Strain rate dependency of dislocation plasticity - arXiv
31
1 Strain rate dependency of dislocation plasticity Haidong Fan ab* , Jaafar A. El-Awady c , Qingyuan Wang a* , Dierk Raabe b , Michael Zaiser d a Department of Mechanics, Sichuan University, Chengdu 610065, China b Department Microstructure Physics and Alloy Design, Max-Planck-Institut für Eisenforschung GmbH, Düsseldorf 40237, Germany c Department of Mechanical Engineering, Whiting School of Engineering, The Johns Hopkins University, Baltimore, MD 21218, USA d WW8-Materials Simulation, Department of Materials Science, FAU Universitä t Erlangen-Nürnberg, Fürth 90762, Germany *Corresponding authors emails: [email protected] (HF), [email protected] (QW) Abstract Dislocation slip is a general deformation mode and governs the strength of metals. Via discrete dislocation dynamics (DDD) and molecular dynamics (MD) simulations, we investigate the strain rate and dislocation density dependence of the strength of bulk copper single crystals using 192 simulations spanning over 10 orders of magnitude in strain rate and 9 orders of magnitude in dislocation density . Based on these large set of simulations and theoretical analysis, a new analytical relationship between material strength, dislocation density, strain rate and dislocation mobility is proposed, which is shown to be in excellent agreement with the current simulations as well as with experimental data. The results show that the material strength is a non-monotonic function of dislocation density and displays two universal regimes (first decreasing, then increasing) as the dislocation density increases. The first regime is a result of strain rate hardening, while the second regime is dominated by the classical Taylor forest hardening. Accordingly, the strength displays universally, as a function of strain rate, a rate-independent regime at low strain rates
-
Upload
khangminh22 -
Category
Documents
-
view
4 -
download
0
Transcript of Strain rate dependency of dislocation plasticity - arXiv

1
Strain rate dependency of dislocation plasticity
Haidong Fanab*, Jaafar A. El-Awadyc, Qingyuan Wanga*, Dierk Raabeb, Michael Zaiserd
a Department of Mechanics, Sichuan University, Chengdu 610065, China
b Department Microstructure Physics and Alloy Design, Max-Planck-Institut für Eisenforschung GmbH,
Düsseldorf 40237, Germany
c Department of Mechanical Engineering, Whiting School of Engineering, The Johns Hopkins University,
Baltimore, MD 21218, USA
d WW8-Materials Simulation, Department of Materials Science, FAU Universität Erlangen-Nürnberg,
Fürth 90762, Germany
*Corresponding authors emails: [email protected] (HF), [email protected] (QW)
Abstract
Dislocation slip is a general deformation mode and governs the strength of metals. Via discrete
dislocation dynamics (DDD) and molecular dynamics (MD) simulations, we investigate the strain rate and
dislocation density dependence of the strength of bulk copper single crystals using 192 simulations spanning
over 10 orders of magnitude in strain rate and 9 orders of magnitude in dislocation density . Based on
these large set of simulations and theoretical analysis, a new analytical relationship between material strength,
dislocation density, strain rate and dislocation mobility is proposed, which is shown to be in excellent
agreement with the current simulations as well as with experimental data. The results show that the material
strength is a non-monotonic function of dislocation density and displays two universal regimes (first
decreasing, then increasing) as the dislocation density increases. The first regime is a result of strain rate
hardening, while the second regime is dominated by the classical Taylor forest hardening. Accordingly, the
strength displays universally, as a function of strain rate, a rate-independent regime at low strain rates

2
(governed by forest hardening) followed by a rate hardening regime at high strain rates (governed by strain
rate hardening). All the results can be captured by a single scaling function, which relates the normalized
strength to the coupling parameter 2/3( / ) between dislocation density and strain rate. Finally, the
fluctuations of dislocation flow are analyzed in terms of the strain rate dependent distribution of dislocation
segment velocities. It is found that the fluctuations are governed by another universal scaling function and
diverge in the rate independent limit, indicating a critical behavior. The current analysis provides a
comprehensive understanding on how collective dislocation motions are governed by the competition
between the internal elastic interactions of dislocations, and the stress required to drive dislocation fluxes at
a given externally imposed strain rate.
Keywords: Discrete dislocation dynamics simulations, strain rate hardening, forest hardening, dislocation
plasticity, dislocation kinetics model
1. Introduction
Metals are mostly used for their excellent load-bearing capacity, enabled by their mechanical strength
and damage tolerance. Serving in practically all engineering fields such as transportation, energy, health,
construction and safety, they create an annual global market above 3000 billion Euros1. The mechanical
properties of most metallic materials exhibit loading rate/time dependency. Particularly many safety-relevant
loading scenarios, that metals are subjected to when in service, show significant mechanical response
variation with loading rate, for instance, during vehicle crash, metal forming, medical implants or bird strike
impact on jet engines. A strain rate hardening response is generic for metallic materials deforming by
dislocation slip2, with exception of a limited regime of deformation conditions in solution-hardened alloys
where dislocation-solute interactions may lead to strain rate softening3,4. Nevertheless, the relationship
between the strain rate and micro-scale deformation mechanisms is still poorly understood, and most
dynamic constitutive models (e.g. Johnson-Cook5, Zerilli-Armstrong6) were formulated in a

3
phenomenological or semi-phenomenological manner with several empirical parameters that do not reflect
micro-scale deformation mechanisms and need to be fitted to specific experiments with loss of generality7.
Therefore, it is essential to develop a general understanding of the microscopic mechanisms that control
strain rate effects, in order to develop physics-based models that are able to reflect and predict the rate-
dependence of the mechanical properties of metals. In BCC (body-centered cubic) metals, such as many
steels, rate effects are often related to dislocation core properties (the relatively high atomic-scale Peierls
barriers and the associated kink-pair mechanism), which control screw dislocation motion. The resulting
temperature and stress dependent mobility of screw dislocations has been incorporated into numerous
physics-based plasticity models (see 8,9). In FCC (face-centered cubic) metals, such as Al and Cu, where
dislocation motion is controlled by phonon drag, the situation becomes more complicated because dislocation
motion is strongly affected by various collective phenomena related to the mutual elastic interactions among
the dislocations. Investigating these phenomena and establishing their rate dependence are the aim of the
present study.
Experimental studies on single-crystalline Cu10, Al11, and LiF12 as well as on polycrystalline Cu13,
Al7 spanning 9 orders of magnitude in strain rate showed that the flow stress exhibits a weakly rate-dependent
response at low strain rates followed by a rate hardening response at high strain rates. It has been argued that
the rate-independent regime is dominated by dislocation forest interactions and/or dislocation interactions
with grain boundaries or precipitates. On the other hand, the rate hardening regime was attributed to viscous
drag forces acting on dislocations7. In this case, the flow stress acting on dislocations was related to the
dislocation velocity through the dislocation drag coefficient, and from dislocation velocity to strain rate
through the Orowan relationship. Accordingly, the direct relationship between stress and strain rate depends
on the ratio between the drag coefficient and the density of ‘mobile’ dislocations. This poses serious problems:
drag coefficients predicted from rate dependent stress-strain curves under the assumption that all dislocations
are mobile are always significantly higher than theoretical estimates, and also higher than drag coefficients

4
deduced from direct velocity measurements14-16. Such discrepancy persists even if additional scattering
mechanisms beyond viscous phonon drag are considered17-19. Kumar et al. conversely used measurements of
rate dependent stress-strain curves in conjunction with directly measured drag coefficients to determine
mobile dislocation densities, leading to a very low value of the mobile dislocation density at the order of 10-
5 m-2 20. The problem in all these studies resides in the fact that the mobile dislocation density is not a directly
observable quantity. Also, it may be argued that the attribute ‘mobile’ is somewhat ill-defined since,
depending on the loading conditions, any dislocation (including those were temporarily rendered immobile)
can become mobile again. This is particularly important when load-path or strain-rate changes are imposed.
As a consequence of the conceptual difficulties engendered by introducing the distinct categories of ‘mobile’
and ‘immobile’ dislocations, many fundamental questions regarding the relationship between the externally
imposed strain rate and the internal collective dynamics of dislocations have never been properly answered.
These questions concern not only the relationship between strain rate and average dislocation velocity and
its dependence on dislocation density, but also the relationship between individual and collective dislocation
behaviors and the meaning of the term ‘mobile dislocation density’. To settle these questions, a systematic
investigation is required that focuses on the problem: how dislocations move.
Discrete dislocation dynamics (DDD) simulations provide in situ observations of collective
dislocation behavior during plastic flow and can therefore provide fundamental insights into the mechanisms
controlling strain rate effects of dislocation mediated plasticity without the need of relying on ad-hoc
assumptions. In DDD simulations21-27, dislocations are coarse-grained as discrete elastic lines and most
relevant dislocation mechanisms are accounted for in a physics-based fashion (dislocation glide, cross-slip,
multiplication, annihilation, long-range interaction, junction formation, etc.). Over the past two decades,
DDD has been extensively employed to investigate various aspects of dislocation mediated plasticity, such
as dislocation-dislocation interactions28-30, dislocation interactions with grain boundaries31, twin
boundaries32, precipitates33, and cracks34. The two dimensional (2D) DDD approach was previously

5
employed to study dislocation mobility at high strain rates35, and showed that dislocation inertia effects may
be important for the accurate prediction of the dynamical properties of dislocations at high strain rates > 105
s-1 36. Using three-dimensional (3D) DDD simulations combined with finite element method, Liu et al.
observed that the dislocation patterns change from non-uniform to uniform under high strain rates37. Wang
et al. performed 3D-DDD simulations and found that while almost all dislocations are mobile at high strain
rates38, a very small percentage of the dislocations move at a speed approaching the shear wave velocity39.
Under shock loading at super high strain rates, dislocation homogeneous nucleation plays an important role
in dynamical plasticity40,41. 3D-DDD simulations were also employed to study shock deformation in silicon
crystals under laser shock peening, and the dislocation density and dislocation multiplication rate are strongly
dependent on the laser processing conditions42,43. While DDD simulations were applied to a wide range of
problems in dislocation plasticity, the aforementioned fundamental questions pertaining to strain rate
dependency have not been systematically investigated. Especially, essential quantities such as the mean
dislocation velocity and distribution of dislocation velocity, which are difficult to be determined
experimentally, were rarely studied, although they can be naturally obtained from 3D-DDD simulations.
To analyze the strain rate dependence of collective dislocation plasticity, a total of 192 simulations
were conducted using primary 3D-DDD and additional molecular dynamics (MD) simulations. In these
simulations, the effects of dislocation density (varied over 9 orders of magnitude) and strain rate (varied over
10 orders of magnitude) on the plastic deformation behavior of bulk copper single-crystals were studied. To
ensure that the results are not contingent on the simulation method, large scale MD simulations of heavily
dislocated samples were conducted additionally and included in the analysis. The mean dislocation velocity
and velocity distribution were analyzed in detail and universal characteristics of collective dislocation
behavior were revealed. Based on this comprehensive database, we derived a universal analytical relationship
between dislocation density, strain rate, material strength and dislocation mobility, which predicts strain rate

6
and dislocation density effects on the plastic properties of metals in terms of a single parameter that combines
dislocation density and strain rate.
2. Computational method
3D-DDD simulations were performed using the open source code, ParaDiS (v2.5.1), developed at
Lawrence Livermore National Laboratory22. In ParaDiS, dislocations are discretized into sequences of
individual interconnected dislocation segments, each of which carries elastic distortion and associated stress
field. Under external applied load 𝝈ex, each dislocation segment experiences a force per unit length
𝑭 = 𝒃 ∙ (𝝈ex + 𝝈dis) × 𝝃 + 𝑭0 + 𝑭self (1)
where 𝝃 is the dislocation line direction, 𝒃 is the Burgers vector of the dislocation segment, 𝝈dis is the long-
range interaction stress between the current dislocation and others, 𝑭self is the dislocation self-force, and 𝑭0
is the lattice friction force. Under this total force, each dislocation segment glides on its slip plane. During
dislocation glide, short-range dislocation interactions are taken into account, including junction formation
and breaking, cross-slip, dislocation annihilation and multiplication. In recent years, ParaDiS was employed
frequently to model crystal plasticity in various situations, such as bulk strain hardening, grain boundary
strengthening, precipitation hardening and deformation twinning44-47. Here, ParaDiS is used to quantify the
strain rate effects on collective dislocation behavior in plastically deforming bulk copper (Cu) single-crystals.
All DDD simulations were conducted for cubic cells with periodic boundary conditions in three directions.
The cube edges are aligned with the three orthogonal crystal lattice directions X = [100], Y = [010], and Z =
[001], respectively. To minimize artifacts induced by the periodic boundary conditions, the simulation cell
size must be several times larger than the characteristic wavelength of the microstructure (here the dislocation
spacing which is estimated as the inverse square root of the dislocation density ρ)48. Accordingly, the
simulation cell size is adjusted according to dislocation density ρ, from 1 mm for the lowest dislocation
density of 2.3×10⁷ m-2 to 100 nm for the highest dislocation density of 1.4×10¹⁶ m-2. The material parameters

7
used in all DDD simulations are those of FCC Cu: shear modulus, G = 54.6 GPa; Poisson ratio, = 0.324;
magnitude of Burgers vector, b = 0.25 nm.
In many previous DDD simulations, the initial dislocation configurations consist of Frank-Read
dislocation sources (a dislocation ending at two pinning nodes)32. Such initial conditions are not only
inconsistent with Burgers vector conservation, since the dislocation ends within the crystal, but might also
cause artifacts in the dynamics, as the artificially introduced pinning nodes are much stronger than naturally
formed ones. Therefore, here we introduced infinite-length dislocations spanning two periodic cells, which
are equi-distributed over the 12 possible slip systems. A typical example of the initial configuration is shown
in Fig. 1(a). The initial dislocation density, ρ, was varied over 9 orders of magnitude (2.3×10⁷ m-2 ~ 1.4×10¹⁶
m-2). The initial dislocation configuration was first relaxed under zero stress. During the relaxation, the
dislocation density decreases due to dislocation reactions driven by dislocation-related internal stresses. The
relaxation is terminated once the incremental plastic strain is less than 10-7 in 10 ns (~104 simulation cycles).
Figure 1(a) shows that the plastic strain is approaching saturation, indicating that the dislocation
configuration approaches a stable state. A representative relaxed dislocation network in the inset of Fig. 1(a)
shows a large number of naturally forming dislocation junctions with a very wide spectrum of junction
lengths. It should be noted that the accumulated plastic strain produced during the relaxation is significant
(up to 0.12% in simulations with a high initial dislocation density). If the relaxation step would be omitted,
this accumulative plastic strain would show as a pre-strain occurring during the elastic loading stage. Thus,
the relaxation step is important to accurately represent a crystal in equilibrium. Then, a constant strain rate 𝜀̇
is imposed parallel to the simulation cell edge along the Z direction. The imposed strain rate was varied by
7 orders of magnitude from 0.1 s-1 to 106 s-1. To account for the effect of variations in the initial dislocation
network, each simulation was run at least three times (except the case of 0.1 s-1) with the same initial
dislocation density but different random distributions. A total of 186 simulations were thus performed.

8
0 10 20 30 40 50 60
0
20
40
60
80
100
Relaxation time (ns)
Pla
stic s
tra
in (
10
-6)
Initial Relaxed
Slip plane
(1-11)
(-111)
(11-1)
(111)
Junction
(a)
20
25
30
35
40
Dis
loca
tio
n d
en
sity (
10
12m
-2)
0 500 1000 1500 2000 2500
0.0
0.5
1.0
1.5
2.0
Dis
loca
tio
n v
elo
city (
km
/s)
Shear stress (MPa)
Mobility data from MD49
Fitting curve by Eq. (2)
(b)
Fig. 1. Plastic strain during relaxation and dislocation mobility law in 3D-DDD simulations. (a) Plastic strain
during relaxation for a simulation with an initial dislocation density of ρ = 2.5×10¹³ m-2 in bulk copper. Insets
show the initial dislocation configuration and relaxed configuration. (b) Dislocation velocity versus resolved
shear stress for an edge dislocation as predicted from MD simulations49, and the exponential dislocation
mobility law shown in Eq. (2). Screw dislocation mobility is assumed equal to edge dislocation mobility.
During all the DDD simulations, a fixed strain rate 𝜀̇ is applied uniaxially along Z-direction. The
total plastic strain inside the simulation cell is calculated from the area A swept by the dislocation segment,
𝜀p = ∑𝐴
2𝑉(𝐧 ⊗ 𝐛 + 𝐛 ⊗ 𝐧 ), where 𝐧 is the unit normal to the slip plane, 𝐛 is the Burgers vector, V is the
volume of the simulation cell50. Then the response in stress can be obtained by 𝜎 = 𝐸(𝜀 − 𝜀p). In high strain
rate experiments, the flow stress is believed to be closely related to the mobility of dislocations14-16. Thus, to
accurately predict dislocation kinetics in high strain rate simulations, a realistic dislocation mobility law is
needed. Recent MD simulations of edge dislocation velocity versus resolved shear stress in Cu49, reproduced
in Fig. 1(b), show a non-linear dislocation mobility relationship. Screw dislocation mobility is comparable
with edge dislocation mobility. In the current DDD simulations, we utilize an exponential mobility rule of
the form
𝑣 = 𝑣max(1 − exp(−𝑘𝜏)) (2)

9
where 𝑣max = 1.5579 km/s is the upper limit of the dislocation velocity and k = 0.0146 MPa-1 is a constant.
This mobility law matches reasonably well the MD predictions (see Fig. 1(b)). It is worth noting that the
functional form of Eq. (2) also provides a good fit for velocity-stress curves in other FCC metals (e.g. Ni, Al
and Al/Mg alloys)51. We finally note that this velocity law reduces, in the regime of low to intermediate
velocity, to the often used linear drag law, ( / )v b B with linear drag coefficient 51.6 10 Pa sB . At
low to intermediate velocity, Eq. (2) represents a linear proportionality between stress and dislocation
velocity as expected for drag-controlled dislocation motion. At the same time, the exponential saturation
avoids unphysical behavior that would otherwise occur associated with dislocations passing the sound
velocity barrier. Comparison with MD simulations, where the inertial and relativistic effects on dislocation
motion are naturally included, demonstrates that Eq. (2) provides an adequate representation of collective
dislocation behavior even in the high velocity regime (see Fig. 1(b) and our comparison of collective DDD
and MD data below).
To ensure that the current predictions are not contingent on simulation method, large scale MD
simulations were conducted additionally. The MD simulations were performed using the MD simulation
package LAMMPS52, with the potential for FCC Al53. The cubic simulation cell has a size of 113.4 nm with
periodic boundary conditions applied in three directions and contains 88 million atoms. In the MD simulation
cell, we initially introduced dislocation loops with the same size as the simulation cell54. Six initial dislocation
densities were considered from 1015 m-2 to 2.8×10¹⁶ m-2. After relaxation which was achieved through a
conjugate gradient algorithm, a dislocation network forms. Then a strain rate of 2.5×10⁸ s-1 was applied on
the simulation cell to study the dislocation dynamics during plastic flow.
In all DDD and MD simulations, only dislocation-mediated plasticity has been considered since other
deformation modes (e.g. twinning and phase transformation) are only active at shock loading stresses in
excess of 10 GPa55, a regime that is beyond the stresses of interest in this study. Finally, homogenous

10
dislocation nucleation in the crystal was also neglected since previous MD simulations56 indicate a
homogenous nucleation stress of ~10 GPa in copper, which is higher than any yield stresses reached in the
current analysis.
3. Results and discussions
The resolved shear stresses at yield as obtained from all the DDD and MD simulations are compiled
and shown in a double-logarithmic manner in Fig. 2. We define the axial yield stress σy as the axial stress at
a plastic strain of 𝜀𝑝 = 0.2%, and the resolved shear stress at yield (short: yield stress) as y = mσy, where
𝑚 = 1/√6 is the Schmidt factor. Figure 2 shows y as a function of the instantaneous dislocation density ρ,
and imposed strain rate, ε̇. In Fig. 2(a), it is clearly seen that for a given strain rate the yield stress displays
two distinct regimes above and below a critical dislocation density, ρc. When ρ < ρc, the yield stress decreases
with increasing dislocation density, while for ρ > ρc, the yield stress increases with increasing density. It is
also interesting to note that ρc increases with increasing strain rate. In addition, the curves for ρ > ρc for all
simulated strain rates collapse onto a single line, which coincides with the classical Taylor forest hardening
model (𝜏 = 𝛼𝐺𝑏√𝜌, with 𝛼 ≈ 0.3 for FCC metals), showing a strain rate independent response above this
critical dislocation density, and the dominance of forest hardening in this regime. On the other hand, while
the slopes of the curves for ρ < ρc are almost equal, y increases significantly with increasing strain rate for a
given ρ, suggesting that in this regime the material is prone to strain rate hardening. In the limit of
infinitesimally low strain rate (quasi-static loading), only the second regime remains, indicating that the
classical forest hardening mechanism is obtained without the consideration of strain rate effects. Clearly, a
competition exists between strain rate hardening and forest hardening. As a result, the material strength is
controlled jointly by an internal variable (dislocation density) and an external variable (strain rate). As
demonstrated by the black data points in Fig. 2(a), these two regimes are equally observed in DDD and in
MD simulations, suggesting that the current predictions are not sensitive to the specific simulation method.

11
107
108
109
1010
1011
1012
1013
1014
1015
1016
1017
1018
10-1
100
101
102
103
104
10-1 s
-1 DDD, Cu
100 s
-1 DDD, Cu
101 s
-1 DDD, Cu
102 s
-1 DDD, Cu
103 s
-1 DDD, Cu
104 s
-1 DDD, Cu
105 s
-1 DDD, Cu
106 s
-1 DDD, Cu
2.5x10⁸ s
-1 MD, Al
Forest hardening model, Cu
y(M
Pa
)
(m-2)
Homogeneous dislocation nucleation stress
(a)
10-2
10-1
100
101
102
103
104
105
106
107
10-1
100
101
102
103
104
y(M
Pa)
1.4x10⁸ m
-2 DDD
2.0x10⁹ m
-2 DDD
1.4x10¹⁰
m-2 DDD
1.1x10¹¹
m-2 DDD
6.8x10¹¹
m-2 DDD
4.1x10¹²
m-2 DDD
2.5x10¹³
m-2 DDD
1.2x10¹⁴
m-2 DDD
8.5x10¹⁴
m-2 DDD
(b)
)( 1s
Fig. 2. Yield stress as predicted from current 3D-DDD/MD simulations. Yield stress y (resolved shear stress
at 0.2% plastic strain) as a function of (a) instantaneous dislocation density ρ and (b) strain rate . In Fig.
(b), no MD points are shown because the MD simulations were conducted at only one strain rate.
The yield stress as a function of strain rate as obtained from DDD simulations is shown in Fig. 2(b)
for different dislocation densities. No MD data are shown because a wide variation of strain rates is difficult
to achieve in MD simulations, which therefore were conducted at a single strain rate only. At first glance, in
Fig. 2(b) we see a quite complex picture: For the low dislocation density of ρ = 1.4×10⁸ m-2, y increases
linearly (note the slope is unity in the double-logarithmic plot) with increasing strain rate over the simulated
strain rate range. At intermediate dislocation densities, the stress level attained at a given strain rate in the
linear regime progressively decreases as the dislocation density increases. At the same time, we observe a
cross-over from a linear strain rate dependence at high strain rates towards a low strain rate regime where
the slope in the double-logarithmic plot decreases with decreasing strain rate. This cross-over shifts to higher
strain rates as dislocation density increases. In the low strain rate regime, the curves approach a horizontal
asymptote (rate independent yield stress) with an asymptotic stress level that increases with increasing
dislocation density. At the high dislocation density simulated in the DDD approach, viz. ρ = 8.5×10¹⁴ m-2,
the yield stress is almost rate independent over the entire range of simulated strain rates. In fact, as we shall
demonstrate below, the cross-over from rate independent behavior to a linear rate dependence of the yield

12
stress is a generic feature of the competition between strain rate hardening and forest hardening. Such cross-
over also agrees well with extensive experimental observations10-12,57. That the cross-over cannot be observed
for the low and high dislocation densities probed in our simulations is a consequence of the limited range of
strain rates attainable in our DDD simulations.
To analyze the behavior observed in our simulations, we note that the stress rate relates to the strain
rate and plastic strain rate through the simple equation
�̇� = 𝐸(𝜀̇ − 𝜀̇p) . (3)
We first consider the behavior at extremely high strain rates and/or very low dislocation densities. Since the
dislocation velocity cannot exceed the maximum value of vmax, for a given dislocation density , there exists
an absolute upper limit of the plastic strain rate that can be accommodated by dislocation glide. This limit is
given by max max
p
am bv (Orowan) where 2 / 3a af is the dislocation density on the active slip
systems. If a strain rate above this limit is imposed, Eq. (3) has no stationary solution and, hence, the stress
is bound to increase indefinitely until, at a stress around 10 GPa, homogeneous dislocation nucleation sets in
and the ensuing dramatic dislocation density increase allows to accommodate the imposed strain rate. We
denote this scenario as the exhaustion regime of the rate dependent response, where the existing dislocations
are insufficient to produce the imposed strain rate. Corresponding stress-strain curves are depicted in Fig.
3(a), where the imposed strain rate lies above the strain rate limit for the two lowest dislocation densities (red
and green curves in the inset of Fig. 3(a)). As shown in Appendix A, 2% yield stresses in this stage are
proportional to the ratio / .
Next, we move to lower strain rates or higher dislocation densities. Once the imposed strain rate falls
below (or dislocation density increases) max max
p
am bv , then Eq. (3) possesses a dislocation density
dependent quasi-stationary solution, where the stress is implicitly related to the plastic strain rate via
( )p
a mm bv (vm is the mean velocity of dislocations on the active slip systems). In Fig. 3(a), all

13
stress-strain curves with dislocation densities above 10 24.8 10 m fulfill this condition. These curves are
characterized by a sharp transition between an elastic loading stage, and a plastic flow stage where the stress
fluctuates around a nearly constant level.
0.000 0.002 0.004 0.006 0.008 0.010
0
100
200
300
400
500
600
(
MP
a)
6.3x10⁹ m
-2
1.4x10¹⁰
m-2
4.8x10¹⁰
m-2
1.1x10¹¹
m-2
4.1x10¹²
m-2
2.5x10¹³
m-2
1.2x10¹⁴
m-2
8.4x10¹⁴
m-2
0.2% offset line
0.00 0.01 0.02 0.03 0.040
1000
2000
3000
4000
5000
6000
(
MP
a)
(a)
0 100 200 300 400 500
0.0
0.3
0.6
0.9
1.2
1.5
1.8
Vm (
km
/s)
e
(MPa)
vm (
km
/s)
e (MPa)
=2.0x10⁹ m
-2
=6.3x10⁹ m
-2
=4.8x10¹⁰
m-2
=7.5x10¹⁰
m-2
=1.1x10¹¹
m-2
=6.8x10¹¹
m-2
=4.1x10¹²
m-2
=2.5x10¹³
m-2
=1.2x10¹⁴
m-2
=8.4x10¹⁴
m-2
Linear law, Eq. (4)
vmax
(b)
0 10 20 30 40 50 60 700.0
0.2
0.4
0.6
0.8
1.0
Fig. 3. Stress-strain curves and mean dislocation velocity as predicted from our DDD simulations. (a) Stress-
strain curves at applied strain rate of 104 s-1 and different dislocation densities. (b) Mean velocity vm of
dislocations on active slip systems versus effective stress τe at applied strain rate of 104 s-1 and different
dislocation densities.
Within the plastic flow regime, we again first look at the limit of low dislocation densities, where
dislocation interactions can be neglected in comparison with the external stress needed to drive the
dislocations. This is referred to as the rate hardening regime of the rate dependent response. Since all
dislocation velocities are well below the maximum velocity, the dislocation mobility law can be linearized,
i.e. ( / )mv b B . Hence 2 /af m b B and 2/ ( )aB f m b
which suggests again a linear relationship
between the yield stress and the ratio / . We can see that both the exhaustion regime and the rate
hardening regime possess the same dependence of stress on strain rate and dislocation density (see Appendix
A for further discussion). The simulation data of Fig. 2 follow this behavior for low dislocation densities or
high strain rates.

14
In the opposite limit of high dislocation density and/or low strain rate, the stress needed to drive
dislocations is fully controlled by the mutual interactions of dislocations. In this Taylor forest hardening
regime, the yield stress of any dislocation arrangement must follow the Taylor relationship, b
(see58 for a general argument regarding this point). This relationship agrees well with the data in Fig. 2 in the
regime of high dislocation densities and/or low strain rates.
The next question is whether the three different regimes can be unified into a consistent picture of
the strain rate dependence of crystal plasticity. A straightforward idea is that the mean driving stress for
dislocation motion is given by an effective stress that equals the resolved shear stress, diminished by the
dislocation resistance stress or Taylor stress: e b . We then expect that the mean dislocation
velocity on the active slip systems follows Eq. (2), with the local resolved shear stress replaced by the
effective shear stress e . Figure 3(b) shows that the mean dislocation velocity follows well this prediction
for a wide range of dislocation densities, as obtained from our 3D-DDD simulations with an applied strain
rate of 104 s-1. Outwith the exhaustion regime, the dislocation mobility law can be linearized, as shown in
the inset of Fig. 3(b). Accordingly,
𝑣𝑚 = 𝜏𝑒𝑏/𝐵 = (𝜏 − 𝛼𝐺𝑏√𝜌)𝑏/𝐵 (4)
Using Eqs. (3) and (4) and Orowan’s formula, it can be shown that
𝜏𝑦 =𝐵�̇�
𝑚𝑓𝑎𝜌𝑏2+ 𝛼𝐺𝑏√𝜌 (5a)
which can be alternatively expressed in terms of dimensionless variables to obtain a representation
independent of material parameters:
1/3
1 22/3 1/3
( ) 1,
( )
y a yT T
G B
f
G
m
b
(5b)

15
where the scaled dislocation density and strain rate are, respectively, given by
32/3 3/2
2/3 3 3/2( ) ,
B
a
a
Gb B
Gb
mf
mf
(5c)
Equation (5a) defines a dislocation kinetics model that provides a generic relationship between
material strength, dislocation density, strain rate, and the related material parameters like dislocation mobility.
This relationship can be stated in the universal forms of Eqs. (5b) and (5c) that are independent of material-
specific parameters. As demonstrated in Figs. 4(a, b), these unified models not only allow to collapse all the
data in Figs. 2(a) and 2(b) onto two universal curves, but also help to aggregate data obtained for different
materials both experimentally and by simulations into the same generic relationship. In particular,
experimental data from different materials and for a wide range of deformation conditions follow the same
generic curve as the DDD simulation data for Cu, and the same is true for MD simulation data obtained for
Al. It is worth noting that the present models even extend to data in the exhaustion regime, as discussed in
Appendix A.
In Eqs. (5a-b), the second terms on the right-hand side control the mechanical behavior in the Taylor
hardening regime at low strain rates (or high dislocation densities), and the first terms control the behavior
in the strain rate hardening regime at high strain rates (or low dislocation densities). The transition between
the two regimes can be identified with the minimum of the stress vs. dislocation density curve, which lies at
2/3 2/3(2 / ) in a scaled representation. At this minimum, the second term on the right-hand side of
Eq. (5b), i.e., the Taylor hardening stress, is exactly twice the rate hardening stress. The absolute values of
the critical dislocation density and the minimum stress are given by
𝜌𝑐 = (2𝐵�̇�
𝛼𝑚𝑓𝑎𝐺𝑏3)2/3 and 𝜏min =3
2𝛼𝐺𝑏√𝜌𝑐 = (
27𝛼2𝐺2𝐵�̇�
4𝑚𝑓𝑎)1/3 (6)

16
𝜏min is the minimum material strength mediated by dislocation plasticity at a given strain rate, which is
significant to the community of mechanics and materials. Figure 4(c) shows excellent agreement between
the prediction of Eq. (6), the data from current 3D-DDD/MD simulations and published experimental results.
10-4
10-2
100
102
104
106
108
10-1
100
101
102
103
104
105
106
107
Strain rate
hardening
regime
Forest
hardening
regime
-1
0.5
6.3x10⁻⁵ s
-1 Exp, CuNi
59
1.7x10⁻⁵ s
-1 Exp, Cu
60
1.0x10⁻⁴ s
-1 Exp, Cu
61
6.3x10⁻⁵ s
-1 Exp, Cu
59
10-1 s
-1 DDD, Cu
100 s
-1 DDD, Cu
101 s
-1 DDD, Cu
102 s
-1 DDD, Cu
103 s
-1 DDD, Cu
104 s
-1 DDD, Cu
105 s
-1 DDD, Cu
106 s
-1 DDD, Cu
2.5x10⁸ s
-1 MD, Al
Current model, Eq. (5b)
Dis
mensio
nle
ss y
ield
str
ess, T
1
Dismensionless dislocation density, P
(a)
10-9
10-7
10-5
10-3
10-1
101
103
10-2
10-1
100
101
102
103
104
105
Forest hardening regime
Strain rate
hardening
regime
1
Dis
mensio
nle
ss y
ield
str
ess, T
2
Dismensionless strain rate, E
2.0x10¹¹
m-2
Exp, Cu10
5.0x10¹¹
m-2
Exp, Cu57
2.7x10¹²
m-2
Exp, Al11
4.7x10¹⁰
m-2
Exp, LiF12
1.4x10⁸ m
-2DDD, Cu
5.7x10⁸ m
-2DDD, Cu
2.0x10⁹ m
-2DDD, Cu
1.4x10¹⁰
m-2
DDD, Cu
1.1x10¹¹
m-2
DDD, Cu
6.8x10¹¹
m-2
DDD, Cu
4.1x10¹²
m-2
DDD, Cu
2.5x10¹³
m-2
DDD, Cu
1.2x10¹⁴
m-2
DDD, Cu
8.5x10¹⁴
m-2
DDD, Cu
Current model, Eq. (5b)
(b)
10-6
10-4
10-2
100
102
104
106
108
1010
103
105
107
109
1011
1013
1015
1017
(c)
c, DDD and MD simulations
c, Exp
59
c, Current model, Eq. (6)
c (
m-2)
)( 1-s
10-2
10-1
100
101
102
103
104
105
min
, DDD and MD simulations
min
, Exp59
min
, Current model, Eq. (6)
min (
MP
a)
Fig. 4. Comparison between the current models of Eqs. (5, 6), 3D-DDD/MD simulation data and published
experimental results10-12,57,59-61. (a) Dimensionless yield stress versus dimensionless dislocation density. (b)
Dimensionless yield stress versus dimensionless strain rate. (c) The minimum stress τmin and critical
dislocation density ρc at the transition point between forest hardening and rate hardening regimes, as a
function of strain rate .

17
In many phenomenological plasticity models, the distinction between rate hardening and Taylor
hardening terms is absent. Instead, the two-regime response is fitted over a limited range of strain rates by a
power law relationship in the form of 𝜏𝑦 ∝ ε̇𝑛, where 𝑛 is assumed to represent the strain rate sensitivity of
the material. From our analysis it is clear that such a procedure does not adequately represent the intrinsic
features of collective dislocation motion. To establish the intrinsic material parameters that control the rate
dependency of plastic flow, the forest hardening term should be subtracted from the measured flow stresses
such as to produce a linear relationship between strain rate and stress. From this relationship one can
determine the coefficient of the strain rate hardening term,
s =𝐵
𝑚𝑓𝑎𝜌𝑏2 (7)
which we propose as a physical measure of rate sensitivity in plastic flow of FCC metals. From Eq. (7), the
strain rate sensitivity is seen to be mainly controlled by the damping coefficient, 𝐵, and dislocation density,
𝜌, in a combination, which can explain many corresponding experimental observations in unified form. A
higher dislocation density thus is expected to lead to lower strain rate sensitivity. This is in good agreement
with experimental observations showing a decrease in strain rate sensitivity with increasing pre-strain62,63.
Also the strain rate sensitivity increases with increasing temperature for FCC crystals64 since the dislocation
damping coefficient is linearly dependent on temperature51.
The dimensionless parameters, P and E, in Eq. (5c) not only govern the strain rate and dislocation
density dependence of the yield stress, but also control the statistics of dislocation motion. Again, we observe
a clear distinction between Taylor hardening and strain rate hardening regimes. This is seen in Fig. 5, which
shows the second moment of the dislocation velocity distribution obtained from current DDD simulations,
normalized by the square of the mean velocity a mv f v of all dislocations. In the strain rate hardening
regime at low P values (P < 1), the mean square velocity is of the order of the mean velocity squared, i.e.

18
fluctuations are small in absolute terms and the second moment of the velocity distribution is approximately
independent on dislocation density. At high values (P >> 1), the second moment of the velocity distribution
grows as P3/2. A theoretical expression describing this behaviour can be derived by analysing the microscopic
energy dissipation (the work expended in moving dislocations against the drag force) and equating this to
the macroscopic dissipated energy (the work expended macroscopically to create a plastic strain). The
derivation is given in Appendix B, and the result reads in scaled notation
2
3/2
2
1 11 1
a a
v
f fv
(8)
As shown in Fig. 5, this relationship gives a good description of the increase of fluctuations in the regime of
high dislocation densities and/or low strain rates that we observe in DDD simulations. Note that the left-hand
side can be interpreted as a ‘dissipation ratio’ where the numerator is proportional to the actual dissipated
energy, and the denominator is proportional to the fictitious dissipation in a hypothetical system of non-
interacting dislocations of the same density and strain rate.
10-4
10-3
10-2
10-1
100
101
102
103
104
10-1
100
101
102
103
104
105
Current model, Eq. (8)
Strain rate 10-1 s
-1DDD
Strain rate 100 s
-1 DDD
Strain rate 101 s
-1 DDD
Strain rate 102 s
-1 DDD
Strain rate 103 s
-1 DDD
Strain rate 104 s
-1 DDD
Strain rate 105 s
-1 DDD
<v 2>
<v>2
Dimensionless dislocation density,
Fig. 5. Squared variation coefficient of the dislocation velocity distribution (dissipation ratio) in 3D-DDD
simulations, as a function of the dimensionless dislocation density. Symbols are data sets for different strain
rates and full line is the theoretical prediction of Eq. (8).
19
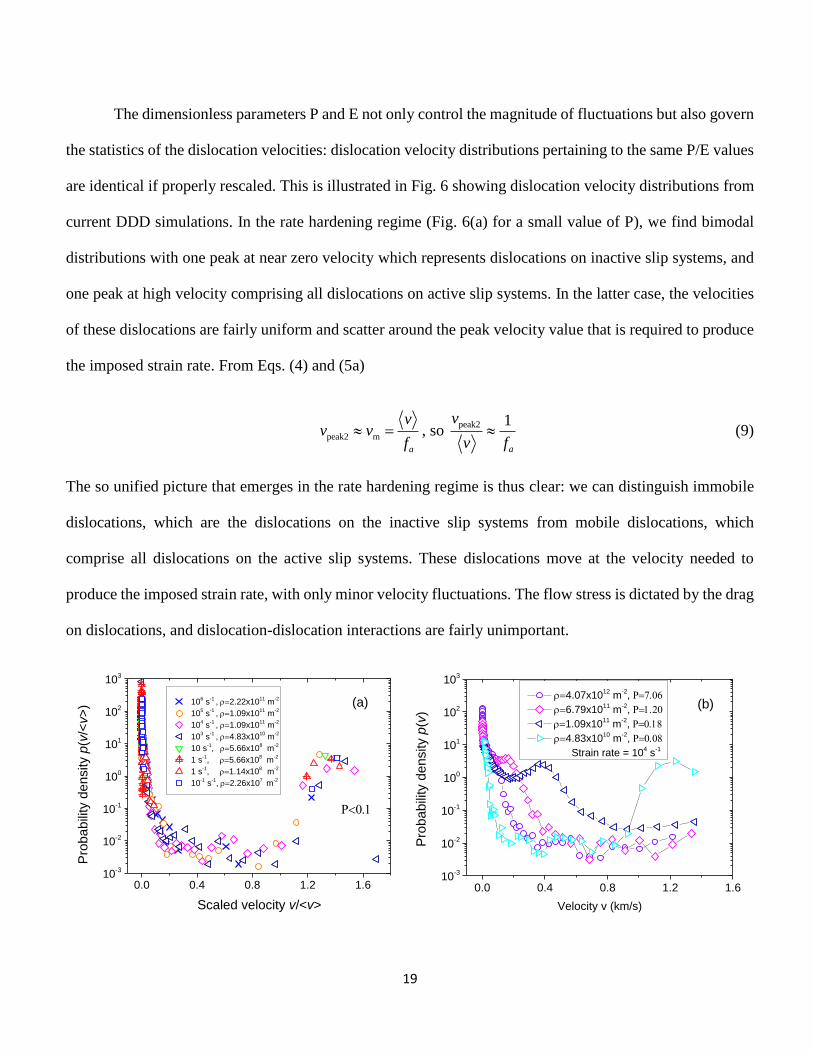
The dimensionless parameters P and E not only control the magnitude of fluctuations but also govern
the statistics of the dislocation velocities: dislocation velocity distributions pertaining to the same P/E values
are identical if properly rescaled. This is illustrated in Fig. 6 showing dislocation velocity distributions from
current DDD simulations. In the rate hardening regime (Fig. 6(a) for a small value of P), we find bimodal
distributions with one peak at near zero velocity which represents dislocations on inactive slip systems, and
one peak at high velocity comprising all dislocations on active slip systems. In the latter case, the velocities
of these dislocations are fairly uniform and scatter around the peak velocity value that is required to produce
the imposed strain rate. From Eqs. (4) and (5a)
peak2 m
a
vv v
f , so
peak2 1
a
v
v f (9)
The so unified picture that emerges in the rate hardening regime is thus clear: we can distinguish immobile
dislocations, which are the dislocations on the inactive slip systems from mobile dislocations, which
comprise all dislocations on the active slip systems. These dislocations move at the velocity needed to
produce the imposed strain rate, with only minor velocity fluctuations. The flow stress is dictated by the drag
on dislocations, and dislocation-dislocation interactions are fairly unimportant.
0.0 0.4 0.8 1.2 1.610
-3
10-2
10-1
100
101
102
103
(a)
Scaled velocity v/<v>
106 s
-1 ,2.22x10
11 m
-2
105 s
-1 ,1.09x10
11 m
-2
104 s
-1 ,1.09x10
11 m
-2
103 s
-1 ,4.83x10
10 m
-2
10 s-1,5.66x10
8 m
-2
1 s-1,5.66x10
8 m
-2
1 s-1,1.14x10
8 m
-2
10-1 s
-1,2.26x10
7 m
-2
Pro
babili
ty d
ensity p
(v/<
v>
)
0.0 0.4 0.8 1.2 1.610
-3
10-2
10-1
100
101
102
103
(b) 4.07x10
12 m
-2,
6.79x10¹¹
m-2,
1.09x10¹¹
m-2,
4.83x10¹⁰
m-2,
Strain rate = 104 s
-1
Pro
ba
bili
ty d
en
sity p
(v)
Velocity v (km/s)

20
0.01 0.1 1 10 10010
-5
10-4
10-3
10-2
10-1
100
101
Scaled velocity v/v
Pro
ba
bili
ty d
en
sity p
(v/
V)
102s
-1 2.55x10
13m
-2
103s
-1 1.24x10
14m
-2
104s
-1 8.34x10
15m
-2
105s
-1 4.53x10
15m
-2
x-2
(c)
P~1000
Fig. 6. Probability distributions of dislocation velocities as observed in 3D-DDD simulations. (a)
Distributions in the strain rate hardening regime, P < 0.1; (b) distributions in the intermediate regime 0.1 <
P < 10; (c) distributions in the Taylor forest hardening regime, P > 1000, in double logarithmic representation,
where the full line indicates a slope of -2. σV is the standard deviation of dislocation velocity distribution,
and <v> is the mean velocity of all dislocations.
As the dimensionless strain rate parameter E decreases or the density parameter P increases towards
unity, the high-velocity peak of the velocity distribution shifts to lower values and ultimately merges, for
high P, with the low-velocity peak (see Fig. 6(b)), leading to unimodal dislocation velocity distribution that
is typical and characteristic of the Taylor hardening regime. In the rate independent limit the velocity
distribution acquires scale free features as the probability density p(v) decreases, for high velocity, in inverse
proportion with v2, leading to the diverging fluctuations.
4. Conclusions
In this work, the strain rate dependence of collective dislocation dynamics was studied using a large
set of 3D-DDD (discrete dislocation dynamics) and MD (molecular dynamics) simulations, spanning nine
orders of magnitude in dislocation density and ten orders of magnitude in strain rate. The performed 192
simulations indicate that the material strength displays two regimes, a strain rate hardening regime where the
yield stress increases in proportion with strain rate and in inverse proportion with dislocation density, and a

21
regime of classical Taylor hardening where the yield stress is approximately rate independent and follows
the Taylor relationship. All results can be described in terms of a scaled dislocation density P or strain rate
E, which combine dislocation density, strain rate, and material parameters in such a manner that the
corresponding yield stress can be expressed through a universal material independent relationship. The
analytical relationship describes not only our simulations over the entire range of strain rates and dislocation
densities, but also a wide range of experimental data published in the literature. The scaled dislocation
density/strain rate parameters not only control the yield stress but also govern the statistics of dislocation
velocities. In the rate-hardening regime of high strain rates/low dislocation densities, we find bimodal
velocity distributions, where dislocations on inactive slip systems remain immobile whereas dislocations on
active slip systems move with small fluctuations in a quasi-laminar manner at the velocity needed to match
the imposed strain rate. In the Taylor hardening regime, on the other hand, the velocity distributions have
scale free characteristics and decrease monotonically towards high velocity according to a 2( )p v v power
law.
The current results have far-reaching consequences both regarding the interpretation of experiments
and the constitutive modeling of crystal plasticity. The interpretation of experiments that try to probe the
strain rate dependence of dislocation motion and to establish drag coefficients has hinged in the idea that it
is possible to distinguish a mobile dislocation density, which moves at a velocity that is dictated by the
externally applied stress, and an immobile dislocation density that consists of dislocations remaining
essentially stationary. Our investigation demonstrates that such a distinction makes sense only in the rate
hardening regime of very high strain rates and/or low dislocation densities. Only experiments conducted in
this regime can yield results that are amenable to direct interpretation. However, most actual experiments
have been conducted at low strain rates and/or high dislocation densities, i.e. in the Taylor hardening regime
(see Fig. 4(a)). In these cases, identifying the mobile dislocation density with the dislocation density on the

22
active slip systems is bound to systematically over-estimate drag effects, and the introduction of a mobile
fraction of the dislocation density is tantamount to introducing a variable that cannot be determined
independently either by experiments or, as our study demonstrates, in simulations. At the same time, our
results offer a way out of this dilemma, as we provide a universal yield stress relationship, which contains
only the total dislocation density and strain rate (both measurable quantities) together with material
parameters. One of these parameters is the poorly documented drag coefficient (as discussed in the
introduction), and the remaining parameters (shear modulus, Burgers vector) are accurately known. Thus, by
re-scaling experimental data obtained from samples at different strain rates to fall on the master curve
provided by our Eq. (5) and depicted in Fig. 4, it is possible to determine drag coefficient B without the need
to rely on assumptions regarding a spurious mobile dislocation density.
Regarding constitutive modeling, we note that, starting from the Kubin-Estrin model65, dislocation
based crystal plasticity models regularly contain a ‘mobile dislocation density’ as a constitutive variable (for
recent examples, see66). Our analysis demonstrates that, in the Taylor hardening regime, the distribution of
dislocation segment velocities offers no means to define such a quantity in a meaningful manner. In the strain
rate hardening regime, by contrast, its definition is straightforward but trivial since the mobile dislocation
density simply encompasses all dislocations on active slip systems. This is very problematic from a
conceptual point of view, in particular since to our knowledge there has been no experimental determination
of the same quantity, which would require large-scale in situ experiments to be conducted with single-
dislocation resolution and sufficient statistical sampling of the microstructure.
In summary, our investigation provides a unifying picture of the strain rate and dislocation density
dependence of collective dislocation dynamics over a so far unprecedented range of scales. In the regime of
comparatively low strain rates or high dislocation densities, in which most laboratory experiments are
conducted, collective dynamics of dislocations appears as a highly turbulent flow process. Once a sufficiently

23
high applied stress causes the dislocation arrangement to lose metastability, complex relaxation processes
lead to highly irregular dynamics with a scale free dislocation velocity spectrum.
Acknowledgements
This work was supported by National Natural Science Foundation of China (U1730106, 11672193),
Alexander von Humboldt Foundation, Chinese State Administration of Foreign Experts Affairs
#MS2016XNJT044 and US National Science Foundation Award #DMR-1609533.
Author contributions
HF designed the DDD and MD simulations; HF, JAE, QW performed computer simulations; HF and
MZ deduced the models; HF, JAE, QW, MZ, DR provided partial financial supports and research requisites;
All authors contributed to discussions of the results and revisions of the manuscript and approved the final
version.
Competing financial interests
All authors declare no competing interests.
Appendix A:
As mentioned above, Eq. (5a) was derived on the basis of two simplifications: low dislocation
velocity and negligible strain hardening rate, so that the mobility law can be linearized. As shown in Fig.
3(a), these simplifications are reasonable for the cases of intermediate and high dislocation densities. Here,
we discuss the cases of low dislocation densities in exhaustion regime, which exhibits high dislocation
velocities approaching the maximum velocity (i.e. 𝑣𝑚 ≈ 𝑣max) and high strain hardening rates. From Eq. (3)
and Orowan’s formula, the strain hardening rate is
𝜃 = 𝐸(1 − 𝑚𝑓𝑎𝜌𝑏𝑣max/𝜀̇) (A1)
The yield stress at 0.2% plastic strain is

24
𝜏𝑦 =0.002𝑚
1/𝜃−1/𝐸 (A2)
Eliminating 𝜃 from Eqs. (A1) and (A2) results in
𝜏𝑦 = 0.002𝑚𝐸(�̇�
𝑚𝑓𝑎𝜌𝑏𝑣max− 1) (A3)
Thus, the yield stress is linear with 𝜀̇/𝜌, which is similar to the first term in Eq. (5a) (the second term in Eq.
(5a) is negligible at low dislocation density). The ratio of the two slopes in Eqs. (A3) and (5a) is
max0.002mbE Bv . As shown in the theory of dislocations67, the damping coefficient can be expressed as
maxB Gb v , where 𝜂 ≈ 0.002. The ratio of the two slopes becomes 2m(1+), which is comparable to
unity, suggesting that Eq. (5a) can still be used at low dislocation densities. That is why Eq. (5a) shows good
agreement with the DDD/MD simulations and experiments even in exhaustion regime.
Appendix B: A fluctuation-dissipation theorem for dislocation plasticity
B1. Macroscopic dissipation
It is a standard assumption in continuum plasticity theory, which is motivated by thermodynamic
arguments, that the work expended in creating plastic deformation is entirely dissipated into heat. Hence, the
dissipated work per unit volume is equal to the plastic work
diss p
pdW dW
dt dt (B1)
For dislocation plasticity, this statement needs to be qualified: strain hardening is associated with the change
of an internal variable (the dislocation density) and, since dislocations carry elastic energy in form of stress
and strain fields and the much smaller contribution from the dislocation core energy, this leads to a stored
internal energy contribution (a stored defect energy68). We estimate the defect energy storage rate as
def
p
L
dE dE
dt d
(B2)

25
where LE is the dislocation line energy. To obtain an upper estimate of the dislocation storage rate, we use
the well-established Kocks-Mecking model and note that an upper bound to the dislocation storage rate is
obtained by neglecting dynamic recovery. In that case, following69 and using 2
LE Gb , we can estimate
2 def
II IIIIp p 2 2
4 4,
2
ppGb dE dW
dt G G dt
(B3)
where II is the initial hardening slope in the limit of athermal rate-independent deformation (in FCC single
crystals: hardening stage II). The numerical factor in the bracket on the right-hand side of Eq. (B3) is of the
order of 1. Since the hardening slope is only a tiny fraction of the shear modulus ( II / 200G , see ref. 69),
the defect energy storage rate is only a tiny fraction of the plastic work rate. Hence Eq. (B1) holds for
dislocation plasticity with only minor corrections due to stored defect energy.
B2. Microscopic dissipation
On the dislocation level, dissipation occurs because the work that is expended in moving dislocations
is dissipated into the phonon system. The situation is particularly simple for non-relativistic over-damped
dislocation motion, because there, due to absence of inertia, all work is instantaneously dissipated. Using
( / )v b B and PKF b we write the dissipated energy as
diss
PK 2
( ) ( )
1
V V
dW BF vds v ds
dt V V (B4)
where the integral runs over the set V
of all dislocation lines in the volume V considered. Introducing the
dislocation density and the mean square dislocation velocity as

26
2
( )2
( )
( )
1, V
V
V
v ds
ds vV ds
(B5)
we thus find that the mean velocity square is related to the microscopically dissipated work by
diss
2dWB v
dt (B6)
B3. Fluctuation-dissipation relationship
It is clear that the microscopically dissipated work and the macroscopic dissipated work must be
identical. We therefore obtain a relationship between the ‘macroscopic’ quantities in (B1) and the
‘microscopic’ quantities in (B6):
diss
2 pdWB v
dt (B7)
We write the plastic strain rate now in terms of microscopic quantities (segment velocities) as
( )
( )
( )
( )
( ) ( ) : , V
V
V
p
m s vdsb
m s v s ds m b v vV m ds
(B8)
where we note that the motion of dislocations on inactive slip systems (Schmidt factor: m(s)=0) does not
contribute to the m-weighted average velocity. Accordingly, this average velocity v of all dislocations
relates to the mean velocity mv on the active slip systems via a mv f v .
We now use Eq. (5a) of the main paper to write 1
a( (1/ )( / ) )m Gb f B b v . This leads to
our final result,
2 3/23
3/2
2 2/3
1 11
a a
v Gb
B f fv
(B9)

27
We can envisage Eq. (B9) as an expression for the magnitude of fluctuations. We define the weighted
coefficient of variation of dislocation velocities as
1/20.52 2 3/43
2 2/3COV 1M
v v Gb
v Bv
(B10)
This quantity measures the magnitude of dislocation velocity fluctuations. As we move to zero or very small
strain rates, this quantity diverges which indicates critical behavior. We note that the general idea of the
above derivation goes back to Hähner70 and the case of a linear drag law has, in embryonic form, been
previously considered by one of the present authors71.
References
1 Mining & Metals in a Sustainable World 2050. World Economic Forum Report (2015).
2 Kolsky, H. An Investigation of the Mechanical Properties of Materials at very High Rates of Loading. P. Roy.
Soc. Lond. B 62, 676 (1949).
3 Zaiser, M. & Hähner, P. A unified description of strain-rate softening instabilities. Materials Science and
Engineering: A 238, 399-406 (1997).
4 Zaiser, M., Glazov, M., Lalli, L. A. & Richmond, O. On the relations between strain and strain-rate softening
phenomena in some metallic materials: a computational study. Comp. Mater. Sci. 15, 0-49 (1999).
5 Johnson, G. R. & Cook, W. H. Fracture characteristics of three metals subjected to various strains, strain
rates, temperatures and pressures. Eng. Fract. Mech. 21, 31-48 (1985).
6 Zerilli, F. J. & Armstrong, R. W. Dislocation‐mechanics‐based constitutive relations for material dynamics
calculations. J. Appl. Phys. 61, 1816-1825 (1987).
7 Salvado, F. C., Teixeira-Dias, F., Walley, S. M., Lea, L. J. & Cardoso, J. B. A review on the strain rate
dependency of the dynamic viscoplastic response of FCC metals. Prog. Mater. Sci. 88, 186-231 (2017).
8 Ma, A., Roters, F. & Raabe, D. A dislocation density based constitutive law for BCC materials in crystal
plasticity FEM. Comp. Mater. Sci. 39, 91-95 (2007).
9 Khan, A. S. & Liang, R. Behaviors of three BCC metal over a wide range of strain rates and temperatures:
experiments and modeling. Int. J. Plast. 15, 1089-1109 (1999).
10 Edington, J. W. The influence of strain rate on the mechanical properties and dislocation substructure in
deformed copper single crystals. The Philosophical Magazine: A Journal of Theoretical Experimental and
Applied Physics 19, 1189-1206 (1969).
11 Chiem, C. Y. & Duffy, J. Strain rate history effects and observations of dislocation substructure in aluminum
single crystals following dynamic deformation. Mater. Sci. Eng. 57, 233-247 (1983).

28
12 Chiem, C. Y. & Duffy, J. Strain rate history effects in LiF single crystals during dynamic loading in shear.
Mater. Sci. Eng. 48, 207-222 (1981).
13 Lea, L. J. & Jardine, A. P. Characterisation of high rate plasticity in the uniaxial deformation of high purity
copper at elevated temperatures. Int. J. Plast. 102, 41-52 (2018).
14 Clifton, R. J. Dynamic Plasticity. J. Appl. Mech. 50, 941-952 (1983).
15 Ferguson, W. G., Kumar, A. & Dorn, J. E. Dislocation Damping in Aluminum at High Strain Rates. J. Appl.
Phys. 38, 1863-1869 (1967).
16 Armstrong, R. W., Arnold, W. & Zerilli, F. J. Dislocation mechanics of copper and iron in high rate
deformation tests. J. Appl. Phys. 105, 023511 (2009).
17 Ferguson, W. G., Hauser, F. E. & Dorn, J. E. Dislocation damping in zinc single crystals. Br. J. Appl. Phys. 18,
411 (1967).
18 Kumar, A., Hauser, F. E. & Dorn, J. E. Viscous drag on dislocations in aluminum at high strain rates. Acta
Metall. 16, 1189-1197 (1968).
19 Victoria, M. P., Dharan, C. K. H., Hauser, F. E. & Dorn, J. E. Dislocation Damping at High Strain Rates in
Aluminum and Aluminum‐Copper Alloy. J. Appl. Phys. 41, 674-677 (1970).
20 Kumar, A. & Kumble, R. G. Viscous Drag on Dislocations at High Strain Rates in Copper. J. Appl. Phys. 40,
3475-3480 (1969).
21 Van der Giessen, E. & Needleman, A. Discrete dislocation plasticity: a simple planar model Model. Simul.
Mater. Sci. Eng. 3, 689-735 (1995).
22 Arsenlis, A. et al. Enabling strain hardening simulations with dislocation dynamics. Model. Simul. Mater. Sci.
Eng. 15, 553-595. (2007).
23 Kubin, L. P. et al. Dislocation microstructures and plastic flow: A 3D simulation. Solid State Phenom. 23 &
24, 455-472 (1992).
24 Ghoniem, N. M., Tong, S. H. & Sun, L. Z. Parametric dislocation dynamics: A thermodynamics-based
approach to investigations of mesoscopic plastic deformation. Phys. Rev. B 61, 913-927 (2000).
25 Benzerga, A. A., Bréchet, Y., Needleman, A. & Van der Giessen, E. Incorporating three-dimensional
mechanisms into two-dimensional dislocation dynamics. Model. Simul. Mater. Sci. Eng. 12, 159 (2004).
26 Liu, Z. L., Liu, X. M., Zhuang, Z. & You, X. C. A multi-scale computational model of crystal plasticity at
submicron-to-nanometer scales. Int. J. Plast. 25, 1436-1455 (2009).
27 Zbib, H. M. & Diaz de la Rubia, T. A multiscale model of plasticity. Int. J. Plast. 18, 1133-1163 (2002).
28 El-Awady, J. A. Unravelling the physics of size-dependent dislocation-mediated plasticity. Nat. Commun. 6
(2015).
29 Gao, Y. et al. Investigations of pipe-diffusion-based dislocation climb by discrete dislocation dynamics. Int. J.
Plast. 27, 1055-1071 (2011).
30 Liu, F. X., Liu, Z. L., Pei, X. Y., Hu, J. Q. & Zhuang, Z. Modeling high temperature anneal hardening in Au
submicron pillar by developing coupled dislocation glide-climb model. Int. J. Plast. 99, 102-119 (2017).

29
31 Fan, H., Aubry, S., Arsenlis, A. & El-Awady, J. A. Orientation influence on grain size effects in ultrafine-
grained magnesium. Scripta Mater. 97, 25-28 (2015).
32 Fan, H., Aubry, S., Arsenlis, A. & El-Awady, J. A. The role of twinning deformation on the hardening
response of polycrystalline magnesium from discrete dislocation dynamics simulations. Acta Mater. 92,
126-139 (2015).
33 Záležák, T., Svoboda, J. & Dlouhý, A. High temperature dislocation processes in precipitation hardened
crystals investigated by a 3D discrete dislocation dynamics. Int. J. Plast. 97, 1-23 (2017).
34 Huang, M., Tong, J. & Li, Z. A study of fatigue crack tip characteristics using discrete dislocation dynamics.
Int. J. Plast. 54, 229-246 (2014).
35 Roos, A., De Hosson, J. T. M. & Van der Giessen, E. High-speed dislocations in high strain-rate deformations.
Computational Materials Science 20, 19-27 (2001).
36 Wang, Z. Q., Beyerlein, I. J. & Lesar, R. Dislocation motion in high strain-rate deformation. Philosophical
Magazine 87, 2263-2279 (2007).
37 Liu, Z. L., You, X. C. & Zhuang, Z. A mesoscale investigation of strain rate effect on dynamic deformation of
single-crystal copper. Int. J. Solids Struct. 45, 3674-3687 (2008).
38 Wang, Z. Q., Beyerlein, I. J. & LeSar, R. Plastic anisotropy in fcc single crystals in high rate deformation. Int.
J. Plast. 25, 26-48 (2009).
39 Shehadeh, M. A., Zbib, H. M. & Diaz De La Rubia, T. Modelling the dynamic deformation and patterning in
fcc single crystals at high strain rates: dislocation dynamics plasticity analysis. Philos. Mag. 85, 1667-1685
(2005).
40 Shehadeh, M. A., Bringa, E. M., Zbib, H. M., McNaney, J. M. & Remington, B. A. Simulation of shock-induced
plasticity including homogeneous and heterogeneous dislocation nucleations. Applied Physics Letters 89,
171918 (2006).
41 Gurrutxaga-Lerma, B., Balint, D. S., Dini, D., Eakins, D. E. & Sutton, A. P. Attenuation of the Dynamic Yield
Point of Shocked Aluminum Using Elastodynamic Simulations of Dislocation Dynamics. Phys. Rev. Lett. 114,
174301 (2015).
42 Cheng, G. J. & Shehadeh, M. A. Multiscale dislocation dynamics analyses of laser shock peening in silicon
single crystals. Int. J. Plast. 22, 2171-2194 (2006).
43 Cheng, G. J. & Shehadeh, M. A. Dislocation behavior in silicon crystal induced by laser shock peening: A
multiscale simulation approach. Scripta Materialia 53, 1013-1018 (2005).
44 Hussein, A. M., Rao, S. I., Uchic, M. D., Dimiduk, D. M. & El-Awady, J. A. Microstructurally based cross-slip
mechanisms and their effects on dislocation microstructure evolution in fcc crystals. Acta Mater. 85, 180-
190 (2015).
45 Fan, H., Li, Z., Huang, M. & Zhang, X. Thickness effects in polycrystalline thin films: Surface constraint versus
interior constraint. International Journal of Solids and Structures 48, 1754-1766 (2011).

30
46 Fan, H., Aubry, S., Arsenlis, A. & El-Awady, J. A. Grain size effects on dislocation and twinning mediated
plasticity in magnesium. Scripta Mater. 112, 50-53 (2016).
47 Lehtinen, A., Granberg, F., Laurson, L., Nordlund, K. & Alava, M. J. Multiscale modeling of dislocation-
precipitate interactions in Fe: From molecular dynamics to discrete dislocations. Phys. Rev. E 93, 013309
(2016).
48 de Souza, O. N. & Ornstein, R. L. Effect of periodic box size on aqueous molecular dynamics simulation of a
DNA dodecamer with particle-mesh Ewald method. Biophys. J. 72, 2395-2397 (1997).
49 Oren, E., Yahel, E. & Makov, G. Dislocation kinematics: a molecular dynamics study in Cu. Model. Simul.
Mater. Sci. Eng. 25, 025002 (2017).
50 Akarapu, S., Zbib, H. M. & Bahr, D. F. Analysis of heterogeneous deformation and dislocation dynamics in
single crystal micropillars under compression. Int. J. Plasticity 26, 239-257 (2010).
51 Olmsted, D. L. & et al. Atomistic simulations of dislocation mobility in Al, Ni and Al/Mg alloys. Model. Simul.
Mater. Sci. Eng. 13, 371 (2005).
52 Plimpton, S. Fast Parallel Algorithms for Short-Range Molecular Dynamics. J. Comp. Phys. 117, 1-19 (1995).
53 Zope, R. R. & Mishin, Y. Interatomic potentials for atomistic simulations of the Ti-Al system. Physical Review
B 68, 024102 (2003).
54 Zepeda-Ruiz, L. A., Stukowski, A., Oppelstrup, T. & Bulatov, V. V. Probing the limits of metal plasticity with
molecular dynamics simulations. Nature 550, 492 (2017).
55 Meyers, M. A. Dynamic Behavior of Materials. (Wiley, 1994).
56 Tschopp, M. A. & et al. Atomistic simulations of homogeneous dislocation nucleation in single crystal
copper. Model. Simul. Mater. Sci. Eng. 15, 693 (2007).
57 Stelly, M. & Dormeval, R. in High Velocity Deformation of Solids. (eds Kozo Kawata & Jumpei Shioiri) 82-97
(Springer Berlin Heidelberg).
58 Zaiser, M. & Sandfeld, S. Scaling properties of dislocation simulations in the similitude regime. Modelling
and Simulation in Materials Science and Engineering 22, 065012 (2014).
59 Hildebrand, H. The effect of the initial dislocation density on dislocation multiplication and work-hardening
characteristics of copper single crystals. Phys. Status Solidi A 12, 239-249 (1972).
60 Livingston, J. D. The density and distribution of dislocations in deformed copper crystals. Acta Metall. 10,
229-239 (1962).
61 Van Drunen, G. & Saimoto, S. Deformation and recovery of [001] oriented copper crystals. Acta Metall. 19,
213-221 (1971).
62 Campbell, J. D. & Ferguson, W. G. The temperature and strain-rate dependence of the shear strength of
mild steel. Philos. Mag. 21, 63-82 (1970).
63 Patrick, L., Annette, B., Kirsten, D. & Wolfgang, B. Influence of Strain Rate, Temperature, Plastic Strain, and
Microstructure on the Strain Rate Sensitivity of Automotive Sheet Steels. Steel Res. Int. 84, 426-442 (2013).

31
64 Altan, T. & Boulger, F. W. Flow Stress of Metals and Its Application in Metal Forming Analyses. Journal of
Engineering for Industry 95, 1009-1019 (1973).
65 Estrin, Y. & Kubin, L. P. Local strain hardening and nonuniformity of plastic deformation. Acta Metall. 34,
2455-2464 (1986).
66 Roters, F. et al. Overview of constitutive laws, kinematics, homogenization and multiscale methods in
crystal plasticity finite-element modeling: Theory, experiments, applications. Acta Mater. 58, 1152-1211
(2010).
67 Hirth, J. P. & Lothe, J. Theory of Dislocations. 2nd edn, (John Wiley and Sons, 1982).
68 Zaiser, M. Local density approximation for the energy functional of three-dimensional dislocation systems.
Phys. Rev. B 92, 174120 (2015).
69 Mecking, H. & Kocks, U. F. Kinetics of flow and strain-hardening. Acta Metall. 29, 1865-1875 (1981).
70 Hähner, P. On the foundations of stochastic dislocation dynamics. Appl. Phys. A 62, 473-481 (1996).
71 Zaiser, M. Statistical modelling of dislocation systems. Mater. Sci. Eng. A 309-310, 304-315 (2001).