Benchmarking of performance of Mexican states with effective coverage
13
Series www.thelancet.com Vol 368 November 11, 2006 1729 Health System Reform in Mexico 3 Benchmarking of performance of Mexican states with effective coverage Rafael Lozano, Patricia Soliz, Emmanuela Gakidou, Jesse Abbott-Klafter, Dennis M Feehan, Cecilia Vidal, Juan Pablo Ortiz, Christopher J L Murray Benchmarking of the performance of states, provinces, or districts in a decentralised health system is important for fostering of accountability, monitoring of progress, identification of determinants of success and failure, and creation of a culture of evidence. The Mexican Ministry of Health has, since 2001, used a benchmarking approach based on the WHO concept of effective coverage of an intervention, which is defined as the proportion of potential health gain that could be delivered by the health system to that which is actually delivered. Using data collection systems, including state representative examination surveys, vital registration, and hospital discharge registries, we have monitored the delivery of 14 interventions for 2005–06. Overall effective coverage ranges from 54·0% in Chiapas, a poor state, to 65·1% in the Federal District. Effective coverage for maternal and child health interventions is substantially higher than that for interventions that target other health problems. Effective coverage for the lowest wealth quintile is 52% compared with 61% for the highest quintile. Effective coverage is closely related to public-health spending per head across states; this relation is stronger for interventions that are not related to maternal and child health than those for maternal and child health. Considerable variation also exists in effective coverage at similar amounts of spending. We discuss the implications of these issues for the further development of the Mexican health-information system. Benchmarking of performance by measuring effective coverage encourages decision-makers to focus on quality service provision, not only service availability. The effective coverage calculation is an important device for health- system stewardship. In adopting this approach, other countries should select interventions to be measured on the basis of the criteria of affordability, effect on population health, effect on health inequalities, and capacity to measure the effects of the intervention. The national institutions undertaking this benchmarking must have the mandate, skills, resources, and independence to succeed. Benchmarking of the performance of health systems is important for fostering of accountability, monitoring of progress, identification of determinants of success and failure, and creation of a culture of evidence. Initiatives from WHO and the Organisation for Economic Co- operation and Development 1,2 have drawn attention to the interest in performance benchmarking of health systems between countries. Performance benchmarking can also be important in countries with federal systems of government to help manage decentralised units. 3–5 Since 2001, the Mexican Ministry of Health has been developing a state-performance benchmarking system. Five yearly reports called Salúd Mexico, have been published; 6–9 each of which has been released at a yearly accountability citizen forum, which brings together important federal and state decision-makers, civil society, academics, and the media. State performance measurement in these reports began with a traditional set of indicators of inputs, outputs, and outcomes. Since the development of the WHO framework for health-systems performance and the elaboration of the construct of effective coverage, 10,11 the Ministry of Health has been using a performance benchmarking approach based on effective coverage. An initial assessment was released by the Ministry of Health 12 based on data obtained from a range of sources between 2000 and 2002, including the National Health Survey in 2000 and the National Health System Performance Survey in 2002–03, which used the World Health Survey. 13 The recently completed state-representative National Health and Nutrition Survey 2005–06, provides more data with which to measure important aspects of effective coverage. Effective coverage brings together three traditions: measurement of intervention coverage, demand for healthcare, and access to healthcare. Effective coverage has been defined for an intervention as “the fraction of potential health gain that can be delivered through an intervention by the health system that is actually delivered.” 11 For example, if the health system could, through detection and treatment of cervical cancer, increase healthy life expectancy for women by 2 years, but delivers only 1 year of increased healthy life expectancy, then effective coverage for this intervention is 50%. Another way to understand effective coverage is use of an intervention conditional on the need for it and adjusted for quality. Need in this framework exists if capacity exists to benefit from the intervention. Quality is defined as the ratio of health gain delivered through an intervention relative to the maximum health gain possible given ideal quality. Delivery of health gain requires that services be available, individuals in households perceive a need and demand the service, providers deliver the right intervention, and individuals adhere to the intervention. Thus, gaps in effective coverage might be due to physical, financial, or cultural barriers to accessing care, the resources available to providers, provider quality, Lancet 2006; 368: 1729–41 Published Online October 25, 2006 DOI:10.1016/S0140- 6736(06)69566-4 This is the third in a Series of six papers about health system reform in Mexico Director General de Información, Secretaría de Salud, Reforma 450 Col Juarez CP 06600, Mexico DF, Mexico (R Lozano MD); Mexican Ministry of Health, Mexico DF, Mexico (P Soliz MD, J P Ortiz MA); Harvard Initiative for Global Health, Cambridge, MA, USA (E Gakidou PhD, J Abbott-Klafter BA, D M Feehan BA, C Vidal MSc, Prof C J L Murray MD); and University of Queensland School of Population Health, Brisbane, Australia (E Gakidou, J Abbott-Klafter) Correspondence to: Dr Rafael Lozano [email protected]
Transcript of Benchmarking of performance of Mexican states with effective coverage

Series
www.thelancet.com Vol 368 November 11, 2006 1729
Health System Reform in Mexico 3
Benchmarking of performance of Mexican states with
eff ective coverage
Rafael Lozano, Patricia Soliz, Emmanuela Gakidou, Jesse Abbott-Klafter, Dennis M Feehan, Cecilia Vidal, Juan Pablo Ortiz, Christopher J L Murray
Benchmarking of the performance of states, provinces, or districts in a decentralised health system is important for fostering of accountability, monitoring of progress, identifi cation of determinants of success and failure, and creation of a culture of evidence. The Mexican Ministry of Health has, since 2001, used a benchmarking approach based on the WHO concept of eff ective coverage of an intervention, which is defi ned as the proportion of potential health gain that could be delivered by the health system to that which is actually delivered. Using data collection systems, including state representative examination surveys, vital registration, and hospital discharge registries, we have monitored the delivery of 14 interventions for 2005–06. Overall eff ective coverage ranges from 54·0% in Chiapas, a poor state, to 65·1% in the Federal District. Eff ective coverage for maternal and child health interventions is substantially higher than that for interventions that target other health problems. Eff ective coverage for the lowest wealth quintile is 52% compared with 61% for the highest quintile. Eff ective coverage is closely related to public-health spending per head across states; this relation is stronger for interventions that are not related to maternal and child health than those for maternal and child health. Considerable variation also exists in eff ective coverage at similar amounts of spending. We discuss the implications of these issues for the further development of the Mexican health-information system. Benchmarking of performance by measuring eff ective coverage encourages decision-makers to focus on quality service provision, not only service availability. The eff ective coverage calculation is an important device for health-system stewardship. In adopting this approach, other countries should select interventions to be measured on the basis of the criteria of aff ordability, eff ect on population health, eff ect on health inequalities, and capacity to measure the eff ects of the intervention. The national institutions undertaking this benchmarking must have the mandate, skills, resources, and independence to succeed.
Benchmarking of the performance of health systems is important for fostering of accountability, monitoring of progress, identifi cation of determinants of success and failure, and creation of a culture of evidence. Initiatives from WHO and the Organisation for Economic Co-operation and Development1,2 have drawn attention to the interest in performance benchmarking of health systems between countries. Performance benchmarking can also be important in countries with federal systems of government to help manage decentralised units.3–5 Since 2001, the Mexican Ministry of Health has been developing a state-performance benchmarking system. Five yearly reports called Salúd Mexico, have been published;6–9 each of which has been released at a yearly accountability citizen forum, which brings together important federal and state decision-makers, civil society, academics, and the media.
State performance measurement in these reports began with a traditional set of indicators of inputs, outputs, and outcomes. Since the development of the WHO framework for health-systems performance and the elaboration of the construct of eff ective coverage,10,11 the Ministry of Health has been using a performance benchmarking approach based on eff ective coverage. An initial assessment was released by the Ministry of Health12 based on data obtained from a range of sources between 2000 and 2002, including the National Health Survey in 2000 and the National Health System Performance Survey in 2002–03, which
used the World Health Survey.13 The recently completed state-representative National Health and Nutrition Survey 2005–06, provides more data with which to measure important aspects of eff ective coverage.
Eff ective coverage brings together three traditions: measurement of intervention coverage, demand for healthcare, and access to healthcare. Eff ective coverage has been defi ned for an intervention as “the fraction of potential health gain that can be delivered through an intervention by the health system that is actually delivered.”11 For example, if the health system could, through detection and treatment of cervical cancer, increase healthy life expectancy for women by 2 years, but delivers only 1 year of increased healthy life expectancy, then eff ective coverage for this intervention is 50%. Another way to understand eff ective coverage is use of an intervention conditional on the need for it and adjusted for quality. Need in this framework exists if capacity exists to benefi t from the intervention. Quality is defi ned as the ratio of health gain delivered through an intervention relative to the maximum health gain possible given ideal quality. Delivery of health gain requires that services be available, individuals in households perceive a need and demand the service, providers deliver the right intervention, and individuals adhere to the intervention. Thus, gaps in eff ective coverage might be due to physical, fi nancial, or cultural barriers to accessing care, the resources available to providers, provider quality,
Lancet 2006; 368: 1729–41
Published Online
October 25, 2006
DOI:10.1016/S0140-
6736(06)69566-4
This is the third in a Series of six
papers about health
system reform in Mexico
Director General de
Información, Secretaría de
Salud, Reforma 450 Col Juarez
CP 06600, Mexico DF, Mexico
(R Lozano MD); Mexican
Ministry of Health, Mexico DF,
Mexico (P Soliz MD,
J P Ortiz MA); Harvard Initiative
for Global Health, Cambridge,
MA, USA (E Gakidou PhD,
J Abbott-Klafter BA,
D M Feehan BA, C Vidal MSc,
Prof C J L Murray MD); and
University of Queensland
School of Population Health,
Brisbane, Australia (E Gakidou,
J Abbott-Klafter)
Correspondence to:
Dr Rafael Lozano
Series
1730 www.thelancet.com Vol 368 November 11, 2006
and a range of factors that determine household demand. Eff ective coverage can be aggregated across interventions with the same logic. Overall health-system eff ective coverage is the fraction of potential health gain for the population that a health system could deliver that is actually delivered.
Mexico is the fi rst country to fully implement the WHO recommendation to measure eff ective coverage of health
care interventions.14 Measurement has necessitated the development of measurement strategies and, in some cases, new analytical methods. Although the concept, particularly the incorporation of quality, has been only partly implemented, the Mexican experience provides a good example of the important interplay between national endeavours to monitor health-system performance and the parallel worldwide agenda. In this paper, we describe
Intervention Population in need Use Quality Years available
Measles immunisation Children aged 18–59 months One or more doses of the MMR or
Antisarampion vaccines as shown on a
vaccination card or, for those without a
card, according to the mother’s report
Not available 2000, 2002–03, 2005–06
DTP3 immunisation Children aged 12–59 months Children who had at least three doses of
pentavalente as shown on a vaccination
card or, for those without a card,
according to the mother’s report
Not available 2000, 2002–03, 2005–06
BCG immunisation Children younger than 5 years Children who showed a BCG scar, or who
reported having one
Not available 2000, 2002–03, 2005–06
Antenatal care Women who gave birth in a given time
period
Saw a doctor, nurse, or midwife during
pregnancy at least four times
Received blood test and had blood
pressure measured
2000, 2002–03, 2005–06
Skilled birth attendance Women who gave birth in a given time
period
Birth attended by health professional Birth took place in hospital 2000, 2002–03, 2005–06
Services delivered to premature
babies
Babies born at 28–36 weeks gestation
or those weighing <3500 g at birth
Birth took place in hospital Diff erence in mortality rate in permature
babies compared with maximum and
minimum risk-adjusted mortality
2000–05
Treatment of acute respiratory
infections in children
Children younger than 5 years whose
mothers report their having had a
cough, cold, fl u, bronchitis, or earache
in the 2 weeks preceding the survey
Mother reports child received treatment Treatment from a health worker 2000, 2002–03, 2005–06
Treatment of diarrhoea in
children
Children younger than 5 years whose
mothers report their having had an
episode of diarrhoea in the 2 weeks
preceding the survey
Mother reports child received more
liquids or oral rehydration therapy
Not available 2000, 2002–03, 2005–06
Breast cancer screening Women aged 40–69 years Had a mammography within past year Not available 2000, 2002–03, 2005–06
Cervical cancer screening Women aged 25–64 years Had a pap test within past year Not available 2000, 2002–03, 2005–06
Treatment of vision disorders Adults older than 20 years who report
near or far visual impairment or wear
glasses or contact lenses
Use glasses or contact lenses Report no near or far visual impairment
when wearing glasses or contact lenses
2002–03, 2005–06
Treatment of asthma Self-reported symptoms to estimate
probability that an individual is
asthmatic with Probabilistic Diagnostic
Scale method15
Self-reported medication Not available 2002–03
Treatment of angina Self-reported symptoms to estimate
probability that an individual has
angina with Probabilistic Diagnostic
Scale method
Self-reported medication Not available 2002–03
Treatment of arthritis Self-reported symptoms to estimate
probability that an individual has
arthritis using Probabilistic Diagnostic
Scale method
Self-reported medication Not available 2002–03
Glycaemic control in diabetes Fasting plasma glucose estimated from
casual plasma glucose ≥6·9 mmol/L
Self-reported use of oral hypoglycaemics
or insulin
Reduction in fasting plasma glucose
compared with treatment targets
2000, 2005–06 (not yet
available)
Treatment of hypertension Adults older than 20 years with systolic
blood pressure ≥140 mm Hg
Self-reported use of antihypertensive
agents
Reduction in systolic blood pressure
compared with treatment targets
2000, 2005–06
Treatment of
hypercholesterolaemia
Adults older than 20 years with total
cholesterol ≥5·2 mmol/L
Self-reported use of drugs for cholesterol
reduction
Reduction in total cholesterol compared
with treatment targets
2005–06
Infl uenza vaccine Adults older than 60 years Self-reported infl uenza vaccine in past
year
Not available 2005–06
MMR=measles, mumps, and rubella . DTP3=three doses of diphtheria toxoid, tetanus toxoid, and pertussis vaccine.
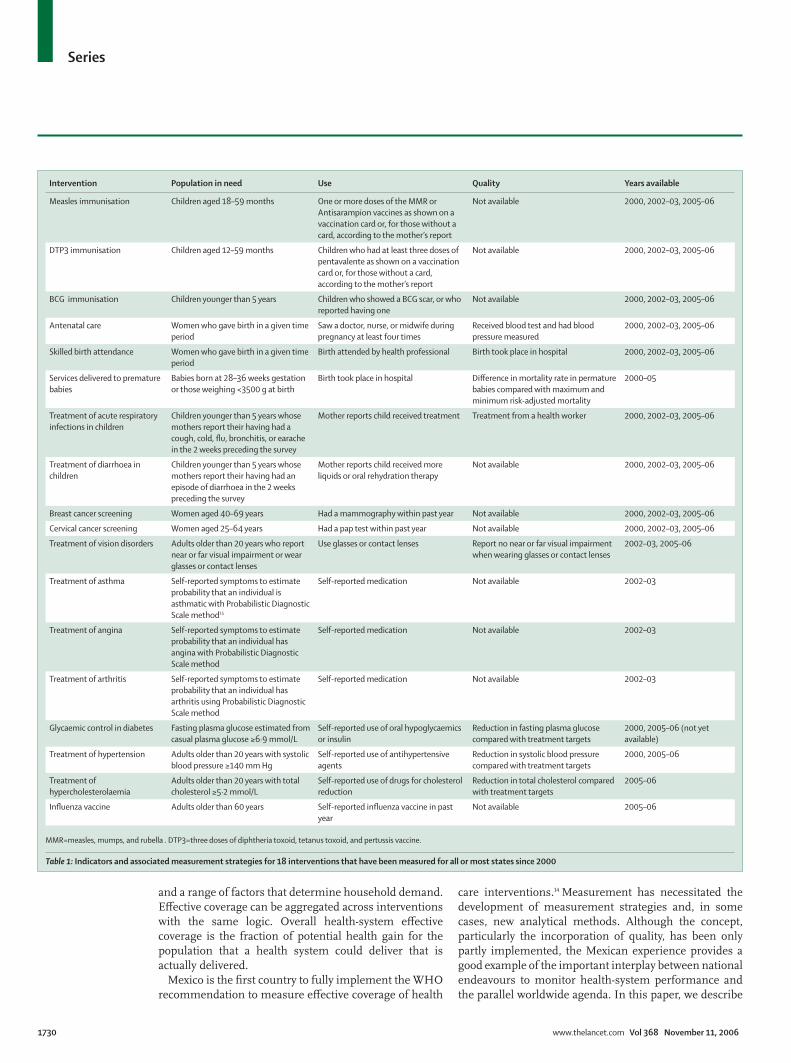
Table 1: Indicators and associated measurement strategies for 18 interventions that have been measured for all or most states since 2000

Series
www.thelancet.com Vol 368 November 11, 2006 1731
the steps taken to implement this performance benchmarking approach and present main results for 2005–06. Implications for both the evolution of the Mexican health system and other health systems are discussed.
Evidence Selection of interventions for monitoringImplementation of eff ective coverage as a performance benchmarking device in Mexican states began with selection of interventions for monitoring and the development of measurement strategies and data requirements. On the basis of a review of available data systems, only a few interventions could be measured with confi dence at the state level. Though not exhaustive, the set of interventions that can be opportunistically measured has been the basis of the fi rst generation of benchmarking of eff ective coverage in Mexico. Table 1 provides the indicators and associated measurement strategies for 18 interventions that have been measured for all or most states for at least one time period in the past 5 years. We stress that this set of interventions is opportunistic rather than ideal; however, it does provide useful insights into health system performance across states in Mexico. As noted in table 1, for several interventions, no measure of quality could be developed with available data; in these cases, crude coverage, which can be defi ned as use dependent on need, has been used.
Measurement strategies for need, use, and qualityMeasurement of eff ective coverage for each indicator must begin with three questions. First, how do we identify those individuals who need an intervention? Need is not simply those who demand a service, but a true population measure of those who would benefi t from an intervention. Second, how do we identify those in need who receive an intervention? Third, how do we measure the quality of the intervention delivered? Quality measurement is the most challenging area, and the one for which the most development was needed. We have taken the perspective of measuring need and use for the entire population, and quality of all providers, not only of the Ministry of Health facilities. Panel 1 shows the strategies that can be used for measuring need, use, and quality of interventions (supplementary information available on authors’ website).
Eff ective coverage for Mexican states in 2005–06Details for the various data sources that have been used to measure eff ective coverage for the period 2000–03 are available elsewhere.12 We have taken advantage of the recently completed national examination survey, 2005–06, and registry data to measure eff ective coverage for 14 of the 18 indicators in table 1 for 2005–06 (supplementary information available on authors’
website). We present detailed results for three inter-ventions—visual impairment correction, hyper tension management, and services delivered to premature infants—to show the practical challenges. For some indicators, we present results for crude coverage, defi ned
Panel 1: Measuring need, use, and quality for eff ective
coverage of interventions
Measuring need
Practical strategies to measure need or capacity to benefi t
from an intervention include:
● using a norm: interventions such as cervical cancer
screening, immunisations for children or mammography
are needed by all members of a particular age-sex group;
● using self-reports in a household survey of a single
symptom or syndrome such as diarrhoea, visual
impairment or a respiratory infection;
● using self-reports in a household survey of multiple
symptoms that together can identify a condition or
disease such as asthma, depression or angina;
● using diagnostic or performance tests in an examination
survey such as for HIV infection, blood pressure, blood
sugar or cholesterol;
● using cases meeting clinical criteria diagnosed in health
facilities; in many systems , however, this might
underestimate need because of poor diagnostic quality,
poor reporting from private health care facilities and lack
of access to care for the disadvantaged.
Strategies for measurement of use
● using self-reports of care in household surveys;
● using drug inventories in household surveys where the
interviewer observed the drugs;
● using health service registries that record the delivery of an
intervention; data from registries can often be biased
upwards but may also miss private sector delivery;16
● using blood assays of drug use or biomarkers that indicate
intervention, such as antibodies due to vaccination.
Measuring quality
Measuring the fraction of potential health gain delivered
● change in a biological endpoint such as blood pressure,
cholesterol or presence of Mycobacterium tuberculosis in
sputum culture;
● change in measured functional health status such as a
change in vision with correction;
● change in self-reported functional health status;
● approximate quality with process proxies for health gain
such as the components of antenatal care;
Quality measurement might need use of cross-sectional data,
so issues of endogeneity must be addressed. In other
instances, risk-adjustment of measured outcomes must also
be undertaken. Quality measurement is the area that will
require the most methodological advance and improvement
of data systems for most countries in order to fully capture
eff ective coverage.
For supplementary information
see http://sinais.salud.gob.mx/
eff ective_coverage_
webappendix/ and http://www.
globalhealth.harvard.edu/
mexicolancet.html
Endogeneity
Endogeneity describes models in
which reverse causality exists
between the explanatory variables
and outcome variable. In the
eff ective coverage context, use of
cross-sectional surveys to measure
intervention quality means that
the eff ect of an intervention can be
obscured if endogeneity is present.
For example, a naive regression of
the eff ect of blood-pressure
treatment on systolic blood
pressure suggests that treatment
actually raises blood pressure. This,
of course, is only true because
individuals receive treatment when
they exhibit high systolic blood
pressure. In this case, not only does
treatment infl uence blood
pressure, but the reverse causality
also exists, as blood pressure level
infl uences treatment.
Series
1732 www.thelancet.com Vol 368 November 11, 2006
as the fraction of those who need an intervention who use it, without adjustment for quality, in addition to eff ective coverage or alone because no measurement of quality was available. In cases for which we can measure both crude and eff ective coverage, the contrast between the two helps identifi cation of the relative roles of physical, fi nancial, or cultural issues in access to any care and the quality of and adherence to care provided (supplementary information available on authors’ website). Composite eff ective coverage, inequalities in eff ective coverage by wealth groups, and the relationship between eff ective coverage and expenditure are also analysed to show the utility of the approach in Mexico.
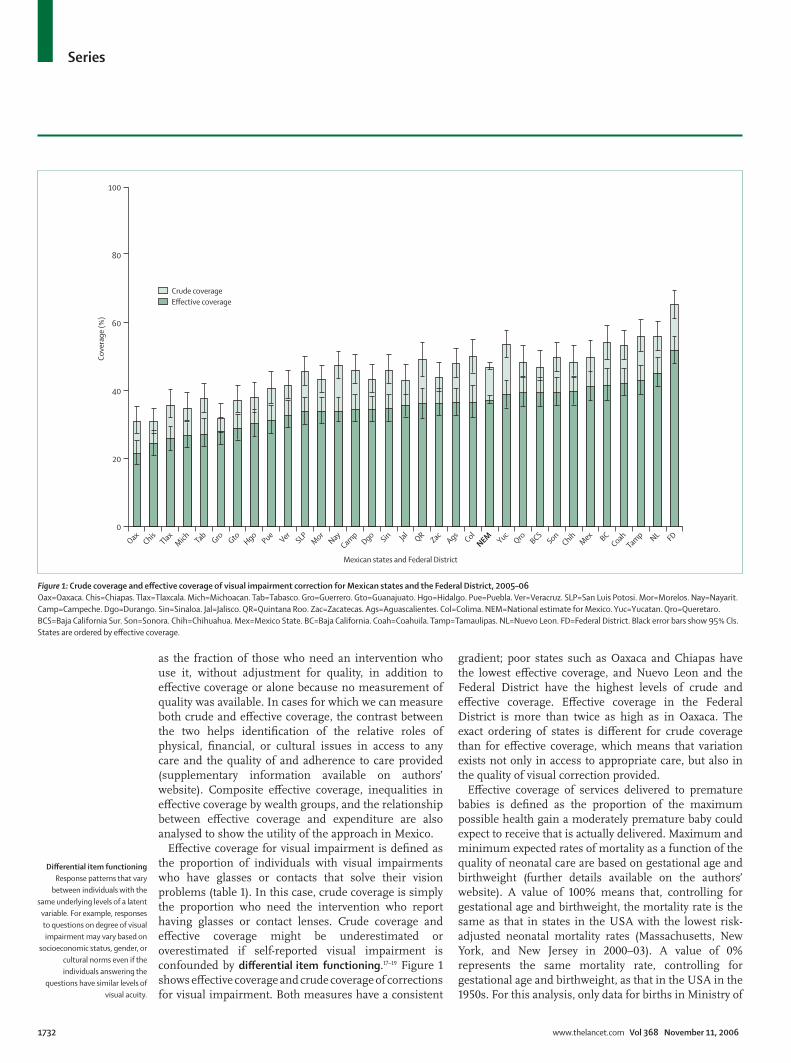
Eff ective coverage for visual impairment is defi ned as the proportion of individuals with visual impairments who have glasses or contacts that solve their vision problems (table 1). In this case, crude coverage is simply the proportion who need the intervention who report having glasses or contact lenses. Crude coverage and eff ective coverage might be underestimated or overestimated if self-reported visual impairment is confounded by diff erential item functioning.17–19 Figure 1 shows eff ective coverage and crude coverage of corrections for visual impairment. Both measures have a consistent
gradient; poor states such as Oaxaca and Chiapas have the lowest eff ective coverage, and Nuevo Leon and the Federal District have the highest levels of crude and eff ective coverage. Eff ective coverage in the Federal District is more than twice as high as in Oaxaca. The exact ordering of states is diff erent for crude coverage than for eff ective coverage, which means that variation exists not only in access to appropriate care, but also in the quality of visual correction provided.
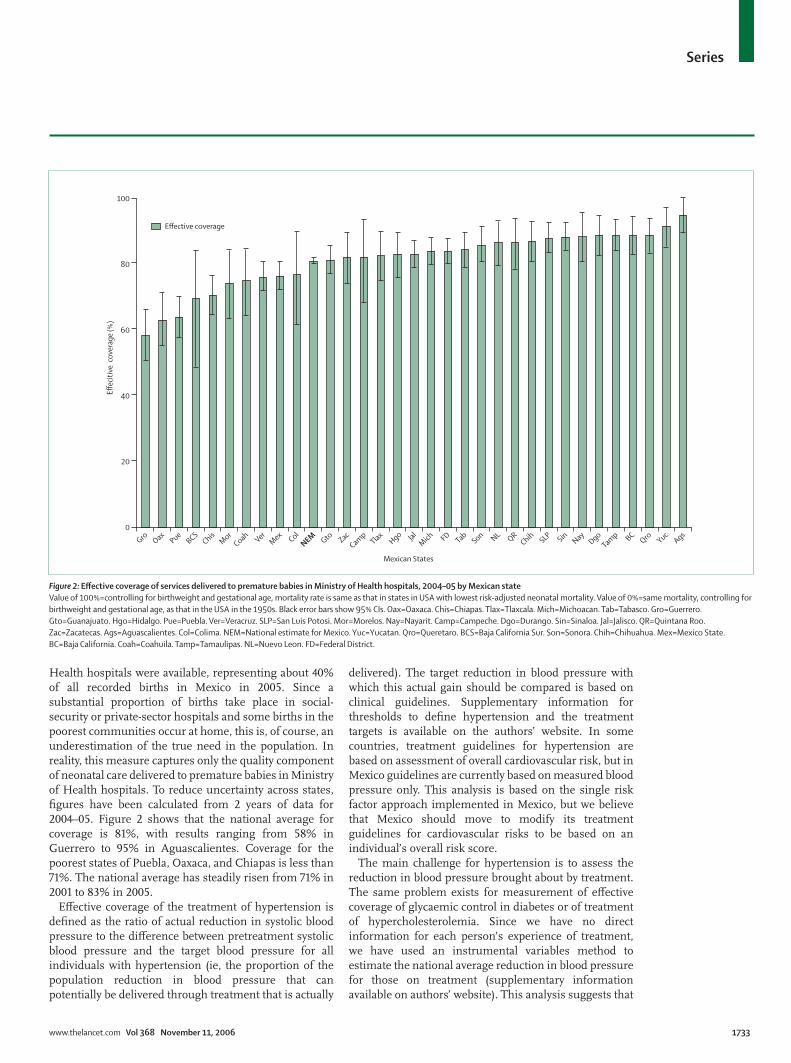
Eff ective coverage of services delivered to premature babies is defi ned as the proportion of the maximum possible health gain a moderately premature baby could expect to receive that is actually delivered. Maximum and minimum expected rates of mortality as a function of the quality of neonatal care are based on gestational age and birthweight (further details available on the authors’ website). A value of 100% means that, controlling for gestational age and birthweight, the mortality rate is the same as that in states in the USA with the lowest risk-adjusted neonatal mortality rates (Massachusetts, New York, and New Jersey in 2000–03). A value of 0% represents the same mortality rate, controlling for gestational age and birthweight, as that in the USA in the 1950s. For this analysis, only data for births in Ministry of
100
80
60
Co
vera
ge
(%)
Mexican states and Federal District
Crude coverage
Effective coverage
40
20
OaxChis
TlaxM
ich TabGro Gto
HgoPue
VerSLP
Mor
Nay
Camp
DgoSin Jal
QRZac
AgsCol
NEM YucQro
BCSSon
ChihM
ex BCCoah
Tamp NL FD
0
Figure 1: Crude coverage and eff ective coverage of visual impairment correction for Mexican states and the Federal District, 2005–06
Oax=Oaxaca. Chis=Chiapas. Tlax=Tlaxcala. Mich=Michoacan. Tab=Tabasco. Gro=Guerrero. Gto=Guanajuato. Hgo=Hidalgo. Pue=Puebla. Ver=Veracruz. SLP=San Luis Potosi. Mor=Morelos. Nay=Nayarit.
Camp=Campeche. Dgo=Durango. Sin=Sinaloa. Jal=Jalisco. QR=Quintana Roo. Zac=Zacatecas. Ags=Aguascalientes. Col=Colima. NEM=National estimate for Mexico. Yuc=Yucatan. Qro=Queretaro.
BCS=Baja California Sur. Son=Sonora. Chih=Chihuahua. Mex=Mexico State. BC=Baja California. Coah=Coahuila. Tamp=Tamaulipas. NL=Nuevo Leon. FD=Federal District. Black error bars show 95% CIs.
States are ordered by eff ective coverage.
Diff erential item functioning
Response patterns that vary
between individuals with the
same underlying levels of a latent
variable. For example, responses
to questions on degree of visual
impairment may vary based on
socioeconomic status, gender, or
cultural norms even if the
individuals answering the
questions have similar levels of
visual acuity.
Series
www.thelancet.com Vol 368 November 11, 2006 1733
Health hospitals were available, representing about 40% of all recorded births in Mexico in 2005. Since a substantial proportion of births take place in social-security or private-sector hospitals and some births in the poorest communities occur at home, this is, of course, an underestimation of the true need in the population. In reality, this measure captures only the quality component of neonatal care delivered to premature babies in Ministry of Health hospitals. To reduce uncertainty across states, fi gures have been calculated from 2 years of data for 2004–05. Figure 2 shows that the national average for coverage is 81%, with results ranging from 58% in Guerrero to 95% in Aguascalientes. Coverage for the poorest states of Puebla, Oaxaca, and Chiapas is less than 71%. The national average has steadily risen from 71% in 2001 to 83% in 2005.
Eff ective coverage of the treatment of hypertension is defi ned as the ratio of actual reduction in systolic blood pressure to the diff erence between pretreatment systolic blood pressure and the target blood pressure for all individuals with hypertension (ie, the proportion of the population reduction in blood pressure that can potentially be delivered through treatment that is actually
delivered). The target reduction in blood pressure with which this actual gain should be compared is based on clinical guidelines. Supplementary information for thresholds to defi ne hypertension and the treatment targets is available on the authors’ website. In some countries, treatment guidelines for hypertension are based on assessment of overall cardiovascular risk, but in Mexico guidelines are currently based on measured blood pressure only. This analysis is based on the single risk factor approach implemented in Mexico, but we believe that Mexico should move to modify its treatment guidelines for cardiovascular risks to be based on an individual’s overall risk score.
The main challenge for hypertension is to assess the reduction in blood pressure brought about by treatment. The same problem exists for measurement of eff ective coverage of glycaemic control in diabetes or of treatment of hypercholesterolemia. Since we have no direct information for each person’s experience of treatment, we have used an instrumental variables method to estimate the national average reduction in blood pressure for those on treatment (supplementary information available on authors’ website). This analysis suggests that
100
80
60
Effec
itiv
e c
ove
rage
(%
)
Mexican States
Effective coverage
40
20
Gro OaxPue
BCSChis
Mor
CoahVer
Mex
Col
NEM Gto Zac
Camp
Tlax JalM
ich FDTab
Son NLQR
Chih SLPSin
NayDgo
Tamp BC
Qro YucAgs
0
Hgo
Figure 2: Eff ective coverage of services delivered to premature babies in Ministry of Health hospitals, 2004–05 by Mexican state
Value of 100%=controlling for birthweight and gestational age, mortality rate is same as that in states in USA with lowest risk-adjusted neonatal mortality. Value of 0%=same mortality, controlling for
birthweight and gestational age, as that in the USA in the 1950s. Black error bars show 95% CIs. Oax=Oaxaca. Chis=Chiapas. Tlax=Tlaxcala. Mich=Michoacan. Tab=Tabasco. Gro=Guerrero.
Gto=Guanajuato. Hgo=Hidalgo. Pue=Puebla. Ver=Veracruz. SLP=San Luis Potosi. Mor=Morelos. Nay=Nayarit. Camp=Campeche. Dgo=Durango. Sin=Sinaloa. Jal=Jalisco. QR=Quintana Roo.
Zac=Zacatecas. Ags=Aguascalientes. Col=Colima. NEM=National estimate for Mexico. Yuc=Yucatan. Qro=Queretaro. BCS=Baja California Sur. Son=Sonora. Chih=Chihuahua. Mex=Mexico State.
BC=Baja California. Coah=Coahuila. Tamp=Tamaulipas. NL=Nuevo Leon. FD=Federal District.

Series
1734 www.thelancet.com Vol 368 November 11, 2006
the average reduction in systolic blood pressure owing to treatment in Mexico is 11 mm Hg; single-agent clinical trials have shown reductions between 5·4 and 8·4 mm Hg.20 State eff ective coverage has been calculated on the basis that the average reduction of systolic blood pressure for those on treatment is the same in all states. Figure 3 shows that, nationally, crude coverage of hypertension treatment is estimated to be about 49% while eff ective coverage is only 23%. As with other coverage indicators, large variations in eff ective coverage rates exist between states in Mexico. The state with the highest eff ective coverage is Jalisco, which, at 31%, is almost twice as high as Queretaro at 16%. Some poor states, such as Chiapas and Oaxaca, are doing much better at delivering eff ective coverage for hypertension than for other interventions; these disadvantaged states have had substantial increases in crude and eff ective coverage since 2000.21 The low crude and eff ective coverage for hypertension cannot be explained by the fact that people with hypertension, but with low total cardiovascular risk, are not being treated. Subgroup analysis shows no relation between crude coverage and total cardiovascular risk.
Table 2 provides the results for eff ective coverage by state for 14 interventions for 2005–06. Results range from 9% for mammography in Guerrero to 100% for
skilled birth attendance at delivery for Baja California Sur and the Federal District. Of the 14 interventions for which data for 2005–06 are available, eight are for maternal and child health and six are for other interventions. The maternal and child health interventions have fairly high coverage on average; for skilled birth attendance and the childhood im-munisations, the range between states is also quite small. The other interventions, which are not part of the maternal and child health package, and which includes breast cancer screening, cervical cancer screening, adult infl uenza vaccination, visual im-pairment correction, treatment of hypertension, and treatment of hypercholesterolaemia, have much lower coverage.
A composite measure of eff ective coverage has been constructed from these 14 interventions to help summarise the overall pattern of service delivery at the state level and to study inequalities. Panel 2 describes alternative methods that can be used to construct composite measures of eff ective coverage and further supplementary information describing in detail the application of three diff erent methods in Mexico is available on the author’s website. Use of simple averages or weighting of each intervention by total health gain yields very similar results; fi gures discussed here are
100
80
60
Co
vera
ge
(%)
Crude coverage
Effective coverage
40
20
Qro YucVer
Gro
Camp
SonHgo QR
SinPue
ZacM
ich TabBCS
TlaxNay
ChisDgo
NEMChih
CoahSLP
OaxM
exCol
NLAgs
Gto BCTam
p FDM
or Jal0
Figure 3: Crude coverage and eff ective coverage of treatment for hypertension in Mexican states and the Federal District, 2005–06
Black error bars show 95% CIs. Oax=Oaxaca. Chis=Chiapas. Tlax=Tlaxcala. Mich=Michoacan. Tab=Tabasco. Gro=Guerrero. Gto=Guanajuato. Hgo=Hidalgo. Pue=Puebla. Ver=Veracruz. SLP=San Luis Potosi.
Mor=Morelos. Nay=Nayarit. Camp=Campeche. Dgo=Durango. Sin=Sinaloa. Jal=Jalisco. QR=Quintana Roo. Zac=Zacatecas. Ags=Aguascalientes. Col=Colima. NEM=National estimate for Mexico.
Yuc=Yucatan. Qro=Queretaro. BCS=Baja California Sur. Son=Sonora. Chih=Chihuahua. Mex=Mexico State. BC=Baja California. Coah=Coahuila. Tamp=Tamaulipas. NL=Nuevo Leon. FD=Federal District.

Series
www.thelancet.com Vol 368 November 11, 2006 1735
based on simple averages. These composite results, however, should be considered with care. A composite based on a small set of indicators might not adequately show the interventions the system should deliver. The set of interventions available for Mexico cannot be regarded as the ideal or the most parsimonious set of interventions. In fact, the set of selected interventions for which consistent and relevant information is available compared with the burden of disease is biased towards maternal and child health. This bias underestimates the crucial role of other interventions to target chronic conditions and other non-communicable diseases. Finally, some measurement issues remain for several of these indicators, including absence of data for the quality dimension of eff ective coverage.
Vaccination Antenatal
care
Skilled
birth
attendance
Services
for
premature
babies
Treatment
of ARI in
children
Treatment
of
diarrhoea
in children
Cancer
screening
Vision
disorders
Hyper-
tension
Hyper-
cholestero-
laemia
Composite
coverage
Measles DTP3 BCG Infl uenza Breast Cervical
Aguascalientes 94·1 85·6 97·8 41·4 69·1 98·5 94·9 69·0 64·3 28·7 43·8 36·8 26·7 28·4 62·8
Baja California 90·9 70·6 94·5 33·6 67·7 93·0 88·7 56·2 69·1 21·9 40·0 41·8 27·3 27·7 58·8
Baja California
Sur
91·1 79·5 96·7 33·6 67·9 100·0 70·5 50·9 66·0 21·2 41·5 39·7 19·7 22·0 57·2
Campeche 97·3 95·2 99·6 55·5 66·6 92·2 82·0 63·8 55·8 24·4 43·1 34·6 17·3 38·6 61·9
Coahuila 91·8 84·1 98·9 46·7 73·5 98·3 75·3 64·5 84·9 19·8 35·2 42·4 24·0 26·0 61·8
Colima 87·9 86·4 97·6 42·2 72·8 93·0 76·5 47·1 63·9 26·1 49·0 36·9 25·6 31·5 59·8
Chiapas 90·0 87·7 98·0 38·6 48·6 73·7 70·3 46·0 61·5 16·3 51·6 24·6 21·8 27·1 54·0
Chihuahua 92·3 86·5 97·3 41·8 68·0 94·9 86·8 51·3 67·4 18·9 34·8 39·8 23·5 21·7 58·9
Federal District 90·4 83·0 97·3 50·0 81·0 100·0 83·9 68·8 72·7 28·1 41·3 52·0 29·1 34·4 65·1
Durango 94·8 88·6 97·6 48·8 63·3 97·4 88·7 55·0 56·3 24·5 42·9 34·7 22·9 26·2 60·1
Guanajuato 97·6 93·8 99·4 52·4 70·5 99·2 81·0 63·0 55·8 16·3 42·1 29·4 27·1 24·9 60·9
Guerrero 93·0 89·7 98·2 49·2 59·1 81·0 58·3 59·2 78·0 8·6 39·1 28·3 17·2 18·5 55·5
Hidalgo 95·6 92·4 99·0 49·1 64·6 96·7 83·0 68·3 63·1 16·1 47·3 30·5 17·8 27·0 60·7
Jalisco 86·1 86·2 96·4 30·0 80·4 98·9 83·0 63·4 72·5 29·0 41·6 36·0 30·8 10·3 60·3
Mexico 91·5 84·9 96·9 49·1 64·3 93·5 76·0 67·2 74·7 23·9 39·1 41·4 25·6 28·3 61·2
Michoacan 93·8 88·0 97·3 50·8 61·2 98·2 83·8 39·7 58·9 15·5 34·4 27·0 19·2 19·2 56·2
Morelos 96·1 88·8 99·3 50·3 60·7 93·0 74·3 47·0 69·9 13·8 36·4 34·3 30·6 17·9 58·0
Nayarit 93·1 88·2 98·5 42·3 80·0 95·0 88·3 59·3 81·7 30·9 49·1 34·4 21·3 22·4 63·2
Nuevo Leon 92·7 77·7 96·5 34·5 75·4 98·3 86·5 52·0 69·5 24·8 36·6 45·5 26·4 17·1 59·5
Oaxaca 91·9 88·5 98·9 49·1 51·0 78·2 63·2 47·1 61·5 19·4 45·6 21·7 24·4 19·3 54·3
Puebla 94·1 86·6 98·4 39·4 51·8 93·6 63·8 57·7 54·7 15·3 43·0 31·6 18·8 18·4 54·8
Queretaro 94·5 86·6 99·0 38·6 75·8 96·3 88·8 68·6 59·5 19·9 35·9 39·4 15·7 15·5 59·6
Quintana Roo 92·4 87·0 97·6 48·1 68·3 89·9 86·4 60·0 43·1 20·0 49·2 36·2 18·3 39·5 59·7
San Luis Potosi 93·5 88·6 99·9 37·6 79·7 93·5 88·0 53·3 71·0 17·1 38·3 34·1 24·4 14·8 59·6
Sinaloa 86·7 80·0 98·1 38·8 62·2 94·7 88·3 53·0 49·6 28·8 44·7 34·9 18·6 11·8 56·4
Sonora 91·8 82·0 98·2 35·3 68·9 97·6 85·6 54·1 67·1 17·2 35·1 39·8 17·5 32·2 58·7
Tabasco 97·7 91·1 98·3 49·6 80·3 90·2 84·0 65·0 57·0 23·9 49·9 27·7 19·4 47·9 63·0
Tamaulipas 90·7 69·3 96·1 36·6 64·5 87·6 88·7 55·6 75·3 23·0 35·6 43·2 29·1 30·3 59·0
Tlaxcala 92·2 90·5 99·3 53·9 69·1 97·9 82·4 56·5 65·9 21·9 43·6 26·1 20·0 18·1 59·8
Veracruz 91·6 88·9 97·4 43·0 67·4 89·8 76·0 49·0 59·4 20·1 45·9 33·0 16·7 27·3 57·5
Yucatan 97·5 87·7 99·3 57·2 78·6 88·6 91·3 59·5 68·0 24·3 40·0 39·0 16·2 33·4 62·9
Zacatecas 89·7 82·5 99·4 51·5 74·3 97·8 82·0 57·6 74·2 26·1 45·6 36·6 19·2 18·7 61·1
National 92·1 85·6 97·7 44·3 67·3 93·3 80·9 58·1 66·3 21·6 41·2 37·5 23·1 25·3 59·6
DTP3=three doses of diphtheria toxoid, tetanus toxoid, and pertussis vaccine. ARI=acute respiratory infection.
Table 2: Eff ective coverage by state for 14 interventions for 2005–06
Panel 2: Construction of eff ective coverage composites
At least four general methods are available for creation of composite measures of
eff ective coverage:
1 With the formal defi nition of eff ective coverage, each intervention could be combined
in proportion to the average health gain it delivers to the population;
2 Preference weights can be derived from revealed choices in the marketplace or from
survey responses;
3 Arbitrary weights, such as simple averages, or other weights can be used;
4 One can assume that each indicator is an imperfect measure of an underlying
unobserved construct, health system eff ective coverage, and use latent variable
techniques, such as factor analysis or variants of probits and logits.
In Mexico, results are mostly insensitive to the weighting method adopted.12 We have used simple averages for presentation
here.
Series
1736 www.thelancet.com Vol 368 November 11, 2006
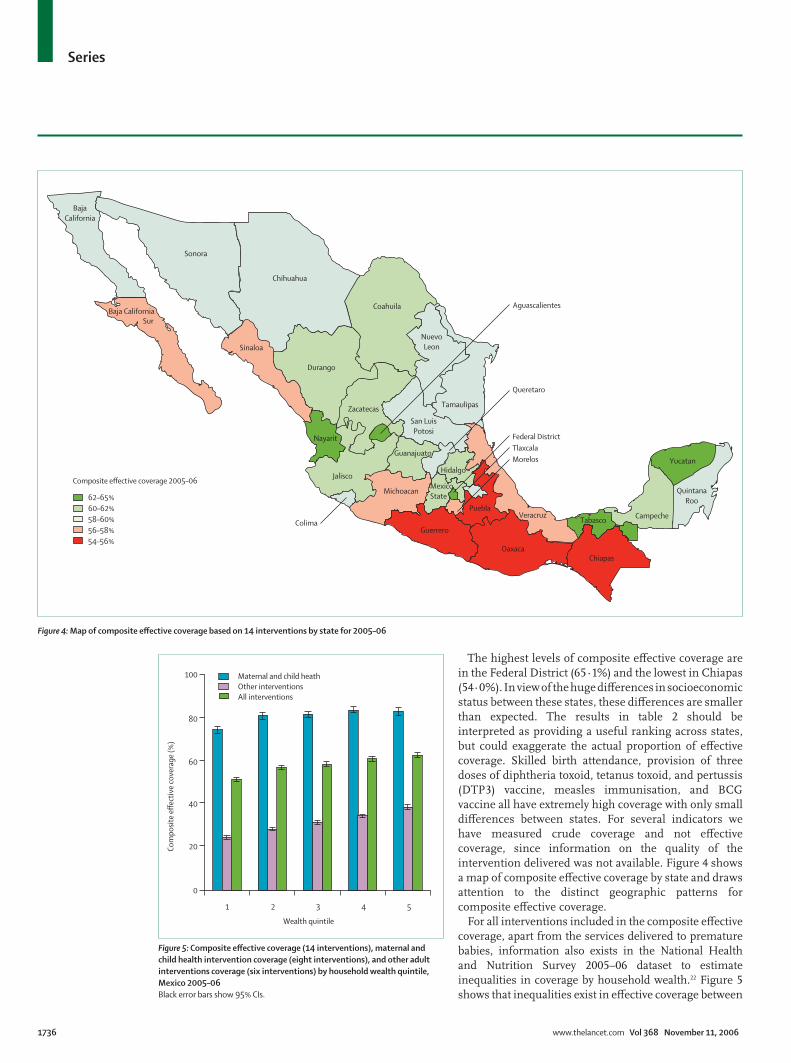
The highest levels of composite eff ective coverage are in the Federal District (65·1%) and the lowest in Chiapas (54·0%). In view of the huge diff erences in socioeconomic status between these states, these diff erences are smaller than expected. The results in table 2 should be interpreted as providing a useful ranking across states, but could exaggerate the actual proportion of eff ective coverage. Skilled birth attendance, provision of three doses of diphtheria toxoid, tetanus toxoid, and pertussis (DTP3) vaccine, measles immunisation, and BCG vaccine all have extremely high coverage with only small diff erences between states. For several indicators we have measured crude coverage and not eff ective coverage, since information on the quality of the intervention delivered was not available. Figure 4 shows a map of composite eff ective coverage by state and draws attention to the distinct geographic patterns for composite eff ective coverage.
For all interventions included in the composite eff ective coverage, apart from the services delivered to premature babies, information also exists in the National Health and Nutrition Survey 2005–06 dataset to estimate inequalities in coverage by household wealth.22 Figure 5 shows that inequalities exist in eff ective coverage between
Composite effective coverage 2005–06
62–65%
60–62%
58–60%
56–58%
54–56%
Baja
California
Baja California
Sonora
Chihuahua
Sinaloa
Durango
Coahuila
Nayarit
Zacatecas
Jalisco
Michoacan
Aguascalientes
Guanajuato
San Luis
Potosi
Nuevo
Leon
Tamaulipas
Queretaro
Mexico
State
Hidalgo
VeracruzPuebla
Guerrero
OaxacaChiapas
TabascoCampeche
Yucatan
Quintana
Roo
Federal District
Tlaxcala
Morelos
Colima
Sur
Figure 4: Map of composite eff ective coverage based on 14 interventions by state for 2005–06
Wealth quintile
Co
mp
osi
te e
ffec
tive
co
vera
ge
(%)
Maternal and child heath
Other interventions
All interventions
100
80
60
40
20
0
1 2 3 4 5
Figure 5: Composite eff ective coverage (14 interventions), maternal and
child health intervention coverage (eight interventions), and other adult
interventions coverage (six interventions) by household wealth quintile,
Mexico 2005–06
Black error bars show 95% CIs.
Series
www.thelancet.com Vol 368 November 11, 2006 1737
income quintiles for the combination of all interventions; subcomposites for the maternal and child health and other interventions are also shown. The absolute gap in eff ective coverage between quintiles is 9% for the maternal and child health interventions and 14% for the other interventions. Since the eff ective coverage for the non-maternal and child health interventions is, on average, much lower than that for other interventions, the 14% absolute gap also represents much greater relative inequality between quintiles. As discussed in detail elsewhere,21 inequalities narrowed substantially during 2000–06. The gradient between quintiles, however, might be underestimated because eff ective coverage of glycaemic control in people with diabetes has not been included in this analysis since the relevant data from the National Health and Nutrition Survey 2005–06 were not yet available.
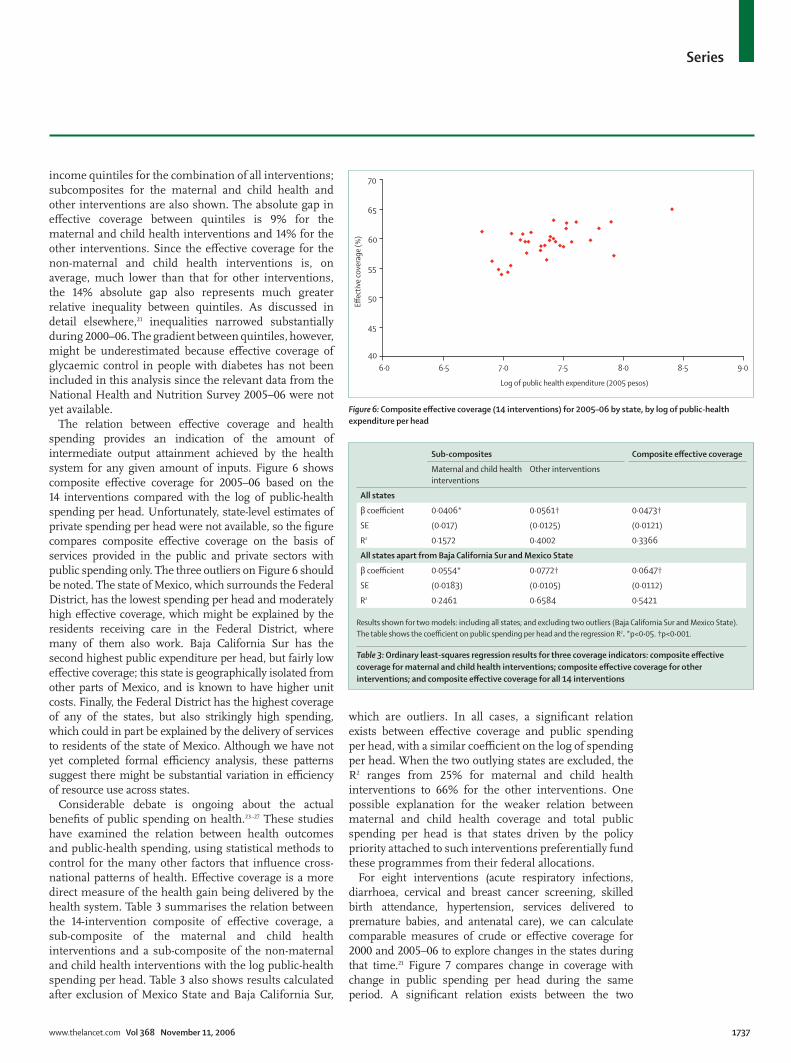
The relation between eff ective coverage and health spending provides an indication of the amount of intermediate output attainment achieved by the health system for any given amount of inputs. Figure 6 shows composite eff ective coverage for 2005–06 based on the 14 interventions compared with the log of public-health spending per head. Unfortunately, state-level estimates of private spending per head were not available, so the fi gure compares composite eff ective coverage on the basis of services provided in the public and private sectors with public spending only. The three outliers on Figure 6 should be noted. The state of Mexico, which surrounds the Federal District, has the lowest spending per head and moderately high eff ective coverage, which might be explained by the residents receiving care in the Federal District, where many of them also work. Baja California Sur has the second highest public expenditure per head, but fairly low eff ective coverage; this state is geographically isolated from other parts of Mexico, and is known to have higher unit costs. Finally, the Federal District has the highest coverage of any of the states, but also strikingly high spending, which could in part be explained by the delivery of services to residents of the state of Mexico. Although we have not yet completed formal effi ciency analysis, these patterns suggest there might be substantial variation in effi ciency of resource use across states.
Considerable debate is ongoing about the actual benefi ts of public spending on health.23–27 These studies have examined the relation between health outcomes and public-health spending, using statistical methods to control for the many other factors that infl uence cross-national patterns of health. Eff ective coverage is a more direct measure of the health gain being delivered by the health system. Table 3 summarises the relation between the 14-intervention composite of eff ective coverage, a sub-composite of the maternal and child health interventions and a sub-composite of the non-maternal and child health interventions with the log public-health spending per head. Table 3 also shows results calculated after exclusion of Mexico State and Baja California Sur,
which are outliers. In all cases, a signifi cant relation exists between eff ective coverage and public spending per head, with a similar coeffi cient on the log of spending per head. When the two outlying states are excluded, the R2 ranges from 25% for maternal and child health interventions to 66% for the other interventions. One possible explanation for the weaker relation between maternal and child health coverage and total public spending per head is that states driven by the policy priority attached to such interventions preferentially fund these programmes from their federal allocations.
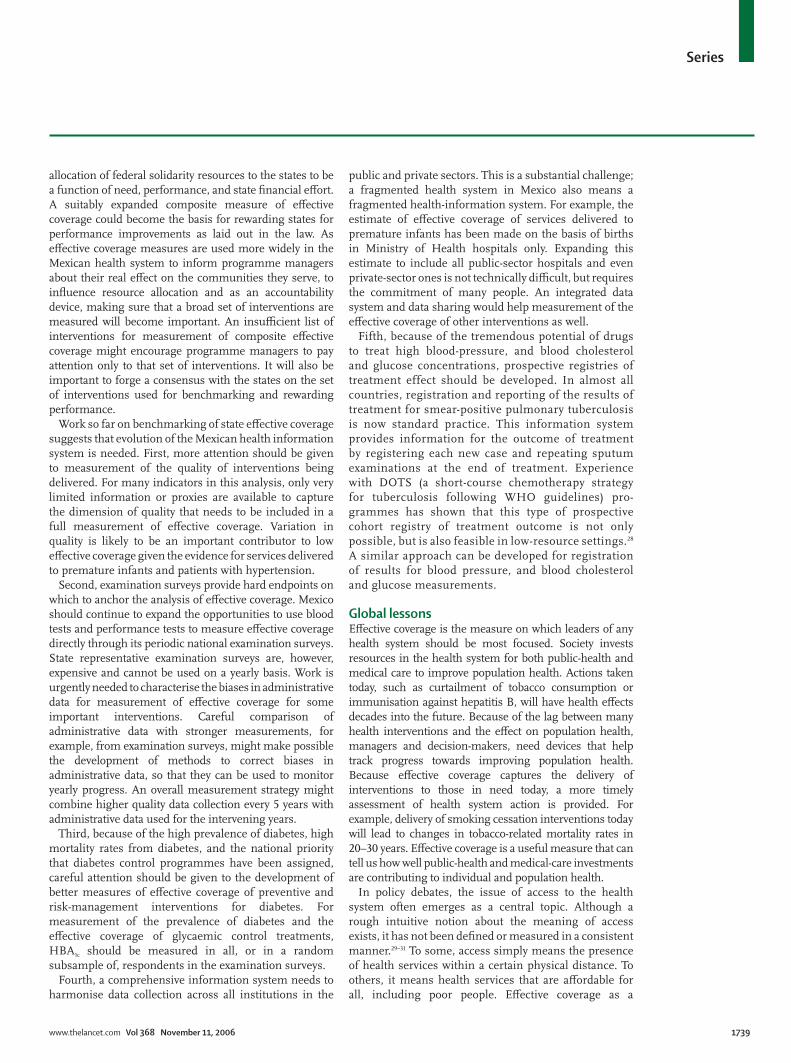
For eight interventions (acute respiratory infections, diarrhoea, cervical and breast cancer screening, skilled birth attendance, hypertension, services delivered to premature babies, and antenatal care), we can calculate comparable measures of crude or eff ective coverage for 2000 and 2005–06 to explore changes in the states during that time.21 Figure 7 compares change in coverage with change in public spending per head during the same period. A signifi cant relation exists between the two
Log of public health expenditure (2005 pesos)
70
65
60
55
50
45
40Eff
ecti
ve c
ove
rage
(%
)
6·0 6·5 7·0 7·5 8·0 8·5 9·0
Figure 6: Composite eff ective coverage (14 interventions) for 2005–06 by state, by log of public-health
expenditure per head
Sub-composites Composite eff ective coverage
Maternal and child health
interventions
Other interventions
All states
β coeffi cient 0·0406* 0·0561† 0·0473†
SE (0·017) (0·0125) (0·0121)
R2 0·1572 0·4002 0·3366
All states apart from Baja California Sur and Mexico State
β coeffi cient 0·0554* 0·0772† 0·0647†
SE (0·0183) (0·0105) (0·0112)
R2 0·2461 0·6584 0·5421
Results shown for two models: including all states; and excluding two outliers (Baja California Sur and Mexico State).
The table shows the coeffi cient on public spending per head and the regression R2. *p<0·05. †p<0·001.
Table 3: Ordinary least-squares regression results for three coverage indicators: composite eff ective
coverage for maternal and child health interventions; composite eff ective coverage for other
interventions; and composite eff ective coverage for all 14 interventions

Series
1738 www.thelancet.com Vol 368 November 11, 2006
(p<0·0005). This relation provides strong evidence that increases in funding lead to increases in the delivery of services to those who need them. The time series relation provides further validation of the relation shown in the cross-sectional data. In Mexico at least, public spending on health seems to have a demonstrable population eff ect.
Lessons for MexicoDespite the practical limitations of each indicator, including the fact that eight of the 14 indicators are crude coverage measures, this benchmarking framework provides important insights into performance at state level. Composite coverage varies substantially between states, and is strongly related to public spending per head. At any given level of public spending per head, considerable variation also exists in composite eff ective coverage, which implies that technical effi ciency varies between states. Further work with the states will be needed to understand why some are achieving greater eff ective coverage than others with the same amount of spending. This could in part be due to the higher unit costs for delivering services to some states with more remote or disadvantaged populations. The relation between public-health spending per head and eff ective coverage draws attention to the importance of increasing spending per head in the disadvantaged states. The roll-out of Seguro Popular20 has already improved the equity of spending between states, and is projected to substantially reduce inequalities in spending across states in the coming years. The greater equity in spending should lead to reductions in inequalities in eff ective coverage between states.
Analysis of eff ective coverage for a limited but generalisable set of interventions makes Mexico seem to have two health systems: one that addresses maternal and child health, and one that is far less advanced, which addresses non-communicable diseases and injuries.
Eff ective coverage metrics show good coverage for maternal and child health services, although indicators that capture the quality dimension, such as antenatal care, services to premature babies, and even DTP3 crude coverage show that much room for further improvement exists. Generally, physical access to these services is not a large problem, as shown by the high rates of crude antenatal care and skilled birth attendance in even the poorest states. Services to premature infants, which are a direct measure of quality of neonatal care in Ministry of Health hospitals, show that quality of care must be improved in several states. Even for this measure, however, Ministry of Health hospitals in Mexico are delivering 81% of the health gain achieved in the best states in the USA with substantially less expenditure. The high coverage for maternal and child health interventions might indicate a historical prioritisation of a set of interventions that are mostly cost-eff ective and address important health problems.
The second health system, which addresses non-communicable diseases and injuries, has much lower eff ective coverage. For the six interventions presented here, the national average is only 32%. If the list were expanded to include all the measures that have been implemented in Mexico for 2000–03, this national fi gure would probably be lower still. More than 82% of Mexico’s burden of disease is due to non-communicable diseases and injuries. The major challenge for the future will be to increase eff ective coverage for these interventions. Even if the past focus on maternal and child health inter-ventions were completely justifi ed by the epidemiological patterns of 30 years ago and by relative cost-eff ectiveness, in view of the current realities of Mexico, increased eff ective coverage for aff ordable interventions for non-communicable disease and injuries will be necessary to make further progress.
Nationally, half the population with hypertension, half those with a visual impairment, and three quarters of those with hypercholesterolaemia do not receive any intervention. The absence of physical, fi nancial, and cultural access is likely to have an important role in explaining that gap in crude coverage. For those who do receive a treatment, on average, only about half the estimated potential eff ect of these interventions is being delivered. The gap between crude and eff ective coverage is probably an indicator of both variable technical quality of providers and the challenges of encouraging adherence to therapy. The Mexican health reform holds out the promise of substantially increasing fi nancial access and the supply of drugs and staff to deliver these interventions. Strategies to achieve good provider quality and adherence to treatment for non-communicable disease interventions, however, need to be further developed.
Improved eff ective coverage metrics that better capture the quality of eff ective coverage and include a wider array of interventions can play an important part in the future of the Mexican health system; the reform calls for the
% change in expenditure
30
25
20
15
10
5
0
–5
% c
han
ge in
eff
ecti
ve c
ove
rage
0 10 20 30 40 50 60 70 80
Figure 7: Change in eff ective coverage for eight interventions measured in 2000 that are strictly comparable
with eight interventions measured in 2005–06, by state, compared with the percentage increase in public
spending per head during the same period.
The eight strictly comparable interventions are those for: acute respiratory infections, diarrhoea, cervical and
breast cancer screening, skilled birth attendance, hypertension, services for premature babies, and antenatal care.
Series
www.thelancet.com Vol 368 November 11, 2006 1739
allocation of federal solidarity resources to the states to be a function of need, performance, and state fi nancial eff ort. A suitably expanded composite measure of eff ective coverage could become the basis for rewarding states for performance improvements as laid out in the law. As eff ective coverage measures are used more widely in the Mexican health system to inform programme managers about their real eff ect on the communities they serve, to infl uence resource allocation and as an accountability device, making sure that a broad set of interventions are measured will become important. An insuffi cient list of interventions for measurement of composite eff ective coverage might encourage programme managers to pay attention only to that set of interventions. It will also be important to forge a consensus with the states on the set of interventions used for benchmarking and rewarding performance.
Work so far on benchmarking of state eff ective coverage suggests that evolution of the Mexican health information system is needed. First, more attention should be given to measurement of the quality of interventions being delivered. For many indicators in this analysis, only very limited information or proxies are available to capture the dimension of quality that needs to be included in a full measurement of eff ective coverage. Variation in quality is likely to be an important contributor to low eff ective coverage given the evidence for services delivered to premature infants and patients with hypertension.
Second, examination surveys provide hard endpoints on which to anchor the analysis of eff ective coverage. Mexico should continue to expand the opportunities to use blood tests and performance tests to measure eff ective coverage directly through its periodic national examination surveys. State representative examination surveys are, however, expensive and cannot be used on a yearly basis. Work is urgently needed to characterise the biases in administrative data for measurement of eff ective coverage for some important interventions. Careful comparison of administrative data with stronger measurements, for example, from examination surveys, might make possible the development of methods to correct biases in administrative data, so that they can be used to monitor yearly progress. An overall measurement strategy might combine higher quality data collection every 5 years with administrative data used for the intervening years.
Third, because of the high prevalence of diabetes, high mortality rates from diabetes, and the national priority that diabetes control programmes have been assigned, careful attention should be given to the development of better measures of eff ective coverage of preventive and risk-management interventions for diabetes. For measurement of the prevalence of diabetes and the eff ective coverage of glycaemic control treatments, HBA1c should be measured in all, or in a random subsample of, respondents in the examination surveys.
Fourth, a comprehensive information system needs to harmonise data collection across all institutions in the
public and private sectors. This is a substantial challenge; a fragmented health system in Mexico also means a fragmented health-information system. For example, the estimate of eff ective coverage of services delivered to premature infants has been made on the basis of births in Ministry of Health hospitals only. Expanding this estimate to include all public-sector hospitals and even private-sector ones is not technically diffi cult, but requires the commitment of many people. An integrated data system and data sharing would help measurement of the eff ective coverage of other interventions as well.
Fifth, because of the tremendous potential of drugs to treat high blood-pressure, and blood cholesterol and glucose concentrations, prospective registries of treatment effect should be developed. In almost all countries, registration and reporting of the results of treatment for smear-positive pulmonary tuberculosis is now standard practice. This information system provides information for the outcome of treatment by registering each new case and repeating sputum examinations at the end of treatment. Experience with DOTS (a short-course chemotherapy strategy for tuberculosis following WHO guidelines) pro-grammes has shown that this type of prospective cohort registry of treatment outcome is not only possible, but is also feasible in low-resource settings.28 A similar approach can be developed for registration of results for blood pressure, and blood cholesterol and glucose measurements.
Global lessonsEff ective coverage is the measure on which leaders of any health system should be most focused. Society invests resources in the health system for both public-health and medical care to improve population health. Actions taken today, such as curtailment of tobacco consumption or immunisation against hepatitis B, will have health eff ects decades into the future. Because of the lag between many health interventions and the eff ect on population health, managers and decision-makers, need devices that help track progress towards improving population health. Because eff ective coverage captures the delivery of interventions to those in need today, a more timely assessment of health system action is provided. For example, delivery of smoking cessation interventions today will lead to changes in tobacco-related mortality rates in 20–30 years. Eff ective coverage is a useful measure that can tell us how well public-health and medical-care investments are contributing to individual and population health.
In policy debates, the issue of access to the health system often emerges as a central topic. Although a rough intuitive notion about the meaning of access exists, it has not been defi ned or measured in a consistent manner.29–31 To some, access simply means the presence of health services within a certain physical distance. To others, it means health services that are aff ordable for all, including poor people. Eff ective coverage as a
Series
1740 www.thelancet.com Vol 368 November 11, 2006
construct and a measurement device can provide a practical way to measure access to health systems. With appropriate data, exploration of the contribution of diff erent factors, such as physical distance, fi nancial barriers, provider quality, and household perceived need to overall eff ective coverage is also possible.11
As an analytical or monitoring device, eff ective coverage focuses on achievement. Many discussions of health policy are often explicitly or implicitly based on the notion of availability. The role of the government is seen as making services physically and fi nancially available. Whether households use those services is seen in this view as less important than the fact that they are legally and physically available. According to this view of health services, individuals or households that do not use available services choose not to, and therefore this is not an issue of interest to governments. We believe that when individuals who need a health intervention do not get that intervention, part of the stewardship role of government is to understand the causes, and intervene. Thus, what matters is delivery of health gain to individuals who need it.
How should other countries defi ne their set of interventions to monitor eff ective coverage? The formal defi nition of eff ective coverage for a health system would need information for all health interventions that are delivered by the system. In practice, in even the most sophisticated health system, to measure all interventions is not feasible; a limited subset of interventions must be used to monitor eff ective coverage of a health system. This set of interventions should ideally be selected to capture the set of aff ordable interventions that, if implemented, would make the biggest improvement in population health in a given country or make the biggest contribution to reducing health inequalities. Three criteria have been invoked: aff ordability, total population health gain, and eff ect on health inequalities. A fourth criterion is whether a measurement strategy for the intervention can be developed.
Aff ordability means that the yearly cost of healthy life gained through an intervention falls below the maximum price that a given society is willing to pay for that benefi t. The second criterion is the size of population health gain if an intervention is fully implemented. If only a few interventions can be monitored, those selected should, if implemented, have a large eff ect on population health. Formulation of this list of interventions for a country needs considerable analytical work, but is in principle made more feasible by the availability of the WHO-CHOICE database for cost-eff ectiveness of interventions.32 The third criterion, eff ect on health inequalities, needs detailed national information for the actual patterns of inequalities and what the eff ect of available intervention strategies on these inequalities would be.
Measurement of eff ective coverage between states or provinces in a country or between countries will strengthen the economic analysis of use of health-system
resources. For example, we have used eff ective coverage measures between states to estimate the effi ciency of resource use by State Ministries of Health.12 Eff ective coverage is a direct measure of what the health system for a geographic unit is delivering; it avoids two major analytical problems that have plagued the analysis of health service inputs and health outcomes: time lags across action and health outcomes and the challenge of separating out the eff ects of other factors from health system actions on health outcomes. The strong relation across states in Mexico between eff ective coverage and public-health spending per head is an indication of the ability to quantify the output of the system with this approach. Variation in eff ective coverage at the same extent of spending per head implies that some states are using resources more effi ciently than others. Benchmarking of eff ective coverage might provide evidence for what can be achieved with increased money as well as for and potential opportunities to improve how well the money is spent.
Eff ective coverage compares how much health gain the health system is delivering to the population compared with how much it could deliver; it is fundamentally an accountability measure. In a country, what institution has the independence, credibility, resources, and technical competence to undertake this work? The answer will depend on national context, but institutional architecture needs to be designed with certain safeguards. Some decision-makers might not like the accountability that will come with good measurement of diff erences in local or national public-health and medical care. Whatever entity undertakes this monitoring function, the staff must have the mandate, equipment, and job security to deliver to the public sound performance benchmarking.
As with Mexico, many middle-income and some low-income countries are well advanced in the epidemi-ological transition. Communicable, maternal, and perinatal disorders account for most of the burden of disease in only three of 14 epidemiological subregions, namely, two regions of sub-Saharan Africa and the poorest countries of the Eastern Mediterranean region.33 Yet, monitoring frameworks like the Millennium Development Goals (MDGs) are exclusively focused on communicable, maternal and perinatal causes. This narrow focus needs to be expanded to capture the main interventions that address non-communicable diseases and injuries that are cost-eff ective and will have a big eff ect on population health. Although the set of inter-ventions that should be used for performance benchmarking will vary across countries according to epidemiological circumstances, with experience, a core set of interventions that are common to all or most countries is likely to emerge. These interventions could be combined with the MDG indicators to create an MDG-plus monitoring framework that is focused on eff ective coverage of these interventions.
Series
www.thelancet.com Vol 368 November 11, 2006 1741
Lancet Health System Reform in Mexico Series steering committee
Felicia Marie Knaul (Chair), Emmanuela Gakidou,
Eduardo González-Pier, Rafael Lozano, Jaime Sepúlveda.
Confl ict of interest statement
We declare that we have no confl ict of interest.
Acknowledgments
We thank the team that did the National Health and Nutrition Survey
study, including Juan Rivera, Teresa Shaman, Mauricio Hernández; the
team that provided databases and parallel analysis, including
Patricia Hernández, Maria de la Cruz Muradas, Vanessa Vázquez,
Maria Victoria Castro, Alejandro Suarez, Daniel Castro,
Juan Jose González, Enrique Ruelas, Roberto Tapia;
Maria Fernanda Merino Juarez for helpful comments; and Ari Friedman
and Michael Lisman for research assistance.
References1 WHO. World Health Report 2000. Geneva: World Health
Organization, 2000.
2 Kelley E, Hurst J. Health care quality indicators project: conceptual framework paper. Paris: OECD Publishing; Sept 9, 2006.
3 Smith PC. Measuring health system performance. Eur J Health Econ 2002; 3: 145–58.
4 National Health Performance Committee. Fourth national report on health sector performance indicators. Sydney: NSW Health, 2000.
5 Wolfson M, Alvarez R. Towards integrated and coherent health information systems for performance monitoring: the Canadian experience. Measuring up—improving health system performance in OECD countries. Paris: OECD Publishing, 2002: 133–55.
6 Secretaría de Salud de México. Salud México 2002: Información para la rendición de cuentas. Federal District, México: Secretaría de Salud de México, 2002.
7 Secretaría de Salud de México. Salud México 2003: información para la rendición de cuentas. Federal District, México: Secretaría de Salud de México, 2003.
8 Secretaría de Salud de México. Salud México 2004: información para la rendición de cuentas. Federal District, México: Secretaría de Salud de México, 2004.
9 Secretaría de Salud de México. Salud México 2005: información para la rendición de cuentas. Federal District, México: Secretaría de Salud de México, 2005.
10 Mexican Ministry of Health. Eff ective coverage of the health system in Mexico 2000–2003. Federal District, Mexico: Mexican Ministry of Health, 2006.
11 Shengelia B, Murray CJL, Adams OB. Beyond access and utilization: defi ning and measuring health system coverage. In: Murray CJL, Evans DB, eds. Health Systems Performance Assessment. Geneva: World Health Organization, 2003: 221–34.
12 Shengelia B, Tandon A, Adams OB, Murray CJL. Access, utilization, quality, and eff ective coverage: an integrated conceptual framework and measurement strategy. Soc Sci Med 2005; 61: 97–109.
13 Ustun TB, Chatterji S, Mechbal A, Murray CJL, World Health Surveys Collaborating Groups. The World Health Surveys. In: Murray CJL, Evans DB, eds. Health systems performance assessment. Geneva: World Health Organization, 2003: 797–808.
14 WHO. Health systems performance assessment. Geneva: World Health Organization, 2003.
15 Tandon A, Murray CJL, Shengeila B. Measuring health care need and coverage on a probabilistic scale in population surveys. Symposium at Population Association of America 2004 Annual Meeting, Boston, MA, USA April 2004.
16 Murray CJ, Shengelia B, Gupta N, Moussavi S, Tandon A, Thieren M. Validity of reported vaccination coverage in 45 countries. Lancet 2003; 362: 1022–27.
17 Tandon A, Murray CJL, Salomon JA, King G. Statistical models for enhancing cross-population comparability. In: Murray CJL, Evans DB, eds. Health Systems Performance Assessment.Geneva: World Health Organization; 2003: 727–46.
18 King G, Murray CJL, Tandon A, Salomon JA. Enhancing the validity and cross cultural comparability of measurement in survey research. Am Polit Sci Rev 2004 ; 98: 191–207.
19 Salomon JA, Tandon A, Murray CJL. Comparability of self rated health: cross sectional multi-country survey using anchoring vignettes. BMJ 2004; 328: 258.
20 Blood Pressure Lowering Treatment Trialists’ Collaboration. Eff ects of diff erent blood-pressure-lowering regimens on major cardiovascular events: results of prospectively-designed overviews of randomised trials. Lancet 2003; 362: 1527–35.
21 Gakidou E, Lozano R, González-Pier E, et al. Assessing the eff ect of the 2001–06 Mexican health reform: an interim report card. Lancet 2006; published online Oct 25. DOI:10.1016/S0140-6736(06)69568-8.
22 Ferguson B, Tandon A, Gakidou E, Murray CJL. Estimating permanent income using indicator variables. In: Murray CJL, Evans DB, eds. Health systems performance assessment. Geneva: World Health Organization, 2003: 747–60.
23 Filmer D, Pritchett L. The impact of public spending on health: does money matter? Soc Sci Med 1999; 49: 1309–23.
24 Castro-Leal F, Dayton J, Demery L, Mehra K. Public spending on health care in Africa: do the poor benefi t? Bull World Health Organ 2000; 78: 66–74.
25 Baldacci E, Guin-Siu MT, De Mello L. More on the eff ectiveness of public spending on health care and education: a covariance structure model. J Int Dev 2003; 15: 709–25.
26 Gupta S, Verhoeven M, Tiongson ER. Public spending on health care and the poor. Health Econ 2003; 12: 685–96.
27 Self S, Grabowski R. How eff ective is public health expenditure in improving overall health? A cross-country analysis. Appl Econ 2003; 35: 835–45.
28 WHO. Global tuberculosis control: surveillance, planning, fi nancing. Geneva: World Health Organization, 2006: 242.
29 Culyer AJ, Wagstaff A. Equity and equality in health and health care. J Health Econ 1993; 12: 431–57.
30 Waters HR. Measuring equity in access to health care. Soc Sci Med 2000; 51: 599–612.
31 Goddard M, Smith P. Equity of access to health care services: theory and evidence from the UK. Soc Sci Med 2001; 53: 1149–62.
32 Edejer TT, Aikins M, Black R, Wolfson L, Hutubessy R, Evans DB. Cost eff ectiveness analysis of strategies for child health in developing countries. BMJ 2005; 331: 1177.
33 WHO. World Health Report 2003. Geneva: World Health Organization, 2003.