Bala 2021 Annual Wastwater Report - District of Muskoka
22
2021 Year End Report: Bala Wastewater Treatment Plant (WWTP) Environmental Compliance Approval: # 5049-B55KXT Engineering and Public Works Department 70 Pine Street, Bracebridge, Ontario P1L 1N3 Phone: 705-645-6764 Toll-Free: 1-800-281-3483 Fax: 705-645-7599 Email: [email protected] Website: www.muskoka.on.ca
-
Upload
khangminh22 -
Category
Documents
-
view
6 -
download
0
Transcript of Bala 2021 Annual Wastwater Report - District of Muskoka

2021 Year End Report: Bala Wastewater Treatment Plant (WWTP)
Environmental Compliance Approval: # 5049-B55KXT
Engineering and Public Works Department
70 Pine Street, Bracebridge, Ontario P1L 1N3
Phone: 705-645-6764
Toll-Free: 1-800-281-3483
Fax: 705-645-7599
Email: [email protected]
Website: www.muskoka.on.ca
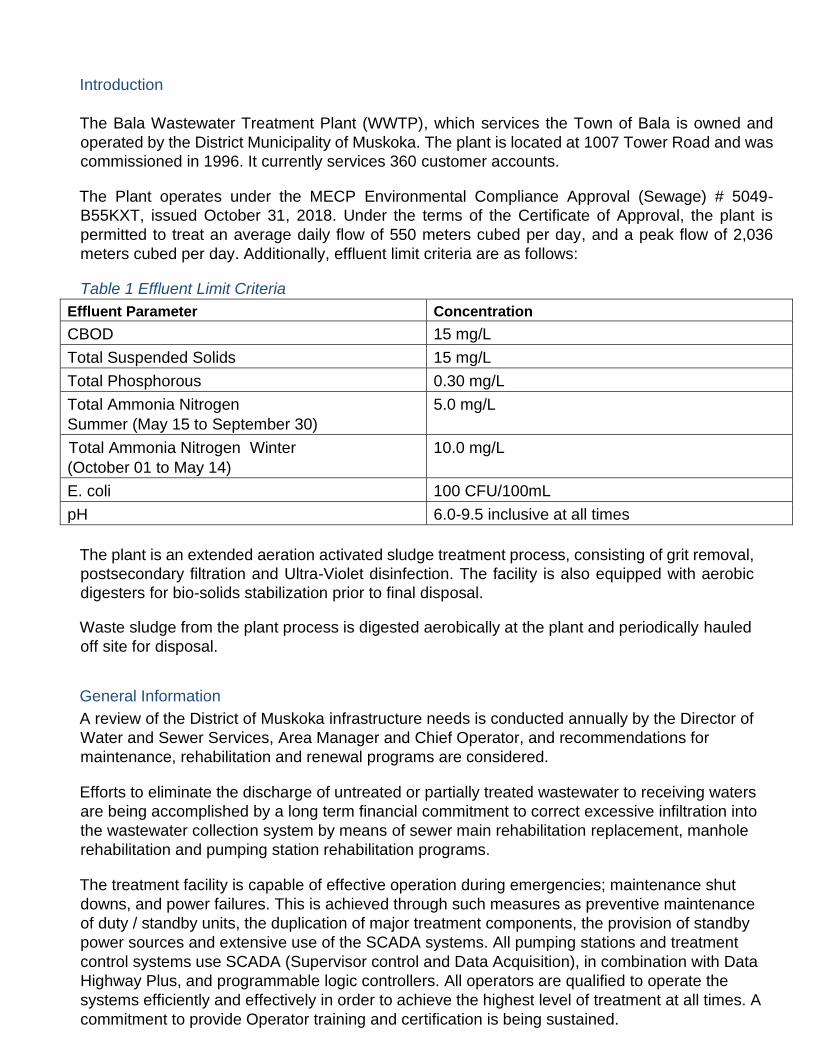
Introduction
The Bala Wastewater Treatment Plant (WWTP), which services the Town of Bala is owned and
operated by the District Municipality of Muskoka. The plant is located at 1007 Tower Road and was
commissioned in 1996. It currently services 360 customer accounts.
The Plant operates under the MECP Environmental Compliance Approval (Sewage) # 5049-
B55KXT, issued October 31, 2018. Under the terms of the Certificate of Approval, the plant is
permitted to treat an average daily flow of 550 meters cubed per day, and a peak flow of 2,036
meters cubed per day. Additionally, effluent limit criteria are as follows:
Table 1 Effluent Limit Criteria
Effluent Parameter Concentration
CBOD 15 mg/L
Total Suspended Solids 15 mg/L
Total Phosphorous 0.30 mg/L
Total Ammonia Nitrogen
Summer (May 15 to September 30)
5.0 mg/L
Total Ammonia Nitrogen Winter
(October 01 to May 14)
10.0 mg/L
E. coli 100 CFU/100mL
pH 6.0-9.5 inclusive at all times
The plant is an extended aeration activated sludge treatment process, consisting of grit removal,
postsecondary filtration and Ultra-Violet disinfection. The facility is also equipped with aerobic
digesters for bio-solids stabilization prior to final disposal.
Waste sludge from the plant process is digested aerobically at the plant and periodically hauled
off site for disposal.
General Information
A review of the District of Muskoka infrastructure needs is conducted annually by the Director of
Water and Sewer Services, Area Manager and Chief Operator, and recommendations for
maintenance, rehabilitation and renewal programs are considered.
Efforts to eliminate the discharge of untreated or partially treated wastewater to receiving waters
are being accomplished by a long term financial commitment to correct excessive infiltration into
the wastewater collection system by means of sewer main rehabilitation replacement, manhole
rehabilitation and pumping station rehabilitation programs.
The treatment facility is capable of effective operation during emergencies; maintenance shut
downs, and power failures. This is achieved through such measures as preventive maintenance
of duty / standby units, the duplication of major treatment components, the provision of standby
power sources and extensive use of the SCADA systems. All pumping stations and treatment
control systems use SCADA (Supervisor control and Data Acquisition), in combination with Data
Highway Plus, and programmable logic controllers. All operators are qualified to operate the
systems efficiently and effectively in order to achieve the highest level of treatment at all times. A
commitment to provide Operator training and certification is being sustained.

Regulatory sampling is carried out to meet the requirements outlined in the ECA, and additional
in house operational sampling beyond these regulatory requirements is being performed on a
routine basis. These efforts have resulted in an effective treatment process which ensures that
effluent discharges consistently meet effluent objectives and are environmentally safe. All final
effluent sample results for the MBR facilities met their effluent limits.
All data in this report is a compilation of test results received from SGS Canada and their
accredited laboratory, Lakefield Research. All in-plant sampling, analysis and recording of
results conforms, in order of precedence, to the following 3 standards: Ministry’s Procedure F-
10-1, “Procedures for Sampling and Analysis Requirements for Municipal and Private Sewage
Treatment Works”, Ministry’s publication “Protocol for the Sampling and Analysis of
Industrial/Municipal Wastewater” and the American Water Works Association/Water
Environment Federation (AWWA/WEF) publication “Standard Methods for the Examination of
Water and Wastewater”
Executive Summary
In all respects, test results of the treated effluent for the parameters of CBOD5, suspended
solids, ammonia, total phosphorous, and E. Coli are in compliance with the limits outlined in the
ECA regarding monthly allowable concentrations and total effluent loading throughout the entire
year.
Overall, the plant treatment processes performed satisfactorily and are deemed to be adequate.
All sample test results of the final effluent were within levels outlined in the plant ECA (#5049-
B55KXT).
Quantity of Flow Summary
The plant has a daily average flow design capacity of 550 meters cubed per day. The actual
average daily flow for 2021 was 325 meters cubed per day, however, the 3 year average is 330
meters cubed per day, which represents 60% of the plant capacity. None of the individual system
components exceeded the design flow rating.
Plant Operational Upsets or Process Failures
On June 11th approx. 30 Liters of effluent was not disinfected due to a short-lived UV equipment
failure.
On September 23rd approx. 62 meters cubed of mixed liquor bypassed the post-secondary filter due
to heavy precipitation.
Summary of Maintenance
Deficiencies identified following 2021 Capital upgrades including clarifier modifications were
rectified.
All equipment information at this plant is entered into a computer database. From this
information, a scheduled preventive maintenance program has been established. The
maintenance program includes (and not limited to):
• Monthly testing of emergency testing (under load) of the standby generators.
• Monthly calibration verification of analytical equipment
• Annual servicing of emergency standby generators.

• Annual replacement of U.V. bulbs
• Annual calibration of flow metering devices
• Annual calibration verification of analytical equipment by third party
• Annual cleaning of sewage pumping stations.
• Marine inspection of effluent outfall and diffuser completed in 2017. (5-year cycle)
All flow meter and analytical calibration verifications indicated all equipment was within
calibration tolerances as required in the ECA.
Evaluation of the Need for Improvement Works
The treatment facility is operating at a plant capacity of 60% and is in compliance with specified
effluent parameter criteria. In addition, there has been no significant treatment process upsets
and plant bypasses.
Evaluation Summary of Proposed Work Requiring Approval under OWRA
ECA 5049-B55KXT was amended October 31, 2018 and allowed for Proposed Works including
the following: Fine bubble aeration system, new blowers for aeration and sludge holding tanks,
post- secondary filtration system(s) and UV disinfection system. These upgrades were carried
out in 2021 and done to existing equipment as part of scheduled lifecycle replacement.
Interpretation of Analytical Results
All sample results for Raw Sewage and Final Effluent are reported in this section. Other tables in
this report include Chemical Usage, Biosolids Quality, and Biosolids Quantity.
Raw Sewage
The information reported in the Raw Sewage sample results summary table consists of test
results of analysis conducted on composite samples of the plant influent flow as required by the
plant ECA. Samples are sent for analysis to Lakefield Research, as well as analysis conducted on
site using Standard Methods or equivalent. Weekly analysis has been performed and reported as
specified under the terms outline in the ECA.
Influent Analysis
Table 2 Influent Analysis
Influent
Parameter Minimum
4 Week Average
Maximum Annual Average
Average loading
kg/day
BOD5 (mg/L) 37 199 118.12 35.50
Suspended Solids
(mg/L) 31 239 133.35 40.14
Total Phosphorus
(mg/L) 0.61 4.34 2.24 0.66
TKN (mg/L) 5.8 36.5 20.35 6.06

Influent
Parameter Minimum
4 Week Average
Maximum Annual Average
Average loading
kg/day
pH 7.24 8.92 max 7.85 N/A
Effluent Analysis
The information reported in the Final Effluent sample results summary table 3 consists of test
results of analysis conducted on final effluent composite samples. Bacteriological samples,
however, consisted of grab samples. Weekly analysis has been performed and reported as
specified under the terms outlined in the ECA.
Effluent Objective Analysis
The effluent objectives were met during all sample periods.
Final Effluent Analysis Summary
All final effluent samples tested for CBOD5, suspended solids, ammonia, E. Coli, and total
phosphorous were below non-compliance limits outlined in the ECA.
Table 3 Final Effluent Analysis Summary
Parameter Minimum 4 Week Average
Maximum Annual Average
Average Loading
kg/day
COBD5 (mg/L) 2 3.25 2.27 0.72
Suspended Solids
(mg/L) 2 4.50 2.90 1.31
Ammonia (mg/L) 0.10 1.0 0.22 0.12
E. Coli (#/100 mL) 0 1.25 0.17 N/A
Total Phosphorus
(mg/L) 0.03 0.08 0.05 0.014
pH 6.85 7.68 (max) 6.90 N/A
Average daily flow comparisons by day of week ensure ECA requirements for scheduled
sampling are taken at a time, and in a location characteristic of the quality and quantity of the
sewage stream over the time period being monitored. Average daily flow rates by day of the week
compare the flow to the average daily flow for the entire year. This data is used to determine if a
particular day of the week is best to ensure samples are taken to meet the requirements of
scheduled monitoring sections of the ECA’s. Sampling plans are reviewed and updated yearly
based on the previous yearly flow data.
Final Effluent Sampling Summary
All samples were collected following the frequency and methods required by the facility
approval. For the coming 2022 year, 24 hour composite samples will be collected on
Wednesday rather than Tuesday of each week.
Biosolids Generation
The quality and volume of biosolids hauled from the facility for disposal is outlined in the table
provided. Dewatered biosolids from the plant was hauled to an approved landfill site. Private
contractors were used by the District of Muskoka to transfer all material for disposal in 2021, and
will continue to do so in 2022. It is not anticipated that there will be a significant increase in the
total volume of bio solids produced in 2022.
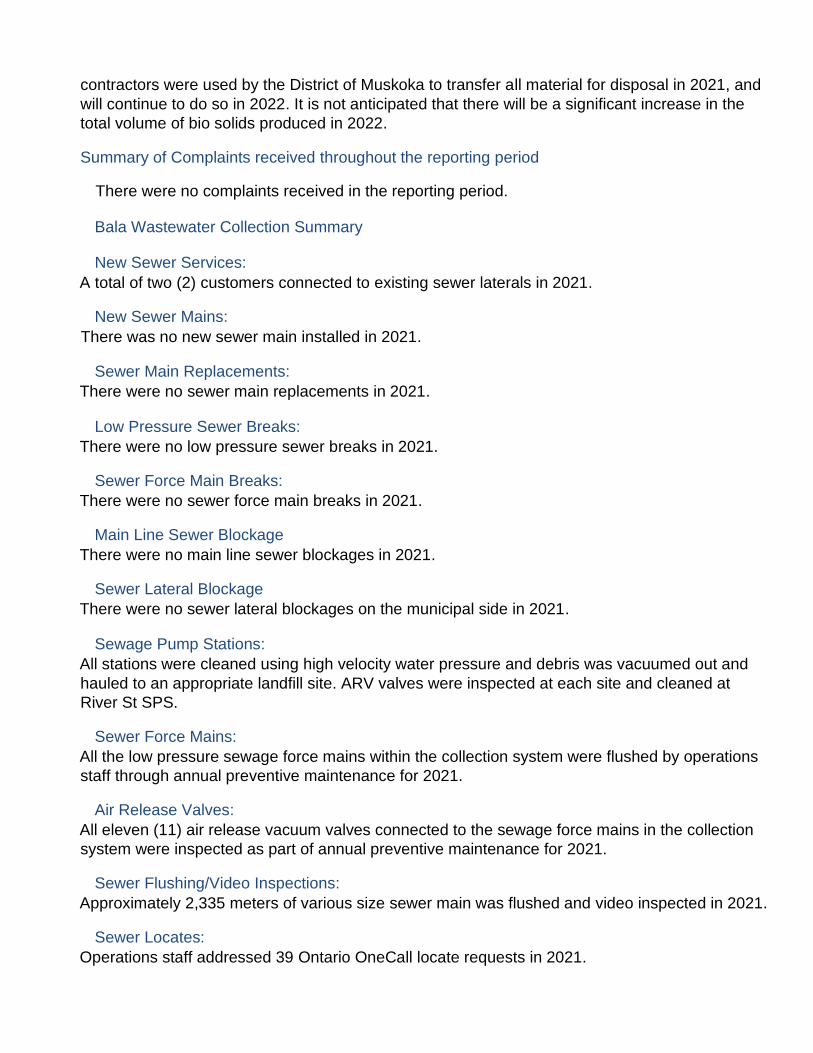
Summary of Complaints received throughout the reporting period
There were no complaints received in the reporting period.
Bala Wastewater Collection Summary
New Sewer Services:
A total of two (2) customers connected to existing sewer laterals in 2021.
New Sewer Mains:
There was no new sewer main installed in 2021.
Sewer Main Replacements:
There were no sewer main replacements in 2021.
Low Pressure Sewer Breaks:
There were no low pressure sewer breaks in 2021.
Sewer Force Main Breaks:
There were no sewer force main breaks in 2021.
Main Line Sewer Blockage
There were no main line sewer blockages in 2021.
Sewer Lateral Blockage
There were no sewer lateral blockages on the municipal side in 2021.
Sewage Pump Stations:
All stations were cleaned using high velocity water pressure and debris was vacuumed out and
hauled to an appropriate landfill site. ARV valves were inspected at each site and cleaned at
River St SPS.
Sewer Force Mains:
All the low pressure sewage force mains within the collection system were flushed by operations
staff through annual preventive maintenance for 2021.
Air Release Valves:
All eleven (11) air release vacuum valves connected to the sewage force mains in the collection
system were inspected as part of annual preventive maintenance for 2021.
Sewer Flushing/Video Inspections:
Approximately 2,335 meters of various size sewer main was flushed and video inspected in 2021.
Sewer Locates:
Operations staff addressed 39 Ontario OneCall locate requests in 2021.

Table 4 Effluent Flow Summary - 2021
Month
Plant Total
Monthly
(m3)
Average
Day Flow
(m3/d)
Maximum
Day Flow
(m3/d)
Minimum
Day Flow
(m3/d)
January
6,761 225 280 180
February 5,131 183 212 161
March 12,431 401 662 201
April 9,122 304 420 235
May 8,245 266 390 189
June 6,262 209 403 145
July 12,027 388 627 259
August 8,520 275 346 224
September 10,977 366 848 198
October 11,429 369 445 282
November 11,834 394 467 279
December 15,877 512 775 395
Total Flow: 118,617m3
Average Day: 325m3
Maximum Day: 848m3
Minimum Day:145m3

Table 5 Influent Quarterly Analysis Summary – Weekly 24 Hour Composite Sample Part 1
Sample Date Sample Identification Number
BOD5 mg/L Alkalinity (Total as CaCO3) mg/L
pH Phosphate Total Phosphorus mg/L
Suspended Solids mg/L
9-Feb-21 BIPCPRS 107 212 7.78 1.68 3.39 100
11-May-21 BIPCPRS 110 203 8.17 0.32 2.20 127
10-Aug-21 BIPCPRS 140 234 7.85 1.80 1.91 84
9-Nov-21 BIPCPRS 63 207 8.00 0.17 0.10 91
Yearly Average
105 214 7.85 1.0 1.9 101
Maximum
140 234 8.92 1.8 3.4 127
Minimum
63 203 7.24 0.2 0.1 84
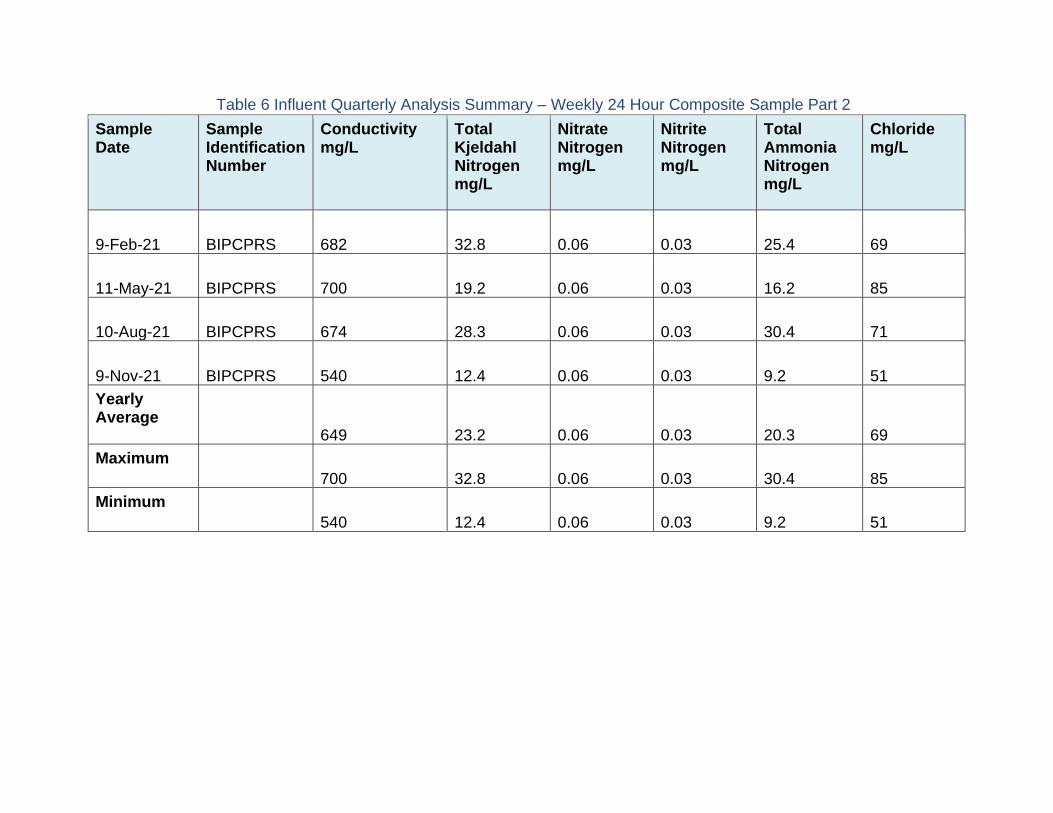
Table 6 Influent Quarterly Analysis Summary – Weekly 24 Hour Composite Sample Part 2
Sample Date
Sample Identification Number
Conductivity mg/L
Total Kjeldahl Nitrogen mg/L
Nitrate Nitrogen mg/L
Nitrite Nitrogen mg/L
Total Ammonia Nitrogen mg/L
Chloride mg/L
9-Feb-21 BIPCPRS 682 32.8 0.06 0.03 25.4 69
11-May-21 BIPCPRS 700 19.2 0.06 0.03 16.2 85
10-Aug-21 BIPCPRS 674 28.3 0.06 0.03 30.4 71
9-Nov-21 BIPCPRS 540 12.4 0.06 0.03 9.2 51
Yearly Average
649 23.2 0.06 0.03 20.3 69
Maximum
700 32.8 0.06 0.03 30.4 85
Minimum
540 12.4 0.06 0.03 9.2 51

Table 7 Chemical Usage Summary: Alum
Month Average Dosage mg/L
Total kg (dry)
January 35.0 1,023.0
February 78.3 761.6
March 73.9 1,834.8
April 70.9 1,355.6
May 71.1 1,195.9
June 69.9 887.0
July 72.1 1,663.2
August 63.6 1,432.2
September 83.5 1,821.6
October 78.6 1,801.8
November 76.9 2,006.4
December 84.4 2,727.1
Average 71.3 1542.5
Total Yearly Kilograms: 18,510kg

Table 8 Chemical Usage Summary: Soda Ash
Month Average Dosage mg/L Total kg (dry)
January 7.3 153.0
February 16.9 129.0
March 31.2 238.0
April 30.2 213.0
May 31.4 200.0
June 40.7 185.0
July 27.8 242.0
August 26.0 398.0
September 28.9 216.0
October 18.4 162.0
November 14.5 166.0
December 15.0 230.0
Average 24 211.0
Total Yearly Kilograms: 2,532kg

Table 9 Effluent Quarterly Analysis Summary – Weekly 24 Hour Composite Sample Part 1
Sample Date Sample Identification Number
CBOD5 mg/L Alkalinity (Total as CaCO3) mg/L
pH Phosphate Total Phosphorus mg/L
Suspended Solids mg/L
9-Feb-21 BIPCPFE 5 56 7.34 0.03 0.08 <2
11-May-21 BIPCPFE 3 74 7.30 <0.03 0.05 <2
10-Aug-21 BIPCPFE 2 32 7.12 < 0.03 0.03 3
9-Nov-21 BIPCPFE 2 77 7.54 < 0.03 0.03 2
Yearly Average
3.0 59.8 7.3 0.0 0.0 2.5
Maximum
5.0 77.0 7.5 0.0 0.1 3.0
Minimum
2.0 32.0 7.1 0.0 0.0 2.0

Table 10 Effluent Quarterly Analysis Summary – Weekly 24 Hour Composite Sample Part 2
Sample
Date
Sample
Identification
Number
Conductivity
mg/L
Total
Kjeldahl
Nitrogen
mg/L
Nitrate
Nitrogen
mg/L
Nitrite
Nitrogen
mg/L
Total
Ammonia
Nitrogen
mg/L
Chloride
mg/L
9-Feb-21 BIPCPFE 583 1.4 20.2 0.22 0.3 68
11-May-21 BIPCPFE 688 <0.5 15.6 <0.03 <0.1 99
10-Aug-21 BIPCPFE 592 1 27.7 0.18 0.1 62
9-Nov-21 BIPCPFE 390 1.2 7 0.03 0.1 43
Yearly
Average
563 1.2 17.5 0.14 0.17 68
Maximum 688 1.4 27.7 0.22 0.3 99
Minimum 390 1 6.6 0.03 0.1 43

Table 11 Effluent Loading and Concentration Summary 2021: COBD5
Month Average mg/L Average kg/day Maximum Daily kg/day
January 2.00 0.45 0.56
February 3.25 0.60 0.69
March 2.60 1.04 1.72
April 2.25 0.68 0.94
May 2.50 0.66 0.97
June 2.20 0.46 0.89
July 2.00 0.78 1.25
August 2.00 0.55 0.69
September 2.50 0.91 2.12
October 2.00 0.74 0.89
November 2.00 0.79 0.93
December 2.00 1.02 1.55
Average Monthly 2.28 0.72 N/A
Effluent Objective 10 N/A N/A
Non-Compliance 15 8.25 N/A

Table 12 Effluent Loading and Concentration Summary 2021: Suspended Solids
Month Average mg/L Average kg/day Maximum Daily kg/day
January 2.00 0.45 0.56
February 4.75 0.87 1.01
March 2.20 0.88 1.46
April 2.25 0.68 0.94
May 3.50 0.93 1.36
June 2.80 0.58 1.13
July 2.25 0.87 1.41
August 4.60 1.26 1.59
September 2.25 0.82 1.91
October 2.75 1.01 1.22
November 3.00 1.18 1.40
December 2.25 1.15 1.74
Average Monthly 2.88 0.89 N/A
Effluent Objective 10.00 N/A N/A
Non-Compliance 15.00 8.25 N/A
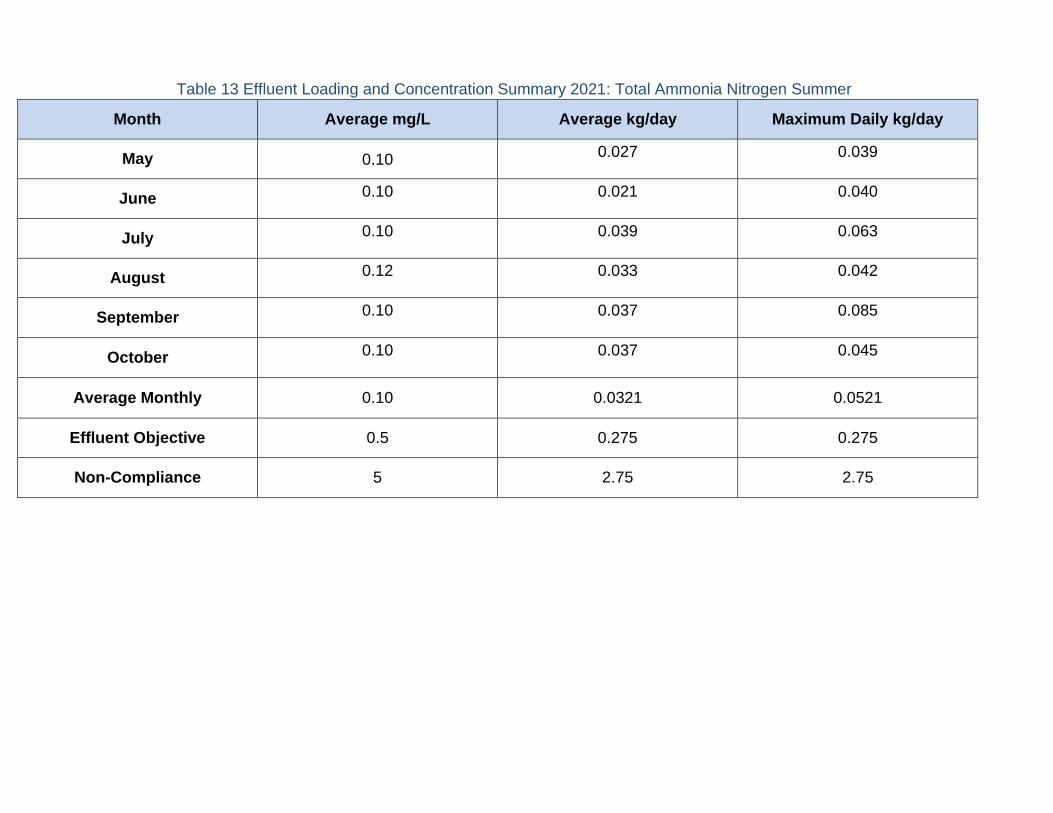
Table 13 Effluent Loading and Concentration Summary 2021: Total Ammonia Nitrogen Summer
Month Average mg/L Average kg/day Maximum Daily kg/day
May 0.10 0.027 0.039
June 0.10 0.021 0.040
July 0.10 0.039 0.063
August 0.12 0.033 0.042
September 0.10 0.037 0.085
October 0.10 0.037 0.045
Average Monthly 0.10 0.0321 0.0521
Effluent Objective 0.5 0.275 0.275
Non-Compliance 5 2.75 2.75
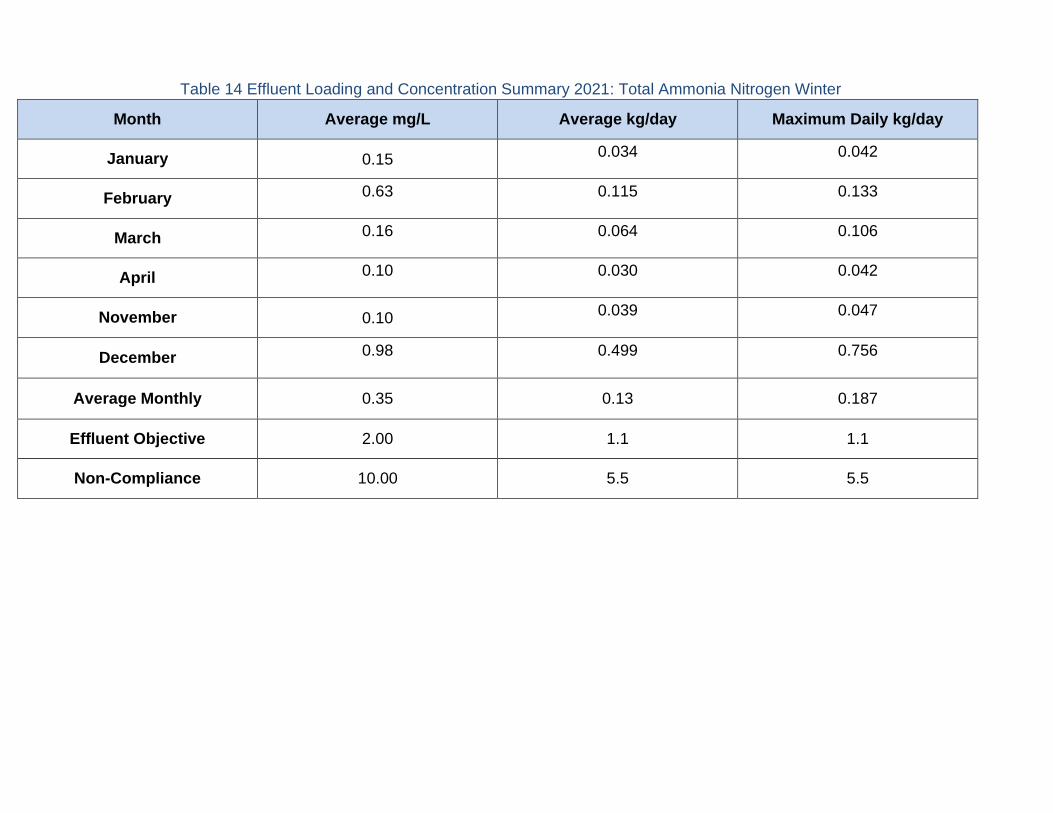
Table 14 Effluent Loading and Concentration Summary 2021: Total Ammonia Nitrogen Winter
Month Average mg/L Average kg/day Maximum Daily kg/day
January 0.15 0.034 0.042
February 0.63 0.115 0.133
March 0.16 0.064 0.106
April 0.10 0.030 0.042
November 0.10 0.039 0.047
December 0.98 0.499 0.756
Average Monthly 0.35 0.13 0.187
Effluent Objective 2.00 1.1 1.1
Non-Compliance 10.00 5.5 5.5
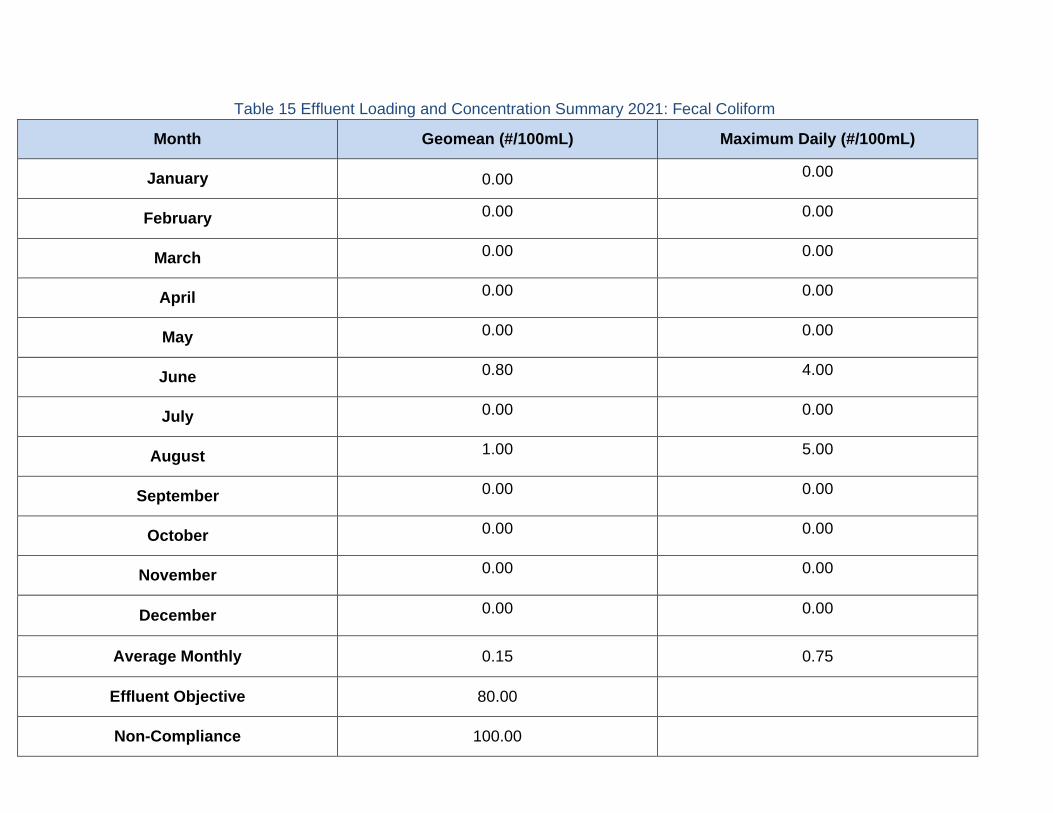
Table 15 Effluent Loading and Concentration Summary 2021: Fecal Coliform
Month Geomean (#/100mL) Maximum Daily (#/100mL)
January 0.00 0.00
February 0.00 0.00
March 0.00 0.00
April 0.00 0.00
May 0.00 0.00
June 0.80 4.00
July 0.00 0.00
August 1.00 5.00
September 0.00 0.00
October 0.00 0.00
November 0.00 0.00
December 0.00 0.00
Average Monthly 0.15 0.75
Effluent Objective 80.00
Non-Compliance 100.00
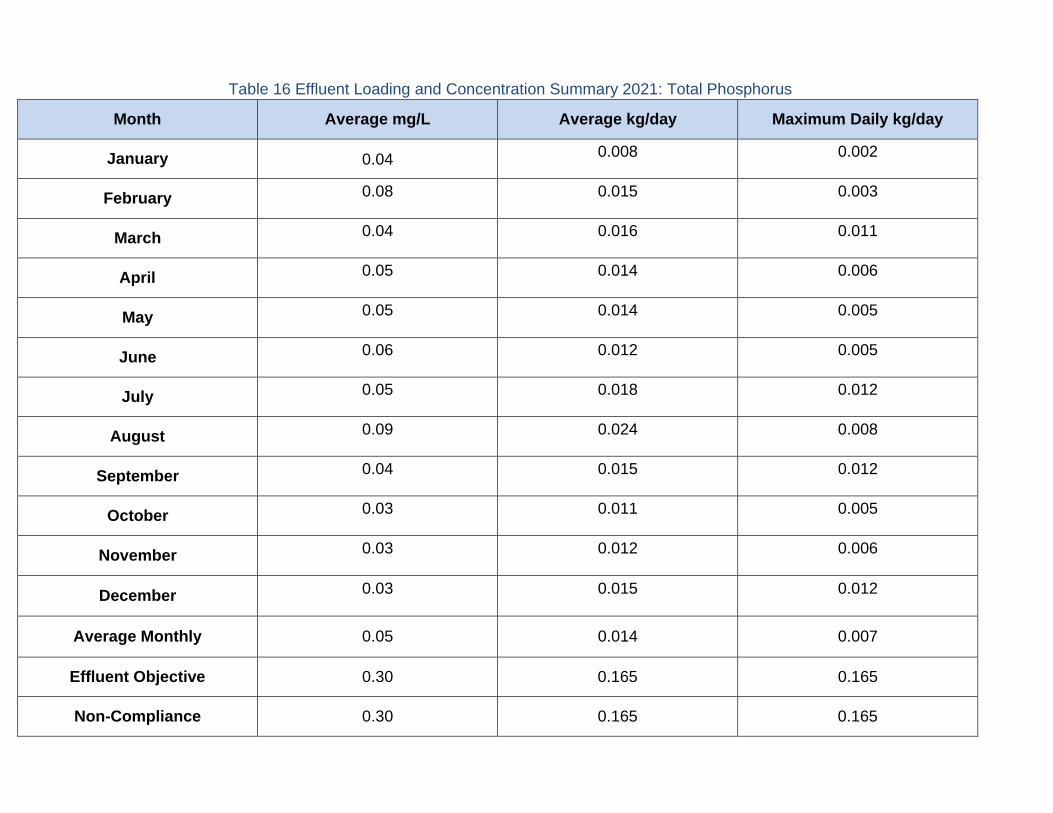
Table 16 Effluent Loading and Concentration Summary 2021: Total Phosphorus
Month Average mg/L Average kg/day Maximum Daily kg/day
January 0.04 0.008 0.002
February 0.08 0.015 0.003
March 0.04 0.016 0.011
April 0.05 0.014 0.006
May 0.05 0.014 0.005
June 0.06 0.012 0.005
July 0.05 0.018 0.012
August 0.09 0.024 0.008
September 0.04 0.015 0.012
October 0.03 0.011 0.005
November 0.03 0.012 0.006
December 0.03 0.015 0.012
Average Monthly 0.05 0.014 0.007
Effluent Objective 0.30 0.165 0.165
Non-Compliance 0.30 0.165 0.165

Table 17 Liquid Sludge Production Summary 2021
Month Hauler Liquid Volume m3
Destination
January
February ROHES 36.4 ROHES - Lagoon
March
April ROHES 145.6 ROHES - Lagoon
May ROHES 109.2 ROHES - Lagoon
June ROHES 109.2 ROHES - Lagoon
July ROHES 72.8 ROHES - Lagoon
August ROHES 145.6 ROHES - Lagoon
September ROHES 72.8 ROHES - Lagoon
October ROHES 109.2 ROHES - Lagoon
November ROHES 72.8 ROHES - Lagoon
December
Yearly Total Volume: 874m3
Yearly Average Volume: 97m3
Maximum Volume: 146m3

Table 18 Sludge Quality Analysis 2021
Parameter Sampled (mg/L) First Quarter Second Quarter Third Quarter Fourth Quarter
Date February 10 May 11 August 10 November 9
Sample ID CA13208 CA12247 CA12229 CA13329
Nitrate 6.0 72 35 36
Mercury 0.045 0.051 0.011 0.059
Chromium 0.19 0.23 0.06 0.26
Cobalt 0.02 0.03 0.01 0.04
Copper 5.2 6.6 1.6 9.2
Lead 0.2 0.2 0.1 0.4
Molybdenum 0.05 0.07 0.05 0.11
Nickel 0.20 0.24 0.04 0.19
Selenium <0.1 <0.1 0.1 <0.1
Arsenic <0.1 <0.1 0.1 0.1
Zinc 4.0 5.0 1.0 8.0
Cadmium 0.006 0.008 0.005 0.016
Ammonia+ Ammonium 3.2 2.4 6.7 13.6
Total Kjeldahl Nitrogen 615 1000 222 1090
Total Phosphorus 330 390 87 640
Total Solids 10600 17000 5070 21700
NO2 13
20 0.9 2
PO4(sol)(Dissolved Reactive
Phosphorous)
<0.75 <0.75 <0.75 <0.75
TSS 17100
16800 15600 20200

Certification of Reports
I certify that the information in this document and all attachments are correct, accurate, and complete
to the best of my knowledge
Michael Spicer Director, Water and Wastewater Services
Stewart Hurd Manager of Water and Wastewater Operations