tiruvallur tiruvallur district district tamilnadu
39
DISTRICT SURVEY REPORT DISTRICT SURVEY REPORT DISTRICT SURVEY REPORT DISTRICT SURVEY REPORT TIRUVALLUR TIRUVALLUR TIRUVALLUR TIRUVALLUR DISTRICT DISTRICT DISTRICT DISTRICT TAMILNADU TAMILNADU TAMILNADU TAMILNADU As per notification No. S.O. As per notification No. S.O. As per notification No. S.O. As per notification No. S.O. 3611 (E) New Delhi, The 3611 (E) New Delhi, The 3611 (E) New Delhi, The 3611 (E) New Delhi, The 25 25 25 25 th th th th July 2018 of Ministry July 2018 of Ministry July 2018 of Ministry July 2018 of Ministry of Environment, Forest and of Environment, Forest and of Environment, Forest and of Environment, Forest and Climate Change, Govt. of Climate Change, Govt. of Climate Change, Govt. of Climate Change, Govt. of India India India India
-
Upload
khangminh22 -
Category
Documents
-
view
2 -
download
0
Transcript of tiruvallur tiruvallur district district tamilnadu

DISTRICT SURVEY REPORTDISTRICT SURVEY REPORTDISTRICT SURVEY REPORTDISTRICT SURVEY REPORT
TIRUVALLURTIRUVALLURTIRUVALLURTIRUVALLUR
DISTRICT DISTRICT DISTRICT DISTRICT
TAMILNADUTAMILNADUTAMILNADUTAMILNADU
As per notification No. S.O. As per notification No. S.O. As per notification No. S.O. As per notification No. S.O.
3611 (E) New Delhi, The 3611 (E) New Delhi, The 3611 (E) New Delhi, The 3611 (E) New Delhi, The
25252525thththth July 2018 of Ministry July 2018 of Ministry July 2018 of Ministry July 2018 of Ministry
of Environment, Forest and of Environment, Forest and of Environment, Forest and of Environment, Forest and
Climate Change, Govt. of Climate Change, Govt. of Climate Change, Govt. of Climate Change, Govt. of
IndiaIndiaIndiaIndia

DISTRICT SURVEY REPORT Tiruvallur District
Page | 1
INDEXINDEXINDEXINDEX
DISTRICT SURVEY REPORTDISTRICT SURVEY REPORTDISTRICT SURVEY REPORTDISTRICT SURVEY REPORT----TIRUVALLURTIRUVALLURTIRUVALLURTIRUVALLUR
Sl.NoSl.NoSl.NoSl.No.... ContentsContentsContentsContents Page noPage noPage noPage no
1. Preface 3
2. Introduction 4
3. Overview of mining activities in the district 4
4. List of mining leases in the district 5
5. Details of royalty or revenue received in Tiruvallur district
Quarry wise sand revenue details of Tiruvallur district for the year
2012-2013
7
Quarry wise sand revenue details of Tiruvallur district for the year
2013-2014
8
Quarry wise sand revenue details of Tiruvallur district for the year
2014-2015
9
Quarry wise sand revenue details of Tiruvallur district for the year
2015-2016
10
Quarry wise sand revenue details of Tiruvallur district for the year
2016-2017
12
6. Process of deposition of sediments in the rivers of the district
6.a. Location Map of Irrigation structures
6.b. Kosasthalaiyar river basin
6.c. Replenishment study for sand
17
17
18
21
7. General profile of the district 21
8. Land Use pattern 24
9. Physiography and regional geology 26
10. Rainfall pattern along Kosasthalaiyar river basin 27
11. Geology and mineral wealth 27
DISTRICT SURVEY REPORT Tiruvallur District
Page | 2
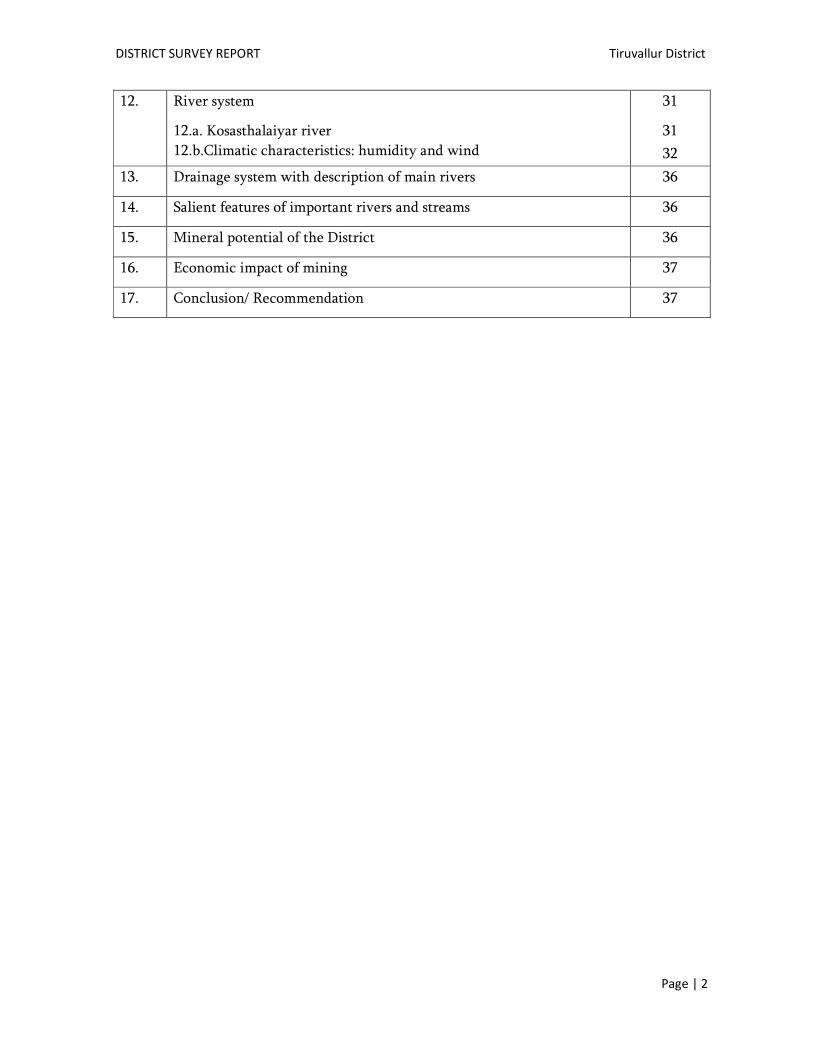
12. River system
12.a. Kosasthalaiyar river
12.b.Climatic characteristics: humidity and wind
31
31
32
13. Drainage system with description of main rivers 36
14. Salient features of important rivers and streams 36
15. Mineral potential of the District 36
16. Economic impact of mining 37
17. Conclusion/ Recommendation 37
DISTRICT SURVEY REPORT Tiruvallur District
Page | 3
DISTRICT SURVEYDISTRICT SURVEYDISTRICT SURVEYDISTRICT SURVEY REPORT FOR SAND REPORT FOR SAND REPORT FOR SAND REPORT FOR SAND MINING MINING MINING MINING TIRUVALLURTIRUVALLURTIRUVALLURTIRUVALLUR DISTRICTDISTRICTDISTRICTDISTRICT
1. PREFACE1. PREFACE1. PREFACE1. PREFACE
In compliance to the Notification issued by the Ministry of Environment and Forest
and Climate Change notification No. S.O. 3611 (E) New Delhi dated 25-07-2018, the
preparation of District Survey Report of river sand mining in accordance with Appendix X of
the Notification. Every effort have been made to cover sand mining locations, areas and
overview of mining activity in the district with all its relevant features pertaining to geology
and mineral wealth in replenishable and non-replenishable areas of rivers, stream and other
sand sources. This report will be a model and guiding document which is a compendium of
available mineral resources, geographical set up, environmental and ecological setup of the
district and is based on data of various departments, study conducted by renowned
institutions, published reports and websites.
SURVEY REPORT OF SURVEY REPORT OF SURVEY REPORT OF SURVEY REPORT OF TIRUVALLURTIRUVALLURTIRUVALLURTIRUVALLUR DISTRICT DISTRICT DISTRICT DISTRICT
As per Gazette Notification No. S.O. 3611 (E) New Delhi dated 25-07-2018 of Ministry of
Environment, Forest and Climate Change, a survey shall be carried out by the District
Environment Impact Assessment Authority (DEIAA) with assistance of Water Resources
Department, Forest Department, Geology and Mining Department and Revenue Department
in the District for preparation for District Survey Report as per sustainable sand mining
guidelines to ensure identification of areas of aggradation or deposition where mining can be
allowed and identification of areas of erosion and proximity to infrastructural structures and
installations where mining should be prohibited and calculation of annual rate of
replenishment and allowing time for replenishment after mining in that area.
The detailed study has been made to cover sand mining locations, area and overview of
mining activity in the district with all its relevant features pertaining to geology and mineral
wealth in replenishable and non-replenishable areas of rivers, stream and other sand sources.
The mineral potential is calculated based on field investigation and geology of the catchment
area of the river (or) Streams. The area for removal of the mineral in a river or stream is
decided depending on geomorphology and other factors. The District Survey Report shall

DISTRICT SURVEY REPORT Tiruvallur District
Page | 4
form on the basis for application for Environmental Clearance, preparation of reports and
appraisal of projects. The report shall be updated once in five years.
2. INTRODUCTION: 2. INTRODUCTION: 2. INTRODUCTION: 2. INTRODUCTION:
Tiruvallur dTiruvallur dTiruvallur dTiruvallur districtistrictistrictistrict is an administrative district in the Indian state of Tamil Nadu. The town
of Tiruvallur is the district headquarters. As of 2011, the district had a population of 3,728,104
with a sex-ratio of 987 females for every 1,000 males. It is located in the North eastern part of
Tamil Nadu between 12 ° 15’ and 13° 15‘ North and 79° 15‘ and 80 ° 20 ‘ East. The district is
bounded by the Bay of Bengal in the East.Vellore district of Tamil Nadu and Chitoor district
of Andhra Pradesh on the West, Nellore district of Andhra Pradesh on the North and on the
South by Kancheepuram district. The district spreads over an area of about 3422 Sq.km.The
district comprising of 9 taluks, 14 blocks, 5 Municipalities and 10 Panchayat unions.The
average normal rainfall of the District is 1104 mm. Out of which 52% has been received
during North East Monsoon period and 41% has been received during South West Monsoon
period.
3. OVERVIEW OF MINING ACTIVITIES IN THE DISTRICT. 3. OVERVIEW OF MINING ACTIVITIES IN THE DISTRICT. 3. OVERVIEW OF MINING ACTIVITIES IN THE DISTRICT. 3. OVERVIEW OF MINING ACTIVITIES IN THE DISTRICT.
The Mining activities available for sand, Gravel, Jelly, Savudu, Rough stone, Black
Granite. Mainly two types of Minor minerals constituents such as sand and jelly are required
for any type of construction. In earlier times, the houses / buildings were constructed in form
of small dwellings with walls made up of mud plaster, stone and interlocking provided with
wooden frames and there were negligible commercial as well as developmental activities
resulting in less demand of binding materials. However with the percentage of time, new
vistas of development activities were started. The quantity of minor mineral consumption in a
particular area is thermometer to assess the development of the area. Thus with the pace of
development activities, the consumption of minerals also increased. As Tamil Nadu State is
highly urbanized state of Indian sub-continent after Maharashtra, the demand of minor
minerals in the Tiruvallur District has started increasing trend, the highly industrialized
districts like Chennai, Kancheepuram, are depending its sand and rough stone need on
Tiruvallur Districts.
DISTRICT SURVEY REPORT Tiruvallur District
Page | 5
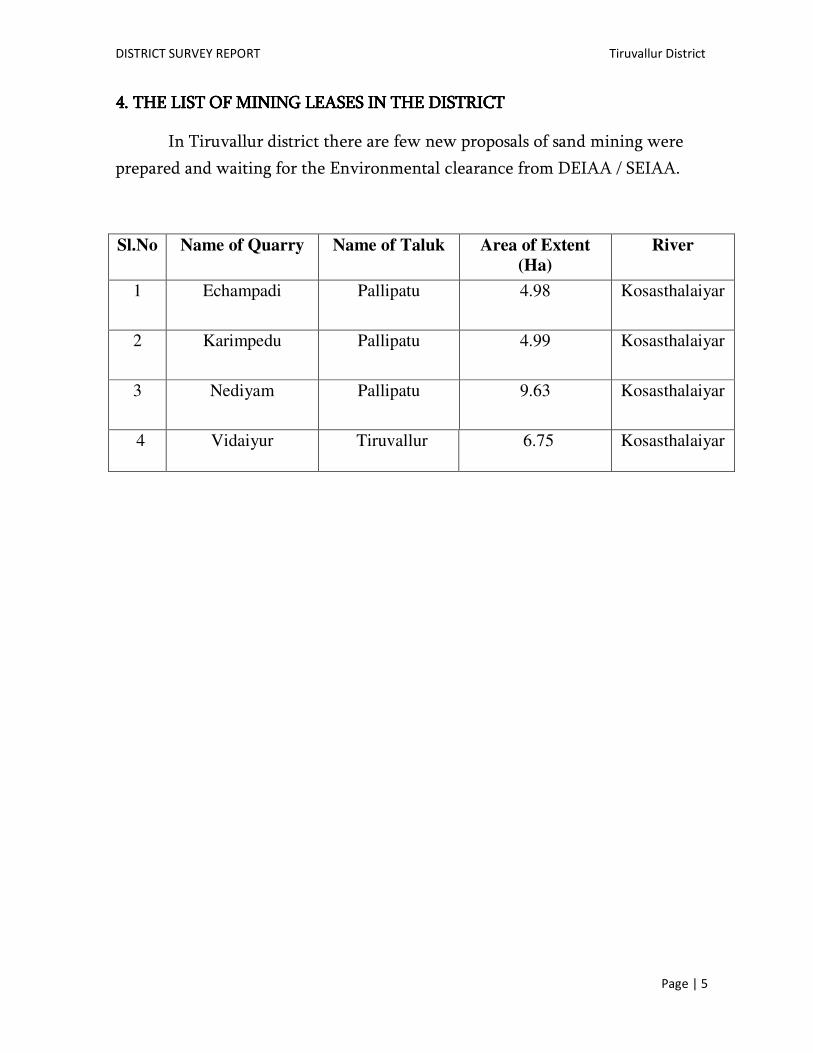
4.4.4.4. THE THE THE THE LISTLISTLISTLIST OF MINING LEASES IN THE DISTRICTOF MINING LEASES IN THE DISTRICTOF MINING LEASES IN THE DISTRICTOF MINING LEASES IN THE DISTRICT
In Tiruvallur district there are few new proposals of sand mining were
prepared and waiting for the Environmental clearance from DEIAA / SEIAA.
Sl.No Name of Quarry Name of Taluk Area of Extent
(Ha)
River
1 Echampadi Pallipatu 4.98 Kosasthalaiyar
2 Karimpedu Pallipatu 4.99 Kosasthalaiyar
3 Nediyam Pallipatu 9.63 Kosasthalaiyar
4 Vidaiyur Tiruvallur 6.75 Kosasthalaiyar

DISTRICT SURVEY REPORT
`
New Quarries in KosasthalaiyarNew Quarries in KosasthalaiyarNew Quarries in KosasthalaiyarNew Quarries in Kosasthalaiyar
DISTRICT SURVEY REPORT
New Quarries in KosasthalaiyarNew Quarries in KosasthalaiyarNew Quarries in KosasthalaiyarNew Quarries in Kosasthalaiyar RiverRiverRiverRiver
Tiruvallur District
Page | 6

DISTRICT SURVEY REPORT Tiruvallur District
Page | 7
5. 5. 5. 5. DETAILS OF ROYALTY OR REVENUE RECEIVED IN DETAILS OF ROYALTY OR REVENUE RECEIVED IN DETAILS OF ROYALTY OR REVENUE RECEIVED IN DETAILS OF ROYALTY OR REVENUE RECEIVED IN TTTTIRUVALLUR IRUVALLUR IRUVALLUR IRUVALLUR
DISTRICT.DISTRICT.DISTRICT.DISTRICT.
From January2012 to April 2012From January2012 to April 2012From January2012 to April 2012From January2012 to April 2012
From May 2012 to August 2012From May 2012 to August 2012From May 2012 to August 2012From May 2012 to August 2012
Sl.
No
Name
of Quarry /
Village
River
January
2012
February
2012
March
2012
April
2012
Amount
(Rs.in
Lakhs)
Amount
(Rs.in
Lakhs)
Amount
(Rs.in
Lakhs)
Amount
(Rs.in
Lakhs)
1. Neiveli Kosasthalaiyar 8.96 19.122 11.808 6.222
2 Vembedu Gerugam
Poondi Kosasthalaiyar 0 0 11.16
12.216
3 Oddappai Kosasthalaiyar - - - -
Sl.
No
Name
of Quarry /
Village
River
May2012
June
2012
July
2012
August
2012
Amount
(Rs.in
Lakhs)
Amount
(Rs.in
Lakhs)
Amount
(Rs.in
Lakhs)
Amount
(Rs.in
Lakhs)
1. Neiveli Kosasthalaiyar 9.87 11.95 5.74
9.94
2 Vembedu Gerugam
Poondi Kosasthalaiyar 11.86 13.84 7.61
11.034
3 Oddappai Kosasthalaiyar - - - 6.678

DISTRICT SURVEY REPORT Tiruvallur District
Page | 8
From September 2012 to December 2012From September 2012 to December 2012From September 2012 to December 2012From September 2012 to December 2012
From January 2013 to December 2013From January 2013 to December 2013From January 2013 to December 2013From January 2013 to December 2013
Sl.
No
Name
of Quarry /
Village
River
September
2012
October
2012
November
2012
December
2012
Amount
(Rs.in
Lakhs)
Amount
(Rs.in
Lakhs)
Amount
(Rs.in
Lakhs)
Amount
(Rs.in
Lakhs)
1. Neiveli Kosasthalaiyar - - -
-
2 Vembedu
Gerugam Poondi Kosasthalaiyar 3.84 - -
-
3 Oddappai Kosasthalaiyar 1.026 11.664 14.35 10.698
Sl.
No
Name
of Quarry /
Village
River
January
2013
(February 2013 To
December 2013)
Amount
(Rs.in Lakhs)
Amount
(Rs.in Lakhs)
1. Neiveli Kosasthalaiyar - -
2 Vembedu Gerugam
Poondi Kosasthalaiyar - -
3 Oddappai* Kosasthalaiyar 3.57 -

DISTRICT SURVEY REPORT Tiruvallur District
Page | 9
From January From January From January From January 2014 to April 20142014 to April 20142014 to April 20142014 to April 2014
From May 2014 to August 2014From May 2014 to August 2014From May 2014 to August 2014From May 2014 to August 2014
Sl.
No
Name
of Quarry /
Village
River
January
2014
February
2014
March
2014
April
2014
Amount
(Rs.in
Lakhs)
Amount
(Rs.in
Lakhs)
Amount
(Rs.in
Lakhs)
Amount
(Rs.in
Lakhs)
1 Kaliyanur Kosasthalaiyar - - 3.87
4.05
2 Sembedu Gerugam
Poondi Kosasthalaiyar - - 2.85
6.46
3 Rajapadmapuram Kosasthalaiyar - - - -
4 Gulur Kosasthalaiyar - - - -
Sl.
No
Name
of Quarry /
Village
River
May2014
June
2014 July 2014
August
2014
Amount
(Rs.in
Lakhs)
Amount
(Rs.in
Lakhs)
Amount
(Rs.in
Lakhs)
Amount
(Rs.in
Lakhs)
1 Kaliyanur Kosasthalaiyar 5.20 8.03 5.48
-
2 Sembedu Gerugam
Poondi Kosasthalaiyar 6.59 10.09 10.067
6.936
3 Rajapadmapuram Kosasthalaiyar - - - -
4 Gulur Kosasthalaiyar - - - -
DISTRICT SURVEY REPORT Tiruvallur District
Page | 10
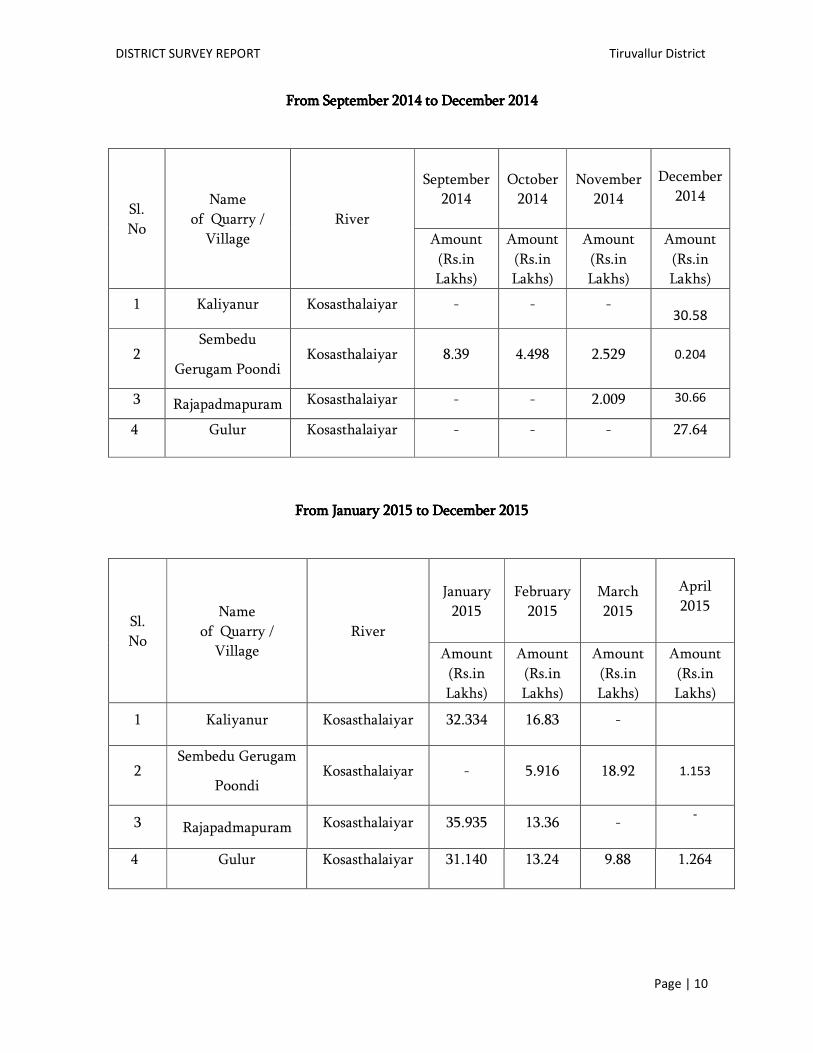
From September 2014 to December 2014From September 2014 to December 2014From September 2014 to December 2014From September 2014 to December 2014
From January 2015 to December 2015From January 2015 to December 2015From January 2015 to December 2015From January 2015 to December 2015
Sl.
No
Name
of Quarry /
Village
River
September
2014
October
2014
November
2014
December
2014
Amount
(Rs.in
Lakhs)
Amount
(Rs.in
Lakhs)
Amount
(Rs.in
Lakhs)
Amount
(Rs.in
Lakhs)
1 Kaliyanur Kosasthalaiyar - - -
30.58
2 Sembedu
Gerugam Poondi Kosasthalaiyar 8.39 4.498 2.529
0.204
3 Rajapadmapuram Kosasthalaiyar - - 2.009 30.66
4 Gulur Kosasthalaiyar - - - 27.64
Sl.
No
Name
of Quarry /
Village
River
January
2015
February
2015
March
2015
April
2015
Amount
(Rs.in
Lakhs)
Amount
(Rs.in
Lakhs)
Amount
(Rs.in
Lakhs)
Amount
(Rs.in
Lakhs)
1 Kaliyanur Kosasthalaiyar 32.334 16.83 -
2 Sembedu Gerugam
Poondi Kosasthalaiyar - 5.916 18.92
1.153
3 Rajapadmapuram Kosasthalaiyar 35.935 13.36 - -
4 Gulur Kosasthalaiyar 31.140 13.24 9.88 1.264
DISTRICT SURVEY REPORT Tiruvallur District
Page | 11
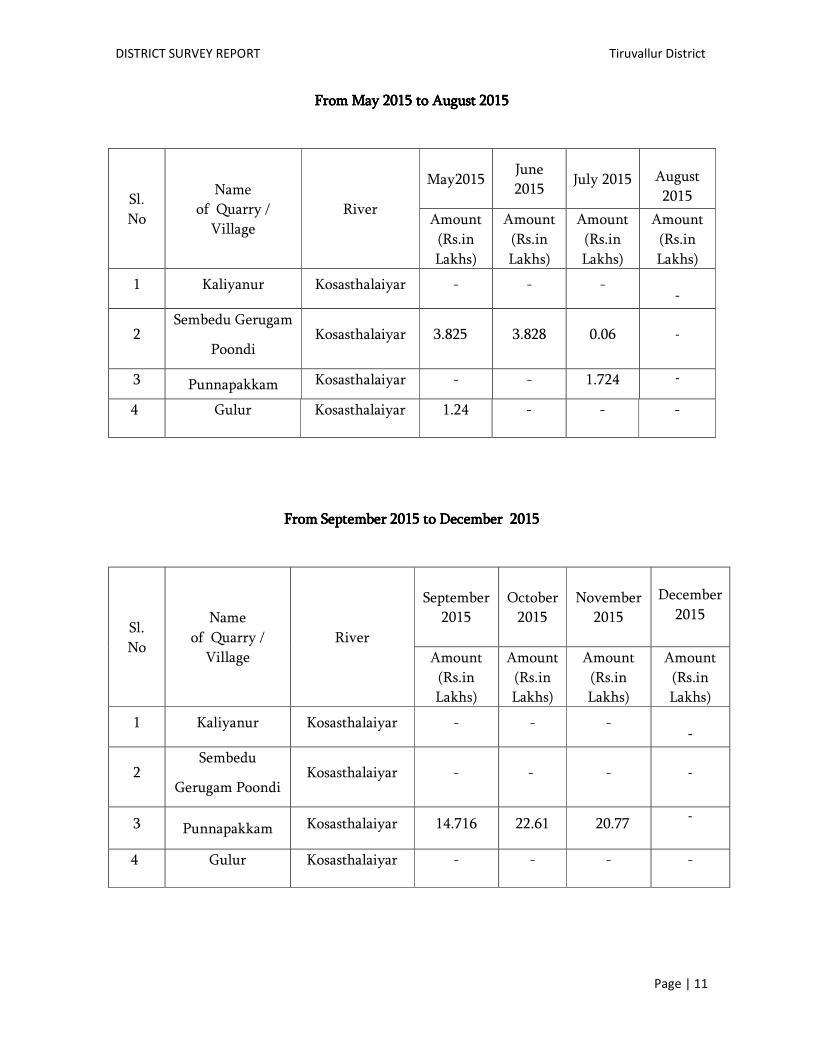
From May 2015 to August 2015From May 2015 to August 2015From May 2015 to August 2015From May 2015 to August 2015
From September 2015 to December 2015From September 2015 to December 2015From September 2015 to December 2015From September 2015 to December 2015
Sl.
No
Name
of Quarry /
Village
River
May2015
June
2015 July 2015
August
2015
Amount
(Rs.in
Lakhs)
Amount
(Rs.in
Lakhs)
Amount
(Rs.in
Lakhs)
Amount
(Rs.in
Lakhs)
1 Kaliyanur Kosasthalaiyar - - -
-
2 Sembedu Gerugam
Poondi Kosasthalaiyar 3.825 3.828 0.06
-
3 Punnapakkam Kosasthalaiyar - - 1.724 -
4 Gulur Kosasthalaiyar 1.24 - - -
Sl.
No
Name
of Quarry /
Village
River
September
2015
October
2015
November
2015
December
2015
Amount
(Rs.in
Lakhs)
Amount
(Rs.in
Lakhs)
Amount
(Rs.in
Lakhs)
Amount
(Rs.in
Lakhs)
1 Kaliyanur Kosasthalaiyar - - -
-
2 Sembedu
Gerugam Poondi Kosasthalaiyar - - -
-
3 Punnapakkam Kosasthalaiyar 14.716 22.61 20.77 -
4 Gulur Kosasthalaiyar - - - -
DISTRICT SURVEY REPORT Tiruvallur District
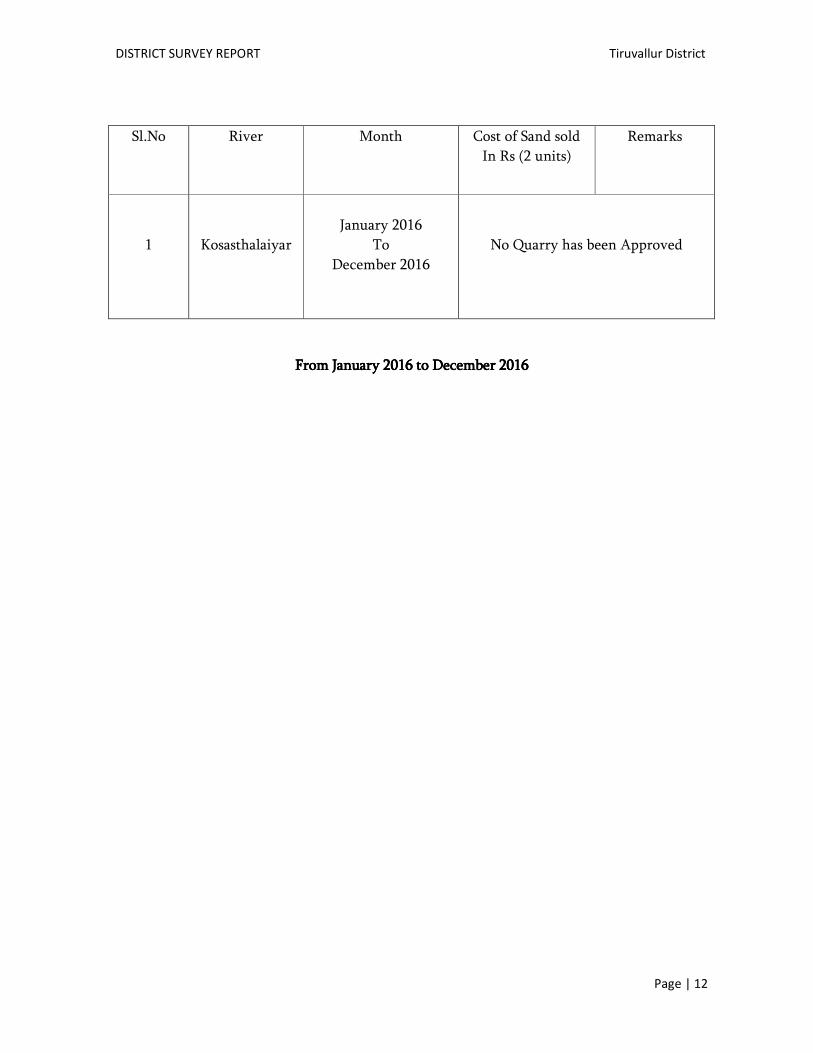
Page | 12
Sl.No River Month Cost of Sand sold
In Rs (2 units)
Remarks
1
Kosasthalaiyar
January 2016
To
December 2016
No Quarry has been Approved
From January 2016 to December 2016From January 2016 to December 2016From January 2016 to December 2016From January 2016 to December 2016
DISTRICT SURVEY REPORT Tiruvallur District
Page | 13
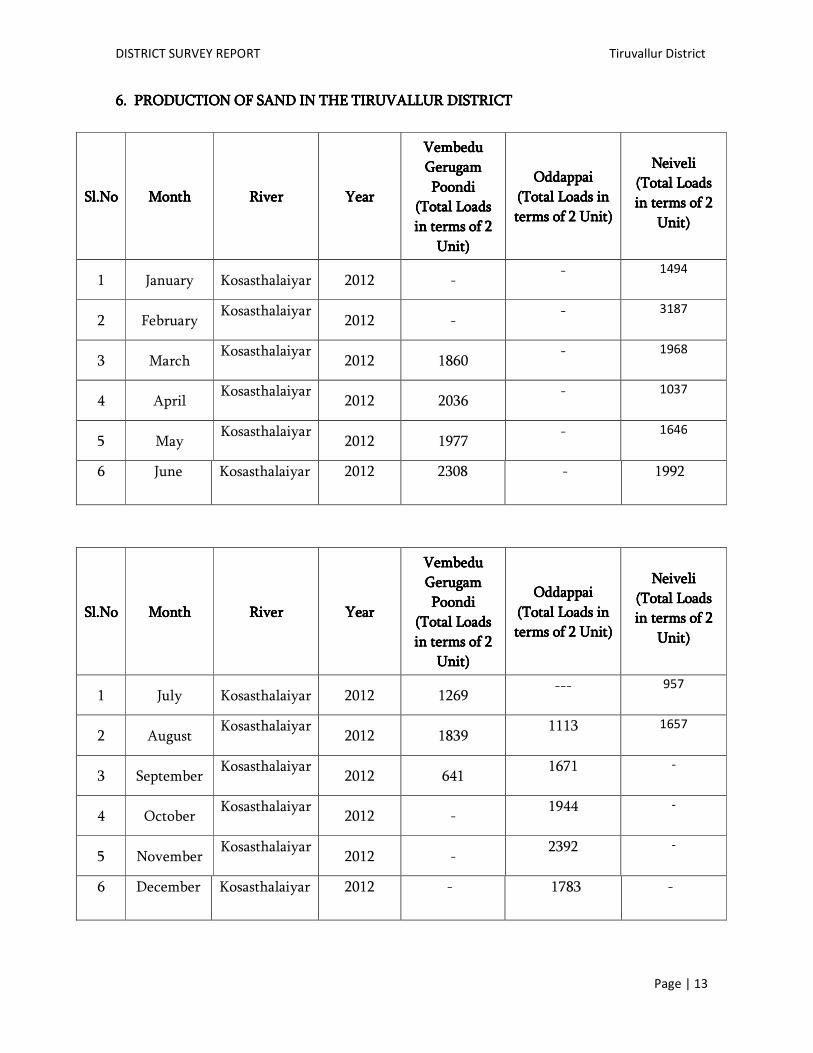
6666. PRODUCTION OF SAND. PRODUCTION OF SAND. PRODUCTION OF SAND. PRODUCTION OF SAND IN THE TIRUVALLUR IN THE TIRUVALLUR IN THE TIRUVALLUR IN THE TIRUVALLUR DISTRICTDISTRICTDISTRICTDISTRICT
Sl.NoSl.NoSl.NoSl.No MonthMonthMonthMonth RiverRiverRiverRiver
YearYearYearYear
Vembedu Vembedu Vembedu Vembedu
Gerugam Gerugam Gerugam Gerugam
PoondiPoondiPoondiPoondi
(Total Loads (Total Loads (Total Loads (Total Loads
in terms of 2 in terms of 2 in terms of 2 in terms of 2
Unit)Unit)Unit)Unit)
OddappaiOddappaiOddappaiOddappai
(Total Loads in (Total Loads in (Total Loads in (Total Loads in
terms of 2 Unit)terms of 2 Unit)terms of 2 Unit)terms of 2 Unit)
NeiveliNeiveliNeiveliNeiveli
(Total Loads (Total Loads (Total Loads (Total Loads
in terms of 2 in terms of 2 in terms of 2 in terms of 2
Unit)Unit)Unit)Unit)
1 January Kosasthalaiyar 2012 - - 1494
2 February Kosasthalaiyar
2012 - - 3187
3 March Kosasthalaiyar
2012 1860 - 1968
4 April Kosasthalaiyar
2012 2036 - 1037
5 May Kosasthalaiyar
2012 1977 - 1646
6 June Kosasthalaiyar 2012 2308 - 1992
Sl.NoSl.NoSl.NoSl.No MonthMonthMonthMonth RiverRiverRiverRiver
YearYearYearYear
Vembedu Vembedu Vembedu Vembedu
Gerugam Gerugam Gerugam Gerugam
PoondiPoondiPoondiPoondi
(Total Loads (Total Loads (Total Loads (Total Loads
in terms of 2 in terms of 2 in terms of 2 in terms of 2
Unit)Unit)Unit)Unit)
OddappaiOddappaiOddappaiOddappai
(Total Loads in (Total Loads in (Total Loads in (Total Loads in
terms of 2 Unit)terms of 2 Unit)terms of 2 Unit)terms of 2 Unit)
NeiveliNeiveliNeiveliNeiveli
(Total Loads (Total Loads (Total Loads (Total Loads
in terms of 2 in terms of 2 in terms of 2 in terms of 2
Unit)Unit)Unit)Unit)
1 July Kosasthalaiyar 2012 1269 --- 957
2 August Kosasthalaiyar
2012 1839 1113 1657
3 September Kosasthalaiyar
2012 641 1671 -
4 October Kosasthalaiyar
2012 - 1944 -
5 November Kosasthalaiyar
2012 - 2392 -
6 December Kosasthalaiyar 2012 - 1783 -

DISTRICT SURVEY REPORT Tiruvallur District
Page | 14
Sl.NoSl.NoSl.NoSl.No MonthMonthMonthMonth RiverRiverRiverRiver
YearYearYearYear
Sembedu Sembedu Sembedu Sembedu
Gerugam Gerugam Gerugam Gerugam
PoondiPoondiPoondiPoondi
(Total Loads (Total Loads (Total Loads (Total Loads
in terms of 2 in terms of 2 in terms of 2 in terms of 2
Unit)Unit)Unit)Unit)
RajapadmapuramRajapadmapuramRajapadmapuramRajapadmapuram
(Total Loads in (Total Loads in (Total Loads in (Total Loads in
terms of 2 Unit)terms of 2 Unit)terms of 2 Unit)terms of 2 Unit)
KaliyanurKaliyanurKaliyanurKaliyanur
(Total Loads (Total Loads (Total Loads (Total Loads
in terms of 2 in terms of 2 in terms of 2 in terms of 2
Unit)Unit)Unit)Unit)
1 January Kosasthalaiyar 2014 - - -
2 February Kosasthalaiyar
2014 - - -
3 March Kosasthalaiyar
2014 285 - 387
4 April Kosasthalaiyar
2014 646 - 405
5 May Kosasthalaiyar
2014 657 - 520
6 June Kosasthalaiyar 2014 1009 - 803
Sl.NoSl.NoSl.NoSl.No MonthMonthMonthMonth RiverRiverRiverRiver
YearYearYearYear
Vembedu Vembedu Vembedu Vembedu
Gerugam Gerugam Gerugam Gerugam
PoondiPoondiPoondiPoondi
(Total Loads (Total Loads (Total Loads (Total Loads
in terms of 2 in terms of 2 in terms of 2 in terms of 2
Unit)Unit)Unit)Unit)
OddappaiOddappaiOddappaiOddappai
(Total Loads in (Total Loads in (Total Loads in (Total Loads in
terms of 2 Unit)terms of 2 Unit)terms of 2 Unit)terms of 2 Unit)
NeiveliNeiveliNeiveliNeiveli
(Total Loads (Total Loads (Total Loads (Total Loads
in terms of 2 in terms of 2 in terms of 2 in terms of 2
Unit)Unit)Unit)Unit)
1 January Kosasthalaiyar 2013 - 595
--
2
(February
to
December)
Kosasthalaiyar 2013 - --
--

DISTRICT SURVEY REPORT Tiruvallur District
Page | 15
Sl.NoSl.NoSl.NoSl.No MonthMonthMonthMonth RiverRiverRiverRiver
YearYearYearYear
Sembedu Sembedu Sembedu Sembedu
Gerugam Gerugam Gerugam Gerugam
PoondiPoondiPoondiPoondi
(Total Loads (Total Loads (Total Loads (Total Loads
in terms of 2 in terms of 2 in terms of 2 in terms of 2
Unit)Unit)Unit)Unit)
RajapadmapuramRajapadmapuramRajapadmapuramRajapadmapuram
(Total Loads in (Total Loads in (Total Loads in (Total Loads in
terms of 2 Unit)terms of 2 Unit)terms of 2 Unit)terms of 2 Unit)
KaliyanurKaliyanurKaliyanurKaliyanur
(Total Loads (Total Loads (Total Loads (Total Loads
in terms of 2 in terms of 2 in terms of 2 in terms of 2
Unit)Unit)Unit)Unit)
1 July Kosasthalaiyar 2014 987 - 538
2 August Kosasthalaiyar
2014 680 - -
3 September Kosasthalaiyar
2014 823 - -
4 October Kosasthalaiyar
2014 441 - -
Sl.NoSl.NoSl.NoSl.No MonthMonthMonthMonth RiverRiverRiverRiver
YearYearYearYear
Sembedu Sembedu Sembedu Sembedu
Gerugam Gerugam Gerugam Gerugam
PoondiPoondiPoondiPoondi
(Total (Total (Total (Total
Loads in Loads in Loads in Loads in
terms of 2 terms of 2 terms of 2 terms of 2
Unit)Unit)Unit)Unit)
RajapadmapuramRajapadmapuramRajapadmapuramRajapadmapuram
(Total Loads in (Total Loads in (Total Loads in (Total Loads in
terms of 2 Unit)terms of 2 Unit)terms of 2 Unit)terms of 2 Unit)
KaliyanurKaliyanurKaliyanurKaliyanur
(Total (Total (Total (Total
Loads in Loads in Loads in Loads in
terms of 2 terms of 2 terms of 2 terms of 2
Unit)Unit)Unit)Unit)
GulurGulurGulurGulur
(Total (Total (Total (Total
Loads in Loads in Loads in Loads in
terms of 2 terms of 2 terms of 2 terms of 2
Unit)Unit)Unit)Unit)
1 November Kosasthalaiyar 2014 248 197 - -
2 December Kosasthalaiyar 2014 20 3006 2998 2710

DISTRICT SURVEY REPORT Tiruvallur District
Page | 16
Sl.NoSl.NoSl.NoSl.No MonthMonthMonthMonth RiverRiverRiverRiver
YearYearYearYear
Sembedu Sembedu Sembedu Sembedu
Gerugam Gerugam Gerugam Gerugam
PoondiPoondiPoondiPoondi
(Total (Total (Total (Total
Loads in Loads in Loads in Loads in
terms of 2 terms of 2 terms of 2 terms of 2
Unit)Unit)Unit)Unit)
RajapadmapuramRajapadmapuramRajapadmapuramRajapadmapuram
(Total Loads in (Total Loads in (Total Loads in (Total Loads in
terms of 2 Unit)terms of 2 Unit)terms of 2 Unit)terms of 2 Unit)
KaliyanurKaliyanurKaliyanurKaliyanur
(Total (Total (Total (Total
Loads in Loads in Loads in Loads in
terms of 2 terms of 2 terms of 2 terms of 2
Unit)Unit)Unit)Unit)
GulurGulurGulurGulur
(Total (Total (Total (Total
Loads in Loads in Loads in Loads in
terms of 2 terms of 2 terms of 2 terms of 2
Unit)Unit)Unit)Unit)
1 January Kosasthalaiyar 2015 - 3523 3170 3053
2 February Kosasthalaiyar 2015 580 1310 1650 1298
3 March Kosasthalaiyar 2015 1855 - - 969
4 April Kosasthalaiyar 2015 113 - - 124
5 May Kosasthalaiyar 2015 375 - - 122
6 June Kosasthalaiyar 2015 324 - - -
Sl.NoSl.NoSl.NoSl.No MonthMonthMonthMonth RiverRiverRiverRiver
YearYearYearYear
Sembedu Sembedu Sembedu Sembedu
Gerugam PoondiGerugam PoondiGerugam PoondiGerugam Poondi
(Total Loads in (Total Loads in (Total Loads in (Total Loads in
terms of 2 Unit)terms of 2 Unit)terms of 2 Unit)terms of 2 Unit)
PunnapakkamPunnapakkamPunnapakkamPunnapakkam
(Total Loads in (Total Loads in (Total Loads in (Total Loads in
terms of 2 terms of 2 terms of 2 terms of 2
Unit)Unit)Unit)Unit)
1 July Kosasthalaiyar 2015 6 169
2 August Kosasthalaiyar 2015 - -
3 September Kosasthalaiyar 2015 - 1415
4 October Kosasthalaiyar 2015 - 2174
5 November Kosasthalaiyar 2015 - 1998
6 December Kosasthalaiyar 2015 - -

DISTRICT SURVEY REPORT Tiruvallur District
Page | 17
6. PROCESS OF6. PROCESS OF6. PROCESS OF6. PROCESS OF THETHETHETHE DEPOSITION OF SEDIMENTS IN THE RIVERS OF THE DEPOSITION OF SEDIMENTS IN THE RIVERS OF THE DEPOSITION OF SEDIMENTS IN THE RIVERS OF THE DEPOSITION OF SEDIMENTS IN THE RIVERS OF THE
DISTRICT.DISTRICT.DISTRICT.DISTRICT.
Kosasthalaiyar is 136-kilometre (85 mi) long and originates near in Vellore District and
drains into the Bay of Bengal. Its northern tributary Nagari river originates in Chitoor district
of Andhra Pradesh and joins the main river in the back waters of Poondy dam. Its catchment
area spreads in Vellore, Chitoor, North Arcot, Thiruvallur and Chennai districts. It has
catchment area in Vellore District with a branch near Kesavaram Anicut and flows to the city
as Cooum River and the main Kosasthalaiyar River flows to Poondi reservoir. From Poondi
reservoir, the river flows through Thiruvallur District, enters the Chennai metropolitan area,
and joins the sea at Ennore creek. The river has 9 check dams. There are two check dams
across the river at Tamaraipakkam and Vallur. The excess discharge in the river is controlled
by the Tamarapakkam Anicut located across the river in the downstream of Poondi reservoir.
Vallur Anicut is a small check dam constructed near Minjur across the river to control water
levels and feed irrigation channels in the area. It flows to a distance of 16 kilometres (10 mi)
in the Chennai metropolitan area. The total catchment area of the river is 3,757 kilometres
(2,334 mi), and the bed width ranges from 150 to 250 metres (490 to 820 ft). The discharge
capacity of the river is 110,000 cubic metres per second (3,900,000 cu ft/s), and the anticipated
flood discharge capacity is about 125,000 cubic metres per second (4,400,000 cu ft/s). The river
drains up to 50,000 cubic feet per second (1,400 m3/s) of flood water into the sea through the
Ennore creek during monsoons.The historic Korattur anicut located at Jamin Korattur in
Tiruvallur district serves as a vital channel to regulating water to the Chembarambakkam
reservoir. The dam was built in 1876 across the unpolluted stretch of the Cooum river and
diverts excess water to the Chembarambakkam reservoir
6666. a. a. a. a. Location of Irrigation structures. Location of Irrigation structures. Location of Irrigation structures. Location of Irrigation structures
The important irrigation structures located along the study which are used for the regulation
of water along the reach are detailed below,
• Kesavaram anicut

DISTRICT SURVEY REPORT Tiruvallur District
Page | 18
• Korattur anicut
• Thamarapakkam anicut
6666. b. b. b. b.... KOSASTHALAIYAR KOSASTHALAIYAR KOSASTHALAIYAR KOSASTHALAIYAR RIVERRIVERRIVERRIVER BASINBASINBASINBASIN
The Kosasthalaiyar river basin (Fig.6.1) extends over an area of 3625 km2, in the
northernmost part of Tamil Nadu. This is a west to east flowing river, starting from the
mountainous terrain in the west and reaching the Bay of Bengal in the east. It has several
tributaries, particularly in the western regions. The river is basically ephemeral in nature
flowing only during a part of the year generally in the period of November to February.
Several reservoirs have been constructed across the river such as Poondi, which impounded
the flood waters. In fact, the river flow is a major source of water to the city of Chennai.
Rainfall being the only source of water in the area, the amount of rainfall received is of
utmost importance in evaluating groundwater resources. The average rainfall in the basin
varies from about 530 mm to 1430 mm.
Fig.6.1Fig.6.1Fig.6.1Fig.6.1. Study area and well location . Study area and well location . Study area and well location . Study area and well location of river basinof river basinof river basinof river basin

DISTRICT SURVEY REPORT Tiruvallur District
Page | 19
The Kosasthalaiyar river basin has a varied geology. The western part is underlain by hard
crystalline rocks (Precambrian) while the eastern part contains sedimentary rocks, alluvium
and Laterite. Numerous dolerite dyke is traversing in western part of study area. Laterite rocks
are present in the north eastern portion, while calcareous gritty sandstone and clay is present
in the central and eastern portion, Alluvium in the predominant formation along the river
course. The various geological formations in the area are shown in Figure 6.2.
Fig.Fig.Fig.Fig.6.26.26.26.2. Regional Geo. Regional Geo. Regional Geo. Regional Geology of river basinlogy of river basinlogy of river basinlogy of river basin

DISTRICT SURVEY REPORT Tiruvallur District
Page | 20
Fig.Fig.Fig.Fig.6.36.36.36.3.... Regional Geomorphology of river basinRegional Geomorphology of river basinRegional Geomorphology of river basinRegional Geomorphology of river basin

DISTRICT SURVEY REPORT Tiruvallur District
Page | 21
6.c6.c6.c6.c. . . . REPLENISHMENT STUDY FOR SANDREPLENISHMENT STUDY FOR SANDREPLENISHMENT STUDY FOR SANDREPLENISHMENT STUDY FOR SAND
Replenishment study was under progress according to the MoEFCC Gazette
Notification No.S.O.3611(E) dated 25.07.2018. Therefore, replenishment study should carried
out across the state in all districts as per the method prescribed in the Sustainable Sand
Mining Guidelines 2018 of MoEFCC. Some of the points that should be taken care of while
conducting replenishment study are:
• The cross-section survey should cover a minimum distance of 1.0 km upstream
and 1.0 km downstream of the potential reach for extraction.
• The sediment sampling should include the bed material and bed material load before,
during and after extraction period.
• Development of sediment rating curve at the upstream end of the potential reach
Using the surveyed cross- section.
• Using the historical or gauged flow rating curve, determination of suitable
Period of high flow that can replenish the extracted volume.
7. GENERAL PROFILE OF THE DISTRICT . GENERAL PROFILE OF THE DISTRICT . GENERAL PROFILE OF THE DISTRICT . GENERAL PROFILE OF THE DISTRICT
7. a7. a7. a7. a. PHYSICAL F. PHYSICAL F. PHYSICAL F. PHYSICAL FEATURES AND GEOGRAPHICAL AREA: EATURES AND GEOGRAPHICAL AREA: EATURES AND GEOGRAPHICAL AREA: EATURES AND GEOGRAPHICAL AREA:
It is located in the North eastern part of Tamil Nadu between 12 ° 15’ and 13° 15‘ North and
79° 15‘ and 80 ° 20 ‘ East. The district is bounded by the Bay of Bengal in the East. Vellore
district of Tamil Nadu and Chitoor district of Andhra Pradesh on the West, Nellore district of
Andhra Pradesh on the North and on the South by Kancheepuram district. The district
spreads over an area of about 3422 Sq.km. The district comprising of 9 taluks, 14 blocks, 5
Municipalities and 10 Panchayat unions.
The District haThe District haThe District haThe District has 3s 3s 3s 3 divisions and 9 divisions and 9 divisions and 9 divisions and 9 Taluks as follows: Taluks as follows: Taluks as follows: Taluks as follows:
DIVISIONS DIVISIONS DIVISIONS DIVISIONS
1. Tiruvallur
2. Ponneri
3. Tiruttani

DISTRICT SURVEY REPORT Tiruvallur District
Page | 22
TALUKS TALUKS TALUKS TALUKS
1. Tiruvallur
2. Poonamallee
3. Uthukottai
4. Avadi
5. Ponneri
6. Gummidipoondi
7. Tiruttani
8. Pallipet
9. R.K. Pet

DISTRICT SURVEY REPORT Tiruvallur District
Page | 23
Tiruvallur experiences a tropical climate . The temperature ranges from a maximum of 45 °C
(113 °F) to a minimum of 13 °C (55 °F). The monsoon which lasts from October to December
brings rainfall of 1152.8 mm. The humidity ranges from 36%–63% during summer and 67%–
86% during winter. The district is well connected by road and rail.
Climate data for Climate data for Climate data for Climate data for TiruvallurTiruvallurTiruvallurTiruvallur
MonthMonthMonthMonth JanJanJanJan FebFebFebFeb MarMarMarMar AprAprAprApr MaMaMaMa
yyyy JunJunJunJun JulJulJulJul AugAugAugAug SepSepSepSep OctOctOctOct
NoNoNoNo
vvvv
DeDeDeDe
cccc
YeaYeaYeaYea
rrrr
Record high °C Record high °C Record high °C Record high °C
(°F)(°F)(°F)(°F)
35.
3
(95
.5)
39.8
(10
3.6)
42.8
(10
9.0)
44.4
(11
1.9)
45.0
(11
3.0)
44.3
(11
1.7)
40.9
(10
5.6)
39.4
(10
2.9)
39.6
(10
3.3)
39.2
(10
2.6)
35.
8
(96
.4)
35.
0
(95
.0)
45.0
(113
.0)
Average high Average high Average high Average high
°C (°F)°C (°F)°C (°F)°C (°F)
29.
8
(85
.6)
32.8
(91.
0)
36.1
(97.
0)
39.9
(10
3.8)
41.1
(10
6.0)
40.6
(10
5.1)
35.1
(95.
2)
34.3
(93.
7)
34.0
(93.
2)
32.3
(90.
1)
29.
8
(85
.6)
28.
7
(83
.7)
34.5
(94.
2)
Average low °C Average low °C Average low °C Average low °C
(°F)(°F)(°F)(°F)
14.
8
(58
.6)
18.9
(66.
0)
21.6
(70.
9)
24.6
(76.
3)
25.7
(78.
3)
25.2
(77.
4)
24.5
(76.
1)
24.0
(75.
2)
23.4
(74.
1)
22.4
(72.
3)
20.
6
(69
.1)
13.
2
(55
.8)
21.6
(70.
8)
Record low °C Record low °C Record low °C Record low °C
(°F)(°F)(°F)(°F)
7.4
(45
.3)
12.0
(53.
6)
12.1
(53.
8)
17.8
(64.
0)
18.1
(64.
6)
19.6
(67.
3)
18.8
(65.
8)
18.7
(65.
7)
18.7
(65.
7)
15.6
(60.
1)
12.
1
(53
.8)
11.
0
(51
.8)
8
(46)
AverageAverageAverageAverage precipiprecipiprecipiprecipi
tationtationtationtation mm mm mm mm
(inches)(inches)(inches)(inches)
11.
5
(0.
45)
1.7
(0.0
7)
16.7
(0.6
6)
28.2
(1.1
1)
69.7
(2.7
4)
78.2
(3.0
8)
110.
4
(4.3
5)
134.
1
(5.2
8)
195.
2
(7.6
9)
158.
1
(6.2
2)
15
6.3
(6.
15)
74.
0
(2.
91)
1,03
4.1
(40.
71)
Average Average Average Average
precipitation precipitation precipitation precipitation
daysdaysdaysdays
0.9 0.2 1.1 1.5 4.5 5.0 6.2 7.8 8.8 8.6 7.6 3.6 55.8

DISTRICT SURVEY REPORT Tiruvallur District
Page | 24
8. LAND UTILISATION PATTERN:8. LAND UTILISATION PATTERN:8. LAND UTILISATION PATTERN:8. LAND UTILISATION PATTERN:----
Out of the total area of 3422 Sq.km. the Tiruvallur District hosts the major land use as the
Agriculture with Crop land and Plantation type land covers, followed by the forest cover and
so on.
+

DISTRICT SURVEY REPORT Tiruvallur District
Page | 25
Land Land Land Land utilizationutilizationutilizationutilization PatternPatternPatternPattern
S.No Class Area (Sq.Km)
1 Barren rocky area 18.82
2 Deciduous 17.94
3 Dry crop 73.22
4 Fallow Land 41.77
5 Forest plantations 11.72
6 Forest 122.95
7 Gullied / Ravenous land 2.06
8 Land with scrub 65.35
9 Land without scrub 16.46
10 plantation 448.85
11 Reservoir / Lake /Tank 162.34
12 River 29.90
13 Settlements 70.98
14 Salt affected 16.28
15 Sandy area 1.00
16 Scrub forest 9.54
17 Wet crop 447.89
Total 1557.07
DISTRICT SURVEY REPORT Tiruvallur District
Page | 26
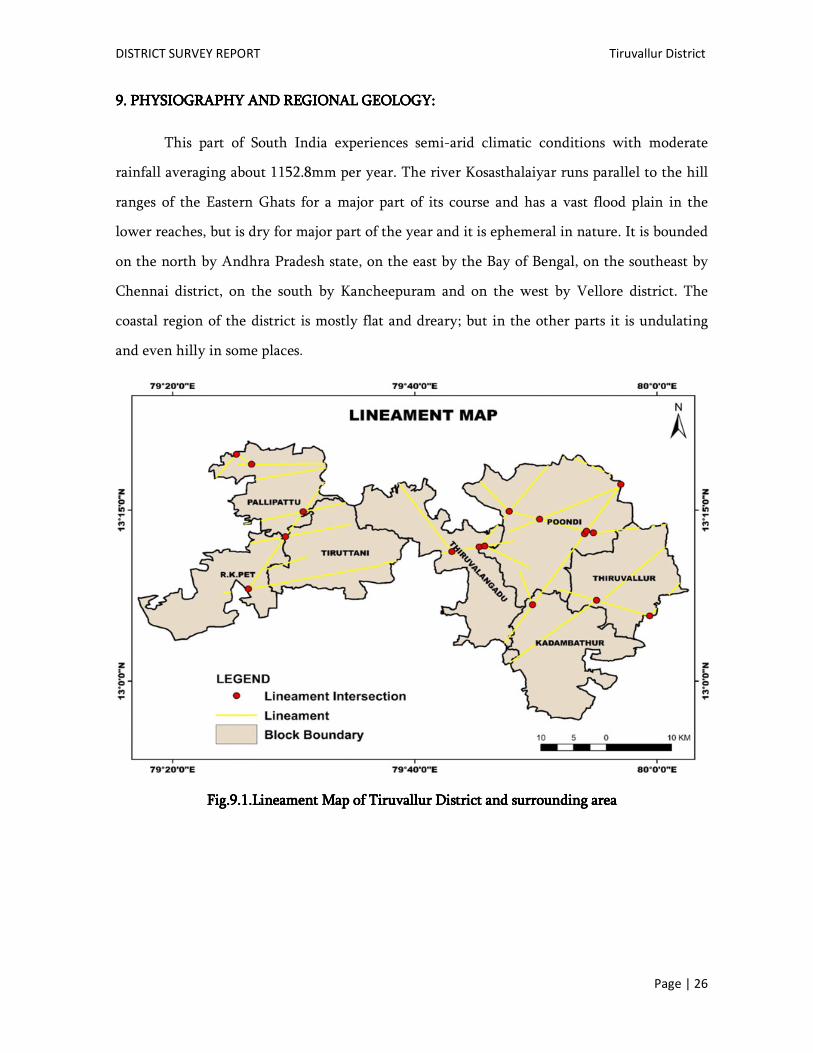
9. PHYSIOGRAPHY AND REGIONAL GEOLOGY9. PHYSIOGRAPHY AND REGIONAL GEOLOGY9. PHYSIOGRAPHY AND REGIONAL GEOLOGY9. PHYSIOGRAPHY AND REGIONAL GEOLOGY: : : :
This part of South India experiences semi-arid climatic conditions with moderate
rainfall averaging about 1152.8mm per year. The river Kosasthalaiyar runs parallel to the hill
ranges of the Eastern Ghats for a major part of its course and has a vast flood plain in the
lower reaches, but is dry for major part of the year and it is ephemeral in nature. It is bounded
on the north by Andhra Pradesh state, on the east by the Bay of Bengal, on the southeast by
Chennai district, on the south by Kancheepuram and on the west by Vellore district. The
coastal region of the district is mostly flat and dreary; but in the other parts it is undulating
and even hilly in some places.
Fig.9.1.Fig.9.1.Fig.9.1.Fig.9.1.Lineament Map of TiruvallurLineament Map of TiruvallurLineament Map of TiruvallurLineament Map of Tiruvallur District and surrounding areaDistrict and surrounding areaDistrict and surrounding areaDistrict and surrounding area

DISTRICT SURVEY REPORT Tiruvallur District
Page | 27
10.10.10.10. RAINFALL PATTERN ALONG KOSASTHALAIYARRAINFALL PATTERN ALONG KOSASTHALAIYARRAINFALL PATTERN ALONG KOSASTHALAIYARRAINFALL PATTERN ALONG KOSASTHALAIYAR RIVER BASINRIVER BASINRIVER BASINRIVER BASIN
Hydrometeorology Hydrometeorology Hydrometeorology Hydrometeorology
Fifteen rain gauge stations in Kosasthalaiyar river basin are considered for analysis. Three
weather stations (full climate stations) are there in this basin. All the rain gauge stations and
climate stations are maintained by Public Works Department.
SSSSllll.No.No.No.No
SeasonSeasonSeasonSeason
Normal Rainfall(mm)Normal Rainfall(mm)Normal Rainfall(mm)Normal Rainfall(mm)
SeasonalSeasonalSeasonalSeasonal
Contribution (Contribution (Contribution (Contribution (%)%)%)%)
1 Winter(Jan–Feb) 33.5 3%
2 Summer( Mar–May) 65.7 6%
3 South West Monsoon 449.5 39%
4 North East Monsoon 604.1 52%
11111111. . . . GEOLOGY AND MINERAL WEALTHGEOLOGY AND MINERAL WEALTHGEOLOGY AND MINERAL WEALTHGEOLOGY AND MINERAL WEALTH
The trace of each and every river/ stream was covered and studied on the following principles
of Geology/River bed mining:
The general geology of the area
The presence of any major geological structure
Origin of river
Pattern of primary / secondary/ tertiary streams
Total catchments
General profile of river/streams
Meandering Pattern
Bank stability
Total potential of river bed in reference to minor mineral

DISTRICT SURVEY REPORT Tiruvallur District
Page | 28
General slope of the river / stream
Morphogenetic regions.
In Addition to above, presence of the following objects were also studied
Agriculture fields
Bank protection works
Plantation etc.
Bridges
Following are the important guiding principles considered while recommending the river /
stream bed or part of the river / stream bed for collection for minor minerals:-
• A stable river is able to consistently transport the flow of sediments produced by
watershed such that its dimension (width and depth) pattern and vertical profile are
maintained without aggrading (building up) or degrading ( scouring down)
• The amount of boulders, cobbles, pebbles and sand deposited in river bed equals to the
amount delivered to the river from watershed and from bank erosion minus amount
transported downstream each year.
• It is compulsive nature for river to meander in their belts and therefore they will
have to be provided with adequate corridor for meandering without hindrance. Any
attempt to diminish the width of this corridor (floodway) and curb their freedom to
meander would prove counterproductive. Erosion and deposition is law of nature. The
river/stream has to complete its geomorphological cycle from youth, mature to old
age.
• River capturing is unavoidable.
• Erosion in upstream and deposition in downstream.
• Tendency of the river / stream toward grade.
• Fundamentally, the lowest point of any stream is fixed by Sea Level.
• The ratio between the width of meander belt and width of the stream decreases as the
width of the stream increases.

DISTRICT SURVEY REPORT Tiruvallur District
Page | 29
• Formation, Bank erosion and Replenishment of any specific riverbed depends
Primarily upon:
The Geology of the area
River Profile
Nature of source
Rainfall in catchments
Morphogenetic region
Catchments geomorphology
Efficiency of River / Stream ( i.e. erosive power)
The competency of the river / Stream ( i.e. transport heaviest stone)
The capacity of the River/Stream ( i.e. volume of transportation)
Hydraulic radius of the River / Stream (ratio between cross sectional area and
length of wetted perimeter)
Secondarily upon:
Geological structures
Porosity of formation
Run off in the catchments
Forest cover
In addition to the above following man made factors are also involved.
Type of agriculture
Encroachment on flood plain leaving least space for meandering
Any barrier on river / stream bed i.e banks , dams and bridge foundations etc
Throwing of debris into the river/stream course
Drying up of river courses due to construction of dams, thereby reducing the
efficiency and capacity of the river / stream.

DISTRICT SURVEY REPORT Tiruvallur District
Page | 30
The total potential of the river / stream bed is calculated up to the depth of one meter
and in the workable span. Total potential or annual replenishment is not necessarily
mineable. Mine ability depends upon the availability of approachable roads, distance from the
general conditions of policy viz distances from WSS Schemes, bridges etc and overall on the
market demand etc. Thus keeping these factors into consideration 60% of the total potential
has been taken for the purpose of exploitation of minor minerals.
11111111. a. Method For calculation of Reserves:. a. Method For calculation of Reserves:. a. Method For calculation of Reserves:. a. Method For calculation of Reserves:
For the calculation of total reserves of sand available in the river bed, length,
average width and depth of the river bed for which the exploitation is to be carried out /
allowed under rule / prevailing instructions of the Goverment taken into consideration. The
volume thus obtained is multiplied with the bulk density which has been assumed as 1.65 for
all types of minor minerals. Thus reserves up to particular datum line i.e. one meter below the
surface have been calculated.
Total reserves of minor minerals (M.T.) = Length x Width x Height i.e Depth x Density. For
the annual replenishment of minor mineral reserves, the average annual mean depth up to
which the replenishment of minor mineral takes place annually, has been taken into
consideration which depends upon the annual rainfall factor and geology of the catchments
area.

DISTRICT SURVEY REPORT Tiruvallur District
Page | 31
12121212. RIVER SYSTEM. RIVER SYSTEM. RIVER SYSTEM. RIVER SYSTEM
12121212. a.KOSASTHALAIYAR. a.KOSASTHALAIYAR. a.KOSASTHALAIYAR. a.KOSASTHALAIYAR RIVERRIVERRIVERRIVER
Kosasthalaiyar is 136-kilometre (85 mi) long and originates near Vellore District and drains
into the Bay of Bengal. Its northern tributary Nagari River originates in Chitoor
district of Andhra Pradesh and joins the main river in the back waters of Poondy dam. Its
catchment area spreads in Vellore, Chitoor, North Arcot, Thiruvallur and Chennai districts. It
has catchment area in Vellore District with a branch near Kesavaram Anicut and flows to the
city as Cooum River and the main Kosasthalaiyar River flows to Poondi reservoir. From
Poondi reservoir, the river flows through Thiruvallur District, enters the Chennai
metropolitan area, and joins the sea at Ennore creek. The river has 9 check dams. There are
two check dams across the river at Thamarapakkam and Vallur. The excess discharge in the
river is controlled by the Thamarapakkam Anicut located across the river in the downstream
of Poondi reservoir. Vallur Anicut is a small check dam constructed near Minjur across the
river to control water levels and feed irrigation channels in the area. It flows to a distance of
16 kilometres (10 mi) in the Chennai metropolitan area. The total catchment area of the river
is 3,757 kilometres (2,334 mi), and the bed width ranges from 150 to 250 metres (490 to
820 ft). The discharge capacity of the river is 110,000 cubic metres per second
(3,900,000 cu ft/s), and the anticipated flood discharge capacity is about 125,000 cubic metres
per second (4,400,000 cu ft/s). The river drains up to 50,000 cubic feet per second (1,400 m3/s)
of flood water into the sea through the Ennore creek during monsoons.
Fig.12.1.Fig.12.1.Fig.12.1.Fig.12.1.SubSubSubSub----basin Map of Kosasthalaiyar basin Map of Kosasthalaiyar basin Map of Kosasthalaiyar basin Map of Kosasthalaiyar RiverRiverRiverRiver

DISTRICT SURVEY REPORT Tiruvallur District
Page | 32
12121212. b . b . b . b CLIMATIC CLIMATIC CLIMATIC CLIMATIC CHARACTERISTICS: HUMIDITY AND WINDCHARACTERISTICS: HUMIDITY AND WINDCHARACTERISTICS: HUMIDITY AND WINDCHARACTERISTICS: HUMIDITY AND WIND
Tiruvallur experiences a tropical climate . The temperature ranges from a
maximum of 45 °C (113 °F) to a minimum of 13 °C (55 °F). The monsoon which lasts from
October to December brings rainfall of 1152.8 mm. The humidity ranges from 36%–63%
during summer and 67%–86% during winter.
SSSSllll.No.No.No.No
SeasonSeasonSeasonSeason
Normal Rainfall(mm)Normal Rainfall(mm)Normal Rainfall(mm)Normal Rainfall(mm)
Seasonal Seasonal Seasonal Seasonal
Contribution (%)Contribution (%)Contribution (%)Contribution (%)
1 Winter(Jan–Feb) 33.5 3%
2 Summer( Mar–May) 65.7 6%
3 South West Monsoon 449.5 39%
4 North East Monsoon 604.1 52%
AVERAGE AVERAGE AVERAGE AVERAGE TEMPERATURETEMPERATURETEMPERATURETEMPERATURE TIRUVALLURTIRUVALLURTIRUVALLURTIRUVALLUR
DISTRICT SURVEY REPORT Tiruvallur District
Page | 33
TIRUVALLURTIRUVALLURTIRUVALLURTIRUVALLUR WEATHER BY MONTH /WEATHER BY MONTH /WEATHER BY MONTH /WEATHER BY MONTH /WEATHER AVERAGESWEATHER AVERAGESWEATHER AVERAGESWEATHER AVERAGES
Climate data for TiruvallurClimate data for TiruvallurClimate data for TiruvallurClimate data for Tiruvallur
MonthMonthMonthMonth JanJanJanJan FebFebFebFeb MarMarMarMar AprAprAprApr MayMayMayMay JunJunJunJun JulJulJulJul AugAugAugAug SepSepSepSep OctOctOctOct NovNovNovNov DecDecDecDec YearYearYearYear
Record high °C (°F)Record high °C (°F)Record high °C (°F)Record high °C (°F)
35.3
(95.
5)
39.8
(103.
6)
42.8
(109.
0)
44.4
(111.
9)
45.0
(113.
0)
44.3
(111.
7)
40.9
(105.
6)
39.4
(102.
9)
39.6
(103.
3)
39.2
(102.
6)
35.8
(96.
4)
35.0
(95.
0)
45.0
(113.
0)
Average high °C Average high °C Average high °C Average high °C
(°F)(°F)(°F)(°F)
29.8
(85.
6)
32.8
(91.0
)
36.1
(97.0
)
39.9
(103.
8)
41.1
(106.
0)
40.6
(105.
1)
35.1
(95.2
)
34.3
(93.7
)
34.0
(93.2
)
32.3
(90.1
)
29.8
(85.
6)
28.7
(83.
7)
34.5
(94.2
)
Average low °C Average low °C Average low °C Average low °C
(°F)(°F)(°F)(°F)
14.8
(58.
6)
18.9
(66.0
)
21.6
(70.9
)
24.6
(76.3
)
25.7
(78.3
)
25.2
(77.4
)
24.5
(76.1
)
24.0
(75.2
)
23.4
(74.1
)
22.4
(72.3
)
20.6
(69.
1)
13.2
(55.
8)
21.6
(70.8
)
Record low °C (°F)Record low °C (°F)Record low °C (°F)Record low °C (°F)
7.4
(45.
3)
12.0
(53.6
)
12.1
(53.8
)
17.8
(64.0
)
18.1
(64.6
)
19.6
(67.3
)
18.8
(65.8
)
18.7
(65.7
)
18.7
(65.7
)
15.6
(60.1
)
12.1
(53.
8)
11.0
(51.
8)
8
(46)
AverageAverageAverageAverage precipitatiprecipitatiprecipitatiprecipitati
onononon mm (inches)mm (inches)mm (inches)mm (inches)
11.5
(0.4
5)
1.7
(0.07
)
16.7
(0.66
)
28.2
(1.11
)
69.7
(2.74
)
78.2
(3.08
)
110.
4
(4.35
)
134.
1
(5.28
)
195.
2
(7.69
)
158.
1
(6.22
)
156.
3
(6.1
5)
74.0
(2.9
1)
1,03
4.1
(40.7
1)
Average Average Average Average
precipitation daysprecipitation daysprecipitation daysprecipitation days 0.9 0.2 1.1 1.5 4.5 5.0 6.2 7.8 8.8 8.6 7.6 3.6 55.8
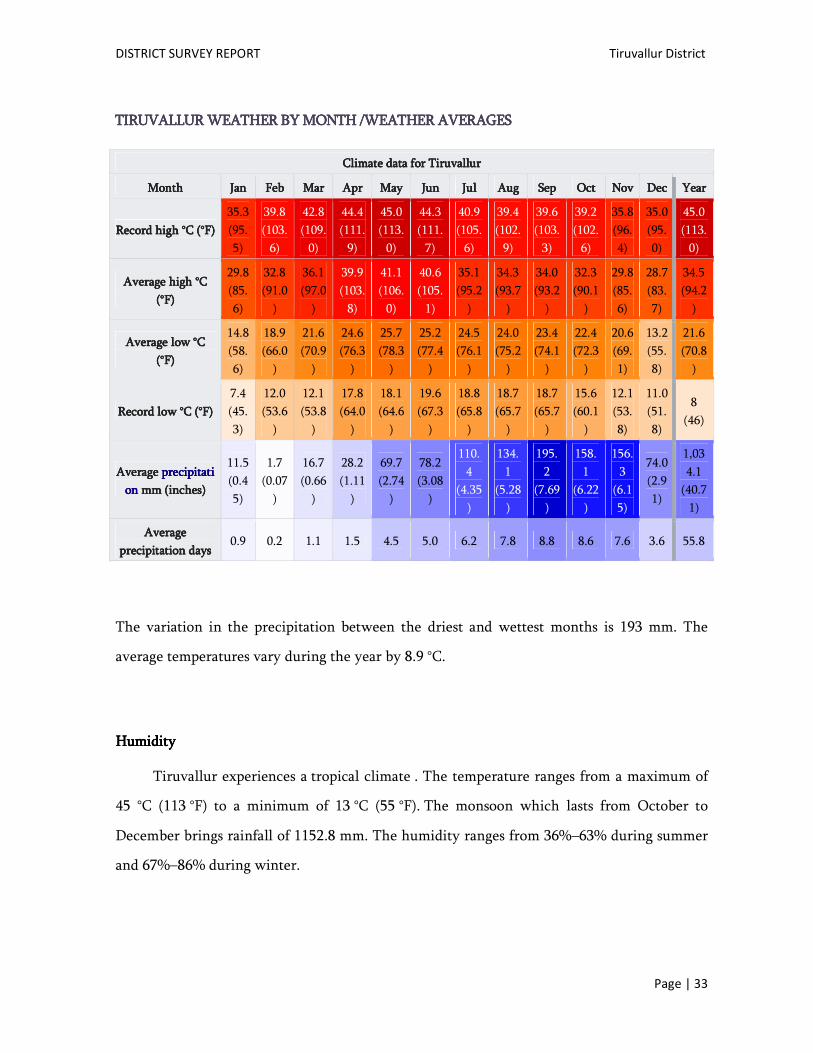
The variation in the precipitation between the driest and wettest months is 193 mm. The
average temperatures vary during the year by 8.9 °C.
Humidity Humidity Humidity Humidity
Tiruvallur experiences a tropical climate . The temperature ranges from a maximum of
45 °C (113 °F) to a minimum of 13 °C (55 °F). The monsoon which lasts from October to
December brings rainfall of 1152.8 mm. The humidity ranges from 36%–63% during summer
and 67%–86% during winter.

DISTRICT SURVEY REPORT
Humidity Graph
Wind:Wind:Wind:Wind:----
The windier part of the year lasts for 5
12.6 km / hour. with an average hourly wind speed of 18.4 km / hour. The ca
lasts for 7 months with an average hourly wind speed of 4.8 km / hour
DISTRICT SURVEY REPORT
r part of the year lasts for 5months with average wind speed of more than
km / hour. with an average hourly wind speed of 18.4 km / hour. The calmer time of year
with an average hourly wind speed of 4.8 km / hour.
Tiruvallur District
Page | 34
speed of more than
lmer time of year

DISTRICT SURVEY REPORT
Average wind speed diagramAverage wind speed diagramAverage wind speed diagramAverage wind speed diagram
DISTRICT SURVEY REPORT Tiruvallur District
Page | 35

DISTRICT SURVEY REPORT Tiruvallur District
Page | 36
11113333. DRAINAGE SYSTEM . DRAINAGE SYSTEM . DRAINAGE SYSTEM . DRAINAGE SYSTEM WITH DESCRIPTION OF MAIN RIVERSWITH DESCRIPTION OF MAIN RIVERSWITH DESCRIPTION OF MAIN RIVERSWITH DESCRIPTION OF MAIN RIVERS
S.NOS.NOS.NOS.NO Name of the RiverName of the RiverName of the RiverName of the River Area drainedArea drainedArea drainedArea drained
(Sq. km)(Sq. km)(Sq. km)(Sq. km)
% Area drained in the District% Area drained in the District% Area drained in the District% Area drained in the District
1. KOSASTHALAIYARKOSASTHALAIYARKOSASTHALAIYARKOSASTHALAIYAR 249 7.27
11114444. SALIENT FEATURES OF IMPORTANT RIVERS AND STREAMS. SALIENT FEATURES OF IMPORTANT RIVERS AND STREAMS. SALIENT FEATURES OF IMPORTANT RIVERS AND STREAMS. SALIENT FEATURES OF IMPORTANT RIVERS AND STREAMS
S.NOS.NOS.NOS.NO Name of the River or Name of the River or Name of the River or Name of the River or
StreamStreamStreamStream
Total Length Total Length Total Length Total Length (in (in (in (in
Km)Km)Km)Km)
Place of Place of Place of Place of OriginOriginOriginOrigin Altitude at Altitude at Altitude at Altitude at
Origin Origin Origin Origin
(m)(m)(m)(m)
1. KOSASTHALAIYARKOSASTHALAIYARKOSASTHALAIYARKOSASTHALAIYAR 136 Vellore 154
2. ARANIYARARANIYARARANIYARARANIYAR 108 Sadasivakonda 1040
3. COOVAMCOOVAMCOOVAMCOOVAM 73 Coovam,tiruvallur 76
15151515. MINERAL POTENTIAL OF THE . MINERAL POTENTIAL OF THE . MINERAL POTENTIAL OF THE . MINERAL POTENTIAL OF THE DISTRICT:DISTRICT:DISTRICT:DISTRICT:
Sl.Sl.Sl.Sl.
NoNoNoNo
River or streamRiver or streamRiver or streamRiver or stream Length of Length of Length of Length of
area area area area
recommenrecommenrecommenrecommen
ded for ded for ded for ded for
mineral mineral mineral mineral
concession concession concession concession
(in km)(in km)(in km)(in km)
Average width Average width Average width Average width
of area of area of area of area
recommended for recommended for recommended for recommended for
mineral mineral mineral mineral
concession)concession)concession)concession)
(in m)(in m)(in m)(in m)
Area Area Area Area
recommendrecommendrecommendrecommend
ed for ed for ed for ed for
mineral mineral mineral mineral
concession concession concession concession
(in square (in square (in square (in square
meter)meter)meter)meter)
Mineable Mineral Mineable Mineral Mineable Mineral Mineable Mineral
Potential (in Metric Potential (in Metric Potential (in Metric Potential (in Metric
Tonne) (60% of total Tonne) (60% of total Tonne) (60% of total Tonne) (60% of total
mineral potential)mineral potential)mineral potential)mineral potential)
1.1.1.1. KOSASTHALAIYARKOSASTHALAIYARKOSASTHALAIYARKOSASTHALAIYAR 60.0060.0060.0060.00 100100100100 6666.00x10.00x10.00x10.00x106666 3.63.63.63.6X10X10X10X106666
2.2.2.2. ARANIYARARANIYARARANIYARARANIYAR 50.0050.0050.0050.00 101010100000 5555.00x10.00x10.00x10.00x106666 3333.00x10.00x10.00x10.00x106666

DISTRICT SURVEY REPORT Tiruvallur District
Page | 37
16161616. ECONOMIC IMPACT OF MINING . ECONOMIC IMPACT OF MINING . ECONOMIC IMPACT OF MINING . ECONOMIC IMPACT OF MINING
The mining will generate direct and indirect employment during mining operations.
In general, there will be no adverse effect on human health as no blasting or handling of toxic
material involved in sand mining. All the safety measures will be strictly followed to prevent
occupational risk during excavation, loading and transportation.
The State is highly urbanized State after Maharashtra, the sand mining operation in the
district will be the backbone for infrastructural development besides generate the revenue to
the Government. Since the operation is carrying out by the Public Works Department they
properly identify the aggradation area over the river bed in the district It will be useful to
maintain the hydro geological cross section of the river to carry the maximum flood
discharge.
17171717. CONCLUSION/RECOMMENDATION. CONCLUSION/RECOMMENDATION. CONCLUSION/RECOMMENDATION. CONCLUSION/RECOMMENDATION:
The detailed scientific study reveals that the Kosasthalaiyar River carrying sand sediments
whenever there is sufficient flows along its entire length in the district. This cumulative
sediment has resulted in shoal formation and reduces the carrying capacity of flood. The
properly managed sand mining activities are recommended in Kosasthalaiyar. Hence, it is
concluded that, the permission of sand quarries in the potential areas of river in the district
will be beneficial for infrastructural development of the state of Tamil Nadu.