Chemical analysis of ground water from various parts of Thiruvarur and Nagapattinam district,...
9
Available online at www.pelagiaresearchlibrary.com Pelagia Research Library Der Chemica Sinica, 2014, 5(3):83-91 ISSN: 0976-8505 CODEN (USA) CSHIA5 83 Pelagia Research Library Chemical analysis of ground water from various parts of Thiruvarur and Nagapattinam district, Tamilnadu, India D. Kannan*, N. Mani and S. Thiyagarajan Department of Chemistry, A. V. V. M. Sri Pushpam College, Poondi, Thanjavur _____________________________________________________________________________________________ ABSTRACT The present study consisted of the estimation of some heavy metals and quality of groundwater from Thiruvarur and Nagapattinam district, Tamilnadu(India).The water sample were collected from various parts of Thiruvarur and Nagapattinam region during Jun-2013. The physicochemical parameters such as Ca2+, Mg 2+ ,Cl - were analyzed by titration method. SO 4 2- , Fe 3+ , Al 3+ , NO 3 - , NO 2 - , Cu 2+ ,Mn 2+ , were estimated by spectrophotometric method. Colour of the water sample determined by platinum-cobalt method. TDS of the water sample determined by gravimetrically,PH was estimated by PH meter. Turbidity was estimated by nephelometric method. Data showed the variation of the investigated physicochemical parameters in sample as follows, TDS of groundwater from Thiruvarur and Nagapattinam region rang between 320mg/l – 1830mg/l and 286mg/l – 1110mg/l respectively. The Total alkalinity of ground water from Thiruvarur and Nagapattinam region range between 108mg/l – 486mg/l and 166mg/l – 368mg/l respectively. The concentration of most of the chemical parameters in the drinking water sample from Thiruvarur and Nagapattinam region excess range the permissible limits of the BIS drinking water quality guideline, most of the region water quality was found unsatisfactory for drinking purpose. Key words: Groundwater, Thiruvarur, Nagapattinam, Physicochemical parameters, Tamilnadu _____________________________________________________________________________________________ INDRODUCTION Groundwater has become major source of water supply for domestic, industrial and agricultural sectors of many countries. It is estimated that one third of the world’s populations use groundwater for drinking purpose.Groundwater is regarded to be the most valuable resources needed to sustain human life, animals and plants, urbanization, discharge of industrial effluents,domestic sewage, solid dumping of waste cause the groundwater to because polluted and created health problems. According to WHO, nearly 80% of all the diseases in human beings are caused by water. Variation of groundwater quality in an area is interaction of physical and chemical parameters and anthropogenic activities [13]. chemical analysis of groundwater and study on its pollution impact in and around jammalalmadugu area of YSR, Andhrapradesh district, India. They have analyzed various Physical and Chemical parameters such as p H , EC, TDS, SO 4 2- , NO 3 - , etc., Were determined using standard procedure. It is found that the ground water sample are suitable for drinking purpose in the sampling areas [9]. Physicochemical and Biological analysis of groundwater of rural areas of wardha city, They have analyzed DO, pH, TDS, TA,, etc. It is found that the groundwater samples are suitable for drinking and domestic purpose [2].
Transcript of Chemical analysis of ground water from various parts of Thiruvarur and Nagapattinam district,...
Available online at www.pelagiaresearchlibrary.com
Pelagia Research Library
Der Chemica Sinica, 2014, 5(3):83-91
ISSN: 0976-8505
CODEN (USA) CSHIA5
83 Pelagia Research Library
Chemical analysis of ground water from various parts of Thiruvarur and Nagapattinam district, Tamilnadu, India
D. Kannan*, N. Mani and S. Thiyagarajan
Department of Chemistry, A. V. V. M. Sri Pushpam College, Poondi, Thanjavur _____________________________________________________________________________________________ ABSTRACT The present study consisted of the estimation of some heavy metals and quality of groundwater from Thiruvarur and Nagapattinam district, Tamilnadu(India).The water sample were collected from various parts of Thiruvarur and Nagapattinam region during Jun-2013. The physicochemical parameters such as Ca2+, Mg2+,Cl- were analyzed by titration method. SO4
2-, Fe3+, Al3+, NO3-, NO2
-, Cu2+,Mn2+, were estimated by spectrophotometric method. Colour of the water sample determined by platinum-cobalt method. TDS of the water sample determined by gravimetrically,PH was estimated by PH meter. Turbidity was estimated by nephelometric method. Data showed the variation of the investigated physicochemical parameters in sample as follows, TDS of groundwater from Thiruvarur and Nagapattinam region rang between 320mg/l – 1830mg/l and 286mg/l – 1110mg/l respectively. The Total alkalinity of ground water from Thiruvarur and Nagapattinam region range between 108mg/l – 486mg/l and 166mg/l – 368mg/l respectively. The concentration of most of the chemical parameters in the drinking water sample from Thiruvarur and Nagapattinam region excess range the permissible limits of the BIS drinking water quality guideline, most of the region water quality was found unsatisfactory for drinking purpose. Key words: Groundwater, Thiruvarur, Nagapattinam, Physicochemical parameters, Tamilnadu _____________________________________________________________________________________________
INDRODUCTION
Groundwater has become major source of water supply for domestic, industrial and agricultural sectors of many countries. It is estimated that one third of the world’s populations use groundwater for drinking purpose.Groundwater is regarded to be the most valuable resources needed to sustain human life, animals and plants, urbanization, discharge of industrial effluents,domestic sewage, solid dumping of waste cause the groundwater to because polluted and created health problems. According to WHO, nearly 80% of all the diseases in human beings are caused by water. Variation of groundwater quality in an area is interaction of physical and chemical parameters and anthropogenic activities [13]. chemical analysis of groundwater and study on its pollution impact in and around jammalalmadugu area of YSR, Andhrapradesh district, India. They have analyzed various Physical and Chemical parameters such as pH, EC, TDS, SO4
2-, NO3-, etc., Were determined using standard procedure. It is found that the ground water sample are suitable
for drinking purpose in the sampling areas [9]. Physicochemical and Biological analysis of groundwater of rural areas of wardha city, They have analyzed DO, pH, TDS, TA,, etc. It is found that the groundwater samples are suitable for drinking and domestic purpose [2].
D. Kannan et al Der Chemica Sinica, 2014, 5(3):83-91 _____________________________________________________________________________
84 Pelagia Research Library
Generally water is polluted on all the surface of earth. All metabolic and physiological activities and life process of aquatic organisms are generally influenced by such polluted waste and hence, it is essential to study physic-chemical characterctics of groundwater [8]. Chemical analysis of ground water and study on its pollution impact in and around Papanasam and Orathanadu areas of Thanjavur district in India, they have analyzed pH , TDS, Fe3+, Cu2+, etc. It is found that the ground water sample are suitable for drinking purpose. [3]. Physicochemical analysis of groundwater samples of BICHI local government area of KANO state of Nigeria.They have analyzed various physical and chemical parameters such as PH, TA, TH, Ca2+, Fe3+, Mg2+, TDS, etc. comparison with WHO and SON Standard. It was shown that the parameters from the water samples were within WHO and SON permissible limit for groundwater which satisfy the safety limit for its use for various purposes like domestic, agricultural, and industrial purpose [4]. In this study involve the determination of Fe3+,Cu2+,Al3+ ions in drinking water sample from various part of Thiruvarur and Nagapattinam region.Some physical and chemical properties of the samples were also determined by BIS analytical method.
MATERIALS AND METHODS
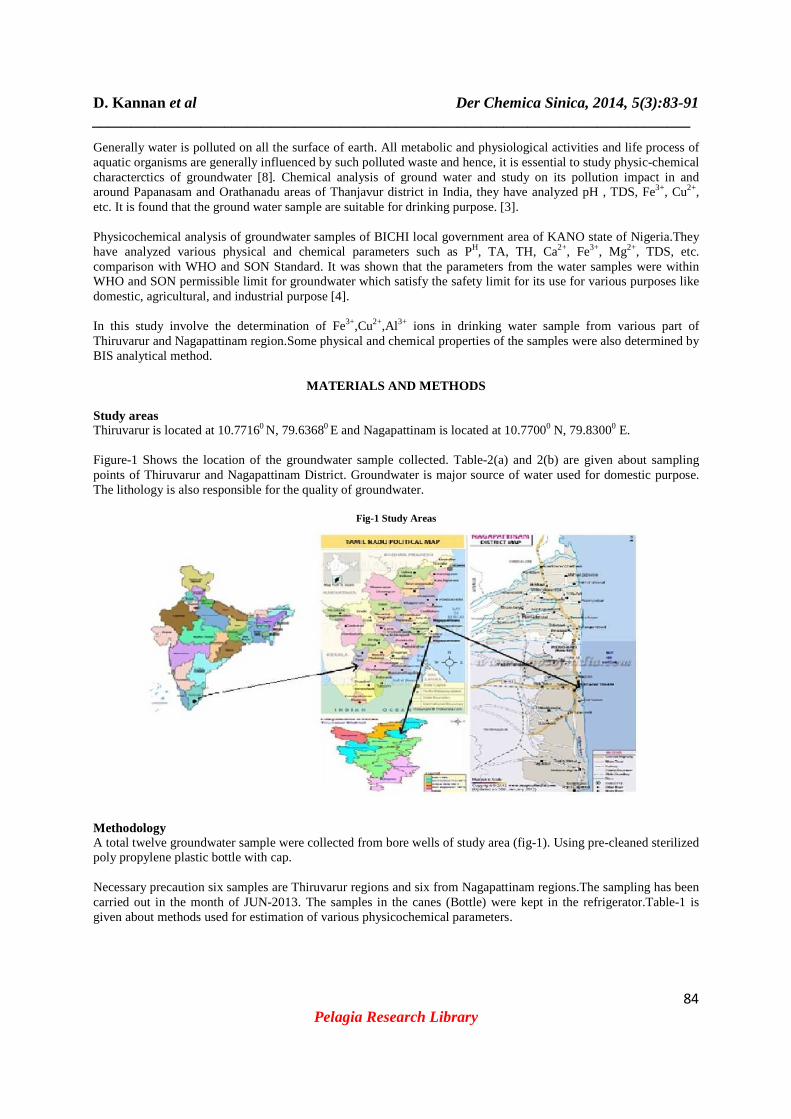
Study areas Thiruvarur is located at 10.77160 N, 79.63680 E and Nagapattinam is located at 10.77000 N, 79.83000 E. Figure-1 Shows the location of the groundwater sample collected. Table-2(a) and 2(b) are given about sampling points of Thiruvarur and Nagapattinam District. Groundwater is major source of water used for domestic purpose. The lithology is also responsible for the quality of groundwater.
Fig-1 Study Areas
Methodology A total twelve groundwater sample were collected from bore wells of study area (fig-1). Using pre-cleaned sterilized poly propylene plastic bottle with cap. Necessary precaution six samples are Thiruvarur regions and six from Nagapattinam regions.The sampling has been carried out in the month of JUN-2013. The samples in the canes (Bottle) were kept in the refrigerator.Table-1 is given about methods used for estimation of various physicochemical parameters.
D. Kannan et al _____________________________________________________________________________
The various physicochemical parameters of groundwater collected from Thiruvarur and Nagapattinum region and its range (concentration) are presented in table 3, 4, 5 and 6 Hydrogen Ion Concentration (pH):pH is an important measurement of water. Dissolved gases such as also affect the pH of water. pH belregion ranges from 6.69 to 8.12 and iregion pH value lie in the BIS desirable limits (6.5 Total Dissolved Solids (TDS): Many dissolved substance are undesirable in water. Disaesthetically displeasing colour, taste and odour. The Total Dissolved Solids of Thiruvarur and Nagapattinam region groundwater range between 320mg/l and 286mg/l – 1110mg/l respectivelyregion and sample number S2, S3, S6 of TDS is high in Nagapattinam region.( Table drinking water is more than 2000mg/l it would result to affect gastro intestinal irritat
Figure 2: pH Variation of the Study Area Figure 3: TDS Variation of the Study
Temperature: The temperature is an essential factor in the determination of other temperature of the water sample was recorded in 32.0and Nagapattinam region respectively.( Table Colour: Colour in water may be due to the inorganic ions, such as iron and manganese, fine particles in suspension, plankton and industrial wastes. The colour unit value inThiruvarur and Nagapattinam region range from 0 to 0.08 HU and 0.08 – 0.16HU respectively (Table-3 and 5) Odour and Taste: Odour is recognized as a quality factor affecting of drinking water most organic and inorganic chemicals originating from domestic wastes and decomposition of vegetable mater contribute taste and odour to the water. All groundwater samples had agreeable od
0
2
4
6
8
10
S1 S2 S3 S4
pH
Sample No
Thiruvarur RegionNagapattinam Region
Der Chemica Sinica, 2014, 5(3):_____________________________________________________________________________
Pelagia Research Library
RESULTS AND DISCUSSION
parameters of groundwater collected from Thiruvarur and Nagapattinum region and its ration) are presented in table 3, 4, 5 and 6 respectively.
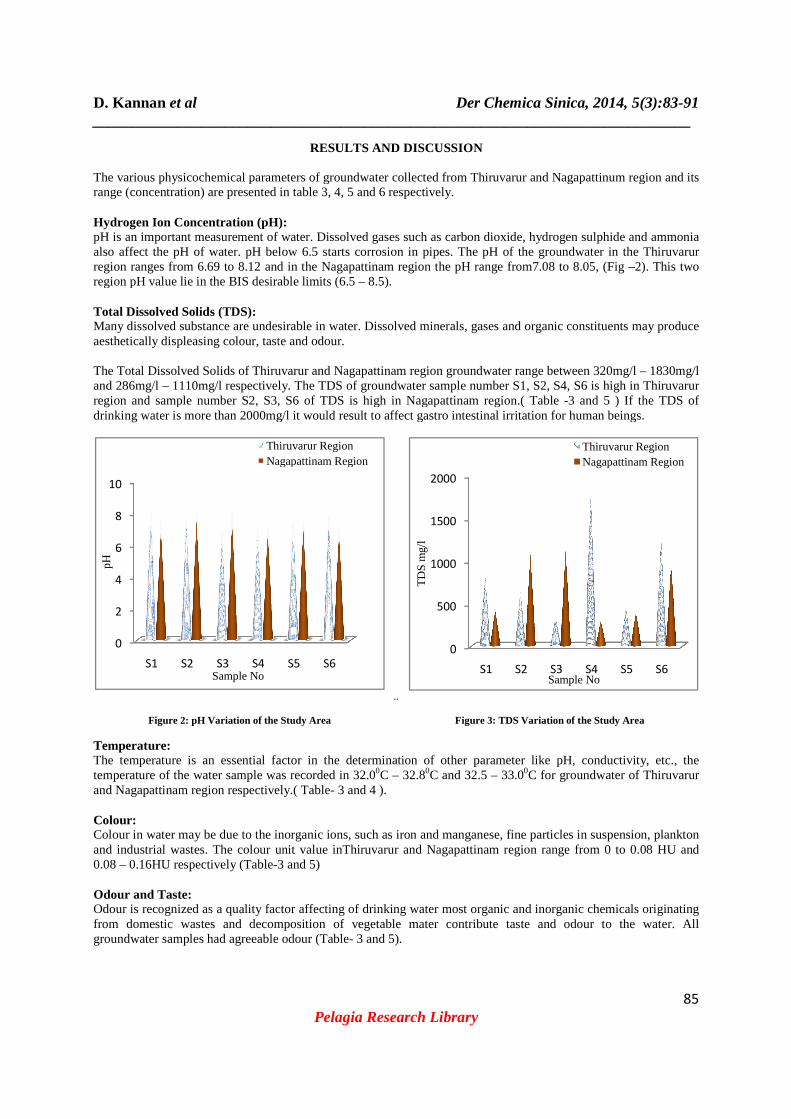
Concentration (pH): pH is an important measurement of water. Dissolved gases such as carbon dioxide, hydrogen sulphide
pH below 6.5 starts corrosion in pipes. The pH of the groundwater in the Thiruvarur from 6.69 to 8.12 and in the Nagapattinam region the pH range from7.08 to 8.05, (Fi
region pH value lie in the BIS desirable limits (6.5 – 8.5).
e are undesirable in water. Dissolved minerals, gases and organic constituents may produce aesthetically displeasing colour, taste and odour.
The Total Dissolved Solids of Thiruvarur and Nagapattinam region groundwater range between 320mg/l 1110mg/l respectively. The TDS of groundwater sample number S1, S2, S4, S6 is high in Thiruvarur
sample number S2, S3, S6 of TDS is high in Nagapattinam region.( Table 2000mg/l it would result to affect gastro intestinal irritation for human beings.
..
Figure 2: pH Variation of the Study Area Figure 3: TDS Variation of the Study
The temperature is an essential factor in the determination of other parameter like pH, conductivity, etc., the temperature of the water sample was recorded in 32.00C – 32.80C and 32.5 – 33.00C for groundwater of Thiruvarur and Nagapattinam region respectively.( Table- 3 and 4 ).
norganic ions, such as iron and manganese, fine particles in suspension, plankton and industrial wastes. The colour unit value inThiruvarur and Nagapattinam region range from 0 to 0.08 HU and
3 and 5)
Odour is recognized as a quality factor affecting of drinking water most organic and inorganic chemicals originating from domestic wastes and decomposition of vegetable mater contribute taste and odour to the water. All groundwater samples had agreeable odour (Table- 3 and 5).
S5 S6
Thiruvarur RegionNagapattinam Region
0
500
1000
1500
2000
S1 S2 S3
TD
S m
g/l
Sample No
Der Chemica Sinica, 2014, 5(3):83-91 _____________________________________________________________________________
85
parameters of groundwater collected from Thiruvarur and Nagapattinum region and its
carbon dioxide, hydrogen sulphide and ammonia pH of the groundwater in the Thiruvarur
from7.08 to 8.05, (Fig –2). This two
gases and organic constituents may produce
The Total Dissolved Solids of Thiruvarur and Nagapattinam region groundwater range between 320mg/l – 1830mg/l oundwater sample number S1, S2, S4, S6 is high in Thiruvarur
sample number S2, S3, S6 of TDS is high in Nagapattinam region.( Table -3 and 5 ) If the TDS of ion for human beings.
Figure 2: pH Variation of the Study Area Figure 3: TDS Variation of the Study Area
parameter like pH, conductivity, etc., the C for groundwater of Thiruvarur
norganic ions, such as iron and manganese, fine particles in suspension, plankton and industrial wastes. The colour unit value inThiruvarur and Nagapattinam region range from 0 to 0.08 HU and
Odour is recognized as a quality factor affecting of drinking water most organic and inorganic chemicals originating from domestic wastes and decomposition of vegetable mater contribute taste and odour to the water. All
S3 S4 S5 S6Sample No
Thiruvarur RegionNagapattinam Region
D. Kannan et al Der Chemica Sinica, 2014, 5(3):83-91 _____________________________________________________________________________
86 Pelagia Research Library
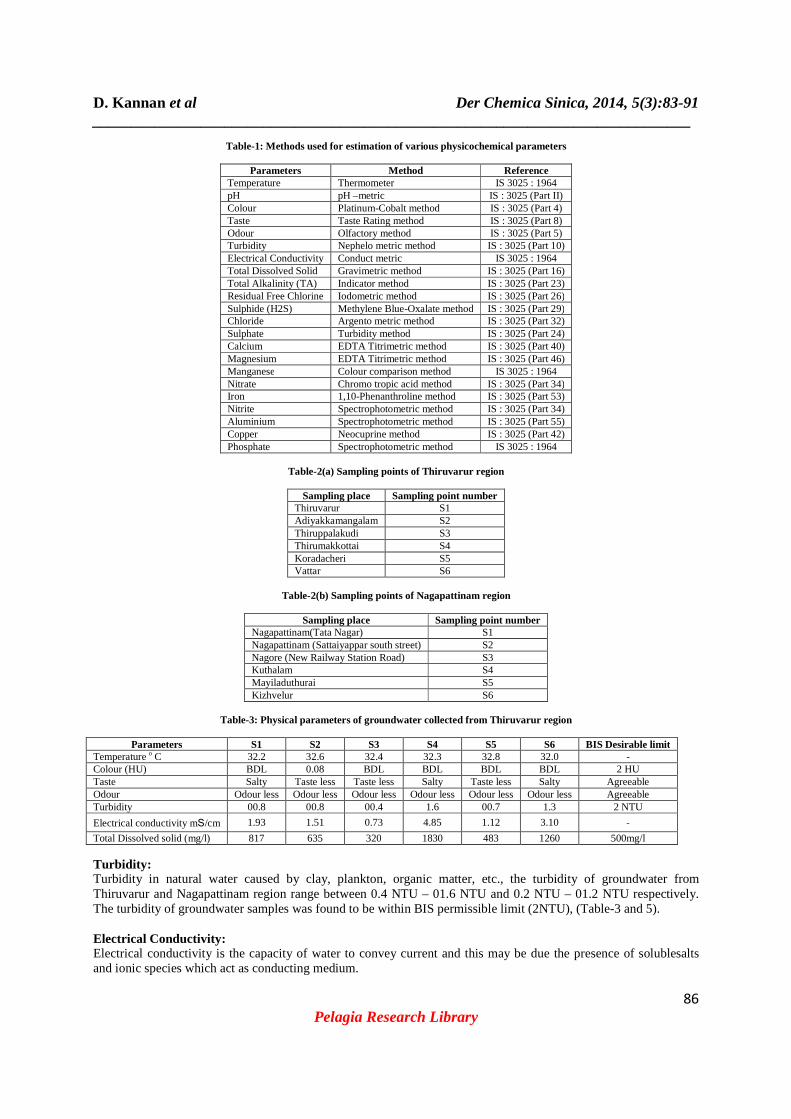
Table-1: Methods used for estimation of various physicochemical parameters
Parameters Method Reference Temperature Thermometer IS 3025 : 1964 pH pH –metric IS : 3025 (Part II) Colour Platinum-Cobalt method IS : 3025 (Part 4) Taste Taste Rating method IS : 3025 (Part 8) Odour Olfactory method IS : 3025 (Part 5) Turbidity Nephelo metric method IS : 3025 (Part 10) Electrical Conductivity Conduct metric IS 3025 : 1964 Total Dissolved Solid Gravimetric method IS : 3025 (Part 16) Total Alkalinity (TA) Indicator method IS : 3025 (Part 23) Residual Free Chlorine Iodometric method IS : 3025 (Part 26) Sulphide (H2S) Methylene Blue-Oxalate method IS : 3025 (Part 29) Chloride Argento metric method IS : 3025 (Part 32) Sulphate Turbidity method IS : 3025 (Part 24) Calcium EDTA Titrimetric method IS : 3025 (Part 40) Magnesium EDTA Titrimetric method IS : 3025 (Part 46) Manganese Colour comparison method IS 3025 : 1964 Nitrate Chromo tropic acid method IS : 3025 (Part 34) Iron 1,10-Phenanthroline method IS : 3025 (Part 53) Nitrite Spectrophotometric method IS : 3025 (Part 34) Aluminium Spectrophotometric method IS : 3025 (Part 55) Copper Neocuprine method IS : 3025 (Part 42) Phosphate Spectrophotometric method IS 3025 : 1964
Table-2(a) Sampling points of Thiruvarur region
Sampling place Sampling point number
Thiruvarur S1 Adiyakkamangalam S2 Thiruppalakudi S3 Thirumakkottai S4 Koradacheri S5 Vattar S6
Table-2(b) Sampling points of Nagapattinam region
Sampling place Sampling point number
Nagapattinam(Tata Nagar) S1 Nagapattinam (Sattaiyappar south street) S2 Nagore (New Railway Station Road) S3 Kuthalam S4 Mayiladuthurai S5 Kizhvelur S6
Table-3: Physical parameters of groundwater collected from Thiruvarur region
Parameters S1 S2 S3 S4 S5 S6 BIS Desirable limit
Temperature o C 32.2 32.6 32.4 32.3 32.8 32.0 - Colour (HU) BDL 0.08 BDL BDL BDL BDL 2 HU Taste Salty Taste less Taste less Salty Taste less Salty Agreeable Odour Odour less Odour less Odour less Odour less Odour less Odour less Agreeable Turbidity 00.8 00.8 00.4 1.6 00.7 1.3 2 NTU
Electrical conductivity mS/cm 1.93 1.51 0.73 4.85 1.12 3.10 -
Total Dissolved solid (mg/l) 817 635 320 1830 483 1260 500mg/l
Turbidity: Turbidity in natural water caused by clay, plankton, organic matter, etc., the turbidity of groundwater from Thiruvarur and Nagapattinam region range between 0.4 NTU – 01.6 NTU and 0.2 NTU – 01.2 NTU respectively. The turbidity of groundwater samples was found to be within BIS permissible limit (2NTU), (Table-3 and 5). Electrical Conductivity: Electrical conductivity is the capacity of water to convey current and this may be due the presence of solublesalts and ionic species which act as conducting medium.
D. Kannan et al _____________________________________________________________________________
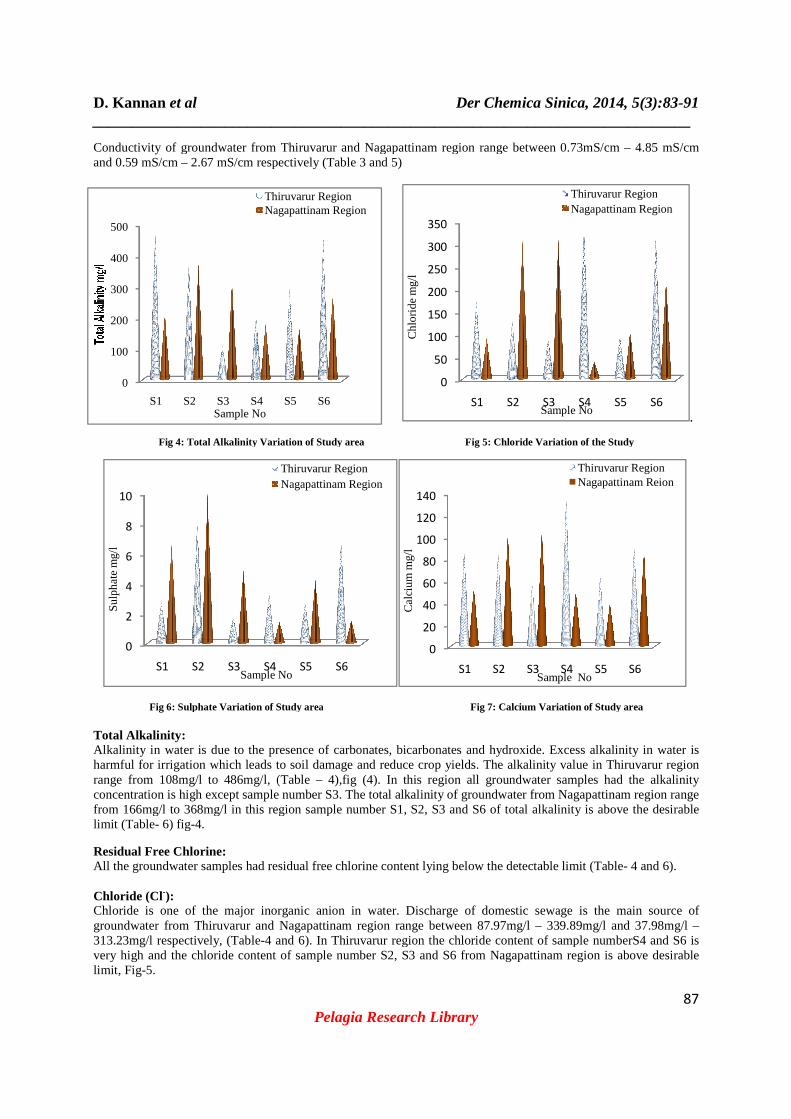
Conductivity of groundwater from Thiruvarur and Nagapattinam region range between 0.73mS/cm and 0.59 mS/cm – 2.67 mS/cm respectively (Table 3 and 5)
Fig 4: Total Alkalinity Variation of Study area
Fig 6: Sulphate Variation of Study area Total Alkalinity: Alkalinity in water is due to the presence of carbonates, bicarbonates and hydroxide. Excess harmful for irrigation which leads to soil damage and reduce crop yields. The alkalinity value in Thiruvarur region range from 108mg/l to 486mg/l, (Table concentration is high except sample number S3. The total alkalinity of groundwater from Nagapattinam region range from 166mg/l to 368mg/l in this region sample number S1, S2, S3 and S6 of total alkalinity is above the desirable limit (Table- 6) fig-4.
Residual Free Chlorine: All the groundwater samples had residual free chlorine content lying below the detectable limit (Table Chloride (Cl-): Chloride is one of the major inorganic anion in water. Discharge of domestic sewage is the main source of groundwater from Thiruvarur and Nagapattinam region range between 87.97mg/l 313.23mg/l respectively, (Table-4 and 6). In Thiruvarur region the chloride content of sample numberS4 and S6 is very high and the chloride content of sampllimit, Fig-5.
0
2
4
6
8
10
S1 S2 S3 S4
Su
lph
ate
mg/
l
Sample No
0
100
200
300
400
500
S1 S2 S3 S4Sample No
Thiruvarur RegionNagapattinam Region
Der Chemica Sinica, 2014, 5(3):_____________________________________________________________________________
Pelagia Research Library
of groundwater from Thiruvarur and Nagapattinam region range between 0.73mS/cm 2.67 mS/cm respectively (Table 3 and 5)
nity Variation of Study area Fig 5: Chloride Variation of the Study
ulphate Variation of Study area Fig 7: Calcium Variation of Study area
Alkalinity in water is due to the presence of carbonates, bicarbonates and hydroxide. Excess harmful for irrigation which leads to soil damage and reduce crop yields. The alkalinity value in Thiruvarur region range from 108mg/l to 486mg/l, (Table – 4),fig (4). In this region all groundwater samples had the alkalinity
ration is high except sample number S3. The total alkalinity of groundwater from Nagapattinam region range from 166mg/l to 368mg/l in this region sample number S1, S2, S3 and S6 of total alkalinity is above the desirable
All the groundwater samples had residual free chlorine content lying below the detectable limit (Table
Chloride is one of the major inorganic anion in water. Discharge of domestic sewage is the main source of dwater from Thiruvarur and Nagapattinam region range between 87.97mg/l – 339.89mg/l and 37.98mg/l
4 and 6). In Thiruvarur region the chloride content of sample numberS4 and S6 is very high and the chloride content of sample number S2, S3 and S6 from Nagapattinam region is above desirable
0
50
100
150
200
250
300
350
S1 S2 S3C
hlo
rid
e m
g/l
Sample No
S5 S6Sample No
Thiruvarur RegionNagapattinam Region
0
20
40
60
80
100
120
140
S1 S2 S3
Ca
lciu
m m
g/l
Sample No
S5 S6
Thiruvarur RegionNagapattinam Region
Der Chemica Sinica, 2014, 5(3):83-91 _____________________________________________________________________________
87
of groundwater from Thiruvarur and Nagapattinam region range between 0.73mS/cm – 4.85 mS/cm
.
e Variation of the Study
Calcium Variation of Study area
Alkalinity in water is due to the presence of carbonates, bicarbonates and hydroxide. Excess alkalinity in water is harmful for irrigation which leads to soil damage and reduce crop yields. The alkalinity value in Thiruvarur region
4),fig (4). In this region all groundwater samples had the alkalinity ration is high except sample number S3. The total alkalinity of groundwater from Nagapattinam region range
from 166mg/l to 368mg/l in this region sample number S1, S2, S3 and S6 of total alkalinity is above the desirable
All the groundwater samples had residual free chlorine content lying below the detectable limit (Table- 4 and 6).
Chloride is one of the major inorganic anion in water. Discharge of domestic sewage is the main source of 339.89mg/l and 37.98mg/l –
4 and 6). In Thiruvarur region the chloride content of sample numberS4 and S6 is e number S2, S3 and S6 from Nagapattinam region is above desirable
S4 S5 S6Sample No
Thiruvarur RegionNagapattinam Region
S4 S5 S6Sample No
Thiruvarur RegionNagapattinam Reion
D. Kannan et al _____________________________________________________________________________
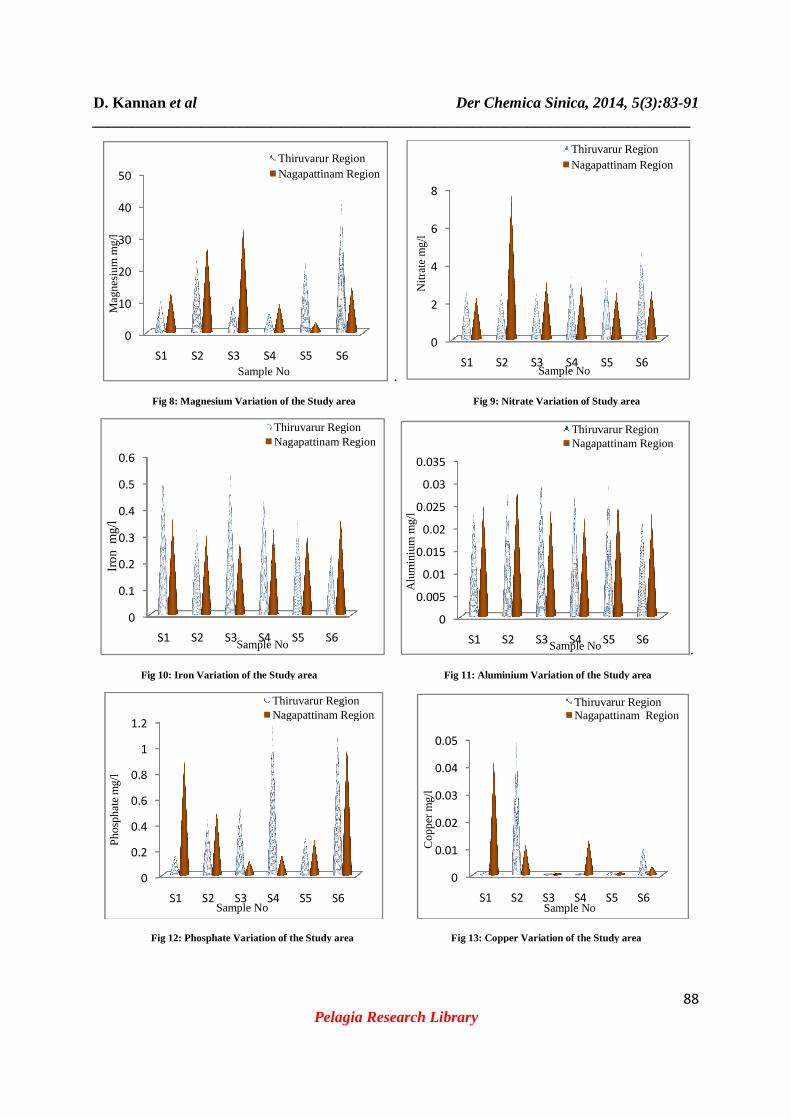
Fig 8: Magnesium Variation of the Study area
Fig 10: Iron Variation of the Study
Fig 12: Phosphate Variation of the Study area
0
10
20
30
40
50
S1 S2 S3 S4
Ma
gnes
ium
mg/
l
Sample No
Thiruvarur RegionNagapattinam Region
0
0.1
0.2
0.3
0.4
0.5
0.6
S1 S2 S3 S4
Iro
n m
g/l
Sample No
Thiruvarur RegionNagapattinam Region
0
0.2
0.4
0.6
0.8
1
1.2
S1 S2 S3 S4
Ph
osp
ha
te m
g/l
Sample No
Thiruvarur RegionNagapattinam Region
Der Chemica Sinica, 2014, 5(3):_____________________________________________________________________________
Pelagia Research Library
.
ium Variation of the Study area Fig 9: Nitrate Variation of Study area
ron Variation of the Study area Fig 11: Aluminium Variation of the Study area
ate Variation of the Study area Fig 13: Copper Variation of the Study area
S5 S6
Sample No
Thiruvarur RegionNagapattinam Region
0
2
4
6
8
S1 S2 S3
Nitr
ate
mg
/l
Sample No
S5 S6Sample No
Thiruvarur RegionNagapattinam Region
0
0.005
0.01
0.015
0.02
0.025
0.03
0.035
S1 S2 S3
Alu
min
ium
mg/
l
Sample No
S4 S5 S6
Thiruvarur RegionNagapattinam Region
0
0.01
0.02
0.03
0.04
0.05
S1 S2 S3
Co
pp
erm
g/l
Sample No
Der Chemica Sinica, 2014, 5(3):83-91 _____________________________________________________________________________
88
Nitrate Variation of Study area
.
ium Variation of the Study area
per Variation of the Study area
S4 S5 S6Sample No
Thiruvarur RegionNagapattinam Region
S4 S5 S6Sample No
Thiruvarur RegionNagapattinam Region
S4 S5 S6Sample No
Thiruvarur RegionNagapattinam Region
D. Kannan et al Der Chemica Sinica, 2014, 5(3):83-91 _____________________________________________________________________________
89 Pelagia Research Library
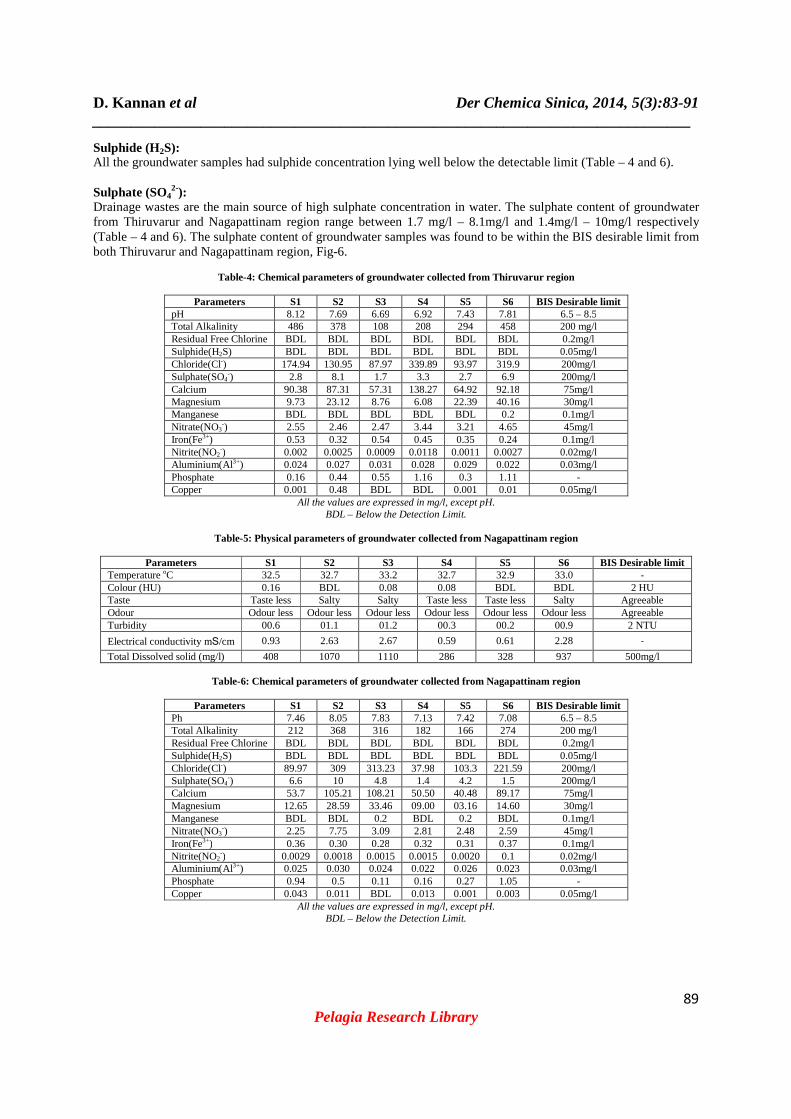
Sulphide (H2S): All the groundwater samples had sulphide concentration lying well below the detectable limit (Table – 4 and 6). Sulphate (SO4
2-): Drainage wastes are the main source of high sulphate concentration in water. The sulphate content of groundwater from Thiruvarur and Nagapattinam region range between 1.7 mg/l – 8.1mg/l and 1.4mg/l – 10mg/l respectively (Table – 4 and 6). The sulphate content of groundwater samples was found to be within the BIS desirable limit from both Thiruvarur and Nagapattinam region, Fig-6.
Table-4: Chemical parameters of groundwater collected from Thiruvarur region
Parameters S1 S2 S3 S4 S5 S6 BIS Desirable limit
pH 8.12 7.69 6.69 6.92 7.43 7.81 6.5 – 8.5 Total Alkalinity 486 378 108 208 294 458 200 mg/l Residual Free Chlorine BDL BDL BDL BDL BDL BDL 0.2mg/l Sulphide(H2S) BDL BDL BDL BDL BDL BDL 0.05mg/l Chloride(Cl-) 174.94 130.95 87.97 339.89 93.97 319.9 200mg/l Sulphate(SO4-) 2.8 8.1 1.7 3.3 2.7 6.9 200mg/l Calcium 90.38 87.31 57.31 138.27 64.92 92.18 75mg/l Magnesium 9.73 23.12 8.76 6.08 22.39 40.16 30mg/l Manganese BDL BDL BDL BDL BDL 0.2 0.1mg/l Nitrate(NO3
-) 2.55 2.46 2.47 3.44 3.21 4.65 45mg/l Iron(Fe3+) 0.53 0.32 0.54 0.45 0.35 0.24 0.1mg/l Nitrite(NO2
-) 0.002 0.0025 0.0009 0.0118 0.0011 0.0027 0.02mg/l Aluminium(Al3+) 0.024 0.027 0.031 0.028 0.029 0.022 0.03mg/l Phosphate 0.16 0.44 0.55 1.16 0.3 1.11 - Copper 0.001 0.48 BDL BDL 0.001 0.01 0.05mg/l
All the values are expressed in mg/l, except pH. BDL – Below the Detection Limit.
Table-5: Physical parameters of groundwater collected from Nagapattinam region
Parameters S1 S2 S3 S4 S5 S6 BIS Desirable limit
Temperature oC 32.5 32.7 33.2 32.7 32.9 33.0 - Colour (HU) 0.16 BDL 0.08 0.08 BDL BDL 2 HU Taste Taste less Salty Salty Taste less Taste less Salty Agreeable Odour Odour less Odour less Odour less Odour less Odour less Odour less Agreeable Turbidity 00.6 01.1 01.2 00.3 00.2 00.9 2 NTU
Electrical conductivity mS/cm 0.93 2.63 2.67 0.59 0.61 2.28 -
Total Dissolved solid (mg/l) 408 1070 1110 286 328 937 500mg/l
Table-6: Chemical parameters of groundwater collected from Nagapattinam region
Parameters S1 S2 S3 S4 S5 S6 BIS Desirable limit Ph 7.46 8.05 7.83 7.13 7.42 7.08 6.5 – 8.5 Total Alkalinity 212 368 316 182 166 274 200 mg/l Residual Free Chlorine BDL BDL BDL BDL BDL BDL 0.2mg/l Sulphide(H2S) BDL BDL BDL BDL BDL BDL 0.05mg/l Chloride(Cl-) 89.97 309 313.23 37.98 103.3 221.59 200mg/l Sulphate(SO4-) 6.6 10 4.8 1.4 4.2 1.5 200mg/l Calcium 53.7 105.21 108.21 50.50 40.48 89.17 75mg/l Magnesium 12.65 28.59 33.46 09.00 03.16 14.60 30mg/l Manganese BDL BDL 0.2 BDL 0.2 BDL 0.1mg/l Nitrate(NO3
-) 2.25 7.75 3.09 2.81 2.48 2.59 45mg/l Iron(Fe3+) 0.36 0.30 0.28 0.32 0.31 0.37 0.1mg/l Nitrite(NO2
-) 0.0029 0.0018 0.0015 0.0015 0.0020 0.1 0.02mg/l Aluminium(Al3+) 0.025 0.030 0.024 0.022 0.026 0.023 0.03mg/l Phosphate 0.94 0.5 0.11 0.16 0.27 1.05 - Copper 0.043 0.011 BDL 0.013 0.001 0.003 0.05mg/l
All the values are expressed in mg/l, except pH. BDL – Below the Detection Limit.
D. Kannan et al Der Chemica Sinica, 2014, 5(3):83-91 _____________________________________________________________________________
90 Pelagia Research Library
Calcium(Ca2+): The calcium content was recorded in 57.31mg/l – 138mg/l and 40.48mg/l – 108.21mg/l for groundwater of thiruvarur and nagapattinam region respectively (Table – 4 and 6), fig-7. Magnesium (Mg2+): The magnesium was recorded in 6.08mg/l – 40.16mg/l and 3.16mg/l –33.46mg/l for groundwater of Thiruvarur and Nagapattinam regions respectively. The magnesium content of sample number S6 from Thiruvarur region is above the desirable limit and the sample number S3 from Nagapattinam region groundwater to reach desirable limit (Table 4 and 6) Fig- 8. Manganese (Mn2+): The manganese content of all the groundwater sample bellow the detectable limit except sample number S6 from Thiruvarur region and sample number S3 and S5 from Nagapattinam region is above the desirable limit (Taable-4 and 6). Nitrate (NO3
-): This is highest oxidized form of nitrogen. Low quantity of nitrate present in surface water, but may attain high level in some groundwater. The nitrate was recorded in 2.46mg/l – 4.65mg/l and 2.25mg/l – 7.75mg/l for groundwater of Thiruvarur and Nagapattinam region respectively. The nitrate of groundwater sample was found to be within the BIS permissible limit (45mg/l) (Table-4 and 6) fig-9. Iron (Fe3+): Iron is an essential element in human nutrition. Iron usually exits in ferrous and ferric forms. Generally the region range between 0.24mg/l – 0.54mg/l and 0.28mg/l – 0.37mg/l respectively. The iron content of all groundwater samples from both the regions is more than BIS permissible limit. (Table – 4 and 6) Iron variation of the study area shown in the fig – 10. Nitrite (NO2
-): Nitrite in water is due to incomplete oxidation of organic matter containing nitrogen. The nitrite content of groundwater from Thiruvarur and Nagapattinam region range between 0.0009mg/l – 0.0029mg/l and 0.0015mg/l – 0.1mg/l respectively (Table-4 and 6). The nitrite content of groundwater in Thiruvarur regions is well within the desirable limit of BIS (0.02mg/l) but the sample number S6 from Nagapattinam region nitrite content of groundwater is more than desirable limit of BIS drinking water quality guideline. Aluminium (Al3+): The aluminium content of groundwater from Thiruvarur and Nagapattinam regions range between 0.022mg/l – 0.03mg/l and 0.022mg/l – 0.030mg/l respectively. The aluminium concentration of groundwater was found to be within the desirable limit from both Thiruvarur and Nagapattinam region (Table -4 and 6) fig-11. Phosphate: Phosphate content naturally occurs as inorganic (or) organic phosphate form. Domestic sewage, agricultural effluent and detergents are the main source of phosphate in water. Phosphate was recorded in 0.16mg/l - 1.16mg/l and 0.1mg/l – 1.05mg/l for groundwater of Thiruvarur and Nagapattinam regions respectively, (Table-4 and 6) Fig-12. Copper: The copper content of groundwater from Thiruvarur and Nagapattinam region range between 0 – 0.048mg/l and 0 – 0.043mg/l respectively (Table-4 and 6). The copper content of groundwater was found to be within the BIS desirable limit from both Thiruvarur and Nagapattinam region respectively, fig-13.
CONCLUSION
In conclusion, the concentration of the investigated major ions in the drinking water samples from various part of Thiruvarur and Nagapattinam region, Tamilnadu (India). In most of the groundwater samples of TDS, TA, Ca2+, Fe3+ are high from both Thiruvarur and Nagapattinam regions. The estimated parameters were compared with BIS drinking water quality guideline. The physicochemical analysis of water samples concluded that the water quality of
D. Kannan et al Der Chemica Sinica, 2014, 5(3):83-91 _____________________________________________________________________________
91 Pelagia Research Library
these two regions most of the areas groundwater is not suitable for drinking purpose. The human beings of that two region are suffering with various diseases like gastro intestinal irritations and skin irritation. Rainwater harvesting is one of the solution to minimize the heavy metals concentration in drinking water.
REFERENCES
[1] BIS: 3025(1964) Method of sampling and test (Physical and Chemical) for water used in industry. [2] Dr. P. B. Nagarnaik, Mr.Pankaj N. Patil, International Journal of Engineering Research and Application, 2012, 803, 2. [3] D.Kannan, N. Mani, K.Mohamad faizal and S.Dharmambal, Int. Journal of Chemistry Environment and Technology, 2013, 54, 1 [4] Emmanuel Bernard and Nurudeen Ayeni, ARPN Journal of Science and Technology, 2012, 325, 2. [5] Gaur. S. Joshi M.C, Saxena S.K and Dutt H. K, Journal of Applied Pharmaceutical Science, 2011, 166, 1. [6] IS: 3025 – Methods of sampling and test (Physical and Chemical) for water and waste water. [7] ISI – Indian Standard Drinking water specification, New Delhi. [8] I. M. Adekunel, M.T.Adetunji,A, M, Gbadebo, O.B.Banjoko, India. Int. Journal of Environ Research Public Health, 2007, 307, 4. [9] K. Saravanakumar and R. Ranjithkumar, Indian Journal of Science Technology, 2011, 660, 4. [10] K .Mohammad Rafi, N. Md. Akram, M. Uma Mahesh, T. Ramachar, Int. Journal of African studies, 2011, 41, 4. [11] M. K .Singh, Dhaneshwar Jha and Jyoti Jadoun, Int. Journal of Applied and Natural Science, 2012, 33, 1. [12] M. Ramesh, E. Dharmaraj and B. Jose Ravindraraj, Advance in Applied Science Research, 2012, 1709, 3. [13] Priyankatrivedi, Amitabajpai, sukarmathareja, J. Nature and science, 2010, 11, 8. [14] Subramani T. Elango L, Damodarasamy SR, Journal of Environ Geol, 2005, 1099, 47.