Back-calculating length from skeletal growth marks in loggerhead sea turtlesCaretta caretta
10
ENDANGERED SPECIES RESEARCH Endang Species Res INTRODUCTION Over the course of their lives, most sea turtle species migrate extensively, with juveniles making trans- oceanic migrations (Carr 1987, Bolten et al. 1998) and occupying a variety of different habitats. This migra- tory existence, combined with lengthy individual life- spans (Heppell et al. 2002), makes sea turtle mark– recapture studies difficult, as a large investment in time and money is needed to begin to understand even mean growth rates on a population scale. Although analyses of mark–recapture data have provided criti- cal information about sea turtle growth (for examples see Chaloupka & Limpus 1997, Balazs & Chaloupka 2004), multi-year growth trajectories are needed for individual turtles to understand variability in growth rates over time and among turtles. Skeletochronology, the technique of using growth marks in skeletal structures to obtain life-history infor- mation, is becoming a standard method for the assess- ment of individual growth trajectories in sea turtles (Bjorndal et al. 2003). The annual nature of skeletal growth marks has been directly validated in numerous amphibians and reptiles (see Castanet et al. 1993 for © Inter-Research 2007 · www.int-res.com *Email: [email protected] Back-calculating length from skeletal growth marks in loggerhead sea turtles Caretta caretta Melissa L. Snover 1, 2, *, Larisa Avens 3 , Aleta A. Hohn 3 1 Duke University Marine Laboratory, 135 Duke Marine Lab Road, Beaufort, North Carolina 28516, USA 2 NOAA Fisheries, Southwest Fisheries Science Center, Environmental Research Division, 1352 Lighthouse Avenue, Pacific Grove, California 93950, USA 3 NOAA Fisheries, Southeast Fisheries Science Center, Center for Coastal Fisheries and Habitat Research, 101 Pivers Island Road, Beaufort, North Carolina 28516, USA ABSTRACT: Growth rates within and among sea turtles are highly variable, and gaining an under- standing of this variability is difficult using traditional means, such as mark–recapture. Skeleto- chronology is becoming a standard technique for the assessment of individual growth rates in sea tur- tles. Here we present an analysis of the relationship between humerus diameter and somatic growth in loggerhead sea turtles Caretta caretta, demonstrating that this relationship is allometric, with a steeper slope for small pelagic turtles and a gentler slope for larger neritic turtles. We compare this relationship to models fit to neritic turtle data only and validate the ability of this relationship to accu- rately back-calculate carapace lengths from diameters of skeletal growth marks using 12 neritic, juvenile loggerheads that were captured, tagged, released, and subsequently recovered as dead strandings. We estimated the length at capture by back-calculation, using the diameter of the skele- tal growth mark most representative of the time of capture as a predictor. The mean difference between the measured carapace length at capture and the estimated carapace length obtained through back-calculation was 0.6 cm ± 0.2 SE. For corresponding estimates of annual growth rate, the mean error was 0.2 cm yr –1 ± 0.05 SE. Although we were unable to validate the back-calculation equation for pelagic turtles, we provide indirect evidence that this equation will allow for back- calculation of sizes through this stage. We suggest that, with proper application, back-calculation in combination with skeletochronology can be a powerful tool in studying the growth dynamics of individual sea turtles. KEY WORDS: Skeletochronology · Ontogenetic habitat shift · Growth rates · Allometry · Caretta caretta Resale or republication not permitted without written consent of the publisher Vol. 3: 95–104, 2007 Printed June 2007 Published online June 20, 2007
Transcript of Back-calculating length from skeletal growth marks in loggerhead sea turtlesCaretta caretta

ENDANGERED SPECIES RESEARCHEndang Species Res
INTRODUCTION
Over the course of their lives, most sea turtle speciesmigrate extensively, with juveniles making trans-oceanic migrations (Carr 1987, Bolten et al. 1998) andoccupying a variety of different habitats. This migra-tory existence, combined with lengthy individual life-spans (Heppell et al. 2002), makes sea turtle mark–recapture studies difficult, as a large investment intime and money is needed to begin to understand evenmean growth rates on a population scale. Althoughanalyses of mark–recapture data have provided criti-
cal information about sea turtle growth (for examplessee Chaloupka & Limpus 1997, Balazs & Chaloupka2004), multi-year growth trajectories are needed forindividual turtles to understand variability in growthrates over time and among turtles.
Skeletochronology, the technique of using growthmarks in skeletal structures to obtain life-history infor-mation, is becoming a standard method for the assess-ment of individual growth trajectories in sea turtles(Bjorndal et al. 2003). The annual nature of skeletalgrowth marks has been directly validated in numerousamphibians and reptiles (see Castanet et al. 1993 for
© Inter-Research 2007 · www.int-res.com*Email: [email protected]
Back-calculating length from skeletal growthmarks in loggerhead sea turtles Caretta caretta
Melissa L. Snover1, 2,*, Larisa Avens3, Aleta A. Hohn3
1Duke University Marine Laboratory, 135 Duke Marine Lab Road, Beaufort, North Carolina 28516, USA2NOAA Fisheries, Southwest Fisheries Science Center, Environmental Research Division, 1352 Lighthouse Avenue,
Pacific Grove, California 93950, USA 3NOAA Fisheries, Southeast Fisheries Science Center, Center for Coastal Fisheries and Habitat Research,
101 Pivers Island Road, Beaufort, North Carolina 28516, USA
ABSTRACT: Growth rates within and among sea turtles are highly variable, and gaining an under-standing of this variability is difficult using traditional means, such as mark–recapture. Skeleto-chronology is becoming a standard technique for the assessment of individual growth rates in sea tur-tles. Here we present an analysis of the relationship between humerus diameter and somatic growthin loggerhead sea turtles Caretta caretta, demonstrating that this relationship is allometric, with asteeper slope for small pelagic turtles and a gentler slope for larger neritic turtles. We compare thisrelationship to models fit to neritic turtle data only and validate the ability of this relationship to accu-rately back-calculate carapace lengths from diameters of skeletal growth marks using 12 neritic,juvenile loggerheads that were captured, tagged, released, and subsequently recovered as deadstrandings. We estimated the length at capture by back-calculation, using the diameter of the skele-tal growth mark most representative of the time of capture as a predictor. The mean differencebetween the measured carapace length at capture and the estimated carapace length obtainedthrough back-calculation was 0.6 cm ± 0.2 SE. For corresponding estimates of annual growth rate, themean error was 0.2 cm yr–1 ± 0.05 SE. Although we were unable to validate the back-calculationequation for pelagic turtles, we provide indirect evidence that this equation will allow for back-calculation of sizes through this stage. We suggest that, with proper application, back-calculation incombination with skeletochronology can be a powerful tool in studying the growth dynamics ofindividual sea turtles.
KEY WORDS: Skeletochronology · Ontogenetic habitat shift · Growth rates · Allometry · Carettacaretta
Resale or republication not permitted without written consent of the publisher
Vol. 3: 95–104, 2007Printed June 2007
Published online June 20, 2007

Endang Species Res 3: 95–104, 2007
review). For sea turtles, annual growth marks in thehumerus bone have been validated both directly(Klinger & Musick 1992, Coles et al. 2001, Snover &Hohn 2004) and indirectly (Bjorndal et al. 2003, Snover& Hohn 2004).
In fisheries science, estimating growth rates by usingdimensions of daily or annual marks in otoliths andscales to back-calculate body length is a widelyaccepted technique (Campana 1990, Francis 1990,Vigliola et al. 2000). All such back-calculation methodsincorporate 2 key assumptions: (1) that there is a con-stant rate of deposition of growth marks (e.g. daily orannual) in the structure being used; and (2) that thereis a constant or predictable proportionality betweensome measurement of the structure (otolith or scale)and body size. Correlations of these metrics in the fish-eries literature have been shown to be either allo-metric (nonlinear) or isometric (linear).
Skeletochronological analysis of loggerhead sea tur-tle Caretta caretta humeri has demonstrated annual de-position of growth marks, meeting the first assumptionfor growth back-calculation (Klinger & Musick 1992,Cole et al. 2001, Bjorndal et al. 2003, Snover & Hohn2004). To meet the second assumption, it is thereforenecessary to demonstrate and describe a strong corre-lation between a dimension of the humerus and thecarapace length of the turtle over the size ranges of theanimals in the study, or, preferably, for all size ranges toenable the use of early growth marks for back-calcula-tion of size and growth rate information (Chaloupka &Musick 1997). Previous studies using skeletal growthmarks in sea turtles to back-calculate length andgrowth rates have demonstrated a linear relationshipbetween humerus dimensions and carapace length forthe range of turtle lengths in their studies (neritic juve-niles, Klinger & Musick 1995; pelagic juveniles, Bjorn-dal et al. 2003). However, because juvenile loggerheadturtles undertake a major ontogenetic shift betweenpelagic and neritic habitats, it is possible that the rela-tionship between the humerus and carapace lengthchanges (Vigliola et al. 2000, Hurst & Conover 2003),resulting in a nonlinear relationship over all life stages.
Although very few growth rate data exist for small,pelagic juvenile loggerheads (but see Bjorndal et al.2000, 2003), when larger juveniles are recovered asdead strandings along the coast, their humeri containgrowth marks that were deposited while they were inthe pelagic environment. If a relationship could befound that described the correlation between humerusdiameter and carapace length over all age classes, itwould enable us to infer growth rates not only from thesize ranges for which we have samples, but also fromthe less well understood pelagic stage.
Snover & Hohn (2004) fit a linear relationshipbetween carapace length and humerus diameter for
loggerhead sea turtles found in neritic habitats. Sizeclasses in this data set included hatchlings, neriticjuveniles and adults, and the results suggest that therelationship between carapace length and humerusdiameter is constant across all size classes, includingsmall pelagic juveniles. Here, we present a moredetailed analysis of the relationship between thehumerus diameter used in skeletochronology and thecarapace length of pelagic and neritic juveniles todetermine whether this relationship is indeed best de-scribed with a linear model, or if it is better describedby an allometric model where the relationship be-tween carapace length and humerus diameterchanges as an animal grows. We also considerwhether the model that best describes the relationshipover all size classes also adequately describes therelationship for neritic turtles only, which are the sizeclasses for which we have the most data. We then pro-pose the use of this relationship in conjunction withthe body proportional hypothesis (BPH) back-calcula-tion technique developed by Francis (1990) to enableestimation of carapace lengths from diameters of earlygrowth marks. To validate the back-calculation tech-nique for neritic-stage juveniles, we used 12 logger-head sea turtles that were captured, measured,tagged, released, and eventually recovered as deadstrandings.
MATERIALS AND METHODS
Back-calculation model. Our goal was to find amodel that describes the relationship betweenhumerus diameter and carapace length over all sizeclasses. We followed methods established in fisheriesscience for defining the relationship between humerusgrowth and increase in carapace length from hatchingby assuming the following proportionality between therelative growth rates of the humerus and the turtle(Vigliola et al. 2000):
(1)
where L is carapace length of the turtle, D is the diam-eter of the humerus, Lop is the carapace length of theturtle at hatching, Dop is the diameter of the humerus athatching, c is the allometric proportionality coefficientand t is time. This equation is slightly different fromthat of Vigliola et al. (2000) as we include the term Dop.Vigliola et al. (2000) assumed that Lop was the length ofa fish at otolith formation, in which case Dop = 0. How-ever, here we assume Lop is the carapace length of ahatchling and hence, Dop > 0. The solution of Eq. (1)yields:
L = Lop + b(D–Dop)c (2)
d( )
( )d
d
( )d
L L
L L tc
D D
D D top
op
op
op
−−
=−
−( )
96

Snover et al.: Back-calculating loggerhead turtle lengths
or, if c = 1, the relationship is isometric:
L = Lop + b(D–Dop) (3)
In each of these equations, b is the slope of the rela-tionship.
One concern with the above approach is that the useof the biological intercepts of Lop and Dop will bias theshape of the curve fit to the larger neritic turtles. Asdiscussed below in ‘Sample collection and analyses’,most of our samples are from neritic juveniles andadults and, with the exception of hatchlings, representthe range of sizes over which we can be most certain ofthe relationship. To explore the relationship betweenhumerus diameter and carapace length over these sizeclasses only, we fit simple linear and allometric equa-tions to the data eliminating the biological intercepts ofLop and Dop:
L = a + bDc (4)and L = a + bD (5)
and we compared the results of these models withthose of Eqs. (2) and (3).
Once the best relationship between carapace lengthand humerus diameter is established, a back-calcula-tion model can be used to estimate carapace lengths(L) from growth-mark (or lines of arrested growth asdescribed below) diameters within the humerus (D)given the final body length (Lfinal) and humerus diame-ter (Dfinal). Most back-calculation models only considerlinear (isometric) relationships between scale or otolithdimension and body length. The BPH developed byFrancis (1990) can incorporate either relationship. TheBPH is a ‘proportional’ method as opposed to a ‘regres-sion’ method (Francis 1990) that incorporates theknown individual body length and humerus diameterat death in back-calculating lengths. The general formof the model is:
L = [ƒ(D)][Lfinal][ƒ(Dfinal)]–1 (6)
where ƒ(D) represents the appropriate relationshipestimating carapace length from humerus diameter(Eqs. 2, 3, 4 or 5), and ƒ(Dfinal) is the same relationshipestimating the final carapace length from the finalhumerus diameter.
Sample collection and analyses. Hatchling and post-hatchling loggerheads originating from the southeast-ern United States are caught up in the Gulf Stream andeventually become entrained in the North Atlanticgyre (Carr 1986, 1987, Bolten et al. 1998). As smalljuveniles, these turtles remain pelagic, completing afull transatlantic migration before returning to thewestern North Atlantic (Carr 1987, Bolten et al. 1998).In the western North Atlantic, loggerheads are ob-
served in nearshore feeding areas beginning at a sizeof about 42 cm in carapace length (Epperly et al. 1995,Bjorndal et al. 2000), eventually transitioning to aprimarily neritic life stage.
We obtained both humeri and carapace length mea-surements from 243 free-ranging loggerhead sea tur-tles found stranded and dead on beaches along theAtlantic and Gulf of Mexico coasts of the US fromMaryland to Texas. As the loggerheads collected alongthe coast of the US are primarily neritic, our samplewas comprised of juvenile and adult turtles between44.7 and 106.1 cm SCL (straight carapace length), withthe exception of 10 hatchlings, 2 post-hatchlings<10 cm SCL, and one 20 cm SCL turtle found strandedin Florida, USA. Mean size of adult female logger-heads is 87 cm SCL (Van Buskirk & Crowder 1994). Oneach report accompanying a stranding, both straightand curved carapace lengths (CCL) are usually noted.Here we used the SCL measurements taken withcalipers from the nuchal notch to the posterior end ofthe posterior marginal scute (notch-to-tip). Humerusdiameters at the sectioning site used for the skeleto-chronology preparations (as described below) weremeasured for each of the 243 turtles. We used 233 datapoints, excluding the hatchlings, to fit Eqs. (2) and (3)using a maximum likelihood analysis. Similarly, weused 230 data points, excluding all of the samples lessthan 44.7 cm SCL to fit Eqs. (4) and (5) using a maxi-mum likelihood analysis. The fits were comparedusing the bias-corrected Akaike information criteria(AICc, Burnham & Anderson 1998). Standard signifi-cance tests and analysis of residuals were also carriedout.
Bjorndal et al. (2003) analyzed the relationshipbetween humeri and carapace lengths for smaller,pelagic stage loggerheads, with CCL ranging from 4.5to 59.2 cm (n = 44). Their methodology differed fromthe current study in that (1) they used CCL rather thanSCL for carapace length, and (2) instead of a diametermeasurement, a ventral radius measurement wastaken from the center of the medullary cavity to theventral edge of the humerus cross-sections. In order tocompare our results for neritic turtles with their resultsfor pelagic turtles, we followed their humeri measure-ment methods for 30 juvenile and adult loggerheadsspanning the size range typical for neritic turtles andanalyzed these measurements along with each turtle’srecorded CCL.
Validation of the back-calculation technique. Tovalidate the accuracy of the BPH back-calculationmethod, we used humeri from an additional 12 juve-nile neritic loggerheads that were captured, tagged,measured, and subsequently recovered stranded dead.Initial capture lengths ranged from 50.6 to 74.8 cmSCL. These loggerheads were tagged as part of an
97
Endang Species Res 3: 95–104, 2007
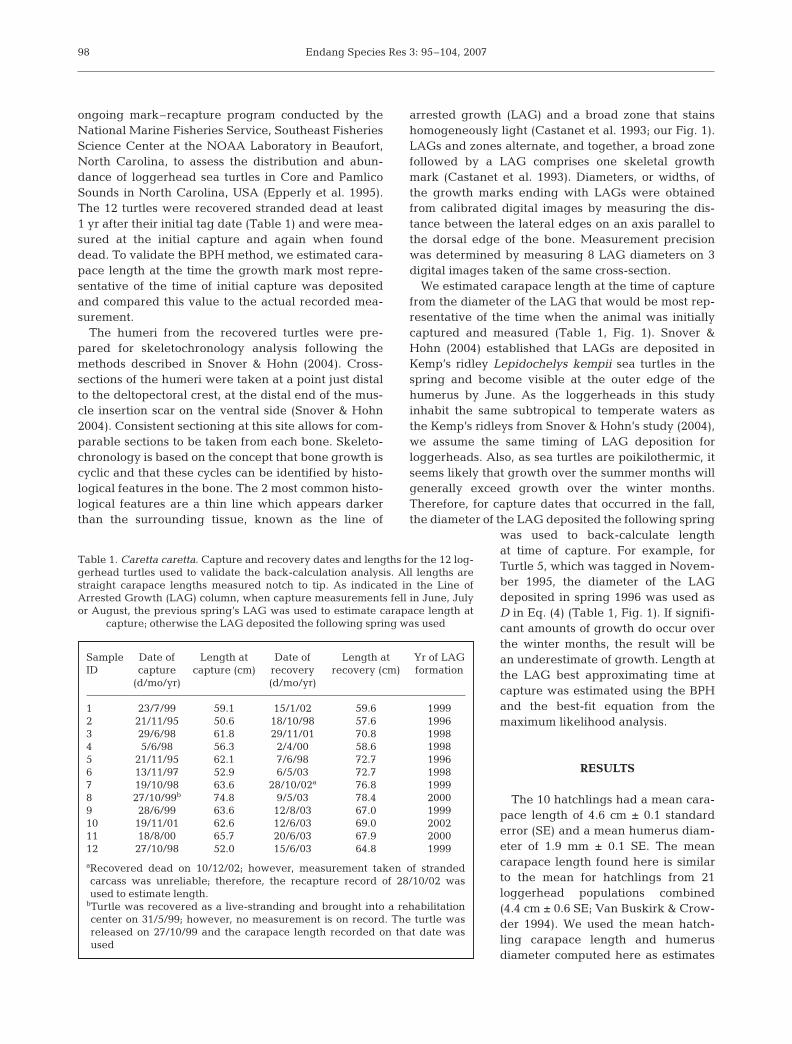
ongoing mark–recapture program conducted by theNational Marine Fisheries Service, Southeast FisheriesScience Center at the NOAA Laboratory in Beaufort,North Carolina, to assess the distribution and abun-dance of loggerhead sea turtles in Core and PamlicoSounds in North Carolina, USA (Epperly et al. 1995).The 12 turtles were recovered stranded dead at least1 yr after their initial tag date (Table 1) and were mea-sured at the initial capture and again when founddead. To validate the BPH method, we estimated cara-pace length at the time the growth mark most repre-sentative of the time of initial capture was depositedand compared this value to the actual recorded mea-surement.
The humeri from the recovered turtles were pre-pared for skeletochronology analysis following themethods described in Snover & Hohn (2004). Cross-sections of the humeri were taken at a point just distalto the deltopectoral crest, at the distal end of the mus-cle insertion scar on the ventral side (Snover & Hohn2004). Consistent sectioning at this site allows for com-parable sections to be taken from each bone. Skeleto-chronology is based on the concept that bone growth iscyclic and that these cycles can be identified by histo-logical features in the bone. The 2 most common histo-logical features are a thin line which appears darkerthan the surrounding tissue, known as the line of
arrested growth (LAG) and a broad zone that stainshomogeneously light (Castanet et al. 1993; our Fig. 1).LAGs and zones alternate, and together, a broad zonefollowed by a LAG comprises one skeletal growthmark (Castanet et al. 1993). Diameters, or widths, ofthe growth marks ending with LAGs were obtainedfrom calibrated digital images by measuring the dis-tance between the lateral edges on an axis parallel tothe dorsal edge of the bone. Measurement precisionwas determined by measuring 8 LAG diameters on 3digital images taken of the same cross-section.
We estimated carapace length at the time of capturefrom the diameter of the LAG that would be most rep-resentative of the time when the animal was initiallycaptured and measured (Table 1, Fig. 1). Snover &Hohn (2004) established that LAGs are deposited inKemp’s ridley Lepidochelys kempii sea turtles in thespring and become visible at the outer edge of thehumerus by June. As the loggerheads in this studyinhabit the same subtropical to temperate waters asthe Kemp’s ridleys from Snover & Hohn’s study (2004),we assume the same timing of LAG deposition forloggerheads. Also, as sea turtles are poikilothermic, itseems likely that growth over the summer months willgenerally exceed growth over the winter months.Therefore, for capture dates that occurred in the fall,the diameter of the LAG deposited the following spring
was used to back-calculate lengthat time of capture. For example, forTurtle 5, which was tagged in Novem-ber 1995, the diameter of the LAGdeposited in spring 1996 was used asD in Eq. (4) (Table 1, Fig. 1). If signifi-cant amounts of growth do occur overthe winter months, the result will bean underestimate of growth. Length atthe LAG best approximating time atcapture was estimated using the BPHand the best-fit equation from themaximum likelihood analysis.
RESULTS
The 10 hatchlings had a mean cara-pace length of 4.6 cm ± 0.1 standarderror (SE) and a mean humerus diam-eter of 1.9 mm ± 0.1 SE. The meancarapace length found here is similarto the mean for hatchlings from 21loggerhead populations combined(4.4 cm ± 0.6 SE; Van Buskirk & Crow-der 1994). We used the mean hatch-ling carapace length and humerusdiameter computed here as estimates
98
Sample Date of Length at Date of Length at Yr of LAGID capture capture (cm) recovery recovery (cm) formation
(d/mo/yr) (d/mo/yr)
1 23/7/99 59.1 15/1/02 59.6 19992 21/11/95 50.6 18/10/98 57.6 19963 29/6/98 61.8 29/11/01 70.8 19984 5/6/98 56.3 2/4/00 58.6 19985 21/11/95 62.1 7/6/98 72.7 19966 13/11/97 52.9 6/5/03 72.7 19987 19/10/98 63.6 28/10/02a 76.8 19998 27/10/99b 74.8 9/5/03 78.4 20009 28/6/99 63.6 12/8/03 67.0 199910 19/11/01 62.6 12/6/03 69.0 200211 18/8/00 65.7 20/6/03 67.9 200012 27/10/98 52.0 15/6/03 64.8 1999
aRecovered dead on 10/12/02; however, measurement taken of strandedcarcass was unreliable; therefore, the recapture record of 28/10/02 wasused to estimate length.
bTurtle was recovered as a live-stranding and brought into a rehabilitationcenter on 31/5/99; however, no measurement is on record. The turtle wasreleased on 27/10/99 and the carapace length recorded on that date wasused
Table 1. Caretta caretta. Capture and recovery dates and lengths for the 12 log-gerhead turtles used to validate the back-calculation analysis. All lengths arestraight carapace lengths measured notch to tip. As indicated in the Line ofArrested Growth (LAG) column, when capture measurements fell in June, Julyor August, the previous spring’s LAG was used to estimate carapace length at
capture; otherwise the LAG deposited the following spring was used

Snover et al.: Back-calculating loggerhead turtle lengths
of Lop and Dop, respectively, in Eqs. (2) and (3). Themean precision of measurements of LAG diameterswas 0.08 mm ± 0.01 SE.
All models provided reasonable fits to the data(Tables 2 & 3, Fig. 2). For the 2 models with the biolog-ical intercepts of Lop and Dop, the nonlinear allometricmodel in Eq. (2) provided a better fit, with the allomet-ric intercept model having the lower bias-corrected
AIC value (Table 2). Analyses of the residuals revealedan increasing negative bias with increasing length forthe linear model (Eq. 3, Fig. 3b), while no bias existedwith the nonlinear model (Eq. 2, Fig. 3a).
The models fit only to the neritic turtles but, while de-scribing the relationship between carapace length andhumerus diameter well (Table 3, Fig. 2), do not capturethe relationship for smaller pelagic turtles or hatchlings(Fig. 4). The relationship described by these models forneritic turtles is nearly identical to that described by theallometric model with biological intercepts (Fig. 4).
The form of the nonlinear model of Eq. (2) suggestedthat the slope of the relationship between humerusdiameter and carapace length was steeper for smaller,pelagic loggerheads than larger neritic juveniles andadults. However, the lack of small, pelagic logger-heads in the dataset made it difficult to assess whetherthis relationship is valid. To test whether a shift in theslope of the relationship really does occur, we tookmeasurements of the ventral radius of the humerusand compared them to the reported curved carapacelength for 30 of the loggerheads in our dataset andadded these results to the data of Bjorndal et al. (2003)for pelagic turtles (Fig. 5a). From this analysis, itappeared that a shift in the relationship betweenhumerus growth and carapace length does occur, witha higher slope of 10.11 cm CCL mm–1 humerus diame-ter for the pelagic regression versus a slope of 6.48 cmCCL mm–1 humerus diameter for the neritic regres-sion. We overlayed the model from Eq. (2) over thedata in this plot to demonstrate how the allometricmodel with biological intercepts appears to describethe relationship between humerus dimension andcarapace length over all size classes (Fig. 5b).
99
Fig. 1. Caretta caretta. Partial image of the cross-section of thehumerus from Sample number 5. Lines of arrested growth(LAG) appear as thin, dark lines running from the top of theimage to the bottom. Counting in from the outside of the bone,the LAG are labeled (black arrows) with approximate times ofdeposition in Spring 1995, 1996 and 1997. The lighter stainedregions between the LAG are the zones. This turtle was origi-nally captured on 21 November 1995. The outer edge of thebone is on the left side of the image and chronologically repre-sents the date, 7 June 1998, when the animal was recovereddead. For this bone, the LAG deposited in spring 1996 was
used to estimate length at the time of initial capture
Parameter estimatesModel SS Ln[L] AICc b (SE) c (SE)
Allometric L = Lop+b(D – Dop)c 5157 691 1389 4.25 (0.26) 0.85 (0.02)Isometric L = Lop+b(D – Dop) 6604 720 1445 2.57 (0.01) –
Table 2. Caretta caretta. Results of the maximum likelihood fits of Eqs. (2) and (3) for carapace length vs. humerus diameter data.In each model, L indicates carapace length, D indicates humerus diameter, Lop indicates hatchling length and Dop indicatesdiameter of hatchling humerus. The letters b, and c are the fitted parameters. SS is the residual sum of squares, Ln[L] is the log-likelihood, and AICc is the bias-corrected Akaike information criterion. The model with the smallest AICc shows the best fit.
Bolded parameter values are significant at p < 0.001
Parameter estimatesModel SS Ln[L] AICc a (SE) b (SE) c (SE)
Allometric L = a+bDc 5091 683 1373 –34.35 (8.26) 15.39 (3.47) 0.58 (0.05)Isometric L = a +bD 5207 685 1376 10.76 (1.47) 2.20 (0.05) –
Table 3. Caretta caretta. Results of the maximum likelihood fits of Eqs. (4) and (5) to the carapace length vs. humerus diameterdata using only data from turtles >44.7 cm SCL and no biological intercepts. The model with the smallest AICc shows the best fit.
Abbreviations as in Table 2. Bolded parameter values are significant at p < 0.001

Endang Species Res 3: 95–104, 2007
Due to the bias in the residuals, we eliminated themodel of Eq. (3) from further consideration. We usedEqs. (2), (4) and (5) in the BPH model to back-calculatelengths for the recaptured turtles
Li = [Lop+b(Di –Dop)c] [Lfinal] [Lop+b(Dfinal–Dop)c]–1 (7)
Li = (a + bDic)(Lfinal)(a + bDfinal
c)–1, (8)
and Li = (a + bDi)(Lfinal)(a + bDfinal)–1 (9)
where i designates the LAG most representative of thetime of initial capture; hence, Di is the diameter ofLAGi and Li is the estimate of the carapace length atthe time LAGi was deposited. Eqs. (7), (8) and (9) allgave values for length at initial capture and growthrate from capture to death that were very similar, with
Eqs. (7) and (9) consistently performing better thanEq. (8) (Table 4). Single-factor ANOVA demonstratedno significant differences between the values for back-calculated length and growth rates for all 3 equations(for initial capture length p = 0.99; for growth rates p =0.99). There were positive, though not significant, cor-relations between time at large and absolute back-calculation error in length (Eq. 7: r2 = 0.09, p = 0.35;Eq. 8: r2 = 0.23, p = 0.12; Eq. 9: r2 = 0.02, p = 0.63).Length was over-estimated in 6, 7 and 6 of the 12recaptures for Eqs. (7), (8) and (9), respectively and
100
0
20
40
60
80
100
120
00 10 20 30 40 50
0 10 20 30 40 50
20
40
60
80
100
120
Humerus diameter (mm)
SC
L (c
m)
a
b
Fig. 2. Caretta caretta. Plots of straight carapace length (SCL)data versus humerus diameter. (a) 233 data points (all post-hatchling size classes). Lines are the fitted regression modelswith biological intercepts for the allometric relationship(Eq. 2, solid black line) and for the isometric relationship(Eq. 3, grey line highlighted with gray crosses). (b) 230 datapoints (size classes >44.7 cm SCL). Lines are the fitted regres-sion models without biological intercepts for the allometricrelationship (Eq. 4, solid black line) and for the isometricrelationship (Eq. 5, grey line highlighted with gray crosses)
–10
–20
–30
000 101010 202020 303030 404040 505050
00
0
0 10
10
101010
10
20
–10
–20
–30
0
10
20
–10
–20
–30
0
10
20
–10
–20
–30
0
10
20
a
b
c
d
202020 303030 404040 50
202020 303030 404040 50
202020 303030 404040 50
Fig. 3. Caretta caretta. Plots of residuals for the 4 regressionmodels. (a) Eq. (2), allometric model with biological inter-cepts; (b) Eq. (3), linear model with biological intercepts;(c) Eq. (4), allometric model with no biological intercepts;
(d) Eq. (5), linear model with biological intercepts

Snover et al.: Back-calculating loggerhead turtle lengths
underestimated in the remaining turtles with theexception of no error for Turtle 7 with Eq. (7) (Table 4).
The mean time-at-large for the 12 marked turtleswas 3.25 yr ± 0.36 SE. The mean observed annualgrowth rate for the 12 turtles was 2.4 cm yr–1 ± 0.5 SE,while the mean expected annual growth rate was2.3 cm yr–1 ± 0.4 SE for all 3 equations.
DISCUSSION
We clearly demonstrate that skeletochronology canbe used to back-calculate lengths and growth rates ofneritic juvenile loggerhead sea turtles within a veryreasonable margin of error. We found a mean error inestimating annual growth rates of 0.2 to 0.3 cm fromgrowth marks. Bresette & Gorham (2001) report a mea-surement error of 0.20 cm for experienced observers
measuring green sea turtle Chelonia mydas SCL.Hence, the error found here is comparable to the mea-surement error of the carapace lengths. Furthermore,for our sample, when an initial capture occurred in thefall, we used the subsequent LAG deposited in thespring to estimate capture length. This inability tomeasure the exact location on the bone representativeof initial capture may have biased our estimates. Insubsequent studies where annual growth rates areestimated more precisely, i.e. from LAG to LAG, lesserror can be expected.
While we could not validate back-calculation oflength for pelagic turtles, we were able to present 2lines of evidence suggesting that the relationshipbetween humerus dimensions and carapace length issteeper for pelagic turtles than for neritic turtles. Theallometric model with biological intercepts fit the fulldataset better than the isometric relationship; and this
101
0
20
40
60
80
100
120
00 10 20 30 40 50
0 10 20 30 40 50
20
40
60
80
100
120
a
b
Humerus diameter (mm)
SC
L (c
m)
Fig. 4. Caretta caretta. Comparison of the models from Eqs.(2), (4), and (5). For both (a) and (b), solid black line is Eq. (2),allometric model with biological intercepts; dashed black lineis Eq. (4), allometric model with no biological intercepts; andthe solid grey line with grey diamonds is Eq. (5), linear modelwith no biological intercepts. In (b) open diamonds are all ofthe data for carapace length vs. humerus diameter, including
hatchlings (N = 243)
0
20
40
60
80
100
120
00 2 4 6 8 10 12 14 16
0 2 4 6 8 10 12 14 16
20
40
60
80
100
120
Car
apac
e le
ngth
(cm
)C
CL
(cm
)
Humerus radius or diameter (mm) /3.25
Humerus radius (mm)
CCL = 6.48 radius+14.65R2 = 0.90P < 0.001
CCL = 10.11 radius-0.19
a
b
Fig. 5. Caretta caretta. Relationship between humerus radiusand curved carapace length (CCL). (a) Open diamonds aremeasurements taken from 30 of the neritic loggerheads in thepresent study. Dashed line represents a linear regressionthrough these data. Open squares represent the regressionequation for pelagic loggerheads from Bjorndal et al. (2003).(b) Open diamonds and open squares as in (a). Solid line is theallometric model with biological intercepts (Eq. 2) fit to 233data for humerus diameter and carapace length. In the plot,humerus diameter has been divided by 3.25 to scale the
measurements with humerus radius

Endang Species Res 3: 95–104, 2007
model is consistent of our comparison with Bjorndal etal.’s (2003) observations of pelagic turtles to our ownobservations of neritic turtles. The allometric modelwith biological intercepts describes the relationshipbetween carapace length and humerus diameter forneritic turtles equally well as models fit only to thosedata, while in addition suggesting a relationship forcarapace length and humerus diameter for smaller,pelagic turtles that would allow for back calculations oflength through those size classes. We suggest that theallometric curve with biological intercepts presentedhere (Eqs. 2 & 7) can be used to estimate carapacelengths and growth rates throughout all size classes ofloggerheads originating from nesting beaches in thesoutheastern US. This relationship will enable us tocollect information on growth rates and shifts ingrowth rates corresponding to the habitat shift thatwere previously impossible to collect.
A comparison of our data with those presented inBjorndal et al. (2003) indicates that there is a shift inthe slope of the relationship between carapace lengthand humerus dimensions, with the slope being steeperfor pelagic turtles than for neritic ones. Given that the2 data sets were collected from turtles in different geo-graphic areas, it is possible that the change in thegrowth trajectory of an individual turtle occurs when itshifts from pelagic to neritic habitat. Similar shifts inotolith/body length relationships occurring in conjunc-tion with ontogenetic habitat shifts have been noted infish (Vigliola et al. 2000).
These results suggest that loggerheads from this pop-ulation may change the way they partition resources
between skeletal growth and development in the 2habitats. When size-dependent mortality is important,there should be a higher allocation of resources to in-creases in length and mass rather than to lipid storagein order to reduce the risk of mortality from predationas quickly as possible (Hurst & Conover 2003). Wefound that a unit increase in bone diameter results in agreater increase in carapace length for smaller juve-niles than for larger juveniles. As size-dependent pre-dation is likely a primary source of mortality for smallturtles in the pelagic environment, they may investmore resources in skeletal growth to reach size refugesas quickly as possible, resulting in a higher carapacelength-to-humerus diameter ratio. Though it is not clearwhat the natural mortality sources are for larger neriticjuveniles, predation is likely not as important a sourceof mortality as for smaller turtles; hence, larger turtlesmay divert more energy into muscle, lipid, and gonadaltissues rather than increased body length, resulting in alower carapace length-to-humerus diameter ratio.
Determining the relationship between carapacelength and humerus diameter is critical for characteriz-ing growth patterns. Other authors attempting to back-calculate length or number of LAGs lost to resorptionhave used a linear relationship (Klinger & Musick1995, Bjorndal et al. 2003). The negative allometricrelationship indicated here (c < 1) suggests that the useof a linear relationship would underestimate lengths ofsmaller turtles and overestimate the lengths of largerturtles. Therefore, if applied to neritic turtles, the linearregression of Bjorndal et al. (2003) would overestimategrowth rates and, similarly, a linear relationship based
102
Sample ID Estimated length (cm SCL) Estimated growth rate (cm yr–1)Eq. (7) Eq. (8) Eq. (9) Eq. (7) Eq. (8) Eq. (9)
1 59.3 (–0.2) 59.3 (–0.2) 59.4 (–0.3) 0.1 (0.1) 0.1 (0.1) 0.1 (0.1)2 49.1 (1.5) 48.6 (2) 49.4 (1.2) 2.9 (–0.5) 3.1 (–0.7) 2.8 (–0.4)3 61.2 (0.6) 61.2 (0.6) 61.3 (0.5) 2.8 (–0.2) 2.8 (–0.2) 2.8 (–0.2)4 56.1 (0.2) 56.0 (0.3) 56.2 (0.1) 1.4 (–0.1) 1.4 (–0.2) 1.3 (0)5 62.5 (–0.4) 62.4 (–0.3) 62.6 (–0.5) 4.0 (0.2) 4.0 (0.1) 4.0 (0.2)6 52.3 (0.6) 51.5 (1.4) 52.7 (0.2) 3.7 (–0.1) 3.9 (–0.3) 3.6 (0)7 63.6 (0) 63.4 (0.2) 63.7 (–0.1) 3.3 (0) 3.3 (–0.1) 3.3 (0)8 76.2 (–1.4) 76.2 (–1.4) 76.2 (–1.4) 0.6 (0.4) 0.6 (0.4) 0.6 (0.4)9 63.8 (–0.2) 63.7 (–0.1) 63.8 (–0.2) 0.8 (0) 0.8 (0) 0.8 (0.1)10 62.4 (0.2) 62.4 (0.2) 62.5 (0.1) 4.2 (–0.1) 4.2 (–0.1) 4.2 (–0.1)11 66.4 (–0.7) 66.4 (–0.7) 66.4 (–0.7) 0.5 (0.3) 0.5 (0.3) 0.5 (0.3)12 50.4 (1.6) 49.7 (2.3) 50.9 (1.1) 3.1 (–0.3) 3.2 (–0.5) 3.0 (–0.2)
Average absolute difference between observed vs. estimated length or growth rate:0.6 ± 0.2 0.8 ± 0.2 0.5 ± 0.1 0.2 ± 0.05 0.3 ± 0 06 0.2 ± 0 04
Table 4. Caretta caretta. Estimated straight carapace lengths (SCL) at initial capture and estimated growth rates for 12 log-gerhead turtles recovered dead after previously being captured, measured and tagged. Three different equations were used todescribe the relationship between humerus diameter and carapace length, and the resulting estimates of length at capture andannual growth rate from capture to death for each of those equations are reported. Values in parentheses indicate the differenceand direction of the error from the observed values. Average absolute differences are the mean of the absolute values of the
error ± standard error

Snover et al.: Back-calculating loggerhead turtle lengths
on neritic turtles would underestimate growth rates insmaller, pelagic turtles.
In studies of skeletochronology in sea turtles, use ofthe humerus bone and location of the sectioning site onthe humerus bone have been relatively consistent andare based on Zug et al. (1986). However, the portion ofthe humerus cross-section used for analysis of growthmarks has varied. Early studies by Zug and his col-leagues (Zug et al. 1986, Parham & Zug 1997) usedventral radius measurements from the center of themedullary cavity to the ventral edge of the humeruscross-section. Later works by Zug and his colleaguesswitched to the use of long-axis (lateral) diameter mea-surements as described here (Zug et al. 1995, 1997,2002, Zug & Glor 1998). The study by Bjorndal et al.(2003) of pelagic stage loggerheads returned to the useof ventral radius measurements taken from the centerof the medullary cavity to the ventral edge of thehumerus, on an axis perpendicular to the longitudinalaxis of the cavity. However, when we duplicated Bjorn-dal et al.’s (2003) methodology in larger neritic juve-niles and adults, we found it difficult to reproduce.Medullary cavities in the humeri of these animals aresometimes expansive and generally asymmetrical, andtheir placement within the humerus varies from indi-vidual to individual. Thus, determining the location ofthe focus of the cavity in order to measure the distancebetween that focus and the ventral edge of thehumerus seemed subjective and inconsistent frombone to bone. As a result, we advise the use of fulldiameter measurements between the lateral edges ofthe humerus, as used here. Alternatively, if growthmarks are difficult to resolve around the full circumfer-ence of the skeletal structure being analyzed, radiusmeasurements might be made along the longitudinalaxis from a set point, such as midway between thelateral edges.
Now that a method for back-calculating lengths fromLAG diameters has been established for loggerheadsea turtles from the southeastern US, we have a tool forinvestigating individual growth rates in turtles fromthis population. Similar methodologies involving theestablishment of the relationship between humerusdiameter and carapace length can be applied to otherloggerhead populations and to other species of seaturtles as a means of assessing individual growth.
Acknowledgements. Most of the humeri were receivedthrough the Sea Turtle Stranding and Salvage Network, acooperative endeavor between the National Marine FisheriesService (NMFS), other federal and state agencies, many aca-demic and private entities, and innumerable volunteers. Spe-cial thanks go to R. Boettcher and W. Teas. In addition, humeriwere received from B. Higgins at NMFS, Southeast FisheriesScience Center (SEFSC), Galveston Lab, the Virginia MarineScience Museum, and the Maryland Department of Natural
Resources. Tagging information and size data for themark–recapture animals were generously supplied by J.Braun-McNeill and S. Epperly. We thank A. Gorgone, B.Brown and L. Goshe for assistance in the lab and L. B. Crow-der, S. S. Heppell, G. R. Zug and 3 anonymous reviewers forproviding comments to improve this manuscript. Funding wasprovided by the NMFS, SEFSC and Office of ProtectedResources. All work was done under and complied with theprovisions of Sea Turtle Research Permit TE-676379-2 issuedby the US Fish and Wildlife Service.
LITERATURE CITED
Balazs GH, Chaloupka M (2004) Spatial and temporal vari-ability in somatic growth of green sea turtles (Cheloniamydas) resident in the Hawaiian Archipelago. Mar Biol145:1043–1059
Bjorndal KA, Bolten AB, Martins HR (2000) Somatic growthmodel of juvenile loggerhead sea turtles Caretta caretta:duration of pelagic stage. Mar Ecol Prog Ser 202:265–272
Bjorndal KA, Bolten AB, Dellinger T, Delgado C, Martins HR(2003) Compensatory growth in oceanic loggerhead seaturtles: response to a stochastic environment. Ecology84:1237–1249
Bolten AB, Bjorndal KA, Martins HR, Dellinger T, BoscoitoMJ, Encalada SE, Bowen BW (1998) Transatlantic devel-opmental migrations of loggerhead sea turtles demon-strated by mtDNA sequence analysis. Ecol Appl 8:1–7
Bresette M, Gorham J (2001) Growth rates of juvenile greenturtles (Chelonia mydas) from the Atlantic coastal watersof St. Lucie County, Florida, USA. Mar Turtl Newsl 91:5–6
Burnham KP, Anderson DR (1998) Model selection andinference: a practical information-theoretic approach.Springer, New York
Campana SE (1990) How reliable are growth back-calcula-tions based on otoliths? Can J Fish Aquat Sci 47:2219–2227
Carr A (1986) RIPs, FADs and little loggerheads. Bioscience36:92–100
Carr A (1987) New perspectives on the pelagic stage of seaturtle development. Conserv Biol 1:103–121
Castanet J, Francillon-Viellot H, Meunier FJ, De Ricqles A(1993) Bone and individual aging. In: Hall BK (ed) Bone,Vol 7, Bone Growth-B. CRC Press, Boca Raton, FL,p 245–283
Chaloupka M, Limpus CJ (1997) Robust statistical modelingof hawksbill sea turtle growth rates (Southern Great Bar-rier Reef). Mar Ecol Prog Ser 146:1–8
Chaloupka M, Musick JA (1997) Age, growth, and populationdynamics. In: Lutz PL, Musick JA (eds) The biology of seaturtles. CRC Press, Boca Raton, FL p 233–276
Coles WC, Musick JA, Williamson LA (2001) Skeletochronol-ogy validation from an adult loggerhead (Caretta caretta).Copeia 2001:240–242
Epperly SP, Braun J, Veishlow A (1995) Sea turtles in NorthCarolina waters. Conserv Biol 9:384–394
Francis RICC (1990) Back-calculation of fish length: a criticalreview. J Fish Biol 36:883–902
Heppell SS, Snover ML, Crowder LB (2002) Sea turtle popula-tion ecology. In: Lutz PL, Musick JA, Wyneken J (eds) Thebiology of sea turtles, Vol 2. CRC Press, Boca Raton, FL,p 275–306
Hurst TP, Conover DO (2003) Seasonal and interannual varia-tion in the allometry of energy allocation in juvenilestriped bass. Ecology 84:3360–3369
Klinger RC, Musick JA (1992) Annular growth layers in juve-
103

Endang Species Res 3: 95–104, 2007
nile loggerhead turtles (Caretta caretta). Bull Mar Sci51:224–230
Klinger RC, Musick JA (1995) Age and growth of loggerheadturtles (Caretta caretta) from Chesapeake Bay. Copeia1995:204–209
Parham JF, Zug GR (1997) Age and growth of loggerhead seaturtles (Caretta caretta) of coastal Georgia: An assessmentof skeletochronological age-estimates. Bull Mar Sci61:287–304
Snover ML, Hohn AA (2004) Validation and interpretation ofannual skeletal marks in loggerhead (Caretta caretta) andKemp’s ridley (Lepidochelys kempii) sea turtles. Fish Bull102:682–692
Van Buskirk J, Crowder LB (1994) Life-history variation inmarine turtles. Copeia 1994:66–81
Vigliola L, Harmelin-Vivien M, Meekan MG (2000) Comparisonof techniques of back-calculation of growth and settlementmarks from the otoliths of 3 species of Diplodus from the
Mediterranean Sea. Can J Fish Aquat Sci 57: 1291–1299Zug GR, Glor RE (1998) Estimates of age and growth in a pop-
ulation of green sea turtles (Chelonia mydas) from theIndian River lagoon system, Florida: a skeletochronologi-cal analysis. Can J Zool 76:1497–1506
Zug GR, Wynn AH, Ruckdeschel C (1986) Age determination ofloggerhead sea turtles, Caretta caretta, by incrementalgrowth marks in the skeleton. Smithsonian Contrib Zool 427
Zug GR, Balazs GH, Wetherall JA (1995) Growth in juvenileloggerhead seaturtles (Caretta caretta) in the north Pacificpelagic habitat. Copeia 1995:484–487
Zug GR, Kalb HJ, Luzar SJ (1997) Age and growth in wildKemp’s ridley sea turtles Lepidochelys kempii from skele-tochronological data. Biol Conserv 80:261–268
Zug GR, Balazs GH, Wetherall JA, Parker DM, MurakawaSKK (2002) Age and growth of Hawaiian green sea turtles(Chelonia mydas): an analysis based on skeletochron-ology. Fish Bull 100:117–127
104
Editorial responsibility: Brendan Godley (Editor-in-Chief),University of Exeter, Cornwall Campus, UK
Submitted: May 19, 2006; Accepted: April 26, 2007Proofs received from author(s): May 29, 2007