THE INFLUENCE OF TEMPORAL AND SPATIAL ORIGIN ON SIZE AND EARLY GROWTH RATES IN CAPTIVE LOGGERHEAD...
10
Herpetological Conservation and Biology 1(2):71-80 Submitted: 12 August 2006; Accepted: 11 October 2006 71 THE INFLUENCE OF TEMPORAL AND SPATIAL ORIGIN ON SIZE AND EARLY GROWTH RATES IN CAPTIVE LOGGERHEAD SEA TURTLES (CARETTA CARETTA) IN THE UNITED STATES LESLEY STOKES 1,2 , JEANETTE WYNEKEN 1,3 , LARRY B. CROWDER 4 , AND JESSE MARSH 4,5 1 Department of Biological Sciences, Florida Atlantic University, 777 Glades Rd., Boca Raton, FL 33431, USA 2 Corresponding Author and Current Affiliation: National Marine Fisheries Service, Southeast Fisheries Science Center, 75 Virginia Beach Drive, Miami, FL 33149, USA, e-mail: [email protected] 3 e-mail: [email protected] 4 Center for Marine Conservation, Nicholas School of the Environment and Earth Sciences, Duke University, 135 Duke Marine Lab Road, Beaufort, NC 28516, USA, e-mail: [email protected] 5 Current Affiliation: Monterey Bay Aquarium, 886 Cannery Row, Monterey, CA 93940, USA, e-mail: [email protected] Abstract.—This study provides morphometric characteristics of early pelagic stage post-hatchling loggerheads in the northwestern Atlantic. We investigated whether differences in temporal and spatial nest origin influence initial size and growth potential in Loggerhead Sea Turtle (Caretta caretta) hatchlings from two genetically distinct subpopulations. We sampled hatchlings from eight sites in the southeastern United States from North Carolina to Florida, representing two genetically distinct subpopulations during three phases (“Early,” “Middle” and “Late”) of the 2002-nesting season. The largest hatchlings were produced at the northern-most nesting site. Initial hatchling size tended to decrease as latitude decreased along the eastern coast of the United States. Hatchlings from the Early phase of the nesting season grew faster than later phase hatchlings, reducing the time interval at the smallest sizes. The initial size differences and growth potential may affect early stage survivorship by altering the risk of size-based predation and decreasing the transit time to the relative safety of Gulf Stream nursery habitats. Key Words.—Caretta caretta; growth; latitude; Loggerhead; sea turtle INTRODUCTION An animal’s body size significantly affects its structure, function and ecology (Peters 1983; Schmidt-Nielsen 1984), and represents the results of selective pressures that lead to tradeoffs between costs and benefits associated with resource allocation. For turtles, individual body size results from multiple factors including maternal investment, initial size at hatching, growth rate and age at maturity (Congdon and van Loben Sels 1991). Although offspring size is frequently interpreted from the perspective of maternal investment, anatomical and physiological characteristics must develop within the animal’s phylogenetic context (Schmidt-Nielsen 1984; Maurer et al. 1992). Together these components determine how plastic the ultimate size range may be. In aquatic vertebrates, selection can favor larger initial size and rapid early growth rates to reduce the risk of predation (Miller et al. 1988; Davenport and Scott 1993a). Vulnerability to predators is often size dependent, as many avian and piscine predators are gape limited (Lawrence 1958; Zaret 1986; Miller et al. 1988; Rice et al. 1993; Vose and Shank 2003). In fishes for example, larger initial size reduces risk of predation, as rapid growth can minimize impacts of gape-limited predators on larval and juvenile survival (Miller et al. 1988; Rice et al. 1993, 1997; Craig et al. in press). In the long-lived freshwater Red-eared Slider (Trachemys scripta elegans), larger initial size at hatching is significantly correlated with higher survival; larger hatchlings moved faster and, therefore, reduced exposure time to predators (Janzen et al. 2000a, 2000b; Janzen and Morjan 2002). The western North Atlantic Loggerhead Sea Turtle (Caretta caretta) population nests on beaches that span 12 degrees of latitude on the east coast of the United States. Nesting females can be genetically separated into four regional subpopulations based on mtDNA evidence (Bowen et al. 1993; Bowen 1995; Encalada et al. 1998; Bowen et al. 2005). Interregional differences in size-specific growth and mean adult size have been found in some stocks of Green Sea Turtles (Chelonia mydas) and Loggerhead Sea Turtles (Bjorndal and Bolten 1988; Green 1993; Chaloupka and Musick 1997), but little is known of growth patterns within the earliest ontogenetic stages. Our study focused on early stage growth rates within two of these subpopulations. In addition to genetic differences, regional and seasonal variation in nest environments may also affect hatchling size at emergence and growth potential. Turtle hatchling size differences may be a function of hydric and thermal properties of the nest incubation environment (Gutzke et al. 1987; Packard 1999; Reece et al. 2002; Glen et al. 2003). Initial hatchling size correlates with the amount of water available to facilitate optimal yolk metabolism in many turtle species (Morris et al. 1983; Packard et al. 1987; Miller and Packard 1992; Packard and Packard 2001). In loggerhead hatchlings from natural nests, nest temperature is negatively correlated and percentage sand moisture content is positively correlated with mass (Reece et al. 2002). Cooler nest temperatures are generally associated with higher humidity and longer incubation periods (Packard 1999). Early-stage size and growth potential are of interest because these factors may directly affect survival during critical periods when mortality risk is high (Miller et al. 1988; Rice et al. 1997; Tucker 2000). Larger hatchlings may be more completely developed, more
Transcript of THE INFLUENCE OF TEMPORAL AND SPATIAL ORIGIN ON SIZE AND EARLY GROWTH RATES IN CAPTIVE LOGGERHEAD...
Herpetological Conservation and Biology 1(2):71-80 Submitted: 12 August 2006; Accepted: 11 October 2006
71
THE INFLUENCE OF TEMPORAL AND SPATIAL ORIGIN ON SIZE AND EARLY GROWTH RATES IN CAPTIVE LOGGERHEAD SEA TURTLES
(CARETTA CARETTA) IN THE UNITED STATES
LESLEY STOKES 1,2, JEANETTE WYNEKEN 1,3, LARRY B. CROWDER 4, AND JESSE MARSH 4,5
1Department of Biological Sciences, Florida Atlantic University, 777 Glades Rd., Boca Raton, FL 33431, USA
2Corresponding Author and Current Affiliation: National Marine Fisheries Service, Southeast Fisheries Science Center, 75 Virginia Beach Drive, Miami, FL 33149, USA, e-mail: [email protected]
3e-mail: [email protected] 4Center for Marine Conservation, Nicholas School of the Environment and Earth Sciences, Duke University,
135 Duke Marine Lab Road, Beaufort, NC 28516, USA, e-mail: [email protected] 5Current Affiliation: Monterey Bay Aquarium, 886 Cannery Row, Monterey, CA 93940, USA, e-mail: [email protected]
Abstract.—This study provides morphometric characteristics of early pelagic stage post-hatchling loggerheads in the northwestern Atlantic. We investigated whether differences in temporal and spatial nest origin influence initial size and growth potential in Loggerhead Sea Turtle (Caretta caretta) hatchlings from two genetically distinct subpopulations. We sampled hatchlings from eight sites in the southeastern United States from North Carolina to Florida, representing two genetically distinct subpopulations during three phases (“Early,” “Middle” and “Late”) of the 2002-nesting season. The largest hatchlings were produced at the northern-most nesting site. Initial hatchling size tended to decrease as latitude decreased along the eastern coast of the United States. Hatchlings from the Early phase of the nesting season grew faster than later phase hatchlings, reducing the time interval at the smallest sizes. The initial size differences and growth potential may affect early stage survivorship by altering the risk of size-based predation and decreasing the transit time to the relative safety of Gulf Stream nursery habitats. Key Words.—Caretta caretta; growth; latitude; Loggerhead; sea turtle
INTRODUCTION
An animal’s body size significantly affects its structure,
function and ecology (Peters 1983; Schmidt-Nielsen 1984), and represents the results of selective pressures that lead to tradeoffs between costs and benefits associated with resource allocation. For turtles, individual body size results from multiple factors including maternal investment, initial size at hatching, growth rate and age at maturity (Congdon and van Loben Sels 1991). Although offspring size is frequently interpreted from the perspective of maternal investment, anatomical and physiological characteristics must develop within the animal’s phylogenetic context (Schmidt-Nielsen 1984; Maurer et al. 1992). Together these components determine how plastic the ultimate size range may be.
In aquatic vertebrates, selection can favor larger initial size and rapid early growth rates to reduce the risk of predation (Miller et al. 1988; Davenport and Scott 1993a). Vulnerability to predators is often size dependent, as many avian and piscine predators are gape limited (Lawrence 1958; Zaret 1986; Miller et al. 1988; Rice et al. 1993; Vose and Shank 2003). In fishes for example, larger initial size reduces risk of predation, as rapid growth can minimize impacts of gape-limited predators on larval and juvenile survival (Miller et al. 1988; Rice et al. 1993, 1997; Craig et al. in press). In the long-lived freshwater Red-eared Slider (Trachemys scripta elegans), larger initial size at hatching is significantly correlated with higher survival; larger hatchlings moved faster and, therefore, reduced exposure time to predators (Janzen et al. 2000a, 2000b; Janzen and Morjan 2002).
The western North Atlantic Loggerhead Sea Turtle (Caretta caretta) population nests on beaches that span 12 degrees of latitude on the east coast of the United States. Nesting females can be genetically separated into four regional subpopulations based on mtDNA evidence (Bowen et al. 1993; Bowen 1995; Encalada et al. 1998; Bowen et al. 2005). Interregional differences in size-specific growth and mean adult size have been found in some stocks of Green Sea Turtles (Chelonia mydas) and Loggerhead Sea Turtles (Bjorndal and Bolten 1988; Green 1993; Chaloupka and Musick 1997), but little is known of growth patterns within the earliest ontogenetic stages. Our study focused on early stage growth rates within two of these subpopulations.
In addition to genetic differences, regional and seasonal variation in nest environments may also affect hatchling size at emergence and growth potential. Turtle hatchling size differences may be a function of hydric and thermal properties of the nest incubation environment (Gutzke et al. 1987; Packard 1999; Reece et al. 2002; Glen et al. 2003). Initial hatchling size correlates with the amount of water available to facilitate optimal yolk metabolism in many turtle species (Morris et al. 1983; Packard et al. 1987; Miller and Packard 1992; Packard and Packard 2001). In loggerhead hatchlings from natural nests, nest temperature is negatively correlated and percentage sand moisture content is positively correlated with mass (Reece et al. 2002). Cooler nest temperatures are generally associated with higher humidity and longer incubation periods (Packard 1999).
Early-stage size and growth potential are of interest because these factors may directly affect survival during critical periods when mortality risk is high (Miller et al. 1988; Rice et al. 1997; Tucker 2000). Larger hatchlings may be more completely developed, more

Stokes et al. —Early Growth in Loggerhead Sea Turtles
72
capable of feeding upon and processing food, and more mobile, allowing them to build upon their initial size advantage toward more rapid growth, even in the absence of intraspecific competition (Ebenman 1988; Janzen 1993; Ji et al. 2003). Our study systematically examined how neonate initial size and subsequent growth were influenced by temporal, spatial and subpopulation nest origin.
MATERIALS AND METHODS
Sample size and nest origin.—We focused on
hatchlings from the two largest western North Atlantic subpopulations: the “northern” subpopulation (extending from North Carolina, ~ 35°N to northeast Florida, ~ 29°N), and the southern “Florida” subpopulation (extending from ~ 29°N on the east coast southward around the southern peninsula coast and then northward to ~27°N on the west coast). Our study sites (Fig. 1) were natural beaches (not renourished within past five years) selected from index nesting beaches with sufficient historical data to characterize nesting patterns.
Hatchlings (typically 10/nest, four nests/site/seasonal phase) were collected using standard methods (Wyneken and Salmon 1992) from four south Florida sites (N = 450): Melbourne Beach, Hutchinson Island, Juno Beach, and Boca Raton. Hatchlings from four sites in the northern subpopulation (N = 490) were sampled at Cape Lookout, North Carolina, Cape Island and Kiawah Island, South Carolina, and Wassaw Island, Georgia.
The seasonal phases, defined as “Early,” “Middle” and “Late”, at each beach were determined by dividing the historical nesting season into thirds based on records of nest incubation duration and nest densities. Most nests were equipped with temperature loggers (Hobo® H8 or Vemco® Minilog 12-bit dataloggers) positioned in the center of each clutch for a concurrent temperatures and sex ratios study (Blair 2005).
Measurements.—We made initial measurements of the
hatchlings within 48 h of emergence from the nest and repeated them weekly for seven weeks. We measured mass to the nearest 0.01g using an electronic balance scale, and we used vernier calipers to measure linear dimensions to the nearest 0.05mm. Both mass (g/d) and the linear measures (mm/d) of standard straight carapace length notch-to-tip (SCL) and width (SCW) were used to quantify absolute growth. We calculated daily captive growth rates [Eq. 1-2] for the duration of the study, where T1 is the date of initial measurement and T2 is the date of final measurement, M is mass, L is straight carapace length or straight carapace width:
[1] Growth Rate (g/d) = [(MT2) – (MT1)] / (T2- T1)
[2] Growth Rate (mm/d) = [(L T2) – (L T1)] / (T2-T1)
Animal husbandry.—Florida hatchlings were raised at the
Florida Atlantic University Marine Laboratory and northern hatchlings were raised at the Duke University Marine Laboratory using standardized husbandry protocols and feeding regimes. After an initial three to five day quarantine period, we housed the turtles in flow-through seawater tanks maintained at
27° C ± 2° C to approximate thermal conditions in the Gulf Stream current. To approximate natural lighting, we used natural spectrum Verilux® fluorescent lights (200-700 nm, 6000K, 12L: 12D). Each hatchling was maintained singly within a 20 cm x 20 cm suspended plastic mesh basket with a water column depth of 15 cm. Comparisons of growth within larger enclosures and baskets used as a control showed that the size of the rearing containers did not inhibit growth potential within the time period studied (Stokes, unpubl. data). We housed and fed turtles individually to prevent feeding hierarchies, thus maximizing individual growth potentials (after Rajagopalau 1984).
We fed the hatchlings peeled shrimp (Penaeus spp.) once daily, supplemented with Mazuri® Amphibian and Carnivorous Reptile Gel diet once weekly. Each individual was offered 20% of its body weight over an initial two-week period, allowing for controlled ad libitum feeding as they started to eat. After Week Two, they were fed 8% of their body weight daily, an amount that balanced the project goals of optimal growth with long-term health. We removed any turtle displaying health problems from the growth study and excluded their data. After the study, we released posthatchlings offshore into the Florida Current or Gulf Stream. Although shrimp tail meat is adequate to meet the short-term nutritional needs of captive hatchlings (Alexander 2000), it is not ideal for longer maintenance due to high protein levels and low calcium/phosphorus ratio (Alexander 2000) respective to their long-
FIGURE 1. Study sites for the southern Florida (Melbourne Beach, Hutchinson Island, Juno Beach, and Boca Raton) and northern (Cape Lookout, North Carolina, Cape Island and Kiawah Island, South Carolina, and Wassaw Island, Georgia) populations. Graphic created with Maptool program, a product of SEATURTLE.org, Maptool. 2002. SEATURTLE.ORG, Inc. http://www.seaturtle.org/maptool/10/14/06.
Herpetological Conservation and Biology 1(2):71-80
73
term needs. For at least two weeks prior to release, we fed all animals an in-house gelatin diet (modified from Choromanski et al. 1987), comprised of Mazuri® Aquatic Turtle Pellets (300g), fish (600g), spinach (70g, optional), unflavored gelatin (225g), Miner-All-I™ calcium and mineral supplement (90g), and water (1400 ml, heated).
Statistical analysis.—We compared initial measurements
between the northern and Florida turtles. Although we made efforts to standardize protocols between the rearing facilities, we did not directly compare growth rates between the Florida and northern turtles because the two groups were not reared in the same facility. Therefore, we analyzed growth rates independently for each subpopulation. Captive growth rates have been reported as two to three times faster than in turtles housed in semi-natural captive conditions (Uchida 1967; Frazer and Schwartz 1984; Chaloupka and Musick 1997), therefore we are not comparing our captive growth rates to estimates from the wild. We compared growth rates for the period in which temperatures could be maintained in the flow-through systems within ± 2° C (water temperatures dropped slightly in the fall). Thus, we analyzed growth rates in Florida for a
five-week period and northern hatchling measurements were analyzed for a seven-week period.
We analyzed absolute growth rates (g/d and mm/d) using a single clutch average from 10 individuals to provide one independent experimental unit per clutch with clutches from the same beach serving as replicates. We confirmed normality of the data using the Kolmogorov-Smirnov test (Dytham 1999). We used Levene’s Test of Equality of Error Variance (Winer et al. 1991) to test homogeneity of variance. To test the null hypothesis of equal treatment effects from “Beach” and “Phase” factors (Winer et al. 1991), we analyzed differences among the sample groups using a univariate two-way ANOVA with replication, and we conducted Tukey HSD post hoc tests (Winer et al. 1991) for pairwise comparisons. When data did not display homogeneity of variance, we used Kruskal-Wallis tests to identify differences among the groups, and we used Mann-Whitney U Tests for pairwise comparisons (Dytham 1999). To investigate relationships between nest incubation parameters (incubation temperature, incubation duration, and clutch size), we used simple linear regression. We used an α level of 0.05 for all statistical tests.
RESULTS
Initial hatchling size comparisons.—The beach of origin
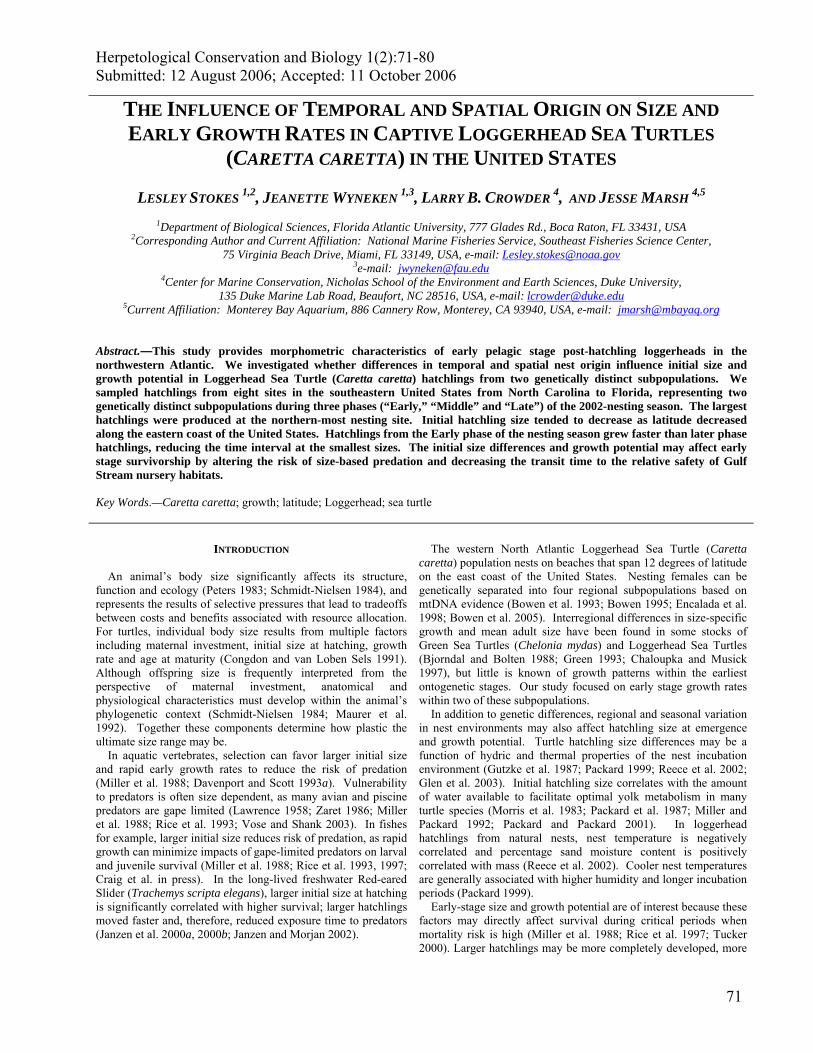
(northern and Florida sites) influenced initial hatching mass (F = 8.14, df = 7, 82, p < 0.001), whereas the phase of the season did not (F = 0.44, df = 2, 82, p = 0.647). Hatchlings from the northern-most site, Cape Lookout (M = 23.64, SD = 3.60), were significantly heavier, averaging nearly four to five grams more than those from all other beaches [Cape Island (M = 19.87, SD = 1.33), Kiawah Island (M = 19.25, SD = 1.29), Wassaw Island (M = 19.31, SD = 1.59), Sarasota (M = 19.23, SD = 2.00), Sanibel Island (M = 18.17, SD = 1.68), Melbourne Beach (M = 18.03, SD = 1.08), Hutchinson Island (M = 18.77, SD = 1.67), Juno Beach (M = 18.65, SD = 1.55), and Boca Raton (M = 18.63, SD = 2.12); Tukey HSD, p < 0.001]. Northern and Florida hatchlings differed significantly in both SCL (U = 538.00, p < 0.001) and SCW (U = 630.50, p < 0.001). Cape Lookout hatchlings were longest and widest, while the shortest and narrowest turtles came from Juno Beach. Initial mass, SCL and SCW measurements tended to be largest at the highest latitudes, and decreased from north to south with latitude (Fig. 2).
Growth rates in Florida.—Daily weight gain among Florida hatchlings did not differ within a five-week period (the time period in which water temperatures were maintained within ± 2° C) in
FIGURE 2. Initial mass, SCL and SCW measurements of Loggerhead Sea Turtle hatchlings in the southern Florida [Melbourne Beach, Hutchinson Island, Juno Beach, and Boca Raton] and the northern samples [Cape Lookout, North Carolina; Cape Island and Kiawah Island, South Carolina; and Wassaw Island, Georgia] plotted against latitude (in decimal degrees, North). Each point represents a mean of measures from 10 hatchlings/nest sampled during the Early, Middle and Late phases of the 2002-nesting season. Initial size generally decreased slightly with latitude from north to south.
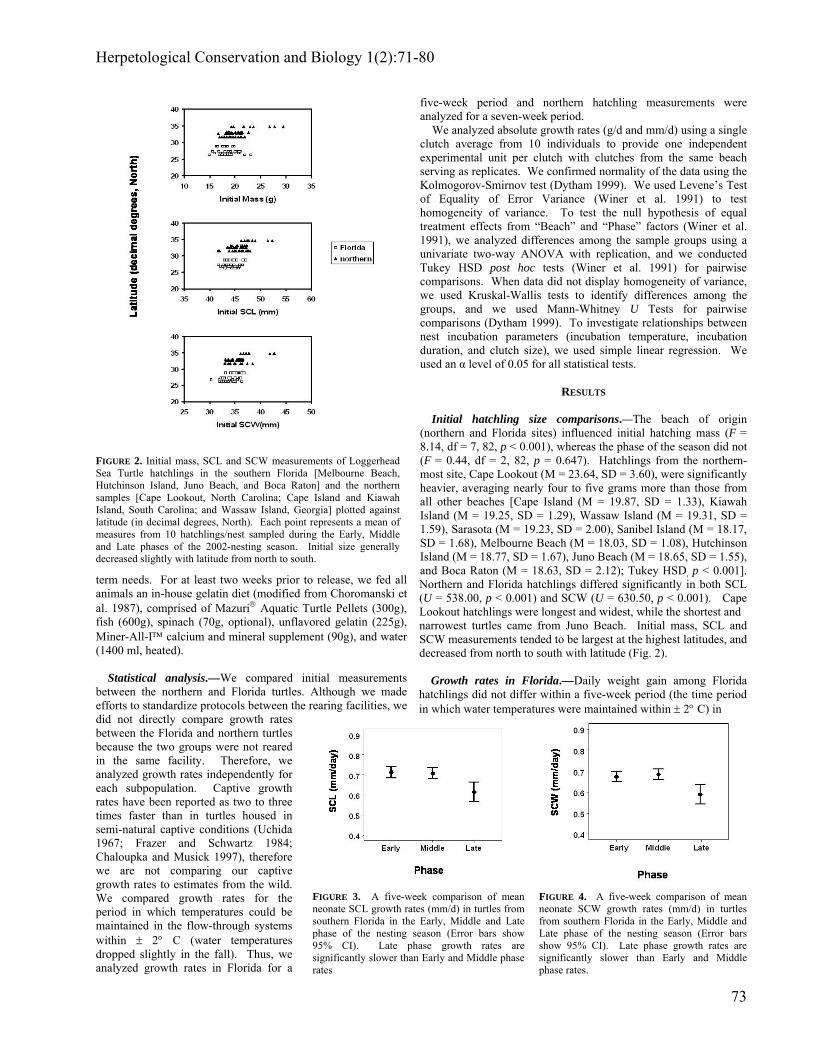
FIGURE 3. A five-week comparison of mean neonate SCL growth rates (mm/d) in turtles from southern Florida in the Early, Middle and Late phase of the nesting season (Error bars show 95% CI). Late phase growth rates are significantly slower than Early and Middle phase rates
FIGURE 4. A five-week comparison of mean neonate SCW growth rates (mm/d) in turtles from southern Florida in the Early, Middle and Late phase of the nesting season (Error bars show 95% CI). Late phase growth rates are significantly slower than Early and Middle phase rates.

Stokes et al. —Early Growth in Loggerhead Sea Turtles
74
hatchlings from different phases of the nesting season (F = 2.97, df = 2, 30, P = 0.067). However, there was a significant slowing (Figs. 3 - 5) in the linear growth rates (SCL F = 11.62, df = 2, 30, P < 0.001; SCW F = 13.66, df = 2, 30, P < 0.001) from the Early to Late phase. Differences in SCL occur between the Early (M = 0.71, SD = 0.05) and Late phases (M = 0.61, SD = 0.08); Tukey HSD, P < 0.001), and between the Middle (M = 0.71, SD = 0.05) and Late phases [(M = 0.61, SD = 0.08); Tukey HSD, P < 0.001]. SCW growth rates were also significantly faster in the Early phase (M = 0.67, SD = 0.04) and the Middle phase (M = 0.68, SD = 0.04) than in the Late phase [(M = 0.59, SD = 0.07); Tukey HSD, P < 0.001]. There were no Beach effects (F = 1.36, df = 3, 30, P = 0.275).
Growth rates in the northern subpopulation.—There were
significant differences within a seven-week period (the time period in which water temperatures were maintained within ± 2° C) in northern hatchling mass gain (Fig. 6) as a function of phase (F = 3.76, df = 2, 37, P = 0.033) as well as Beach (F = 3.89, df = 3, 37, P = 0.016). Mass gain in Early phase hatchlings (M = 1.39, SD = 0.15) was more rapid than that of Late phase hatchlings [(M = 1.21, SD = 0.23); Tukey HSD, P = 0.009]. Cape Lookout hatchlings (M = 1.44, SD = 0.15) gained mass significantly faster than those from Wassaw Island [(M = 1.22, SD = 0.22); Tukey HSD, P = 0.008]. Early phase SCL (Fig. 7) growth rates (M = 0.75, SD = 0.06) were significantly faster (F = 10.80, df = 2, 37, P < 0.001) than Middle [(M = 0.69, SD = 0.06); Tukey HSD, P = 0.011] and Late phase rates [(M = 0.64, SD = 0.06); Tukey HSD, P < 0.001]; there were no Beach effects reflected in SCL (F = 2.50, df = 3, 37, P = 0.074). The SCW growth rates followed a different pattern (Fig. 8). Although the phase of the nesting season did not influence SCW
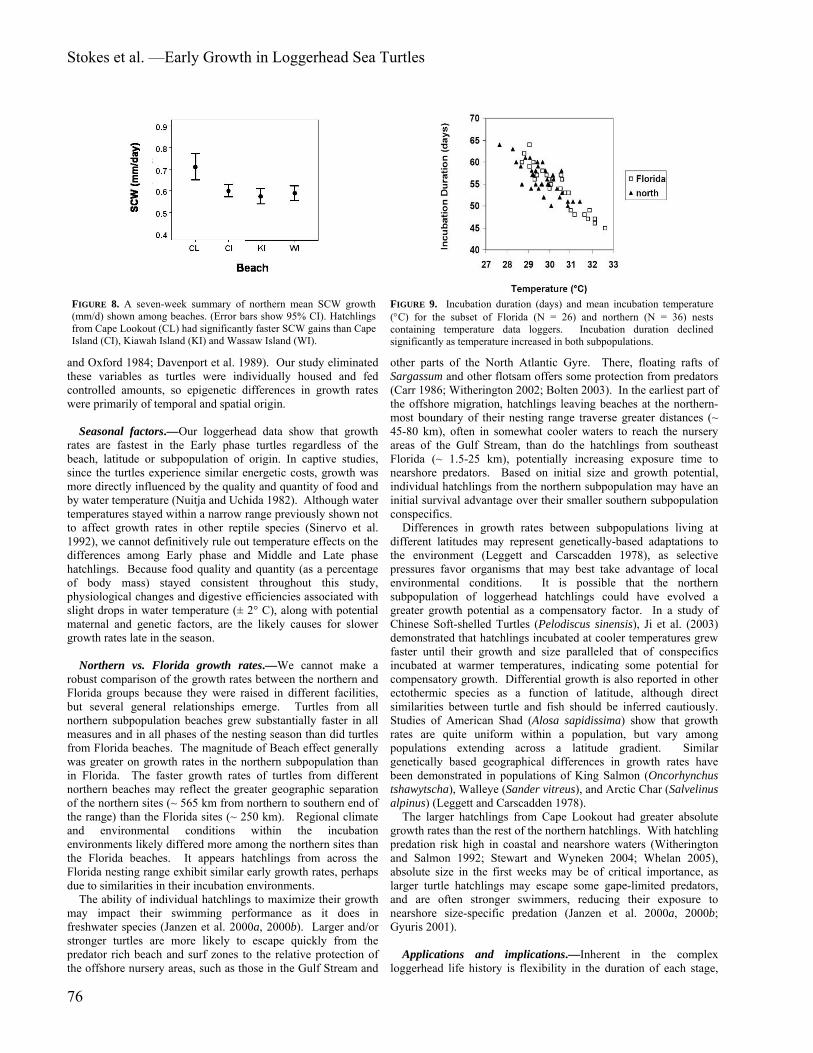
(F = 2.88, df = 2, 37, P = 0.069), the beach site at which turtles hatched did influence these rates (F = 12.31, df = 3, 37, P < 0.001). The hatchlings from Cape Lookout (M = 0.74, SD = 0.05) grew wider faster than turtles from Cape Island [(M = 0.69, SD = 0.07); Tukey HSD, P < 0.001], Kiawah Island [(M = 0.68, SD = 0.05); Tukey HSD, P < 0.001], and Wassaw Island [(M = 0.68, SD = 0.09); Tukey HSD, P < 0.001].
Northern vs. Florida growth rates.—Significant differences in the growth rates of turtles from different beaches in the northern group were found in two of three measurement parameters (Mass F = 3.89, df = 3, 37, P = 0.016; SCW F = 12.31, df = 3, 37, P < 0.001), but there were no Beach effects in Florida (F =1.36, df = 3, 30, P = 0.275). However, while Cape Lookout turtles were larger initially, proportional growth increases were nearly identical to those of the other turtles from the northern sites and to rates in the Florida subpopulation (197% increase in mass and 57-59% increase in SCL over a five-week period).
Nest incubation temperature and duration.—There was an
inverse relationship between mean nest incubation temperatures and incubation duration, as warmer nests had shorter incubation durations (Fig. 9). Florida nests tended to be warmer and have shorter incubation durations than northern nests overall. Incubation temperatures predicted incubation duration (β = -3.77, t (60) = -13.42, P < 0.01) and explained a significant proportion of variance in incubation duration (r2 = 0.75, F = 180.01, df = 1, 60, P < 0.01). No other significant relationships were found among incubation temperature, duration, and clutch size. Both Florida and northern nests had slightly cooler incubation temperatures and longer incubation durations during the Early and Middle phases than in the Late phase (Table 1). The coolest sites were the northern-most ones
FIGURE 5. Representative growth curves for hatchlings from Boca Raton, Florida collected in the Early, Middle and Late phases of the nesting season. (Points represent grand means and error bars show 95% CI). Plots were similar in form for all beaches in the study.
FIGURE 6. A seven-week summary of mean mass gains (g/d) shown among beaches and across seasonal phases in the northern turtles. (Error bars show 95% CI). Early phase hatchlings gained mass significantly faster than Late phase hatchlings, and Cape Lookout (CL) hatchlings grew significantly faster than those from Wassaw Island (WI).
FIGURE 7. A seven-week summary of northern turtle mean SCL growth (mm/d) shown across seasonal phases. (Error bars show 95% CI). Early phase SCL growth rates were significantly faster than Middle and Late phases with no Beach effects.

Herpetological Conservation and Biology 1(2):71-80
75
from each subpopulation, Melbourne Beach in Florida and Cape Lookout in the north, although there was some overlap across the entire range.
DISCUSSION
The ecological importance of body size in sea turtles is
apparent at each life history stage. The life history characteristics of sea turtles imply early rapid growth to minimize size-specific mortality risk (Davenport and Scott 1993a). Growth rates affect duration of size-specific mortality, stage class recruitment, energetics, swimming performance, age and size at maturity (Stearns and Koella 1986), and in sexually mature females, fecundity (Van Buskirk and Crowder 1994). The epigenetic factors that ultimately determine a hatchling’s body size represent tradeoffs in resource acquisition and allocation and the energetic costs associated with each (Bernardo 1996).
Though gaining an insight into the selective advantage of phenotypic variation is a crucial step in understanding the evolution of life history traits (Sinervo and Doughty 1996), few controlled growth studies are available. Measurements of phenotypic variation are often based on field studies that cannot control for multiple effects on phenotypes. Controlled studies
such as this one strive to identify the proximate causal mechanisms and patterns of phenotypic variation in growth rates.
Initial body size at hatching.—Initial hatchling size is a function of egg size, nest location, incubation duration and temperatures, as well as developmental physiological processes (Ackerman 1997). Phenotypic plasticity in turtle hatchling size extends beyond genetics to include influences of egg and yolk size (Pinchney 1990; Steyermark and Spotila 2001) and the impact of the hydric and thermal properties of the nest incubation environment (Gutzke et al. 1987; Glen et al. 2003).
Initial hatchling size correlates with the amount of water available to facilitate optimal yolk metabolism in a number of turtle species, including sea turtles. Embryonic growth and yolk consumption in Snapping Turtles (Chelydra serpentina) are directly related to the water reserve available to the egg (Morris et al. 1983; Packard et al. 1987; Packard and Packard 2001). Eggs incubated in drier environments hatch sooner and produce smaller hatchlings than those in wetter environments, suggesting potential differences (Packard 1984). In an analysis of loggerhead nests, temperature correlates negatively and percent water content correlates positively with hatchling mass (Reece et al. 2002). A study of Green Sea Turtles produced similar results, where hatchlings experiencing warmer incubation temperatures were significantly smaller suggesting that nest incubation temperature may play an important part determining phenotypic variation in hatchlings (Glen et al. 2003). Our largest hatchlings came from Cape Lookout from nests that averaged slightly cooler incubation temperatures and incubated slightly longer than other clutches (Table 1). The smallest turtles were found in Florida, where incubation temperatures tended to be warmer and incubation durations were shorter. Initial mass, SCL and SCW measurements tended to decrease with latitude from north to south. Although environmental nest parameters were not the focus of this study, moisture content and incubation temperatures probably contributed to this latitudinal phenotypic variation. The ability of turtles to survive involves maximizing physiological and morphological performance to minimize mortality risks. Clearly, species differ in whether “bigger is
better” for hatchling survival (Congdon et al. 1999; Tucker 2000). Our study design did not enable us to test if the larger initial size of these northern hatchlings would ultimately increase their survival odds. Larger hatchlings may reach the water more quickly, be stronger swimmers and be able to escape predators more effectively, but they are likely to have smaller yolk reserves (Miller et al. 1987; Pinckney 1990; Janzen 1993; Janzen et al. 2000a, 2000b) and need to locate food sooner than smaller hatchlings with larger yolk reserves (Reece et al. 2002).
Hatchling growth rates.—Differences in turtle growth rates may
reflect clutch differences, the downstream effects of incubation temperatures, and egg size differences (Rhen and Lang 1995; Janzen and Morjan 2002; Ji et al. 2003). Most reptile growth studies report wide variability in individual growth rates, even when environmental conditions are closely controlled, indicating that genetic variation among individuals is also important (Andrews 1982; Sinervo et al. 1992). Studies with Green Sea Turtles show that growth is extremely variable among individuals, though relatively stable for individuals (Davenport and Scott 1993b). However, turtles in that study were housed collectively and fed to satiation, increasing the possibility that competition or dominance hierarchies causing disproportionate feeding rates (Ebenmann 1988), thereby exaggerating variance among individuals (Davenport
TABLE 1. Estimated mean incubation duration, total clutch size and mean incubation temperature from Florida [Boca Raton (BR), Juno Beach (JU), Hutchinson Island (HI), and Melbourne Beach (ME)] and northern sites [Wassaw Island, Georgia (WI), Kiawah Island (KI) and Cape Island (CI), South Carolina, and Cape Lookout, North Carolina (CL)], listed from south to north. (N = number of nests for which incubation parameters were available).
Site/Phase
Mean Incubation Duration ± SE
Estimated Total
# of Eggs ± SE
Mean Incubation
Temperature (°C) ± SD
Florida BR Early (N = 4) 55.8 ± 1.7 127.0 ± 4.0 28.8 ± 1.3 BR Mid (N = 4) 56.0 ± 0.4 93.3 ± 4.2 29.2 ± 1.6 BR Late (N = 4) 48.0 ± 1.6 86.0 ± 3.7 31.8 ± 0.7 JU Early (N = 4) 56.8 ± 0.5 n/a 30.1 ± 1.1 JU Mid (N = 4) 55.0 ± 0.6 101.5 ± 18.5 29.6 ± 1.7 JU Late(N = 3) 47.3 ± 0.3 103.0 ± 6.7 31.8 ± 0.7 HI Early(N = 4) 57.3 ± 1.3 93.0 ± 16.0 29.1 ± 0.8 HI Mid (N = 4) 58.0 ± 3.2 103.3 ± 26.0 30.2 ± 1.4 HI Late (N = 3) 50.0 ± 1.5 102.3 ± 6.5 31.2 ± 1.2
ME Early(N = 4) 61.5 ± 0.7 126.0 ± 13.3 27.9 ± 1.5 ME Mid (N = 4) 59.3 ± 1.3 96.0 ± 14.0 28.7 ± 1.6 ME Late (N = 3) 51.0 ± 0.6 72.3 ± 4.4 26.6 ± 2.6
Northern WI Early (N = 4) 59.0 ± 2.8 109.5 ± 5.9 28.5 ± 2.7 WI Mid (N = 6) 54.3 ± 1.1 107.5 ± 12.5 30.1 ± 2.2 WI Late (N = 4) 55.7 ± 0.7 99.3 ± 15.1 29.3 ± 0.7 KI Early (N = 4) 58.0 ± 0.6 105.8 ± 10.0 29.1 ± 2.2 KI Mid (N = 3) 55.8 ± 1.3 104.0 ± 16.4 29.9 ± 2.3 KI Late (N = 4) 52.3 ± 1.5 112.7 ± 12.6 29.8 ± 1.3 CI Early (N = 4) 59.3 ± 0.8 115.0 ± 5.8 29.6 ± 2.5 CI Mid (N = 5) 56.4 ± 0.8 118.7 ± 9.7 30.0 ± 2.5 CI Late(N = 4) 51.3 ± 0.6 109.0 ± 5.0 31.0 ± 1.7
CL Early (N = 3) 61.3 ± 0.9 106.0 ± 4.9 28.6 ± 1.9 CL Mid (N = 4) 53.7 ± 0.9 117.0 ± 8.9 29.6 ± 1.7
CL Late (N = 2) 56.7 ± 2.2 125.3 ± 11.3 29.4 ± 1.5
Stokes et al. —Early Growth in Loggerhead Sea Turtles
76
and Oxford 1984; Davenport et al. 1989). Our study eliminated these variables as turtles were individually housed and fed controlled amounts, so epigenetic differences in growth rates were primarily of temporal and spatial origin.
Seasonal factors.—Our loggerhead data show that growth
rates are fastest in the Early phase turtles regardless of the beach, latitude or subpopulation of origin. In captive studies, since the turtles experience similar energetic costs, growth was more directly influenced by the quality and quantity of food and by water temperature (Nuitja and Uchida 1982). Although water temperatures stayed within a narrow range previously shown not to affect growth rates in other reptile species (Sinervo et al. 1992), we cannot definitively rule out temperature effects on the differences among Early phase and Middle and Late phase hatchlings. Because food quality and quantity (as a percentage of body mass) stayed consistent throughout this study, physiological changes and digestive efficiencies associated with slight drops in water temperature (± 2° C), along with potential maternal and genetic factors, are the likely causes for slower growth rates late in the season.
Northern vs. Florida growth rates.—We cannot make a
robust comparison of the growth rates between the northern and Florida groups because they were raised in different facilities, but several general relationships emerge. Turtles from all northern subpopulation beaches grew substantially faster in all measures and in all phases of the nesting season than did turtles from Florida beaches. The magnitude of Beach effect generally was greater on growth rates in the northern subpopulation than in Florida. The faster growth rates of turtles from different northern beaches may reflect the greater geographic separation of the northern sites (~ 565 km from northern to southern end of the range) than the Florida sites (~ 250 km). Regional climate and environmental conditions within the incubation environments likely differed more among the northern sites than the Florida beaches. It appears hatchlings from across the Florida nesting range exhibit similar early growth rates, perhaps due to similarities in their incubation environments.
The ability of individual hatchlings to maximize their growth may impact their swimming performance as it does in freshwater species (Janzen et al. 2000a, 2000b). Larger and/or stronger turtles are more likely to escape quickly from the predator rich beach and surf zones to the relative protection of the offshore nursery areas, such as those in the Gulf Stream and
other parts of the North Atlantic Gyre. There, floating rafts of Sargassum and other flotsam offers some protection from predators (Carr 1986; Witherington 2002; Bolten 2003). In the earliest part of the offshore migration, hatchlings leaving beaches at the northern-most boundary of their nesting range traverse greater distances (~ 45-80 km), often in somewhat cooler waters to reach the nursery areas of the Gulf Stream, than do the hatchlings from southeast Florida (~ 1.5-25 km), potentially increasing exposure time to nearshore predators. Based on initial size and growth potential, individual hatchlings from the northern subpopulation may have an initial survival advantage over their smaller southern subpopulation conspecifics.
Differences in growth rates between subpopulations living at different latitudes may represent genetically-based adaptations to the environment (Leggett and Carscadden 1978), as selective pressures favor organisms that may best take advantage of local environmental conditions. It is possible that the northern subpopulation of loggerhead hatchlings could have evolved a greater growth potential as a compensatory factor. In a study of Chinese Soft-shelled Turtles (Pelodiscus sinensis), Ji et al. (2003) demonstrated that hatchlings incubated at cooler temperatures grew faster until their growth and size paralleled that of conspecifics incubated at warmer temperatures, indicating some potential for compensatory growth. Differential growth is also reported in other ectothermic species as a function of latitude, although direct similarities between turtle and fish should be inferred cautiously. Studies of American Shad (Alosa sapidissima) show that growth rates are quite uniform within a population, but vary among populations extending across a latitude gradient. Similar genetically based geographical differences in growth rates have been demonstrated in populations of King Salmon (Oncorhynchus tshawytscha), Walleye (Sander vitreus), and Arctic Char (Salvelinus alpinus) (Leggett and Carscadden 1978).
The larger hatchlings from Cape Lookout had greater absolute growth rates than the rest of the northern hatchlings. With hatchling predation risk high in coastal and nearshore waters (Witherington and Salmon 1992; Stewart and Wyneken 2004; Whelan 2005), absolute size in the first weeks may be of critical importance, as larger turtle hatchlings may escape some gape-limited predators, and are often stronger swimmers, reducing their exposure to nearshore size-specific predation (Janzen et al. 2000a, 2000b; Gyuris 2001).
Applications and implications.—Inherent in the complex
loggerhead life history is flexibility in the duration of each stage,
FIGURE 8. A seven-week summary of northern mean SCW growth (mm/d) shown among beaches. (Error bars show 95% CI). Hatchlings from Cape Lookout (CL) had significantly faster SCW gains than Cape Island (CI), Kiawah Island (KI) and Wassaw Island (WI).
FIGURE 9. Incubation duration (days) and mean incubation temperature (°C) for the subset of Florida (N = 26) and northern (N = 36) nests containing temperature data loggers. Incubation duration declined significantly as temperature increased in both subpopulations.

Herpetological Conservation and Biology 1(2):71-80
77
determined primarily by growth rate. It is important to understand the duration at each life history stage, including the hatchling and post-hatchling stages investigated in this study, as the survival rates at this stage may have a large impact on overall population growth (Heppell et al. 2003). This study provides morphometric and demographic characteristics of early pelagic stage post-hatchling loggerheads in the northwestern Atlantic. We partition variation in growth for captive turtles among selected factors: temporal and spatial nest origin, and initial hatchling size, and we show that there is a latitudinal trend in initial hatchling size, as well as a seasonal phase effect on early growth rates.
To formulate effective management plans, we must understand size and growth patterns to provide context for assessing size- or stage-specific risks. Based upon our results, hatchlings from the southern-most and northern-most portions of the nesting range, as well as those from different phases of the nesting season, may face different size specific risks or differ in their time at the smaller size classes. These components can now be considered when estimating size-specific mortality or size-age relationships.
Acknowledgments.—We thank Kimberly Blair, Peter Lutz,
Kirt Rusenko, Michael Salmon, Jay Vaughan, Neal Tempel, Jim Weege, Larry Wood and Gary Stokes for providing invaluable assistance during this project. Alan J. Nash provided statistical consultation. The following organizations provided assistance in the field: Cape Lookout National Sea Shore, Cape Island Turtle Program, Duke University Marine Laboratory, Ecological Associates, Georgia DNR, Kiawah Island Turtle Program, Marinelife Center at Juno Beach, Mote Marine Laboratory, Quantum Associates (FPL), Sanibel-Captiva Sea Turtle Program, National Marine Fisheries Service, UCF Marine Turtle Program, Palm Beach County DERM, Miami-Dade County DNR, and North Carolina Wildlife Commission. Dean Bagley, Corie Baird, Beverly Ball, Michael Bresette, Kimberly Blair, Meghan Conti, Mark Dodd, Lew Ehrhart, Sheryan Epperly, Jerris Foote, Michael Frick, Matthew Godfrey, Kristie Grigg, Craig Harms, Rick Herren, Chris Johnson, Stacy Kubis, Charles Manire, Catherine, McClellan, Sally Murphy, Kelly Rogers, Kelly Stewart, Sean Smith, and Blair Witherington assisted with hatchling collections, turtle care, or provided historical data. The authors acknowledge use of Maptool program, a product of SEATURTLE.ORG, for graphics.
Animals were cared for in strict accordance with the guidelines set forth by Florida Atlantic University’s Institutional Animal Care and Use Committee under authorization # A0026, and by Duke University IACUC # A147-02-05. Work was conducted under Florida Fish and Wildlife Conservation Commission Sea Turtle Permit # 073, North Carolina Endangered Species Permit 02ST75, USFWS permit TE05217-2 to Jeanette Wyneken, South Carolina Sea Turtle Permit 2002 and Georgia Sea Turtle Permit 2002 to Larry Crowder. The study was funded by an Environmental Protection Agency STAR Grant R82-9094, the National Marine Fisheries Service Southeast Fisheries Science Center to Jeanette Wyneken and Larry Crowder, and by personal funds.
LITERATURE CITED
Ackerman, R.A. 1997. The nest environment and the embryonic development of sea turtles. Pp. 83-106 In The Biology of Sea Turtles. Lutz, P., and J. Musick (Eds.). CRC Press, Boca Raton, Florida, USA.
Alexander, J. 2000. Calcium requirement and growth in the hatchling loggerhead sea turtle (Caretta caretta). M.Sc. Thesis, Florida Atlantic University, Boca Raton, Florida, USA, 62 p.
Andrews, R.M. 1982. Patterns of growth in reptiles. Pp. 273-320 In Biology of the Reptilia, Volume 13. Gans, C., and F.H. Pough (Eds.). Academic Press, New York, New York, USA.
Bernardo, J. 1996. The particular maternal effect of propagule size, especially egg size: patterns, models, quality of evidence and interpretations. American Zoologist 36:216-236.
Bjorndal, K.A., and A.B. Bolten. 1988. Growth rates of immature green turtles, Chelonia mydas, on feeding grounds in the southern Bahamas. Copeia 1988: 555-564.
Blair, K. 2005. Determination of accurate sex ratios and their relationship to nest temperature of loggerhead sea turtle (Caretta caretta, L.) hatchlings produced along the southeastern Atlantic coast. M.Sc. Thesis, Florida Atlantic University, Boca Raton, Florida, USA. 86 p.
Bolten, A. B. 2003. Active swimmers – passive drifters: the oceanic juvenile state of loggerheads in the Atlantic system. Pp. 63-78 In The Biology of Sea Turtles. Lutz, P., and J. Musick (Eds.). CRC Press, Boca Raton, Florida, USA.
Bowen, B.W. 1995. Tracking marine turtles with genetic markers. BioScience 45:528-534.
Bowen, B.W., J.C. Avise, J.I. Richardson, A.B. Meylan, D. Margaritoulis, and S.R. Hopkins-Murphy. 1993. Population structure of loggerhead turtles (Caretta caretta) in the northwestern Atlantic Ocean and Mediterranean Sea. Conservation Biology 7:834-844.
Bowen, B.W., A.L. Bass, L. Soares, and R.J. Toonen. 2005. Conservation implications of complex population structure: Lessons from the loggerhead turtle (Caretta caretta). Molecular Ecology 14:2389–2402.
Carr, A. F. 1986. Rips, FADS and little loggerheads. BioScience 36:92-100.
Chaloupka, M.Y., and J.A. Musick. 1997. Age, growth, and population dynamics. Pp. 233-276 In The Biology of Sea Turtles. Lutz, P., and J. Musick (Eds.). CRC Press, Boca Raton, Florida, USA.
Choromanski, J.M., R.H. George, and S.A. Bellmund. 1987. Nutritional benefit of a marine animal gelatin diet as measured by sea turtle blood chemistry values. Proceedings of 1987 AAZPA National Conference:501-511.
Congdon, J.D., and R.C. Van Loben Sels. 1991. Growth and body size in Blanding’s turtles (Emydoidea blandingi): relationships to reproduction. Canadian Journal of Zoology 69:239-245.
Congdon, J.D., R.D. Nagle, A.E. Dunham, C.W. Beck, O.M. Kinney, and S.R. Yeomans. 1999. The relationship of body size to survivorship of hatchling snapping turtles (Chelydra serpentina): an evaluation of the “bigger is better” hypothesis. Oecologia 121:224-235.
Craig, J.K., B.J. Burke, L.B. Crowder, and J.A. Rice. In press. Prey growth dynamics and size-dependent predation interactions in juvenile estuarine fishes: Experimental and model analyses. Ecology.
Davenport, J., and P.J. Oxford. 1984. Feeding, gut dynamics, digestion and oxygen consumption in hatchling green turtles (Chelonia mydas L.) British Journal of Herpetology 6:351-358.
Davenport, J., and C.R. Scott. 1993a. Individual growth and allometry of young green turtles (Chelonia mydas L.). Herpetological Journal 3:19-25.
Davenport, J., and C.R. Scott. 1993b. Individuality of growth, appetite, metabolic rate and assimilation of nutrients in young green turtles (Chelonia Mydas L.). Herpetological Journal 3:26-31.

Stokes et al. —Early Growth in Loggerhead Sea Turtles
78
Davenport, J., S. Antipas, and E. Blake. 1989. Observations of gut function in young green turtles. Herpetological Journal 1:336-342.
Dytham, C. 1999. Choosing and Using Statistics: A Biologist’s Guide. Blackwell Science, Ltd., Oxford, United Kingdom.
Ebenman, B. 1988. Dynamics of age-and size-structured populations: Interspecific competition. Pp. 127-139 In Size-structured Populations: Ecology and Evolution. Ebenman B., and L. Persson (Eds.). Springer-Verlag, Berlin, Germany.
Encalada, S.E., K.A. Bjorndal, A.B. Bolten, J.C. Zurita, B. Schroeder, E. Possardt, C.J. Sears, and B.W. Bowen. 1998. Population structure of loggerhead turtle (Caretta caretta) nesting colonies in the Atlantic and Mediterranean as inferred from mitochondrial DNA control region sequences. Marine Biology 130:567-575.
Frazer, N.B., and F.J. Schwartz. 1984. Growth curves for captive loggerhead turtles, Caretta caretta, in North Carolina, USA. Bulletin of Marine Science 34:485-489.
Glen, F., A.C. Broderick, B.J. Godley, and G.C. Hays. 2003. Incubation environment affects phenotype of naturally incubated green turtle hatchlings. Journal of the Marine Biological Association of the UK 83:1183-1186.
Green, D. 1993. Growth rates of wild immature green turtles in the Galapagos Islands, Ecuador. Journal of Herpetology 27:338-341.
Gutzke W.N., G.C. Packard, M.J. Packard, and T. Boardman. 1987. Influence of the hydric and thermal environments on eggs and hatchlings of painted turtles (Chrysemys picta). Herpetologica 43:393-404.
Gyuris, E. 2001. The relationship between body size and predation rates on hatchlings of the Green Turtle (Chelonia mydas): is bigger better? Pp. 143–147 In Sea Turtles of the Indo-Pacific. Pilcher, N. and G. Ismail (Eds.). Sea Turtles of the Indo-Pacific, Research Management and Conservation. ASEAN Academic Press Ltd, London, England.
Heppell, S.S., L.B. Crowder, D.T. Crouse, S.P. Epperly, and N.B. Frazer. 2003. Population models of Atlantic loggerheads: past present, and future. Pp. 255-273 In Synopsis of the Biology and Conservation of Loggerhead Sea Turtles. Bolten, A. and B. Witherington (Eds.). Smithsonian Institution Press, Washington, D.C., USA.
Janzen, F.J. 1993. An experimental analysis of natural selection on body size of hatchling turtles. Ecology 74:332-341.
Janzen, F.J., and C.L. Morjan. 2002. Egg size, incubation temperature, and posthatching growth in painted turtles (Chrysemys picta). Journal of Herpetology 36:308-311.
Janzen, F.J., J.K. Tucker, and G.L. Paukstis. 2000a. Experimental analysis of an early life-history stage: selection on size of hatchling turtles. Ecology 81:2290-2304.
Janzen, F.J., J.K. Tucker, and G.L. Paukstis. 2000b. Experimental analysis of an early life-history stage: avian predation selects for larger body size of hatchling turtles. Journal of Evolutionary Biology 13:947-954.
Ji, X., F. Chen, W.G. Du, and H.L. Chen. 2003. Incubation temperature affects hatchling growth but not sexual phenotype in the Chinese soft-shelled turtle, Pelodiscus sinensis (Trionychidae). Journal of Zoology, London 261:409-416.
Lawrence, J.M. 1958. Estimated sizes of various forage fishes largemouth bass can swallow. Proceedings of the Annual Conference Southeastern Association of Game and Fish Commissioners 11:220-225.
Leggett, W.C., and J.E. Carscadden. 1978. Latitudinal variations in reproductive characteristics of American shad (Alosa
sapidissima). Evidence for population specific life-history strategies in fish. Journal of the Fisheries Research Board of Canada 35:1469-1478.
Maurer, B.A., J.H. Brown, and R.D. Rusler. 1992. The micro and macro in body size evolution. Evolution 46:939–953.
Miller, K., and G.C. Packard. 1992. The influence of substrate water potential during incubation on the metabolism of embryonic snapping turtles (Chelydra serpentina). Physiological Zoology 65:172-187.
Miller, K., G.C. Packard, and M.J. Packard. 1987. Hydric conditions during incubation influence locomotor performance of hatchling snapping turtles. Journal of Experimental Biology 127:401-412.
Miller, T.J., L.B. Crowder, J.A. Rice, and E.A. Marschall. 1988. Larval size and recruitment mechanisms in fishes: Toward a conceptual framework. Canadian Journal of Fisheries and Aquatic Sciences 45:1657-1670.
Morris, K.A., G.C. Packard, T.J. Boardman, G.L. Paukstis, and M.J. Packard. 1983. Effect of the hydric environment on growth of embryonic snapping turtles (Chelydra serpentina). Herpetologica 39:272-285.
Nuitja, I.N., and I. Uchida. 1982. Preliminary studies on the growth and food consumption of the juvenile loggerhead turtle (Caretta caretta L.) in captivity. Aquaculture 27:157-160.
Packard, G.C. 1999. Water relations of chelonian eggs and embryos: Is wetter better? American Zoologist 39:289-303.
Packard, G.C., and M.J. Packard. 1984. Effects of the hydric environment on metabolism of embryonic snapping turtles do not result from altered patterns of sexual differentiation. Copeia 1984:547-550.
Packard, G.C., and M.J. Packard. 2001. Environmentally induced variation in size, energy reserves, and hydration of hatchling painted turtles, Chrysemys picta. Functional Ecology 15:481-489.
Packard, G.C., M.J. Packard, K. Miller, and T.J. Boardman. 1987. Influence of moisture, temperature, and substrate on snapping turtle eggs and embryos. Ecology 68:983-993.
Peters, R.H. 1983. The Ecological Implications of Body Size. Cambridge University Press, Cambridge, Massachusetts, USA.
Pinckney, J. 1990. Correlation analysis of adult female, egg, and hatchling sizes in the loggerhead turtle, Caretta caretta (L.), nesting at Kiawah Island, South Carolina. Bulletin of Marine Science 47:670-679.
Rajagopalau, M. 1984. Studies on the growth of olive ridley Lepidochelys olivacea in captivity. Central Marine Fisheries Research Institute Bulletin 35:49-54.
Reece, S.E., A.C. Broderick, B.J. Godley, and S.A. West. 2002. The effects of incubation environment, sex, and pedigree on the hatchling phenotype in a natural population of loggerhead turtles. Evolutionary Ecology Research 4:737-748.
Rhen, T., and J.W. Lang. 1995. Phenotypic plasticity in the common snapping turtle: effects of incubation temperature, clutch, and their interaction. American Naturalist 146:726-747.
Rice, J.A., L.B. Crowder, and K.A. Rose. 1993. Interactions between size-structured predator and prey populations: experimental test and model comparison. Transactions of the American Fisheries Society 122:481-491.
Rice, J.A., L.B. Crowder, and E.A. Marschall. 1997. Predation on juvenile fishes: Dynamic interactions between size-structured predators and prey. Pp. 333-356 In Early Life History and Recruitment in Fish Populations. Chambers, R.C., and E.A. Trippel (Eds.). Chapman & Hall, New York, New York, USA.

Herpetological Conservation and Biology 1(2):71-80
79
Schmidt-Nielsen, K. 1984. Scaling. Why is Animal Size So Important? Cambridge University Press, Cambridge, United Kingdom.
Sinervo, B.D., and P. Doughty. 1996. Interactive effects of offspring size and timing of reproduction on offspring reproduction: experimental, maternal, and quantitative genetic aspects. Evolution 50:1314-1327.
Sinervo, B., P. Doughty, R.B. Huey, and K. Zamudio. 1992. Allometric engineering: A causal analysis of natural selection on offspring size. Science 258:1927-1930.
Stewart, K.R., and J. Wyneken. 2004. Predation risk to loggerhead hatchlings at a high-density nesting beach in southeast Florida. Bulletin of Marine Science 74:325-335.
Steyermark, A.C., and J.R. Spotila. 2001. Effects of maternal identity and incubation temperature on hatchling morphology in snapping turtles, Chelydra serpentina. Copeia 2001:129-135.
Stearns, S.C., and J. Koella. 1986. The evolution of phenotypic plasticity in life-history traits: Predictions for norms of reaction for age- and size-at-maturity. Evolution 40:893-913.
Tucker, J. K. 2000. Body size and migrations of hatchling turtles: Inter- and intraspecific comparisons. Journal of Herpetology 34:541-546.
Uchida, I. 1967. On the growth of the loggerhead turtles, Caretta caretta, under rearing conditions. Bulletin of the Japanese Society of Scientific Fisheries 33:497-507.
Van Buskirk, J., and L.B. Crowder. 1994. Life-history variation in marine turtles. Copeia 1994:66-81.
Vose, F.E., and B.V. Shank. 2003. Predation on loggerhead and leatherback post-hatchlings by gray snapper. Marine Turtle Newsletter 99:11-14.
Whelan, C.L. 2005. Estimating predation levels and site-specific survival of hatchling loggerhead sea turtles (Caretta caretta) from South Florida beaches. M.Sc. Thesis, Florida Atlantic University, Boca Raton, Florida, USA. 50 p.
Winer, B.J., D.R. Brown, and K.M. Michaels. 1991. Statistical Principles in Experimental Design, Third Edition. McGraw Hill, Boston, Massachusetts, USA.
Witherington, B.E. 2002. Ecology of neonate loggerhead turtles inhabiting lines of downwelling near a Gulf Stream front. Marine Biology 140:843-853.
Witherington, B.E., and M. Salmon. 1992. Predation on loggerhead turtle hatchlings after entering the sea. Journal of Herpetology 26:226-228.
Wyneken, J., and M. Salmon. 1992. Frenzy and postfrenzy swimming activity in loggerhead, leatherback, and green sea turtles. Copeia 1992:478-484.
Zaret, T.M. 1986. Predation and Freshwater Communities. Yale University Press, New Haven, Connecticut, USA.
ERRATA: Page 74, Line 10 was originally published online as,
“SCW growth rates were also significantly slower….” This should have read, “SCW growth rates were also significantly faster…” This correction has been made in the above text.

Stokes et al. —Early Growth in Loggerhead Sea Turtles
80
LESLEY STOKES currently works as a Research Fishery Biologist for the National Marine Fisheries Service/Southeast Fisheries Science Center. She previously worked as the field manager for the Leatherback Turtle conservation project at Parque Nacional Marino Las Baulas on the Pacific coast of Costa Rica. She holds her M.S. in Biology from Florida Atlantic University and a B.S. in Marine Science from Jacksonville University. Her current research focus involves investigating methods to reduce injury and mortality in incidentally captured sea turtles, primarily in the commercial pelagic longline fisheries.
JESSE MARSH is a Research Analyst for Monterey Bay Aquarium’s Seafood Watch program. Jesse researches and evaluates various fisheries to develop recommendations for the Seafood Watch Pocket Guide. Jesse received her B.A. in Environmental Science from Boston University, and a Master of Environmental Management from Duke University. After researching the interaction of sea turtles and the Blue Crab fishery in North Carolina, she went on to manage a project raising 500 sea turtle hatchlings. After conducting sea turtle field work in Florida and Mexico, and environmental education in North Carolina, she joined the Monterey Bay Aquarium’s Seafood Watch program.
LARRY B. CROWDER is a Stephen Toth Professor of Marine Biology in the Nicholas School of the Environment at Duke University. He holds a Ph.D. from Michigan State University, an M.S. from Michigan State University, and a B.A. California State University Fresno. Dr. Crowder's research centers on predation and food web interactions, mechanisms underlying recruitment variation in fishes, and on population and food web modeling in conservation biology. He has studied food web processes in estuaries and lakes, and has used observational, experimental and modeling approaches to understand these interactions in an effort to improve fisheries management. He co-directed the South Atlantic Bight Recruitment Experiment (SABRE) and continues to conduct research on the life histories of estuarine-dependent fishes. He continues to conduct model and statistical analyses to assist in endangered species management for both aquatic (sea turtles) and terrestrial species (Red-cockaded Woodpeckers). Recently he has begun developing more extensive programs in marine conservation, including research on bycatch, spatial analysis, nutrients and low oxygen, marine invasive species and integrated ecosystem management. Dr. Crowder serves on the editorial board for Ecological Applications, on the Ocean Studies Board of the National Research Council, and on the steering committee for GLOBEC.
JEANETTE WYNEKEN is an Associate Professor of Biological Sciences at Florida Atlantic University. A research choice to focus on questions about the biology of sea turtles lead this University of Illinois graduate (Ph.D. 1988) to career that is geographically and ecologically far from her roots. She leads a diverse and active laboratory that studies turtle behavior, morphology, and physiological ecology, as well addressing conservation and management questions. Many of her studies address the interactions of the animals with their environment, particularly sea turtles in the nearshore environment (orientation, swimming behavior, predation risk). When she is not studying sea turtles, she is can be found exploring reptile structure and function with high-speed CT and FMRI imaging and delivering lectures on reptile anatomy and physiology to veterinarians. She is the author of the Anatomy of Sea Turtles, and co-editor of the Biology of Sea Turtles, vol. II. She continues to use morphology as an underpinning for many other studies and is in the process of completing a book on the anatomy of reptiles.