Two Cathepsins B Are Responsible for the Yolk Protein Hydrolysis in Culex quinquefasciatus

ent 367 (2006) 170–181www.elsevier.com/locate/scitotenv
Science of the Total Environm
Loggerhead sea turtle (Caretta caretta) egg yolk concentrationsof persistent organic pollutants and lipid increase during
the last stage of embryonic development
Juan José Alava a,b,1, Jennifer M. Keller c,⁎, John R. Kucklick c, Jeanette Wyneken d,Larry Crowder e, Geoffrey I. Scott b
a School of the Environment, University of South Carolina, 702G Byrnes Building, Columbia, SC 29208, USAb Center for Coastal Environmental Health and Biomolecular Research, National Oceanic and Atmospheric Administration,
219 Ft. Johnson Road, Charleston, SC 29412, USAc National Institute of Standards and Technology, Hollings Marine Laboratory, 331 Fort Johnson Road, Charleston, SC 29412, USA
d Florida Atlantic University, Department of Biological Sciences, 777 Glades Road, Boca Raton, FL 33431, USAe Duke University Marine Laboratory, 135 Duke Marine Lab Road, Beaufort, NC 28516, USA
Received 13 December 2005; received in revised form 14 February 2006; accepted 21 February 2006Available online 6 March 2006
Abstract
Data are scarce describing the concentrations of polychlorinated biphenyls (PCBs) and organochlorine pesticides in sea turtle eggs.The purpose of this studywas to establish appropriate sample collectionmethodology tomonitor these contaminants in sea turtle eggs.Contaminant concentrations were measured in yolk samples from eggs that failed to hatch from three loggerhead sea turtle (Carettacaretta) nests collected in southern Florida to determine if concentrations change through embryonic development. One to three eggyolk samples per nest were analyzed from early, middle, and late developmental stages (n=22 eggs total). PCB and pesticideconcentrations were determined by gas chromatography with electron capture detection (GC–ECD). Geometric mean concentrationsof∑PCBs (52 congeners),∑DDTs,∑chlordanes, and dieldrin in all eggs were 65.0 (range=7.11 to 3930 ng/g lipid), 67.1 (range=7.88 to 1340 ng/g lipid), 37.0 (range=4.04 to 685 ng/g lipid), and 11.1 ng/g lipid (range=1.69 to 44.0 ng/g lipid), respectively. Earlyand middle developmental stage samples had similar concentrations of PCBs and organochlorine pesticides on a wet-mass basis (ng/gtissue extracted), but the concentrations doubled by the late stage. This increase is most likely attributable to the 50% increase in lipidcontent observed in the late-stage yolk. These findings indicate that an early-stage sample cannot be directly compared to a late-stagesample, especially from different nests. These preliminary findings also allowed us to calculate the minimum number of eggs pernest required for analysis to obtain an acceptable mean concentration per nest. More research is required to investigate geographicaltrends of contaminant concentrations and potential health effects (i.e., abnormalities) caused by these contaminants on sea turtledevelopment.© 2006 Elsevier B.V. All rights reserved.
Keywords: Loggerhead sea turtle; Eggs; PCBs; Organochlorine pesticides; Reptile; Lipid; Embryonic development
⁎ Corresponding author. Tel.: +1 843 762 8863; fax: +1 843 762 8742.E-mail addresses: [email protected] (J.J. Alava), [email protected] (J.M. Keller).
1 Current address: Environmental Toxicology Research Group, School of Resource and Environmental Management, Simon Fraser University,8888 University Drive, Burnaby, British Columbia V5A 1S6, Canada.
0048-9697/$ - see front matter © 2006 Elsevier B.V. All rights reserved.doi:10.1016/j.scitotenv.2006.02.029

171J.J. Alava et al. / Science of the Total Environment 367 (2006) 170–181
1. Introduction
Data on contaminant concentrations in sea turtle tis-sues are scarce and widely dispersed across contaminanttypes, geographic locations, species, and tissues (Pughand Becker, 2001). In the last three decades, eight studiesmeasured persistent organochlorine pollutants (POPs) insea turtle eggs (Hillestad et al., 1974; Thompson et al.,1974; Clark and Krynitsky, 1980; Clark and Krynitsky,1985; Cobb and Wood, 1997; Podreka et al., 1998;Mackenzie et al., 1999; Alam and Brim, 2000). Thesestudies focused on loggerhead (Caretta caretta) andgreen (Chelonia mydas) sea turtles in the Atlantic Oceanand Mediterranean Sea. Just six of these studies reportPOP levels in loggerhead eggs. Most studies focused onmeasuring polychlorinated biphenyls (PCBs) and di-chlorodiphenyltrichloroethane (DDT) metabolites, butonly three of the five PCB contributions used congener-specific analytical techniques (Cobb and Wood, 1997;Mackenzie et al., 1999; Alam and Brim, 2000).
The U.S. Department of the Interior, under the au-thority of the Endangered Species Act, currently lists theloggerhead sea turtle as a threatened species (Leitzell andGreenwalt, 1978). Because of their population status, itis important to measure contaminant concentrations intheir tissues to better understand how chemical pollu-tants may impact their reproductive abilities and surviv-al. Egg samples providemany advantages for monitoringpollutants. They can be collected in a nonlethal manner ifunhatched eggs are sampled after the live hatchlingshave emerged from the nest or if the chorioallantoicmembranes (CAMs) can be found in remaining hatchedeggshells. Loggerhead sea turtle CAMs have been vali-dated as a nonlethal sample that represents the PCBconcentrations in whole eggs (Cobb andWood, 1997), asvalidated with bird and alligator CAMs as well (review-ed byCobb et al., 2003). The drawback to using sea turtleCAMs is that this tissue can be highly disturbed in thenest chamber and mixed with beach sand during hatch-ling emergence. It can, however, be collected in an un-contaminatedmanner from late-stage embryos that fail tohatch as was done by Cobb and Wood (1997). Whetherthe whole egg or a portion (CAM or yolk) is sampled,unhatched eggs are fairly common, because averageloggerhead turtle nests contain more than 100 eggs andhatching success is typically 80% (Miller et al., 2003).Eggs are more accessible for sampling compared tocapturing juveniles or adults at sea. Moreover, the con-tents of sea turtle eggs represent the diet, nutrients, andchemical compounds ingested by adult females (Miller,1997). POPs are thought to be transferred from adultfemales to egg yolk (Meyers-Schöne and Walton, 1994;
Mackenzie et al., 1999); therefore, the concentrations ineggs reflect the exposure not only of the developingembryo, but also of the adult females on their previousforaging grounds.
Loggerhead turtles prey on a wide range of inverte-brates (i.e., crustaceans and mollusks) in benthic envi-ronments (Bjorndal, 1997). They nest every two to threeyears on average, each time laying up to seven clutches(Miller, 1985, 1997; Schroeder et al., 2003). Satellitetagging studies have shown that adult nesting femalesforage in areas far from nesting beaches. Turtles nestingon Florida's west coast migrate to resident foraging areasnear Cuba, Mexico, Florida coastal waters, and in theGulf of Mexico (Schroeder et al., 2003). Turtles nestingon the east coast of Florida forage in all of these areas aswell as near the Bahamas (Schroeder et al., 2003). It is inthese places that the turtles are investing energy re-sources into egg production (Miller et al., 2003).
The purpose of this study was to provide additionalbaseline data on POP concentrations in loggerhead eggsaswell as to improve samplingmethodologies.This studyexamined the change of lipid content and contaminantconcentrations in the yolk through embryonic develop-ment in order to standardize future sampling efforts andanalysis of additional samples. In addition, these datawere also used to determine the number of egg yolksamples required per nest to provide an acceptable es-timate of the average concentration per nest.
2. Materials and methods
2.1. Egg collection and processing
Eggs that failed to hatch were collected from 47 nestsin collaboration with a large-scale project to evaluatesex ratios on nesting beaches along the Southeast coastof the U.S. in 2002 (Blair, 2005). Nests were not re-located (except FLBR14a), but some were caged withwire mesh to minimize predation. The egg samplesanalyzed in this study were selected from only three ofthese nests because each developmental stage was re-presented. Two nests were from Boca Raton, Florida(FLBR2 and FLBR14a) (near 26°23′00.9″N, 80°03′59.8″W) and one from Siesta Key near Sarasota, Florida(FLSA12) (near 27°13′7.60″N, 82°30′54.91″W). Un-hatched eggs were placed in plastic bags during theexcavation of each nest approximately three days to fivedays after the last hatchling emerged. Eggs were shippedovernight with frozen gel packs. After receipt, eggs wererinsed with deionized water to remove sand and openedto determine the stage of embryonic development at thetime the embryo died, to examine for abnormalities, and

172 J.J. Alava et al. / Science of the Total Environment 367 (2006) 170–181
to store samples for several purposes. Only the yolk wasavailable for contaminant analysis. The identification ofearly (E), middle (M), and late (L) embryonic stageswere based on the following criteria: E = small whiteembryo, usually with eyes, without an obvious carapace;M = white embryo with a carapace, without dark scutes;L = large brown or white (amelaninic) embryo with fullyformed scutes. An eggwithout visible development of anembryo was classified as “No” embryo. Middle to latestage embryos were measured and the gonads werestored for sexing. Yolk was separated from the albumenas much as possible and from embryos and stored frozenin hexane-rinsed aluminum foil. Yolk sacs were separat-ed from late-stage embryos using hexane-rinsed stainlesssteel scissors and stored frozen in hexane-rinsed glassvials. Seven to ten egg yolk samples per nest were ana-lyzed individually and represented one to three eggs ofeach stage per nest. Stages No and Ewere considered onegroup. Stages M and L were considered two separategroups. Eggs chosen from each nest are described inTable 1.
2.2. Extraction of yolk
Analysis of egg yolks for POPs followed methodsmodified from Kucklick et al. (2002) and Keller et al.
Table 1Data on loggerhead sea turtle nests and egg yolks analyzed in this study
Nest ID Egg yolk ID Stage SCL(mm)
Samplingdate
FLBR2 FLBR2-17 No embryo NM July 20, 2002FLBR2-19 No embryo NM July 20, 2002FLBR2-27 No embryo NM July 20, 2002FLBR2-15 Middle NM July 20, 2002FLBR2-36 Middle 19.9 July 20, 2002FLBR2-61 Middle 16.0 July 20, 2002FLBR2-12 Late 33.2 July 20, 2002FLBR2-20 Late NM July 20, 2002FLBR2-22 Late NM July 20, 2002
FLBR14a FLBR14a-19 No embryo NM September 25, 2002FLBR14a-18 Early NM September 25, 2002FLBR14a-20 a Middle NM September 25, 2002FLBR14a-24 Middle 15.5 September 25, 2002FLBR14a-11 Late 42.8 September 25, 2002FLBR14a-12 Late 40.3 September 25, 2002
FLSA12 FLSA12-5 No embryo NM September 14, 2002FLSA12-8 No embryo NM September 14, 2002FLSA12-9 No embryo NM September 14, 2002FLSA12-7 Middle 11.6 September 14, 2002FLSA12-2 Late 32.7 September 14, 2002FLSA12-4 Late 29.4 September 14, 2002FLSA12-11 Late 40.0 September 14, 2002
FLBR = Boca Raton; Florida; FLSA = Sarasota, Florida; SCL =straight carapace length; NM = not measured.a Embryo with two heads.
(2004). Egg yolks (2.0 to 5.2 g) were homogenized usingstainless steel spatulas in individual beakers and mixedwith sodium sulfate (Na2SO4). Na2SO4 was previouslycombusted overnight at 700 °C to remove water andorganic compounds. Homogenized samples were trans-ferred to 33mLpressurized fluid extractor (PFE) cells. Sixcalibration solutions were prepared by gravimetricallycombining National Institute of Standards and Technol-ogy (NIST) Standard Reference Materials (SRMs): 2261(Chlorinated Pesticides in Hexane), 2262 (ChlorinatedBiphenyl Congeners in 2,2,4-Trimethylpentane), 2274(PCB Congener Solution-II in Isooctane), 2275 (Chlori-nated Pesticides Solution-II in Isooctane), and anadditional solution containing 15 PCB congeners. Thediluted calibration solutions, ranging from approximately370 ng of each compound to 0.5 ng, were added toindividual PFE cells packed with Na2SO4. An internalstandard solution containing 4,4′-DDT-d8, 4,4′-DDE-d8,4,4′-DDD-d8, Endosulfan I-d4, PCB 103, and PCB 198was added gravimetrically to all PFE cells (45 ng of eachcompound, 0.25 mL added). An analytical blank (a PFEcell packed with Na2SO4), SRM 1946 (Lake SuperiorFish Tissue), and a cryohomogenized composite of tenloggerhead sea turtle egg yolks (from No/E staged eggs)from an additional nest (FLBR13) were also processedalongside the samples for quality control. Samples andcalibrants were extracted with dichloromethane (DCM) inanAccelerated Solvent Extractor (Dionex, Salt Lake City,UT). The extracts of the samples, SRM 1946, and the eggcomposite were filtered through DCM-cleaned siliconephase separation paper (Whatman, Maidstone, England)in order to remove water. Extracts of the blank andcalibration curve were not filtered because they did notcontain water. Extracts were reduced to 10 mL in volumeby evaporation using purified nitrogen in a Turbovap II(Zymark, Hopkinton, MA).
2.3. Lipid determination
Gravimetric lipid analysis was performed to deter-mine the percent lipid in all yolk samples using a methodmodified from Keller et al. (2004). A 2 mL portion ofeach extract (≈20%) was removed and transferredgravimetrically to a tared aluminum dish. The solventwas allowed to evaporate at room temperature for 6 to12 h, and the dried lipid residue was reweighed to thenearest 0.00001 g and used to calculate the percent lipid.
2.4. Extract cleanup and analysis
Lipids and large biomolecules in the extracts wereremoved by size exclusion chromatography according to

173J.J. Alava et al. / Science of the Total Environment 367 (2006) 170–181
Kucklick et al. (2002). Additional cleanup of the extractswas carried out using an automated solid phase extrac-tion system (Rapid Trace SPE workstation, Zymark,Hopkinton, MA) with 1 g Florisil columns eluted with10 mL 1:1 hexane:dichloromethane (volume fractionbasis). Florisil was previously combusted at 700 °C, and12 μL of water was added to each g of Florisil just priorto use. The samples were fractionated with silica col-umns to separate the lower polarity compounds resultingin fraction 1 (F1) from the higher polarity compounds infraction 2 (F2). Compounds contained in F1 included 52PCB congeners, heptachlor, 2,4′-DDE, 4,4′-DDE, 2,4′-DDT, hexachlorobenzene (HCB), aldrin, and mirex.Analytes in F2 included 4,4′-DDT, cis- and trans-chlor-dane, cis- and trans-nonachlor, α-β-, and γ-hexachloro-cyclohexane (HCH), heptachlor epoxide, oxychlordane,2,4′-DDD, 4,4′-DDD, dieldrin, endrin, endosulfan I andII, and endosulfan sulfate. Contaminant concentrationswere determined by gas chromatography with electroncapture detection (GC–ECD) according toKucklick et al.(2002). The amount of each compound was calculatedusing the slope and interceptof linear regressions (amountandpeakarea ratios of the analyteof interest to the internalstandards as x-axis and y-axis variables, respectively)containing at least three calibration points. The limits ofdetection (LODs) were determined by integrating thenoise in the blank for each compound and calculating thenanograms of each compound in the blank using thecalibration curve (if a negative value was obtained, the y-intercept was set to zero). The LOD was established foreachsampleandeachcompoundas3 times thenanogramscalculated in the blank divided by the sample massextracted.
2.5. Statistical analysis
Statistical analyses were conducted using JMP 5.1(SAS, Institute Inc., Cary, NC).∑PCBs were defined asthe sum of 29 detected individual PCB congeners.∑DDTwas defined as the sum of 2,4′-DDE, 4,4′-DDE,and 4,4′-DDD, and ∑chlordanes as the sum of hepta-chlor epoxide, oxychlordane, cis-chlordane, cis-nona-chlor, and trans-nonachlor. Additional PCB congenersand pesticides were not included because they were notdetected in the samples. Organochlorine contaminantconcentrations were lipid normalized by dividing thewet-mass concentration by the fraction of lipid. Lipid-normalized POP concentrations were normally distrib-uted within each nest as tested by the Shapiro–Wilk Wtest. Differences in concentrations among nests weredetermined using a Welch analysis of variance(ANOVA), because the variances of each nest were
unequal (Bartlett test pb0.05). A Turkey–Kramer mul-tiple comparison test was used to determine which nestswere different from the others. To examine changes incontaminant concentrations and lipid content amongdevelopmental stages, the percent change from the No/Estage was calculated for the M and L stages of each nest.The percent changes were averaged across the threenests, and these were normally distributed (Shapiro–Wilk W test, pN0.05) with equal variances between theM and L stages (Bartlett test, pN0.05). The Student'st-test was used to determine differences in contaminantconcentrations and lipid content between middle andlate stages of development. Pearson correlations wereused to examine the relationship between percent lipidand straight carapace length (SCL). Iterations of thefollowing equation were used to estimate the requirednumber of eggs (n) from each nest to obtain an aver-age concentration for that nest that was within an ac-ceptable confidence interval of the measured nest meanconcentration:
n ¼SD2*t20:05ð2Þ;df
d2
where SD=standard deviation; t=two-tailed criticalvalue of a Student's t-test with α=0.05; df=degrees offreedom or (n−1); d=half of the desired confidenceinterval, which was chosen as 30%, 20%, or 10% aboveor below the measured mean concentration (Zar, 1999).This parametric analysis, performed on each nest in-dividually and then averaged across nests, was possi-ble because the POP concentrations were normallydistributed within each nest (Shapiro–Wilk W test,pN0.05).
3. Results
3.1. Quality control analysis
The PCB and pesticide concentrations measuredin two replicates of SRM 1946 differed from NIST'scertified values by an average of −6.8% (range=−27% to 17%) (Table 2), which demonstrates ac-ceptable accuracy. The lipid content measured inSRM 1946 was within 17% of the certified values(Table 2). Concentrations measured in two replicates ofa loggerhead egg composite control material demon-strated precision even at low concentrations (Table 2).The majority of POPs were found below 0.200 ng inthe blank sample, and the blank had concentrations thatranged from 0.020 ng for PCB 206 to 11.5 ng for 4,4′-DDD.

Table 2Concentrations of selected PCBs and pesticides (ng/g wet mass) measured in two aliquots of National Institute of Standards and Technology StandardReference Material 1946 (Lake Superior Fish Tissue) compared to certified concentrations and two aliquots of a loggerhead egg composite controlmaterial
Compound SRM 1946 Loggerhead egg composite
Certifiedvalue (ng/gwet mass)
Measured concentration(ng/g wet mass)
Measured concentration(ng/g wet mass)
Rep 1a Rep 2 Rep 1a Rep 2
PCB 99 25.6±2.3 26.5 23.5 1.79 1.90PCB 105 19.9±0.9 17.7 19.0 0.488 0.574PCB 118 52.1±1.0 48.3 48.2 1.31 1.22PCB 128 22.8±1.9 20.4 21.7 0.495 0.575PCB 138+163 115±13b 123 135 2.85 3.57PCB 146 30.1±3.5 22.1 22.2 0.515 0.726PCB 153 170±9 161 155 4.46 6.39PCB 170 25.2±2.2 25.9 22.3 0.465 0.492PCB 180 74.4±4.0 72.9 71.3 1.10 1.18PCB 187 55.2±2.1 51.6 47.0 1.23 1.23Mirex 6.47±0.77 5.63 5.83 0.231 0.185Dieldrin 32.5±3.5 29.8 30.4 1.21 0.964Heptachlor epoxide 5.50±0.23 5.79 6.17 0.235 0.178Oxychlordane 18.9±1.5 15.1 18.2 bLODc 0.185trans-nonachlor 99.6±7.6 87.6 79.7 1.34 1.314,4′-DDE 373±48 354 351 6.73 7.92Percent lipid (%) 10.17±0.48 8.45 9.85 8.48 8.31
Certified values taken from the Certificate of Analysis for SRM 1946.a Replicate 1 was analyzed with the samples reported in this study; replicate 2 was analyzed the following year by the same personnel with similar
methods.b Certified value for only PCB 138.c Measured below the limit of detection, which was 0.120 ng/g wet mass for oxychlordane in this sample.
174 J.J. Alava et al. / Science of the Total Environment 367 (2006) 170–181
3.2. Lipid content
The percent lipid in all egg yolk samples averaged15.0% with a standard deviation of 4.7% and a range of7.70% to 25.6%. No significant difference in yolk lipid
02040
6080
100120140
160180200
No/E M L
Per
cent
of
No/
E y
olk
lipid
con
tent
*
Fig. 1. Percent change in lipid content of loggerhead sea turtle yolksamples through embryonic development from no development/early(No/E) to middle (M) and late (L) stages. Percent change wascalculated relative to the average lipid content of the No/E stage ofeach nest. Mean and one standard deviation (error bars) werecalculated from three nests. The asterisk indicates a significantdifference between the M and L stages (Student's t-test; p=0.015).
content was observed among nests when all develop-mental stages were averaged per nest (ANOVA; p=0.986; data not shown). Yolk lipid content (expressedrelative to the percent lipid in the No/E stage within eachnest) significantly increased between the middle and latestages of development (Student's t-test;p=0.015; Fig. 1).Percent lipid in yolk sacs of late-stage embryos wasapproximately 1.5 fold higher than earlier stages (No/E
0
5
10
15
20
25
30
0 10 20 30 40 50
SCL (mm)
M
L
Per
cent
lipi
d
r = 0.9027; p = 0.0003
Fig. 2. Percent lipid in yolk versus straight carapace length (SCL) often loggerhead embryos of middle (M) and late (L) developmentalstages from three nests. Linear trendline and Pearson correlationstatistics indicate a strong positive correlation.
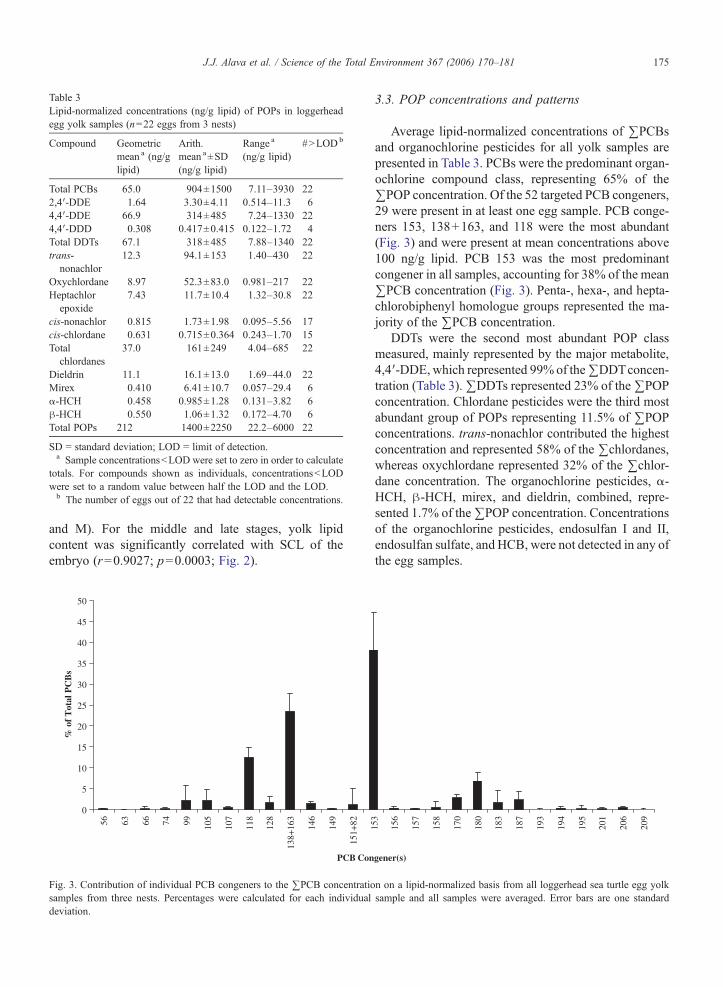
Table 3Lipid-normalized concentrations (ng/g lipid) of POPs in loggerheadegg yolk samples (n=22 eggs from 3 nests)
Compound Geometricmean a (ng/glipid)
Arith.mean a±SD(ng/g lipid)
Range a
(ng/g lipid)#NLODb
Total PCBs 65.0 904±1500 7.11–3930 222,4′-DDE 1.64 3.30±4.11 0.514–11.3 64,4′-DDE 66.9 314±485 7.24–1330 224,4′-DDD 0.308 0.417±0.415 0.122–1.72 4Total DDTs 67.1 318±485 7.88–1340 22trans-
nonachlor12.3 94.1±153 1.40–430 22
Oxychlordane 8.97 52.3±83.0 0.981–217 22Heptachlor
epoxide7.43 11.7±10.4 1.32–30.8 22
cis-nonachlor 0.815 1.73±1.98 0.095–5.56 17cis-chlordane 0.631 0.715±0.364 0.243–1.70 15Total
chlordanes37.0 161±249 4.04–685 22
Dieldrin 11.1 16.1±13.0 1.69–44.0 22Mirex 0.410 6.41±10.7 0.057–29.4 6α-HCH 0.458 0.985±1.28 0.131–3.82 6β-HCH 0.550 1.06±1.32 0.172–4.70 6Total POPs 212 1400±2250 22.2–6000 22
SD = standard deviation; LOD = limit of detection.a Sample concentrationsbLOD were set to zero in order to calculate
totals. For compounds shown as individuals, concentrationsbLODwere set to a random value between half the LOD and the LOD.b The number of eggs out of 22 that had detectable concentrations.
175J.J. Alava et al. / Science of the Total Environment 367 (2006) 170–181
and M). For the middle and late stages, yolk lipidcontent was significantly correlated with SCL of theembryo (r=0.9027; p=0.0003; Fig. 2).
0
5
10
15
20
25
30
35
40
45
50
56 63 66 74 99 105
107
118
128
138+
163
146
149
151+
82
PCB Con
% o
f T
otal
PC
Bs
Fig. 3. Contribution of individual PCB congeners to the ∑PCB concentratiosamples from three nests. Percentages were calculated for each individualdeviation.
3.3. POP concentrations and patterns
Average lipid-normalized concentrations of ∑PCBsand organochlorine pesticides for all yolk samples arepresented in Table 3. PCBs were the predominant organ-ochlorine compound class, representing 65% of the∑POP concentration. Of the 52 targeted PCB congeners,29 were present in at least one egg sample. PCB conge-ners 153, 138+163, and 118 were the most abundant(Fig. 3) and were present at mean concentrations above100 ng/g lipid. PCB 153 was the most predominantcongener in all samples, accounting for 38% of the mean∑PCB concentration (Fig. 3). Penta-, hexa-, and hepta-chlorobiphenyl homologue groups represented the ma-jority of the ∑PCB concentration.
DDTs were the second most abundant POP classmeasured, mainly represented by the major metabolite,4,4′-DDE,which represented 99% of the∑DDTconcen-tration (Table 3).∑DDTs represented 23% of the∑POPconcentration. Chlordane pesticides were the third mostabundant group of POPs representing 11.5% of ∑POPconcentrations. trans-nonachlor contributed the highestconcentration and represented 58% of the ∑chlordanes,whereas oxychlordane represented 32% of the ∑chlor-dane concentration. The organochlorine pesticides, α-HCH, β-HCH, mirex, and dieldrin, combined, repre-sented 1.7% of the∑POP concentration. Concentrationsof the organochlorine pesticides, endosulfan I and II,endosulfan sulfate, and HCB, were not detected in any ofthe egg samples.
153
156
157
158
170
180
183
187
193
194
195
201
206
209
gener(s)
n on a lipid-normalized basis from all loggerhead sea turtle egg yolksample and all samples were averaged. Error bars are one standard

0
500
1000
1500
2000
2500
3000
3500
4000
FLSA12 FLBR2 FLBR14a
ΣPCBsΣDDTsΣChlordanesDieldrin
ng/g
lipi
d
*
*
*
a
0
10
20
30
40
50
60
FLSA12 FLBR2
cb
Fig. 4. Comparison of ∑PCB, ∑DDT, ∑chlordane and dieldrinconcentrations among three loggerhead sea turtle nests. An asteriskindicates a significant difference in concentrations from the other twonests; different letters indicate significant differences among nests(Welch ANOVA pb0.0001 with Tukey–Kramer multiple comparisonstest pb0.05). Error bars are one standard deviation.
50
100
150
200
250
300
No/E M L% c
hang
e in
wet
mas
s co
ncen
trat
ion
**
**
50
75
100
125
150
No/E M L
% c
hang
e in
lipi
d-no
rmal
ized
con
cent
rati
on
*
ΣPCBsΣDDTsΣchlordanesDieldrin
ΣPCBsΣDDTsΣchlordanesDieldrin
a
b
Fig. 5. Percent change in POP concentrations in loggerhead egg yolksamples through development from no development/early (No/E) tomiddle (M) and late (L) stages on a) a wet-mass basis and b) on a lipid-normalized basis. Percent change was calculated relative to the averageconcentrations of the No/E stage of each nest. Mean and one standarddeviation (error bars) were calculated from three nests. An asteriskindicates a significant difference between the M and L stageconcentrations (Student's t-test; pb0.05).
176 J.J. Alava et al. / Science of the Total Environment 367 (2006) 170–181
3.4. Differences in POP concentrations among nests
Lipid-normalized concentrations of∑PCBs, ∑DDTs,∑chlordanes, and dieldrin differed among the three nests(Welch ANOVA, pb0.0001; Fig. 4). Egg samples fromnest FLBR14a had the highest concentrations of all ofthese compounds. The less predominant pesticides,mirex, α-HCH, and β-HCH, were detectable only inFLBR14a. The pattern of POP classes was similarbetween the two Boca Raton nests with the ∑PCBsoccurring at the highest concentrations followed by∑DDTs,∑chlordanes, and dieldrin. However, the patternobserved in the nest from the west coast of Florida(FLSA12) was different. In FLSA12,∑DDTs (45.9 ng/glipid) dominated the pattern, followed by ∑chlordanes(17.4 ng/g lipid), dieldrin (15.5 ng/g lipid) and ∑PCBs(9.21 ng/g lipid).
3.5. Changes in POP concentrations through develop-mental stages
To examine changes in POP concentrations throughdevelopment, the average concentrations for each stagewithin each nest were expressed as a percent of theaverage concentration in the No/E stage of that nest. Thedifferences among developmental stages were strongerwhen the POP concentrations were reported on a wet-mass basis (Fig. 5a) compared to a lipid-normalizedbasis (Fig. 5b). On a wet-mass basis, the late-stage eggyolks had approximately double the concentrations of∑PCBs, ∑DDTs, ∑chlordanes, and dieldrin comparedto the No/E and M stages (Fig. 5a). The late-stage con-centrations were significantly higher than the middlestage (Student's t-test, pb0.05). On a lipid-normalized
basis, the percent change from the No/E concentrat-ions did not differ among developmental stages for∑PCBs, ∑DDTs, or dieldrin (pN0.05), but ∑chlor-danes significantly increased at the late stage by 35%(pb0.05) (Fig. 5b).
3.6. Sample size
Based on the observed change in POP concentrationsdetected in the late-stage samples, only No, E, and Mstages from each nest were used in this statistical ana-lysis. The number of eggs required per nest to yield anacceptable average estimate of ∑POP concentrations ispresented in Table 4. For ∑POP concentrations, a re-spective sample size of approximately 3, 4, or 11 eggsper nest would be required to obtain an average nestconcentration that was within 30%, 20%, or 10% of themeasured sample mean. If concentrations of late-stageeggs are incorporated in the estimation, a sample size of

Table 4Minimum loggerhead egg sample size required per nest to obtain anacceptable estimate of lipid-normalized POP concentrations for eachnest based on eggs with no development, early-stage, or middle-stageembryos
Predicted n to achieve a population mean within
30% of samplemean
20% of samplemean
10% of samplemean
∑PCBs 4 6 17∑DDTs 2 4 9∑chlordanes 6 10 33Dieldrin 3 4 11∑POPs 3 4 11
n = sample size.Predictednwas derived from the following equation: n=(SD2)(t20.05(2),df) /(d2) where SD = standard deviation, t = two-tailed critical value of aStudent's t-test withα= 0.05; df= degrees of freedomor (n−1); d= half ofthe desired confidence internal, which was chosen here as 30%, 20%, or10% above or below the measured mean concentration (Zar, 1999). Theaverage of the derived n for three nests is shown here.
177J.J. Alava et al. / Science of the Total Environment 367 (2006) 170–181
more than 9 eggs per nest would be required to be within20% of the measured sample mean ∑POPs.
4. Discussion
This study provides additional baseline data on con-taminant concentrations in sea turtle eggs. POP con-centrations (ng/g wet mass) measured in this study arecompared to previous studies that analyzed sea turtleeggs in Table 5. One previous study was not included inthe table because it reported concentrations only on alipid-normalized basis (Cobb and Wood, 1997). Theaverage ∑PCB concentration (904 ng/g lipid) measuredin the current study was similar to that found in logger-head eggs (1188 ng/g lipid) from Cape Island, SouthCarolina (Cobb and Wood, 1997). A decline in POPconcentrations is not evident based on a comparison ofthe present study to those performed in the 1970s and1980s along the Southeast coast of the U.S. (Hillestad etal., 1974; Clark andKrynitsky, 1980, 1985 in Table 5). Infact, PCB and chlordane concentrations appear to haveincreased, while DDT concentrations have remainedrelatively constant. These comparisons suggest that mostPOP concentrations have not substantially decreasedthrough time, even though most of these compoundswere banned from use in the U.S. and other developedcountries. This conclusion, however, must be consideredwith caution, because a long-term monitoring study hasobserved declining trends in PCB and pesticide concen-trations in Atlantic menhaden (Brevoortia tyrannus)from this region (Mitchum, unpublished data). Addi-tionally, the temporal comparison of concentrations in
sea turtles is weakened by their migratory behavior,which may cause them to reflect exposure levels fromother countries where these compounds are still beingused. In addition, the comparison among the present andprevious studies is limited, because different analyticalmethodologies, sample sizes, and sampling locationswere used.
The POP concentrations measured in the loggerheadegg samples in the present study are higher than thosemeasured previously in green sea turtle eggs (Table 5).For example, the mean 4,4′-DDE concentration in theloggerhead eggs was more than ten times higher than theconcentrations found in green turtle eggs from fourlocations (Table 5). These species differences have beenobserved previously and have been explained by dif-fering trophic status (Meyers-Schöne and Walton,1994). Green turtles are herbivores, so they do not ac-cumulate POPs to the same level as omnivorous log-gerhead turtles.
POP concentrations in eggs from other reptile speciesare generally higher than those measured in loggerheadeggs. For example, ∑PCB concentrations in the logger-head eggs (144 ng/g wet mass) were lower than theaverage ∑PCB concentrations measured in snappingturtle (Chelydra serpentina) eggs from several sites inthe Great Lakes (241 ng/g wet mass to 3946 ng/g wetmass), except for a reference site (17.9 ng/g wet mass)(Bishop et al., 1998). Similarly, the loggerhead eggs hadlower concentrations of 4,4′-DDE (49.7 ng/g wet mass)compared to Alligator mississippiensis (range: 100 to7600 ng/g wet mass) (Heinz et al., 1991) andCrocodylusacutus (range: 370 to 2900 ng/g wet mass) (Hall et al.,1979). On the other hand, the maximum concentration of∑PCBsmeasured here (1010 ng/g wet mass) was greaterthan the maximum found in eggs of A. mississippiensisfrom Lakes Apopka (450 ng/g wet mass) and LakeGriffin (670 ng/g wet mass) in Florida (Heinz et al.,1991). The mean ∑PCB concentration measured in thecurrent study (904 ng/g lipid) was bracketed byconcentrations measured in egg contents of A. mis-sissippiensis collected from two sites in South Carolina(333 ng/g lipid and 3176 ng/g lipid) and was higher thanalligator eggs collected from Louisiana (218 ng/g lipid)(Cobb et al., 2002). The geometric mean of 4,4,′-DDEmeasured in Morelet's crocodile eggs from Belize(48.0 ng/g wet mass) (Wu et al., 2000) was higher thanthat in the current study (9.60 ng/g wet mass). Thesedifferent levels of exposure are most likely due todifferences in proximity to contaminant sources and/ordifferences in trophic levels.
Two nests from the same beach (Boca Raton, FL) hadvery different POP concentrations, but they had similar

Table 5Comparison of measured organochlorine concentrations, mean (SD) [range], in ng/g wet mass in eggs of sea turtles
Species n a Location ∑PCBs ∑DDTs ∑chlordanes Dieldrin Mirex ∑HCH Reference
C.caretta
22 (3) Boca Ratonand Sarasota,Florida
144 (280)[0.796–1010]
50.2 (92.4)[1.19–344]
25.5 (46.7)[0.827–175]
2.53 (2.76)[0.278–10.8]
1.03 (2.04)[0.009–7.52]
0.258 (0.508)[0.020–2.05] b
This study
C.caretta
NR S. Carolinaand Georgia
NM [58–305] c NM ND–56.4 NM NM Hillestadet al. (1974)
C.caretta
9 (9) Merritt Island,Florida
78 d
[32–201]66 e
[18–200][ND–6, 17,or 9] f
ND [ND–5] NM Clark andKrynitsky(1980)
C.caretta
56 (1) Merritt Island,Florida
NM 99g
[56.0–150][ND–8] h NM NM NM Clark and
Krynitsky(1985)
C.caretta
1 Cyprus,MediterraneanSea
89 155 i 1.8 j 0.6 NM NM Mackenzieet al. (1999)
C.caretta
4–12eggspooled/nest (20)
NorthwestFlorida
[240–3720] k [ND–178] k, l ND ND ND ND Alam and Brim(2000)
C.mydas
2 (2) Merritt Island,Florida
ND 2 e [ND–5] ND ND ND NM Clark andKrynitsky(1980)
C.mydas
10 (4) AscensionIsland
76 (64)[20.0–220]m
3 (3)[ND–9.00] e
NM NM NM NM Thompsonet al. (1974)
C.mydas
15 (4) Heron Island,Queensland,Australia
NM 1.7[1.3–2.4] e
NM NM NM NM Podrekaet al. (1998)
C.mydas
1 Cyprus,MediterraneanSea
6.1 4.3 i b 0.3 b 0.3 NM NM Mackenzieet al. (1999)
C. caretta: loggerhead sea turtle; C. mydas: green sea turtle; NR: not reported; NM: not measured; ND: not detected because value was below thedetection limit.a n = total number of eggs analyzed individually from a total number of nests in parentheses.b Sum of α-HCH and β-HCH.c Sum of “DDE, DDD, and DDT”.d Geometric mean; total PCBs were measured as Aroclor 1260.e Arithmetic mean for only 4,4′-DDE.f Range of heptachlor epoxide, oxychlordane, and trans-nonachlor, respectively.g Geometric mean for only 4,4′-DDE.h Approximate range for cis-chlordane and oxychlordane, individually; both had the same range.i Sum of 4,4′-DDE, 4,4′-DDD, and 4,4′-DDT.j Sum of heptachlor, heptachlor epoxide, α-chlordane, γ-chlordane, oxychlordane, and trans-nonachlor.k Values converted from ng/g dry mass to ng/g wet mass.l Reported as 4,4′-DDD alone.m Total PCBs were measured as Aroclor 1242 or 1248.
178 J.J. Alava et al. / Science of the Total Environment 367 (2006) 170–181
patterns (i.e., ΣPCBsNΣDDTsNΣchlordanes). Thenest laid near Sarasota on the west coast of FL(FLSA12) had similar concentrations compared to theless contaminated nest from Boca Raton, but it con-tained a unique pattern in which DDTs were moreabundant than PCBs. This pattern suggests that the adultfemale that laid nest FLSA12 was foraging in areas withrelatively more contamination by organochlorine pesti-cides compared to PCBs. These similarities anddifferences highlight the hypothesis that adult foraging
sites, far from the nesting beach, greatly influence thelevels and patterns transferred to eggs. Interestingly, thehighest levels of POPs were found in nest FLBR14a(mean∑POP=4940 ng/g lipid), which contained a two-headed embryo. Abnormality rates have been shown toincrease in snapping turtle hatchlings from the GreatLakes in relation to higher egg concentrations ofchlorinated contaminants (Bishop et al., 1998). Thesefindings emphasize the need to examine geographicaldifferences in contamination of loggerhead eggs and

179J.J. Alava et al. / Science of the Total Environment 367 (2006) 170–181
the potential developmental effects caused by thesecontaminants.
This study compared organochlorine contaminants inyolk among developmental stages in loggerhead eggs inorder to develop standardized sampling methods forlong-term monitoring. This was important for two rea-sons. Firstly, this study was part of a larger projectinvestigating the sex ratio of loggerhead turtles hatchingon nesting beaches located throughout the southeasterncoast of the U.S. (Blair, 2005). Many sea turtle studies,such as this one, involve numerous collaborators, re-sulting in the need to subdivide samples for differentpurposes. Only the egg yolk was available for contami-nant measurements in this study, but the eggs representeda variety of developmental stages. Prior to analyzing theremaining 44 nests, we needed to determine if any stagecould be analyzed or if one stage should be the focus.
A related but more broadly important reason for thisstudy is that the yolk sac visibly changes throughoutdevelopment of the embryo. It becomes smaller andmore viscous in late stages. During the last stage ofembryonic development (final third of development) theyolk volume decreases to approximately 50% of thevolume of the embryo, and during pipping the remainingyolk sac is completely internalized into the body cavity(Miller et al., 2003). Hatchlings require this high-energysource for the first few days of frenzy swimming. Inorder to reduce the size of the yolk sac, we hypothesizedthat some component of the yolk, probably water, isremoved and utilized while lipids are concentrated. Aportion of this hypothesis was supported by the findingthat lipid content increased by 50% between the middleand late stages. A similar increase in yolk lipid contentwas noted previously for three other reptile species(Rowe et al., 1995). This process of concentrating thelipids also appeared to increase the concentration ofhydrophobic POPs. The yolk of the late-stage embryosanalyzed in the current study had POP concentrations, ona wet-mass basis, that were approximately two-foldgreater than earlier stages. Similar findings have beenobserved in the yolk plus albumen portion of whiteleghorn chicken (Gallus domesticus) eggs after exposinghens to a mixture of three PCBs and endosulfan (Bargaret al., 2001). In that study, lipid content steadily in-creased through embryonic development, and PCB con-centrations on a wet-mass basis increased five-fold fromday 9 to day 19 of incubation.
Changes in POP concentrations through developmentwere larger when the data were reported on a wet-massbasis compared to lipid-normalized concentrations. Thisfinding provides more evidence that the POPs are beingconcentrated along with the lipids and is important for
two reasons. Methodologically, yolk samples from ear-lier stages from one nest cannot be directly compared tosamples from late stages, especially from different nests.Future studies that utilize only a portion of the eggcontents should focus consistently on either the earlier orthe later developmental stages. If different stages areused, it is important to normalize contaminant concen-trations to the lipid content measured in the samples.Another important implication is that rapid mobilizationof these concentrated lipids during the first few days afterhatching will increase the exposure of target tissues toPOPs at this vulnerable life stage. Future studies shouldinvestigate the toxic effects of hydrophobic contami-nants on developing sea turtles, especially during theearly post-hatchling stage.
Sample size is a major aspect in designing experi-ments and monitoring programs. Larger sample sizes areadvantageous for statistical testing, but field sampling isoften limited by availability of funds and time and by thespecies under study (i.e., protected species). As shown inTable 4, the number of eggs per nest required for∑POPanalysis increases to 11 as the allowable deviation fromthe true nest mean decreases to 10% versus only 3 eggsrequired for a 30% deviation from the mean. Theprobability of obtaining 3 eggs of these developmentalstages per loggerhead nest is high. For example, 37 of the47 nests (79%) sampled in the larger portion of this studyhad 3 or more unhatched eggs of these earlier develop-mental stages. The coefficient of variation of POP con-centrations within nests considering only the No/E andmiddle stages is relatively small (b20%). The late stagewas excluded from the calculation of the sample sizerequirements since this stage exhibited an increase inwet-mass POP concentrations, resulting in increasedvariability within each nest and the need to analyze moreeggs per nest.
5. Conclusion
This study provides a broader foundation for futureresearch and monitoring of sea turtle eggs for contam-inant concentrations and their toxic effects. We concludetwo important findings that will be utilized when weexpand our analytical efforts and should be consideredfor all future sampling efforts. Firstly, No/E and Mstages cannot be directly compared to L stages, es-pecially from different nests. And, three or more eggsper nest are necessary to obtain acceptable averagenest concentrations of ∑POPs. Future studies willevaluate geographical trends along the Southeast coastof the U.S. and the relationships of these compoundsto hatching success, embryonic abnormality rates,
180 J.J. Alava et al. / Science of the Total Environment 367 (2006) 170–181
hatchling survival rates, sex ratios, and hatchlinggrowth rates.
Acknowledgements
The authors thank Stacy Vander Pol (NIST) and RyanTempleton (Research Experience for Undergraduates)for their technical assistance, Allan Strand (College ofCharleston) for statistical advice, and everyone whoparticipated in egg collection during the sex ratio project,including Jesse Marsh, CatherineMcClellan, Matt Rush,Kim Blair, Lesley Stokes, Kelly Stewart, MatthewGodfrey, Jeff Cordes, Jerris Foote, Kirt Rusenko, ChrisJohnson, Michael Bresette, Rick Herren, Stacy Kubis,Kelly Roberts, and Dean Bagley from Duke University,Florida Atlantic University, North Carolina WildlifeResources Commission, Cape Lookout National Sea-shore, Mote Marine Laboratory, Gumbo Limbo NatureCenter, Marinelife Center of Juno Beach, QuantumResources at the St. Lucie Power Plant, and University ofCentral Florida. The sex ratio project was funded by theU.S. Environmental Protection Agency STAR grantR82-9094 (JW, LC). Academic support and scholarshipfor JJA was granted by the Fulbright-Organization ofAmerican States (OAS) Ecology Program through theFulbright Commission/Foundation, the Academic andProfessional Programs for the Americas (LASPAU), andthe OAS. Additional funding and support for JJA wasprovided by the Center for Coastal EnvironmentalHealth and Biomolecular Research, the National Ocean-ographic and Atmospheric Agency, and the NationalOcean Service.
References
Alam SK, Brim MS. Organochlorine, PCB, PAH, and metalsconcentrations in eggs of loggerheads sea turtles (Caretta caretta)from Northwest Florida, USA. J Environ Sci Health 2000;B35:705–24.
Bargar TA, Scott GI, Cobb GP. Uptake and distribution of three PCBcongeners and endosulfan by developing white leghorn chickenembryos (Gallus domesticus). Arch Environ Contam Toxicol2001;41:508–14.
BishopCA,NgP, Pettit KE,KennedySW,Stegeman JJ,NorstromRJ, etal. Environmental contamination and developmental abnormalitiesin eggs and hatchlings of the common snapping turtle (Chelydraserpentina serpentina) from the Great Lakes–St. Lawrence RiverBasin (1989–91). Environ Pollut 1998;101:143–56.
Bjorndal KA. Foraging ecology and nutrition of sea turtles. In: Lutz PL,Musick JA, editors. The biology of sea turtles. Boca Raton, FL:CRC Press; 1997. p. 199–231.
Blair K, 2005. Determination of accurate sex ratios and theirrelationship to nest temperature of loggerhead sea turtle (Carettacaretta, L.) hatchlings produced along the southeastern Atlanticcoast. MS thesis. Florida Atlantic University, Boca Raton, Florida.
Clark Jr DR, Krynitsky AJ. Organochlorine residues in eggs ofloggerhead and green sea turtles nesting at Merritt Island, Florida–July and August 1976. Pestic Monit J 1980;14:7–10.
Clark Jr DR, Krynitsky AJ. DDE residues and artificial incubation ofloggerhead sea turtle eggs. Bull Environ Contam Toxicol1985;34:121–5.
Cobb GP, Wood PD. PCB concentration in eggs and chorioallantoicmembranes of loggerhead sea turtles (Caretta caretta) from the CapeRomain National Wildlife Refuge. Chemosphere 1997;34:539–49.
Cobb GP, Houlis PD, Bargar TA. Polychlorinated biphenyl occurrencein American alligators (Alligator mississippiensis) from Louisianaand South Carolina. Environ Pollut 2002;118:1–4.
Cobb GP, Bargar TA, Pepper CB, Norman DM, Houlis PD, AndersonTA. Using chorioallantoic membranes for non-lethal assessment ofpersistent organic pollutant exposure and effect in oviparouswildlife. Ecotoxicology 2003;12:31–45.
Hall RJ, Kaiser TE, Robertson Jr WB, Patty PC. Organochlorineresidues in eggs of the endangeredAmerican crocodile (Crocodylusacutus). Bull Environ Contam Toxicol 1979;23:87–90.
Heinz GH, Percival HF, Jennings ML. Contaminants in Americanalligator eggs from Lake Apopka, Lake Griffin, and LakeOkeechobee, Florida. Environ Monit Assess 1991;16:277–85.
Hillestad HO, Reimold RJ, Stickney RR, Windom HL, Jenkins JH.Pesticides, heavy metals, and radionuclide uptake in loggerheadsea turtles from South Carolina and Georgia. Herpetol Rev1974;5:75.
Keller JM, Kucklick JR, Harms CA, McClellan-Green PD. Organo-chlorine contaminants in sea turtles: correlations between wholeblood and fat. Environ Toxicol Chem 2004;23:726–38.
Kucklick JR, Struntz WDJ, Becker PR, York GW, O'Hara TM,Bohonowych JE. Persistent organochlorine pollutants in ringedseals and polar bears collected from northern Alaska. Sci TotalEnviron 2002;287:45–59.
Leitzell TL, Greenwalt LA. Listing and protecting loggerhead seaturtles as “threatened species” and populations of green and oliveridley sea turtles as threatened species or “endangered species.”.Fed Regist 1978;43(146):32800–11.
Mackenzie C, Godley BJ, Furness RW, Wells DE. Concentrations andpatterns of organochlorine contaminants in marine turtles fromMediterranean andAtlanticwaters.Mar EnvironRes 1999;47:117–35.
Meyers-Schöne L, Walton BT. Turtles as monitors of chemicalcontaminants in the environment. Rev Environ Contam Toxicol1994;135:93–153.
Miller JD. Reproduction in sea turtle. In: Lutz PL, Musick JA, editors.The biology of sea turtles. Boca Raton, FL: CRC Press; 1997.p. 51–81.
Miller JD. Embryology of marine turtles. In: Gans C, Billet F,Maderson PFA, editors. The biology of the reptilia. New York, NY:Willey-Interscience; 1985. p. 269–328.
Miller JD, Limpus CJ, Godfrey MH. Nest site selection, oviposition,eggs, development, hatching, and emergence of loggerhead turtles.In: Bolten AB, Witherington BE, editors. Loggerhead sea turtles.Washington, DC: Smithsonian Books; 2003. p. 125–43.
Podreka S, Georges A, Maher B, Limpus CJ. The environmentalcontaminant DDE fails to influence the outcome of sexualdifferentiation in the marine turtle Chelonia mydas. EnvironHealth Perspect 1998;106:185–8.
Pugh RS, Becker PR. Sea turtle contaminants: a review with annotatedbibliography. National Institute of Standards and Technologyinternal report, vol. 6700; 2001.
Rowe JW, Holy L, Ballinger RE, Stanley-Samuelson D. Lipidprovisioning of turtle eggs and hatchlings: total lipid, phospholipid,

181J.J. Alava et al. / Science of the Total Environment 367 (2006) 170–181
triacylglycerol and triacylglycerol fatty acids. Comp BiochemPhysiol 1995;112B:323–30.
Schroeder BA, Foley AM, Bagley DA. Nesting patterns, reproductivemigrations, and adult foraging areas of loggerhead turtles. In:Bolten AB, Witherington BE, editors. Loggerhead sea turtles.Washington, DC: Smithsonian Books; 2003. p. 114–24.
Thompson NP, Rankin PW, Johnston DW. Polychlorinated biphenylsand p,p′ DDE in green turtle eggs from Ascension Island, SouthAtlantic Ocean. Bull Environ Contam Toxicol 1974;11:399–406.
Wu TH, Rainwater TR, Platt SG, McMurry ST, Anderson TA.Organochlorine contaminants in Morelet's crocodile (Crocodylusmoreletii) eggs from Belize. Chemosphere 2000;40:671–8.
Zar JH. Biostatistical analysis. 4th edition. Upper Saddle River, NewJersey: Prentice Hall; 1999. p. 105–6.
Copyright © 2022 FDOKUMEN