Expanded mitochondrial control region sequences increase resolution of stock structure among North...
16
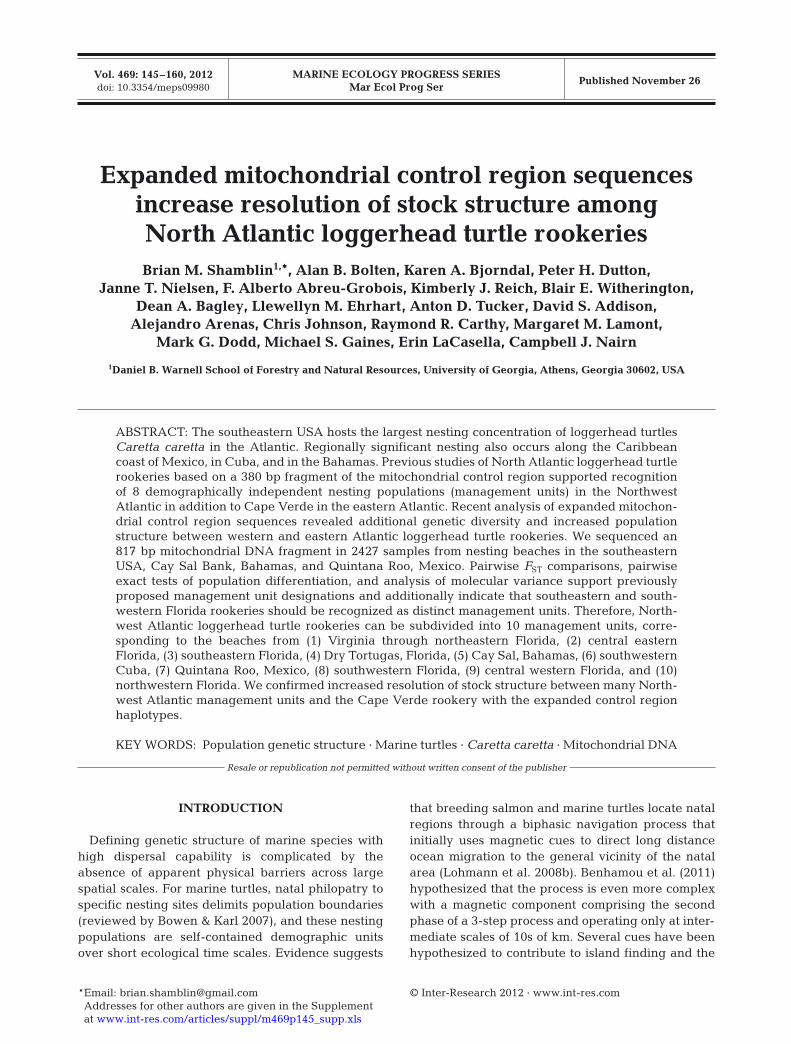
MARINE ECOLOGY PROGRESS SERIES Mar Ecol Prog Ser Vol. 469: 145–160, 2012 doi: 10.3354/meps09980 Published November 26 INTRODUCTION Defining genetic structure of marine species with high dispersal capability is complicated by the absence of apparent physical barriers across large spatial scales. For marine turtles, natal philopatry to specific nesting sites delimits population boundaries (reviewed by Bowen & Karl 2007), and these nesting populations are self-contained demographic units over short ecological time scales. Evidence suggests that breeding salmon and marine turtles locate natal regions through a biphasic navigation process that initially uses magnetic cues to direct long distance ocean migration to the general vicinity of the natal area (Lohmann et al. 2008b). Benhamou et al. (2011) hypothesized that the process is even more complex with a magnetic component comprising the second phase of a 3-step process and operating only at inter- mediate scales of 10s of km. Several cues have been hypothesized to contribute to island finding and the © Inter-Research 2012 · www.int-res.com *Email: [email protected] *Addresses for other authors are given in the Supplement at www.int-res.com/articles/suppl/m469p145_supp.xls Expanded mitochondrial control region sequences increase resolution of stock structure among North Atlantic loggerhead turtle rookeries Brian M. Shamblin 1, *, Alan B. Bolten, Karen A. Bjorndal, Peter H. Dutton, Janne T. Nielsen, F. Alberto Abreu-Grobois, Kimberly J. Reich, Blair E. Witherington, Dean A. Bagley, Llewellyn M. Ehrhart, Anton D. Tucker, David S. Addison, Alejandro Arenas, Chris Johnson, Raymond R. Carthy, Margaret M. Lamont, Mark G. Dodd, Michael S. Gaines, Erin LaCasella, Campbell J. Nairn 1 Daniel B. Warnell School of Forestry and Natural Resources, University of Georgia, Athens, Georgia 30602, USA ABSTRACT: The southeastern USA hosts the largest nesting concentration of loggerhead turtles Caretta caretta in the Atlantic. Regionally significant nesting also occurs along the Caribbean coast of Mexico, in Cuba, and in the Bahamas. Previous studies of North Atlantic loggerhead turtle rookeries based on a 380 bp fragment of the mitochondrial control region supported recognition of 8 demographically independent nesting populations (management units) in the Northwest Atlantic in addition to Cape Verde in the eastern Atlantic. Recent analysis of expanded mitochon- drial control region sequences revealed additional genetic diversity and increased population structure between western and eastern Atlantic loggerhead turtle rookeries. We sequenced an 817 bp mitochondrial DNA fragment in 2427 samples from nesting beaches in the southeastern USA, Cay Sal Bank, Bahamas, and Quintana Roo, Mexico. Pairwise F ST comparisons, pairwise exact tests of population differentiation, and analysis of molecular variance support previously proposed management unit designations and additionally indicate that southeastern and south- western Florida rookeries should be recognized as distinct management units. Therefore, North- west Atlantic loggerhead turtle rookeries can be subdivided into 10 management units, corre- sponding to the beaches from (1) Virginia through northeastern Florida, (2) central eastern Florida, (3) southeastern Florida, (4) Dry Tortugas, Florida, (5) Cay Sal, Bahamas, (6) southwestern Cuba, (7) Quintana Roo, Mexico, (8) southwestern Florida, (9) central western Florida, and (10) northwestern Florida. We confirmed increased resolution of stock structure between many North- west Atlantic management units and the Cape Verde rookery with the expanded control region haplotypes. KEY WORDS: Population genetic structure · Marine turtles · Caretta caretta · Mitochondrial DNA Resale or republication not permitted without written consent of the publisher
-
Upload
independent -
Category
Documents
-
view
2 -
download
0
Transcript of Expanded mitochondrial control region sequences increase resolution of stock structure among North...
MARINE ECOLOGY PROGRESS SERIESMar Ecol Prog Ser
Vol. 469: 145–160, 2012doi: 10.3354/meps09980
Published November 26
INTRODUCTION
Defining genetic structure of marine species withhigh dispersal capability is complicated by theabsence of apparent physical barriers across largespatial scales. For marine turtles, natal philopatry tospecific nesting sites delimits population boundaries(reviewed by Bowen & Karl 2007), and these nestingpopulations are self-contained demographic unitsover short ecological time scales. Evidence suggests
that breeding salmon and marine turtles locate natalregions through a biphasic navigation process thatinitially uses magnetic cues to direct long distanceocean migration to the general vicinity of the natalarea (Lohmann et al. 2008b). Benhamou et al. (2011)hypothesized that the process is even more complexwith a magnetic component comprising the secondphase of a 3-step process and operating only at inter-mediate scales of 10s of km. Several cues have beenhypothesized to contribute to island finding and the
© Inter-Research 2012 · www.int-res.com*Email: [email protected]*Addresses for other authors are given in the Supplementat www.int-res.com/articles/suppl/m469p145_supp.xls
Expanded mitochondrial control region sequencesincrease resolution of stock structure among North Atlantic loggerhead turtle rookeriesBrian M. Shamblin1,*, Alan B. Bolten, Karen A. Bjorndal, Peter H. Dutton,
Janne T. Nielsen, F. Alberto Abreu-Grobois, Kimberly J. Reich, Blair E. Witherington, Dean A. Bagley, Llewellyn M. Ehrhart, Anton D. Tucker, David S. Addison,
Alejandro Arenas, Chris Johnson, Raymond R. Carthy, Margaret M. Lamont, Mark G. Dodd, Michael S. Gaines, Erin LaCasella, Campbell J. Nairn
1Daniel B. Warnell School of Forestry and Natural Resources, University of Georgia, Athens, Georgia 30602, USA
ABSTRACT: The southeastern USA hosts the largest nesting concentration of loggerhead turtlesCaretta caretta in the Atlantic. Regionally significant nesting also occurs along the Caribbeancoast of Mexico, in Cuba, and in the Bahamas. Previous studies of North Atlantic loggerhead turtlerookeries based on a 380 bp fragment of the mitochondrial control region supported recognitionof 8 demographically independent nesting populations (management units) in the NorthwestAtlantic in addition to Cape Verde in the eastern Atlantic. Recent analysis of expanded mitochon-drial control region sequences revealed additional genetic diversity and increased populationstructure between western and eastern Atlantic loggerhead turtle rookeries. We se quenced an817 bp mitochondrial DNA fragment in 2427 samples from nesting beaches in the southeasternUSA, Cay Sal Bank, Bahamas, and Quintana Roo, Mexico. Pairwise FST comparisons, pairwiseexact tests of population differentiation, and analysis of molecular variance support previouslyproposed management unit designations and additionally indicate that southeastern and south-western Florida rookeries should be recognized as distinct management units. Therefore, North-west Atlantic loggerhead turtle rookeries can be subdivided into 10 management units, corre-sponding to the beaches from (1) Virginia through northeastern Florida, (2) central easternFlorida, (3) southeastern Florida, (4) Dry Tortugas, Florida, (5) Cay Sal, Bahamas, (6) southwesternCuba, (7) Quintana Roo, Mexico, (8) southwestern Florida, (9) central western Florida, and (10)northwestern Florida. We confirmed increased resolution of stock structure between many North-west Atlantic management units and the Cape Verde rookery with the expanded control regionhaplotypes.
KEY WORDS: Population genetic structure · Marine turtles · Caretta caretta · Mitochondrial DNA
Resale or republication not permitted without written consent of the publisher
Mar Ecol Prog Ser 469: 145–160, 2012
final step of fine scale nesting beach selection in marine turtles (Lohmann et al. 2008a,b, Benhamou etal. 2011), but the relative importance of these factorsand perhaps additional mechanisms remains un -clear. The precise scale of natal homing in marineturtles may vary across populations as well as amongspecies (reviewed by Bowen & Karl 2007). Rookeriesflourish or perish based on recruitment and survivalof females (Bowen et al. 2005); therefore, determin-ing the scale of female natal homing in marine turtlepopulations is essential for population monitoringand management on ecological time scales. Marineturtle researchers from around the globe have highlighted the characterization of rookery and for-aging ground connectivity and partitioning as amajor priority for conservation planning (Hamann etal. 2010).
Loggerhead turtles are distributed in warm tem-perate waters circumglobally (Bolten 2003). The 2largest nesting aggregations occur in the southeast-ern United States of America (USA) and Masirah,Oman (Dodd 1988, Baldwin et al. 2003). In the south-eastern USA, loggerhead turtles nest regularlywhere suitable sandy beaches occur from Virginia toTexas. Nesting densities vary considerably along thiscoastline with 6 counties in eastern Florida account-ing for approximately 80% of nesting effort for thespecies nationally (NMFS & USFWS 2008). Annualmean nest numbers on Florida’s index nestingbeaches declined by approximately 44% from 1998through 2006 (Witherington et al. 2009), promptingconcern that the largest nesting population in theAtlantic may be in decline. In addition to the south-eastern USA, the Caribbean coast of Mexico, Cay SalBank (Bahamas), and the beaches of southwesternCuba also serve as important nesting habitats in theNorthwest Atlantic, hosting hundreds to severalthousands of nests each year (NMFS & USFWS 2008).
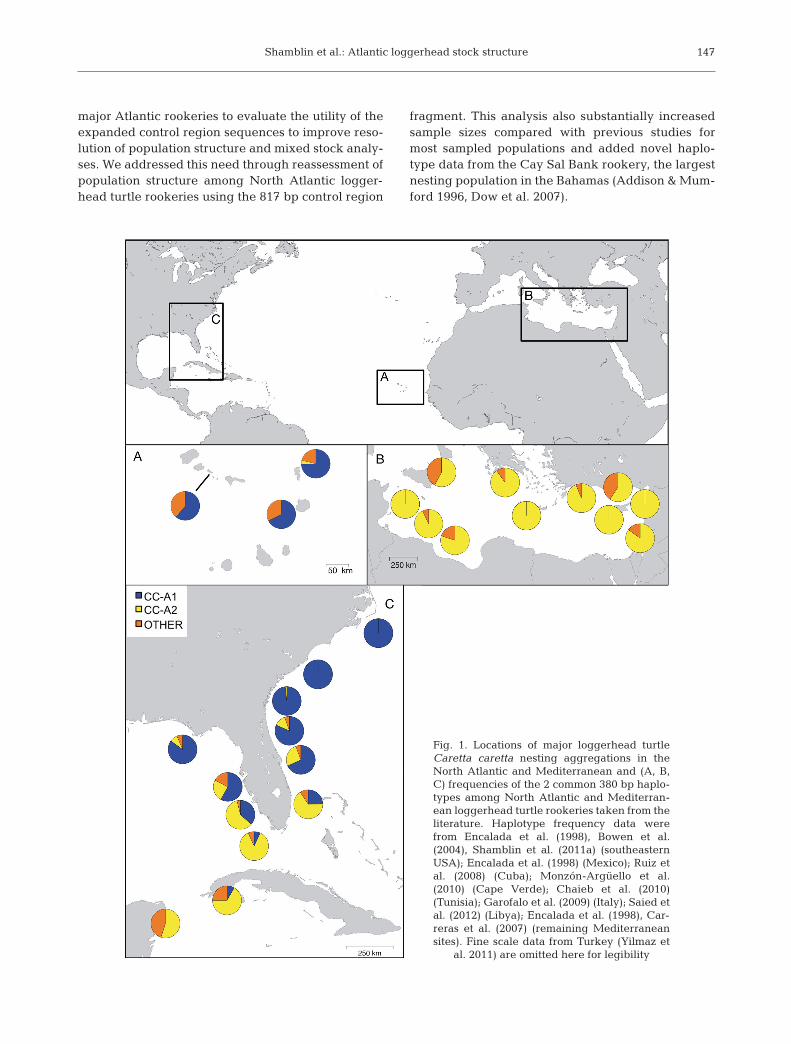
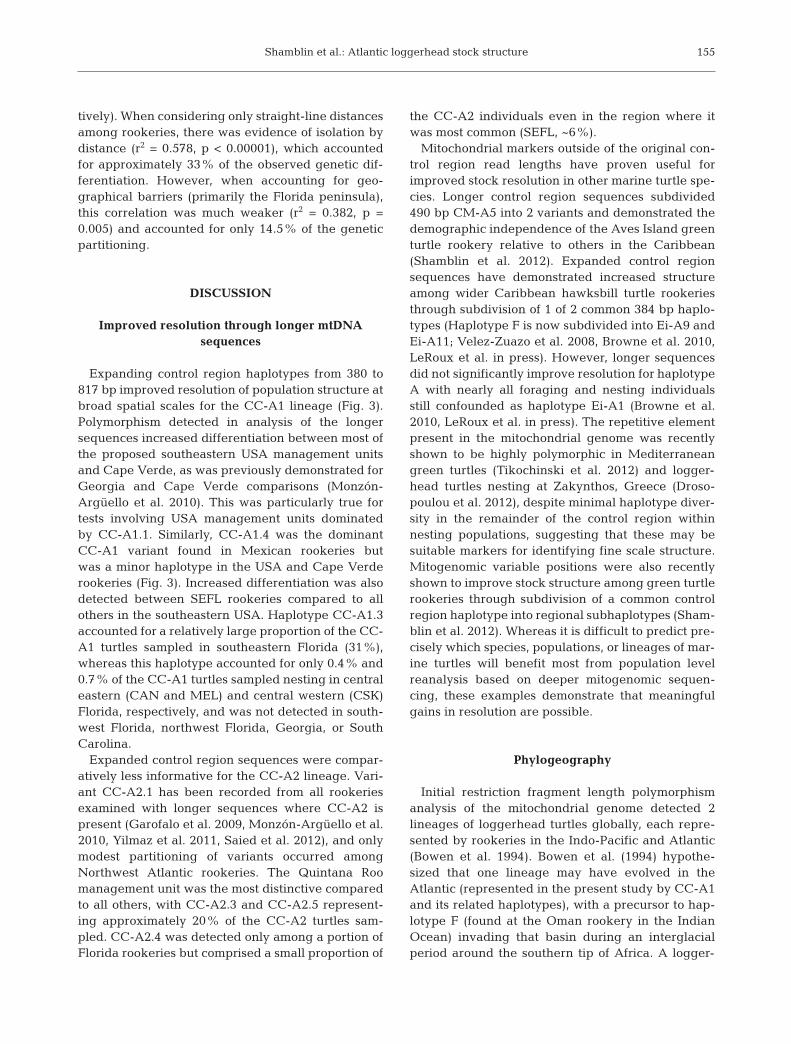
Several demographically discrete nesting popula-tions (management units) for loggerhead turtles inthe Atlantic and Mediterranean basins have beendetected based on frequency analysis of 380 bp mito-chondrial control region haplotypes (Fig. 1). Geneticstructure at regional scales has been detected in theNorthwest Atlantic, Brazilian, and Mediterraneannesting aggregations (Encalada et al. 1998, Bowen etal. 2004, Carreras et al. 2007, Ruiz et al. 2008, Garo-falo et al. 2009, Reis et al. 2010, Shamblin et al.2011a) but not among females nesting on variousCape Verde Islands (Monzón-Argüello et al. 2010).Early restriction fragment length polymorphismanalyses determined that at least 2 genetic stocksoccurred in the southeastern USA, one nesting on
Florida beaches and the other nesting on Georgiaand South Carolina beaches (Bowen et al. 1993,1994). More extensive sampling and sequence analy-sis of a 380 bp portion of the mitochondrial controlregion added the northwestern Florida and QuintanaRoo, (Mexico) rookeries as a distinct managementunit (Encalada et al. 1998) followed by recognition ofthe Dry Tortugas as a distinct management unit(Pearce 2001). A recent analysis revealed additionalstructure within peninsular Florida, such that 6 man-agement units were proposed for the southeasternUSA, corresponding to the beaches from (1) Virginiathrough the Ponce Inlet area of northeastern Florida,(2) central eastern Florida, encompassing VolusiaCounty south of Ponce Inlet and Brevard County, (3)southern Florida, represented by peninsular Floridabeaches from Juno Beach in southeastern Floridathrough Keewaydin Island in southwestern Florida,(4) the Dry Tortugas, (5) central western Florida, rep-resented by Sarasota County, and (6) northwesternFlorida (Shamblin et al. 2011a).
Extensive haplotype sharing (based on 380 bp hap-lotypes) among loggerhead turtle rookeries occursacross regional and ocean basin scales with just 2common haplotypes accounting for approximately90% of samples from North Atlantic and Mediterran-ean loggerhead rookeries (n = 1971, Fig. 1). Overlapof mtDNA markers not only confounds assessments ofdemographic connectivity among some rookeries butalso introduces uncertainty into estimates of rookerycontributions to mixed aggregations of foraging tur-tles (Bolker et al. 2007). As rookery sampling efforthas increased, additional haplotype sharing amongregions has been detected that could affect interpre-tations of mixed stock analyses. For example, someportion of CC-A1 turtles foraging in the Mediterran-ean initially assigned to western Atlantic stocks (Lau-rent et al. 1998, Carreras et al. 2006) could originatefrom the proximal Cape Verde rookery.
Sequence comparisons of an expanded mtDNAcontrol region fragment have detected novel poly-morphism with the potential to improve hawksbillturtle population structure assessments and mixedstock analyses (Abreu-Grobois et al. 2006). Sequenceanalysis of approximately 760 bp of the loggerheadturtle control region using the novel primersdescribed in that study subdivided the common380 bp haplotype CC-A1 into 4 haplotypes withthe longer sequences, with each present only in theCape Verde rookery or in the western Atlantic rook-ery sampled at Blackbeard Island, Georgia, USA(Monzón-Argüello et al. 2010). These results arepromising, and additional data are needed from the
146
Shamblin et al.: Atlantic loggerhead stock structure
major Atlantic rookeries to evaluate the utility of theexpanded control region sequences to improve reso-lution of population structure and mixed stock analy-ses. We addressed this need through reassessment ofpopulation structure among North Atlantic logger-head turtle rookeries using the 817 bp control region
fragment. This analysis also substantially increasedsample sizes compared with previous studies formost sampled populations and added novel haplo-type data from the Cay Sal Bank rookery, the largestnesting population in the Bahamas (Addison & Mum-ford 1996, Dow et al. 2007).
147
Fig. 1. Locations of major loggerhead turtleCaretta caretta nesting aggregations in theNorth Atlantic and Mediterranean and (A, B,C) frequencies of the 2 common 380 bp haplo-types among North Atlantic and Mediterran-ean loggerhead turtle rookeries taken from theliterature. Haplotype frequency data werefrom Encalada et al. (1998), Bowen et al.(2004), Shamblin et al. (2011a) (southeasternUSA); Encalada et al. (1998) (Mexico); Ruiz etal. (2008) (Cuba); Monzón-Argüello et al.(2010) (Cape Verde); Chaieb et al. (2010)(Tunisia); Garofalo et al. (2009) (Italy); Saied etal. (2012) (Libya); Encalada et al. (1998), Car-reras et al. (2007) (remaining Mediterraneansites). Fine scale data from Turkey (Yilmaz et
al. 2011) are omitted here for legibility
Mar Ecol Prog Ser 469: 145–160, 2012
MATERIALS AND METHODS
Field methods
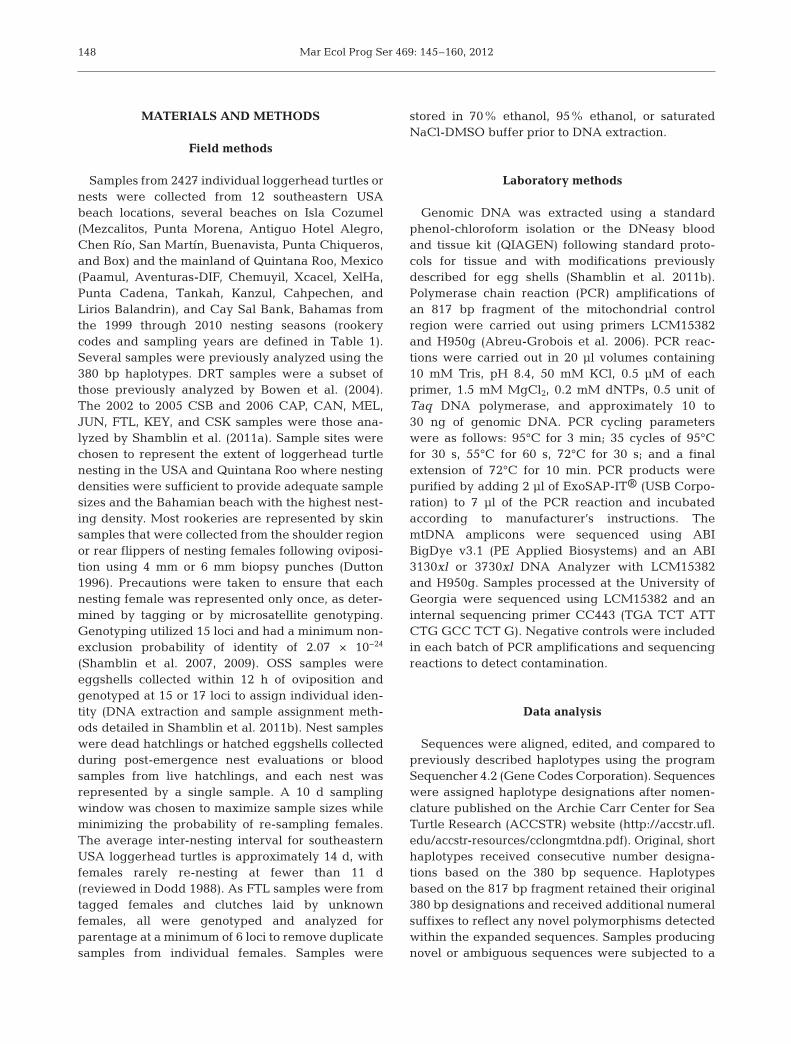
Samples from 2427 individual loggerhead turtles ornests were collected from 12 southeastern USAbeach locations, several beaches on Isla Cozumel(Mezcalitos, Punta Morena, Antiguo Hotel Alegro,Chen Río, San Martín, Buenavista, Punta Chiqueros,and Box) and the mainland of Quintana Roo, Mexico(Paamul, Aventuras-DIF, Chemuyil, Xcacel, XelHa,Punta Cadena, Tankah, Kanzul, Cahpechen, andLirios Balandrin), and Cay Sal Bank, Bahamas fromthe 1999 through 2010 nesting seasons (rookerycodes and sampling years are defined in Table 1).Several samples were previously analyzed using the380 bp haplotypes. DRT samples were a subset ofthose previously analyzed by Bowen et al. (2004).The 2002 to 2005 CSB and 2006 CAP, CAN, MEL,JUN, FTL, KEY, and CSK samples were those ana-lyzed by Shamblin et al. (2011a). Sample sites werechosen to represent the extent of loggerhead turtlenesting in the USA and Quintana Roo where nestingdensities were sufficient to provide adequate samplesizes and the Bahamian beach with the highest nest-ing density. Most rookeries are represented by skinsamples that were collected from the shoulder regionor rear flippers of nesting females following oviposi-tion using 4 mm or 6 mm biopsy punches (Dutton1996). Precautions were taken to ensure that eachnesting female was represented only once, as deter-mined by tagging or by microsatellite genotyping.Genotyping utilized 15 loci and had a minimum non-exclusion probability of identity of 2.07 × 10⁻²⁴
(Shamblin et al. 2007, 2009). OSS samples wereeggshells collected within 12 h of oviposition andgenotyped at 15 or 17 loci to assign individual iden-tity (DNA extraction and sample assignment meth-ods detailed in Shamblin et al. 2011b). Nest sampleswere dead hatchlings or hatched eggshells collectedduring post-emergence nest evaluations or bloodsamples from live hatchlings, and each nest was represented by a single sample. A 10 d samplingwindow was chosen to maximize sample sizes whileminimizing the probability of re-sampling females.The average inter-nesting interval for southeasternUSA loggerhead turtles is approximately 14 d, withfemales rarely re-nesting at fewer than 11 d(reviewed in Dodd 1988). As FTL samples were fromtagged females and clutches laid by unknownfemales, all were genotyped and analyzed forparentage at a minimum of 6 loci to remove duplicatesamples from individual females. Samples were
stored in 70% ethanol, 95% ethanol, or saturatedNaCl-DMSO buffer prior to DNA extraction.
Laboratory methods
Genomic DNA was extracted using a standardphenol-chloroform isolation or the DNeasy bloodand tissue kit (QIAGEN) following standard proto-cols for tissue and with modifications previouslydescribed for egg shells (Shamblin et al. 2011b).Polymerase chain reaction (PCR) amplifications ofan 817 bp fragment of the mitochondrial controlregion were carried out using primers LCM15382and H950g (Abreu-Grobois et al. 2006). PCR reac-tions were carried out in 20 µl volumes containing10 mM Tris, pH 8.4, 50 mM KCl, 0.5 µM of eachprimer, 1.5 mM MgCl2, 0.2 mM dNTPs, 0.5 unit ofTaq DNA polymerase, and approximately 10 to30 ng of genomic DNA. PCR cycling parameterswere as follows: 95°C for 3 min; 35 cycles of 95°Cfor 30 s, 55°C for 60 s, 72°C for 30 s; and a finalextension of 72°C for 10 min. PCR products werepurified by adding 2 µl of ExoSAP-IT® (USB Corpo-ration) to 7 µl of the PCR reaction and incubatedaccording to manufacturer’s instructions. ThemtDNA amplicons were sequenced using ABIBigDye v3.1 (PE Applied Biosystems) and an ABI3130xl or 3730xl DNA Analyzer with LCM15382and H950g. Samples processed at the University ofGeorgia were sequenced using LCM15382 and aninternal sequencing primer CC443 (TGA TCT ATTCTG GCC TCT G). Negative controls were includedin each batch of PCR amplifications and sequencingreactions to detect contamination.
Data analysis
Sequences were aligned, edited, and compared topreviously described haplotypes using the programSequencher 4.2 (Gene Codes Corporation). Sequenceswere assigned haplotype designations after nomen-clature published on the Archie Carr Center for SeaTurtle Research (ACCSTR) website (http:// accstr. ufl.edu/ accstr-resources/cclongmtdna. pdf). Original, shorthaplotypes received consecutive number designa-tions based on the 380 bp sequence. Haplotypesbased on the 817 bp fragment retained their original380 bp designations and received additional numeralsuffixes to reflect any novel polymorphisms detectedwithin the expanded sequences. Samples producingnovel or ambiguous sequences were subjected to a
148
Shamblin et al.: Atlantic loggerhead stock structure 149
Code Sample beach Nests Years sampled Samples Type Source
CAP Cape Island, South Carolina, USA 735a 2006 52 F Shamblin et al. (2011a)
OSS Ossabaw Island, Georgia, USA 165b 2008 58 E Present study 2009 31 E Present study
CAN Canaveral National Seashore, Florida, USA 2738c 2001 156 F Present study 2003 52 F Present study 2004 48 F Present study 2006 58 F Shamblin et al. (2011a)
MEL Melbourne Beach, Florida, USA 9439c 2003 201 F Present study 2004 147 F Present study 2006 104 F Shamblin et al. (2011a) 2007 132 F Present study 2008 166 F Present study
JUN Juno Beach, Florida, USA 3136c 2003 52 F Present study 2004 41 F Present study 2006 48 F Shamblin et al. (2011a)
FTL Ft. Lauderdale, Florida, USA 575c 2003 46 F Present study 2006 29 N Shamblin et al. (2011a)
CSL Cay Sal Bank, Bahamas 100−500d 1999 6 F Present study 2000 15 F Present study
DRT Dry Tortugas, Florida, USA 151c,e 1998 32 N Bowen et al. (2004)
ICZ Isla Cozumel, Quintana Roo, Mexico 230f 2008 21 N Present study
QRM Mainland Quintana Roo beaches, Mexico 1218g 2006 99 F Present study 2008 56 F Present study
KEY Keewaydin Island, Florida, USA 128c 2004 37 F Present study 2006 39 F Shamblin et al. (2011a) 2007 29 F Present study 2008 49 F Present study 2009 22 F Present study 2010 32 F Present study
CSK Casey Key, Florida, USA 449c 2006 55 F Shamblin et al. (2011a) 2007 64 F Present study 2008 100 F Present study 2009 90 F Present study 2010 148 F Present study
SGI St. George Island, Florida, USA 106c 2007 13 N Present study 2008 12 N Present study
CSB Cape San Blas, Florida, USA 36c 2002 15 F Shamblin et al. (2011a) 2003 14 F Shamblin et al. (2011a) 2004 10 F Shamblin et al. (2011a) 2005 9 F Shamblin et al. (2011a) 2010 39 F Present study
aSouth Carolina Department of Natural Resources databGeorgia Department of Natural Resources datacStatewide Nesting Beach Survey data, Florida Fish and Wildlife Research Institute, Florida Fish and Wildlife Conserva-tion Commission
dBahamas data from Dow et al. (2007), numbers represent total crawls, not just nestseNest counts available from 2003 and 2004 onlyf2008 nest count from Rafael Chacón, Director de Ecología en el Municipio de CozumelgAverage nest count for 2006 and 2008; Flora, Fauna y Cultura de México, A.C. Programa de Protección y Conservaciónde Tortugas Marinas en el Litoral Central del Estado de Quintana Roo data
Table 1. Sample collection and nesting data for sampled rookeries. Nests are annual mean nest counts from 2002 to 2006unless otherwise noted. F samples were skin biopsies obtained from nesting females. E samples were eggs collected the morn-ing following oviposition. N samples were either blood samples collected from hatchlings or dead hatchling or hatched egg
shells collected during post-emergence nest evaluations
second round of DNA extraction, PCR amplification,and sequencing for verification. Novel haplotypeswere deposited with Genbank and ACCSTR. Anunrooted parsimony network was created using theprogram TCS (Clement et al. 2000). Haplotype distri-bution maps were generated using the Maptool func-tion at www.seaturtle.org/maptool/.
Haplotype diversity (h), pairwise FST comparisons,and tests of genetic partitioning were conductedusing the software Arlequin version 3.5 (Excoffier &Lischer 2010). Significance values for analysis ofmolecular variance (AMOVA) were obtained from10 000 permutations. Tests of temporal variation ofhaplotype frequencies were conducted using haplo-type frequency-based AMOVA. All interannual sam-ples for each site that were not significantly differentwere pooled for spatial analyses. Spatial structurewas examined using pairwise FST comparisons, exacttests of population differentiation, and haplotype fre-quency-based AMOVA with p-values less than 0.05considered significant. Exact tests of population dif-ferentiation were conducted with 100 000 permuta-tions and 10 000 dememorization steps after themethod of Raymond & Rousset (1995). Frequencydata for 380 bp haplotypes for southwestern Cuban(SWC) rookeries (n = 36; Ruiz et al. 2008) wereincluded to assess the relationship of the Cubanrookeries relative to others in the region. As onlyshort sequences were available from Cuba, thereported FST values from Cuban comparisons weregenerated from a separate analysis so that the differ-ences between values generated from 380 and817 bp haplotype data for remaining rookeries couldbe attributed solely to differences in haplotype reso-lution. A Mantel test as implemented in Arlequin 3.5was used to test for the presence of isolation by dis-tance (Mantel 1967) based on the haplotype fre-quency-based FST matrix. These correlations werecalculated using both straight-line distances andminimum swim distances to account for terrestrialbarriers between sampling sites.
Following pairwise FST comparisons and exact testsof population differentiation, proximal NorthwestAtlantic sample sites that were not significantly dif-ferent using both tests were pooled for further analy-ses. Any ambiguous rookery clustering and splittingdecisions were testing through alternative groupingsby pairwise tests and AMOVA. Optimal groupingswere considered to yield the highest values for FST
and FCT, respectively, while also minimizing FSC forAMOVA. To minimize bias in the case of incorrectpooling decisions, haplotype frequencies wereweighted for each proposed management unit based
on the relative size of individual rookeries compris-ing them as measured by nest counts. Haplotype fre-quencies from proposed Northwest Atlantic manage-ment units determined from the initial analysis werethen compared with published data from Cape Verde(n = 128; Monzón-Argüello et al. 2010). Significanceof the final round of pairwise FST comparisons andexact tests of population differentiation were ad -justed using sequential Bonferroni correction with atable-wide α of 0.05 (Rice 1989).
RESULTS
Haplotypes
Sequence alignments of the 380 bp control regionfragment revealed 34 polymorphic sites, correspon-ding to 26 transitions and 9 indels among the Northwest Atlantic sample set (see Table S1 inthe supplement at www.int-res.com/articles/suppl/m469 p145_supp.xls). Position 358 contained both anindel and a transition. Sixteen of the polymorphicsites differed only between the 2 Atlantic lineagespreviously described from 380 bp control regionsequence analysis (Encalada et al. 1998). Polymor-phic sites defined 22 haplotypes, 14 of which werepreviously described from Northwest Atlantic rook-eries (Encalada et al. 1998, Bowen et al. 2004, Ruiz etal. 2008, Shamblin et al. 2011a). Haplotype CC-A21,formerly recovered from 2 foraging juveniles aroundthe Straits of Gibraltar (Revelles et al. 2007), wasfound in 2 nesting females from CSK in the presentstudy. Haplotype CC-A27, described from a juvenileforaging in the vicinity of the Gimnesies Islands inthe western Mediterranean (Carreras et al. 2006),was recovered from a female nesting at CSB in north-western Florida. The remaining haplotypes werenovel: CC-A36, CC-A41, CC-A42, CC-A51, CC-A59,and CC-A60.
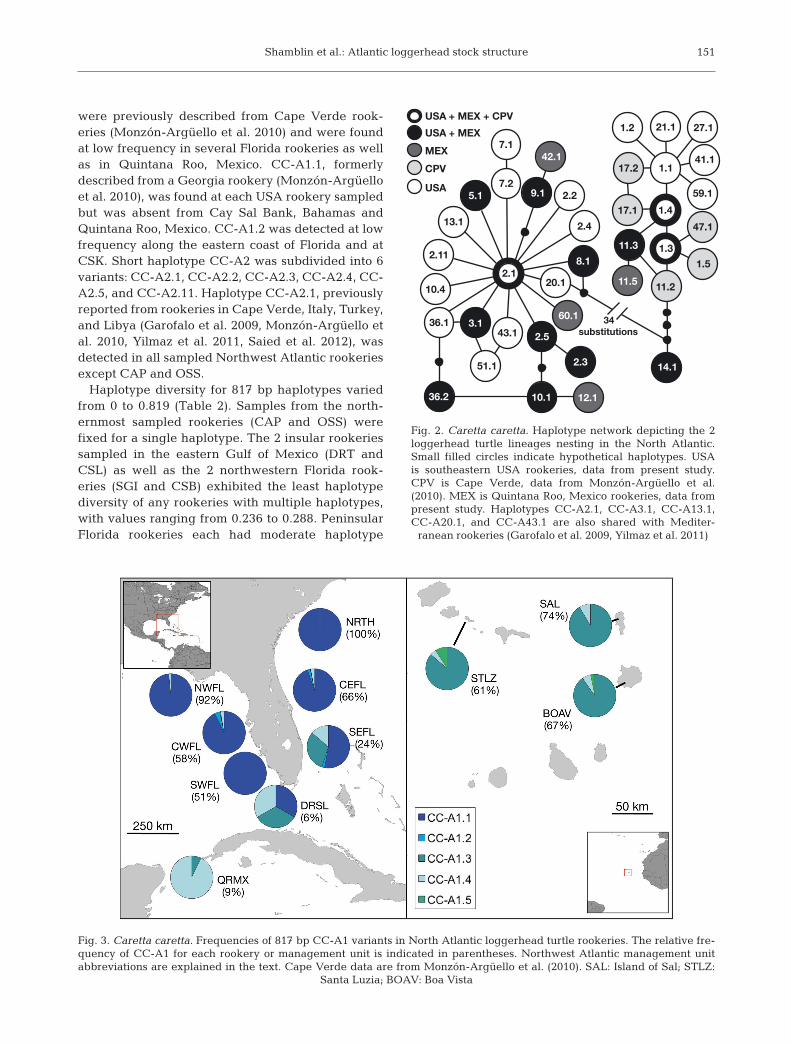
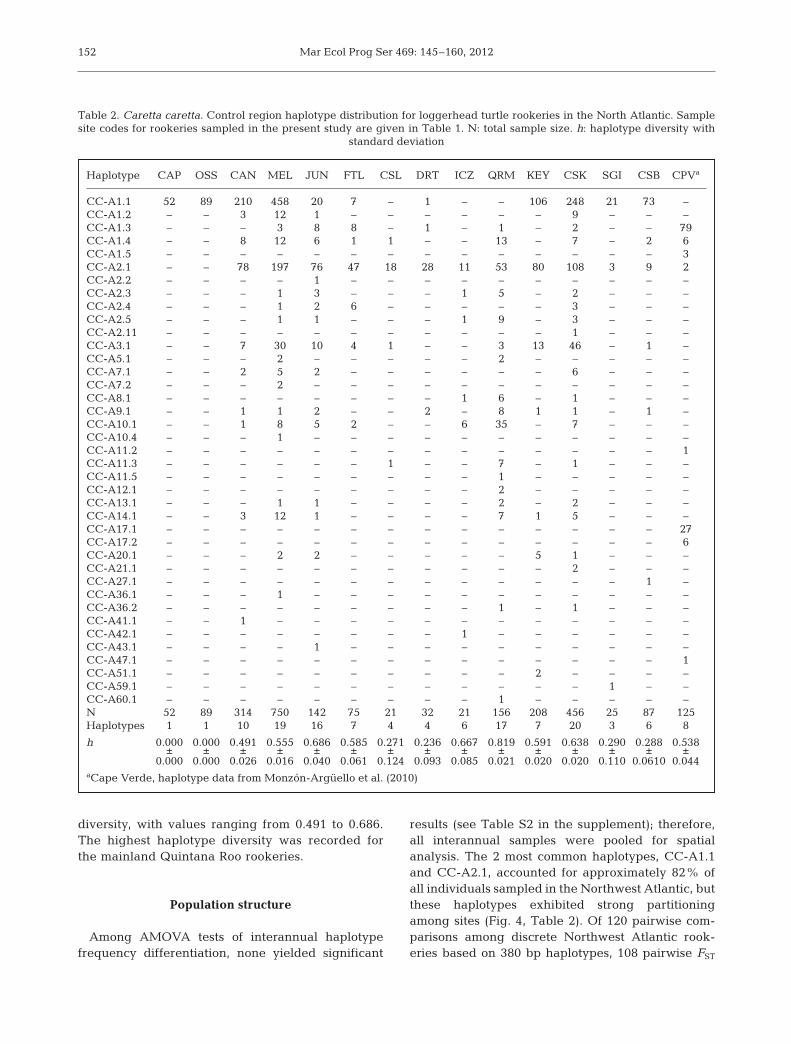
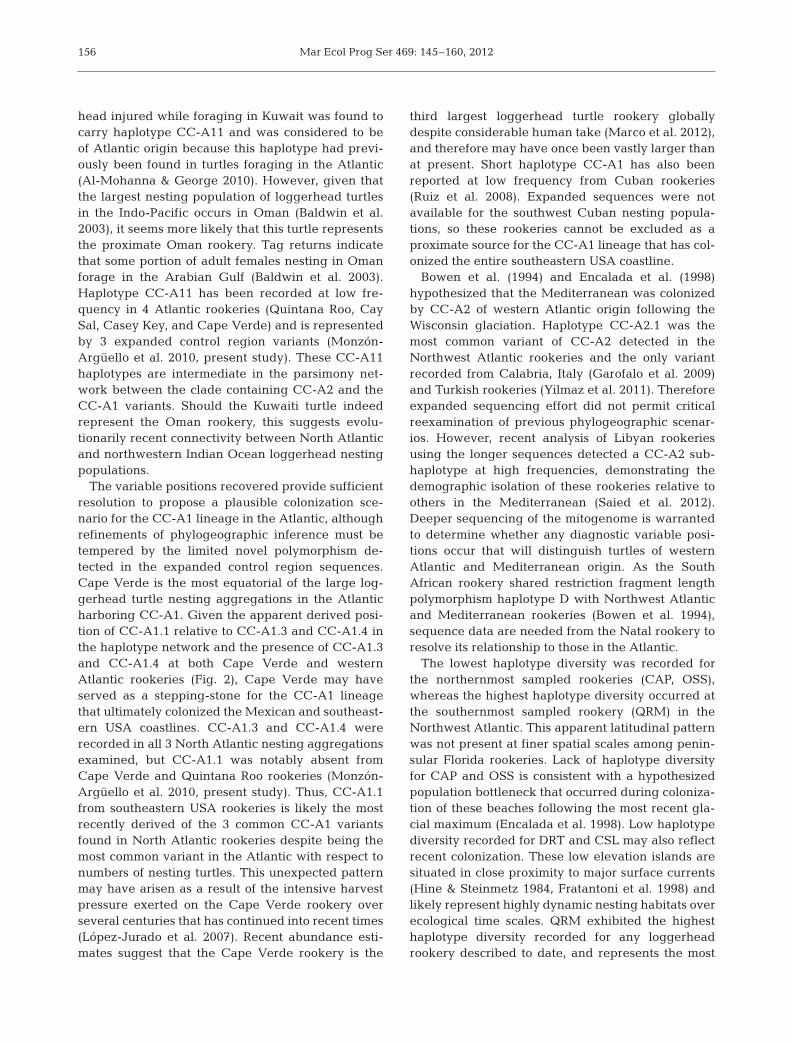
Sequence comparisons of the 817 bp fragmentyielded 22 additional polymorphic positions, corre-sponding to 20 transitions and 2 transversions(Table S1 in the supplement). Eleven of the sites var-ied only between the 2 lineages. Novel variable posi-tions subdivided six 380 bp haplotypes into 18 vari-ants for a total of 34 haplotypes resolved amongNorthwest Atlantic samples and 39 haplotypes acrossthe North Atlantic with the expanded control regionfragment (Fig. 2). Short haplotype CC-A1 was sub -divided into 4 variants among Northwest Atlanticrookeries: CC-A1.1, CC-A1.2, CC-A1.3, and CC-A1.4 (Fig. 3). Haplotypes CC-A1.3 and CC-A1.4
Mar Ecol Prog Ser 469: 145–160, 2012150
Shamblin et al.: Atlantic loggerhead stock structure 151
were previously described from Cape Verde rook-eries (Monzón-Argüello et al. 2010) and were foundat low frequency in several Florida rookeries as wellas in Quintana Roo, Mexico. CC-A1.1, formerlydescribed from a Georgia rookery (Monzón-Argüelloet al. 2010), was found at each USA rookery sampledbut was absent from Cay Sal Bank, Bahamas andQuintana Roo, Mexico. CC-A1.2 was detected at lowfrequency along the eastern coast of Florida and atCSK. Short haplotype CC-A2 was subdivided into 6variants: CC-A2.1, CC-A2.2, CC-A2.3, CC-A2.4, CC-A2.5, and CC-A2.11. Haplotype CC-A2.1, previouslyreported from rookeries in Cape Verde, Italy, Turkey,and Libya (Garofalo et al. 2009, Monzón-Argüello etal. 2010, Yilmaz et al. 2011, Saied et al. 2012), wasdetected in all sampled Northwest Atlantic rookeriesexcept CAP and OSS.
Haplotype diversity for 817 bp haplotypes variedfrom 0 to 0.819 (Table 2). Samples from the north-ernmost sampled rookeries (CAP and OSS) werefixed for a single haplotype. The 2 insular rookeriessampled in the eastern Gulf of Mexico (DRT andCSL) as well as the 2 northwestern Florida rook-eries (SGI and CSB) exhibited the least haplotypediversity of any rookeries with multiple haplotypes,with values ranging from 0.236 to 0.288. PeninsularFlorida rookeries each had moderate haplotype
1.3
1.4
1.1
1.2
59.1
21.1
14.1
11.3
2.1
5.1
2.3
2.5
10.1
7.2
7.1
8.1
3.1 36.1
10.4
2.4
20.1
34 substitutions
11.2
17.1
17.2
47.1
1.5
9.1 USA
USA + MEX
13.1
36.2
51.1
2.11
CPV
43.1
27.1
60.1
MEX 42.1
11.5
41.1
12.1
USA + MEX + CPV
2.1
1.3
1.4 2.2
Fig. 2. Caretta caretta. Haplotype network depicting the 2loggerhead turtle lineages nesting in the North Atlantic.Small filled circles indicate hypothetical haplotypes. USAis southeastern USA rookeries, data from present study.CPV is Cape Verde, data from Monzón-Argüello et al.(2010). MEX is Quintana Roo, Mexico rookeries, data frompresent study. Haplotypes CC-A2.1, CC-A3.1, CC-A13.1,CC-A20.1, and CC-A43.1 are also shared with Mediter-
ranean rookeries (Garofalo et al. 2009, Yilmaz et al. 2011)
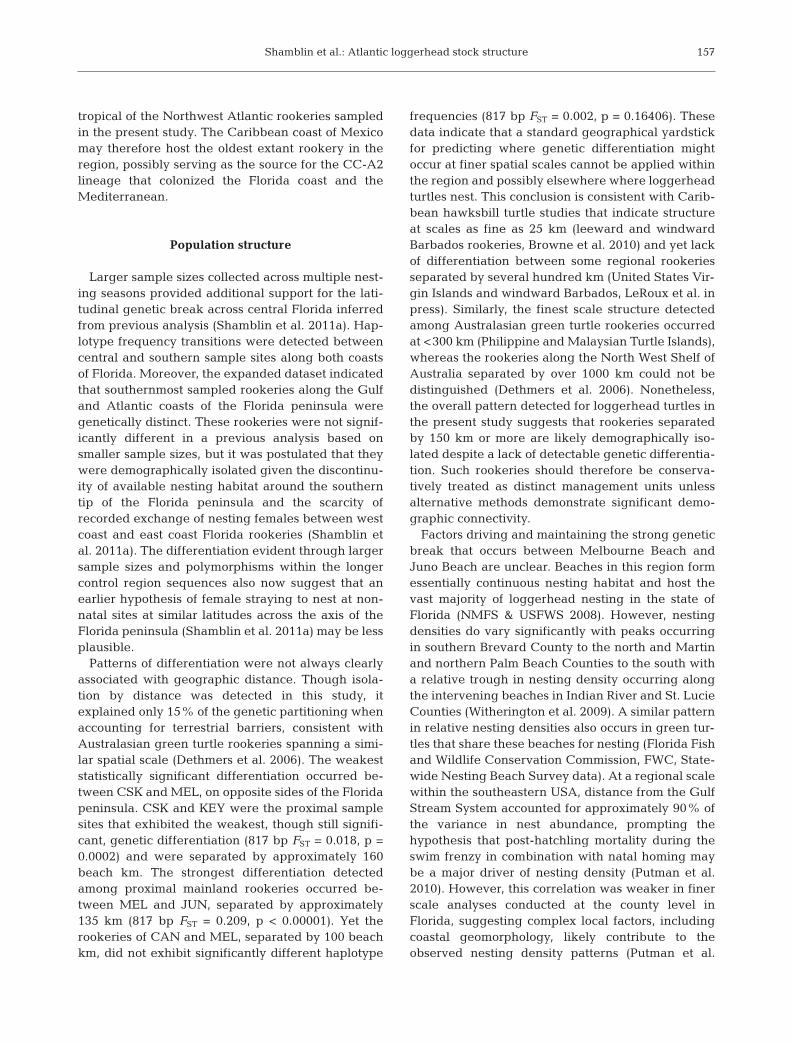
Fig. 3. Caretta caretta. Frequencies of 817 bp CC-A1 variants in North Atlantic loggerhead turtle rookeries. The relative fre-quency of CC-A1 for each rookery or management unit is indicated in parentheses. Northwest Atlantic management unitabbreviations are explained in the text. Cape Verde data are from Monzón-Argüello et al. (2010). SAL: Island of Sal; STLZ:
Santa Luzia; BOAV: Boa Vista
Mar Ecol Prog Ser 469: 145–160, 2012152
diversity, with values ranging from 0.491 to 0.686.The highest haplotype diversity was recorded forthe mainland Quintana Roo rookeries.
Population structure
Among AMOVA tests of interannual haplotype frequency differentiation, none yielded significant
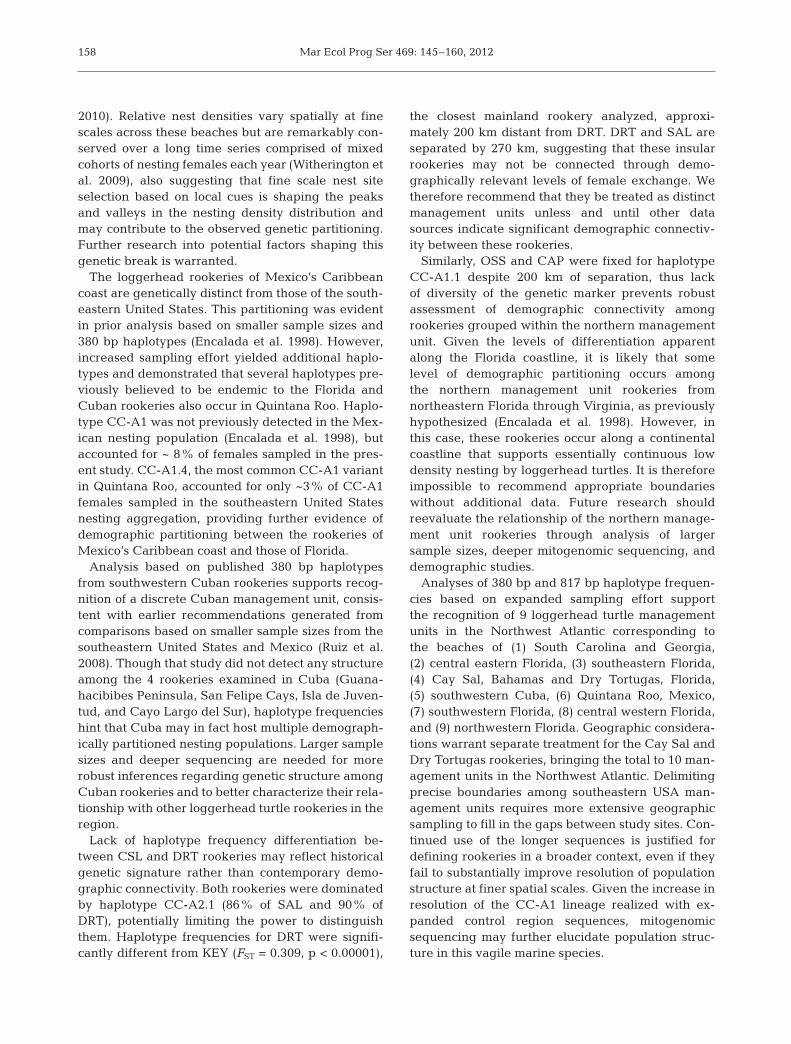
results (see Table S2 in the supplement); therefore,all interannual samples were pooled for spatialanalysis. The 2 most common haplotypes, CC-A1.1and CC-A2.1, accounted for approximately 82% ofall individuals sampled in the Northwest Atlantic, butthese haplotypes exhibited strong partitioningamong sites (Fig. 4, Table 2). Of 120 pairwise com-parisons among discrete Northwest Atlantic rook-eries based on 380 bp haplotypes, 108 pairwise FST
Haplotype CAP OSS CAN MEL JUN FTL CSL DRT ICZ QRM KEY CSK SGI CSB CPVa
CC-A1.1 52 89 210 458 20 7 – 1 – – 106 248 21 73 –CC-A1.2 – – 3 12 1 – – – – – – 9 – – –CC-A1.3 – – – 3 8 8 – 1 – 1 – 2 – – 79CC-A1.4 – – 8 12 6 1 1 – – 13 – 7 – 2 6CC-A1.5 – – – – – – – – – – – – – – 3CC-A2.1 – – 78 197 76 47 18 28 11 53 80 108 3 9 2CC-A2.2 – – – – 1 – – – – – – – – – –CC-A2.3 – – – 1 3 – – – 1 5 – 2 – – –CC-A2.4 – – – 1 2 6 – – – – – 3 – – –CC-A2.5 – – – 1 1 – – – 1 9 – 3 – – –CC-A2.11 – – – – – – – – – – – 1 – – –CC-A3.1 – – 7 30 10 4 1 – – 3 13 46 – 1 –CC-A5.1 – – – 2 – – – – – 2 – – – – –CC-A7.1 – – 2 5 2 – – – – – – 6 – – –CC-A7.2 – – – 2 – – – – – – – – – – –CC-A8.1 – – – – – – – – 1 6 – 1 – – –CC-A9.1 – – 1 1 2 – – 2 – 8 1 1 – 1 –CC-A10.1 – – 1 8 5 2 – – 6 35 – 7 – – –CC-A10.4 – – – 1 – – – – – – – – – – –CC-A11.2 – – – – – – – – – – – – – – 1CC-A11.3 – – – – – – 1 – – 7 – 1 – – –CC-A11.5 – – – – – – – – – 1 – – – – –CC-A12.1 – – – – – – – – – 2 – – – – –CC-A13.1 – – – 1 1 – – – – 2 – 2 – – –CC-A14.1 – – 3 12 1 – – – – 7 1 5 – – –CC-A17.1 – – – – – – – – – – – – – – 27CC-A17.2 – – – – – – – – – – – – – – 6CC-A20.1 – – – 2 2 – – – – – 5 1 – – –CC-A21.1 – – – – – – – – – – – 2 – – –CC-A27.1 – – – – – – – – – – – – – 1 –CC-A36.1 – – – 1 – – – – – – – – – – –CC-A36.2 – – – – – – – – – 1 – 1 – – –CC-A41.1 – – 1 – – – – – – – – – – – –CC-A42.1 – – – – – – – – 1 – – – – – –CC-A43.1 – – – – 1 – – – – – – – – – –CC-A47.1 – – – – – – – – – – – – – – 1CC-A51.1 – – – – – – – – – – 2 – – – –CC-A59.1 – – – – – – – – – – – – 1 – –CC-A60.1 – – – – – – – – – 1 – – – – –N 52 89 314 750 142 75 21 32 21 156 208 456 25 87 125Haplotypes 1 1 10 19 16 7 4 4 6 17 7 20 3 6 8
h 0.000 0.000 0.491 0.555 0.686 0.585 0.271 0.236 0.667 0.819 0.591 0.638 0.290 0.288 0.538 ± ± ± ± ± ± ± ± ± ± ± ± ± ± ±
0.000 0.000 0.026 0.016 0.040 0.061 0.124 0.093 0.085 0.021 0.020 0.020 0.110 0.0610 0.044aCape Verde, haplotype data from Monzón-Argüello et al. (2010)
Table 2. Caretta caretta. Control region haplotype distribution for loggerhead turtle rookeries in the North Atlantic. Samplesite codes for rookeries sampled in the present study are given in Table 1. N: total sample size. h: haplotype diversity with
standard deviation

Shamblin et al.: Atlantic loggerhead stock structure
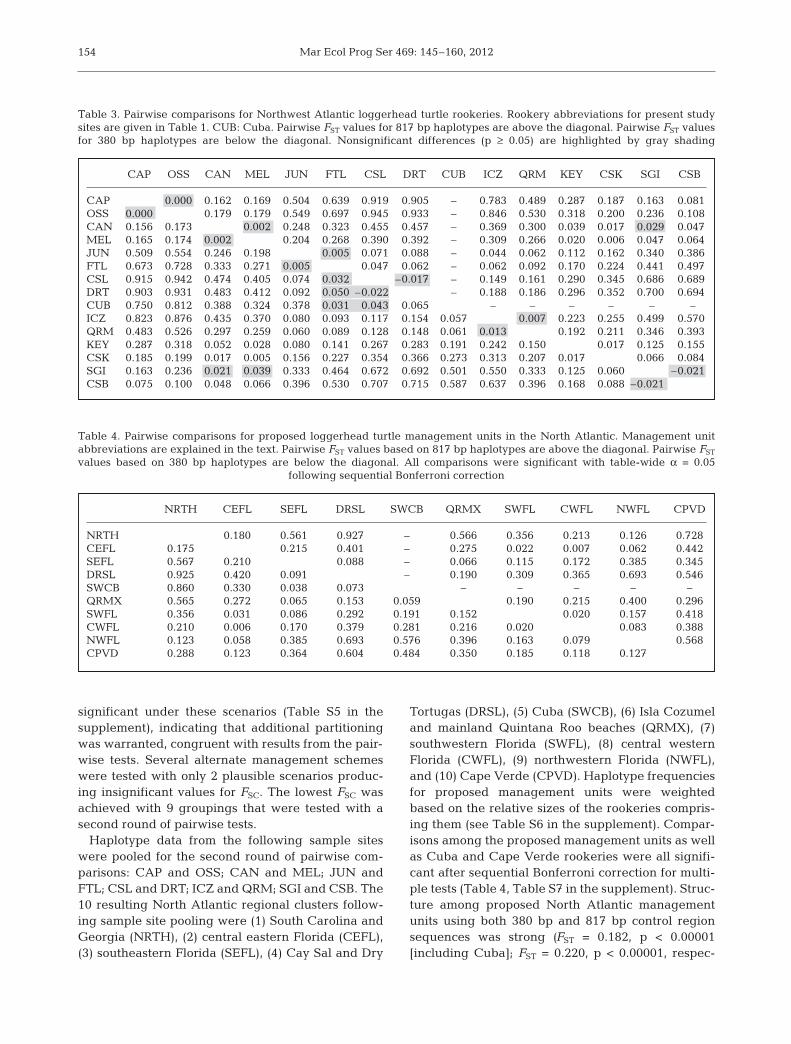
comparisons and 107 exact tests of population differ-entiation indicated differentiation (Table 3, Table S3in the supplement). Of 91 pairwise comparisonsbased on 817 bp haplotypes (less the Cuban rookeryfor which expanded sequences were not available),84 pairwise FST comparisons and 79 exact tests ofpopulation differentiation were significant (Tables 3& S3). Comparisons involving proximal (rangingfrom 50 to approximately 270 km) sample sitesaccounted for most of the nonsignificant differences.
Sample site clustering and splitting was generallyunambiguous with appropriate boundaries indicatedby congruent pairwise FST and exact tests of popula-
tion differentiation. An exception was clustering forthe rookeries of southeastern Florida, the Bahamas,and the eastern Gulf of Mexico: JUN, FTL, CSL, DRT,and SWC. Alternative pairwise clustering andAMOVA results clarified groupings for these rook-eries (see Tables S4 & S5, respectively, in the supple-ment). Partitioning among provisional managementunits previously proposed by the Recovery Plan forthe Northwest Atlantic Population of the LoggerheadSea Turtle (Caretta caretta) (NMFS & USFWS 2008)and Shamblin et al. (2011a) was significant. Maxi-mum FCT was achieved by grouping Florida as pro-posed in the Recovery Plan. However, FSC was also
153
Fig. 4. Caretta caretta. Sample site locations and frequencies of the 3 most common haplotypes of sampled loggerhead turtlerookeries in the Northwest Atlantic. Rookery abbreviations are explained in Table 1. ( ) Position of rookeries. Dashed
lines: proposed management unit subdivisions but not necessarily precise placement of boundaries
Mar Ecol Prog Ser 469: 145–160, 2012
significant under these scenarios (Table S5 in thesupplement), indicating that additional partitioningwas warranted, congruent with results from the pair-wise tests. Several alternate management schemeswere tested with only 2 plausible scenarios produc-ing insignificant values for FSC. The lowest FSC wasachieved with 9 groupings that were tested with asecond round of pairwise tests.
Haplotype data from the following sample siteswere pooled for the second round of pairwise com-parisons: CAP and OSS; CAN and MEL; JUN andFTL; CSL and DRT; ICZ and QRM; SGI and CSB. The10 resulting North Atlantic regional clusters follow-ing sample site pooling were (1) South Carolina andGeorgia (NRTH), (2) central eastern Florida (CEFL),(3) southeastern Florida (SEFL), (4) Cay Sal and Dry
Tortugas (DRSL), (5) Cuba (SWCB), (6) Isla Cozumeland mainland Quintana Roo beaches (QRMX), (7)southwestern Florida (SWFL), (8) central westernFlorida (CWFL), (9) northwestern Florida (NWFL),and (10) Cape Verde (CPVD). Haplotype frequenciesfor proposed management units were weightedbased on the relative sizes of the rookeries compris-ing them (see Table S6 in the supplement). Compar-isons among the proposed management units as wellas Cuba and Cape Verde rookeries were all signifi-cant after sequential Bonferroni correction for multi-ple tests (Table 4, Table S7 in the supplement). Struc-ture among proposed North Atlantic managementunits using both 380 bp and 817 bp control regionsequences was strong (FST = 0.182, p < 0.00001[including Cuba]; FST = 0.220, p < 0.00001, respec-
154
CAP OSS CAN MEL JUN FTL CSL DRT CUB ICZ QRM KEY CSK SGI CSB
CAP 0.000 0.162 0.169 0.504 0.639 0.919 0.905 – 0.783 0.489 0.287 0.187 0.163 0.081OSS 0.000 0.179 0.179 0.549 0.697 0.945 0.933 – 0.846 0.530 0.318 0.200 0.236 0.108CAN 0.156 0.173 0.002 0.248 0.323 0.455 0.457 – 0.369 0.300 0.039 0.017 0.029 0.047MEL 0.165 0.174 0.002 0.204 0.268 0.390 0.392 – 0.309 0.266 0.020 0.006 0.047 0.064JUN 0.509 0.554 0.246 0.198 0.005 0.071 0.088 – 0.044 0.062 0.112 0.162 0.340 0.386FTL 0.673 0.728 0.333 0.271 0.005 0.047 0.062 – 0.062 0.092 0.170 0.224 0.441 0.497CSL 0.915 0.942 0.474 0.405 0.074 0.032 –0.017 – 0.149 0.161 0.290 0.345 0.686 0.689DRT 0.903 0.931 0.483 0.412 0.092 0.050 –0.022 – 0.188 0.186 0.296 0.352 0.700 0.694CUB 0.750 0.812 0.388 0.324 0.378 0.031 0.043 0.065 – – – – – –ICZ 0.823 0.876 0.435 0.370 0.080 0.093 0.117 0.154 0.057 0.007 0.223 0.255 0.499 0.570QRM 0.483 0.526 0.297 0.259 0.060 0.089 0.128 0.148 0.061 0.013 0.192 0.211 0.346 0.393KEY 0.287 0.318 0.052 0.028 0.080 0.141 0.267 0.283 0.191 0.242 0.150 0.017 0.125 0.155CSK 0.185 0.199 0.017 0.005 0.156 0.227 0.354 0.366 0.273 0.313 0.207 0.017 0.066 0.084SGI 0.163 0.236 0.021 0.039 0.333 0.464 0.672 0.692 0.501 0.550 0.333 0.125 0.060 –0.021CSB 0.075 0.100 0.048 0.066 0.396 0.530 0.707 0.715 0.587 0.637 0.396 0.168 0.088 –0.021
Table 3. Pairwise comparisons for Northwest Atlantic loggerhead turtle rookeries. Rookery abbreviations for present studysites are given in Table 1. CUB: Cuba. Pairwise FST values for 817 bp haplotypes are above the diagonal. Pairwise FST valuesfor 380 bp haplotypes are below the diagonal. Nonsignificant differences (p ≥ 0.05) are highlighted by gray shading
NRTH CEFL SEFL DRSL SWCB QRMX SWFL CWFL NWFL CPVD
NRTH 0.180 0.561 0.927 – 0.566 0.356 0.213 0.126 0.728CEFL 0.175 0.215 0.401 – 0.275 0.022 0.007 0.062 0.442SEFL 0.567 0.210 0.088 – 0.066 0.115 0.172 0.385 0.345DRSL 0.925 0.420 0.091 – 0.190 0.309 0.365 0.693 0.546SWCB 0.860 0.330 0.038 0.073 – – – – –QRMX 0.565 0.272 0.065 0.153 0.059 0.190 0.215 0.400 0.296SWFL 0.356 0.031 0.086 0.292 0.191 0.152 0.020 0.157 0.418CWFL 0.210 0.006 0.170 0.379 0.281 0.216 0.020 0.083 0.388NWFL 0.123 0.058 0.385 0.693 0.576 0.396 0.163 0.079 0.568CPVD 0.288 0.123 0.364 0.604 0.484 0.350 0.185 0.118 0.127
Table 4. Pairwise comparisons for proposed loggerhead turtle management units in the North Atlantic. Management unitabbreviations are explained in the text. Pairwise FST values based on 817 bp haplotypes are above the diagonal. Pairwise FST
values based on 380 bp haplotypes are below the diagonal. All comparisons were significant with table-wide α = 0.05 following sequential Bonferroni correction
Shamblin et al.: Atlantic loggerhead stock structure
tively). When considering only straight-line distancesamong rookeries, there was evidence of isolation bydistance (r2 = 0.578, p < 0.00001), which accountedfor approximately 33% of the observed genetic dif-ferentiation. However, when accounting for geo-graphical barriers (primarily the Florida peninsula),this correlation was much weaker (r2 = 0.382, p =0.005) and accounted for only 14.5% of the geneticpartitioning.
DISCUSSION
Improved resolution through longer mtDNAsequences
Expanding control region haplotypes from 380 to817 bp improved resolution of population structure atbroad spatial scales for the CC-A1 lineage (Fig. 3).Polymorphism detected in analysis of the longersequences increased differentiation between most ofthe proposed southeastern USA management unitsand Cape Verde, as was previously demonstrated forGeorgia and Cape Verde comparisons (Monzón-Argüello et al. 2010). This was particularly true fortests involving USA management units dominatedby CC-A1.1. Similarly, CC-A1.4 was the dominantCC-A1 variant found in Mexican rookeries butwas a minor haplotype in the USA and Cape Verderookeries (Fig. 3). Increased differentiation was alsodetected between SEFL rookeries compared to allothers in the southeastern USA. Haplotype CC-A1.3accounted for a relatively large proportion of the CC-A1 turtles sampled in southeastern Florida (31%),whereas this haplotype accounted for only 0.4% and0.7% of the CC-A1 turtles sampled nesting in centraleastern (CAN and MEL) and central western (CSK)Florida, respectively, and was not detected in south-west Florida, northwest Florida, Georgia, or SouthCarolina.
Expanded control region sequences were compar-atively less informative for the CC-A2 lineage. Vari-ant CC-A2.1 has been recorded from all rookeriesexamined with longer sequences where CC-A2 ispresent (Garofalo et al. 2009, Monzón-Argüello et al.2010, Yilmaz et al. 2011, Saied et al. 2012), and onlymodest partitioning of variants occurred amongNorthwest Atlantic rookeries. The Quintana Roomanagement unit was the most distinctive comparedto all others, with CC-A2.3 and CC-A2.5 represent-ing approximately 20% of the CC-A2 turtles sam-pled. CC-A2.4 was detected only among a portion ofFlorida rookeries but comprised a small proportion of
the CC-A2 individuals even in the region where itwas most common (SEFL, ~6%).
Mitochondrial markers outside of the original con-trol region read lengths have proven useful forimproved stock resolution in other marine turtle spe-cies. Longer control region sequences subdivided490 bp CM-A5 into 2 variants and demonstrated thedemographic independence of the Aves Island greenturtle rookery relative to others in the Caribbean(Shamblin et al. 2012). Expanded control regionsequences have demonstrated increased structureamong wider Caribbean hawksbill turtle rookeriesthrough subdivision of 1 of 2 common 384 bp haplo-types (Haplotype F is now subdivided into Ei-A9 andEi-A11; Velez-Zuazo et al. 2008, Browne et al. 2010,LeRoux et al. in press). However, longer sequencesdid not significantly improve resolution for haplotypeA with nearly all foraging and nesting individualsstill confounded as haplotype Ei-A1 (Browne et al.2010, LeRoux et al. in press). The repetitive elementpresent in the mitochondrial genome was recentlyshown to be highly polymorphic in Mediterraneangreen turtles (Tikochinski et al. 2012) and logger-head turtles nesting at Zakynthos, Greece (Droso -poulou et al. 2012), despite minimal haplotype diver-sity in the remainder of the control region withinnesting populations, suggesting that these may besuitable markers for identifying fine scale structure.Mitogenomic variable positions were also recentlyshown to improve stock structure among green turtlerookeries through subdivision of a common controlregion haplotype into regional subhaplotypes (Sham-blin et al. 2012). Whereas it is difficult to predict pre-cisely which species, populations, or lineages of mar-ine turtles will benefit most from population levelreanalysis based on deeper mitogenomic sequen-cing, these examples demonstrate that meaningfulgains in resolution are possible.
Phylogeography
Initial restriction fragment length polymorphismanalysis of the mitochondrial genome detected 2 lineages of loggerhead turtles globally, each repre-sented by rookeries in the Indo-Pacific and Atlantic(Bowen et al. 1994). Bowen et al. (1994) hypothe-sized that one lineage may have evolved in theAtlantic (represented in the present study by CC-A1and its related haplotypes), with a precursor to hap-lotype F (found at the Oman rookery in the IndianOcean) invading that basin during an interglacialperiod around the southern tip of Africa. A logger-
155
Mar Ecol Prog Ser 469: 145–160, 2012
head injured while foraging in Kuwait was found tocarry haplotype CC-A11 and was considered to beof Atlantic origin because this haplotype had previ-ously been found in turtles foraging in the Atlantic(Al-Mohanna & George 2010). However, given thatthe largest nesting population of loggerhead turtlesin the Indo-Pacific occurs in Oman (Baldwin et al.2003), it seems more likely that this turtle representsthe proximate Oman rookery. Tag returns indicatethat some portion of adult females nesting in Omanforage in the Arabian Gulf (Baldwin et al. 2003).Haplotype CC-A11 has been recorded at low fre-quency in 4 Atlantic rookeries (Quintana Roo, CaySal, Casey Key, and Cape Verde) and is representedby 3 expanded control region variants (Monzón-Argüello et al. 2010, present study). These CC-A11haplotypes are intermediate in the parsimony net-work between the clade containing CC-A2 and theCC-A1 variants. Should the Kuwaiti turtle indeedrepresent the Oman rookery, this suggests evolu-tionarily recent connectivity between North Atlanticand northwestern Indian Ocean loggerhead nestingpopulations.
The variable positions recovered provide sufficientresolution to propose a plausible colonization sce-nario for the CC-A1 lineage in the Atlantic, althoughrefinements of phylogeographic inference must betempered by the limited novel polymorphism de -tected in the expanded control region sequences.Cape Verde is the most equatorial of the large log-gerhead turtle nesting aggregations in the Atlanticharboring CC-A1. Given the apparent derived posi-tion of CC-A1.1 relative to CC-A1.3 and CC-A1.4 inthe haplotype network and the presence of CC-A1.3and CC-A1.4 at both Cape Verde and westernAtlantic rookeries (Fig. 2), Cape Verde may haveserved as a stepping-stone for the CC-A1 lineagethat ultimately colonized the Mexican and southeast-ern USA coastlines. CC-A1.3 and CC-A1.4 wererecorded in all 3 North Atlantic nesting aggregationsexamined, but CC-A1.1 was notably absent fromCape Verde and Quintana Roo rookeries (Monzón-Argüello et al. 2010, present study). Thus, CC-A1.1from southeastern USA rookeries is likely the mostrecently derived of the 3 common CC-A1 variantsfound in North Atlantic rookeries despite being themost common variant in the Atlantic with respect tonumbers of nesting turtles. This unexpected patternmay have arisen as a result of the intensive harvestpressure exerted on the Cape Verde rookery overseveral centuries that has continued into recent times(López-Jurado et al. 2007). Recent abundance esti-mates suggest that the Cape Verde rookery is the
third largest loggerhead turtle rookery globallydespite considerable human take (Marco et al. 2012),and therefore may have once been vastly larger thanat present. Short haplotype CC-A1 has also beenreported at low frequency from Cuban rookeries(Ruiz et al. 2008). Expanded sequences were notavailable for the southwest Cuban nesting popula-tions, so these rookeries cannot be excluded as aproximate source for the CC-A1 lineage that has col-onized the entire southeastern USA coastline.
Bowen et al. (1994) and Encalada et al. (1998)hypothesized that the Mediterranean was colonizedby CC-A2 of western Atlantic origin following theWisconsin glaciation. Haplotype CC-A2.1 was themost common variant of CC-A2 detected in theNorthwest Atlantic rookeries and the only variantrecorded from Calabria, Italy (Garofalo et al. 2009)and Turkish rookeries (Yilmaz et al. 2011). Thereforeexpanded sequencing effort did not permit criticalreexamination of previous phylogeographic scenar-ios. However, recent analysis of Libyan rookeriesusing the longer sequences detected a CC-A2 sub-haplotype at high frequencies, demonstrating thedemographic isolation of these rookeries relative toothers in the Mediterranean (Saied et al. 2012).Deeper sequencing of the mitogenome is warrantedto determine whether any diagnostic variable posi-tions occur that will distinguish turtles of westernAtlantic and Mediterranean origin. As the SouthAfrican rookery shared restriction fragment lengthpolymorphism haplotype D with Northwest Atlanticand Mediterranean rookeries (Bowen et al. 1994),sequence data are needed from the Natal rookery toresolve its relationship to those in the Atlantic.
The lowest haplotype diversity was recorded forthe northernmost sampled rookeries (CAP, OSS),whereas the highest haplotype diversity occurred atthe southernmost sampled rookery (QRM) in theNorthwest Atlantic. This apparent latitudinal patternwas not present at finer spatial scales among penin-sular Florida rookeries. Lack of haplotype diversityfor CAP and OSS is consistent with a hypothesizedpopulation bottleneck that occurred during coloniza-tion of these beaches following the most recent gla-cial maximum (Encalada et al. 1998). Low haplotypediversity recorded for DRT and CSL may also reflectrecent colonization. These low elevation islands aresituated in close proximity to major surface currents(Hine & Steinmetz 1984, Fratantoni et al. 1998) andlikely represent highly dynamic nesting habitats overecological time scales. QRM exhibited the highesthaplotype diversity recorded for any loggerheadrookery described to date, and represents the most
156
Shamblin et al.: Atlantic loggerhead stock structure
tropical of the Northwest Atlantic rookeries sampledin the present study. The Caribbean coast of Mexicomay therefore host the oldest extant rookery in theregion, possibly serving as the source for the CC-A2lineage that colonized the Florida coast and theMediterranean.
Population structure
Larger sample sizes collected across multiple nest-ing seasons provided additional support for the lati-tudinal genetic break across central Florida inferredfrom previous analysis (Shamblin et al. 2011a). Hap-lotype frequency transitions were detected betweencentral and southern sample sites along both coastsof Florida. Moreover, the expanded dataset indicatedthat southernmost sampled rookeries along the Gulfand Atlantic coasts of the Florida peninsula weregenetically distinct. These rookeries were not signif-icantly different in a previous analysis based onsmaller sample sizes, but it was postulated that theywere demographically isolated given the discontinu-ity of available nesting habitat around the southerntip of the Florida peninsula and the scarcity ofrecorded exchange of nesting females between westcoast and east coast Florida rookeries (Shamblin etal. 2011a). The differentiation evident through largersample sizes and polymorphisms within the longercontrol region sequences also now suggest that anearlier hypothesis of female straying to nest at non-natal sites at similar latitudes across the axis of theFlorida peninsula (Shamblin et al. 2011a) may be lessplausible.
Patterns of differentiation were not always clearlyassociated with geographic distance. Though isola-tion by distance was detected in this study, itexplained only 15% of the genetic partitioning whenaccounting for terrestrial barriers, consistent withAustralasian green turtle rookeries spanning a simi-lar spatial scale (Dethmers et al. 2006). The weakeststatistically significant differentiation occurred be -tween CSK and MEL, on opposite sides of the Floridapeninsula. CSK and KEY were the proximal samplesites that exhibited the weakest, though still signifi-cant, genetic differentiation (817 bp FST = 0.018, p =0.0002) and were separated by approximately 160beach km. The strongest differentiation detectedamong proximal mainland rookeries occurred be -tween MEL and JUN, separated by approximately135 km (817 bp FST = 0.209, p < 0.00001). Yet therookeries of CAN and MEL, separated by 100 beachkm, did not exhibit significantly different haplotype
frequencies (817 bp FST = 0.002, p = 0.16406). Thesedata indicate that a standard geographical yardstickfor predicting where genetic differentiation mightoccur at finer spatial scales cannot be applied withinthe region and possibly elsewhere where loggerheadturtles nest. This conclusion is consistent with Carib -bean hawksbill turtle studies that indicate structureat scales as fine as 25 km (leeward and windwardBarbados rookeries, Browne et al. 2010) and yet lackof differentiation between some regional rookeriesseparated by several hundred km (United States Vir-gin Islands and windward Barbados, LeRoux et al. inpress). Similarly, the finest scale structure detectedamong Australasian green turtle rookeries occurredat <300 km (Philippine and Malaysian Turtle Islands),whereas the rookeries along the North West Shelf ofAustralia separated by over 1000 km could not bedistinguished (Dethmers et al. 2006). Nonetheless,the overall pattern detected for loggerhead turtles inthe present study suggests that rookeries separatedby 150 km or more are likely demographically iso-lated despite a lack of detectable genetic differentia-tion. Such rookeries should therefore be conserva-tively treated as distinct management units unlessalternative methods demonstrate significant demo-graphic connectivity.
Factors driving and maintaining the strong geneticbreak that occurs between Melbourne Beach andJuno Beach are unclear. Beaches in this region formessentially continuous nesting habitat and host thevast majority of loggerhead nesting in the state ofFlorida (NMFS & USFWS 2008). However, nestingdensities do vary significantly with peaks occurringin southern Brevard County to the north and Martinand northern Palm Beach Counties to the south witha relative trough in nesting density occurring alongthe intervening beaches in Indian River and St. LucieCounties (Witherington et al. 2009). A similar patternin relative nesting densities also occurs in green tur-tles that share these beaches for nesting (Florida Fishand Wildlife Conservation Commission, FWC, State -wide Nesting Beach Survey data). At a regional scalewithin the southeastern USA, distance from the GulfStream System accounted for approximately 90% ofthe variance in nest abundance, prompting thehypothesis that post-hatchling mortality during theswim frenzy in combination with natal homing maybe a major driver of nesting density (Putman et al.2010). However, this correlation was weaker in finerscale analyses conducted at the county level inFlorida, suggesting complex local factors, includingcoastal geomorphology, likely contribute to theobserved nesting density patterns (Putman et al.
157
Mar Ecol Prog Ser 469: 145–160, 2012
2010). Relative nest densities vary spatially at finescales across these beaches but are remarkably con-served over a long time series comprised of mixedcohorts of nesting females each year (Witherington etal. 2009), also suggesting that fine scale nest siteselection based on local cues is shaping the peaksand valleys in the nesting density distribution andmay contribute to the observed genetic partitioning.Further research into potential factors shaping thisgenetic break is warranted.
The loggerhead rookeries of Mexico’s Caribbeancoast are genetically distinct from those of the south-eastern United States. This partitioning was evidentin prior analysis based on smaller sample sizes and380 bp haplotypes (Encalada et al. 1998). However,increased sampling effort yielded additional haplo-types and demonstrated that several haplotypes pre-viously believed to be endemic to the Florida andCuban rookeries also occur in Quintana Roo. Haplo-type CC-A1 was not previously detected in the Mex-ican nesting population (Encalada et al. 1998), butaccounted for ~ 8% of females sampled in the pres-ent study. CC-A1.4, the most common CC-A1 variantin Quintana Roo, accounted for only ~3% of CC-A1females sampled in the southeastern United Statesnesting aggregation, providing further evidence ofdemographic partitioning between the rookeries ofMexico’s Caribbean coast and those of Florida.
Analysis based on published 380 bp haplotypesfrom southwestern Cuban rookeries supports recog-nition of a discrete Cuban management unit, consis-tent with earlier recommendations generated fromcomparisons based on smaller sample sizes from thesoutheastern United States and Mexico (Ruiz et al.2008). Though that study did not detect any structureamong the 4 rookeries examined in Cuba (Guana-hacibibes Peninsula, San Felipe Cays, Isla de Juven-tud, and Cayo Largo del Sur), haplotype frequencieshint that Cuba may in fact host multiple demograph-ically partitioned nesting populations. Larger samplesizes and deeper sequencing are needed for morerobust inferences regarding genetic structure amongCuban rookeries and to better characterize their rela-tionship with other loggerhead turtle rookeries in theregion.
Lack of haplotype frequency differentiation be -tween CSL and DRT rookeries may reflect historicalgenetic signature rather than contemporary demo-graphic connectivity. Both rookeries were dominatedby haplotype CC-A2.1 (86% of SAL and 90% ofDRT), potentially limiting the power to distinguishthem. Haplotype frequencies for DRT were signifi-cantly different from KEY (FST = 0.309, p < 0.00001),
the closest mainland rookery analyzed, approxi-mately 200 km distant from DRT. DRT and SAL areseparated by 270 km, suggesting that these insularrookeries may not be connected through demo-graphically relevant levels of female exchange. Wetherefore recommend that they be treated as distinctmanagement units unless and until other datasources indicate significant demographic connectiv-ity between these rookeries.
Similarly, OSS and CAP were fixed for haplotypeCC-A1.1 despite 200 km of separation, thus lackof diversity of the genetic marker prevents robustassessment of demographic connectivity amongrookeries grouped within the northern managementunit. Given the levels of differentiation apparentalong the Florida coastline, it is likely that somelevel of demographic partitioning occurs amongthe northern management unit rookeries fromnortheastern Florida through Virginia, as previouslyhypothesized (Encalada et al. 1998). However, inthis case, these rookeries occur along a continentalcoastline that supports essentially continuous lowdensity nesting by loggerhead turtles. It is thereforeimpossible to recommend appropriate boundarieswithout additional data. Future research shouldreevaluate the relationship of the northern manage-ment unit rookeries through analysis of larger sample sizes, deeper mito genomic sequencing, anddemographic studies.
Analyses of 380 bp and 817 bp haplotype frequen-cies based on expanded sampling effort supportthe recognition of 9 loggerhead turtle managementunits in the Northwest Atlantic corresponding tothe beaches of (1) South Carolina and Georgia,(2) central eastern Florida, (3) southeastern Florida,(4) Cay Sal, Bahamas and Dry Tortugas, Florida,(5) southwestern Cuba, (6) Quintana Roo, Mexico,(7) southwestern Florida, (8) central western Florida,and (9) northwestern Florida. Geographic considera-tions warrant separate treatment for the Cay Sal andDry Tortugas rookeries, bringing the total to 10 man-agement units in the Northwest Atlantic. Delimitingprecise boundaries among southeastern USA man-agement units requires more extensive geographicsampling to fill in the gaps between study sites. Con-tinued use of the longer sequences is justified fordefining rookeries in a broader context, even if theyfail to substantially improve resolution of populationstructure at finer spatial scales. Given the increase inresolution of the CC-A1 lineage realized with ex -panded control region sequences, mitogenomicsequencing may further elucidate population struc-ture in this vagile marine species.
158
Shamblin et al.: Atlantic loggerhead stock structure
Acknowledgements. In addition to the many volunteers, stu-dents, and staff representing the authors’ institutions, wethank S. Ouellette and the Broward County Sea Turtle Pro-gram crew, B. Drye of the St. George Island volunteerturtlers, and R. Chacón, director of the marine turtle pro-gram in the municipality of Cozumel, México for providingsamples. We thank G. Clark at the ICBR Genetic AnalysisLaboratory at the University of Florida for isolations andamplifications and S. Shankar in the ICBR Genomics Coreat the University of Florida for sequencing a portion ofthe Florida samples. We also recognize contributions fromA. Meylan, S. Murphy, D. Griffin, A. McKee, S. Dawsey,D. Browning, A. Mackinnon, M. Koperski, A. Frey, andK. Stewart. Thanks to 4 anonymous reviewers who greatlyimproved the quality of the manuscript. This research wasfunded in part by a grant awarded from the Sea TurtleGrants Program. The Sea Turtle Grants Program is fundedfrom proceeds from the sale of the Florida Sea Turtle LicensePlate. Learn more at www.helpingseaturtles.org.
LITERATURE CITED
Abreu-Grobois A, Horrocks J, Formia A, Dutton P and oth-ers (2006) New mtDNA dloop primers which work for avariety of marine turtle species may increase the resolu-tion of mixed stock analyses. In: Frick M, PanagopoulouA, Rees AF, Williams K (eds) Book of abstracts from the26th annual symposium on sea turtle biology and conser-vation. International Sea Turtle Society, Athens, p 179
Addison D, Mumford B (1996) Sea turtle nesting activity onthe Cay Sal Bank. Bahamas J Sci 3: 31−36
Al-Mohanna S, George P (2010) Assessment of the origin ofa loggerhead turtle, Caretta caretta, found in Kuwaitiwaters, using mitochondrial DNA. Zool Middle East 49: 39−44
Baldwin R, Hughes G, Prince R (2003) Loggerhead turtles inthe Indian Ocean. In: Bolten A, Witherington B (eds) Log-gerhead sea turtles. Smithsonian Institution Press, Wash-ington, DC, p 218−232
Benhamou S, Sudre J, Bourjea J, Ciccione S, De Santis A,Luschi P (2011) The role of geomagnetic cues in greenturtle open sea navigation. PLoS ONE 6: e26672
Bolker BM, Okuyama T, Bjorndal KA, Bolten AB (2007)Incorporating multiple mixed stocks in mixed stockanalysis: ‘many to many’ analyses. Mol Ecol 16: 685−695
Bolten AB (2003) The loggerhead sea turtle: a most excellentfishe. In: Bolten AB, Witherington BE (eds) Loggerheadsea turtles. Smithsonian Institution Press, Washington,DC, p 1−3
Bowen BW, Karl SA (2007) Population genetics and phylo-geography of sea turtles. Mol Ecol 16: 4886−4907
Bowen BW, Avise JC, Richardson JI, Meylan AB, Margari-toulis D, Hopkins-Murphy SR (1993) Population structureof loggerhead turtles (Caretta caretta) in the northwest-ern Atlantic Ocean and Mediterranean Sea. Conserv Biol7: 834−844
Bowen BW, Kamezaki N, Limpus CJ, Hughes GR, MeylanAB, Avise JC (1994) Global phylogeography of the log-gerhead turtle (Caretta caretta) as indicated by mito-chondrial DNA haplotypes. Evolution 48: 1820−1828
Bowen BW, Bass AL, Chow SM, Bostrom M and others(2004) Natal homing in juvenile loggerhead turtles(Caretta caretta). Mol Ecol 13: 3797−3808
Bowen BW, Bass AL, Soares L, Toonen RJ (2005) Conserva-
tion implications of complex population structure: Les-sons from the loggerhead turtle (Caretta caretta). MolEcol 14: 2389−2402
Browne DC, Horrocks JA, Abreu-Grobois FA (2010) Popula-tion subdivision in hawksbill turtles nesting on Barbados,West Indies, determined from mitochondrial DNA con-trol region sequences. Conserv Genet 11: 1541−1546
Carreras C, Pont S, Maffucci F, Pascual M and others (2006)Genetic structuring of immature loggerhead sea turtles(Caretta caretta) in the Mediterranean sea reflects watercirculation patterns. Mar Biol 149: 1269−1279
Carreras C, Pascual M, Cardona L, Aguilar A and others(2007) The genetic structure of the loggerhead sea turtle(Caretta caretta) in the Mediterranean as revealed bynuclear and mitochondrial DNA and its conservationimplications. Conserv Genet 8: 761−775
Chaieb O, El Ouaer A, Maffucci F, Bradai M, Bentivegna F,Said K, Chatti N (2010) Genetic survey of loggerheadturtle Caretta caretta nesting population in Tunisia. MarBiodiversity Rec 3: e20
Clement M, Posada D, Crandall K (2000) TCS: A computerprogram to estimate gene genealogies. Mol Ecol 9: 1657−1659
Dethmers KEM, Broderick D, Moritz C, FitzSimmons NNand others (2006) The genetic structure of Australasiangreen turtles (Chelonia mydas): exploring the geograph-ical scale of genetic exchange. Mol Ecol 15: 3931−3946
Dodd CK Jr (1988) Synopsis of the biological data on the log-gerhead sea turtle Caretta caretta (Linnaeus 1758). USFish and Wildlife Service Biological Report 88 (14)
Dow W, Eckert K, Palmer M, Kramer P (2007) An atlas of seaturtle nesting habitat for the wider Caribbean region.Wider Caribbean Sea Turtle Network and The NatureConservancy. WIDECAST Technical Report 6
Drosopoulou E, Tsiamis G, Mavropoulou M, Vittas S andothers (2012) The complete mitochondrial genome of theloggerhead turtle Caretta caretta (Testudines: Cheloni-idae): genome description and phylogenic considera-tions. Mitochondrial DNA 23: 1−12
Dutton PH (1996) Methods for collection and preservation ofsamples for sea turtle genetics studies. In: Bowen BW,Witzell WN (eds) Proc Int Symp Sea Turtle ConservationGenetics. NOAA Technical Memorandum NMFS-SEFSC-396, p17−24
Encalada SE, Bjorndal KA, Bolten AB, Zurita JC and others(1998) Population structure of loggerhead turtle (Carettacaretta) nesting colonies in the Atlantic and Mediterran-ean as inferred from mitochondrial DNA control regionsequences. Mar Biol 130: 567−575
Excoffier L, Lischer HEL (2010) Arlequin suite ver 3.5: Anew series of programs to perform population geneticsanalyses under Linux and Windows. Mol Ecol Resour 10: 564−567
Fratantoni PS, Lee TN, Podesta GP, Muller-Karger FE (1998)The influence of Loop Current perturbations on the for-mation and evolution of the Tortugas eddies in the south-ern Straits of Florida. J Geophys Res 103: 24759−24779
Garofalo L, Mingozzi T, Micó A, Novelletto A (2009) Logger-head turtle (Caretta caretta) matrilines in the Mediterran-ean: Further evidence of genetic diversity and connectiv-ity. Mar Biol 156: 2085−2095
Hamann M, Godfrey MH, Seminoff JA, Arthur K and others(2010) Global research priorities for sea turtles: inform-ing management and conservation in the 21st century.Endang Species Res 11: 245−269
159
Mar Ecol Prog Ser 469: 145–160, 2012
Hine AC, Steinmetz JC (1984) Cay Sal Bank, Bahamas — apartially drowned carbonate platform. Mar Geol 59: 135−164
Laurent L, Casale P, Bradai MN, Godley BJ and others(1998) Molecular resolution of marine turtle stock com-position in fishery bycatch: A case study in the Mediter-ranean. Mol Ecol 7: 1529−1542
LeRoux R, Dutton P, Abreu-Grobois A, Lagueux C and others (in press) Re-examination of population structureand phylogeography of hawksbill turtles in the WiderCaribbean using longer mtDNA sequences. J Hered doi:10.1093/jhered/ess055
Lohmann KJ, Luschi P, Hays GC (2008a) Goal navigationand island-finding in sea turtles. J Exp Mar Biol Ecol 356: 83−95
Lohmann KJ, Putman NF, Lohmann CMF (2008b) Geomag-netic imprinting: A unifying hypothesis for long-distancenatal homing in salmon and sea turtles. Proc Natl AcadSci USA 105: 19096−19101
López-Jurado LF, Sanz P, Abella E (2007) Loggerhead nest-ing on Boa Vista, República de Cabo Verde. SWOTReport 2
Mantel N (1967) The detection of disease clustering and ageneralized regression approach. Cancer Res 27: 209−220
Marco A, Abella E, Liria-Loza A, Martins S and others (2012)Abundance and exploitation of loggerhead turtles nest-ing in Boa Vista Island, Cape Verde, the only substantialrookery in the eastern Atlantic. Anim Conserv 15: 351−360
Monzón-Argüello C, Rico C, Naro-Maciel E, Varo-Cruz N,López P, Marco A, López-Jurado LF (2010) Populationstructure and conservation implications for the logger-head sea turtle of the Cape Verde islands. ConservGenet 11: 1871−1884
NMFS, USFWS (National Marine Fisheries Service, US Fishand Wildlife Service) (2008) Recovery plan for the North-west Atlantic population of the loggerhead sea turtle(Caretta caretta), 2nd revision. National Marine FisheriesService, Silver Spring, MD
Pearce AF (2001) Contrasting population structure of theloggerhead turtle (Caretta caretta) using mitochondrialand nuclear DNA markers. MSc thesis, University ofFlorida, Gainesville, FL
Putman NF, Bane JM, Lohmann KJ (2010) Sea turtle nestingdistributions and oceanographic constraints on hatchlingmigration. Proc Biol Sci 277: 3631−3637
Raymond M, Rousset F (1995) An exact test for populationdifferentiation. Evolution 49: 1280−1283
Reis E, Soares LS, Vargas S, Santos F and others (2010)Genetic composition, population structure and phylo-geography of the loggerhead sea turtle: Colonizationhypothesis for the Brazilian rookeries. Conserv Genet 11: 1467−1477
Revelles M, Carreras C, Cardona L, Marco A and others(2007) Evidence for an asymmetrical size exchange ofloggerhead sea turtles between the Mediterranean andthe Atlantic through the straits of Gibraltar. J Exp MarBiol Ecol 349: 261−271
Rice WR (1989) Analyzing tables of statistical tests. Evolu-tion 43: 223−225
Ruiz A, Vega M, Riverón F, Abreu F and others (2008)Estructura genética de poblaciones de Caretta caretta enel gran Caribe y la costa Atlántica de Estados Unidos,con enfasis en colonias de anidacion del suroesteCubano. Rev Invest Mar 29: 151−160
Saied A, Maffucci F, Hochscheid S, Dryag S and others(2012) Loggerhead turtles nesting in Libya: an importantmanagement unit for the Mediterranean stock. Mar EcolProg Ser 450: 207−218
Shamblin BM, Faircloth BC, Dodd M, Wood-Jones A andothers (2007) Tetranucleotide microsatellites from theloggerhead sea turtle (Caretta caretta). Mol Ecol Notes 7: 784−787
Shamblin BM, Faircloth BC, Dodd MG, Bagley DA and oth-ers (2009) Tetranucleotide markers from the loggerheadsea turtle (Caretta caretta) and their cross-amplificationin other marine turtle species. Conserv Genet 10: 577−580
Shamblin BM, Dodd MG, Bagley DA, Ehrhart LM and oth-ers (2011a) Genetic structure of the southeastern UnitedStates loggerhead turtle nesting aggregation: Evidenceof additional structure within the peninsular Floridarecovery unit. Mar Biol 158: 571−587
Shamblin BM, Dodd MG, Williams KL, Frick MG, Bell R,Nairn CJ (2011b) Loggerhead turtle eggshells as asource of maternal nuclear genomic DNA for populationgenetic studies. Mol Ecol Resour 11: 110−115
Shamblin BM, Bjorndal KA, Bolten AB, Hillis-Starr ZM andothers (2012) Mitogenomic sequences better resolvestock structure of southern Greater Caribbean green tur-tle rookeries. Mol Ecol 21: 2330−2340
Tikochinski Y, Bendelac R, Barash A, Daya A, Levy Y, Friedmann A (2012) Mitochondrial DNA STR analysis asa tool for studying the green sea turtle (Chelonia mydas)populations: the Mediterranean Sea case study. MarGenomics 6: 17−24
Velez-Zuazo X, Ramos WD, Van Dam RP, Diez CE, Abreu-Grobois A, McMillan WO (2008) Dispersal, recruitmentand migratory behaviour in a hawksbill sea turtle aggre-gation. Mol Ecol 17: 839−853
Witherington B, Kubilis P, Brost B, Meylan A (2009) Decreas-ing annual nest counts in a globally important logger-head sea turtle population. Ecol Appl 19: 30−54
Yilmaz C, Turkozan O, Bardakci F (2011) Genetic structureof loggerhead turtle (Caretta caretta) populations inTurkey. Biochem Syst Ecol 39: 266
160
Editorial responsibility: Philippe Borsa,Montpellier, France
Submitted: February 27, 2012; Accepted: August 1, 2012Proofs received from author(s): November 13, 2012