The calcium-activated potassium channels of turtle hair cells
24
The Calcium-activated Potassium Channels of Turtle Hair Cells J. J. ART,* Y.-C. Wu, and R. FETFIPLACE From the Department of Neurophysiology, University of Wisconsin Medical School, Madison, Wisconsin 53706; and *Department of Pharmacological and Physiological Sciences, University of Chicago, Chicago, Illinois 60637 A B S T R AC T A major factor determining the electrical resonant frequency of turtle cochlear hMr cells is the time course of the Ca-activated K current (Art, J. J., and R. Fettiplace. 1987.Journal of Physiology. 385:207-242). We have examined the notion that this time course is dictated by the K channel kinetics by recording single Ca-activated K channels in inside-out patches from isolated cells. A hair cell's resonant frequency was estimated from its known correlation with the dimensions of the hair bundle. All cells possess BK channels with a similar unit conductance of ~ 320 pS but with different mean open times of 0.25-12 ms. The time constant of relaxation of the average single-channel current at -50 mV in 4 p.M Ca varied between cells from 0.4 to 13 ms and was correlated with the hair bundle height. The magnitude and voltage dependence of the time constant agree with the expected behavior of the macroscopic K(Ca) current, whose speed may thus be limited by the channel kinetics. All BK channels had similar sensitivities to Ca which produced half-maximal activation for a concentration of ~2 p.M at +50 mV and 12 p.M at -50 mV. We estimate from the voltage dependence of the whole-cell K(Ca) current that the BK channels may be fully activated at -35 mV by a rise in intracellular Ca to 50 p.M. BK channels were occasionally observed to switch between slow and fast gating modes which raises the possibility that the range of kinetics of BK channels observed in different hair cells reflects a common channel protein whose kinetics are regulated by an unidentified intracellular factor. Membrane patches also contained 30 pS SK channels which were ~5 times more Ca-sensitive than BK channels at -50 inV. The SK channels may underlie the inhibitory synaptic potential produced in hair cells by efferent stimulation. INTRODUCTION Hair cells of the turtle's basilar papilla are tuned to specific frequencies in the acoustic stimulus from ~ 20 Hz to more than 500 Hz by an electrical resonance (Crawford and Fettiplace, 1981) which, over much of this frequency range, arises from the combined action of a voltage-dependent Ca'current and a Ca-activated K current. A major determinant of the resonant frequency is the speed of the Ca-activated K current which relaxes with a time constant varying from ~ 15 ms at 50 Address correspondence to R. Fettiplace, Department of Neurophysiology, 273 Medical Sciences Building, 1300 University Avenue, Madison, WI 53706. j . GEN. PHYSIOL. 9 The Rockefeller University Press 9 0022-1295/95/01/0049/24 $2.00 Volume 105 January 1995 49-72 49 on February 16, 2014 jgp.rupress.org Downloaded from Published January 1, 1995
Transcript of The calcium-activated potassium channels of turtle hair cells

The Calcium-activated Potassium
Channels of Turtle Hair Cells
J. J. ART,* Y.-C. Wu, and R. FETFIPLACE
From the Department of Neurophysiology, University of Wisconsin Medical School, Madison, Wisconsin 53706; and *Department of Pharmacological and Physiological Sciences, University of Chicago, Chicago, Illinois 60637
A B S T R A C T A major factor determining the electrical resonant frequency of turtle cochlear hMr cells is the time course of the Ca-activated K current (Art, J. J., and R. Fettiplace. 1987.Journal of Physiology. 385:207-242). We have examined the notion that this time course is dictated by the K channel kinetics by recording single Ca-activated K channels in inside-out patches from isolated cells. A hair cell's resonant frequency was estimated from its known correlation with the dimensions of the hair bundle. All cells possess BK channels with a similar unit conductance of ~ 320 pS but with different mean open times of 0.25-12 ms. The time constant of relaxation of the average single-channel current at - 5 0 mV in 4 p.M Ca varied between cells from 0.4 to 13 ms and was correlated with the hair bundle height. The magnitude and voltage dependence of the time constant agree with the expected behavior of the macroscopic K(Ca) current, whose speed may thus be limited by the channel kinetics. All BK channels had similar sensitivities to Ca which produced half-maximal activation for a concentration of ~ 2 p.M at +50 mV and 12 p.M at - 5 0 mV. We estimate from the voltage dependence of the whole-cell K(Ca) current that the BK channels may be fully activated at - 3 5 mV by a rise in intracellular Ca to 50 p.M. BK channels were occasionally observed to switch between slow and fast gating modes which raises the possibility that the range of kinetics of BK channels observed in different hair cells reflects a common channel protein whose kinetics are regulated by an unidentified intracellular factor. Membrane patches also contained 30 pS SK channels which were ~ 5 times more Ca-sensitive than BK channels at - 5 0 inV. The SK channels may underl ie the inhibitory synaptic potential produced in hair cells by efferent stimulation.
I N T R O D U C T I O N
Hai r cells o f the turt le 's basi lar papi l la are tuned to specific f requencies in the acoustic st imulus f rom ~ 20 Hz to more than 500 Hz by an electrical resonance (Crawford and Fet t iplace, 1981) which, over much of this f requency range , arises from the combined act ion of a v o l t a g e - d e p e n d e n t C a ' c u r r e n t and a Ca-act ivated K current . A majo r d e t e r m i n a n t of the r e sonan t f requency is the speed of the Ca-act ivated K cur ren t which re laxes with a t ime constant varying from ~ 15 ms at 50
Address correspondence to R. Fettiplace, Department of Neurophysiology, 273 Medical Sciences Building, 1300 University Avenue, Madison, WI 53706.
j. GEN. PHYSIOL. �9 The Rockefeller University Press �9 0022-1295/95/01/0049/24 $2.00 Volume 105 January 1995 49-72
49
on February 16, 2014
jgp.rupress.orgD
ownloaded from
Published January 1, 1995

5 0 THE JOURNAL OF GENERAL PHYSIOLOGY �9 VOLUME 1 0 5 �9 1 9 9 5
Hz to 0.7 ms at 350 Hz (Art and Fettiplace, 1987). Resonant frequencies < 50 Hz are achieved by a slow voltage-dependent K current with an activation time constant up to 150 ms (Art, Fettiplace, and Wu, 1993). For the higher-frequency cells, the time course of the Ca-activated K current could be limited by delays due to the diffusion and buffering of intracellular Ca (Ashmore and Attwell, 1985; Hudspeth and Lewis, 1988b; Oberholtzer, Buettiger, Summers, and Matschinsky, 1988), or by the K(Ca) channel kinetics. We have previously argued, based mainly on measurements of the spectral composition of K(Ca) current noise, that the channel kinetics are indeed the limiting factor (Art and Fettiplace, 1987) and we have now examined this hypothesis by assaying single Ca-activated K channels in inside-out patches from cells tuned to different frequencies.
The turtle's basilar papilla is homologous to the cochleas of higher vertebrates and its hair cells are tonotopically organized with their optimal frequencies increasing with distance from the apical end of the organ (Crawford and Fettiplace, 1980). In addition to the kinetics of the K(Ca) current, other properties of the hair cells, including the size of both the Ca and K(Ca) currents (Art et al., 1993) as well as the dimensions of the hair bundle (Hackney, Fettiplace, and Furness, 1993) display a systematic variation with hair cell resonant frequency and hence cochlear location. A broader question concerns the mechanism by which this panoply of cellular attributes is regulated, and some clue might be derived by elucidating the control of any single property. Both Drosophila (Atkinson, Robertson, and Ganetzky, 1991; Adelman, Shen, Kavenaugh, Warren, Wu, Lagrutta, Bond, and North, 1992) and mouse (Butler, Tsunoda, McCobb, Wei, and Salkoff, 1993) Ca-activated K channels have been recently cloned and exhibit the potential for expression of multiple spliced variants which could form the basis of a variation in channel kinetics in turtle hair cells. An alternate possibility is that the hair cell K(Ca) channel kinetics are regulated by some intracellular process such as phosphorylation (Reinhart, Chung, Martin, Brautigan, and Levitan, 1991).
M A T E R I A L S A N D M E T H O D S
Preparation and Recording Techniques
Hair cells were isolated from the basilar papilla of the red-eared turtle (Trachemys scripta elegans, carapace length 10-12 cm) using a standard procedure (Art and Fettiplace, 1987). Briefly, after decapitation of the turtle, the basilar papilla was dissected out, the tectorial membrane removed and the preparation incubated in a saline containing 0.1 mM Ca supplemented with 0.5 mg/ml papain, 2.5 mM L-cysteine and 0.1 mg/ml serum albumin. Hair cells were collected from identified regions of the papilla and plated onto a glass coverslip which was transferred to the stage of an Zeiss IM-35 inverted microscope fitted with Nomarski optics. Recordings were made only from cells with an intact hair bundle, the dimensions of which were measured before recording with an eyepiece graticule. At the magnification of 1,280 used, the bundle measure- ments were reproducible to ~ 0.2 ~m. The maximum height of the hair bundle has been found to vary inversely with the cell's resonant frequency (Fo) from 9.5 ~m (Fo = 20 Hz) to 5.0 ~m (Fo > 350 Hz) (Art and Fettiplace, 1987; Hackney, Fettiplace, and Furness, 1993). The resonant frequency was inferred from the hair bundle height since it was rarely possible to make both whole-cell and detached patch recordings on the same hair cell.
on February 16, 2014
jgp.rupress.orgD
ownloaded from
Published January 1, 1995
ART ET AL Ca2+-activated K + Channels of Hair Cells 51
Single-channel currents were recorded with an Axopatch 200A amplifier (Axon Instruments, Foster City, CA) from cell-attached or inside-out patches of the basolateral membrane of a hair cell. Borosilicate recording pipettes of resistance 15-25 Mf~ and tip diam ~0.5 Ixm were normally filled with a solution containing (in millimolar): KC1, 135; K2EGTA, 5; K HEPES, 5, pH 7.4. After seal formation the pipette was detached from the cell and the resulting membrane vesicle was broken by contact with a Sylgard ball. This procedure to produce an inside-out patch was performed in an extracellular solution identical to that in the pipette so that the cytoplasmic surface of the membrane was never exposed to high Ca. For an inside-out patch to contain few channels, the patch area needed to be very small, and experiments where a significant membrane omega was drawn into the pipette were rejected. The length of the omega usually ranged between ~ 1 and 5 ~m from the electrode tip. In some experiments, the patch area was determined from the change in capacitance when the electrode was inserted into the Sylgard ball (Sakmann and Neher, 1983), assuming a specific membrane capacitance of 10 fF/v,m 2. All membrane currents were stored on a Sony PC-108M instrumentation recorder at a band width of 0-20 kHz. Experiments were performed at 22-24~
Solutions
Inside-out patches were exposed to solutions of different composition by means of a six- barreled glass "pan pipe" (Vitro Dynamics, Rockaway, NJ). Each barrel was of square cross-section pulled to an internal diameter of ~ 50 I~m and perfused from a peristaltic pump, a given barrel being selected by means of a remotely controlled miniature solenoid valve (Lee Products, Westbrook, CT). For most of the experiments the ionic composition of the perfusate was (in millimolar): KC1, 130; MgC12, 0.5; Mg ATP, 1; K HEPES, 5, pH 7.4, with a variable Ca, buffered with 2 mM of the K salt of dibromoBAPTA (Molecular Probes, Inc., Eugene, OR) to give free Ca concentrations of 0.5-50 ~M. The proportion of buffer and total Ca to achieve a given free Ca concentration was calculated based on a K~a of 2 I~M (Bers, Patton, and Nuccitelli, 1993), and all solutions were then calibrated using a MI-100 Ca electrode (Microelectrodes, Inc., Londonderry, NH). DibromoBAPTA was the preferred Ca buffer because its K~a lies within the range of Ca concentrations that activate the channel, and also it is relatively insensitive to Mg and pH. In a few early experiments, HEDTA or BAPTA was used as the Ca buffer. The use of BAPTA was discontinued because of the finding that the measured free Ca was often considerably higher than that calculated, probably due to water impurity in the buffer (Harrison and Bers, 1987). For later experiments, the cytoplasmic solutions were supplemented with 0.1 I~M okadaic acid (Calbiochem Corp., La Jolla, CA), an inhibitor of PP-1 and PP-2A protein phosphatases. Tyrosine phosphatase catalytic subunit was obtained from Calbiochem and A-kinase catalytic subunit from Promega Corp. (Madison, WI).
To measure simultaneously both single-Ca and K(Ca)-channel currents in cell-attached mode, the recording electrode was filled with a solution similar to that described by Pietrobon, Prod'horn, and Hess (1989) that contained (in millimolar): NaC1, 135; KC1, 2; Na HEDTA, 5; Na TAPS, 5, pH 8.7. To prolong the Ca channel openings, 5 I~M (--) BAY K8644 (Calbiochem Corp.) or FPL-64176 (Zheng, Rampe, and Triggle, 1991), a sample of which was kindly supplied by Fisons (Loughborough, UK), was added to the pipette solution. In some experiments, charybdotoxin (Peninsula Laboratories, Belmont, CA) was applied to the extra- cellular face of an inside-out patch by pressurized perfusion of the patch pipette (Adams and List Associates, Ltd., Westbury, NY) via a quartz capillary whose tip was sited within 0.6 mm of the end of the pipette.
Single-Channel Analysis
Continuous stretches of single-channel data were low-pass filtered at between 5 and 8 kHz (8-pole Bessel) and digitized at 40 kHz. Opening and closing transitions were detected using
on February 16, 2014
jgp.rupress.orgD
ownloaded from
Published January 1, 1995

52 THE JOURNAL OF GENERAL PHYSIOLOGY �9 VOLUME 105 �9 1995
half the single-channel amplitude as the threshold criterion. Open and closed time distribu- tions derived from these idealized records were fitted with sums of exponential probability density functions by a maximum likelihood method using a random optimization algorithm (Solis and Wets, 1981). The fit was corrected for the dead time of the recording system (Colquhoun and Sigworth, 1983), estimated as 0.3/fo where fc is the - 3 dB frequency of the filter. Only those events longer than the dead time are shown. Record durations in a given condition were typically long enough to contain between 5,000 and 50,000 events. To display the range of open and closed durations, the distributions are presented as log-log plots (McManus and Magleby, 1991) or using the transformation of Sigworth and Sine (1987). The number of exponentials needed to fit a distribution was determined from the likelihood ratio test, an additional component being added only if the • test on the likelihood ratios reached a 0.05 level (P• < 0.05 for rejecting the extra component). The stationarity of the data was assessed from the stability of the open probability and mean open time in a given standard condition, usually 4 I~M Ca at +- 50 mV. Transient data were low-pass filtered at 3 kHz and digitized at 12.5 kHz. Leakage and capacitative currents were subtracted using sweeps that contained no openings, and ensemble averages were constructed typically from responses to 300 stimuli presented at 10/s. The number of channels in a patch was estimated from the maximum current for a condition in which the probability of opening was high (Horn, 1991). While patches containing only a single channel could be used for forming open- and closed-time distributions, analysis of the transient response is based on some multichannel patches.
R E S U L T S
Ca-activated K Channels in Cell-attached Patches
Fig. 1 shows cel l -a t tached pa tch record ing o f l a rge -ampl i tude K channels f rom two different hair cells, one with a long hair bund le and the o the r with a short hair bundle . T h e resonan t frequencies o f the two hair cells were es t imated from previous measu remen t s (Art and Fet t iplace, 1987; Hackney et al., 1993) as 50 and 200 Hz, respectively. Both hair cells were immersed in a high K, low Ca solut ion identical to that in the p ipe t t e (see Materials and Methods) so that patches could subsequently be de t ached from the cell in a quasi- int racel lular envi ronment . U n d e r these ionic condi t ions, the cells p robably had zero res t ing potent ia l which was s u p p o r t e d by the observat ion that the channels had reversal potent ia ls close to zero mV. Fig. 1 shows that at +50 mV, the two channels had a similar size of ~ 12-13 pA, consistent with their bo th be ing BK channels , but that f rom the shor t -bund led cell had briefer transit ions. As will be shown later, the variat ions in the kinetics of the BK channels seen in Fig. 1 were r e t a ined when the patches were de t ached and s tudied in ins ide-out mode .
To obta in patches with jus t a few BK channels , it was necessary to use e lect rodes of in ternal t ip d i am 0.5 Ixm enclosing a small m e m b r a n e omega. With such electrodes, a variable n u m b e r of channe l s /pa t ch was observed. For cells with short hai r bundles of l ength 5 .8-6 .8 ~xm, the mean n u m b e r of channe l s /pa t ch was 3.0 4- 2.1 (N = 43 patches) and for long hair bundles of length 7.7 to 8.8 txm it was 1.0fi 4- 1.26 (N = 40). In seven expe r imen t s we measu red the pa tch area (see Methods) which r anged from 2 to 13 Ixm 2, with a mean 4- SD of 9 4- 4 ~m 2. Using this pa tch area, we es t imated that cells with short bundles con ta ined a mean densi ty of 0.33 channels / i~m 2 whereas cells with long bundles had a mean of 0.12 channels /~ ,m 2. These
on February 16, 2014
jgp.rupress.orgD
ownloaded from
Published January 1, 1995

ART ET AL Cae+-activated K + Channels of Hair Cells 53
differences are consistent with previous results indicating that cells tuned to high frequencies possess a greater dens i ty o f K(Ca) channels than cells tuned to low- frequencies (Art et al., 1993).
It was our general impression that the channel density was higher in the basal half of the cell at the nuclear level than in the apical half towards the hair bundle. The measurements on low-frequency cells were mostly from patches in the basal half, but for the high-frequency cells, many of the patches were taken from the apical half in order to obtain some with single channels. This experimental variation would have led to an underest imate in the difference between low- and high-frequency cells. I f some BK channels were concentrated into a small number of"hotspots , " correspond-
Hair bundle = 8.3 ~tm ( low resonant frequency)
I 10 ms
Hair bundle = 6.5 ~tm (high resonant frequency)
C
O
FIGURE 1. Single Ca-activated K channels recorded in cell-attached configuration from different hair cells. Note that the channels were more prolonged from the cell with the long hair bundle (8.3 la.m, top) than from the celt with the short hair bundle (6.5 ~m, bottom). Estimated resonant frequencies were 50 Hz (top) and 200 Hz (bottom). Holding potentials +50 mV, both cells immersed in 135 mM KCI, 5 mM K2EGTA solution. C and O indicate closed and open levels.
ing to the synaptic release sites (Roberts, Jacobs, and Hudpseth , 1990), it is conceivable that we would rarely have recorded from them. Of the 113 patches studied, one from a cell with a 5 .5-r hair bundle had an unusually high number of BK channels (26); this was not included in the mean-channel densities cited above.
Ca and Ca-activated K Channels Occur in the Same Patch
For the BK channels that we routinely recorded to contribute to the whole-cell current and to experience rapid and substantial changes in intraceUular Ca dur ing depolarization, they would need to have neighboring voltage-sensitive Ca channels. We tested for this possibility by searching for both types of channel in the same patch
on February 16, 2014
jgp.rupress.orgD
ownloaded from
Published January 1, 1995

5 4 T H E J O U R N A L OF GENERAL PHYSIOLOGY �9 V O L U M E 105 �9 1 9 9 5
in cell-attached recordings. To improve the resolution for Ca channels, we measured the Na current through these channels with a pipette solution containing 145 Na, a low divalent cation concentration, and a Ca channel activator, either Bay K8644 or the FPL-64176 (Zheng, Rampe, and Triggle, 1991). In five patches both inward (Na) and outward (K) currents were observed (e.g., Fig. 2), and in another two patches neither type of channel was present. The inward current was activated between - 6 0 and - 2 0 mV, it had an extrapolated reversal potential near 0 mV and it was not observed in more than 20 additional cell-attached experiments in the absence of the Ca-channel activator, all of which endorse its identification as a Ca channel. The slope conductance was 86 pS, and because our previous experiments (Art et al., 1993) have shown that for Ca concentrations < 0.1 p.M, the current through the Ca channels is increased about sixfold, this yields a channel conductance in 2.8 mM Ca of 14 pS, comparable to previous values reported for the L-type channel (Hess, Lansmen, and Tsien, 1986). The outward current was strongly activated only at membrane potentials positive to - 3 0 mV. By its size and prevalence, it is most likely the Ca-activated K channel which has a lower slope conductance in asymmetric K than the usual 300 pS (Yellen, 1984). It should be noted that at - 5 0 mV, the deduced amplitudes of the Ca and BK single-channel currents are ~ 0.8 and 2 pA, respectively. The main conclusion from this type of experiment is that the Ca- activated K channels whose properties will be described later have neighboring Ca channels and are likely to contribute functionally to the electrical resonance.
Stationary Behavior of Ca-activated K Channels in Inside-Out Patches
Fig. 3 shows representative segments of records illustrating the effects of Ca concentration on channel activity. At the membrane potential of +50 mV, the channel was fully activated in 5 I~M Ca and its amplitude was ~ 12 pA in the symmetrical 150 mM K solutions. The current-voltage relationship for such channels displayed slight inward rectification, variable from channel to channel (Fig. 6 B), so the slope conductance was characterized at - 5 0 mV, giving 323 pS for this example and a range from 290 to 340 pS in other experiments. The large unitary conductance and the fact that in four experiments the channel was completely blocked by pipette perfusion with 100 nM charybdotoxin establish it as a BK channel (Miller, Moczyd- lowski, Latorre, and Phillips, 1985; Latorre, Oberhauser, Labarca, and Alvarez, 1989; McManus, 1991).
The effects of Ca on the probability of opening at + 50 mV is plotted in Fig. 4 A for channels from three cells, two with short hair bundles and one with a long bundle. The smooth curve was calculated from the Hill equation:
eo = emax Can/[(K0.5) n + Can] (1)
with a half-saturating Ca concentration, K0.~, of 2.9 I~M and a Hill coefficient, n, of 3.5. In contrast to Eq. 1, a relation without binding cooperativity with the form Po = Pmax[Ca/(Ko.5 + Ca)] n gave a poor fit to the data and in particular did not predict the sharp corner near saturation. Fits of Eq. 1 to individual data sets for 17 channels gave values for K0.5 ranging from 1.1 to 3.9 I~M and values for n from 1.9 to 3.7; the maximum probability of opening, Pmax was between 0.65 and 0.95. There was no evidence that the channel's Ca sensitivity varied systematically with the height of the
on February 16, 2014
jgp.rupress.orgD
ownloaded from
Published January 1, 1995

-110 m V
B
-40
-50
10-2
5 -
-5-
A < & E
o -
tm .fi ~q
-10 - I I I I
-100 -50 0 50 Membrane potential (mV)
FIGURE 2. (A) Records of both voltage-sensitive Ca chan- nels (negative-going inward currents) and Ca-activated K channels (outward currents) in a single cell-attached patch. The patch was held at - 1 1 0 mV and stepped to the poten- tial indicated beside each trace. Note the increase in the in- ward-current channel in the bottom trace on repolarizing to - l l 0 mV. Cell bathed in 135 mM KCI, 5 mM K2EGTA solu- tion. The pipette solution con- tain in millimolar: NaC1, 135; KCI, 2; NaHEDTA, 5; NaTAPS, 5, pH 8.7 with 5 ixM FPL-64176 to prolong the Ca channel openings. (B) Current- voltage relations for the two types of channel in the experi- ment shown in A. The smooth curves were drawn by eye, that through the K channel points being extrapolated to an as- sumed K reversal potential of - 1 0 7 inV.
on February 16, 2014
jgp.rupress.orgD
ownloaded from
Published January 1, 1995

56 THE JOURNAL OF GENERAL PHYSIOLOGY �9 VOLUME 105 �9 1995
A 0.7 gM Ca 2+
. . . . L . . . . . . . . 1 _ _ L L ~ I [ . . . . . . . . . . . l . . . . . . . . l . . . . I . . . . . . . . • . . . . . .
2.4 gM Ca 2+
•••lll••--- . . . . . . . 771222. ' - - L - L - 2 . - 5 22 2r ."W|I~'! V
10 pA / I 4.8 gM Ca 2+
100 ms
9.6 gM Ca 2+
B 0.7 ~tM Ca2+
~ ~ - -%L t ~:', -.. ,..-"~ .,:. ,~,.~" :,~ ,',:L'= "-..=;.z.= =:: ~
2.4 gM Ca 2+
10pAI I 9.6 gM Ca 2+
5ms
FIGURE 3. Representative stretches of recordings from a single BK Ca-activated K channel in an inside-out patch shown on a slow (A) and fast (B) time scale, in the presence of different cytoplasmic Ca concentrations. Holding potential, +50 inV.
b u n d l e (Fig. 4 B): m e a n values (+_SD) for K0.5 were 2.2 -+ 0.8 IxM (N = 17, + 5 0 mY) a n d 11.8 + 5.6 IxM (N = 13, - 5 0 mV). T h e value o f K0.5 at 0 mV, i n t e r p o l a t e d f rom m e a s u r e m e n t s at o t h e r m e m b r a n e po ten t ia l s (see Fig. 10 A) was 4.9 + 2.1 ixM.
T h e Ca sensitivities a n d Hill coefficient for the hai r cell 's BK c h a n n e l are very s imilar to those of the wel l -charac ter ized Channels in rat skeletal muscle (Barret t , Magleby, a n d Pallotta, 1982; M c M a n u s a n d Magleby, 1991). T h e h igh Hill coefficient
on February 16, 2014
jgp.rupress.orgD
ownloaded from
Published January 1, 1995

ART ET AL Ca2+-activated K § Channels of Hair Cells 57
is indicative of multiple Ca binding sites, a conclusion reinforced by the numbers of exponential components needed to fit the closed- and open-time histograms. The closed time histograms generally required four to six components and the open-time histograms two to three components. Examples of these histograms are illustrated in Fig. 5 for two channels originating from hair cells with long and short hair bundles, which were assumed to be tuned to low and high frequencies, respectively. The open- time histograms tended to be dominated by one of the components which comprised 50-75% of the total area; this major component was ~ 0.3 ms in the cell with a short bundle and 2.8 ms in the cell with the long hair bundle.
A B 1
0.I
z ta
0.01
0.001 . . . . . . i . . . . . . . . . . . . . .
1 1'0 C a l c i u m c o n c e n t r a t i o n (paM)
10
xl
�9 + 5 0 m V O - 5 0 m V
o
o o o K.so = 11.8 :t:5.6 u M - - o o
8 o o
o
: - . a
e
Kso = 2.2• ~M
I I i I 5 6 7 8 9
B u n d l e h e i g h t (p.m)
FIGURE 4. (A) Probability of opening plotted against Ca concentration for three BK channels from cells of different hair bundle length, holding potential +50 mV. Hair bundle lengths: (squares) 5.8 I~m (same cell as Fig. 3); (circles) 6.7 I~m; (diamonds) 7.7 I~m. Smooth curve is the Hill equation (Eq. 1) with Pm~x = 0.81, K0.5 = 2.9 ~M and n = 3.5. (B) Values of K0.5, the half-saturating Ca concentration plotted against hair bundle height of cell of origin; (filled symbols) +50 mV; (open symbols) -50 mV. The plot includes measurements from both single-channel and multichannel patches.
The major component of the open time at +50 mV is plotted for seven channels against Ca concentration in Fig. 6 A. For each channel, the open time increased between two- and fourfold with Ca concentration, but the limiting value varied considerably in different cells from 0.25-12 ms. Such variation was not obviously correlated with the absolute Ca sensitivity of the channel or with the channel conductance at - 5 0 mV. However, channels with longer open times had more linear current-voltage relations (Fig. 6 B). The shorter open times tended to occur in channels originating from cells with shorter hair bundles, though there are probably insufficient results to establish a strict correlation. They do suggest however, that the
on February 16, 2014
jgp.rupress.orgD
ownloaded from
Published January 1, 1995

58 T H E JO U RN A L OF GENERAL PHYSIOLOGY - VOLUME 1 0 5 �9 1 9 9 5
kinetic p roper t i e s of the BK channel a re d ic ta ted by a separa te par t of the channel p ro te in f rom the regions involved in e i ther po re format ion or Ca sensing. This observat ion is reminiscent o f the al ternatively spliced variants descr ibed for the D-slo Ca-act ivated K channel which possess similar uni tary conductance and Ca sensitivity but substantial ly different mean open t imes (Adelman et al., 1992).
A
-'~ 4 ' :3.
3 '
g O,
. ] ,
"~ -3 '
.4
0.01
B
.7 p.M Ca, +50 mV
0.1 1 10 100 1000
Closed interval (ms)
4
3
2
I "
O,
-1
-2
-3 0.01 0.1 1 10
Open interval (ms)
100
4 ,
:3. 3'
~ -1 '
"~ -2 '
~ -3 '
0.01
FIGURE 5.
~o 2.0 I.tM Ca, +50 mV
~ � 9 eo ~
0,1 1 10 100 1000
Closed intervfl (ms)
Histograms of the closed and open
4 '
3
2
1 '
O '
_| .
-2 '
-3 0.01 0.1 1 10
Open interval (ms)
100
times for BK channels from two cells of different hair bundle lengths at +50 mV. (A) Hair bundle, 7.7 ~m; Ca, 2.7 p,M; probability of opening, 0.39; number of events, t6,686. The smooth lines are the maximum likelihood fits with the sums of six exponential components to the closed intervals and three exponential components to the open intervals. The time constants of the closed and open distribution are (in milliseconds): closed, 0.05, 0.17, 0.77, 8.4, 171, 1067; open .065, 1.3, 2.8, of which 2.8 ms supplied 60% of the area. (B) Hair bundle, 6.7 ~m; Ca, 2.0 ~M; probability of opening, 0.23; number of events, 31,175. The smooth lines are the maximum likelihood fits with the sums of five exponential components to the closed intervals and three exponential components to the open intervals. The time constants of the closed and open distribution are (in milliseconds): (closed) .08, .25, 1.0, 4.7, 81 ; (open) .08, .24, .44, of which the 0.24 ms component supplied 71% of the area.
Responses to Voltage Steps
The kinetics o f the whole-cell cu r ren t have previously been inferred (Art and Fet t iplace, 1987) from the re laxa t ion at the end of a depo la r iz ing vol tage step r e tu rn ing to a ho ld ing potent ia l o f ~ - 5 0 mV. This potent ia l co r responds to the
on February 16, 2014
jgp.rupress.orgD
ownloaded from
Published January 1, 1995

ART ET AL Cae+-activated K + Channels of Hair Cells 59
average resting potential of turtle hair cells. To compare directly the whole-cell results with single-channel data, ensemble averages of the channel responses to voltage steps were constructed. This allowed the inclusion of some multichannel patches. Examples o f the results are illustrated in Fig. 7, A and B, for patches from short- and long-bundled cells. Each patch was subjected to a 100-mV voltage step from - 5 0 mV in Ca concentrat ions from 0.5 to 35 or 50 IzM which produced a full range o f probabilities o f opening. The most notable conclusion is that the channel with the longer open time had a much slower relaxation on repolarizing to - 5 0 mV. The principal time constants o f the current relaxations for the two cells were ~ 1 ms
A B
10
!
0.1
330 pS, 8.1 gtm
310 pS, 6.8gm / / mV
~ 340pS, 7.7pan
/ -100 -50
/ ~ 96 pS, 7.4 I~m -10 - 23 pS, 6.7 ~xm ~ ! ! i
w / - ~ ~ . . . . . o . . . - ~ ~0ps ,5 . s~ _ _
av'~ / 312 PS' 6'0 I'tm
' ' ' ' ' " 1 ' ' ' . . . . . I , , , , , , -40
1 10 Calcium concentral~on (p.M)
,01 ? o VO0 I
FIGURE 6. (A) The major component of the open time is plotted against Ca concentration for channels from seven different patches, holding potential +50 mV. The single-channel conductance and the hair bundle height from the cell of origin are given alongside each set of points. (B) Current-voltage curves for two BK channels from hair cells with bundle heights 6.5 p.m (circles) and 8.1 ~m (squares). Same cells as those illustrated in Fig. 7. Each point is the average of the currents at different Ca concentrations. The line through the points corresponds to a unit conductance of 340 pS. Note the inward rectification in one of the channels which represents the most extreme example observed.
(Fig. 7 A) and 8 ms (Fig. 7 B) in 4 p,M Ca. In both cases, the tail current relaxed more rapidly at Ca concentrat ions < 4 p,M.
Collected measurements of the relaxation time constant o f the average current are plot ted against bundle height in Fig. 8 A. Each of the measurements was made in 4 p.M Ca since this concentrat ion may be comparable to the Ca concentrat ion at the resting potential of intact hair cells (see Discussion). For each patch, the decay in channel activity on repolarization to - 5 0 mV was fitted with one or two exponential components and the major componen t was plotted. For cleaner records obtained with muhichannel patches, two components differing by a factor between 5 and 10
on February 16, 2014
jgp.rupress.orgD
ownloaded from
Published January 1, 1995

60
A 50
THE JOURNAL OF GENERAL PHYSIOLOGY �9 VOLUME 105 �9 1995
-50 mV
pA lOf o ~ ~
-10 I 1
35 pM Ca 18 4 2 1
0.5
~ , ~ - ~ 18 ~ ~ ' ~ 35
0 20 40 ms
B 50 _ _ I ] -5o mV
FIGURE 7. Responses to volt- age steps of BK channels from two hair cells of bundle heights (A) 6.5 o,m and (B) 8.1 Ixm. For each par t of the figure, the top traces show the voltage step from - 5 0 to +50 mV and three records of the channel behavior in 4 tam Ca. Bottom traces, super imposed ensemble-aver- age currents in Ca concentra- tions from 0.5 to 35 or 50 ~.M. The recording in B conta ined two channels.
30
-30
~A 50 ~M Ca 10
2 1
0.5 ,
~ . . . , ~ . _ . . . , ~ - . - ~ 10
~ 50 I I 0 20 40 ms
w e r e usua l ly r e q u i r e d , t h e f a s t e r c o m p o n e n t in m o s t cases b e i n g t h e d o m i n a n t one .
Fig. 8 A shows t i m e c o n s t a n t s , % r a n g i n g f r o m 0 .4 to 13 ms , w h i c h w e r e c o r r e l a t e d
w i th b u n d l e h e i g h t , h. T h e s m o o t h c u r v e d e s c r i b e s t h e p a r a b o l i c r e l a t i o n s h i p :
T = 0 .5 h 2 / ( 1 0 . 2 - h) 2 (2)
on February 16, 2014
jgp.rupress.orgD
ownloaded from
Published January 1, 1995

ART ET AL Ca2+-activated K + Channels of Hair Cells 61
An equa t ion of this form is expec t ed if (a) the t ime constant o f deact ivat ion o f the whole-cell K cur ren t varies inversely with the square o f the resonan t frequency, Fo, i.e., "r = k/F2o (Art and Fet t iplace, 1987) where k is a cons tant and (b) the r e sonan t f requency is inversely p ropo r t i ona l to bund le he igh t (Hackney, Fet t iplace, and Furness, 1993), a re la t ionship h = a/(b + Fo) where a and b are constants, be ing used to der ive Eq. 2. T h e range of t ime constants for the s ingle-channel measurement s co r r e sponds well to the r ange o f t ime constants der ived for the whole-cell K current , ~ 15-0.7 ms for r e sonan t f requencies between 50 and 350 Hz. T h e conclusion f rom these results is that for hair cells in this f requency range that use BK channels to
A B 14
12
10
i - o ,/o
I I I I I 5 6 7 8 9
Bundle height (~m)
1 4 -
1 2 -
1 0 -
8 -
6
4
2
0 - I I I I I I I
0 2 4 6 8 10 12 14 Time constant (ms)
FIGURE 8. (A) Collected measurements from 21 patches of the time constant of relaxation of the ensemble-average BK channel current ( - 5 0 mV, 4 i~M Ca) plotted against the bundle height of the hair cell. Smooth curve fitted using Eq. 2 in text. (B) The maximum open times measured at +50 mV in a Ca concentration of 10 I~M or more is plotted for eight channels against the time constant of relaxation of the average current at - 5 0 mV in 4 ~m Ca. The line is a least-squares fit with regression coefficient 0.89, slope 0.9 and intercept on the y axis of 0.067.
genera te the i r r e sonan t proper t ies , the kinetics of the macroscopic cur ren t may be var ied by regu la t ion of the kinetics o f the channels themselves.
The tail cu r ren t kinetics were measured at a po ten t ia l of - 5 0 mV, where the BK channels normal ly con t r ibu te to resonance , but most o f the s ingle-channel o p e n t imes were ob ta ined at +50 mV (Fig. 6A) . While it need not be the case that s ingle-channel kinetic differences seen at +50 mV for high and low-frequency cells ex t end to - 5 0 mV, in those channels where measu remen t s were available at bo th m e m b r a n e potent ia ls , the m a x i m u m open t imes were similar. This suggests that the re laxa t ion of the ensemble average cur ren t is d e t e r m i n e d mainly by the channel open
on February 16, 2014
jgp.rupress.orgD
ownloaded from
Published January 1, 1995

62 T H E J O U R N A L O F G E N E R A L P H Y S I O L O G Y �9 V O L U M E 1 0 5 �9 1995
time. Fig. 8 B gives a plot for eight channels of the open time measured at +50 mV against the relaxation time constant of the average current at - 5 0 mV. This shows a reasonable correlation between the two variables, the fitted line having a slope of 0.86 and a regression coefficient of 0.9.
The relaxation time constant of the whole-cell K(Ca) current changes e-fold for an ~ 25 mV change in the holding potential (Art and Fettiplace, 1987). To confirm the limiting role of the channel properties, we verified that the time constant of the single-channel relaxation possessed a similar voltage dependence. Examples of the single-channel tail currents in 4 IzM Ca for repolarization to three different membrane potentials are shown in Fig. 9A; each has been fitted with a single
A B
.-m
0.5--
0-
1, -70 mV
I I I I I
0 20 40 ms I i I |
-80 - 60 ~]d) - 20 0 Holding potential (mV)
FIGURE 9. Voltage dependence of the relaxation of the ensemble average tail current in 4 IzM Ca. (A) Averages of the BK single-channel relaxation at -30, -50, and -70 mV after a voltage step to +50 inV. For display, the averages have been scaled to the same maximum value and the steady levels have been subtracted. Smooth curves are single-exponential fits with time constants of 21 ms ( -30 mV); 9.5 ms ( -50 mV) and 4.6 ms ( -70 mV). (B) Results of measurements in A along with those from two other cells, time constant plotted against holding potential. Lines through points correspond to an e-fold change in time constant in 28, 29 and 29 mV. Bundle heights of hair cells: 8.1 Cm (circles), 7.4 I~m (squares), 6.5 Izm (triangles).
exponential decay. The inferred time constants for this and two other patches are plotted in Fig. 9 B. All three sets o f data had similar slopes, corresponding to an e-fold increase in time constant for a mean reduction in holding potential o f 28.7 - 0.5 mV.
The Range of Ca Concentrations Occurring Physiologically
The aim of this section is to use the single-channel properties to derive an estimate of the range of Ca concentrations that are needed to activate the K(Ca) channel under physiological conditions. The voltage dependence of the probability of opening, P, of a single BK channel obtained from analysis of stationary records is displayed in Fig. 10A. The measurements in different Ca concentrations have been fitted with the
on February 16, 2014
jgp.rupress.orgD
ownloaded from
Published January 1, 1995

ART ET AL Ca2+-activated K + Channels of Hair Cells 63
Bohzmann equation:
P = Pmax/[1 + exp {(V o - V)/V,}], (3)
where Vo is the voltage for half-maximal activation, Pmax is the maximum probability of open ing (~0 .77) and V, is the slope factor, which increased from 10 mV in the lowest Ca concentrat ion to 21 mV in the highest. Mean values for V~ in six patches were 15 - 4 mV in 4 p,M Ca and 18 - 3 mV in 10 v,M Ca, values similar to those repor ted for BK channels in other preparat ions (Latorre et al., 1989). The half- saturating Ca concentrat ion depended exponentially on membrane potential, de- creasing e-fold for a depolarization of ~ 38 mV (equivalent to a 10-fold change in 86
A B
0.8
0.6
,.z, 8 0.4
0.2-
0 .0-
~�9 M
I I I I I -150 -100 -50 0 50 100
M e m b r a n e potential (mV)
&
2000-
1500-
1000-
500q
0 -
-6O
_•• F ~ 99 H z
I I I I -40 -30 -20
Membrane potential (mY)
FIGURE 10. (A) Probability of opening of BK channel at different membrane potentials in a range of Ca concentrations. Data obtained from stationary measurements, same cell as Fig. 7 A. Smooth curves calculated from Boltzmann equation (Eq. 3) with values of Ca, Pma~, Vo, V~: 2 p.M, 0.7, 32 mV, 10 mV; 4 p.M, 0.77, - 3 mV, 18 mV; 18 ~M, 0.76, - 48 mV, 18 mV; 35 ~M, 0.78, -77 mV, 21 mV. (B) Plots of the whole-cell K tail current at a holding potential of - 50 mV in three hair cells with different resonant frequencies. The smooth curves have been calculated from Eq. 8 of text with the following values of IK(max), A, n, and resonant frequency: (triangles) 1,820 pA, 0.26, 4.2, 222 Hz; (circles) 1,230 pA, 0.15, 3.1, 173 Hz; (squares) 500 pA, 0.10, 2.3, 99 Hz. The apparent trend in the constant A was not obvious in other results.
mV). It is clear f rom these results that at membrane potentials of - 4 0 to - 3 0 mV, where the whole-cell K(Ca) current normally saturates (Fig. 10B), a maximal probability o f opening is achieved for a Ca concentrat ion of 35 vLM. Similar estimates for o ther channels gave a concentrat ion o f no more than 50 p,M.
An alternative estimate o f the Ca concentrat ion can be derived from fitting the voltage dependence of the whole-cell K(Ca) current using the approach described by Martin and Fuchs (1992). Fig. 10 B shows activation curves for the whole-cell current, obtained from tail current measurements at - 5 0 mV (see Art and Fettiplace, 1987; Art et al., 1993). These currents are steeply voltage dependen t and increase e-fold in 2-3 mV. To describe the activation curves, we shall neglect the intrinsic voltage-
on February 16, 2014
jgp.rupress.orgD
ownloaded from
Published January 1, 1995

6 4 THE JOURNAL OF GENERAL PHYSIOLOGY �9 VOLUME 1 0 5 �9 1 9 9 5
sensitivity of the channel and assume that the voltage dependence arises solely from the voltage dependence of the Ca channel amplified by the cooperative binding of Ca to the BK channel. The activation of the Ca current, Ica, is described by a Boltzmann equation:
/Ca = Ica(max)/[ 1 + exp {(Vl - V)/V2}] (4)
where values for the half-activation, Vl, and slope factor, V2, of - 2 7 and 7 mV, respectively, have been taken from previous analysis of the hair cell's Ca current (Art and Fettiplace, 1987; Art et al., 1993). Eq. 4 has been corrected for the changes in driving force by assuming an ohmic single-channel conductance and a reversal potential of +50 mV:
/ C a = O- /Ca (max) / [ l + exp {(V~ - V)/V2} ] ( 5 )
where e~ = (0.905 -0 .018V) . Eq. 5 generates the U-shaped steady state current- voltage relationship with a peak at ~ - 15 mV as observed experimentally. The average Ca concentration [Ca] at the mouth of the K channel is related to/Ca by
[Ca] = 13 Icaf(r, t) (6)
where (1 - 13) is the fraction of Ca instantaneously bound by buffer andf( r , t) reflects attenuation due to diffusion and is a function of distance, r, from the Ca channel and time, t, after it opens; f is assumed to be independent of the Ca concentration, as occurs in simple diffusion models (Smith and Augustine, 1988; Roberts et al., 1990). The Ca concentration can thus be described by
[Ca] = o~[Ca]max/[1 + exp { (V 1 - V)/V2} ] (7)
[Ca]max is the maximum steady state Ca concentration at the K(Ca) channel. Eq. 7 can be substituted into the Hill equation (Eq. 1) and the parameters for the Ca current, V1 and V2, inserted giving the voltage dependence of the K(Ca) current, Ix, as
I K = IK(max)/[1 + A%cn(I + exp {--(27 + V)/7}) n] (8)
where n is the Hill coefficient and A = KoJ[Ca]max; K0.5 is the half-saturating Ca concentration which in the voltage range over which the channel is activated will vary by no more than 50%, and is therefore, assumed to be constant. Eq. 8 gave excellent fits to the whole-cell current (Fig. 10 B) with values of n from 1.8 to 4.2 similar to those obtained from the single-channel results. The mean value of A derived from fitting 10 cells was 0.19 -+ 0.06. Assuming that the K(Ca) channels in the whole cell have a Ca sensitivity similar to those assayed in detached patches, their K0.5 will be no greater than 11.8 IxM (the average value at - 5 0 mV in Fig. 4 B), and therefore [Ca]max is 62 I~M. [Ca]max can be substituted in Eq. 7 to give the voltage-dependence of the Ca concentration at the BK channel; the deduced concentration at a membrane potential of - 3 0 mV is 35 ~M, which is comparable to the value inferred from the measurements in Fig. 10 A.
Rundown in Ca Sensitivity and Open Time
In a number of patches, there were reductions in the Ca sensitivity of the channel and also a shortening of the mean open time throughout the course of a recording. These
on February 16, 2014
jgp.rupress.orgD
ownloaded from
Published January 1, 1995

ART ET AL Ca2+-activated K § Channels of Hair Cells 65
changes were not necessarily correlated and one could occur without the other. In view of previous claims that the BK channel may be regulated by phosphorylation (Reinhart, Chung, Martin, Brautigan, and Levitan, 1991; Bielefeldt and Jackson, 1994), most experiments were performed in the presence of 1 mM MgATP and, in later experiments, 0.1 ~M okadaic acid, an inhibitor of PP-1 and PP-2A protein phosphatases. The latter maneuver may have slightly augmented the Ca sensitivity, so that the K0.5 for Ca activation at +50 mV was 2.6 +- 0.9 ~M (N = 7) without okadaic acid and 1.9 -+ 0.7 ~M (N = 10) with okadaic acid. In three experiments, 0.3 ~M of the catalytic subunit of protein kinase A, added in the presence of okadaic acid, increased the Ca sensitivity by a factor of 1.7 -+ 0.4. This enhancement, which took place over a period of ~ 10 min, is similar to that reported by Reinhart et al. (1991), and may point to a role for A-kinase in modulating the channel. However, such changes in sensitivity were accomplished without a change in channel kinetics and, moreover, a shortening of the mean open time was still observed in the presence of okadaic acid. The channel kinetics were not reproducibly accelerated by prolonged exposure to 300 ~M Ca (six experiments) or perfusion with 0.14 ~M of the catalytic subunit of tyrosine phosphatase (three experiments). Taken together, these results suggest that the channel kinetics are not regulated by phosphorylation at a site susceptible to the common protein phosphatases.
The speeding up of the channel kinetics was usually, but not always, irreversible. In one such channel, the time constant of relaxation of the tail current at - 5 0 mV was 4.1 _+ 0.2 ms during the initial 10 min of a recording and then declined over the next 15 min to 1.3 ms. It might be argued that this stems from a pathological change in the patch: for example oxidation of membrane lipids or loss of cholesterol (Bolotina, Omelyanenko, Heyes, Ryan, and Bregestovski, 1989). However, occasionally, the change was abrupt and reversible, as shown in Fig. 11. In this case the mean open time decreased ~ threefold for a period of a few minutes and then reverted to its original condition, and interestingly, the channel in its faster mode had a lower conductance at +50 mV (cf Fig. 6 B). This phenomenon was observed in other patches and is reminiscent of the multiple gating modes reported for the ~1 Na channel (Zhou, Potts, Trimmer, Agnew, and Sigworth, 1991). In those experiments the equilibrium between slow and fast modes of a single Na channel protein expressed in Xenopus oocytes was influenced by an intracellular modulator, and also there was a tendency during an extended recording for the channel to migrate into the fast mode. The similar behavior of the BK channel raises the possibility that the range of kinetics of BK channels observed in different hair cells reflects a common channel protein whose kinetics are regulated by an unidentified intracellular factor. It should be noted that, in view of the occasional run down, to characterize a channel's kinetics (Fig. 8), the initial data from a given patch was used, and then only if the channel was stable during the first 10 min of recording (see Materials and Methods).
Other K Channels
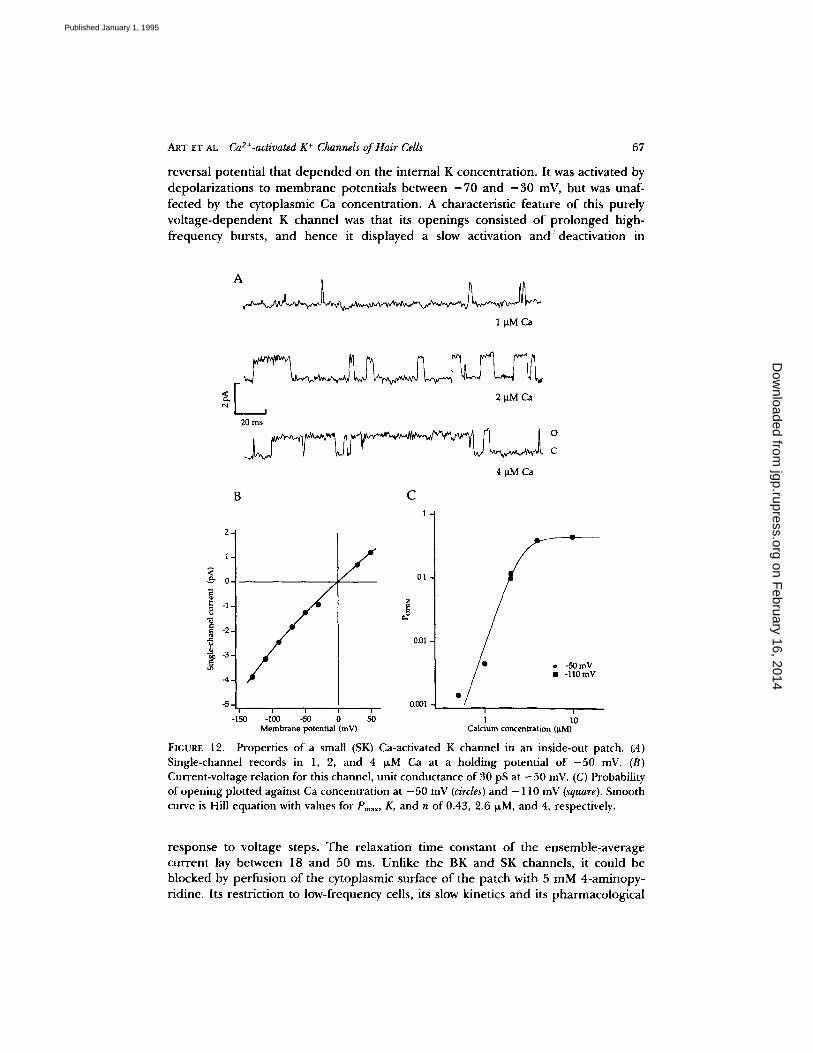
In many patches taken from hair cells with a range of bundle sizes, a calcium- dependent leak was evident during the early part of a recording. This was caused by a small channel, the properties of which were characterized in three single-channel recordings (Fig. 12). The channel had a mean conductance at - 5 0 mV of 30 -+ 2 pS
on February 16, 2014
jgp.rupress.orgD
ownloaded from
Published January 1, 1995

6 6 T H E JOURNAL OF GENERAL PHYSIOLOGY �9 VOLUME 105 �9 1 9 9 5
and a reversal potent ia l at 0 mY in symmetr ical 150 mM K. The reversal po ten t ia l was shifted positive on subst i tut ion of Na for K in the solution ba th ing the cytoplasmic face o f the patch, suggest ing that it was a K channel . This K channel was r emarkab le in be ing very steeply act ivated by int racel lular Ca. T h e probabi l i ty of o p e n i n g at - 5 0 mV was ha l f -maximal at a Ca concent ra t ion of 2.4 -+ 0.4 p,M, and the Hill coefficient was 4 o r more . It was therefore about five t imes more sensitive to Ca than the BK channel at - 5 0 mV but, in contras t to the BK channel , it had little vol tage dependence . T h e Ca concentra t ion, besides ga t ing the probabi l i ty of open- ing, also strongly inf luenced the open t ime: for the e xa mple i l lustrated, the mean
A ~ O
C
I t O m s
B
0.3 ~ 0.25
0.2 "~ 0.15 .8
i 0.1 0.05
v
0.3 1 ~ 0.25 "~ 0.2 ~0.15
t 0.05 0
0.01 0.1 1 10 100 1000 0.01 0.1 1 10 100
Closed interval (ms) O~n interval (ms)
FIGURE 11. (A) Records showing a spontaneous change in the kinetics of a single BK channel, holding potential +50 mV, 0.5 p.M Ca. (B) Closed and open time histograms, displayed using the transformation of Sigworth and Sine (1987). (Horizontal lines) Channel in fast mode. (Circles and diamonds) Channel in slow mode before and after. The smooth curves are fits based on five closed-time and three open-time components. The major component of the open time was reduced from 1.4 to 0.4 ms.
open t ime increased from 0.6 ms in 0.5 IxM Ca to 9 ms in 10 ~M Ca. An unusual feature o f this SK channel was its comple te d i sappea rance after br ie f (20 s) exposures of the pa tch to 10-30 I~M Ca. It was therefore only observed if the pa tch was isolated in a low Ca solut ion (see Materials and Methods) and fur thermore , its con tamina t ing effects could be e l imina ted f rom a record ing by ba th ing in 30 IxM Ca. We had no evidence that b r ie f exposu re to high Ca a l te red the p rope r t i e s of the BK channel .
While SK channel were commonly r eco rded f rom all classes of hair cell, a th i rd type of K channel was ob ta ined only in patches from cells with hair bundles longer than 7 Ixm. This channel had a mean conductance at - 5 0 mV of 45 -+ 5 pS (N = 5) and a
on February 16, 2014
jgp.rupress.orgD
ownloaded from
Published January 1, 1995
ART ET AL Cae+-activated K + Channels of Hair Cells 67
reversal potential that depended on the internal K concentration. It was activated by depolarizations to membrane potentials between - 7 0 and - 3 0 mV, but was unaf- fected by the cytoplasmic Ca concentration. A characteristic feature o f this purely vol tage-dependent K channel was that its openings consisted o f pro longed high- frequency bursts, and hence it displayed a slow activation a n d ' deactivation in
1 ~M Ca
<~[~ I 2wMCa
20 ms
4 ~M Ca
B C
1
I .
0-
~ -2-
- 3 -
-4-
-5-
-150
0.1
z
0.01
0.001
0
�9 -50 mV �9 -110 mV
I I I I i
-100 -,50 0 50 1 1 0 Membrane potential (mV) Calcium concen~'ation (~M)
FIGURE 12. Properties of a small (SK) Ca-activated K channel in an inside-out patch. (A) Single-channel records in 1, 2, and 4 p.M Ca at a holding potential of - 50 mV. (B) Current-voltage relation for this channel, unit conductance of 30 pS at - 5 0 mV. (C) Probability of opening plotted against Ca concentration at - 50 mV (circles) and - 110 mV (square). Smooth curve is Hill equation with values for Pmax, K, and n of 0.43, 2.6 ~M, and 4, respectively.
response to voltage steps. The relaxation time constant o f the ensemble-average current lay between 18 and 50 ms. Unlike the BK and SK channels, it could be blocked by perfusion o f the cytoplasmic surface o f the patch with 5 mM 4-aminopy- ridine. Its restriction to low-frequency cells, its slow kinetics and its pharmacological
on February 16, 2014
jgp.rupress.orgD
ownloaded from
Published January 1, 1995

6 8 THE JOURNAL OF GENERAL PHYSIOLOGY " VOLUME 1 0 5 �9 1 9 9 5
profile all suggest that it is the voltage-dependent K channel which tunes hair cells to the very lowest resonant frequencies.
D I S C U S S I O N
Properties and Role of BK Channels in Turtle Hair Cells
The large, 300-pS, Ca-activated K (BK) channels recorded in turtle hair cells have properties remarkably similar to those occurring in rat skeletal muscle (Barrett, Magleby and Pallotta, 1982; Moczydlowski and Latorre, 1983; McManus and Magleby, 1991): they are half-activated by a Ca concentration of ~ 5 p~M at 0 mV, they have a steep voltage sensitivity (e-fold in 15 mV) and the Ca dependence has a Hill coefficient up to 3.7, indicating at least four Ca-binding sites; furthermore the channels are blocked by TEA with a Ki of 0.27 mM (Art J. J, and M. B. Goodman, unpublished results). In spiking cells, the BK channels contribute to repolarization of the action potential (Adams, Constanti, Brown, and Clark, 1982) but in hair cells, which are nonspiking, they form the basis of an electrical resonance which endows the cells with frequency selectivity (Lewis and Hudspeth, 1983; Art and Fettiplace, 1987; Hudspeth and Lewis, 1988b; Fuchs, Nagai, and Evans 1988; Fuchs and Evans, 1988). The main conclusion from the present results is that the speed of the macroscopic current, which is the major determinant of the resonant frequency (Art and Fettiplace, 1987), may be largely dictated by the channel kinetics. Both the magnitude (Fig. 8 A) and the voltage dependence (Fig. 9) of the time constant of the single-channel relaxation at - 5 0 mV are in quantitative agreement with previous measurements on the macroscopic K(Ca) current.
Since the relaxation time constant for the single channels depends on Ca concentration (Fig. 7), the similar range for the time constants of the single channels in 4 o~M Ca and of the whole-cell K(Ca) current may be fortuitous. The previous characterization of the whole-cell K(Ca) conductance (Art and Fettiplace, 1987) indicated that at the resting potential of - 5 0 mV, where the whole-cell kinetics were measured, ~ 20% of the maximal conductance was activated (mean = 0.18 +- 0.08, N = 10; same cells as used for analysis shown in Fig. 10 B). This value may be used to determine the Ca concentration that produces an equivalent probability of opening of single BK channels at - 5 0 inV. From Hill plots at - 5 0 mV for seven channels, this Ca concentration was calculated as 6.1 +- 1.6 p~M, a value sufficiently close to 4 ~M to permit the comparison between the data in Fig. 8 A and earlier measurements of the kinetics of the whole-cell K(Ca) current.
The fast kinetics of the voltage-sensitive Ca current in turtle hair cells (Art and Fettiplace, 1987) can be used to calculate that at the end of a depolarizing voltage-clamp step returning to - 5 0 mV, the Ca current will deactivate with a time constant of ~ 0.2 ms. Although the time course of the consequent drop in intracellu- lar Ca is unknown, it could in theory diffuse away from a nearby K(Ca) channel with a time constant not much greater than that of the Ca current. Under such conditions, the deactivation of the whole-cell current may be largely determined by the closing rate of the BK channels. This line of argument finds some support from the similarity in the ranges of kinetics for the whole-cell current and single-channel relaxation.
on February 16, 2014
jgp.rupress.orgD
ownloaded from
Published January 1, 1995

ART ET AL Ca2+-activated K + Channels of Hair Cells 69
Comparison with Other Hair Cell Preparations
Ca-activated K channels have been recorded in a number of other hair cell preparations. In the frog saccule, BK channels obtained in inside-out patches possessed multiple open and closed times indicative of complex gating, but had a somewhat lower Ca and voltage dependence (Hudspeth and Lewis, 1988a) than those reported here. It was subsequently estimated from whole-cell perfusion with Ca buffers that in order to produce the requisite activation of the whole-cell K(Ca) conductance, the steady state Ca concentration at the K channel needed to be 100 ~M at - 5 3 mV and I mM at - 4 2 mV (Roberts et al., 1990; Roberts, 1993). The whole-cell K(Ca) conductance in frog hair cells, as in turtle, was maximally activated at ~ - 3 0 mV. Employing an essentially similar approach, but comparing the activation of the whole-cell K(Ca) conductance with that of single BK channels, we estimate the Ca concentration to be ~ 6 ~M at - 5 0 mV and 50 p~M at - 3 5 inV. The Ca sensitivity of the BK channels in turtle hair cells is thus ~ 15- to 20-fold greater than for those in the frog. It might be argued that the Ca sensitivity of channels in our detached patches is much higher than under whole-cell conditions, but this seems unlikely in view of the previous observation that the whole-cell K(Ca) current in turtle cells can still be activated in 10 ~M external Ca (Art et al., 1993).
An extensive study of Ca-activated K channels has also been made in goldfish saccular hair cells (Sugihara, 1994). BK channels is these cells possess multiple open and closed times and a range of both unitary conductances (130-320 pS) and Ca sensitivities. The Ca concentration required to produce a half-maximal probability of opening at 0 mV lay between 50 ~M and 1 mM. Thus, these BK channels may be more than an order of magnitude less sensitive than those reported here for the turtle. The results on goldfish and frog saccular hair cells taken together suggests a real difference in the BK channels between saccular and cochlear hair cells.
Both BK and SK channels with properties similar to those described for the turtle have also been reported in guinea pig outer hair cells (Ashmore and Meech, 1986). The BK channel of conductance 233 pS was activated by micromolar Ca concentra- tions at +53 mV, and the SK channel had a smaller unit conductance (44 pS) and a higher Ca-sensitivity than the BK channel at negative membrane potentials. There is no evidence at the present time that the BK channels are employed to electrically tune mammalian hair cells. The SK channel, however, may in all hair cells play a common role of mediating the efferent cholinergic inhibitory post synaptic potentials (Art, Fettiplace and Fuchs, 1984). In cochlear hair cells of guinea pig (Housely and Ashmore, 1991), chick (Shigemoto and Ohmori, 1990; Fuchs and Murrow, 1992) and turtle (Goodman and Art, 1992), acetylcholine is thought to act by causing an elevation in intracellular Ca so activating a K channel; in chick, this K channel is distinct from the BK channel in having a smaller conductance and different ionic selectivity.
The SK channels may also contribute to the whole-cell current in turtle hair cells tuned to lower frequencies since it was found that the current in such cells showed a diphasic dependence on extracellular Ca: most of the current, attributed to the BK channels, disappeared in 1 ~M external Ca, but the remainder was only abolished in 0.1 ~M Ca (Art et al., 1993). This residual component was originally explained on the
on February 16, 2014
jgp.rupress.orgD
ownloaded from
Published January 1, 1995

70 THE JOURNAL OF GENERAL PHYSIOLOGY �9 VOLUME 105 �9 1995
bas is o f a h i g h e r Ca-sens i t iv i ty o f slow B K c h a n n e l s , b u t in l i gh t o f t h e p r e s e n t r e su l t s
it is m o r e l ikely d u e to a s e p a r a t e SK c h a n n e l .
We thank Larry Trussell for his comments on the manuscript.
This work was supported by National Institutes of Health grants DC01362 to R. Fettiplace and DC00454 to J. J. Art.
Original version received 15June 1994 and accepted version received 25 August 1994.
R E F E R E N C E S
Adams, P. R., A. Constanti, D. A. Brown, and R. B. Clark. 1982. Intracellular Ca 2+ activates a fast
voltage-sensitive K § current in vertebrate sympathetic neurones. Nature. 296:746-749.
Adelman, J. P., K-Z. Shen, M. P. Kavenaugh, R. A. Warren, Y.-N. Wu, A. Lagrutta, C. T. Bond, and
R. A. North. 1992. Calcium-activated potassium channels expressed from cloned complementary
DNAs. Neuron. 9:209-216.
Art, J. J., and R. Fettiplace. 1987. Variation of membrane properties in hair cells isolated from the
turtle cochlea. Journal of Physiology. 385:207-242.
Art, J. J., R. Fettiplace, and P. A. Fuchs. 1984. Synaptic hyperpolarization and inhibition of turtle
cochlear hair cells. Journal of Physiology. 356:525-550.
Art, J. J., R. Fettiplace, and Y.-C. Wu. 1993. The effects of low calcium on the voltage-dependent
conductances involved in tuning of turtle hair cells. Journal of Physiology. 470:109-125.
Ashmore, J. F., and D. Attwell. 1985. Models for electrical tuning in hair cells. Proceedings of the Royal Society of London B Biological Sciences. 226:325-344.
Ashmore, J. F., and R. W. Meech. 1986. Ionic basis of membrane potential in outer hair cells of
guinea pig cochlea. Nature. 322:368-371. Atkinson, N. S., G. A. Robertson, and B. Ganetzky. 1991. A component of calcium-activated-
potassium channels encoded by the Drosophila sit locus. Science. 253:551-555.
Barrett, J. N., K. L. Magleby, and B. S. Pallotta. 1982. Properties of single calcium-activated
potassium channels in cultured rat muscle. Journal of Physiology. 331:211-230.
Bers, D. M., C. W. Patton, and R. Nuccitelli. 1994. A practical guide to the preparation of calcium
buffers. Methods in Cell Biology. 40:3-29. Bielefeldt, K., and M. B. Jackson. 1994. Phosphorylation and dephosphorylation modulate a
CaZ+-activated K + channel in rat peptidergic nerve terminals. Journal of Physiology. 475:241-254. Bolotina, V., V. Omelyanenko, B. Heyes, U. Ryan, and P. Bregestovski. 1989. Variation of membrane
cholesterol alters the kinetics of Ca2+-activated K § channels and membrane fluidity in vascular
smooth muscle cells. Pfliigers Archiv. 415:262-268. Butler, A., S. Tsunoda, D. P. McCobb, A. Wei, and L. Salkoff. 1993. mSlo, a complex mouse gene
encoding maxi calcium-activated potassium channels. Science. 261:221-224.
Colquhoun, D., and F. J. Sigworth. 1983. Fitting and statistical analysis of single-channel records. In Single-Channel Recording. B. Sakmann and E. Neher, editors. Plenum Publishing Corp., NY.
191-263. Crawford, A. C., and R. Fettiplace. 1980. The frequency selectivity of auditory nerve fibres and hair
cells in the cochlea of the turtle.Journal of Physiology. 306:79-125. Crawford, A. C., and R. Fettiplace. 1981. An electrical tuning mechanism in turtle cochlear hair cells.
Journal of Physiology. 312:377-412. Fuchs, P. A., and M. G. Evans. 1988. Voltage oscillations and ionic conductances in hair cells isolated
from the alligator cochlea.Journal of Comparative Physiology A. 164:151-163.
on February 16, 2014
jgp.rupress.orgD
ownloaded from
Published January 1, 1995

ART ET AL Ca2+-activated K + Channels of Hair Cells 71
Fuchs, P. A., and B. W. Murrow. 1992. Cholinergic inhibition of short (outer) hair cells of the chick's
cochlea. Journal of Neuroscience. 12:800-809.
Fuchs, P. A., T. Nagai, and M. G. Evans. 1988. Electrical tuning in hair cells isolated from the chick
cochlea. Journal of Neuroscience. 8: 2460-2467.
Goodman, M. B., and J. J. Art. 1992. Acetylcholine-mediated currents in solitary turtle cochlear hair
cells. Society for Neuroscience Abstracts. 18:588.7. (Abstr.)
Hackney, C. M., R. Fettiplace, and D. N. Furness. 1993. The functional morphology of stereociliary
bundles on turtle cochlear hair cells. Hearing Research. 69:163-175.
Harrison, S. M., and D. M. Bers. 1987. The effect of temperature and ionic strength on the apparent
Ca-affinity of EGTA and the analogous Ca-chelators, BAPTA and dibromo-BAPTA. Biochimica et Biophysica Acta. 925:133-143.
Hess, P., J. B. Lansman, and R. W. Tsien. 1986. Calcium channel selectivity for divalent and
monovalent cations. Voltage and concentration dependence of single-channel currents in ventricu-
lar heart cells. Journal of General Physiology. 88:293-319.
Horn, R. 1991. Estimating the number of channels in patch recordings. Biophysical Journal. 60:433-439.
Housley, G. D., and J. F, Ashmore. 1991. Direct measurements of the action of acetylcholine on
isolated outer hair cells of the guinea pig cochlea. Proceedings of the Royal Society of London B Biological Sciences. 244:161-167.
Hudspeth, A. J., and R. S. Lewis. 1988a. Kinetic analysis of voltage- and ion-dependent conductances
in saccular hair cells of the bullfrog, Rana catesbeiana. Journal of Physiology. 400:237-274. Hudspeth, A. J., and R. S. Lewis. 1988b. A model for electrical resonance and frequency tuning in
saccular hair cells of the bull-frog, Rana catesbeiana. Journal of Physiology. 400:275-297.
Latorre, R., A. Oberhauser, P. Labarca, and O. Alvarez. 1989. Varieties of calcium-activated
potassium channels. Annual Reviews of Physiology. 51:385-399.
Lewis, R. S., and A. J. Hudspeth. 1983. Voltage and ion-dependent conductances in solitary vertebrate hair cells. Nature. 304:538-540.
Martin, A. R., and P. A. Fuchs. 1992. The dependence of calcium-activated potassium currents on
membrane potential. Proceedings of the Royal Society of London B Biological Sciences. 250:71-76.
McManus, O. B. 1991. Calcium-activated potassium channels. Journal of Bioenergetics and Biomem- branes. 23:537-560.
McManus, O. B., and K. L. Magleby. 1991. Accounting for the Ca2+-dependent kinetics of single
large-conductance Ca2+-activated K + channels in rat skeletal muscle.Journal of Physiology. 443:739-
777.
Miller, C., E. Moczydlowski, R. Latorre, and M. Phillips. 1985. Charybdotoxin, a protein inhibitor of
single Ca~+-activated K + channels from mammalian skeletal muscle. Nature. 313:316-318.
Moczydlowski, E., and R. Latorre. 1983, Gating of Ca~+-activated K + channels from rat muscle
incorporated into planar lipid bilayers.Journal of General Physiology. 82:511-542.
Oberholtzer, J. C., c. Buettiger, M. C. Summers, and F. M. Matschinsky. 1988. The 28-kDa calbindin-D is a major calcium-binding protein in the basilar papilla of the chick. Biochemistry. 85:3387-3390.
Pietrobon, D., B. Prod'horn, and P. Hess. 1989. Interactions of protons with single open L-type Ca ~+
channels, pH dependence of proton induced fluctuations with Cs +, K + and Na § as charge carriers.
Journal of General Physiology. 94:1-21. Reinhart, P. H., S. Chung, B. L. Martin, D. L. Brautigan, and I. B. Levitan. 1991. Modulation of
calcium-activated potassium channels from rat brain by protein kinase A and phosphatase 2A. Journal ofNeuroscience. 11 : 1627-1635.
Roberts, W. M. 1993. Spatial calcium buffering in saccular hair cells. Nature. 363:74-76.
on February 16, 2014
jgp.rupress.orgD
ownloaded from
Published January 1, 1995

72 THE JOURNAL OF GENERAL PHYSIOLOGY �9 VOLUME 105 �9 1995
Roberts, W. M., R. A. Jacobs, and A. J. Hudspeth. 1990. Colocalization of ion channels involved in
frequency selectivity and synaptic transmission at presynaptic active zones of hair cells. Journal of Neuroscience. 10:3664-3684.
Sakmann, B., and E. Neher. 1983. Geometric parameters of pipettes and membrane patches. In Single-Channel Recording. B. Sakmann and E. Neher, editors. Plenum Publishing Corp., NY. 37-51.
Shigemoto, T., and H. Ohmori. 1990. Muscarinic agonists and ATP increase the intracellular Ca 2+
concentration in chick cochlear hair cells.Journal of Physiology. 420:127-148.
Sigworth, F. J., and S. M. Sine. 1987. Data transformations for improved display and fitting of
single-channel dwell time histograms. Biophysical Journal. 52:1047-1054.
Smith, S. J., and G. J. Augustine. 1988. Calcium ions, active zones and synaptic transmitter release. Trends in Neuroscience. 11:458-464.
Solis, F. J., and R. J.-B. Wets. 1981. Minimization by random search techniques. Mathematics of Operational Research. 1 : 19-30.
Sugihara, I. 1994. Calcium-activated potassium channels in goldfish hair cells.Journal of Physiology. 476:373-390.
Yellen, G. 1984. Ionic permeation and blockade in Ca2+-activated K + channels of bovine chromaffin
ceils.Journal of General Physiology. 84:157-186. Zheng, W., D. Rampe, and D. J. Triggle. 1991. Pharmacological, radioligand binding, and
electrophysiological characteristics of FPL 64176, a novel non-dihydropyridine Ca 2+ channel
activator in cardiac and vascular preparations. Molecular Pharmacology. 40:734-741.
Zhou, J., J. F. Potts, J. S. Trimmer, W. S. Agnew, and F.J. Sigworth. 1991. Multiple gating modes and the effects of modulating factors on the I~1 sodium channel. Neuron. 7:775-785.
on February 16, 2014
jgp.rupress.orgD
ownloaded from
Published January 1, 1995