
Human Scalp Hair: Geometry, Biochemistry, Growth ...
140
University of Cape Town HUMAN SCALP HAIR: GEOMETRY, BIOCHEMISTRY, GROWTH PARAMETERS AND MECHANICAL CHARACTERISTICS Kwezikazi Mkentane MKNKWE002 A Thesis Presented for the Degree of Doctor of Philosophy (Trichology & Cosmetic Science) in the Department of Medicine, University of Cape Town Supervisor: Associate Professor Nonhlanhla P. Khumalo Co-supervisor: Associate Professor Lester M. Davids ***** December 2016
-
Upload
khangminh22 -
Category
Documents
-
view
0 -
download
0
Transcript of Human Scalp Hair: Geometry, Biochemistry, Growth ...

Univers
ity of
Cap
e Tow
n
HUMAN SCALP HAIR: GEOMETRY,
BIOCHEMISTRY, GROWTH PARAMETERS AND
MECHANICAL CHARACTERISTICS
Kwezikazi Mkentane
MKNKWE002
A Thesis Presented for the Degree of
Doctor of Philosophy (Trichology & Cosmetic Science) in the Department of
Medicine, University of Cape Town
Supervisor: Associate Professor Nonhlanhla P. Khumalo
Co-supervisor: Associate Professor Lester M. Davids
*****
December 2016

Univers
ity of
Cap
e Tow
n
The copyright of this thesis vests in the author. No quotation from it or information derived from it is to be published without full acknowledgement of the source. The thesis is to be used for private study or non-commercial research purposes only.
Published by the University of Cape Town (UCT) in terms of the non-exclusive license granted to UCT by the author.

3
TABLE OF CONTENTS
ACKNOWLEDGEMENTS ........................................................................................... I
ABBREVIATIONS...................................................................................................... II
SYMBOLS ................................................................................................................. II
ABSTRACT .............................................................................................................. III
LIST OF FIGURES..................................................................................................... V
LIST OF TABLES .................................................................................................... VII
CHAPTER ONE ......................................................................................................... 8
1 INTRODUCTION AND LITERATURE REVIEW ................................................... 8
1.1 HUMAN SCALP HAIR MORPHOGENESIS ............................................................................ 8
1.1.1 THE HAIR CYCLE ........................................................................................................ 13
1.2 MORPHOLOGY OF HUMAN SCALP HAIR ............................................................................ 15
1.3 HAIR CLASSIFICATION METHODS ................................................................................... 16
1.3.1 CLASSIFICATIONS BY ANTHROPOLOGISTS .................................................................... 17
1.3.2 CLASSIFICATIONS FOR THE COSMETIC INDUSTRY ......................................................... 18
1.3.2.1 The LOIS System© ................................................................................................ 18
1.3.2.2 Andre Walker Hair Classification............................................................................ 18
1.3.3 GEOMETRIC HAIR CLASSIFICATIONS ............................................................................ 19
1.3.3.1 Hrdy, Bailey& Schliebe Curve Diameter Classification ........................................... 20
1.3.3.2 De Mettrie et al. Geometric Classification .............................................................. 21
1.4 BIOCHEMICAL CHARACTERISTICS OF HUMAN HAIR SHAFT COMPONENTS ...... 22
1.4.1 THE HAIR CUTICLE ..................................................................................................... 22
1.4.2 THE HAIR CORTEX ..................................................................................................... 22
1.4.3 THE MEDULLA ............................................................................................................ 25
1.4.4 BIOCHEMICAL CHARACTERISTICS OF WHOLE HAIR FIBRES ........................................... 25
1.5 THE USE OF HUMAN SCALP HAIR IN MEDICINE ..................................................... 27
1.6 STUDY AIMS .............................................................................................................. 29

4
CHAPTER TWO....................................................................................................... 30
GEOMETRIC CLASSIFICATION OF HUMAN SCALP HAIR CURL: REDUCING
GROUPS FROM 8 TO 6 IMPROVES RELIABILITY ............................................... 30
2 INTRODUCTION ................................................................................................ 31
2.1 MATERIALS AND METHODS ..................................................................................... 34
2.1.1 PARTICIPANTS AND SAMPLE PREPARATION .................................................................. 34
2.1.2 GEOMETRIC CHARACTERIZATIN .................................................................................. 34
2.2 STATISTICS .................................................................................................................. 35
2.3 RESULTS ................................................................................................................... 35
2.4 DISCUSSION ............................................................................................................. 40
2.5 CONCLUSION ............................................................................................................ 41
CHAPTER THREE ................................................................................................... 42
DOES FOURIER TRANSFORM INFRARED ANALYSIS CORRELATE WITH
GEOMETRIC CLASSIFICATION OF HUMAN SCALP HAIR? ............................... 42
3 INTRODUCTION ................................................................................................ 43
3.1 MATERIALS AND METHODS ..................................................................................... 46
3.1.1 SAMPLE COLLECTION AND PREPARATION .................................................................... 46
3.1.2 TOTAL INTERNAL LIPID QUANTIFICATION ...................................................................... 46
3.1.2.1 Lipid extraction ...................................................................................................... 46
3.1.2.2 Sulfo-Phospho-Vanillin Assessment Assay of Total Lipids ..................................... 47
3.1.3 FOURIER TRANSFORM INFRARED MICROSCOPY OF WHOLE HAIR FIBRES ....................... 48
3.2 RESULTS AND DISCUSSION .................................................................................... 49
3.2.1 TOTAL LIPID CONTENT ............................................................................................... 49
3.2.2 FOURIER TRANSFORM INFRARED ................................................................................ 51
3.2.2.1 Biochemical Variation between Racial Groups ....................................................... 52
3.2.2.2 Biochemical Variation across Hair Curl Groups ..................................................... 54
3.2.2.3 Discriminative analysis of hair groups by ATR-FTIR .............................................. 57
3.2.2.4 Predictive models for FTIR hair classification......................................................... 62
3.3 CONCLUSIONS AND FUTURE WORK ...................................................................... 66

5
CHAPTER FOUR ..................................................................................................... 70
MECHANICAL CHARACTERISTICS, HAIR GROWTH PARAMETERS AND
ULTRASTRUCTURE OF HUMAN SCALP HAIR .................................................... 70
4 INTRODUCTION ................................................................................................ 72
4.1 MECHANICAL AND GROWTH PARAMETERS OF HUMAN SCALP HAIR .................................. 72
4.1.1 MECHANICAL PROPERTIES OF SCALP HAIR .................................................................. 72
4.1.2 HAIR GROWTH PARAMETERS (GROWTH RATE AND DENSITY) ......................................... 73
4.1.3 STRUCTURAL PROPERTIES OF SCALP HAIR CROSS-SECTIONS ...................................... 74
4.2 MATERIALS AND METHODS ..................................................................................... 74
4.2.1 PARTICIPANTS AND SAMPLES ...................................................................................... 74
4.2.2 GEOMETRIC CHARACTERIZATION ................................................................................ 75
4.2.3 MEASUREMENT OF MECHANICAL PROPERTIES OF SINGLE HAIR FIBRES......................... 75
4.2.4 HAIR GROWTH RATE AND HAIR DENSITY ASSESSMENTS .............................................. 76
4.2.4.1 Automated Hair Growth Assessment: TrichoScan® ............................................... 76
4.2.4.2 Manual Hair Growth Assessment Using SEM Micrographs .................................... 76
4.2.5 STRUCTURAL CHARACTERISTICS OF HUMAN SCALP HAIR CROSS-SECTIONS ................. 77
4.2.5.1 Transmission Electron Microscopy ........................................................................ 77
4.2.5.2 Fluorescence Light Microscopy.............................................................................. 77
4.3 STATISTICS ............................................................................................................... 78
4.4 RESULTS ................................................................................................................... 78
4.4.1 MECHANICAL PROPERTIES IF SINGLE HAIR FIBRES....................................................... 78
4.4.2 HAIR GROWTH PARAMETERS ...................................................................................... 83
4.4.2.1 Hair Growth Rate (TrichoScan®) ........................................................................... 83
4.4.2.2 Hair Growth Rate from SEM Micrographs .............................................................. 85
4.4.3 HAIR DENSITY ............................................................................................................ 89
4.4.4 ULTRASTRUCTURAL CHARACTERISTICS OF DIFFERENT HAIR CURL GROUPS .................. 89
4.4.4.1 Transmission Electron Microscopy ........................................................................ 89
4.4.4.2 Fluorescence Light Microscopy.............................................................................. 92
4.5 DISCUSSION ............................................................................................................. 94
4.6 CONCLUSIONS ........................................................................................................ 101

6
CHAPTER FIVE ..................................................................................................... 106
5 DISCUSSION .................................................................................................... 106
CONCLUSIONS ..................................................................................................... 115
FUTURE WORK .................................................................................................... 116
REFERENCES ....................................................................................................... 117
ADDENDUM 1: ...................................................................................................... 133
ADDENDUM 2: ...................................................................................................... 134

i
ACKNOWLEDGEMENTS
I would like to thank the following people and institutions for their invaluable support
throughout my doctoral degree journey; The National Research Foundation, the
University of Cape Town’s post grad funding office and the Medical Research
Council for funding my doctoral studies.
The university’s postgraduate community and academic staff for their research and
admin support.
My supervisors; Associate Professors Nonhlanhla P. Khumalo and Lester M. Davids
for their guidance and mentorship.
Dr Jeanne Rossouw for introducing me to molecular biology. May her soul rest in
peace.
Mr Mohammed Jaffer and colleagues at the university’s Electron Microscopy Unit for
all their assistance with acquiring TEM ad SEM micrographs.
Dr Helene Nieuwoudt and Professor Martin Kidd from Stellenbosch University for the
assistance with the analyses of FTIR data.
All Redox ‘Labsters’ past and present, for the camaraderie, humour and comments we
have exchanged over a good spread of eats at our journal clubs and lab meetings.
The Kidson and Prince Laboratory members for their help with techniques and
reagents.
My colleagues at The Hair and Skin Research lab, especially Miss Ntombenhle Sishi,
Drs Jennifer Van Wyk and Malebogo Ngoepe for their invaluable support with various
aspects of my project.
My family and friends for their support, patience and encouragement throughout the
most demanding 4 years of my life thus far.
My beloved, for his love and support; the past 3 years would have been all the more
challenging without your prayers, encouragement and humour. Kea leboga
Motshweneng.
My mother, for her continuous support and prayers. Enkosi Mandulini.
And lastly, to God, the creator of all life for expressing His thoughts through me. Thank
you for giving the grace for every assignment.
~ I love you God, You make me strong. You are a bedrock under my feet, the castle
on which I live...~

ii
ABBREVIATIONS
AA: Amino Acids
ATR: Attenuate total reflectance
CMC: Cell membrane complex
DA: Discriminative analysis
FFA: Free fatty acids
FLM: Fluorescence Light Microscopy
FTIR: Fourier Transform Infrared
ISD: Interscale distance
IQR: Interquartile range
Min: minutes
MPA: Mega Pascal
MSE: mean error squared
OPLS Orthogonal partial least squares
SEM: Scanning Electron Microscopy
SPVA: Sulfo-phospho-vanillin assay
TEM: Transmission Electron Microscopy
USA: United States of America
SYMBOLS
α: alpha
β: beta
C: degrees celsius
δ: delta
Ø: diameter
g: grams
ml: millilitre
μ: micro
cm-1: wavenumber

iii
ABSTRACT
Scalp hair is increasingly being used as a testing substrate for toxins and for
monitoring treatment adherence. The biochemistry of human hair is assumed to be
similar, however, a recent study reported higher lipid content in African hair. The effect
of hair curvature, if any, on drug incorporation (e.g. lipid soluble drugs) is unknown.
Racial description of hair morphology is unscientific. A geometric classification of hair
into 8 groups (I-straight to VIII-tightly curly) was recently proposed, however its
reliability has not been confirmed.
The aim of this thesis was to investigate the reliability of the geometric classification
(and to assess whether it could be improved) and to investigate relationships between
hair morphology and other hair characteristics.
Virgin hair was collected from 128 volunteers using a standardized protocol.
Geometric measurements to classify hair were carried out using published templates.
Reliability was assessed using Kappa statistics.
Characteristics assessed included mechanical properties (miniature tensile tester),
growth rate and hair density (TrichoScan® trichogram), biochemistry (Vanillin assay
for lipids and Fourier Transform Infrared adsorption for lipids and amino acids) and
imaging (Electron and Fluorescent Light Microscopy).
For geometric classification, the inter-observer agreement was poor for 8-groups
(k=0.418) but improved for 6-groups (k=0.671). The intra-observer agreement also
improved [ranges: k=0.444 to 0.648 (8-groups) and k=0.599 to 0.836 (6-groups)]. The
yield strength of all hair groups was higher than usually reported for racially grouped
samples. Curly hair groups had lower growth rates and tensile strengths. The
TrichoScan based growth rate was fastest for the straightest (0.72 ± 0.3 cm/month)
and slowest for the curliest (0.39 ± 0.2 cm/month) hair.
When the relationship between biochemistry and geometry was investigated, the
analysis of FTIR spectra suggested a correlation with biochemistry (internal lipid
content) for the extremes (i.e. straight versus curly) for both the 8 and 6-group hair
classification while the inverse was observed for absorption of both amide I and II
bands. A supervised statistical approach applied to 4 hair groups using the FTIR data
improved classification success from (36.85% and 36.0% with the 8 and 6 groups) to

iv
79% (range: 69% – 88%), which needs confirmation but would be more objective than
using race as a visual descriptor for hair testing in Medical and Forensic Science.
This thesis therefore proposes a geometric classification with fewer groups (6, based
kappa statistics of geometric measurements and 4, based on biochemistry); it is also
the first, that we are aware of, to report correlations between hair geometry,
biochemistry and physical properties on the same samples.

v
LIST OF FIGURES
Figure 1-1 Schematic diagrams of hair follicle morphogenesis24. ..................................................................... 9
Figure 1-2 Schematic diagram showing the different cell lineages that give rise to the cycling hair follicle28 . 11
Figure 1-3 The hierarchical structure of the hair shaft35. ................................................................................ 12
Figure 1-4 The different zones of growth and structural organization in the hair follicle38. ............................ 13
Figure 1-5 A schematic illustration of the stages of the hair cycle. The level and shape of the DP changes at
the various stages44 .............................................................................................................................. 14
Figure 1-6 The LOIS hair classification64.......................................................................................................... 18
Figure 1-7 The Andre Walker hair typing system65. ........................................................................................ 19
Figure 1-8 A geometric classification template based on curvature measurements by Bailey & Schliebe.
Diagram taken from Ogle & Fox (1999)72. ............................................................................................. 21
Figure 1-9 Hierarchical structure of the hair shaft showing the composition and distribution of cortical cell
types81. ................................................................................................................................................. 24
Figure 1-10 Martini Force Field model showing the arrangement of keratins with and without internal
lipids73 .................................................................................................................................................. 26
Figure 1-11 Schematic diagram showing the incorporation of ethyl glucuronide (EtG), a metabolite of
ethanol, into the hair shaft110. .............................................................................................................. 28
Figure 2-1 Curve diameter template derived by De La Mettrie et al.63 from Bailey and Schliebe70. ................ 32
Figure2-2 Geometric templates used for the 8-group hair classification69. ..................................................... 33
Figure 2-3 Hair classification rules described by De La Mettrie et al63 and Loussouarn et al69. ....................... 33
Figure 2-4 Variations in the degree of air curvature across 8 hair curl groups (I – VIII). .................................. 36
Figure 2-5Distribution of hair curvature (8 groups) according to self-declared racial group ........................... 39
Figure 2-6Distribution of hair curvature (6 groups) according to self-declared racial group ........................... 39
Figure 3-1 Vibrations responsible for Amide I and Amide II bands. Illustration taken from Gallagher 1997145.
............................................................................................................................................................. 44
Figure 3-2 FTIR spectrum of intact human hair fibre. ..................................................................................... 45
Figure 3-3 Box and whiskers plot (median and IQR) showing the distribution of total internal lipids across 8
hair curl groups. (Group I (n = 2), II (n = 7), III (n = 5), IV (n = 3), V (n = 3), VI (n = 5), VII (n = 11) & VIII (n
= 3)). ..................................................................................................................................................... 49
Figure 3-4 Box and whiskers plot (median and interquartile range) showing the distribution of total internal
lipids in 4 racial groups. ........................................................................................................................ 50
Figure 3-5 FTIR absorbance of different racial groups .................................................................................... 52
Figure 3-6 Absorbance of C-H band across racial groups ................................................................................ 53
Figure 3-7 Absorbance of Amide I and Amide II bands across different racial groups. ................................... 53
Figure 3-8 statistically significant differences observed in the selected FTIR bands for the 8 and 6-group
classifications. Median and IQR. ........................................................................................................... 56
Figure 3-9 Amide II band absorption by different hair curl groups. Median and IQR. ..................................... 56
Figure 3-10 PCA-X scatter plot of FTIR spectra from 8 hair curl groups ........................................................... 57

vi
Figure 3-11 Pairwise Orthogonal Partial Least Squares Discriminative Analysis of hair groups I and II. .......... 58
Figure 3-12 Multiple linear regression model of the relationship between hair morphology and spectroscopy.
............................................................................................................................................................. 62
Figure 3-13 Multiple linear regression model of the relationship between hair morphology and spectroscopy
of 6 hair curl groups. ............................................................................................................................. 64
Figure 3-14 Scatter plot of canonical scores from 4 hair curl groups. ............................................................. 66
Figure 4-1 Stress and strain profiles of African , Asian and Caucasian hair159. ................................................ 73
Figure 4-2 Hair classification rules for the 8-group geometric classification69. ............................................... 75
Figure 4-3 Stress & strain curves illustrating the mechanical behaviour of 8 hair curl groups ........................ 79
Figure 4-4 Average hair thickness of geometrically classified hair groups. ..................................................... 80
Figure 4-5 The average tensile stress of geometrically classified hair groups ................................................. 83
Figure 4-6 Shaved scalp areas of volunteers for the assessments of hair growth rate and hair density. Images
were captured using a TrichoScan® Fotofinder. .................................................................................... 83
Figure 4-7 The average hair growth rate of 8 hair groups. (Mean ± SEM). Hair growth was assessed from
TrichoScan® outputs. ............................................................................................................................ 84
Figure 4-8 Average hair growth rate of 6 hair groups .Mean ± SEM ............................................................... 85
Figure 4-9 SEM images captured at 600 and 1000 fold for the assessment of ISD (a) and hair diameter (b). .. 85
Figure 4-10 Interscale distances of different hair groups ............................................................................... 86
Figure 4-11 Average ISD calculated hair growth rate of 8 hair groups (Mean ± SEM). .................................... 87
Figure 4-12 The assessment of hair density using an automatic and manual approach. ................................. 89
4-13 Toluidine blue staining of ultrathin hair sections (hair group VIII). ......................................................... 90
Figure 4-14 TEM micrographs hair group I. Orthocortical cells (O) were observed on the periphery of the hair
cross section, while paracortical (p) cells made up the bulk of the hair cortex. .................................... 90
Figure 4-15 A TEM micrograph of hair group III, showing a thicker layer of orthocortical cells. ..................... 91
Figure 4-16 A TEM micrograph of stained hair section from hair group IV. A thicker layer of orthocortical
cells is observed for this group than group I and III. .............................................................................. 91
Figure 4-17 FLM images of hair group I showing a layer of Flourescein Sodium (FS) stained orthocortical cells
(red) at the periphery of the hair cortex. Paracortical cells are stained green with Sulforhodamine (SR).
............................................................................................................................................................. 92
Figure 4-18 FLM image of hair group III hair cross section. A single layer of orthocortical cells can be
observed at the edges of the hair cortex, adjacent to cuticle cells. ....................................................... 93
Figure 4-19 FLM images of hair group IV showing an asymmetric distribution of ortho and paracortical cells.
............................................................................................................................................................. 93
Figure 4-20 FLM image of hair group V. Orthocortical cells (red) on the RHS of the image and paracortical
cells (green) are observed on the LHS. .................................................................................................. 93
Figure 4-21 FLM image of hair group VII hair. Although the image is out of focus in some areas, the
asymmetric distribution of the two cell types can be observed. ........................................................... 94
Figure 4-22 FLM image of hair group VIII with less orthocortical cells than hair group VII. ............................ 94

vii
LIST OF TABLES
Table 1-1 Amino acid content across 3 major racial groups. Table taken from Wolfram 200355. .................... 26
Table 2-1 Inter-rater agreement for the 8-group classification: 3 evaluators at occasion 1 and occasion 2. ... 37
Table 2-2 Intra-rater agreement for the 8-group classification. Rater 1 to rater 3. ......................................... 37
Table 2-3Inter-rater agreement for the 6-group classification: 3 evaluators at occasion 1 and occasion 2. .... 38
Table 2-4 Intra-rater agreement for the 6-group classification: rater 1 to rater 3. ......................................... 38
Table 3-1The main unsaturated fatty acids found in sunflower oil. ............................................................... 47
Table 3-2 Band assignment chart for FTIR absorbance146 ............................................................................... 52
Table 3-3 Summary of Orthogonal Partial Least Squares Discriminative Analysis .......................................... 58
Table 3-4 Misclassification table of 8 hair groups .......................................................................................... 60
Table 3-5 Misclassification table for 6 hair groups ......................................................................................... 60
Table 3-6 misclassification table of averaged spectra (8 hair groups) ............................................................. 61
Table 3-7 OPLS-DA Misclassification table of averaged spectra (6 hair groups) .............................................. 61
Table 3-8 Regression for hair curl (8 hair groups) ........................................................................................... 63
Table 3-9 Regression summary for hair curl (6 groups) .................................................................................. 65
Table 3-10 Resubstitution classification matrix of 4 hair groups .................................................................... 66
Table 4-1 Hair characteristics of hair 3 racial groups92,158 ............................................................................... 72
Table 4-2 Mechanical properties of hair from different races159 .................................................................... 73
Table 4-3 Mechanical characteristics of 8 hair groups. Median and range (minimum to maximum). ............. 81
Table 4-4 Mechanical characteristics of 6 hair groups. Median and range (minimum to maximum). ............ 81
Table 4-5 Hair growth rate (HGR) of 8 hair groups ......................................................................................... 88
Table 4-6 Hair growth rate (HGR) of 6 hair groups ......................................................................................... 88
Table 4-7 Hair growth across racial groups, based on the TrichoScan ............................................................ 88

8
CHAPTER ONE
1 INTRODUCTION AND LITERATURE REVIEW
Human hair plays an important role in psychosocial communication by functioning as
a symbol of youth, beauty and health. Scalp hair is also an easy marker and
expression of ethnic origin, culture and positioning within a society. Natural hair
morphology varies widely across the world possibly due to diversity arising from
heredity and environmental factors1. Human scalp hair has thermoregulatory, sensory
and decorative (social communication) functions. Modification and maintenance of
scalp hair has thus contributed significantly to a multibillion dollar cosmetic industry.
Some of the often overlooked functions of scalp hair include protection against
electromagnetic radiation, transportation of pheromones and sebum (from the skin
surface)2 as well as aiding in cleansing the skin surface of squames, dirt and
parasites2. Hair is increasingly being used in forensic3–5 and medical science to assess
exposure to toxins6–8 and monitor adherence to therapies, such as antiretroviral
treatment 9–13. Hair can also be investigated for its use as a substrate for biomarkers
for stress14–17 and testing for diabetes18,19.
1.1 Human Scalp Hair Morphogenesis
The hair shaft is produced by the hair follicle portion of the pilosebaceous unit. The
earliest evidence of human hair in the growing foetus is observed on the eyebrows
and upper lip at 9 weeks20; by 12 weeks, all hair follicles across the body have started
developing20 into lanugo that is usually replaced just before (or soon after) birth21,22.
The pilosebaceous unit starts as an invagination of the epidermis into the dermis and
results from epidermal cells that cluster together, forming a placode over dermal
fibroblast aggregates23–25.These dermal fibroblasts are the precursors of the hair
follicle dermal papilla (DP)26,27.An experiment by Higgins et al. illustrated the induction
of de novo hair follicles from cultured dermal papilla spheroids, providing evidence
that the dermal papilla has all the necessary information for the induction of a hair
follicle27.The quantity of dermal cells has also been shown to influence hair size,
morphology and cycling of the hair follicle and the reduction of these cells is reported

9
to lead to a decline in follicular numbers 26.Following interactions between the
epidermal and mesenchymal cells, the dermal aggregates grow down as buds into the
dermis and give rise to the epithelial portion of the hair follicle, which goes through
eight morphological stages of induction to maturation as illustrated in Figure 1-1.
Figure 1-1 Schematic diagrams of hair follicle morphogenesis24.
Using immunohistochemistry of murine hair, Paus et al. (1999) extensively described
the physical changes that the hair follicle undergoes during morphogenesis24. During
stage 1, the hair germ appears as an epidermal thickening with an increase in the
number of dermal fibroblasts below the hair germ, coupled by a change in the
orientation of the dermal fibroblasts. The hair germ then becomes elongated and has
a convex proximal end and the dermal fibroblasts condense to form a cap below the
hair germ at stage 2. A characteristic feature of stage 3 is a hair peg with a concave
basal border and central keratinocytes that have a columnar arrangement. These
columnar keratinocytes are organized radially to the follicular axis. In stage 4, the hair
peg thickens further, becomes bulb-like and the inner root sheath (IRS) is formed. The
dermal papilla (DP) cells are arranged in an elongated orientation and are partially
10
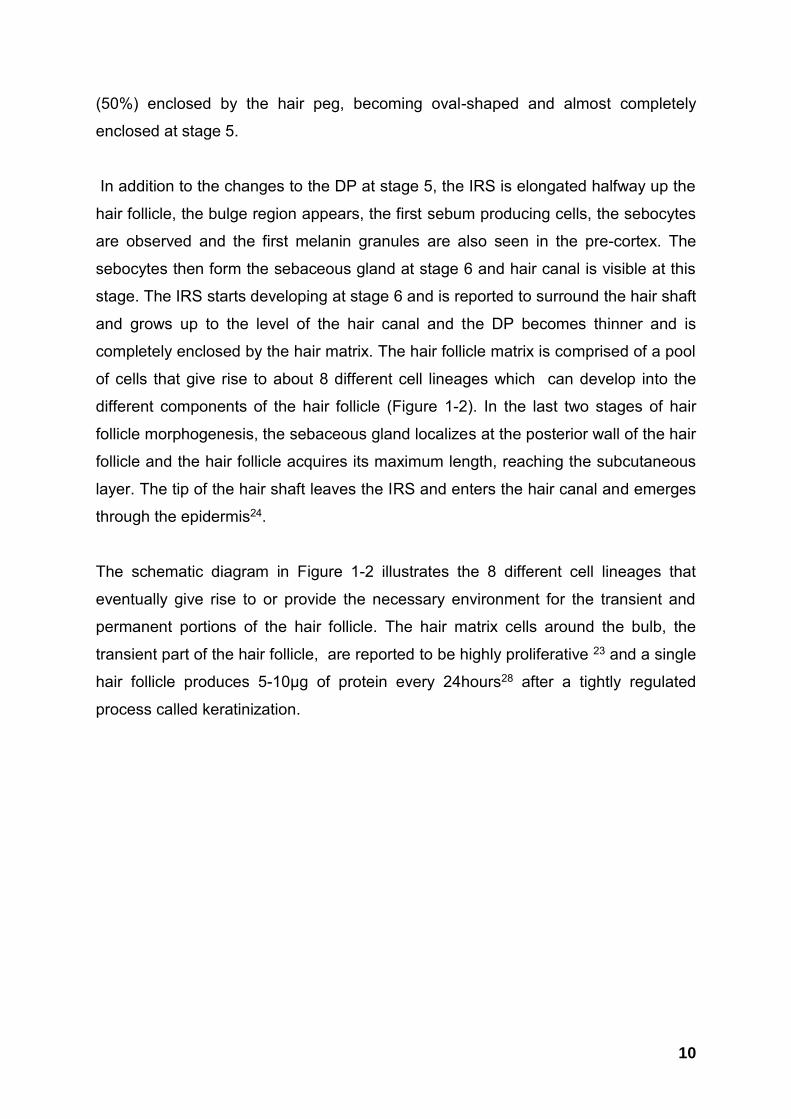
(50%) enclosed by the hair peg, becoming oval-shaped and almost completely
enclosed at stage 5.
In addition to the changes to the DP at stage 5, the IRS is elongated halfway up the
hair follicle, the bulge region appears, the first sebum producing cells, the sebocytes
are observed and the first melanin granules are also seen in the pre-cortex. The
sebocytes then form the sebaceous gland at stage 6 and hair canal is visible at this
stage. The IRS starts developing at stage 6 and is reported to surround the hair shaft
and grows up to the level of the hair canal and the DP becomes thinner and is
completely enclosed by the hair matrix. The hair follicle matrix is comprised of a pool
of cells that give rise to about 8 different cell lineages which can develop into the
different components of the hair follicle (Figure 1-2). In the last two stages of hair
follicle morphogenesis, the sebaceous gland localizes at the posterior wall of the hair
follicle and the hair follicle acquires its maximum length, reaching the subcutaneous
layer. The tip of the hair shaft leaves the IRS and enters the hair canal and emerges
through the epidermis24.
The schematic diagram in Figure 1-2 illustrates the 8 different cell lineages that
eventually give rise to or provide the necessary environment for the transient and
permanent portions of the hair follicle. The hair matrix cells around the bulb, the
transient part of the hair follicle, are reported to be highly proliferative 23 and a single
hair follicle produces 5-10µg of protein every 24hours28 after a tightly regulated
process called keratinization.

11
Figure 1-2 Schematic diagram showing the different cell lineages that give rise to the cycling
hair follicle28
Keratinization, in the context of hair, is the protein synthesis process that eventually
leads to a mature hair shaft29. During keratinization, cortical cells (keratinocyte cell of
the cortex) terminally differentiate and are completely filled with keratin intermediate
filaments and matrix, a complex that is further stabilized by disulphide linkages, and a
transglutaminase enzyme28,30. The building blocks for the process of keratinization are
fibrillar keratin intermediate filaments (KIFs) and matrix proteins or keratin associated
proteins (KAPs)30–33. Intermediate filaments are named after their intermediate size
between micro actin filaments and tubulin macro filaments34.

12
Figure 1-3 The hierarchical structure of the hair shaft35.
Figure 1-3 is a hierarchical illustration of the hair shaft, showing the constituents that
contribute to the different components and their X- Ray diffraction patterns35.
Intermediate filament keratins are fibrous alpha proteins that can be classified into two
groups according to their isoelectric points; Type I (acidic,40 - 50 kilo Daltons (kDa)
and Type II keratins (neutral to basic keratins, 55-65kDa), with 9 and 11 members in
each group respectively36,37.
Intermediate filaments have low-sulphur content, while the matrix that surrounds them
is sulphur-rich. The hair matrix is composed of high sulphur proteins (HSP), high
glycine tyrosine (HGT) proteins, and non-high sulphur/high glycine tyrosine proteins.
These are collectively called keratin associated proteins (KAPs). Matrix proteins have
no helical content and have a molecular weight of 10-28 kDa. The time it takes for a
keratinocyte cell to be completely keratinized upon entering the keratinization zone is
said to be 48hrs 28.
The hair follicle is comprised of three main sections; the lower segment consisting of
the bulb and supra-bulb (bulge),the middle segment (isthmus), and the upper segment
(infundibulum) as shown in Figure 1-438. Within the infra-infundibulum section is the
Inner root sheath (IRS), a component that has been described as the mould of the hair

13
shaft39,40. The inner root sheath is made up of the four layers; the Companion, Henley’s
and Huxley’s layers as well as the inner root sheath cuticle. The IRS ends at the
opening of the sebaceous gland. The sebaceous gland forms part of the isthmus
region and has been suggested to release proteases that lead to the degradation of
the IRS28,41 allowing the mature hair shaft to be covered in protective sebum as it
makes an exit in the region of the infundibulum. The three innermost cell layers; the
medulla, the cortex and the cuticle cells are what ultimately constitute the permanent
hair shaft that emerges out of the epidermis (Figure 1-4). These components are
discussed under section 1.4.
Figure 1-4 The different zones of growth and structural organization in the hair follicle38.
1.1.1 The Hair Cycle
Throughout a lifetime, the hair follicle is constantly cycling21,42 going through periods
of growth, regression, rest and shedding. These are termed Anagen, Catagen,
Telogen and Exogen as shown in Figure 1-5. Thermoregulation may have been the
evolutionary force that resulted in adaption to seasonal variation and a cycling hair
follicle43.

14
Figure 1-5 A schematic illustration of the stages of the hair cycle. The level and shape of
the DP changes at the various stages44
Anagen: The anagen phase is a period where the hair is actively growing, the
terminative epithelial cells of the bulb continuously proliferate, undergo programmed
cell death and terminally differentiate, becoming fully keratinized29,45. This phase of
the hair cycle is the longest for scalp hair follicles, lasting 3 - 5 years 44. During this
phase, hair follicles continuously produce hair fibres at a rate of 0.3 to 0.5mm/day46,47.
Catagen: This phase is the regression phase of the hair cycle where the transient part
of the HF undergoes apoptosis42,48,49 and the DP is retracted upwards to the surface,
stopping at the level of the stem cell niche when it reaches the resting phase. The
Catagen phase is brief and lasts for 2-3 weeks42,46.
Telogen: The resting phase lasts 2 – 4 months46,48. In this phase of the hair cycle, the
dermal papilla retracts upwards to the level of the sebaceous gland and just below the
stem cell bulge46. This positions the hair bulb perfectly for the stem cells to migrate to
populate the hair matrix, giving rise once again to all the cell lineages of the transient
portion of the hair follicle, marking the beginning of another anagen phase44,48,50,51.

15
Exogen: The Exogen phase has been defined as the shedding of the club hair at the
end of the resting phase25,52. Hair shedding is described as being independent of the
hair cycle and occurs without any influence from the anagen phase48,53.
The length of each phase in the hair cycle is regulated and varies according to body
site; very short on the forehead, longer on the eyebrows or eyelashes and longest on
the scalp22,39. Further, each HF or follicular unit has its own hair cycle clock47,54,55. The
exact mechanisms of how hair cycle clocks are regulated have not been elucidated24
but contributions from the dermal papilla are hypothesized47.
Two different types of hairs are present across the bodies of children and adults (i.e.
vellus and terminal).Vellus hairs are fine and usually not pigmented and cover most of
the body and often invisible (e.g. on the cheeks), while terminal hairs are large and
pigmented39.Terminal hair follicles tend to go deep into tissue while vellus hair follicles
are superficial. The transition between vellus and terminal, arising from hormonal
changes, is classically seen at the onset of puberty 21,22,53,56. In males, androgens are
reported to convert vellus hair to terminal hair on the beard and other sites during
puberty. Interestingly, androgens can also turn terminal head hair into vellus hair in
genetically predispose individuals resulting in common male pattern baldness; this
phenomenon has been called the Androgen paradox56.
1.2 Morphology of human scalp hair
Various factors that contribute to the morphology of the hair fibre have been reported
over the years. In a 1938 review by Trotter57, Duclert (in 1824) is quoted as having
suggested that hair curl depends on the shape of the hair follicle57. The explanation
for this thought was given by Grotte in 1867.In 1882 T.P.A Stuart also attributed the
curl pattern of negroid hair to a hair follicle that displayed curvature and reported that
the curvature is a fourth of a circle, which was less than Grotte’s observation that it
was a half-circle57. In 1889, Fritsch observed that the dermal papilla was the structure
in the hair bulb that determined hair morphology. He showed that kidney-shaped

16
dermal papillae resulted in flattened hair and that Europeans usually had round dermal
papillae while Africans sometimes had what he called “twin-papillae”57.
In 1897, J. Pohl Pincus looked at histological sections of Caucasian hair and saw that
the hair was dived in 3 parts; an upper part of the deepest third section where cells
appeared to be well-organised and fused together, a middle section that had uniform
circular cross-section. The last section he observed to be superficial, and seemed to
abruptly change in shape where it met with the middle. He also observed that at this
position, the inner root sheath disappeared.
In recent times, these observations were confirmed by other researchers40,58,59. Using
computer-aided reconstruction of scalp biopsy samples, Lindelof demonstrated that
hair emerged from follicles at a right angle to the surface of the scalp for Asian hair
and at an acute angle for African hair resulting in straight and curly hair respectively59,
while Thibaut et al.2005 observed that hair follicles collected from African volunteers
were curved with a retro-curvature and that their bulbs were bent40. More recently,
Thibaut et al. also showed, using immunohistochemistry, that the proliferation of hair
matrix cells was asymmetrical in curved hair follicles40,60. Another recent study used
mouse models to show that the size and shape of the dermal papilla dictates hair shaft
morphology and thickness and that the depletion of DP cells results in smaller hair
fibres26.
1.3 Hair Classification Methods
Hair morphology and other visible physical characteristics have widely been used by
anthropologists as one of the key distinguishing characteristics in allocating racial
groups57. However, natural hair morphology varies widely across the world possibly
due to diversity arising from heredity and environmental factors61. Further, curvature
within racial groups (especially Caucasian) is not uniform62,63. This makes race an
unreliable surrogate for hair curl. Various hair classification approaches have been
proposed in different fields.

17
1.3.1 Classifications by anthropologists
In 1938, Trotter compiled a comprehensively inventory of hair classification systems
that existed in that period, their origins and applications57. Trotter and earlier workers
described the nature of hair as the hair’s appearance, behaviour or habit. The
observed habits were that hair tends to either hang straight, wave deeply or have curls
that form ringlets57. Trotter cites Herodutus as being the first person to make
inferences of race based on hair appearance or morphology when he divided Xerxes’
army into straight and “woolly” hair groups57. In 1878 Topinards published an essay
on the classification of human races using hair morphology as the main differentiator
of external physical characteristics and the shape of the skull and skin colour only as
secondary differentiators57. In 1853 Browne observed and made drawings of hair
cross-sections and assigned mankind into three different species based on the shape
of the hair cross-section57. These species he defined as follows:
A: The “cylindrical piled hair” cross-section, represented by a person of Indian
descent.
B: The “oval piled hair” cross-section, represented by a white man.
C: The “eccentrically – elliptical piled”, represent by a person of Negroid
descent.
In addition to describing the cross-sections of the hair types that he drew, Browne also
described the (microscopic and macroscopic) characteristics of the various hairs. His
work was later supported by the work of Pruner-Bey in 1863, who examined the
microscopic characteristics of hair cross-sections, correlated these with macroscopic
observations and found that the flatter the hair tended to be, the more it would roll up',
whereas the more round it was, the more inclined it was to be straight and ‘smooth’.
In 1860 Geoffroy Saint-Hilarie assigned racial groups based on how the hair exited
the scalp surface, whether at an angle or straight57.
Workers like Ranke (1890), however reviewed preceding hair-centred racial
classifications and concluded that it was inadequate to distinguish races, as was skin
pigmentation57.

18
1.3.2 Classifications for the Cosmetic Industry
1.3.2.1 The LOIS System©
The LOIS system© classifies hair according to total strand shape in relation to the
letters that spell out LOIS 64 as shown in Figure 1-6. Using this system, hairs that
“bend, have right angles, with little or no curvature” are classified as L, while straight
hair with no bends or curvature looks like the capital letter “I” and is thus classified as
I. Hair groups with more curvature are classified as either “O” or “S”; the letter “S” also
describes wavy hair, while the letter “O” describes hair fibres whose curvature tends
to roll up into one or several zeros. People that have more than one obvious hair group
are then described by a combination of letters64. A shortcoming of the LOIS system©
is that it subjective and does not define guidelines about hair length requirements for
the classification, and thus wavy hair that rolls up into a circle can be classified as an
S or an O.
Figure 1-6 The LOIS hair classification64
1.3.2.2 Andre Walker Hair Classification
The Andre Walker hair classification (Figure 1-7) is widely used in the informal
cosmetic industry and it classifies hair form into four main categories, 1 to 4, with the
straightest hair being Type 1 and the hair with the greatest curvature being Type 4.

19
Figure 1-7 The Andre Walker hair typing system65.
Each category is then subdivided into two or three descriptive sub-categories, which
are subjectively described as straight and thin or kinky and ‘wiry’ as being soft, shiny,
difficult to hold curl and fragile and tightly coiled respectively 66. Further, this
classification does not give length guidelines.
1.3.3 Geometric Hair Classifications
Over the years, modern researchers have increasingly heeded to Ranke’s57
assessment that race is an incorrect descriptor of hair curvature and others have
echoed to call that use of race should be abandoned67,68, a move that has resulted in

20
an attempt to develop more objective geometric classifications of hair morphology63,69–
71.
1.3.3.1 Hrdy, Bailey& Schliebe Curve Diameter Classification
The first objective hair classification was introduced by Hrdy who assessed hair form
variation in seven populations (Bougainville, East Africa, Northwest European,
Malaita, Sioux, Japan and Ifugao)71. Hrdy assessed the average diameter,
medullation, scale count, kinking, average curvature, ratio of maximum to minimum
curvature, crimp and ratio of natural to straight hair length then compared within and
between population variations using F-tests. He found that the average curvature and
ratio of curvature were the two most important variables in describing hair form. Using
correlation matrices, Hrdy observed a strong correlation between curling variables
(kinking, average curvature, ratio of maximum to minimum curvature, crimp and ratio
of natural to straight length) while a weak correlation was observed between scale
count and the curling variables.
Using principal component analysis (PCA), Hrdy found that 3 components (curling,
size and regularity of curl) accounted for 80% of the variance in the data71. He also
observed that the average curvature varied between populations and that it had the
greatest contribution in differentiating between groups71. Bailey and Schliebe70 later
investigated the precision of this approach by measuring the hair curvature of 30
strands (6cm long) from the same individual three times on a template of circles of
known radii (Figure 1-8). The two scientists also investigated the differences in
average hair curvature within a limited genetic pool of 5 male members of the same
family and found that there were distinct population distributions70.
The relationship between ethnic origin and hair morphology was later investigated by
De La Mettrie et al. in an experiment that included 1442 volunteers from 18 different
countries63. De La Mettrie et al. and showed the distribution of hair morphology
variation across the world63 .

21
Figure 1-8 A geometric classification template based on curvature measurements by
Bailey & Schliebe. Diagram taken from Ogle & Fox72.
1.3.3.2 De Mettrie et al. Geometric Classification
The hair classification study showed the distribution of hair morphology variation
across the world63. This study was later extended to a total of over 2500 volunteers
from 26 countries69. The results of this study was an 8-group hair classification method
that classifies hair using 3 geometric parameters; curve diameter, number of waves
and the number of twists present in 5cm of wavy to curly hair. With this extended study,
Loussouarn et al. suggested that it was possible to classify the worldwide variability of
human hair morphology into 8 main groups without reference to racial origin.
This hair classification method completely eliminates race as a descriptor for hair
morphology and instead classifies hair as type I through to type 8. Type I describes

22
straight hair, whether it originates from an Asian or Caucasian person. Curly hair
ranges from type IV to VIII 63,69. This new hair classification method raises questions
about whether or not these 8 categories correlate with hair characteristics that have
previously been assigned to racial groups. Some of these characteristics include the
biochemistry, mechanical and microscopic details of hair fibre traits. No study has
published testing the new geometric classification’s reliability. Recent studies still use
racial classifications when referring to hair curvature73.
1.4 BIOCHEMICAL CHARACTERISTICS OF HUMAN HAIR SHAFT
COMPONENTS
The human hair shaft is comprised of 3 components; the outer cuticle layers, the cortex
and the medulla.
1.4.1 The Hair Cuticle
The cuticle component of the hair shaft is a chemically resistant22,74 imbricated75 multi-
layer ( 6 to 8 layers) of flattened keratinized cells that are attached at the root end of
the hair fibre76. The keratins present in cuticle cells are mainly arranged in β-sheet
conformation53. These flattened cells have a thickness of 0.5 – 1.0µm and an average
length of 45µm39. Each cuticle cell is made up of A-layer, exocuticle, endocuticle and
cell membrane complex (CMC)77. On its own, the hair cuticle is higher in cystine
content78 and in other non α-helical amino acids than the whole hair fibre22. The cuticle
is reported to have lower tryptophan and histidine content79. Cuticle cells contribute
negligibly to the mechanical properties of whole hair fibres76,80 but play an important
role in the diffusion of water and other substances onto the hair cortex 39.
1.4.2 The Hair Cortex
The hair cortex accounts for the bulk of the hair fibre. The thickness and length of
cortical cells are usually 1-6µm and 100µm, respectively22. The main components of
the cortex are the intermediate filaments (macrofibrils) and the matrix39. Intermediate
filaments (IFs) are rich in the amino acids that are usually found in α –helical proteins
and in leucine and glutamic acid. Cystine (~ 6%), lysine and tyrosine are present in
smaller quantities81. The hair matrix has high cystine content (~21%), proline and is

23
rich in amino acids that do not form α-helices 81. Pigment granules are incorporated
into cortical cells via phagocytosis at the zone of differentiation39.
There are 3 different cortical cell types (ortho, para and meso-cortex) that are usually
distributed across the cortex of hair or wool fibres22,82. Orthocortical cells have lower
sulphur content (~3%) and less matrix between intermediate filaments; while
paracortical cells have higher sulphur content (~5%) and tend to be smaller, with
smooth rounded borders83. Mesocortical cells have an intermediate sulphur content84.
The ultrastructure of cortical cells is usually visualised using transmission electron
microscopy31,85,86.
The differences in the cell types are associated with the arrangement of keratin
intermediate filaments or macrofibrils and matrix within these cells for wool50,87. The
macrofibrils within the inter-macrofibrilar material (IMM) of orthocortical cells are
cylindrical and are arranged as double twists88,89, while those of paracortical cells are
packed in a parallel arrangement and that of mesocortical cells is intermediate
between these two89. The double-twisted macrofibrils are observed as whorls in
transverse sections50 and are usually used to locate orthocortical cells in the hair cross
section.
In the human hair cortex, there are variations in the arrangement of macrofibrils within
single cells90. This variation was elucidated in straight hair by Harland et al. using
electron tomography91. Harland et al. observed similar IF arrangement and spacing in
the cortical cells of straight hair but found that there were variations in the staining
intensities of hair sections prepared for transmission electron microscopy (TEM).The
researchers concluded that for hair sections, orthocortical cells had a high intensity
while para-cortex has low intensity staining macrofibrils91.
Variations in the distribution of cortical cell types has been associated with hair
morphology62,85,90. The cortex of straight hair is composed of predominantly
paracortical cells90 while that of curly hair has an asymmetric distribution of
orthocortical and paracortical cells60,62,90. Figure 1-9 shows an illustration of how the
cortical cells types would typically be distributed on a fibre with curvature.

24
Figure 1-9 Hierarchical structure of the hair shaft showing the composition and
distribution of cortical cell types81.
The cortex is the component of the hair structure that is responsible for mechanical
properties of the hair fibre39,92,93. Hair with high curvature is reported to be the least
resistant to mechanical extension and to exhibit profiles of premature failure92. The
mechanical characteristics of curly hair are unlikely to be related to hair biochemistry.
Using silver-staining and TEM, Khumalo et al.(2005) showed there was similar staining
in different race groups and suggested that the fragility of African hair is not related to
the distribution of cystine-rich protein94 and likely to be due to other mechanical
influences, such as grooming.

25
1.4.3 The Medulla
The medulla, the innermost component structural component of the hair shaft is not
present in fine hair but is usually seen in coarse or thicker scalp and beard hair
fibres32,95,96. When present, the medulla is observed as a series of vacuoles along the
hair fibre and does not contribute significantly to the mechanical properties of the hair
fibre39.
1.4.4 Biochemical Characteristics of Whole Hair Fibres
Whole hair fibres are composed of 65 to 95% proteins that are condensation polymers
of amino acids. The remaining composition is water, lipids, hair pigment (melanin) and
trace elements39. There is significant overlap in the amino acids quantities of hairs of
volunteers from different races (Tables 1-1)93, although some amino acids vary
depending gender and hair colour; the cystine content of male scalp hair is higher than
that of female hair, while highly pigmented or dark hair also has higher cystine content
than lighter hair97. The lipids found of the hair shaft are usually categorised according
to their origin, with external hair lipids being those secreted by the sebaceous and
internal lipids being those present within hair matrix cells98–101. Hair lipids account for
1-9% weight of the total hair fibre39,73. These lipids are cholesterol esters (ChE),
cholesterol (Ch), cholesterol sulphate (ChS), ceramides (Cer)102 and free fatty acids
(FFA). Of these lipids, the ChE and some FFAs are attributed to the sebaceous
gland99. The major external lipid is 18 Methyleicasonoic acid (18-MEA), which is
covalently bound to the cuticle surface via thio-ester linkages93,103. Disruption or
depletion of this lipid renders the hair hydrophilic104. Both internal and external lipids
have been reported to contribute to the physical properties of hair fibres99,105.
Duvel et al. reported that the decrease in mechanical properties of distal hair fibres
might be due to progressive loss of free and covalently bound lipids105. The
researchers showed gradual decreases of ceramides, cholesterol sulphate and bound
fatty acid (18-MEA) as one moves from hair root to tip105.

26
Table 1-1 Amino acid content across 3 major racial groups. Table taken from Wolfram
200355.
Recent work has showed that internal lipids are variably distributed all over the hair
cortex and contribute to the structural arrangement of keratins within cortical cells73.
These lipids may influence hair texture or be associated with hair morphology of hairs
from the 3 major racial groups. Cruz et al. observed that African hair has the highest
internal lipid content (3.48%), with Asian and Caucasian hair having similar amounts
(2.07% and 2.05% respectively)73. The study showed that the arrangement of internal
lipids in the hair matrix influences the secondary structure of keratins and keratin
associated proteins.
Figure 1-10 Martini Force Field model showing the arrangement of keratins with and without
internal lipids73

27
The presence of these lipids caused an intercalation of keratin dimers, changing the
architectural arrangement of hair filaments73 (Figure 1-10). Integral hair lipid levels and
other intermolecular components of hair are reported to be significantly affected by
adverse biological changes such as the presence of cancerous cells18,106–108. These
will be discussed further under section 1.6.
1.5 THE USE OF HUMAN SCALP HAIR IN MEDICINE
There are two approaches that can be employed to gain information from hair; the
changes in the biochemical composition can be indicative of disease
presence/progression 15,18,19,108,109 and exposure to (or incorporation of) various
substances (including drugs and toxins)5,7,8,110 which can be investigated and even
detectable years post-mortem3. Levels of exposure can be quantified from scalp,
pubic or auxiliary hair long after exposure6.
Substances are incorporated into the hair shaft via various mechanism; passive
diffusion through blood into the hair matrix during keratinization, transfer into the hair
follicle from surrounding tissue, absorption onto the formed hair shaft from sebum,
sweat and from the environment3. Figure 1-11 shows the routes of incorporation for
ethyl glucuronide, a metabolite of ethanol which can be used as an objective marker
of chronic alcohol intake110.
The incorporation of substances into the hair shaft may depend on their chemical
nature; neutral and lipophilic substance enter the hair shaft17,53 and get diffused into
matrix cells, while basic compounds are reported to bind to melanin111,112. These
substances are usually extracted from hair shafts and analysed using various
analytical tools including liquid and gas chromatography mass spectrometry 9,17,110.
28
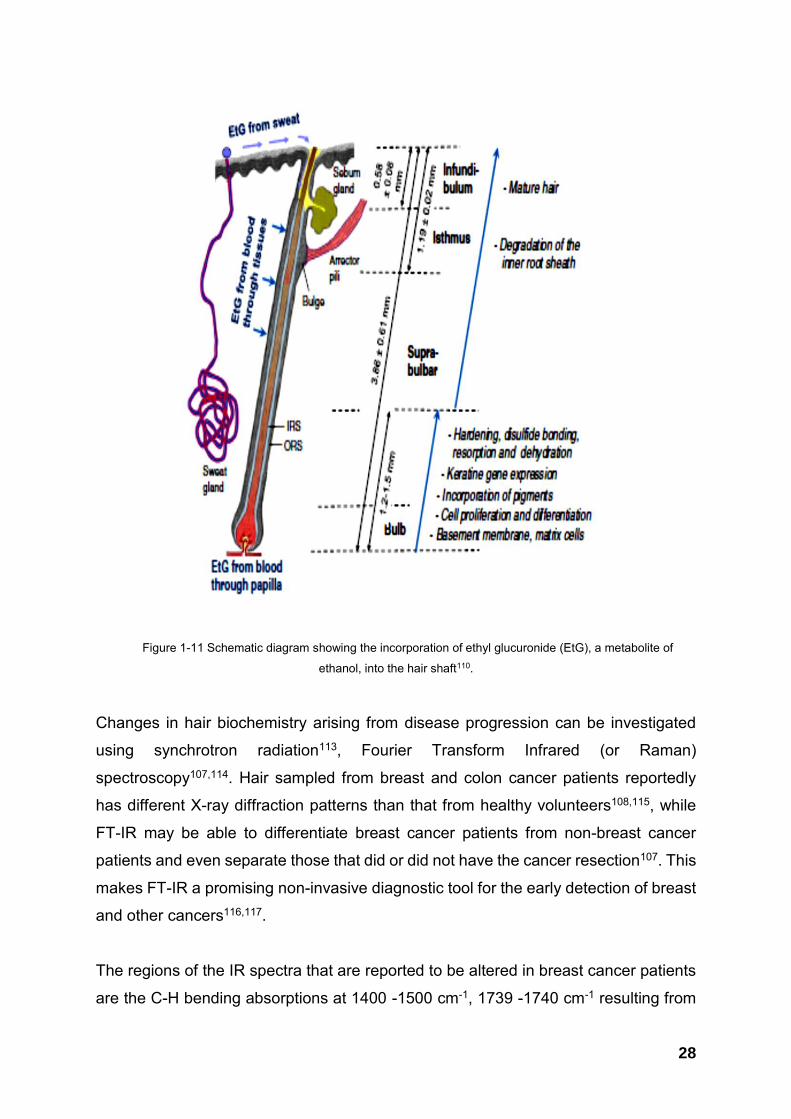
Figure 1-11 Schematic diagram showing the incorporation of ethyl glucuronide (EtG), a metabolite of
ethanol, into the hair shaft110.
Changes in hair biochemistry arising from disease progression can be investigated
using synchrotron radiation113, Fourier Transform Infrared (or Raman)
spectroscopy107,114. Hair sampled from breast and colon cancer patients reportedly
has different X-ray diffraction patterns than that from healthy volunteers108,115, while
FT-IR may be able to differentiate breast cancer patients from non-breast cancer
patients and even separate those that did or did not have the cancer resection107. This
makes FT-IR a promising non-invasive diagnostic tool for the early detection of breast
and other cancers116,117.
The regions of the IR spectra that are reported to be altered in breast cancer patients
are the C-H bending absorptions at 1400 -1500 cm-1, 1739 -1740 cm-1 resulting from

29
lipid esters, 1240 cm-1 from C-H lipid, 1163 cm-1 from C-O stretching in lipid, 1161 cm-
1 C-O-C stretching in lipids and at 1055 cm-1 from cholesterol. These changes in lipid
content are thought to result from an increase in the lipid material in the delta layer of
the cuticle – cortex cell membrane complex (CMC)106,107,118 as well as from fatty acid
synthases that are expressed in cancer107,119.
Hair analyses and interpretation of results have mainly focused on differences
between race, however racial categorizations is limited and subjective and could be
biased120. The growing use of hair in medicine and forensic medicine therefore
requires that the baseline characteristics of human scalp be holistically elucidated in
order to interpret results. The most recent increasing use of hair for testing
incorporated substances includes testing for antiretroviral drug levels to monitor
treatment compliance9–13.
Race continues to be used as a surrogate for hair curvature in the interpretations of
hair analyses results, however racial categorizations is limited, subjective and could
give biased results120. Further, if curly hair indeed has the highest internal lipid content
as previously suggested73 both hair curl and its potential influence (e.g. on
incorporation of lipid soluble drugs) have to be objectively quantified. Objective
measures of hair curl and its influence on biochemistry would allow appropriate
interpretation of results and improve the validity of the growing use of hair as a testing
substrate in Medicine and Forensic Sciences6–19.
1.6 STUDY AIMS
The current study aimed to;
1. Evaluate the reliability of the geometric classification of hair curl and explore
whether its reliability could be improved.
2. To explore the relationships that may exist between the hair curl and
biochemical characteristics (internal lipid content and FTIR of whole hair fibres).
3. To investigate relationships between physical characteristics (mechanical
properties, hair growth rate and hair density) and the degree of hair curl.

30
CHAPTER TWO
GEOMETRIC CLASSIFICATION OF HUMAN SCALP HAIR CURL: REDUCING
GROUPS FROM 8 TO 6 IMPROVES RELIABILITY
ABSTRACT
Background:The use of race to describe human hair variation (Asian, Caucasian and
African) is unscientific. This study aimed to test the reliability of a classification that is
based on 3 geometric measurements (curve diameter, curl index and number of
waves).
Methods: After ethical approval and informed consent, proximal virgin (6cm) hair
sampled from the vertex of 128 healthy volunteers was evaluated. Three raters each
scored hairs from 48 volunteers at two occasions each for the 8 and 6-group
classifications. One rater also classified hair from all 128 volunteers using the 6-group
method. Kappa statistics were used to assess inter and intra-rater agreement.
Results: Each rater classified 480 hairs on each occasion. No rater classified any
volunteer’s 10 hairs into the same group; the most frequently occurring group was
used for analysis. The inter-rater agreement was poor for the 8-groups (k = 0.418) but
improved for the 6-groups (k = 0.671). The intra-rater agreement was also poor for 8
(k = 0.444 to 0.648) and improved for 6-groups (0.599 to 0.836). The intra-rater
agreement for the one evaluator for all volunteers was good (k = 0.754). The 6-group
method reduced the classification time of curly hair from 30 to 10 minutes.
Limitations: Although the current study had a small sample size, it is the first to test
the reliability of a geometric classification.
Conclusions: The 6-group method was quicker and more reliable. However, a
digital hair curl classification that correlates with biochemistry is warranted and likely
to reduce operator error.

31
2 INTRODUCTION
The variation in hair curvature is the most distinct characteristic of human scalp hair
morphology. Studies have indicated that differences in hair curl arise from the
bulb40,58,59.Using computer-aided reconstruction of scalp biopsy samples, Lindelof
demonstrated that hair emerged from follicles at a right angle to the surface of the
scalp for Asian hair and at an acute angle for African hair resulting in straight and curly
hair respectively59. Recent studies using mouse models show that the size and shape
of the dermal papilla dictates hair shaft morphology and thickness26. Natural hair curl
varies widely across the world possibly due to diversity arising from heredity and
environmental factors61. However, the use of race (African, European, Asian) as a
descriptor of hair form has limitations because it is subjective68 and presents with
overlaps1,121.
The accurate identification of hair curl is crucial for forensic investigators wanting to
link trace evidence found at crime scenes to suspects116,122,123. Further, certain hair
disorders such as folliculitis keloidalis nuchea are predominantly associated with high
curvature hair124. Objective characterization of hair would also be useful for hair-curl-
specific hair product development. This would better address the needs of different
hair curl phenotypes; for example, sebum is not evenly distributed along curly hair
shafts resulting in dryer hair125. The proposal to abandon the use of race in describing
human hair phenotypes67,68 is even more relevant for the exploding interest in the use
of hair as a testing substrate in medicine9,15–17,19,126. There is evidence to suggest that
curly hair has a higher lipid content;73 this may influence the incorporation of lipid
soluble drugs, requiring adjustments for hair morphology when interpreting results.
A few objective hair classification systems have been attempted64,70,71. The first was
introduced by anthropologist Hrdy71 who assessed hair form variation in seven
populations (Bougainville, East Africa, Northwest European, Malaita, Sioux, Japan
and Ifugao). He measured the average diameter, medullation, scale count, kinking,
average curvature, ratio of maximum to minimum curvature, crimp and ratio of natural
to straight hair length then compared within and between population variations using
F-tests. The average curvature and ratio of curvature were the two most important
variables in describing hair form. Correlation matrices showed a strong correlation

32
between curling variables (kinking, average curvature, ratio of maximum to minimum
curvature, crimp and ratio of natural to straight length) while a weak correlation was
observed between scale count and the curling variables. Principal component analysis
(PCA) showed that 3 components (curling, size and regularity of curl) accounted for
80% of the variance in the data.71. Hrdy also observed that the average curvature
varied between groups and suggested it would have the greatest contribution in
differentiating groups71. The precision of the contribution of average curvature to
variation was later investigated by Bailey and Schliebe70 who measured hair curvature
of 30 strands (6cm long) from the same individual three times on a template of circles
of known radii (Figure 2-1) (and compared means) in one experiment. They described
average curvature as an inverse of the radius as did Hrdy71. In a second experiment,
they compared the curvature of hair form recorded for five family members and found
overlaps in recorded means70. They did not investigate the reliability by calculating
intra and inter rater agreement.
Figure 2-1 Curve diameter template derived by De La Mettrie et al.63 from Bailey and
Schliebe70.
Most recently, De La Mettriet al. expanded on the Bailey & Schliebe system by
introducing 3 additional variables (for curly hair), also measured on a 6cm length of
proximal hair. They classified hair collected from 1442 volunteers, originating from 18
countries63, by measuring the curve diameter (CD), the ratio between relaxed and
extended hair length (termed the curl index or i), the number of twists (t) and waves

33
(w). The number of waves was counted by constricting a 5cm segment of the hair to
4cm, while the number of twists is the number of natural constrictions along the hair
axis63. They reported a direct correlation between the number of twists and number of
waves which supported the exclusion of the number of twists measurement for future
analyses. Using the remaining three variables (Figure 2-2), PCA and hierarchical
ascendant clustering (HAC), they reported that hair could objectively be classified into
8 groups and provided a set of rules for the classification63 (Figure 2-3).
Figure2-2 Geometric templates used for the 8-group hair classification69.
Figure 2-3 Hair classification rules described by De La Mettrie et al63 and Loussouarn et
al69.
The curve diameter was used to distinguish four groups in the straight hair spectrum
based on cut-off values obtained from the PCA and HAC analysis. Curly hair was
differentiated based on combinations of curl index (i) scores and maximum number of
waves. A follow-up study led by Loussouarnet al.69 included an additional 1007
volunteers and aimed to demonstrate the reproducibility of the geometric classification.

34
They proposed a simplified approach to the classification, where instead of measuring
the curl index (i), a curl meter which is a circle with a diameter of 0.98cm was used
first to see if the 6cm of hair fits completely (hair curl group VII and VIII) or not (hair V
and VI) within the circle. Thereafter the 6cm hair is taped down ,0.5cm on each side ,
giving rise to a 5cm segment which is then constricted to 4cm and the number of waves
counted. Thus, classification of the curlier hair groups depended on the combination
of the curl meter and number of waves69.
Although the authors had large sample sizes, they only measured 3 hair fibres
sampled from different parts of the head for each volunteer. Further, although the
classifications in both63,69 studies were conducted by different scientists, the inter-rater
agreement was not calculated. Both studies also did not report comparisons of repeat
measurements (intra-rater reliability).
The aim in this study was to evaluate the reliability of the geometric classification and
explored whether reliability could be improved.
2.1 MATERIALS AND METHODS
2.1.1 Participants and Sample Preparation
Permission to conduct the study was granted by the Faculty of Health Sciences,
Research Ethics Committee (HREC REF: 328 2012). Participants with at least 6cm of
virgin hair (and had not used any chemical straightener or dyes for > 7 months) were
invited to participate in the study via notices, fliers and University online research
notices. After participants gave informed consent, an area of 0.56cm2 (using the same
sterilized electric shaver) was shaved from the vertex of the scalp and kept in a dry
sealed evenlope. Prior to geometric measurements, the hair was washed in a petri
dish using 10 ml of 1% sodium dodecyl sulphate solution (30 seconds of soaking,60
secods of lathering by shaking hair petri dish, 60 seconds of rinsing under warm (37 C)
running water, followed by 2 rinses with 100 ml of cold distilled water). Hair was then
air-dried for a minimum of 4 hours and stored in sealed packets at room temperature,
away from direct sunlight, until geometrically classified.
2.1.2 Geometric Characterizatin
Three scientists classified 6cm of proximal virgin hair from the same pool of 48
35
volunteers using published classification templates and rules (Figures 2-2 and 2-3)69.
Each rater classified 10 hairs at 2 different occasions; therefore, each volunteer’s hair
was classified 60 times.
Single strands of natural hair (Figure 2-4) were classified using the curve diameter
(CD) meter which identified hair groups I to IV. Six centimetre long strands of hair were
place on top of the curve diameter template and a glass slide placed on the hair without
shifting or altering its natural curl. The hair was then classified as hair curl group I, II,
III or IV by superimposing it to the best fit half-circle. For hair with curls too tight to fit
in the curve diameter template, both the curl meter [i.e. hair fits completely (VII and
VIII) or does not (V and VI) fit within within the circle] and the number of waves
calculated [up to 3 for V; ≥ 4 for VI; up to 5 for VII and ≥ 6 for VIII] were used for
classification.
The most frequently occurring hair curl group for each set of 10 strands was reported
as the representative hair curl group for the volunteer for each rater at occasion 1 and
2.
2.2 Statistics
The inter and intrarater agreement, reflecting the reliability of the geometric
classification systems was assessed using Cohen’s kappa coefficient (StataCorp.
2013. Stata: Release 13. Statistical Software. College Station, TX: StataCorp LP). The
Kappa coefficient measures chance corrected agreement between two or more raters
and can range between +1 and -1127.A coefficient of 1 denotes perfect agreement, 0
reflects agreement obtained by chance and a negative value shows worse than
expected agreement128. Kappa values 0.41-0.60 reflect moderate, 0.00–0.20 slight
0.61-0.81 substantial and > 0.81 reflects almost perfect agreement between
raters127,129,130.
2.3 RESULTS
A total 128 volunteers (83% female and 18% male) aged 18 -55 years from 4 self-
identified racial groups (Asian, Caucasian, Mixed and African) were included. Single
strands of natural hair (Figure 2-4)were classified using published geometric

36
templates.Sixty hair strands were classified for each volunteer for the 8 and again for
6-group classification. It took approximately 15 to 30 minutes to classify 10 strands for
curly hair groups (V – VIII) and approximately 10 minutes for straighter hair. In all,
2880 hair strands (48 volunteers X 10 strands X 3 raters X 2 occasions) were initially
classified. No rater classified any volunteer’s 10 hairs into the same group; hair was
classified into at least 2 (and occasionally 3) groups. The most frequently occurring
hair curl group of the 10 strands at each assessment time point was chosen as the
representative hair group for the volunteer.
Figure 2-4 Variations in the degree of air curvature across 8 hair curl groups (I – VIII).
The inter-rater agreement for the 8-groups, was fair to moderate129,130, and higher at
occasion 2 (k = 0.455, CI; 0.389– 0.521 ) than occasion 1 (k = 0.380, 95% CI; 0.313 –
0.447). The intra-rater agreement [ranged from k = 0.444 (95% CI; 0.334 – 0.553) to
k = 0.648 (95% CI; 0.525 – 0.771)] showed the lowest agreement between the three
raters for the most extreme groups (I and VIII, k = 0.170 and k = 0.074 respectively)
at occasion 1 (Table 2-1).

37
Table 2-1 Inter-rater agreement for the 8-group classification: 3 evaluators at occasion 1
and occasion 2.
Occasion 1 Occasion 2
Hair Curl
Group
Kappa 95% CI Kappa 95% CI
I 0.170 0.007 - 0.334 0.603 0.440 - 0.766
II 0.419 0.256 - 0.583 0.443 0.279 - 0.606
III 0.379 0.216 - 0.543 0.439 0.275 - 0.602
IV 0.515 0.352 - 0678 0.554 0.391 - 0.717
V 0.604 0.441 - 0.768 0.364 0.200 - 0.527
VI 0.182 0.018 - 0.345 0.407 0.244 - 0.571
VII 0.396 0.232 - 0.559 0.453 0.290 – 0616
VIII 0.074 0.000 - 0.237 0.399 0.236 - 0.562
Combined 0.380 0.313 - 0.447 0.455 0.389 - 0.521
Table 2-2 Intra-rater agreement for the 8-group classification. Rater 1 to rater 3.
Agreement Expected Agreement Kappa 95% CI
Rater 1 58.33% 13.02% 0.521 0.413 – 0.629
Rater 2 52.08% 13.89% 0.443 0.334 – 0.553
Rater 3 70.8% 17.19% 0.648 0.525 – 0.771
The third step of the classification for curly hair i.e. counting the number of waves
(taping the ends down to count the number of waves) was reported by all 3 raters as
laborious, the tiny hair as difficult to handle and at risk of breakage. As a result this,
repeat measurements were again performed at two time points by the 3 raters where
the third step [the number of waves count (w)] was excluded. This resulted in a 6-
group classification where the first step categorized hair curl groups 1 to 4 similarly to
I to IV69 but ended at the second step where the curl meter classified hair as falling
outside of the circle (Group 5 equivalent to V and VI) 69 or completely inside (Group 6
equivalent to VII and VIII). The inter-rater (k = 0.613 at occasion 1 and k = 0.729 at
occasion 2) and intra-rater agreements [range: k = 0.599 (95% CI: 0.422 – 0.776) to k
= 0.836 (95% CI; 0.691 – 0.981)] for the 6-group classification were higher than those
of the 8-group classification (Table 1-2).

38
Table 2-3Inter-rater agreement for the 6-group classification: 3 evaluators at occasion 1
and occasion 2.
Occasion 1 Occasion 2
Hair Curl
Group Kappa 95% CI Kappa 95% CI
1 0.171 0.008 – 0.335 0.000 0.000 – 0.149
2 0.534 0.371 – 0.698 0.610 0.447 – 0.773
3 0.578 0.414 – 0.741 0.645 0.482 – 0.809
4 0.531 0.367 – 0.694 0.806 0.643 – 0.970
5 0.206 0.045 – 0.369 0.463 0.299 – 0.626
6 0.883 0.720 – 1.000 0.913 0.750 – 1.000
Combined 0.613 0.527 – 0.699 0.729 0.641 – 0.817
Table 2-4 Intra-rater agreement for the 6-group classification: rater 1 to rater 3.
Agreement Exp. Agreement Kappa 95% CI
Rater 1 87.50% 23.87% 0.836 0.691 – 0.981
Rater 2 70.83% 27.13% 0.599 0.422 – 0.776
Rater 3 81.25% 24. 70% 0.751 0.601 – 0.901
One evaluator who also assessed (at a different time point) 10 hairs each for all
volunteers using the 6-group classification was found to have similar intra-rater
agreement [k = 0.754 (95% CI; 0.669 – 0.839)] to that reported for the 48 volunteer
sample. The overall distribution of classified hair curl groups somewhat correlated with
subjective racial classification, where Asian hair is usually straight, Caucasian hair is
straight to curly and African hair was the curliest (Figures 2-1 and 2-2).

39
Figure 2-5Distribution of hair curvature (8 groups) according to self-declared racial group
Figure 2-6 Distribution of hair curvature (6 groups) according to self-declared racial group
.
0
5
10
15
20
25
30
35
40
45
I II III IV V VI VII VIII
Nr.
Of
Vo
lun
tee
rs
Hair Curl Group(Loussouarn)
Hair curl destribution according to self-declared race8-group geometric classification
Asian
Caucasian
Mixed
African
0
5
10
15
20
25
30
35
40
45
1 2 3 4 5 6
Nr.
Of
volu
nte
ers
Hair Curl Group (Mod. Loussouarn)
Hair curl destribution according to self-declared race6-group geometric classification
Asian
Caucasian
Mixed
African

40
2.4 DISCUSSION
Self-declared racial groups showed significant overlap with each “race” falling into 4
of the 8-group and at least 2 of the 6-group classifications; thus confirming “race” as
an unreliable descriptor of hair curl. Although representative hair samples (10 strands,
one volunteer) from each geometric group, demonstrate a gradual increase in hair
curvature from group I to VIII (Figure 2-4); statistical analysis suggests that including
the third step (‘counting the waves’) does not reliably distinguish curly hair phenotypes
into 4 four groups (Group V versus VI and VII versus VIII) as previously suggested69.
For all raters, classification of hair from the same volunteer fell into at least 2 (and
occasionally 3) groups which may suggest observer error or heterogeneity of hair
morphology even within a small area (0.562cm2) as previously reported70,71. The
straight hair phenotype of Asian (Chinese and Indian) volunteers in our sample was
grouped into group I to IV; the Indian participants likely contributed to the presence of
hair curlier phenotypes. Participants who identified their race as Caucasian were
classified in all hair curl groups except VII and VIII. The absence of participants who
identified as mixed race in hair group VII was thought to be by chance. African hair
ranged from curl group V to VIII. This was consistent with observations by Loussouarn
et al.69 and other workers 62,69,131.
Inter-rater agreement for the 8-group classification system was moderate [occasion 1
(k = 0.380) even though slightly improved (k = 0.455) at occasion 2]. This may reflect
improved rater proficiency with the geometric classification.
The major challenge encountered with the 8-group classification system was the
difficulty in handling the hair to count the number of waves for hair groups V to VIII.
Further, the distinction of hair group V from VI and hair group VII from VIII was
somewhat subjective. For instance, a strand could be a V or VI based on one extra or
less wave. Eliminating this step (counting waves) from the classification resulted in
improved inter and intra-rater agreement as seen in the kappa values of the 6-group
classification (Table 2-3).
The worst inter-rater agreement values were obtained for Hair curl groups I, VI and
VIII (Tables 2-1 and 2-2) for the 8-group and hair curl group 1 and 5 for the 6-group
classification; these could reflect ambiguity and lack of uniqueness of the groups. The
existence of the two extreme hair curl groups (I and VIII) is likely to reduce in future,76

41
while groups III – V are predicted to increase because of increasing human migration
and admixture. The distribution of hair curl groups according to race varied slightly
when comparing the 8 and 6-group classifications (Figures 2-5 and 2-6) with more
group 1 hair in the 8 than the 6-group classification of the same volunteers. The most
frequently occurring hair curl for each set of 10 strands was used as representative for
the volunteer. This was done for all raters at occasion 1 and occasion 2. In instances
where no one hair curl was the most frequent in a set of 10 strands, the curliest hair
was used (i.e. considered more likely to be representative for the volunteer than
straighter hair that could have straightened due to mechanical damage or extension).
Temporary hair curl change as a result heat and/or cosmetic physical curling would
not have survived the sample preparation steps. Chemically altered hair (straightened
or curled) was excluded from the study. Further, hair samples were washed in between
evaluators in order for the hair to regain its natural non-extended hair form. Lastly, the
overall hair curl for each of the 48 volunteers was based on the most frequently
occurring hair group of the 6 evaluations (i.e. from 60 hairs) made by the 3 raters each
for the 8 and 6-group classifications.
There is an exponential increase in the number of studies that report the use hair as
a testing substrate, including investigations of drug hair levels as objective measures
of treatment compliance10,12,13,132,133. Unlike blood and urine that have a high turnover,
human hair is a medical repository that can be used to extrapolate exposure to drugs,
toxins and poisons dating back many months (depending on hair length) . However,
lipid content may vary with hair curl73.
The geometric classification system presented by De La Mettri et al. and Loussouarn
et al. is a significant contribution to the scientific use of hair for various applications.
2.5 CONCLUSION
The 6-group geometric hair classification is quicker and more reliable than the one has
8-groups. However, there is a need to investigate the potential contribution of hair
biochemistry, mechanical and ultra-structural characteristics. The investigations of the
biochemical characteristics are presented in Chapter Three.
42
CHAPTER THREE
DOES FOURIER TRANSFORM INFRARED ANALYSIS CORRELATE WITH GEOMETRIC CLASSIFICATION OF HUMAN SCALP HAIR? ABSTRACT Background: Recent studies report the use of various spectroscopy techniques to
identify biomarkers for screening and early diagnosis of disease e.g. breast and colon
cancer. The reliability of such diagnostic approaches is likely to be influenced by the
“natural” baseline state of the hair samples under investigation. It is thus crucial to
elucidate the basic science of hair in order to understand the potential influence of
morphology on test results. The aim of the current section was to investigate whether
the biochemical characteristics of hair vary with curvature.
Method: Natural scalp hair of varying morphology was collected from 128 healthy
volunteers and grouped according to geometrically measured hair curl; for practical
reasons 53 samples were used for this component of the study. The biochemical
profile of unprocessed whole hair fibres was non-destructively assessed using
Attenuated Total Reflectance-Fourier Transform Infrared Micro-spectroscopy.
Relative total lipid content of pulverized hair samples was assessed using the Sulfo-
Phospho-Vanillin assay.
Results: The total internal lipids of geometrically grouped hair samples were highest
in the curly hair compared to straight hair. When the biochemical analysis of
unprocessed geometrically classified whole hair fibres was investigated, there was a
trend toward higher absorbance of lipid associated bands for curly hair groups (V to
VIII or 5 and 6).A supervised statistical approach applied to 4 hair groups using the
FTIR data improved classification success to 79% (range: 69% – 88%).
Conclusion: Based on FTIR analysis a geometric classification with 4 groups may be
more reliable than an 8 or 6-group system. Confirmation of such a system is however
needed for the reliable use of hair as testing substrate in Medicine.

43
3 INTRODUCTION
The biochemical composition of the hair shaft has long been reported to be uniform
across different racial groups 55,93,134–137. However, recent studies are increasingly
reporting that chemical composition may actually vary with hair morphology62,73. Using
differential scanning calorimetry (DSC) and 2-D gel electrophoresis experiments,
Porter et al. showed variations in the thermal characteristics and staining intensities of
intermediate filaments of hair samples from different ethnic groups62. Cruz et al.73
reported that African hair had the highest total lipid content, followed Caucasian and
Asian hair. The authors used confocal microscopy and computational simulation
techniques to demonstrate that the arrangement of internal lipids in the hair matrix
influence the secondary structure of keratins and keratin associated proteins73.
Internal lipid material is present in the cell membrane complex (CMC) that binds cuticle
and cortical cells99,138.The CMC is composed of a δ-layer and β-layer. The δ-layer is
made up proteins and glycoproteins and it makes up the intercellular cement99,139,140,
while the β-layer is a thin layer of lipids100,141. There are two classes of lipids that have
been identified in the CMC; internal, free lipids and integral, bound lipids39,99, also
referred to as integral hair lipids (IHL)101. Free fatty acids, sterols and polar
components make up the internal lipids and are extractable with organic solvents102.
Integral lipids are composed of stearic, palmitic and 18-methyleicasonoic acid and are
covalently bound onto hair fibres via ester linkages105,140. The latter group is only
extractable by hydrolysis with a strong alkali100,142.
The biochemistry of whole hair fibres can be assessed non-invasively using
techniques such as synchrotron radiation, Fourier Transform Infrared (or Raman)
spectroscopy. These techniques are also used to investigate changes in hair
biochemistry arising from changes in health status107,113,114; hair sampled from breast
and colon cancer patients reportedly has different X-ray diffraction patterns than that
of healthy volunteers108,115, while FTIR may be able to differentiate breast cancer from
non-breast cancer patients and even separate those that did (and not) have the cancer
resected107. This makes FTIR a promising non-invasive diagnostic tool for the early
detection of cancers116,117,143.

44
FTIR is an ambient temperature analytical method that can directly monitor the
vibrations of functional groups that characterize molecular structure by irradiating
samples in the mid-infrared region (4000 to 400 cm-1))144.The sample absorbs the
electromagnetic radiation and converts it to vibrational energy of the chemical bonds
that join the atoms of the molecule. Different molecules absorb at different
wavelengths and this depends on the masses of the atoms, the force constants of the
bonds as well as the geometries of the masses of the atoms. In order for a molecules
to be IR active, there must be a change in its electric dipole moment during vibration145.
The vibrational modes that are usually observed in keratin polypeptides are the Amide
I – VIII bands, C-H stretching bands from lipids and bands from nucleic acids. The
Amide I band are arises from carbonyl stretching, amide II is due mostly from NH
bending vibrations146.The bands of interest as assigned in the current study are
indicated in figure 3.2 below.
Figure 3-1 Vibrations responsible for Amide I and Amide II bands. Illustration taken from
Gallagher 1997146.
The equation for absorption wavenumbers and related parameters is as described
below:
𝒗 = 𝟏
𝟐𝝅𝑪 √
𝒌
𝝁 Equation 4-1
Where
ѵ is the IR absorption wavenumber
C is the propagation velocity of electromagnetic waves;
k is the force constant of a chemical bond, and
μ is the reduced mass, with μ = 𝒎𝟏𝒎𝟐
𝒎𝟏+ 𝒎𝟐 Equation 4-2
IR absorption follows Beer-Lamberts law and thus the peak absorption intensity is
directly proportional to molecular concentration of a said material.

45
The FTIR absorption peaks observed in the study were assigned as laid out in the
band assignment in Table 3-2.
In the chemical or pharmaceutical industries, FTIR is commonly used routinely in
process control144, to identify unknown compounds or to assess the purity of materials.
In biochemical applications, FTIR can provide information about the content of the
secondary structure of proteins and lipids146 .In hair research ,FTIR instruments can
be used on ATR (attenuated total reflectance) mode which allows the analysis of hair
fibres with very little or no sample preparation116,143,147.
Figure 3-2 Typical FTIR spectrum of intact human hair fibre.
The regions of the IR spectra that are reportedly altered in breast cancer patients are
the C-H bending absorptions at 1500 – 1400 cm-1, 1739 -1740 cm-1 resulting from lipid
esters, 1240 cm-1 from C-H lipid, 1161 cm-1 C-O-C stretching in lipids and at 1055 cm-
1 from cholesterol107. These changes in lipid content are thought to result from an
increase in the lipid material in the δ- layer of the cuticle – cortex cell membrane
complex (CMC)106,107,118 as well as from fatty acid synthases that are expressed in
cancerous cells107,119. Baseline understanding of hair lipids is however crucial for

46
accurate interpretation of test results that depend on lipid variation as a biomarker of
disease.
The aim in the current chapter was thus to investigate the relationships that may exist
between hair curl and biochemistry, specifically lipid characteristics.
3.1 MATERIALS AND METHODS
3.1.1 Sample Collection and Preparation
Hair from 53 volunteers, out of the 128 that had been classified using geometric
templates (chapter two) was used for this exploratory study. Representative samples
were included from each of the 8 hair curl group for quantification of total internal lipids
and FTIR micro-spectroscopy. Care was taken to use the first 6cm of hair fibers for
analysis in order to minimize introducing confounding variability arising from
environment damage and other external features.
3.1.2 Total Internal Lipid Quantification
3.1.2.1 Lipid extraction
External lipids were removed from the hair surface by placing whole hair fibres in
glass tubes with 1ml of hexane93 (S303 K02/0415, Kimix South Africa) for 5 minutes
at room temperature. Hair samples were then dried and placed into suitable sample
tubes for pulverisation. Samples were pulverised with an Omni Bead Ruptor (Omni
International Inc.) using two cycles of pulverization (60 seconds long at speed setting
5 with a 2 second pause in between cycles. One milligram (1mg) of pulverised hair
was then used for total internal lipid extraction. Endogenous hair lipids were extracted
in glass vials using a serial extraction with 2:1, 1:1 and 1:2 v/v mixtures of
CHCl3:CH3OH (Chlorofrom: Methanol) (S327 K15/05/15, TAP10042965 K02/0415,
Kimix, South Africa) for two hours each at room temperature followed by an overnight
extraction at 4 C with 100% methanol 73,100. Extracts from each mixture were pooled
and concentrated using a miVac Quattro concentrator (United Scientific, South Africa)
at 30 C for 45 minutes.

47
Care was taken not to heat extracted lipids beyond 35 C to minimise degradation of
extracted lipids98 during drying. One millilitre (1ml) of HPLC grade methanol was used
to reconstitute the dried lipids for analysis. When not analysed immediately, extracted
lipids were stored in methanol at 4 C until total lipid content quantification using the
Sulfo-phospho Vanillin (SPV) Assay148.
3.1.2.2 Sulfo-Phospho-Vanillin Assessment Assay of Total Lipids
The Sulfo-phospho Vanillin Assay method is a colorimetric assay for the quantification
of total lipids. The assay is a two-step reaction, the first of which is the reaction of
unsaturated lipids at 100 C with concentrated sulphuric acid (H2SO4) to yield
carbonium ions. The vanillin reagent is made by reacting vanillin (4-methoxy-3-
hydroxy-benzaldehdye, C8H8O3) with phosphoric acid, yielding vanillin phosphate.
Phosphate esters from the vanillin reagent then react with the carbonium ions formed
in the first step of the assay, yielding a pink complex that can be measured
spectrophotometrically149,150.The intensity of the complex depends on the composition
of unsaturated fatty acids present. Oleic acid yields more intense colour than linoleic
acid which in turn has a more intense colour than cholesterol151. Table 3.1 below
shows the composition of standard used (sunflower oil) for the assay152.
Table 3-1 The main unsaturated fatty acids found in sunflower oil.
Unsaturated fatty acids in Sunflower Oil Content (%)
Palmitic Acid (C16:0) 6.07
Stearic acid (C18:0) 3.57
Oleic Acid (C18:1) 28.7
Linoleic Acid (C18:2) 60.0
Linolenic Acid (C18:3) 0.22
Arachic Acid (C20:0) 0.25
Behenic Acid (C22:0) 0.71
The vanillin reagent was prepared by dissolving 2mg of vanillin (Sigma Aldrich,
BCBN9635V) in 10ml of 1:5 mixture of 85% phosphoric acid (Sigma Aldrich,
STBF0263V)) in distilled water. The vanillin assay was first developed and used for
the quantification of total lipids in serum150 and has been adapted for use in multi-well
plates for higher lipid analysis throughput148,153. For the assay, 50µl of extracted lipids

48
in 100% methanol and prepared standards were transferred into glass test tubes and
the solvent was evaporated by placing onto a heating block at 90 C – 100 C for 5
minutes. A standard curve was made with sunflower oil at a concentration range of 0
– 3mg/ml. Ideally, the choice of standard used should be adapted to the sample or
materials being analysed, however for convenience, sunflower oil can be used151
because it is rich in unsaturated fatty acids152.
One hundred microliters (100 µl) of concentrated sulphuric acid were added to glass
test tubes, mixed gently and incubated on the heating block at 90 C – 100 C for 10
minutes. Samples were then removed from the heating block and cooled at 4 C for 5
minutes before being transferred into a 96-well plate. Background absorbance of
samples was read at 540nm using a Modulus Microplate reader (Promega
Biosystems, Sunnyvale, CA, USA). Fifty microliters of freshly prepared Vanillin reagent
was added into each well, mixed by gently pipetting and incubated at 37 C for 15
minutes. Absorbance was read again at 540nm. Total lipid content was calculated from
the sunflower oil derived standard curve.
3.1.3 Fourier Transform Infrared Microscopy of Whole Hair Fibres
The biochemical profile of whole hair fibres was investigated using Attenuated Total
Reflectance Fourier Transform Infrared (ATR-FTIR) Microspectroscopy according
manufacturer instructions (Bruker LUMOS, Bruker Optik GmbH 2014). Samples were
collected and cleaned as described in chapter two. Three 2 cm strands of hair were
taken from a minimum of 5 randomly selected volunteers from each of the 8 hair curl
groups. Each strand was measured at three different positions 1cm apart to assess
variation across different areas of the shaft. ATR-FTIR absorption spectra were
obtained from 4000 to 400 cm-1 using 64 scans at a resolution of 4 cm-1 with a midband
mercury cadmium telluride (MCT) detector. The detector was cooled with liquid
nitrogen for at least 30 minutes prior to sample analysis. The ATR germanium (Ge)
crystal with a diameter of 100μm was set at medium pressure for the acquisition of
spectra.

49
3.2 RESULTS AND DISCUSSION
3.2.1 Total Lipid Content
The total lipid content of different hair groups was assessed using the Vanillin Assay.
The method is a quantitative technique for unsaturated fatty acids149,153. The efficiency
of the SPV approach is consistent with standard gas chromatography analysis, as
demonstrated in a lipid assay for microalgae 154.
Although attempts were made to collect similar numbers of samples from each group,
the 8-group method that was used initially was later shown to be unreliable (chapter
two) – thus resulting in unequal numbers in the hair groups. Internal free lipids were
extracted from a minimum of two volunteers per hair group. The data did not follow a
Gaussian distribution and there was a lot of variation within groups. To gain insight in
the observed variation between hair groups and reduce their influence on overall
results, outliers (Interquartile range *1.5) in the box and whiskers plot (Figure 3-3) were
excluded and results reanalysed. The median total internal lipid of the curliest hair
groups (VII and VIII) was significantly higher than that of the straightest hair groups (I
and II).The same trend was observed in the 6-group geometric classification.
Interestingly, the median total internal lipid content of group V was also significantly
lower than that of groups VII and VIII, while hair group 5 was significantly lower than
group 6.
Figure 3-3 Box and whiskers plot (median and IQR) showing the distribution of total internal
lipids across 8 hair curl groups. (Group I (n = 2), II (n = 7), III (n = 5), IV (n = 3), V (n = 3), VI
(n = 5), VII (n = 11) & VIII (n = 3)).
010
20
30
40
To
tal Lip
id C
onte
nt (u
g/u
l) p
er
mg o
f h
air
Hair Curl Group
Total Lipid Content of 8 Hair Curl Groups
I II
III IV
V VI
VII VIII

50
The total lipid content results obtained from the volunteers across the 8 hair curl
groups were then arranged according to self-assigned racial group in order to assess
the relationship between race and total lipid content. The median total lipid content
(Figure 3.4) of hair volunteers who self-declared as ‘African” and “Mixed race” were
significantly higher than the Caucasian group [(p<0.05) and (p<0.01) respectively]
Total Lipid Content Distribution According to Race
Asian Caucasian Mixed Race African0
10
20
30
40
50
*
**
***
Racial Group
To
tal L
ipid
Co
nte
nt
(g
/l)
Figure 3-4 Box and whiskers plot (median and interquartile range) showing the
distribution of total internal lipids in 4 racial groups.
These observations were similar to those made by Cruz et al who reported that the
total lipid content of African hair was higher than that of Asian and Caucasian
volunteers73. The total internal lipids quantified in this study are thought to be the
unsaturated fatty acids (FFAs) such as oleic (C18:1) and linoleic acid (C18:2n-6) and
polysaturated Fatty Acids (PUFA) (C18:2, C18:3) present in the hair155.
Internal hair lipid levels were investigated in the current study in order to establish the
baseline quantities of internal hair lipid across of hair with varying degrees of
curvature. This was done in order understand the possible role of lipids in how lipid
soluble substances are incorporated into the growing hair shaft. It is acknowledged
that factors such as diet could have a confounding effect on these lipids. Is it also
possible that exogenous lipids were incorporated from hair maintenance products
although all surface lipids should have been removed when the hair was cleaned and
flushed hexane wash99,100.

51
3.2.2 Fourier Transform Infrared Micro-spectroscopy
The biochemical profile of whole hair fibres, from the cuticle inwards, was measured
in the medium IR region, which spanned the fingerprint and functional group regions
of the IR spectrum. The fingerprint region is the region below 1300 cm-1 while the
region beyond that is the functional group region156. A representative ATR-FTIR
spectrum acquired from the hair is shown in Figure 3-2. Variations in functional group
region of hair spectra from different hair groups were first investigated by comparing
the absorbance of selected IR bands. The selected bands were some of the
characteristic bands observed in the spectra of proteins and amino acids. C-H
stretching (usually assigned to lipids) at 2957cm-1, Amide I band at 1637 cm-1 and
Amide II at 1531cm-1. These bands were also selected because they could be
discerned without the requirement of spectral processing. Correlations between these
bands and hair morphology would thus allow for rapid classification of hair for practical
applications.
The peak absorbance of 0-H stretching band from H2O was excluded. The peak area
was measured relative to the local baseline. Other peaks that were observed in the
spectra of whole hair fibres but were excluded for the current comparisons are listed
in Table 3-2. An illustration of peak position and integration can be found in Appendix
3-1.
Two representative volunteers were randomly selected from each the 8 hair groups to
explore the variations in adsorption of bands of interest. Three strands were assessed
for each volunteer and each strand was measured in 3 positions along the length of
the hair shaft. Sixty-four spectra were captured in each position and one
representative spectrum was generated for each position.

52
Table 3-2 Band assignment chart for FTIR absorbance147
3.2.2.1 Biochemical Variation between Racial Groups
The FT-IR data was not normally distributed, no spectral processing was applied to
the data and median and interquartile ranges were therefore used for all comparisons.
The Kruskal Wallis with Dunn’s post-hoc test was used for all statistical analysis,
except where otherwise indicated. Figure 3-5 shows the variation observed in the band
absorbance of C-H, Amide I and Amide II bands across the three racial groups. The
results for the statistical analyses are reflected in Figures 3-6 and 3-8.
Figure 3-5 FTIR absorbance of different racial groups
0
0.05
0.1
0.15
0.2
0.25
C-H Amide I Amide II
Ab
sorb
ance
(a.
u))
IR Band
FTIR Absorbance of 3 Racial Groups
Caucasian
Mixed Race
African
Wavenumbers (cm-1) Assignment
Left edge Right Edge
3669.1000 3119.4000 OH (H2O)
3113.5600 3025.8400 Unknown
2996.6000 2949.8200 C-H
2949.8200 2903.0400 C-H
2897.1900 2832.8600 C-H
1721.7000 1575.5000 Amide I
1587.2000 1482.0000 Amide II
1481.9800 1429.3400 -CH3
1429.3400 1359.1700 CH3 deforms

53
Statistically significant differences were observed for the median total lipid across
racial groups. The absorbance of C-H stretching vibrations of African hair significantly
higher than that of Caucasian (p < 0.01) and Mixed race (p < 0.05) hair. This confirmed
the elevated total lipid content obtained with the Vanillin Assay.
C-H Absorption vs Race
Caucasian Mixed Race African0.00
0.01
0.02
0.03
0.04
**
***
*
Race
Absorb
ance (
a.u
)
Figure 3-6 Absorbance of C-H band across racial groups
No statistically significant differences were observed between the absorbance of
Caucasian and Mixed race racial groups. Asian hair samples were not included in the
current analysis as a consequence of random sampling. The absorption of Amide I
and II bands was significantly lower for African hair (p < 0.01 and p < 0.001). No
significant differences were observed between Caucasian and Mixed race groups. The
absorbance of the Amide II band was lower than that of Amide I, as expected and
observed in the spectra in Figure 3-5.
Figure 3-7 Absorbance of Amide I and Amide II bands across different racial groups.
Amide I Absorption vs Race
Caucasian Mixed Race African0.00
0.05
0.10
0.15
0.20
0.25**** ******
Race
Absorb
ance (
a.u
)

54
The position of the Amide I and Amide II band are related to the structural
conformations in the biological sample; Amide I at approximately 1652 cm -1 and
Amide II at approximately 1548 cm-1 are indicative of α-helical conformation of tertiary
proteins114,146. An Amide I band at 1630 cm -1 with an Amide II band between 1515 –
1525 cm-1 indicate proteins that have a β-sheet conformation146,157. The keratin
conformation observed in the current study was closer to the ranges of the β-sheet
form, indicating the IR radiation did not did not reach the hair cortex.
3.2.2.2 Biochemical Variation across Hair Curl Groups
The variation observed in the biochemical profile of different hair curl groups was
assessed using the Kruskal Wallis test with Dunn’s post-hoc test (GraphPad Prism
Version 5). The hair groups with high curvature (V – VIII) were generally observed to
have greater peak area for the lipid region (C-H). Some of these observed differences
were statistically significant (p < 0.001 to p < 0.05) (Figure 3-8).The groups that have
statistically significant variations are denoted by identical symbols, the level of
statistical significance is illustrated by the weight of these symbols, for example +
denotes a statistically significant variation with a p < 0.05, ++ denotes p < 0.01 and
+++ denote p < 0.001. The band absorbance of hair group V was significantly higher
than that of hair groups I, III and IV, while hair group VII was lower than hair groups II
and IV (p < 0.001). The tendency of curly hair groups to have greater peak absorbance
in the lipid was more consistent in the 6-group classification system (that was shown
to be more reliable in Chapter 2), where hair groups 5 and 6 had the highest median
peak absorbance. These were significantly higher than groups 1, 2 and 3 (Figure 3-
8). The absorbance of the lipid band did not differ between groups 5 and 6.
A comparison of another lipid peak at 1481 cm-1 is shown in Addendum 1 in this report.
Variations for this cancer associated peak were uniform across hair all groups for the
6-group classification, reflecting that this band could be a good region to focus on to
monitor changes in lipid content in cancer patients across different hair types.
For the absorption of Amide I and II, curly hair groups were observed to have lower
peak areas in both regions, and this was more consistent when hair morphology was
categorised into 6 groups instead of 8.

55
Hair group V absorbed less amide I than groups II to IV, while the absorbance in group
VII was lower than that of groups I, III, IV and interestingly VIII. (Figure 3-8, bottom
panel). The same was observed for the 6-group classification; hair group 5 was
significantly lower than hair groups 1, 3 and 4. The median amide II absorbance of
hair group V was lower than that of hair groups I to IV (p < 0.001) (Figure 3-9), while
hair group III was statistical higher than the highest curvature hair groups (V to VIII) (p
< 0.05), for the 8-group classification. For the 6 group classification, there was
significant variation between low (1 to 3) and high curvature hair groups (5 and 6). The
absorption of Amide II by hair groups 5 and 6 was significantly lower than 2, 3 and 4
(p < 0.001 to p < 0.05). Hair group 1 could not be shown to be statistically different
from any of the other hair groups. In most instances, no statistically significant
differences were observed between straight hair groups (I to IV), reflecting a level of
possible biochemical homogeneity in these hair types.
There were no clear correlations between biochemistry and geometry for the 8 group
classification. There were however some discernible trends between the biochemical
characteristics and different hair groups for the 6-group geometric classification where
high curvature hair groups tended to have higher lipid content and lower amide I and
amide II absorption. It is thus likely that biochemical variations are easier to detect
when hair curl groups are fewer because in the 6 group classification, the high
curvature are reduced from 4 to 2 groups. It is however still likely that the 3 racial
groups are not only subjective but are too few.

56
Ab
so
rban
ce o
f lipid
asso
cia
ted
ban
dacro
ss 8
hair c
url g
rou
ps
III
IIIIV
VV
IV
IIV
III0.0
0.2
0.4
0.6
0.8
1.0
***
***
+++
+++
**
**
$$
$
$$
$
///
///
Ha
ir Cu
rl Gro
up
Peak Area (a.u)
12
34
56
0.0
0.2
0.4
0.6
0.8
Ab
so
rban
ce o
f lipid
asso
cia
ted
ban
dacro
ss 6
hair c
url g
rou
ps
+++
+++
++
++
+
+
***
***
Ha
ir Cu
rl Gro
up
Peak Area (a.u)
III
IIIIV
VV
IV
IIV
III0 2 4 6 8
10
Am
ide II A
bso
rptio
nacro
ss 8
hair c
url g
rou
ps
+++
+++
++
++
******
//////
\\\\\\
\\
\\
^^^
^^^
!!!!!!
!!!!
Ha
ir Cu
rl Gro
up
Peak Area (a.u)
III
IIIIV
VV
IV
IIV
III0 5
10
15
20
Am
ide I A
bso
rptio
nacro
ss 8
hair c
url g
rou
ps
******
+++
+++
++
//////
\\\\\\
*
*$
$$
$$
$
!!!!!! !
!#
#
Ha
ir Cu
rl Gro
up
Peak Area (a.u)
12
34
56
0 5
10
15
Am
ide I A
bso
rptio
nacro
ss 6
hair c
url g
rou
ps
+++
+++
++
++
+
+
******
**
//////
\\\
\\\
Ha
ir Cu
rl Gro
up
Peak Area (a.u)
12
34
56
0 2 4 6 8
10
Am
ide II A
bso
rptio
nacro
ss 6
hair c
url g
rou
ps
***
***
+++
+++
&&
&&
&&
&&
//////
\\\\\\
!!!!!!
^^^
^^^
Ha
ir Cu
rl Gro
up
Peak Area (a.u)
Fig
ure
3-8
Sig
nific
ant d
iffere
nce
s o
bse
rve
d in
the s
ele
cte
d F
T-IR
ban
ds fo
r the 8
an
d 6
-gro
up
cla
ssific
atio
ns. M
edia
n a
nd
IQR
.
F
igu
re 3
-8 s
tatis
tica
lly s
ign
ifica
nt d
iffere
nces o
bse
rve
d in
the s
ele
cte
d F
TIR
ban
ds fo
r the 8
an
d
6-g
roup c
lassific
atio
ns. M
ed
ian a
nd
IQR
. F
igu
re 3
-9 A
mid
e II b
an
d a
bso
rptio
n b
y
diffe
rent h
air c
url g
roup
s. M
edia
n a
nd
IQR
.

57
3.2.2.3 Discriminative analysis of hair groups by ATR-FTIR
The capability of ATR-FTIR to discern the variation observed between the different
hair groups and correctly identify which hair group the spectra originated from was
explored. Principal component analysis (PCA) applied to the full FTIR data obtained
from 53 volunteers. Each volunteer had multiple spectra as described in the methods
section. Spectra that were clearly outliers, possibly reflecting poor contact between
the ATR crystal and the test sample were excluded. This was indicated by spectra
whose absorbance was lower than the majority of the spectra for a particular
individual.
3.2.2.3.1 Variations in ATR-FTIR Spectra of Different Hair Curl Groups
Figure 3-10 is a scatter plot from a PCA showing the variations between and within
the different hairs. Up to four components were retained and the PCA did not reflect
any distinct hair groups. The first four components explained more than 80% of the
observed variation between the hair groups. Variation was also observed within some
of the hair curl groups.
Figure 3-10 PCA-X scatter plot of FTIR spectra from 8 hair curl groups

58
Orthogonal partial least squares discriminative analysis (OPLS-DA) (SIMCA, Version
14.1 MKS Umetrics) was used to investigate the validity and uniqueness of the 8 hair
curl groups. OPLS-DA fits an OPLS model using dummy variables and interprets
variation in X. The X variable is orthogonal to Y (SIMCA, Version 14.1 MKS Umetrics).
Figure 3-11 is an example of the scatter plot post pairwise OPLS-DA applied to hair
curl groups I and II. The scatter plot shows that the majority of the spectra from hair
group I could be discriminated from that of hair group II. The variation between the
groups is observed along the x-axis, while the variation with the groups is observed
the y-axis.
Figure 3-11 Pairwise Orthogonal Partial Least Squares Discriminative Analysis of hair
groups I and II.
Pair-wise OPLS-DA was applied to all pairwise combinations found in the 8-group
classification. Most of the groups could correctly predict the group membership of most
of its spectra. Table 3-3 is a misclassification table showing the results of the pairwise
OPLS-DA between major groups. The first column shows the chosen pairs, the second
column shows the number of spectra in each group and the third column is the % of
spectra that were correctly assigned to their original group by each prediction model.
Table 3-3 Summary of Orthogonal Partial Least Squares Discriminative Analysis

59
Summarized Misclassification Table
Class Pairs Members Correct (%) Fisher's prob.
I 47 91.49
II 99 98.99 3.8 e-031
II 99 58.59
III 133 77.44 2.1e-008
III 133 96.99
IV 56 98.21 1.2e-041
IV 63 100
V 43 88.37 1.1e-023
V 43 100
VI 35 97.14 2.4e-021
VI 43 97.14
VII 49 100 9.5e-023
VII 54 100
VIII 26 100 1.3e-021
The groups could be discriminated for more than 50% of the spectra for each pairwise
OPLS-DA, the worst discrimination was observed between hair groups II and III, as
reflected by a correctly classified score of 58.59. In the comparison between these two
groups, 41 out of the 99 spectra from group II were incorrectly classified as belonging
hair group III and 30 spectra belonging to hair group III were given class membership
of group II. The misclassification table for the OPLS-DA of all 8 hair groups is shown
Table 3-4 .
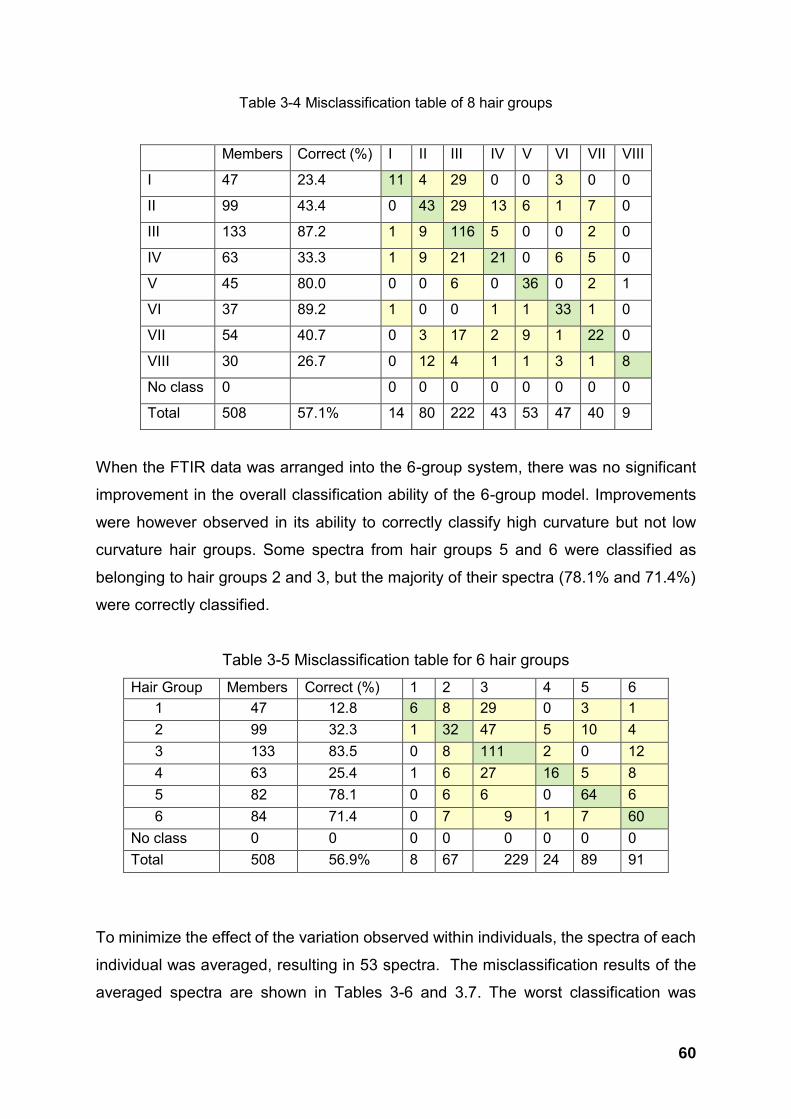
60
Table 3-4 Misclassification table of 8 hair groups
Members Correct (%) I II III IV V VI VII VIII
I 47 23.4 11 4 29 0 0 3 0 0
II 99 43.4 0 43 29 13 6 1 7 0
III 133 87.2 1 9 116 5 0 0 2 0
IV 63 33.3 1 9 21 21 0 6 5 0
V 45 80.0 0 0 6 0 36 0 2 1
VI 37 89.2 1 0 0 1 1 33 1 0
VII 54 40.7 0 3 17 2 9 1 22 0
VIII 30 26.7 0 12 4 1 1 3 1 8
No class 0 0 0 0 0 0 0 0 0
Total 508 57.1% 14 80 222 43 53 47 40 9
When the FTIR data was arranged into the 6-group system, there was no significant
improvement in the overall classification ability of the 6-group model. Improvements
were however observed in its ability to correctly classify high curvature but not low
curvature hair groups. Some spectra from hair groups 5 and 6 were classified as
belonging to hair groups 2 and 3, but the majority of their spectra (78.1% and 71.4%)
were correctly classified.
Table 3-5 Misclassification table for 6 hair groups
Hair Group Members Correct (%) 1 2 3 4 5 6
1 47 12.8 6 8 29 0 3 1
2 99 32.3 1 32 47 5 10 4
3 133 83.5 0 8 111 2 0 12
4 63 25.4 1 6 27 16 5 8
5 82 78.1 0 6 6 0 64 6
6 84 71.4 0 7 9 1 7 60
No class 0 0 0 0 0 0 0 0
Total 508 56.9% 8 67 229 24 89 91
To minimize the effect of the variation observed within individuals, the spectra of each
individual was averaged, resulting in 53 spectra. The misclassification results of the
averaged spectra are shown in Tables 3-6 and 3.7. The worst classification was

61
observed for hair groups II, IV and VI where none of their group members were
correctly classified. All the members belonging to hair group II & VI were classified as
hair group III, while 6 out the 7 members of group IV were classified as group III. Hair
groups III and V had the best classification, with 100% of their members being correctly
classified. The total classification score for the averaged spectra was 35.85%.
Table 3-6 misclassification table of averaged spectra (8 hair groups)
Members Correct I II III IV V VI VII VIII No
class
(YPred
<= 0)
I 5 20% 1 0 4 0 0 0 0 0 0
II 8 0% 0 0 8 0 0 0 0 0 0
III 11 100% 0 0 11 0 0 0 0 0 0
IV 7 0% 0 0 6 0 1 0 0 0 0
V 5 100% 0 0 0 0 5 0 0 0 0
VI 4 0% 0 0 4 0 0 0 0 0 0
VII 8 12.5% 0 0 4 0 3 0 1 0 0
VIII 5 20% 0 0 3 0 1 0 0 1 0
No
class
0 0 0 0 0 0 0 0 0 0
Total 53 35.85% 1 0 40 0 10 0 1 1 0
Fisher's
prob.
3.1e-005
Table 3-7 OPLS-DA Misclassification table of averaged spectra (6 hair groups)
Members Correct 1 2 3 4 5 6 No
class
(YPred
<= 0)
1 5 0% 0 0 3 0 1 1 0
2 8 0% 0 0 6 0 2 0 0
3 11 100% 0 0 11 0 0 0 0
4 7 0% 0 0 3 0 3 1 0
5 8 37.5% 0 0 2 0 3 3 0
6 11 36.36 0 0 5 0 2 4 0
No class 3 0 0 0 0 0 0 0
Total 53 36.0% 0 0 30 0 14 19 0
Fisher's
prob.
0.023

62
3.2.2.4 Predictive models for FTIR hair classification
The variation observed in the average d spectra was also investigated by multiple
linear regression (Statistica). For this, hair morphology was treated as a continuous
variable, with the straightest and curliest hairs being 1 and 8 respectively. The full FTIR
spectrum (500 to 4000cm-1) was condensed by taking every 10th wavenumber and
discriminative analysis was conducted on every 10th scan. A linear regression model
consisting of 8 variables (obtained by variable selection) showed that 78% of the
variance in hair curl is explained by the proposed model (Figure 3-12). These
observations were validated using leave-one out cross validation method and the
calculated R2 was 0.6713 and the mean squared error (MSE) was 1.625.
Figure 3-12 Multiple linear regression model of the relationship between hair morphology
and spectroscopy.
The multiple linear regression model when hair curl is treated as a continuous variable
from 1 to 8 is shown below in Equation 3-3:
Ŷ=W2038.84+W1814.57+W2446.61+W1304.86+W1284.47+W1406.80+W2181.56+
W2120.39+W2507.77 Equation 3-3
Predicted vs. Observed Values
Dependent variable: Hair Curl group
0 1 2 3 4 5 6 7 8 9
Predicted Values
0
1
2
3
4
5
6
7
8
9
Obse
rved V
alu
es

63
Where Ŷ is the predicted hair curl. The W are the different wavenumbers that
contributed to the model. The regression summary for the model is show below in
Table 3-8.
Table 3-8 Regression for hair curl (8 hair groups)
Regression Summary for Hair Curl
R = 0.8844
R2 = 0.7821
Adjusted R2 = 0.7303
Std. Error of estimate: 1.154
Wavenumber (cm-1) Coefficient (b*) p-value
Intercept 0.000910
2038.84 -4.476 0.01014
1818.57 0.523 <0.0001
2446.61 25.697 <0.0001
1304.86 3.780 <0.0001
1284.47 -3.052 <0.0001
1406.80 -0.809 <0.0001
2181.56 -30.148 <0.0001
2120.39 19.563 <0.0001
2507.77 -10.745 <0.0001
When a multiple linear regression model with a hair curl scale of 1 to 6 was fitted
(Figure 3-13), better correlation was noted between the observed and predicted values
(R2 = 0.8137).
The linear regression model for this scale (1 to 6) was:
Ŷ=W1814.57+W2038.84+W1733.01+W2711.65+W2752.43+W2344.66+W1610.68+
W3139.81+W3078.65+W2222.33 Equation 3-4

64
Figure 3-13 Multiple linear regression model of the relationship between hair morphology
and spectroscopy of 6 hair curl groups.
When the model was validated with leave-one out cross-validation, the observed R2
was 0.7497 and MSE was 0.705. The model for a 6-group hair classification was thus
better than that of a classification with 8 groups; R2 =.0.8167 vs R2 = 0.7821. The
regression summary for the 6 groups is shown below in Table 3-9.
Predicted vs. Observed Values
Dependent variable: 6groups
0 1 2 3 4 5 6 7
Predicted Values
0
1
2
3
4
5
6
7
Obse
rved V
alu
es
0.95 Conf.Int.

65
Table 3-9 Regression summary for hair curl (6 groups)
Regression Summary for Hair Curl
R = 0.9020
R2 = 0.8137
Adjusted R2 = 0.7629
Std. Error of estimate: 0.811
Wavenumber (cm-1) Coefficient (b*) p-value
Intercept 0.4399
1814.57 0.821 <0.0001
2038.84 -3.489 <0.0001
1733.01 -0.736 <0.0001
2711.65 41.004 <0.0001
2752.43 -32.189 <0.0001
2344.66 -0.236 0.0114
1610.68 1.999 <0.0001
3139.81 4.135 <0.0001
3078.65 -5.089 <0.0001
2222.33 -4.735 <0.0001
A supervised approach was then applied to the data set; the original 8 hair groups
were merged into 4 groups ( I & II (A), III & V (B), V & VI (C) and VII & VIII (D)) and the
variation between these groups was investigated with partial least squares
discriminative analysis. Three principal components were retained. The resubstitution
classification matrix is shown in Table 3-10, the overall classification success was
higher than 79% across the 4 hair groups. Figure 3-14 is a scatterplot of the first 2
canonical scores from 4 hair groups. Four clusters of partially heterogeneous groups
can be observed. The kappa statistics investigation of a 4-group classification at
attached in this report as Addendum 2.

66
Table 3-10 Resubstitution classification matrix of 4 hair groups
Hair
Group
Percent Correct
( %)
1 2 3 4
A 69.23 9 3 1 0
B 83.33 2 15 0 1
C 88.89 1 0 8 0
D 79.92 0 3 0 10
Total 79.25 12 21 9 11
Figure 3-14 Scatter plot of canonical scores from 4 hair curl groups.
3.3 CONCLUSIONS AND FUTURE WORK
The total internal lipid content was highest in curly hair in both the 8 and 6 group
classification. This was consistent with findings of other workers that had racially
classified their hair samples73. The unique aspect of the current investigation was the
objective geometric classification that is geared towards minimizing variation that
arises from the heterogeneity of (i.e. more objective than) race based classification.
For the FTIR analysis, the peak areas of the C-H band were higher for curly compared
to straight hair groups, also indicating higher lipid content. Lipid variations of a cancer
Scatterplot of CSCR___2 against CSCR___1; categorized by 4groups
Spreadsheet207 5v*53c
CSCR___1
CS
CR
___2
4groups: 1
4groups: 2
4groups: 3
4groups: 4-4 -3 -2 -1 0 1 2 3
-3
-2
-1
0
1
2
3
4

67
associated peak were uniform across hair groups (shown in addendum 1). This
confirms that this band could be a suitable region to monitor changes in lipid content
in cancer patients.
Although there were no identifiable groups on PCA, more than 50% of spectra from
geometrically classified hair groups could be discriminated using pairwise OPLS-DA.
However, when average spectra per group were used, the 8-groups had a poor
averaged classification score (35.85%) which was similar to that for the 6-group
classification (36.0%). Further, predictive models were also similar for the 6 and the 8-
group classification (R2 =.0.8167 vs R2 = 0.7821).
The analysis of FTIR spectra suggested a correlation with biochemistry (internal lipid
content) for the extremes (i.e. straight versus curly) both the 8 and 6-group hair
classification. The wavenumbers that were statistically significant for the relationship
between FTIR and hair morphology are shown in Tables 3-7 and 3-8. Although
pairwise OPLS-DA comparisons do not provide evidence to merge groups, except hair
groups II and III, the 6 group classification is simpler because it excludes the hair count
requirement (as described in chapter two) without loss of information.
The FTIR investigation in this study was explorative, only participants with natural (not
chemically altered hair were investigated). It is suggested that future work should also
include investigations of the factors (e.g. age, gender, hair preparation) that may
contribute to the variability in hair spectra of healthy volunteers. Such influence on
FTIR should be taken into consideration when interpretation changes in hair chemistry
that arises from certain disease.
Overall, the relationship between hair geometry and biochemistry was more consistent
in the 6 group classification than in the 8. Therefore it is likely that biochemical
variations are easier to detect when hair curl groups are fewer. Compared to the 8
group, in the 6-group classification the curly hair is effectively reduced from 4 to 2
groups. Consistent with improved reliability for fewer groups, when a supervised
statistical approach was applied to 4 groups using the FTIR data classification success
improves from 36.85% (8 groups) and 36.0%(6 groups) to 79% (range: 69% – 88%).

68
Such a 4-group classification needs validation but seems more objective than using
racial groups to describe hair testing samples in clinical or research studies.

69
Ap
pe
nd
ix 3
-1 : In
teg
ratio
n o
f FT
IR b
an
ds fo
r pe
ak
are
a c
om
pa
rion
s
C:\O
ld G
Drive
20 M
ay 2
016\P
hD
\Jan +
Feb 2
016\F
inal d
ata
analy
sis
\Bio
chem
\FTIR
\Extra
cte
d S
pectra
2-3
Feb\F
or U
nscra
mble
r\I\14_2\1
4_2 s
1p1.2
14_2 s
1p1 G
e A
TR
Obje
ctive
2016-0
2-0
2
3280.42
3075.88
2958.102923.412852.05
1636.41
1525.68
1454.63
1387.441338.77
1235.88
1073.741000
1500
2000
2500
3000
3500
Wave
num
ber c
m-1
0.00 0.05 0.10 0.15 0.20 0.25
Absorbance Units
P
ag
e 1
/1

70
CHAPTER FOUR
MECHANICAL CHARACTERISTICS, HAIR GROWTH PARAMETERS AND ULTRASTRUCTURE OF HUMAN SCALP HAIR
ABSTRACT
Background: Human hair characteristics are commonly described using race;
however racial classification (Asian, Caucasian and African) is limited and unscientific.
A recently published geometric classification allows for less subjective investigation of
hair features. The aim of this study was to investigate relationships between hair
curvature using 2 classifications (I–VIII and 1-6; for straight to tightly curly hair) and
other physical characteristics [mechanical properties (elasticity, tensile strength, yield
extension and break extension), growth parameters (growth rate and hair density) and
ultra and micro structure].
Methods: Virgin hair from 128 volunteers was classified using published templates.
Mechanical characteristics were measured using a Miniature Tensile Tester and
growth parameters using a computerized trichogram as well as a formula based on
interscale distance (ISD) and diameter; samples were also imaged using Electron and
Fluorescent Light Microscopy (FLM) to elucidate ultra-structural difference.
Results: The yield strength of all hair groups was higher (> 100MPa) than published
data from racially assigned groups (58 MPa – 100 MPa). The straightest hair (group
1) had the highest average diameter and although this was not statistically significant
from that of high curvature hair groups. Hair groups 2 and 3 surprisingly had the
thinnest diameters even compared to curly hair groups. Overall the tensile strength
was lowest for the curliest hair groups, although there was no consistent correlation
(in elastic modulus, yield strength, Break strength and strain failure) with fibre
geometry.
The growth rate based on the TrichoScan® was fastest for the straightest hair (group1,
0.72 ± 0.3 cm/month) and slowest for the curliest hairs (0.39 ± 0.2 cm/month). Growth
rates based on ISD were haphazard and did not correlate with hair curl. This study is

71
the first to confirm that FLM gives similar results to TEM for visualization of cortical cell
in curly African hair (as previously reported for straight hair). There was also no
consistent correlation between density and fibre geometry.
Conclusion: This study suggests that the common assumption of 1.0cm growth rate
for all hair phenotypes may be incorrect. This may lead to incorrect estimation of drug
exposures for curly hair.

72
4 INTRODUCTION
Human scalp hair characteristics vary beyond morphology1,61,62,76. Straight hair is
reported to have a higher break stress and faster hair growth than hair with
curvature76,158. The hair cortex is the hair component that is largely responsible for the
mechanical properties of the hair fibre32,39. Hair cuticles cells form multiple layers over
the hair cortex22,protecting it from physical and chemical insult76. The contribution of
hair cuticles to the mechanical properties of the hair39. The distance between cuticle
cells is reported to be related to the rate of hair growth159; Baque et al. measured
interscale distance (ISD) and observed that straight hair from Japanese volunteers
was thicker, had shorter ISD and faster rates of hair growth, while curly hair the inverse
was observed for Caucasian volunteers with slightly curly hair159. Table 4-1 shows the
differences observed in the cross-sectional properties92 and surface properties92,159 of
African, Asian and Caucasian hair .
Table 4-1 Hair characteristics of hair 3 racial groups92,159
Race Shape No. of
cuticle
Cuticle Scale Interscale ISD Hair Growth
scales Thickness(µm) Distance Rate (mm/day)
African Oval-flat 6 - 7 0.3 - 0.5 - -
Asian Nearly oval 5 - 6 0.3 - 0.5 7.99 0.4335
Caucasian Nearly round 6 - 7 0.3 - 0.5 8.06 0.376
Recent advances in hair classification now allow for the investigation of correlation
with other hair features such as mechanical and physical properties beyond racial
categorization. Natural scalp hair can now be classified using 3 geometric parameters;
curve diameter, curl meter and the number of waves present 63,69 resulting in 8 hair
curl groups69. However, our investigation, using Kappa statistics, showed that that a
6-group classification is more reliable (chapter two).
4.1 Mechanical and Growth Parameters of Human Scalp Hair
4.1.1 Mechanical Properties of Scalp Hair
The tensile properties of human scalp hair are an important metric of its
strength160.Scalp hair with a high degree of curvature is reported to be least resistant
to mechanical extension and to exhibit profiles of premature failure92. African hair is

73
reported to have average yield strength of 58 MPa, while that of Asian and Caucasian
hair is 100 MPa and 67 MPa respectively and shown in Figure 4-2 and Table 4-2.
Furthermore, the tensile strength of African hair has been reported to be lower than
that of Caucasian or Asian hair137.
Figure 4-1 Stress and strain profiles of African , Asian and Caucasian hair160.
Table 4-2 Mechanical properties of hair from different races160
Mechanical Property African Asian Caucasian
Elastic modulus (GPa) 2.5 4.7 3.3
Yield strength (MPa) 58 100 67
Breaking strength (MPa) 101 139 117
Strain at failure (%) 20 32 35
4.1.2 Hair Growth Parameters (growth rate and density)
African hair is reported to have the slowest hair growth rate and to have the second
lowest hair density, after Caucasian hair158,161. African hair is reported to have a growth
rate of 256 ± 44 µm/day (0.6 - 0.9cm/month), Caucasian hair: 396 ± 55 µm/day (1.0 -

74
1.35cm/month)158,162. Hair analysis interpretations usually cite a blanket growth of
1.0cm per month for all racial groups3,6,17,126 and sampling 3cm as indicating a 3 month
exposure126. The rate of hair growth could influence levels of incorporation onto the
growing hair shaft and variations across hair groups elucidated and taken into for all
hair groups in order to correctly interpret results obtained for various hair
analyses120,126.
4.1.3 Structural Properties of Scalp Hair Cross-sections
The hair cortex, like wool, made up of 3 different three cortical cells types; ortho, para
and mesocortical cell types22,60,77,90,163. The differences between these cell types are
their biochemical composition22 .Orthocortical cells are reported to contain less matrix
between their intermediate filaments than paracortical cells and they have been shown
to have a lower sulphur content (~3%) than Paracortical cells (~5%) while that of
mesocortical cells is intermediate22.Correlations have between drawn between hair
morphology and arrangement of various cortical cells within the hair cortex90. Straight
hair groups are reported to be composed of predominantly paracortical cells, with a
layer of orthocortical and mesocortical usually observed adjacent to the hair cuticles
22,60,90. African hair has been reported to have higher proportions of orthocortical cells
than Caucasian77 and the cell types usually have an asymmetrically distribution on the
hair cortex cross-section60.
The aim of this chapter was to investigate relationships between hair curvature and
mechanical characteristics, hair growth parameters and ultrastructure. The
mechanical characteristics investigated were elastic modulus (elasticity), break stress
(tensile strength), yield extension and break extension. The hair growth parameters of
interest were hair growth rate and hair density. The ultrastructural details that the study
sought to elucidate were the arrangement of the cortical cells across different hair
groups.
4.2 MATERIALS AND METHODS
4.2.1 Participants and Samples
Permission to conduct the study was granted by the Faculty of Health Sciences,
Research Ethics Committee of UCT (HREC REF: 328 2012). Participants with at least

75
6cm of virgin hair (had not used any chemical straightener or dyes for > 7 months)
were invited to participate in the study via notices, fliers and university’s online
research invitations. After participants gave informed consent, an area of 0.56cm2 was
shaved from the vertex of the scalp. To prepare the hair samples for geometric
measurements, they were washed using a 1% sodium dodecyl sulphate (SDS)
solution, rinsed with warm water (37 C) and air-dried for a minimum of 4 hours.
Samples were then stored at room temperature until used for various assessments.
4.2.2 Geometric Characterization
Hair samples were classified were first classified into 8 geometric groups following
published templates and the rules69 as shown in Figure 4-2. Inter and intra-observer
data showed better reliability of a 6-group classification (chapter two). This was used
in the current study to investigate the relationships between hair geometry and
characteristics discussed below.
Figure 4-2 Hair classification rules for the 8-group geometric classification69.
4.2.3 Measurement of Mechanical Properties of Single Hair Fibres
The tensile properties of dry natural hair were measured using a Miniature Tensile
Test (MTT686, Dia-stron Ltd, Hampshire). The mechanical properties of single hair
fibres were measured using a 20 Newton (N) load cell and a strain of 12.5 mm/min.
The gauge force was set to 0.5g. All measurements were carried out in an

76
environmentally controlled chamber (Electro-tech systems, Inc) that was set at a
temperature and a relative humidity of 22 ± 5 C and 45 ± 5 %, respectively. All hair
samples were equilibrated in the environment chamber for 12 hours before mechanical
assessments. The elastic modulus, break stress, yield extension and break extension
were recorded for all hair groups.
4.2.4 Hair Growth Rate and Hair Density Assessments
4.2.4.1 Automated Hair Growth Assessment: TrichoScan®
Hair growth parameters (hair growth rate and hair density) were quantified using the
TrichoScan® platform. Hair density is reported as the number of hairs in an area of
0.562cm2 immediately after shaving (day 0). Our current license version of the
TrichoScan® software did not automatically calculate of hair growth. Instead, an output
of hair length frequencies (hair length versus count) was obtained. Image processing
platforms (MATLAB 6.1 and GRABIT (MATLAB and Statistics Toolbox Release 2012b,
The MathWorks, Inc., Natick, Massachusetts, United States)) were used to quantify
TrichoScan® outputs at each time point (day 0 and day 2). The combination of these
two image processing platforms allowed for the collection of “raw data” points. An
illustration of this is included as appendix 4-1. The collected raw data was used for
assessments of hair growth rate and hair density. Hair growth rate, in micrometres
(µm) per day, was calculated using equation 4.1.
𝐇𝐚𝐢𝐫 𝐠𝐫𝐨𝐰𝐭𝐡 𝐫𝐚𝐭𝐞 =(𝑫𝟐−𝑫𝟎)
𝟐 (Equation 4.1)
Where day 0 (D0) is the average hair length, measured immediately after shaving and
Day 2 (D2) is the hair length in the same area, measured at the second visit ,two days
later.
4.2.4.2 Manual Hair Growth Assessment Using SEM Micrographs
Hair growth rate was also calculated from interscale distance (ISD) and the hair
diameter as described by Baque et al. 159. Representative hair samples from each of

77
the 8 hair groups were imaged using SEM (FEI Nova nanoSEM 230). SEM images
were captured at 600 and 1000-fold magnification and at a working distance of 6mm.
ImageJ processing software (ImageJ 1.47v, National Institutes of Health, USA
http://imajeJ.nih.gov//ij)164 was used to measure the distance between successive
cuticle scales and hair shaft diameter159. Care was taken to image within 1 to 6cm of
hair fibres in order to exclude damaged hair. Equations 4.2 taken from Baque et al.
were then used to calculate hair growth.
𝑰𝑺𝑫 = −𝟗. 𝟒𝟑𝟑𝟕𝑿 𝑮𝒓𝒐𝒘𝒕 𝒓𝒂𝒕𝒆 + 𝟏𝟏. 𝟖𝟑𝟏 (Equation 4.2)
4.2.5 Structural Characteristics of Human Scalp Hair Cross-sections
4.2.5.1 Transmission Electron Microscopy
Representative hair samples were selected from the geometric 8-groups and prepared
for transmission electron microscopy (TEM) viewing as outlined in Appendix 4-1. Once
processed, ultra-thin sections (95nm) were sections using a diamond knife on a Leica
ultra-microtome (Leica Wild M3Z Reichert Utracuts and Diatome Static line II made by
HAUG). Sections were then stained with uranyl acetate and lead citrate and then
imaged with TEM.
4.2.5.2 Fluorescence Light Microscopy
Structural characteristics of cross-sectional properties of different hair groups were
also imaged using Fluorescent Light Microscopy. For this protocol, clean hair samples,
taken from the first 6cm length of a volunteer’s hair were fixed with glutaraldehyde and
osmium tetroxide before being embedded in LR White resin overnight at 700C. Thick
hair sections (1.5µm) were cut using an ultra-microtome. Sections were lifted onto
positively charged glass slides (SuperFrost Plus®, Menzel-Glaser, Thermo Scientific),
dried and stained with 0.002% phosphate buffered Fluorescein sodium (FS) (Sigma
Aldrich, USA) in a dark room for 18 hours. After 18 hours, the slides were rinsed with
water, dried and then stained with 0.0005% phosphate buffered Sulforhodamine 101
(SR) (Sigma Aldrich,USA) for 2 - 15 minutes. Slides were then washed with water,
dried and mounted with mowiol 4-88 containing N-propyl galate anti-fade (Sigma

78
Aldrich, USA) before being incubated overnight at room temperature in the dark and
viewed with a fluorescent light microscope (Carl Zeiss, Axiovert 200M) the following
day. Fluorescent light microscopy (FLM) images were captured with an Axiocam high
resolution microscope camera (Carl Zeiss, Germany) and analysis was performed with
the associated Axiovision software (Release 4.8).
4.3 STATISTICS
The normality of all data sets was assessed using the D'Agostino-Pearson normality
test recommended on GraphPad (GraphPad Prism version 5.00 for Windows,
GraphPad Software, San Diego California USA, www.graphpad.com). One-way
ANOVA with Tukey’s post-test was performed for normally distributed data sets. The
levels of significance for Tukey’s column pair-wise comparison were as follows; p <
0.05 (*), p < 0.001 (**) and p < 0.001(***). Statistically significance in non-parametric
data sets was assessed using the Kruskal-Wallis test with Dunn’s post-test for pair-
wise comparisons (GraphPad).
4.4 RESULTS
4.4.1 Mechanical Properties if Single Hair Fibres
Hair samples from 5 volunteers were chosen from each of the 8 hair group. Ten
strands of hair were used for each volunteer and only data from hair fibres that showed
normal hair fibre failure profiles were used. The normal hair fibre profiles of 8 hair
groups, illustrated with stress & strain curves, are shown in Figure 4-4. Representative
data from 2 volunteers per group was used for stress & strain curves illustrations.

79
Figure 4-3 Stress & strain curves illustrating the mechanical behaviour of 8 hair curl groups
The lag typically observed for high curvature hair groups can be seen here for hair
groups VII and VIII. The yield strengths of the different hair groups were above
100MPa for all hair groups. Hair groups I, II and IV had similar yield strengths (highest)
while groups III and V were lower. Hair groups VI to VIII were even lower, with group
VII exhibiting the lowest yield strength.
Hair thickness (diameter) was measured using a laser scan micrometre (LSM500,
Mitutoyo). The data was normally distributed. The average hair diameter of 8 hair
groups was uniform across most of the hair groups. Statistically significant differences
in hair diameter were observed for hair groups II and III (Figure 4-5). The average hair
diameter of hair group III was significantly lower than that of group I (p < 0.001) and
groups IV to VIII (p < 0.001 to p < 0.05), while that of hair group II was significantly
lower than that groups I , V and VI ( p < 0.001). The hair diameters of hair groups II
and III were not statistically different (p > 0.05). The straightest hair group, I, had the
highest average diameter but this was not statistically significant from that of groups
IV to VIII (p > 0.05). The straightest was observed to be thickest for the 6-group
classification as shown in Figure 4-5.
0
50
100
150
200
250
0 10 20 30 40 50 60
Stre
ss (
MP
a)
Strain (%)
Stress and Strain Curves of 8 Hair Groups
I
II
III
IV
V
VI
VII
VIII

80
Average Diameter of 8 Hair Groups
I II III IV V VI VII VIII60
70
80
90
*
******
***
*
***
******
*
Hair Curl Group
Ave
rag
e d
iam
ete
r (
m)
Average Diameter of 6 Hair Groups
1 2 3 4 5 660
70
80
90
*
******
***
**
*
***
Hair Curl Group
Ave
rag
e d
iam
ete
r (
m)
Figure 4-4 Average hair thickness of geometrically classified hair groups.
The data for mechanical properties (excluding tensile strength) was not normally
distributed. The Kruskal-Wallis and Dunn’s multiple comparison tests were used
assess variation between the groups.
When the elastic modulus, referred to here as the elasticity, of the original 8 groups
was compared, hair group III had the highest median elasticity (3319 MPa, range 2159
- 4331) (Table 4-3). Statistically significant differences were observed between hair
group III and VI (p < 0.001) and VII (p < 0.05). Hair group IV was also statistically
significant higher from groups VI and VII (p <0.001 and p < 0.05 respectively).The
elasticity of the hair group with the highest curvature (VIII) was only statistically
significant from that of group VI (p < 0.05). The statistical outputs for the multiple
comparisons are attached as appendix 4-2.
For the 6 group classification, there were significant differences between hair group 2
and 5 (p < 0.05), 3 and 5 (p < 0.001) and between 4 and 5 (p < 0.001) (Table 4-4).
The statistical outputs of the multiple comparisons for the 6-group classification are
attached as appendix 4-3.

81
Ta
ble
4-3
Me
cha
nic
al c
hara
cte
ristic
s o
f 8 h
air g
rou
ps. M
edia
n a
nd
rang
e (m
inim
um
to m
axim
um
).
C
RO
SS
-SE
CT
ION
AL
AR
EA
(µm
²) E
LA
ST
IC M
OD
UL
US
(MP
a)
YIE
LD
EX
T. (%
Stra
in)
BR
EA
K E
XT
. ( % S
train
)
HA
IR
GR
OU
P
Me
dia
n
Ra
ng
e
Me
dia
n
Ra
ng
e
Me
dia
n
Ra
ng
e
Me
dia
n
Ra
ng
e
I 4641
2506 - 8
264
3080
2288 - 3
909
26,4
6
21,1
2 - 3
1,8
9
50,4
1
39,2
8 - 6
0,9
9
II 3352
2302 -6
054
3227
1996 - 3
869
25,5
3
19,7
1 - 2
9,7
3
48,9
4
37,3
0 - 5
5,5
2
III 3236
1290 - 6
489
3319
2159 - 4
331
25,3
3
19,2
4 - 2
9,8
6
48,3
9
35,9
7 - 5
7,3
7
IV
4137
1629 - 7
144
3275
2346 - 8
099
25,6
5
18,2
5 - 2
9,2
2
48,4
9
34,2
4 - 5
5,7
9
V
4248
2263 - 7
865
3085
2188 - 3
625
25,3
1
18,1
7 - 3
2,0
3
47,6
5
32,8
8 - 6
1,0
6
VI
4142
1911 -7
007
2824
1023 - 3
723
24,1
0
14,0
1 - 3
1,2
2
43,8
5
24,2
9 - 5
9,8
9
VII
3490
2324 - 4
919
2967
1802 - 4
222
22,2
9
17,4
3 - 3
5,0
3
40,7
5
31,3
4 - 5
6,7
2
VIII
3704
2518 - 5
471
3137
2295 - 4
117
23,1
3
18,5
3 - 2
6,9
6
41,7
9
33,3
1 - 4
8,4
7
Ta
ble
4-4
Me
cha
nic
al c
hara
cte
ristic
s o
f 6 h
air g
rou
ps. M
edia
n a
nd
rang
e (m
inim
um
to m
axim
um
).
C
RO
SS
-SE
CT
ION
AL
AR
EA
(µ
m²)
EL
AS
TIC
MO
DU
LU
S (M
Pa
) Y
IEL
D E
XT
. (% S
train
) B
RE
AK
EX
T. ( %
Stra
in)
HA
IR G
RO
UP
M
ed
ian
R
an
ge
Me
dia
n
Ra
ng
e
Me
dia
n
Ra
ng
e
Me
dia
n
Ra
ng
e
1
4641
2506 - 8
264
3080
2288 - 3
909
26,4
6
21,1
2 - 3
1,8
9
50,4
1
39,2
8 - 6
0,9
9
2
3352
2302 -6
054
3227
1996 - 3
869
25,5
3
19,7
1 - 2
9,7
3
48,9
4
37,3
0 - 5
5,5
2
3
3236
1290 - 6
489
3319
2159 - 4
331
25,3
3
19,2
4 - 2
9,8
6
48,3
9
35,9
7 - 5
7,3
7
4
4137
1629 - 7
144
3275
2346 - 8
099
25,6
5
18,2
5 - 2
9,2
2
48,4
9
34,2
4 - 5
5,7
9
5
4248
1911 - 7
865
2965
1023 - 3
723
24,6
6
14,0
1 - 3
2,0
3
46,0
1
24,2
9 - 6
1,0
6
6
3543
2324 - 5
471
3029
1802 - 4
222
22,6
3
17,4
3 - 3
5,0
3
41,4
2
31,3
4 - 5
6,7
2

82
More variation was observed in the yield extension of the 8 groups (Table 4-3) when
compared to the 6 groups (Table 4-4). For the 8 group classification, significant
differences were observed between the medians of hair groups VII and VIII when
compared to most hair groups (I – V). The yield strength of hair groups VII and VIII
was statistically lower than that of hair groups I to V (p < 0.001 to p < 0.05). Similar
trends were observed for the 6 groups. The median yield extension of hair group 6
was significantly from all other hair groups (p<0.05) (Appendix 4-3).
A decrease in median break extension with increasing hair curl was observed for the
8 hair groups; the hair group with the least curvature had the highest median break
extension (Table 4-3). The median break extensions of hair groups VI to VIII was
statistically lower than that of the first 4 groups [p < 0.001 to p < 0.05 (appendix 4-
3)].The break extension of hair group V was statistically lower than that of hair groups
VII and VIII (p < 0.001 and p < 0.05). Similarly, significant differences for the 6-group
classification were observed between hair groups 5 and 6 versus all hair groups
(Figure 4-5) .These groups had significantly lower break extensions (p < 0.001 to p <
0.05).
For the ultimate measure of each group’s mechanical properties, the break stress,
referred to here as the tensile strength, was measured. The average tensile strength
of the hair curl group with the second highest curvature had the lowest tensile strength.
This was statistically significant from the average tensile strength of hair groups II to
V (p < 0.001 to p < 0.05) (Figure 4-5). The tensile strength of hair group IV was
significantly higher than that of hair groups VI (p < 0.01) and VII (p < 0.01). For the 6-
group classification (Figure 4-5), the average tensile strength of hair group 6 was
significantly different lower (p < 0.05 to p < 0.001) than that of hair groups 2 to 4. A
table of means and 95% confidence intervals for the 8 & 6-group classifications is
included in appendix 4-4.

83
Average Tensile Strength of 8 Hair Groups
I II III IV V VI VII VIII170
180
190
200
210
220 *
**
*
***
Hair Curl Group
Bre
ak S
tre
ss (
MP
a)
Average Tensile Strength of 6 Hair Groups
1 2 3 4 5 6170
180
190
200
210
220 **
***
*
*
Hair Curl Group
Bre
ak S
tre
ss (
MP
a)
Figure 4-5 The average tensile stress of geometrically classified hair groups
Overall there was a n indication of (3 and 2) groups on the curliest hair spectrum
having the lowest break stress (for the 8 and 6-group classification respectively)
4.4.2 Hair Growth Parameters
4.4.2.1 Hair Growth Rate (TrichoScan®)
The Trichoscan® platform uses epiluminiscence microscopy and automatic digital
image analysis to compare and analyse images taken at days 0, 2 or 3, resulting in an
output of various hair parameters such as hair density, anagen to Telogen ratios. Hair
growth parameters were assessed in a 0.56cm2 newly shaved area on the scalps of
volunteers as shown in Figure 4-6.
Almost all groups were unique with regards to their hair growth rate for the 8-group
classification (Figure 4-7).
For the 8-group classification, the average hair growth rate (µm/day) of hair group I
was statistically significant higher than that of hair groups VI (p < 0.01) and VIII (p <
0.05). The growth rate for hair group II was statistically higher than that of hair groups
I II III IV V VI VII VIII
Figure 4-6 Shaved scalp areas of volunteers for the assessments of hair growth rate
and hair density. Images were captured using a TrichoScan® Fotofinder.

84
III (p < 0.001), V (p < 0.05), VI (p <0 .001), VII (p < 0.001) and VIII (p < 0.001). The
growth rate of hair group VI was statically slower than that of hair group IV (p < 0.001).
Hair Growth Rate of 8 Hair Groups
I II III IV V VI VII VIII50
100
150
200
250
300
350*
****
******
***
***
**
Hair Curl Group
Ha
ir g
row
th r
ate
(
m/d
ay)
Figure 4-7 The average hair growth rate of 8 hair groups. (Mean ± SEM). Hair growth
was assessed from TrichoScan® outputs.
For the 6-group classification the average hair growth rate of hair group 1 was
statistically faster hair groups 5 and 6 ( p < 0.05), while hair group 2 was statistically
faster (p<0.001) than that of hair groups 3 to 6 (p < 0.001 to p < 0.05) (Figure 4-8).
The hair of volunteers in hair group 4 hair grew at a statistically faster rate than those
in hair groups 5 (p < 0.01) and 6 (p < 0.05), however the curliest 2 groups (5 and 6)
has the lowest growth rates.
Overall the growth rate calculations based on TrichoScan® data for hair group 1 was
significantly faster (0.72 ± 0.3 cm/month) than that of the hair group with the greatest
curvature (6) (0.39 ± 0.1 cm/month).Hair group 2 was also observed to be significantly
faster than all hair groups with greater curvature (3 to 6) (0.48 ± 0.1 to 0.39 ± 0.1
cm/month).The average hair growth for each of the 8 groups is shown in Table 4-
5).Distributions of growth rate across self-declared race groups were ;Asian (0.64 ±
0.1 cm/month, Mixed (0.59 ± 0.1 cm/month, Caucasian (0.58 ± 0.2 cm/month and
African (0.36 ± 0.1 cm/month) ( Table 4-7).Calculations of monthly growth rate used
were based on 30-day long months.

85
Hair Growth Rate of 6 Hair Groups
1 2 3 4 5 650
100
150
200
250
300
350 **
*
***
******
**
Hair Curl Group
Ha
ir g
row
th r
ate
(
m/d
ay)
Figure 4-8 Average hair growth rate of 6 hair groups .Mean ± SEM
4.4.2.2 Hair Growth Rate from SEM Micrographs
For the preliminary investigation of the Baque et al. hair growth rate approach159, one
volunteer was selected to represent each of the 8 hair groups. Three hair fibres were
taken from each volunteer. Each hair fibre was imaged in triplicate at 3 different
positions along the hair shaft and hair shaft diameter measurements were carried out
3 time times for each position. Therefore, each volunteer’s hair diameter was
measured 27 times (3 strands X 3 images X 3 positions).For interscale distance (ISD)
measurements, multiple lines, starting and ending on a cuticle edge, were drawn for
each hair fibre as illustrated in Figure 4-9.
Figure 4-9 SEM images captured at 600 and 1000 fold for the assessment of ISD (a) and
hair diameter (b).

86
The ISD was then calculated by dividing the length of each line with the number of
scales it spanned over. The average ISD was observed to be uniform between most
of the 8 hair group. However, the average ISD for hair group III was longer than that
of hair groups II to VIII (Figure 4-10) (p < 0.001 to p < 0.05) and that of hair group VI
was statistically shorter than that of hair groups I and IV (p < 0.01 and p < 0.05).
For the 6-group classification, the longest ISD was observed for hair group 3. This
observation was found to be statistically significant (p < 0.001 to p <0.05). Hair group
1 had a statistically longer ISD than hair group 5 (p < 0.05).
Interscale Distance of 8 Hair Groups
I II III IV V VI VII VIII
6
8
10**
***
******
***
**
*
**
Hair Curl Group
Inte
rsca
le D
ista
nce
(
m)
Interscale Distance of 6 Hair Groups
1 2 3 4 5 66
7
8
9
10
11
**
******
*
*
**
Hair Curl Group
Inte
rsca
le D
ista
nce
(
m)
Figure 4-10 Interscale distances of different hair groups
Hair growth rate was then calculated from ISD using equation 4-2. The calculated
average hair growth rate was observed to be generally uniform across most hair
groups (Figures 4-11 and 4-12),however the hair growth rate of hair group III or 3 was
significantly lower than most hair groups (p < 0.001 to p < 0.05) for the 8 and 6-group
classifications (Figures 4-11 and 4-12).

87
Average Hair Growth Rate based on ISD
I II III IV V VI VII VIII0.0
0.2
0.4
0.6
**
*
**
**
***
******
***
Hair Curl Group
Ha
ir g
row
th r
ate
(m
m/d
ay)
Figure 4-11 Average ISD calculated hair growth rate of 8 hair groups (Mean ± SEM).
The hair growth rate of hair group VI was unexpectedly higher than that of groups I
and IV (p < 0.01 and p < 0.05).Finally, there was no overall trend of lower growth rate
as calculated by inter-scale distance for either the 8 or 6-group classification for high
curvature hair groups, instead, one of the high curvature hair groups (5) was observed
to have be significantly faster hair group 1 (p < 0.05).
Average Hair Growth Rate based on ISD
1 2 3 4 5 60.0
0.2
0.4
0.6
******
**
**
**
Hair Curl Group
Ha
ir g
row
th r
ate
(m
m/d
ay)
Figure 4-12 Average ISD calculated hair growth of 6 hair groups (Mean ± SEM).
The average monthly hair growth rates based on ISD for the 6-group classification
were; 1.1 ± 0.2cm/month (group 1), 1.2 ± 0.1cm/month (group 2), 0.6 ± 0.2 cm/month
(group 3), 1.2 ± 0.3 cm/month (group 4), 1.4 ± 0.3 (group 5) and 1.4 ± 0.5 cm/month
(group 6). A summary of the hair growth rates based on the TrichoScan® and ISD

88
approaches is shown below in Tables 4-5 and 4-6 for the 8 and 6-group classifications
respectively. Table 4-7 shows the variations of TrichoScan based growth rates
observed in the current study.
Table 4-5 Hair growth rate (HGR) of 8 hair groups
Hair Curl
Group
TrichoScan® HGR
(cm/month)
ISD based HGR
(cm/month)
I 0.72 ± 0.2 1.1 ± 0.2
II 0.72 ± 0.3 1.2 ± 0.1
III 0.48 ± 0.1 0.6 ± 0.2
IV 0.60 ± 0.1 1.2 ± 0.3
V 0.50 ± 0.2 1.3 ± 0.4
VI 0.34 ± 0.1 1.6 ± 0.2
VII 0.41 ± 0.1 1.4 ± 0.6
VIII 0.34 ± 0.1 1.4 ± 0.2
Table 4-6 Hair growth rate (HGR) of 6 hair groups
Hair Curl
Group
TrichoScan® HGR
(cm/month)
ISD based HGR
(cm/month)
1 0.72 ± 0.2 1.1 ± 0.2
2 0.72 ± 0.3 1.2 ± 0.1
3 0.48 ± 0.1 0.6 ± 0.2
4 0.60 ± 0.1 1.2 ± 0.3
5 0.39 ± 0.2 1.4 ± 0.3
6 0.39 ± 0.1 1.4 ± 0.5
Table 4-7 Hair growth across racial groups, based on the TrichoScan
Racial Group TrichoScan® HGR
(cm/month)
Asian 0.64 ± 0.1
African 0.36 ± 0.2
Caucasian 0.58 ± 0.2
Mixed 0.59 ± 0.1

89
4.4.3 Hair Density
Hair density was assessed in a newly shaved area of 0.562cm2 (Figure 4-6).The
average hair densities for the 8 groups ranged between 223 - 266 hairs/cm2 when
taken recorded from the TrischoScan® output. Manually calculated hair densities
using Matlab and GRABIT gave a range of 257 - 292 hairs/cm2. No significant
differences in average hair density were observed between the different hair groups
for any of the groups (8 or 6) (p > 0.05) (Figure 4-13).
Trichoscan Hair Density of 8 Groups
I II III IV V VI VII VIII200
250
300
Hair Curl Group
Ha
ir D
en
sity (
ha
irs/c
m2)
Matlab Hair Density of 8 Groups
I II III IV V VI VII VIII200
250
300
Hair Curl Group
Ha
ir D
en
sity (
ha
irs/c
m2)
Figure 4-12 The assessment of hair density using an automatic and manual approach.
4.4.4 Ultrastructural Characteristics of Different Hair Curl Groups
4.4.4.1 Transmission Electron Microscopy
The ultrastructural characteristics of geometrically classified hair samples were
investigated using TEM. Two representative samples were used for each of the 8 hair
groups. Sample preparation for curly hair groups was extremely challenging because
ultra-thin (95nm) sections of these hair groups were tended to lift off the resin as shown
in Figure 4-14. Sections were stained with a 1% Toluidine blue in 1% sodium borate
for 30 seconds in order to visualize samples orientation. Toluidine blue stained
sections were imaged with light microscopy. Successful TEM imaging was achieved
for hair groups I, III and IV. The TEM micrographs are shown in Figures 4-15 to 4-17.

90
4-13 Toluidine blue staining of ultrathin hair sections (hair group VIII).
In the TEM micrographs of hair group I, 2 – 5 layers of orthocortical cells were
observed at the periphery of the hair cortex (Figure 4-15a and b). Paracortical cells
were accounted for the bulk of cortex. Randomly distributed melanin granules (M) can
also be observed on the hair cortex and sometimes amongst cuticle cells. Six – seven
layers of cuticle cells were observed for hair groups I (Figure 4-15) and III (Figure 4-
16).
Figure 4-14 TEM micrographs hair group I. Orthocortical cells (O) were observed on the
periphery of the hair cross section, while paracortical (p) cells made up the bulk of the hair
cortex.
A slightly thicker arrangement (8 layers) of orthocortical cells was observed for hair
group III (Figure 4-15).These were also observed on the periphery of the cortex as in
b M
a
O
P
P
O

91
hair group I. Paracortical cells still appeared to account for the greater portion of the
hair cortex.
Figure 4-15 A TEM micrograph of hair group III, showing a thicker layer of orthocortical cells.
Of the 3 hair groups visualised with TEM, the hair group with the highest degree of
curvature (hair group IV) had the thickest layer of orthocortical cells. Ten layers of
orthocortical cells were observed on the representative samples imaged for this hair
group (Figure 4-17). Fewer cuticle layers were also observed for this group.
Figure 4-16 A TEM micrograph of stained hair section from hair group IV. A thicker layer
of orthocortical cells is observed for this group than group I and III.
P
O
O P

92
To overcome the challenges encountered with obtaining ultrathin sections for high
curvature hair groups, another imaging method was used. Fluorescent light
microscopy (FLM) can be used to visualise thicker sample sections (1.5μm).
4.4.4.2 Fluorescence Light Microscopy
Representative samples that had been prepared for TEM were used for FLM.
Embedded sample sections were dual stained with Fluorescein Sodium (FS) and
Sulforhodamine (SR). FS (green) preferentially stained paracortical cells while SR
(red) stained orthocortical cells. FLM micrographs were captured for hair groups I, III,
IV, V, VII and VIII.
Orthocortical cells were observed at the periphery of the hair cortex for hair groups I
(Figure 4-18) and III (Figure 4-19) while an approximately 1:1 distribution of the two
cortical cell types was observed for hair groups IV (Figure 4-20) and V (Figure 4-21).
Figure 4-17 FLM images of hair group I showing a layer of Flourescein Sodium (FS) stained
orthocortical cells (red) at the periphery of the hair cortex. Paracortical cells are stained green with
Sulforhodamine (SR).

93
Figure 4-18 FLM image of hair group III hair cross section. A single layer of orthocortical
cells can be observed at the edges of the hair cortex, adjacent to cuticle cells.
Half the cross-section of hair groups IV, V and VII hair were comprised of orthocortical
cells while the other half had paracortical cells. Similar observations were made for
hair group VII (Figure 4-22). Stained sections of hair group VIII had a lower ratio of
orthocortical cells than type VII (Figure 4-23).
Figure 4-19 FLM images of hair group IV showing an asymmetric distribution of ortho
and paracortical cells.
Figure 4-20 FLM image of hair group V. Orthocortical cells (red) on the RHS of the image
and paracortical cells (green) are observed on the LHS.

94
Figure 4-21 FLM image of hair group VII hair. Although the image is out of focus in some
areas, the asymmetric distribution of the two cell types can be observed.
Figure 4-22 FLM image of hair group VIII with less orthocortical cells than hair group VII.
4.5 DISCUSSION
Mechanical Properties
The average hair thickness of 8 hair groups was generally uniform except for
significantly smaller diameters for hair groups II and III. The hair group with the
straightest hair (group I), comprising of Asian volunteers, had the greatest average
diameter; however this variation was not statistically significant from that observed for
hair groups IV to VIII. Hair groups hair shafts were II and III were significantly thinner
than that of all other groups. This was expected because Caucasian hair samples are
usually reported to be fine or thinner than Asian or African hair samples22,93,122.

95
The mechanical properties of hairs with varying degrees with curvature were of interest
in the current study because African hair is usually reported as being mechanically
weaker 55 than other hair groups, although the biochemical composition of all hair
groups has been said to be quite uniform 93,94,135–137. The lower tensile properties of
hair groups with high curvature have been attributed to the kinks present along the
hair shafts of such hair groups. These kinks become areas where the applied stress
gets concentrated, leading to premature breakage or failure62.
One of the contributors to the widely reported intrinsic weakness of highly curly hair
has been said to be its yield extension. African hair is said to reach their yield extension
at a faster rate than other hair groups 55,160. The median yield extensions of the 8
different hair groups are shown in Tables 4-3 and 4-4. Hair group I statistically had the
highest yield extension. No significant differences were observed between the yield
extensions of all the straight hair groups (I – IV). For the curlier hair groups (V – VIII),
significant differences were only observed between hair group V and VIII. Hair groups
VII and VIII, which have been assigned to African hair, had the lowest yield extension.
This lower yield extension was shown to be statistically significant from that of hair
types I, II, III, IV and VI.
A low yield extension reflects an earlier transition of the keratin structure from alpha-
helical to being β-sheets 32. The yield region arises from the uncoiling of α-helical
chains into β-sheet 22,160, a process that happens without much resistance and is
reflected by very small changes in the % strain with increasing stress in the pre-yield
(Hookean) region160.
All hair groups had a yield extension below 30% strain, which is in line with literature
that reports that hair is perfectly elastic up to 30% extension 165, after which point it will
not regain its original shape even if the exerted mechanical energy is lifted. The yield
strengths observed in the current study were higher than those reported in literature.
All yield strengths were above 100MPa (Figure 4-4). The reported average yield
strength for Asian , Caucasian and African hair is 100 MPa, 67 MPa and 58 MPa
respectively160.
96
In the pre-yield region, stress and strain are proportional and the gradient this linear
relationship, termed the elastic modulus, can be found. The elastic modulus of the hair
group III was statistically higher than that of all hair groups with a higher degree of
curvature. No significant differences were observed between hair groups I to III and V
to VIII. These observations give indications of two major groups; those with low
curvature and those with high curvature, masking variations that could be observed
for intermediate hair groups.
Beyond the yield region, the β-sheet configuration of the keratin resists stretching and
stress increases with strain until the fibre reaches the highest stress it can withstand
and breaks39,160.Hair groups with lower yield extensions were subsequently observed
to reach their breaking point at a lower extension (break extension in % strain). Hair
groups VII and VIII had the lowest break extensions (Table 4-3). An inversely
proportional relationship was observed between hair curvature and break extension.
There was a decrease in break extension with increasing curvature (Tables 4-3 and
4-4).
The tensile strength is the maximum stress that each single fiber was able to
withstand.
The average tensile strength of the different groups was observed to be statically
significant from the hair group with the second highest degree of curvature (VII) (185.4
± 18.97 MPa) when compared to hair groups I to V [200.5 ± 22.86 to 211.1 ± 22.71
MPa] for the 8 group classification. No significant differences were observed between
groups nearest to each other (I vs II, II vs III, etc.) for the 8 group classification. This
provides evidence that supports merging some the groups as done the last 4 groups
of the 8-group classification, resulting in the 6-group classification.
Variations between hair groups 4 (211.1 ± 22.71 MPa) and 5 (188.3 ± 21.50 MPa)
were statistically significant for the 6 group classification (Figure 4-8). The trends
observed for average tensile strength for the 8 group classification were similar to
those reported by other workers62,131, where the break stress decreased with
increasing hair curvature, Asian hair (straightest) is reported to have highest tensile
strength160. For the 6-group classification, the average tensile strength of the group

97
with the highest curvature (hair group 6) was statistically lower than all hair groups 2
to 4.
Interestingly, higher break stress results were observed in the current study for hair
groups, the lowest break stress was 153 MPa for hair group VIII, Break stress results
usually reported in are 101, 139 and 117 MPa for African, Caucasian and Asian hair
respectively160.
Hair Growth Parameters
Hair growth rate
Hair growth parameters were measured using the TrichoScan® platform, a
quantitative method that combines epiluminiscence microscopy and automatic digital
image analysis 166,167. As already outlined in the methods section, the hair growth rate
of different hair forms was assessed using two approaches; using data extracted from
the TrichoScan® platform and using an approach that correlates the Interscale
distance with hair growth rate. The hair growth rates calculated from the TrichoScan®
platform were consistent with data available where type I and II is usually termed as
Asian hair, type II – IV as Caucasian and hair group V – VIII as African hair.
If hair groups I, III and VIII are used to represent Asian, Caucasian and African hair
respectively, their average hair growth rates would be 240.6, 160.4 and 131.9 µm /
day as shown in Figure 4-7. This is similar to observations by Loussouarn et al. that
showed that Asian hair had the fastest hair growth (244 - 611 µm/day) compared to
African and Caucasian that grew at 165 -201 and 165 - 506 µm/day 158. Variations
exist in the reported hair growth of different racial groups. Loussouarn had earlier
reported earlier (2001) that African hair has a growth rate of 256 ± 44 µm/day while
Caucasian was seen to grow at 396 ± 55 µm/day 161.
Although the relationship between hair morphology and hair growth is not directly
proportional, the growth rate of the curliest hair group was the slowest, as previously
reported by other workers 161. In the current study, significant differences in hair growth
rate were observed between the straightest hair groups (I and II) and the curly hair
groups (IV – VIII).No significant differences were observed between hair group I and
II while variations observed in hair groups II and III were statistically significant. No
statistically differences were observed for the hair group with the highest hair curvature

98
hair (VIII) when compared to other high curvature groups (VI and VII). Variations in the
intermediate hair groups (IV and V) could also not be shown be to statistically
significant. These observations cluster the 8 group classification into 4 groups (I & II,
III, IV & V and VI to VIII).
Hair growth rate has been shown to be related to the distance between cuticle layers
for straight hair 159. Using ISD and hair shaft diameter, Baque et al. showed that for
straight hair from Asian and Caucasian volunteers, a thick hair fibre and short ISD
corresponded with a high growth rate159. A fibre with a dimeter of 100 µm and growth
rate of 20 µm per hour is reported to produce 5 -10 µg of protein per 24 hours28.
ISD therefore reflects the rate of cell turn over in the hair bulb; hairs with slower growth
have lower cell over and would thus have longer distances between successive cuticle
cells.
The authors corroborated hair growth rate calculations from their new approach to
those observed with conventional hair growth rate measurements. This new hair
growth rate calculation method was explored in the current study in order to assess its
suitability for curlier hair groups. The results observed in the current study were similar
to those obtained by Baque et al. for the ISD of straight hair.
Overall, the anticipated trend that the curliest hair ought to have the longest ISD was
not observed. The curliest hair groups (VII and VIII) were observed to have shorter
inter scale distances than straight hair groups (I and II) .Similar results were observed
for the 6-group classification (Figure 4-11).
ISD had no association with hair curl. Hair group VI had an average hair growth rate
that was statistically higher than that of hair groups I and IV, while that of hair group III
was statistically lower than most groups. These deviations from the expected trend
that curlier hair groups would have lower growth rates could be explained by the wide
variations usually reported for hair growth rates (Asian: 0.73 – 1.8 cm/month,
Caucasian: 0.50 – 1.2cm/month, African: 0.5 – 0.6 cm/month)158 , making the
assignment of average hair growth rate to geometric groups challenging. The variation
in the ISD calculated hair growth rate could also be due to limited sample size in the

99
current preliminary investigation. Including more volunteers for each group could
improve results.
The magnitude of hair growth rate was however similar to that reported from
conventional methods: the average hair growth of hair group 1 was 1.1 cm/month (±
0.2) when calculated using ISD and 0.72 cm/month (± 0.3) when measured with the
TrichoScan® (Figure 4-8 and 4-12).
This approach is similar to the older hair classification method of counting the number
of scales and using that as a descriptor of hair form71. Measurements of this parameter
are reported to vary widely from researcher to research and it is recommended that
comparisons should be limited to one’s own data71.
The rate of hair growth could influence levels of incorporation onto the growing hair
shaft, although hair analysis interpretations usually cite a blanket growth of 1.0 cm per
month for all racial groups3,6,17,126. Variations across hair groups should be taken into
consideration for all hair groups in order to correctly interpret results obtained for
various hair analyses120,126.
Overall, the growth rates based ISD had no association with hair curl and were higher
than those observed for the conventional TrichoScan® method; 1.1 ± 0.2cm/month
(group 1) to 1.4 ± 0.5 cm/month (group 6) .
The distributions of TrichoScan® based growth rate across self-declared race groups
(Asian (0.64 ± 0.1 cm/month, Mixed (0.59 ± 0.1 cm/month, Caucasian (0.58 ± 0.2
cm/month and African (0.36 ± 0.1 cm/month)) were similar to published data for
Caucasian (0.50 – 1.5cm/month), African (0.5 – 0.6 cm/month)158, but lower for
Asian(0.73 – 1.8 cm/month). This study is the first to report on the growth rate of a
mixed racial group. Variations of ISD based hair growth rate across racial groups were
not calculated due limited sample size.
Hair Density
No significant differences were observed in hair density across hair groups when
comparing data obtained from the automatic TrichoScan® output and data obtained

100
using MATLAB and GRABIT software. This reflected consistency between the two
approaches, although the Matlab approach showed greater variability within groups.
The hair density results observed in this study were consistent with results obtained
for racially classified hair where the reported ranges in hair density usually overlap for
the three major racial groups; African: 194 ± 44 hairs/cm2, Asian: 224 ± 38 hairs/cm2
and Caucasian hair: 285 ± 66 hairs/cm2, 158.
Ultrastructure
Orthocortical cells are reported to contain lower sulphur content (~3%) than
paracortical cells (~5%) and it would be expected that hair shafts with greater
composition of paracortical cells would have the highest tensile strength, while those
with 1:1 proportions would have intermediate tensile properties. However ,disulphide
bonding is reported to not affect the tensile properties of dry hair39 and the fragility of
African hair to be unrelated to the distribution of cystine-rich proteins94 .
The distribution of cortical cells within the hair cortex has also been related with hair
morphology60,90. This relationship was investigated using transmission electron
microscopy and fluorescence light microscopy. Several researchers have visualized
the variation in the ratios and distributions of cortical cells within the cortex of different
hairs using TEM77,168. However, to our knowledge, the current work is the first to show
the distribution cortical cells of more than 2 hair groups using the FLM dual staining
protocol; Baque et al. investigated cortical cell distributions in Caucasian and Asian
(Japanese) hair.
Straight hair from Japanese volunteers was found to be predominantly composed of
paracortical cells90, similarly, in the current work, the straight hair cortex of samples
from hair groups I to III was predominantly stained with Sulforhodamine, reflecting
abundance of paracortical cells. For curlier hair groups, there were variations in the
distributions of orthocortical and paracortical as expected. Samples from hair groups
IV, V and VII were stained with Sulforhodamine and fluorescein sodium in almost equal
proportions, reflecting 1:1 distribution of these cells types. Hair group VIII was mostly
stained with Sulforhodamine, reflecting paracortical cells. Interestingly, the

101
asymmetric distribution of these cell types40 was only observed in the curliest hair
group (VIII).
4.6 CONCLUSIONS
The current chapter presented investigations on the relationships between
morphology and other physical characteristics of hair.
The yield strength and break stress results observed were higher than those
previously reported for racial groups, although this could be due to the measurement
technique used. The overall trends in mechanical properties were similar to published
results (i.e. the curliest hair had the lowest tensile strength, whilst the straightest had
the highest). The intermediate hair group (4) had the highest median hair elasticity.
Although there was a statistically significant difference in hair diameter between some
of the groups, this did correlate with hair curl.
The growth rates observed with the TrichoScan® were similar to those previously
published (i.e. the straightest hair group had the fastest growth rate (0.72 ± 0.3
cm/month) compared to the curliest hair (0.39 ± 0.2 cm/month). However growth rates
based on ISD were haphazard and did not correlate with hair curl.
New dual staining techniques by FLM have been used for visualizing cortical cell in
straight hair and were found to give similar results to TEM. This study is the first (that
we are aware of) to confirm that this is also the case for African hair; FLM techniques
are cheaper and more efficient than TEM.
Understanding the relationships that exist between hair morphology and other
previously characterised hair features is important. Hair morphology and hair growth
rate are two characteristics that could have an influence on how substances are
incorporated into the hair follicle and emerging hair shaft. These substances could
include illicit drugs, chronic medication or alcohol. The rate of hair growth could
influence levels of incorporation into the growing hair shaft. Variations across hair
groups should be taken into consideration for all hair groups in order to correctly
interpret results obtained for various hair analyses120,126.

10
2
Ap
pe
nd
ix 4
-1. A
scre
en s
hot illu
stra
ting h
ow
data
poin
ts e
xtra
cte
d fro
m T
rich
oS
ca
n®
outp
ut u
sin
g M
AT
LA
B a
nd
GR
AB
IT im
ag
e p
roce
ssin
g
softw
are
.Th
e ra
ng
es fo
r the x
(0.2
5 –
2.1
5) a
nd
y (0
– 2
4) a
xis
had
to b
e d
efin
ed
first in
ord
er to
pic
k d
ata
poin
ts a
ccura
tely
, the s
et ra
ng
es o
n
the a
xis
are
sh
ow
n b
y b
lue o
r red c
ross h
airs
. The
pre
vie
w b
ox, to
p rig
ht, s
how
s th
e tre
nd o
f pic
ke
d d
ata
poin
ts, w
hic
h m
atc
hes th
at o
f the
his
togra
m a
nd th
e p
an
el o
n th
e b
otto
m rig
ht is
a s
um
mary
of p
icke
d d
ata
po
ints
. Th
is s
um
mary
wa
s th
en e
xp
orte
d o
nto
exce
l for d
ata
ana
lysis
.

103
Appendix 4-2
Statistical significance observed in the mechanical properties of 8 hair groups.
Statistical significance was assessed using the Kruskal-Wallis and Dunn's Multiple
tests.
Dunn's Multiple Comparison Test for 8 hair curl groups
Comparison Level of Significance*
Cross sectional area I vs II ***
I vs III ***
I vs VII *
II vs V *
II vs VI *
III vs V **
III vs VI **
Elastic Modulus (MPa) II vs VI **
III vs VI ***
III vs VII *
IV vs VI ***
IV vs VII *
VI vs VIII *
Yield Extension (% strain) I vs VII ***
I vs VIII ***
II vs VII ***
II vs VIII **
III vs VII ***
III vs VIII *
IV vs VII ***
IV vs VIII **
V vs VII **
Break Extension (% strain) I vs VI ***
I vs VII ***
I vs VIII ***
II vs VI **
II vs VII ***
II vs VIII ***
III vs VI **
III vs VII ***
III vs VIII ***
IV vs VI **
IV vs VII ***
IV vs VIII ***
V vs VII **
V vs VIII *
* Asterisks indicate different levels of significance; p-value between 0.01 and 0.05
(*), p- value between 0.001 and 0.01 (**) and p < 0.001 (***).

104
Appendix 4-3
Statistical significance observed between the 6 hair curl groups
Dunn's Multiple Comparison Test for 6 hair curl groups
Comparison Level of Significance*
Cross sectional area 1 vs 2 ***
1 vs 3 ***
1 vs 6 *
2 vs 5 ***
3 vs 4 *
5 vs 6 ***
Elastic Modulus (MPa) 2 vs 5 *
3 vs 5 ***
4 vs 5 ***
Yield Extension (% Strain) 1 vs 6 ***
2 vs 6 ***
3 vs 6 ***
4 vs 6 ***
5 vs 6 **
Break Extension ( % Strain) 1 vs 5 **
1 vs 6 ***
2 vs 5 *
3 vs 6 ***
3 vs 5 *
3 vs 6 ***
4 vs 6 ***
5 vs 6 *
* Asterisks indicate different levels of significance; p-value between 0.01 and 0.05
(*), p- value between 0.001 and 0.01 (**) and p < 0.001 (***).

105
Appendix 4-4
Average tensile strength of 8 hair curl groups.
Average Tensile Strength of 8 Hair Groups (MPa)
Hair Group Mean Std.
Deviation 95% CI (LL - UL)
I 200,5 22,86 191,8 - 209,2
II 205 27,16 197,1 - 212,9
III 204,5 19,43 198,8 - 210,2
IV 211,1 22,71 203,8 - 218,3
V 203,7 28,37 192,5 - 214,9
VI 190,4 25,34 182,3 - 198,5
VII 185,4 18,97 178,3 - 192,5
VIII 192,3 24,43 181,5 - 203,1
Average tensile strength of 6 hair groups
Average Tensile Strength of 6 Hair Groups (MPa)
Hair Group
Mean Std. Deviation 95% CI (LL - UL)
1 200,5 22,86 191,8 - 209,2
2 205,0 27,16 197,1 - 212,9
3 204,5 19,43 198,8 - 210,2
4 211,1 22,71 203,8 - 218,3
5 195,7 27,20 189,1 - 202,4
6 188,3 21,50 182,3 - 194,3

106
CHAPTER FIVE
5 DISCUSSION
The interest in human scalp hair extends beyond cosmetic applications. Hair is
increasingly being used for diagnoses107,108,115, detection of drug use and abuse5,8,112
and as a substrate to bio mark disease progression15,16,19.
Some of the most recent investigations include testing for antiretroviral drug levels to
monitor treatment compliance9–13. Interpretation of hair testing results continue to be
based on race as a surrogate for hair morphology, however racial categorizations is
limited, subjective and could misconstrue findings120,169. Further, variations in hair
morphology are usually associated with other hair characteristics such hair growth
rate, hair density and biochemical composition. The extent of these variations is
possibly masked in subjective racial categorization.
The first geometric classification of hair morphology was by Daniel Hrdy, an
anthropologist who assessed the variation of hair form in 7 populations71. Unlike other
researchers before him, Hrdy systematically studied hair morphology using direct
curling variables and attempted to apply quantitative and statistical methods to
describe observed variations. Other workers used variables such as hair diameter,
medullation scale count or cross-sectional index. Further, Hrdy devised 4 additional
curling variables (average curvature, ratio of maximum to minimum curvature, crimp
and ratio of natural to straight hair length) to accurately measure hair curl71.
Hrdy’s work was followed by Bailey& Schliebe who focused on average curvature for
describing hair morphology70.
Recently, a new geometric system that classifies hair based on hair curvature was
proposed. This new classification used 3 geometric parameters (curve diameter, curl
meter and number of waves), adopted from Hrdy, Bailey & Schliebe, to objectively
classify hair as I (least curvature) to VIII (greatest curvature). The curve diameter is
comprised of circles of known radii and the curl meter is a simplified assessment of
the ratio of natural to straight hair length71 for curly hair groups63,69 .

107
Geometric classifications of human scalp hair are a welcomed move away from using
race as a surrogate for hair morphology. However to date no study has published data
on the reliability of the most recent geometric classification.
The aims of this dissertation were therefore to, firstly evaluate the reliability of the
geometric classification and explore whether its reliability could be improved.
Secondly, I sought to elucidate the relationships between the hair morphology and
biochemical characteristics, focusing on internal lipid content and FTIR absorption.
Lastly, I investigated the relationships between the physical characteristics of hair with
varying degrees of curvature in order to understand associations between hair
morphology and mechanical properties, hair growth rate, hair density. Ultrastructural
details were elucidated to understand correlations between cortical cell distributions
and hair curvature.
Geometric classification of human scalp hair curl: reducing groups from 8 to 6
improves reliability
Natural hair samples from 128 volunteers (83% female and 17% male) were collected
to assess the reliability of the new geometric classification. Hair geometry was initially
classified using a published template that classifies the variation in hair curvature into
8 groups using 3 parameters; curve diameter, curl meter and counting the number of
waves63,69.
Six centimetre long strands of hair were place on top of the curve diameter template
and a glass slide placed on the hair without shifting or altering its natural curl. The hair
was then classified as hair curl group I, II, III or IV by superimposing it to the best fit
half-circle. For hair with curls too tight to fit in the curve diameter template, both the
curl meter and the number of waves calculated were used for classification. The curl
meter was a circle with a diameter of 0.98cm. Hair samples that did not fit into the curl
meter were classifiable as V and VI and those that completely fit as VII and VIII.
Counting the number of waves present in a 5cm strand that was constricted to 4cm
further differentiated the high curvature hair groups; up to 3 for V; ≥4 for VI; up to 5 for
VII and ≥ 6 for VIII.

108
Ten strands of hair were assessed from 48 volunteers by 3 evaluators at 2 occasions
in order to investigate the reliability of the published classification. The most frequently
occurring hair curl group for each set of 10 strands was reported on each occasion. In
instances where there was more than one frequently occurring hair curl group, the
group with the higher degree of curvature was assigned because I considered this
group to be representative for the volunteer than straighter hair that could have
straightened due to mechanical damage or extension.
Temporary hair curl change as a result heat and/or cosmetic physical curling would
not persist beyond the sample preparation steps. Chemically altered hair (straightened
or curled) was excluded from the study.
Further, hair samples were washed in between evaluators in order for the hair to regain
its natural non-extended hair form. Lastly, the overall hair curl for each of the 48
volunteers was based on the most frequently occurring hair group of the 6 evaluations
(i.e. from 60 hairs).
The last step (counting the number of waves) of 8-group classification was found by
the 3 evaluators to be laborious and impractical for the purposes of rapidly classifying
hair curl. This classification categorized hair curl groups 1 to 4 similarly as I to IV in th
8-group classification. For differentiating high curvature hair groups, the curl meter
circle was still used. Hair group 5 was those hairs that did not fit inside the curl meter
and was equivalent to V and VI (in the 8-group classification), while hair group 6 was
comprised of hair groups VII and VIII, hair fibres that fitted perfectly inside the curl
meter.
In chapter two, the results of the investigation of the reliability of a published geometric
classification were presented. Kappa statistics reflecting the level of agreement
between the 3 evaluators was 0.447. The reproducibility of the classification was
assessed by comparing each evaluator’s scores at the two occasions and the intra-
observer scores ranged from k = 0.444 (95% CI; 0.334 – 0.553) to k = 0.648 (95% CI;
0.525 – 0.771)].
The Kappa coefficient measures chance corrected agreement between two or more
raters and can range between +1 and -1127. Kappa values < 0.20 reflect poor

109
agreement and 0.41-0.60 reflect moderate agreement. Kappa values between 0.61-
0.80 are regarded as good agreement, while very good agreement is reflected by
kappa values ranging from 0.81 to 1.00127,129,130. A kappa value below 0 reflects worse
than expected agreement128.
Improvements were seen in both the reliability and reproducibility of the geometric
classification when the 6-group classification was used. The level of agreement
between the 3 evaluators was 0.7291. The reproducibility (intra-observer) of the
classification ranged from 0.599 (95% CI: 0.422 – 0.776) to 0.836 (95% CI; 0.691 –
0.981). The intra-observer kappa statistic for the one evaluator who classified the
additional 80 volunteers was 0.754 (95% CI; 0.669 – 0.839), reflecting good
agreement.
The main findings of this study were that the 6-group geomentric classification is more
reliable both between three different evaluators and within the same assessor at two
different time points.
The Relationship between Biochemistry and Hair Morphology
It has long been largely accepted that the biochemical characteristics of different hair
phenotypes are uniform and tend to overlap93. This has been illustrated by most amino
acid analysis quantification studies, particularly those using whole hair fibre.
Investigations of different components of hair proteins have also come to similar
conclusions136,170. Variations have however been reported in the total internal lipid
content of hair from healthy volunteers of different racial groups73. Changes in lipid
content have also been reported as possible indicators of breast and colon cancer
107,115.
The biochemical characteristics of hair groups in the current study were investigated
using 2 approaches;
Total internal lipids were extracted from pulverized hair using organic solvents and
non-destructive assessment of whole fibre was profiled using attenuated total
reflectance Fourier Transform Infrared Microspectroscopy (ATR-FTIR).

110
Although an attempt was made to collect similar numbers of samples from each group,
the 8-group method that was used initially employed was later shown to be unreliable
(chapter 2), contributing to unequal numbers of participants in hair groups.
Total internal content was assessed using the SPV assay and a minimum of two
volunteers per hair group were included for comparison were included. The Vanillin
Assay has been used to quantify total lipids in serum149,150 and Meibomian gland
secretions153 and it was adapted for use in a microplate to allow for rapid quantitative
analysis by Cheng et al148. The assay requires the presence of a carbon-carbon
double bond 149 and the unsaturated free internal lipids from the hair shaft that would
have been quantified are; ceramide, cholesterol ester (ChE), cholesterol sulphate
(ChS) and free fatty acids such as linoleic, oleic and alpha linoleic acids149,155,171.
Although no distinction of exact lipid class was made in the current study, the observed
higher internal lipid content for high curvature hair groups could be attributed to
contributions from FFAs, cholesterol esters and cholesterol sulphate. This is
consistent finding by Cruz et al., where African hair samples were richer in these lipids
than Caucasian or Asian hair samples73.
Unlike other comparisons of lipid content from FTIR spectra107,118 that assess
absorption of lipids in the 1500 – 1400 cm-1 or 1739 – 1740 cm-1, this study focused
on the lipid band at 2850 - 2960 cm-1 region. This region was discernible from
unprocessed spectra (expect for background correction) and did not require
derivatization to separate it from other peaks. This was thought to be an important
requirement for applications of rapid hair classification of hair. Further, Zhang et al114
observed higher lipid content in the cuticle, so although the evanescent wave of IR
radiation did not reach the cortex region, variations in lipid content could still be
observed. Indications of spectra in the cortex are; Amide I at approximately 1652 cm -
1 and Amide II at approximately 1548 cm-1, reflecting α-helical conformation of tertiary
proteins114,146. An Amide I band at 1630 cm -1 with an Amide II band between 1515 –
1525 cm-1 indicate proteins that have a β-sheet conformation146,157. The keratin
conformation observed in the current study was closer to the ranges of the β-sheet
form, indicating that the evanescent wave did not did not reach the hair cortex.

111
Together with the outcomes of the SPV assay, this corroborates reports that African
hair has higher lipid content with contribution from both the cortex and cuticle layers.
Further, for the FTIR spectra of hair samples from different geometric groups; curly
hair groups also tended to have higher lipid content. Lower amide I and amide II
absorption was also observed in these groups.
When the variations in baseline corrected spectra were compared, observations were
more haphazard with no clear correlation between biochemistry for the 8 group
classification. Trends were however observed trends (although no consistent
correlation) between the biochemical characteristics and different hair groups for the
6-group geometric classification.
When an 8-group classification was used, 78% of the variations in the spectra were
explained by hair morphology, while for the 6-group classification, hair morphology
explained 81% of the variation.
Further, the prediction model for the 6-group classification was better than that of the
8-groups. Using general discriminant analysis, the important wavenumbers that were
used to explain the variation between 6 groups were close to bands of interest in
biological tissue. Six out of the 9 wavenumbers could be correlated to discernible
peaks in the FTIR-spectra of scalp hair. Two of the selected wavenumbers were in the
range of O-H absorption and two other wavenumbers were in the Amide I region.
Hair lipid levels were investigated in the current study using the Vanillin assay and
FTIR in order to understand baseline levels of lipids across different geometric hair
groups for accurate comparisons of diseased hair samples in the future. It is
acknowledged that factors such as dietary habits could have a confounding effect on
these lipids.

112
The Relationships between Hair Morphology and Physical Characteristics
Mechanical Properties
The mechanical properties of hair fibres were assessed using a miniature tensile
tester. For the analysis, single hair fibres were crimped and loaded onto a rotatory
carrousel for automated mechanical testing instrument. The setup included a laser
scanning micrometre for measuring hair diameter. Mechanical properties quantifiable
with this instrument were cross-sectional area, minimum, mean and maximum
diameter, elastic modulus, gradient and extension, plateau load and stress, load and
work and load at different % strains (15% and 25%), yield and break extensions, post
yield gradient, break load and stress, total work and toughness.
The chosen variables for assessments of variations in mechanical properties across
groups in the current study were; hair diameter, cross-sectional area, elastic modulus,
yield extension, break extension and break stress. Stress & strain curves were
generated for all hair groups. These variables are widely used for descriptions of hair
strength92,160,172.
The hair group with the straightest hair (group 1), comprising of Asian volunteers, had
the greatest average diameter; as expected, however this variation was not statistically
significant from that observed for hair groups 4 to 6. Hair curl groups 2 and 3 were
significantly thinner than those of all other groups. This was not surprising because
Caucasian hair samples are sometimes reported to be fine or thinner than Asian or
African hair samples22,93.
All hair groups had a yield extension below 30% strain similar to published reports
that hair is perfectly elastic up to 30% extension 165, after which point it will not regain
its original shape even if the exerted mechanical energy is lifted. The yield strengths
observed in the current study were higher than those reported in literature. All yield
strengths were above 100MPa. The reported average yield strength for Asian,
Caucasian and African hair is 100 MPa, 67 MPa and 58 MPa respectively160.
The elastic modulus of the hair group 3 was statistically higher than that of all hair
groups with a higher degree of curvature; this could be related to the smaller average

113
diameter for this hair group. No significant differences were observed between hair
groups 1 to 3 and 5 to 6. These observations give indications of two major groups;
those with low curvature and those with high curvature, masking variations that could
be observed for intermediate hair groups.
The lower tensile properties of hair groups with high curvature have been attributed to
the kinks present along the hair shafts of such hair groups. These kinks become areas
where the applied stress gets concentrated, leading to premature breakage or
failure62.
The tensile strength is the maximum stress that each single fiber was able to
withstand. The average tensile strength of the group with the highest curvature (hair
group 6) was statistically lower than hair groups 2 to 4.
Hair Growth Parameters
Hair growth rate
Hair growth rate was calculated from the TrichoScan® platform and interscale
distance. The TrichoScan platform calculates hair growth parameters and is widely
used in dermatology for assessment of hair loss and response to treatments166,167.
Although the relationship between hair morphology and hair growth was not directly
proportional, the growth rate of the curliest hair group was the slowest, as previously
reported by other workers161. In the current study, significant differences in hair growth
rate were observed between the straightest hair groups (1 and 2) and the curly hair
groups (4 –6).
Hair growth rate is reported to be related to the distance between cuticle layers for
straight hair on scanning electron microscopy159. Quantifying interscale distance is
similar to the scale count assessment that researchers used to describe hair
morphology71.Using ISD and hair shaft diameter, Baque et al. showed that for straight
hair from Asian and Caucasian volunteers, a thick hair fibre corresponded with a high
growth rate159.

114
This study is the first (we are aware of) to report the relationship between ISD and hair
growth rate for hair groups with high curvature. The results observed in the current
study were similar to those obtained by Baque et al. for the ISD of straight hair;
however, the anticipated trend that the curliest hair ought to have the longest ISD was
not observed. The curliest hair group (6) had shorter inter scale distances than straight
hair groups (1 and 2).
Hair growth rates based ISD had no association with hair curl .Hair group 5 had an
average hair growth rate that was statistically higher than that of hair groups 1 and 4,
which was unexpected because the inverse was observed for hair growth rates based
on the TrichoScan ® platform. Further, ISD based growth rates were also observed to
be higher than TrichoScan® based results ; 1.1 ± 0.2cm/month (group 1) to 1.4 ± 0.5
cm/month (group 6) versus 0.72 ± 0.2 cm/month (group 1) to 0.39 ± 0.1 (group 6).
The growth rate based on the TrichoScan® approach was fastest for the straightest
hair (group1, 0.72 ± 0.3 cm/month), while hair groups with the greatest curvature were
significantly slower (5 and 6, 0.39 ± 0.2 and 0.39 ± 0.11 cm/month).
Of the two growth rate assessments, the TrichoScan was observed to be more
reliable, having growths that were similar to those reported by other workers
(Asian: 0.73 – 1.8 cm/month, Caucasian: 0.50 – 1.5cm/month, African: 0.5 – 0.6
cm/month)158,162.
The rate of hair growth could influence amounts of drug incorporation into the growing
hair shaft. Interestingly, hair testing studies assume a blanket growth rate of 1cm per
month for all racial groups3,6,17,126. Variations in growth rate across, ages, races and
nutritional states should be taken into consideration for all hair groups in order to
correctly interpret results obtained for various hair analyses120,126.
Ultrastructure
Several researchers have visualized the variation in the ratios and distributions of
cortical cells within the cortex of different hairs using TEM77,168. To our knowledge,
the current study is the first to show the distribution cortical cells of more than 2 hair
groups using the FLM dual staining protocol.
115
The arrangement of cortical cells was imaged by FLM using a dual staining protocol
has been used for Japanese hair90. Straight hair from Japanese volunteers was found
to be predominantly composed of paracortical cells90. In the current work, the straight
hair cortex of samples representing hair groups I to III was observed to be composed
of paracortical cells. For curlier hair groups, there were variations in the distributions
of orthocortical and paracortical. Samples from hair groups IV to VII were observed to
have an almost 1:1 distribution of these cells types, while hair groups VIII cross
sections were observed to have lower proportions of orthocortical cells.
This new dual staining techniques by FLM have been used for visualizing cortical cell
in straight hair and were found to give similar results to TEM. This study is the first
(that we are aware of) to confirm that this is also the case for African hair; FLM
techniques are cheaper and more efficient than TEM.
LIMITATIONS
One of the major limitations of the current study was recruitment of volunteers with
natural scalp hair. In spite of much advertisement only 128 participants could be
included in the study. After geometric classification the hair curl groups were unequal,
with the least number of volunteers in group 1 which is the straightest hair group and
the most were the curliest hair groups. The biggest contributors to these groups were
Asian and African volunteers respectively. Further, although an attempt was made to
collect similar numbers of samples from each group, the 8-group method that was
used initially was later shown to be unreliable (chapter 2) also contributing to unequal
numbers of participants in hair groups.
However, in spite of a small sample size, to our knowledg this is the first thesis to test
the reliability of a geometric classification and correlate hair curl with biochemistry and
other parameters.
CONCLUSIONS
This thesis is the first to comprehensively investigate the characteristics of human hair
using multiple approaches on the same sample pool. Understanding the variation in

116
human hair morphology is the doorway to elucidating the mechanism involved in
substance incorporation as well correct interpretations of hair analyses results.
This thesis supports a geometric classification with fewer groups (6 based kappa
statistics and 4, based on biochemistry); it is also the first to report correlations
between hair geometry, biochemistry and physical properties.
SUGGESTIONS FOR FUTURE WORK
Improvements on the current work could be to include more volunteers for the
assessments of other hair characteristics, particulary biochemistry (internal lipid
content and absorption of relavent FTIR bands of interest) in order to expand
components that were only explored in the current study. Additionally, an FT-IR
prediction model that correlates hair spectra with hair biochemistry would make the
use of destructive hair analysis technique for quantifying hair chemistry obsolute. This
would allow for rapid scientific classification of hair that would more reliable for use in
Medicine and Forensic Science.

117
REFERENCES
1. Robbins, C. R. in Chem. Phys. Behav. Hum. Hair 177 – 204 (2012).
2. Stenn, K. S. & Paus, R. Controls of Hair Follicle Cycling. Physiol. Rev. 81, 449–494 (2001).
3. Piraccini, B. M., Pazzaglia, M. & Tosti, A. in Hair growth Disord. (Blume-peytavi, U., Tosti, A. & Trueb, R. M.) (Springer, 2008).
4. Banirashaid, A. Forensic Research and Technology. J. Forensic Res. 4, 82 (2013).
5. Nakahara, Y. Hair analysis for te abused and therapeutic drugs. J Chromatogra B Biomed Sci Appl 733, 161–80 (1999).
6. Umweltbundtsesamt. Hair Analysis in Environmental Medicine. Bundesgesundheitsbl-Gesundheitsforsch-Gesundheitsschutz 48, 246–250 (2005).
7. Appenzeller, B. M. R. & Tsatsakis, A. M. Hair analysis for biomonitoring of environmental and occupational exposure to organic pollutants : State of the art , critical review and future needs. Toxicol. Lett. 210, 119–140 (2012).
8. Boumba, V. ., Ziavrou, K. . & Vougiouklakis, T. Hair as a biological indicator of drug use, drug abuse or chronic exposure to environmental toxicants. Int. J. Toxicol. 143 – 63 (2006).
9. Bartelink, I. H. et al. Pharmacokinetics of Lopinavir/Ritonavir and Efavirenz in Food Insecure HIV-Infected Pregnant and Breastfeeding Women in Tororo,Uganda. J. Clin. Pharmacol. XX, 1 –12 (2013).
10. Gandhi, M. et al. Atazanavir concentration in hair is the strongest predictor of outcomes on antiretroviral therapy. Clin. Infect. Dis. 1267 – 75 (2011).

118
11. Gandhi, M. & Greenblatt, R. . Hair it is: The long and short of monitoring antiretroviral treatment. Ann. Intern. Med 137, 696–697 (2002).
12. Van Zyl, G. . et al. Low lopinavir plasma or hair concentrations explain second protease inhibitor failures in a resource-limited setting. J. Acquir. Immune Defiency Syndr. 333 (2011).
13. Olds, P. . et al. Assessment of HIV antiretroviral therapy adherence by measuring drug concentrations in hair among children in rural Uganda. AIDS Care 1 – 4 (2014).
14. Staufenbiel, S. M., Penninx, B. W. J. H., Spijker, A. T., Elzinga, B. M. & van Rossum, E. F. C. Hair cortisol, stress exposure, and mental health in humans: a systematic review. Psychoneuroendocrinology 38, 1220–35 (2013).
15. Karlén, J., Ludvigsson, J., Frostell, A., Theodorsson, E. & Faresjö, T. Cortisol in hair measured in young adults - a biomarker of major life stressors ? BMC Clin. Pathol. 11, 12 (2011).
16. Sauve, B., Koren, G., Walsh, G., Tokmakejian, S. & Uum, S. Van. Measurement of cortisol in human hair as a biomarker of systemic exposure. Clin Invest Med 30, E183–91 (2007).
17. Kirschbaum, C., Tietze, A., Skoluda, N. & Dettenborn, L. Hair as a retrospective calendar of cortisol production –— Increased cortisol incorporation into hair in the third trimester of pregnancy. 32–37 (2009). doi:10.1016/j.psyneuen.2008.08.024
18. Wołowiec, P., Michalak, I., Chojnacka, K. & Mikulewicz, M. Hair analysis in health assessment. Clin. Chim. Acta 419, 139–171 (2013).
19. Oimomi, M., Masuda, S., Igaki, N. & Nakamichi, T. Glycation of Hair Protein in the Assessment of Long-term Control of Blood Glucose. Japanese J. Med. 27, 277–280 (1988).
20. Hijazy, M. in Princ. Pediatr. Dermatology (2008).

119
21. Ebling, F. J. The activity of the hair follicle. J. Soc. Cosmet. Chem. 15, 447 – 457 (1964).
22. Robbins, C. R. in Chem. Phys. Behav. Hum. Hair 1 – 104 (2012). doi:10.1007/978-3-642-25611-0
23. Hardy, M. H. The secret life of the hair follicle. Trends Genet. 8, 55–61 (1992).
24. Paus, R. et al. A Comprehensive Guide for the Recognition and Classification of Distinct Stages of Hair Follicle. 523–532 (1999).
25. Botchkarev, V. A. & Paus, R. Molecular biology of hair morphogenesis: development and cycling. J. Exp. Zool. B. Mol. Dev. Evol. 298, 164–180 (2003).
26. Chi, W., Wu, E. & Morgan, B. A. Dermal papilla cell number specifies hair size, shape and cycling and its reduction causes follicular decline. Development 140, 1676–83 (2013).
27. Higgins, C. A., Chen, J. C., Cerise, J. E., Jahoda, C. A. B. & Christiano, A. M. Microenvironmental reprogramming by three-dimensional culture enables dermal papilla cells to induce de novo human hair-follicle growth. Proc. Natl. Acad. Sci. U. S. A. 110, 19679–88 (2013).
28. Rogers, G. E. Hair follicle differentiation and regulation. Int. J. Dev. Biol. 48, 163–70 (2004).
29. Fukuyama, K., Inuoe, N., Suzuki, H. & Epstein, W. Keratinization. Int. J. Dermatol. 15, 473 – 489 (1976).
30. Philpott, M. & Paus, R. in Mol. basis Epithel. appendage Morphog. (Chuong, C. .) 75 – 103 (Landes Bioscience Publication, 1998).
31. Birbeck, M. S. & Mercer, E. H. The electron microscopy of the human hair follicle. Part 1. Introdcution and the hair cortex. J. Biophys. Biochem. Cytol. 3, (1957).

120
32. Feughelman, M. & South, N. The physical properties of alpha-keratin fibers. 406, 385–406 (1982).
33. Zahn, H. Progress report on hair keratin research. Int. J. Cosmet. Sci. 24, 163 – 169 (2002).
34. Cooper, G. . & Sunderland, M. . The Cell: A Molecular Approach. (Sinauer Associates, 2000).
35. Yang, F., Zhang, Y. & Rheinst, M. C. The structure of people ’ s hair. (2014). doi:10.7717/peerj.619
36. Langbein, L. The Catalog of Human Hair Keratins. I. EXPRESSION OF THE NINE TYPE I MEMBERS IN THE HAIR FOLLICLE. J. Biol. Chem. 274, 19874–19884 (1999).
37. Dunn, S. M., Keough, R. a, Rogers, G. E. & Powell, B. C. Regulation of a hair follicle keratin intermediate filament gene promoter. J. Cell Sci. 111 ( Pt 2, 3487–96 (1998).
38. Hoffmann, R. & McElwee, K. J. Hair follicle mesenchymal stem cells and use thereof. (2013).
39. Robbins, C. R. Chemical and Physical Behaviour of Human Hair. (1994).
40. Thibaut, S., Gaillard, O., Bouhanna, P., Cannell, D. . & Bernard, B. Human hair shape is programmed from the bulb. Br. J. Dermatol. 152, 632–8 (2005).
41. Blount, M., Goff, S. & Slusarewicz, P. In vitro degradation of the inner root sheath in human hair follicles lacking sebaceous glands. Br. J. Dermatol. 158, 22 – 30 (2008).
42. Alonso, L. & Fuchs, E. The hair cycle. J. Cell Sci. 119, 391–393 (2006).
43. Kealey, T., Philpott, M. & Guy, R. The regulatory biology of the human pilosebasecous unit. Baillieres. Clin. Obstet. Gynaecol. 11, 205 – 227

121
(1997).
44. Shimomura, Y. & Christiano, A. M. Biology and Genetics of Hair. Annu Rev Genomics Hum Genet. 11, 109 – 32 (2010).
45. Morioka, K. Hair Cortex and Hair Cuticle. Hair Follicle Differ. Under Electron … (2005). at <http://link.springer.com/content/pdf/10.1007/4-431-27179-1_3.pdf>
46. Bernard, B. A. Hair biology: an update. Int. J. Cosmet. Sci. 24, 13 –16 (2002).
47. Krause, K. & Foitzik, K. Biology of the Hair Follicle: The Basics. Semin. Cutan. Med. Surg. 25, 2–10 (2006).
48. Paus, R. Principles of hair cycle control. J. Dermatol. 25, 793–802 (1998).
49. Schneider, M. R., Schmidt-Ullrich, R. & Paus, R. The hair follicle as a dynamic miniorgan. Curr. Biol. 19, R132–42 (2009).
50. Rogers, G. E. Electron microscopy of wool. J. Ultrastruct. Res. 2, 309 – 330 (1959).
51. Panteleyev, A. A., Jahoda, C. A. B. & Christiano, A. M. Hair follicle predetermination. J. Cell Sci. 114, 3419 – 3431 (2001).
52. Stenn, KS., Parimoo, S and Prouty, S. Growth of the hair follicle: a cycling and regenerating biological system. In: Molecular Basis of Epithelial Appendage Morphogenesis. (1998).
53. Araújo, R., Fernandes, M. & Cavaco-paulo, A. Biology of Human Hair : Know Your Hair to Control It. (2010). doi:10.1007/10
54. Paus, R., Muller-Rover, S. & Botchkarev, V. A. Chronobiology of the hair follicle: hunting the ‘ hair cycle clock’. J. Investig. Dermatol. Symp. Proc. 4, 338–345 (1999).

122
55. Wolfram, L. J. Human hair: a unique physicochemical composite. J. Am. Acad. Dermatol. 48, S106–14 (2003).
56. Randall, V. A. Androgens and hair : a biological paradox. 207–232
57. Trotter, M. A review of the classifications of hair. Am. J. Phys. Anthropol. 24, 105–126 (1938).
58. Schlake, T. Determination of hair structure and shape. Semin. Cell Dev. Biol. 18, 267–273 (2007).
59. Lindelof, B., Forslind, B., Hedblad, M. & Kaveus, U. Human hair morphology revealed by light and scanning electronmicroscopy and computer aided three-dimensional reconstruction. Arch Dermatol 124, 1359–63 (1988).
60. Thibaut, S., Barbarat, P., Leroy, F. & Bernard, B. A. Human hair keratin network and curvature. 46, 7–10 (2007).
61. Robbins, C. R. Chemical compositon of different hair types. (Springer Berlin Heidelberg, 2012). doi:10.1007/978-3-642-25611-0
62. Porter, C. E. et al. The behavior of hair from different countries. 109, 97–109 (2009).
63. De La Mettrie, R. et al. Shape Variability and Classification of Human Hair: A Worldwide Approach. Hum. Biol. 79, 265–281 (2007).
64. Davis-Sivasothy, A. The Science of Black Hair: A Comprehensive Guide to Textured Hair: (Saja Publishing, 2011). at <https://books.google.co.za/books?id=WQAZAgAAQBAJ>
65. http:/www.andrewalkerhair.com/v/vspfiles/templates/140/Hair-Typing-System.asp.
66. Webpage. www.healthyhairdimensions.com/?page_id=71.

123
67. Bigby, M. & Thaler, D. Describing patient’s ‘race’ in clinical presentations should be abandoned. J. Am. Acad. Dermatol. 54, 1074 – 6 (2006).
68. Khumalo, N. P. Yes, let’s abandon race - It does not accurately correlate with hair form. J. Am. Acad. Dermatol. 56, 709–710 (2007).
69. Loussouarn, G. et al. Worldwide diversity of hair curliness : a new method of assessment. (2007).
70. Bailey & Schliebe, S. The Presicion of average curvature meaurement. In Human Hair:Proceedings of the Symposium on Forensic Hair Comparisons, Federal Bureau of Investigation, ed. Washing, DC: US Govenment Printing Office. (1985).
71. Hrdy, D. Quantitative hair form variation in seven populations. Am. J. Phys. Anthropol. 39, 7 –18 (1973).
72. Ogle, R. J. & Fox, M. J. Atlas of Human Hair Microscopic Characteristics. (CRC Press LLC, 1999).
73. Cruz, C. F. et al. Keratins and lipids in ethnic hair. Int. J. Cosmet. Sci. 35, 244–9 (2013).
74. Wolfram, L. J. & Lindemann, M. . Some observations of the hair cuticle. J. Soc. Cosmet. Chem. 22, 839 – 856 (1971).
75. Areida, S. K., Ismail, M. F., Hady, E. K. A. & Osman, A. O. Molecular Characterization of the Hair Cuticle and its Extracted Proteins in Seven Mammalian Species. Egypt. J. Hosp. Med. 23, 287–308 (2006).
76. Robbins, C. R. in Chem. Phys. Behav. Hum. Hair 537 – 640 (Springer-Verlag Berlin Heidelberg, 2012). doi:10.1007/978-3-642-25611-0
77. Leon, H. Structural aspects of keratin fibres. 445, (1972).
78. Bradbury, J. H., Chapman, G. ., Hambly, A. . & King, N. L. . Separation of chemically unmodified histological components of hair fibres and

124
analyses of cuticles. Nature 210, 1333 – 1334 (1966).
79. Swift, J. A. & Bews, B. . The chemistry of the human hair cuticle: part 3: Isolation and amino acid analysis of sufractions of cuticle obtained by pronase and trypsin difestion. J. Cosmet. Sci. 27, 289 – 300 (1976).
80. Robbins, C. R. & Crawford, R. Cuticle damage and the tensile properties of human hair. J. Soc. Cosmet. Chem. 42, 59 –67 (1991).
81. Fraser, R. D. ., MacRae, T. . & Rogers, G. E. in Keratins , Thier Compos. Struct. Biosynthesis. (1972).
82. Popescu, C. & Hocker, H. Hair - the most sohpisticated biological composite. Chem. Soc Rev. 36, 1282 – 1291 (2007).
83. Kassenbeck, P. in Hair Res. (Orfanos, C. ., Montagna, W. & Stuttgen, G.) 52 – 64 (Springer-Verlag Berlin, 1981).
84. Mowat, I., Parmar, R. ., Speakmann, P. . & Woodhouse, M. Crimp, Amino-acid Composition, and the Proportion of Orthocortical, Paracotival and Mesocortical Cells in Wool from Different Breeds of Sheep. J. Text. Inst. 73, 246 – 248 (1982).
85. Harland, D. P., Vernon, J. A., Walls, R. J. & Woods, J. L. Transmission electron microscopy staining methods for the cortex of human hair : a modified osmium method and comparison with other stains. 243, 184–196 (2011).
86. Takizawa, T., Takizawa, T., Uchiwa, H. & Arai, S. Ultrastructural Localization of Hair Keratins in Human Scalp Hair Shafts as Revealed by Rapid-Freezing Immunocytochemistry. Acta Histochem. Cytochem. 31, 237–242 (1998).
87. Orwin, D. F. ., Woods, J. L. & Ranford, S. . Cortical cell types and thier distribution in wool fibres. Aust. J. Biol. Sci. 37, 237 – 255 (1984).
88. Caldwell, J. P., Mastronarde, D. ., Woods, J. L. & Bryson, W. G. The three dimensional arrangement of intermediate filaments in Romney wool

125
cortical cells. J. Struct. Biol. 151, 298 – 305 (2005).
89. Harland, D. P., Caldwell, J. P., Woods, J. L., Walls, R. J. & Bryson, W. G. Arrangement of trichokeratin intermediate filaments and matrix in the cortex of Merino wool. J. Struct. Biol. 173, 29 – 37 (2011).
90. Bryson, W. G. et al. Cortical cell types and intermediate filament arrangements correlate with fiber curvature in Japanese human hair. J. Struct. Biol. 166, 46–58 (2009).
91. Harland, D. P. et al. Three-dimensional architecture of macrofibrils in the human scalp hair cortex. J. Struct. Biol. 185, 397–404 (2014).
92. Kamath, Y., Hornby, S. & Weigmann, H. Mechanical and fractographic behavior of negroid hair. J Soc Cosmet Chem 43, 21–43 (1984).
93. Robbins, C. R. in Chem. Phys. Behav. Hum. Hair 105 – 176 (Springer-Verlag Berlin Heidelberg, 2012).
94. Khumalo, N., Dawber, R. & Ferguson, D. Apparent fragility of African hair is unrelated to the cystine-rich protein distribution : a cytochemical electron microscopic study. 311–314 (2005).
95. Hutchinson, P. E. & Thompson, J. R. The size and form of the medulla of human scalp hair is regulated by the hair cycle and cross-sectional size of the hair shaft. Br. J. Dermatol. 140, 438–445 (1999).
96. Yoshida, H. et al. Keratins of the human occipital hair medulla: androgenic regulation of in vitro hair keratin K37 expression. Br. J. Dermatol. 169, 218–21 (2013).
97. Clay, R., Cook, K. & Routh, J. I. Studies in the composition of human hair. J Am Chem Soc 62, 2709–2710 (1940).
98. Curry, K. V. & Golding, S. Hair lipids -I. The extraction of fatty materials from hair clippings. J. Soc. Cosmet. Chem. 22, 681 – 699 (1971).

126
99. Coderch, L. et al. Lamellar rearrangement of internal lipids from human hair. Chem. Phys. Lipids 155, 1–6 (2008).
100. Masukawa, Y., Narita, H. & Imokawa, G. Characterization of the lipid composition at the proximal root regions of human hair. J. Cosmet. Sci. 56, 1–16 (2005).
101. Lee, W.-S. Integral hair lipid in human hair follicle. J. Dermatol. Sci. 64, 153–158 (2011).
102. Koch, J., Aitzetmuller, K., Horf, G. . & Waibel, J. Hair lipids and their contribution to the perception of hair oiliness: part 1: surface and internal lipids in hair. J. Soc. Cosmet. Chem. 33, 317 – 326 (1982).
103. Evans, D. . & Lanezki, M. Cleavage of intergral surface lipids of wool by aminolysis. Textilw Res. J. 67, 435 – 444 (1997).
104. Bhushan, B. & Chen, N. AFM studies of environmental effects on nanomechanical properties and cellular structure of human hair. Ultramicroscopy 106, 755–764 (2006).
105. Duvel, L., Chun, H., Deppa, D. & Wertz, P. W. Analysis of hair lipids and tensile properties as a function of distance from scalp. 193–197 (2005).
106. Lyman, J. D. & Murray-Wiljelath, J. Fourier transform infrared attenuated total reflection analysis of human hair: comparison of hair from breast cancer patients with hair from healthy subjects. Appl. Spectrosc. 59, 26 –32 (2005).
107. Lyman, J. D. & Fay, G. S. The effect of breast cancer on the Fourier transform infrared attenuated total reflection spectra of human hair. eCancer Med. Sci. 405, (2014).
108. James, V., Kearsley, J., Irving, T., Amemiya, Y. & Cookson, D. Using hair to screen for breast cancer. Nature 398, 33–34 (1999).
109. Ajose, F. O. A. Diseases that turn African hair silky. Int. J. Dermatol. 51, 12 – 16 (2012).

127
110. Schräder, J., Rothe, M. & Pragst, F. Ethyl glucuronide concentrations in beard hair after a single alcohol dose: evidence for incorporation in hair root. Int. J. Legal Med. 126, 791–9 (2012).
111. Measurement of Cortisol in Hair : Some Recent Investigations. 2–6
112. Pragst, F. & Balikova, M. . Sate of the art in hair analysis for the detection of drug and alcohol abuse. Clin. Chim. Acta 370, 17 – 49 (2006).
113. James, V. J. A place for fiber diffraction in the detection of breast cancer ? Cancer Detect. Prev. 30, 233–238 (2006).
114. Zhang, G., Senak, L. & Moore, D. J. Measuring changes in chemistry, composition, and molecular structure within hair fibers by infrared and Raman spectroscopic imaging. J. Biomed. Opt. 16, 056009 (2011).
115. James, V. Fibre diffraction from a single hair can provide an early non-invasive test for colon cancer. Med Sci Mon It 7, MT79 – 84 (2003).
116. Barton, P. M. J. A Forensic Investigation of Single Human Hair Fibres using FTIR-ATR Spectroscopy and Chemometrics. (2011).
117. Lin, S.-Y., Li, M.-J. & Cheng, W.-T. FT-IR and Raman vibrational microspectroscopies used for spectral biodiagnosis of human tissues. Spectroscopy 21, 1 – 30 (2007).
118. Lyman, J. D. & Schofield, P. Attenuated total reflection Fourier transform spectroscopy analysis of human hair fibre structure. Appl. Spectrosc. 62, 525 – 535 (2008).
119. Little, J. . & Kridel, S. . Fatty acid synthases are expressed in cancer. Subcell Biochem 49, 169 – 94 (2008).
120. Mieczkowski, T. The Further Mismeasure : The Curious Use of Racial Categorizations in the Interpretation of Hair Analyses. Int. J. Drug Test. 2, 1–20 (1999).

128
121. Gray, J. Human hair diversity. (Wiley, 2001).
122. Ogle, R. J. & Fox, M. J. Atlas of Human Hair: Microscopic Characteristics (Google eBook). (CRC Press LLC, 1999). at <http://books.google.com/books?id=-WdtFZoZVOgC&pgis=1>
123. Wickenheiser, R. A. & Hepworth, D. G. Further evaluation of probabilities in human scalp hair comparisons. J. Forensic Sci. 35, 1323–1329 (1990).
124. Khumalo, N. P., Gumedze, F., Lehloenya, R. & Ward, G. Folliculitis keloidalis nuchae is associated with the risk for bleeding from haircuts. Int. J. Dermatol. 50, 1212 – 1216 (2011).
125. Khumalo, Nonhlanhla P., Callender, V. D. in Hair growth Disord. 483 – 497 (Springer US, 2008).
126. Russell, E., Koren, G., Rieder, M. & Uum, S. Van. Hair cortisol as a biological marker of chronic stress : Current status , future directions and unanswered questions. Psychoneuroendocrinology 37, 589–601 (2012).
127. McHugh, M. L. Interrater reliability: the kappa statistic. Biochem. Medica 22, 276 – 82 (2012).
128. Viera, A. J. & Garret, J. M. Understanding the Interobserver Agreement: The Kappa Statistic. Fam. Med. 37, 360 –3 (2005).
129. Cohen, J. . A coefficient of agreement for nominal scales. Educ. Psychol. Meas. 20, 37 – 46 (1960).
130. Landis, J. . & Koch, G. . The measuremenet of observer agreement for categorical data. Biometrics 33, 159 – 74 (1977).
131. Bryant, H., Porter, C. & Yang, G. Curly hair: measured differences and contributions to breakage. Int. J. Dermatol. 51, 8 – 11 (2012).
132. Gandhi, M. et al. Protease inhibitor levels in hair samples strongly predict

129
virologic responses to HIV treatment. AIDS 471 (2009).
133. Shah, S. . et al. Simultaneous analysis of antiretroviral drugs abacavir and tenofovir in human hair by liquid chromatography-tandem mass spectrometry. J. Pharm. Biomed. Anal. 308 – 13 (2013).
134. Thibaut, S. et al. Hair keratin pattern in human hair follicles grown in vitro. 160–164 (2003).
135. Dekoi, S. & Jidoi, J. Amounts of fibrous and matrix substances in hairs of differenet races. J. Dermatol. Sci. 17, 62– 4 (1990).
136. Dekoi, S. & Jidoi, J. Hair low-sulphur protein composition does not differ electrophoretically among different races. J. Dermatol. Sci. 15, 393 – 6 (1988).
137. Franbourg, A., Hallegot, P., Baltenneck, F., Toutain, C. & Leroy, F. Current research on ethnic hair. J. Am. Acad. Dermatol. 48, S115 – 9 (2003).
138. Jones, L. . Hair structure anatomy and comparative anatomy. Clin. Dermatology 19, 95 – 103 (2001).
139. Allen, A. ., Ellis, J. & Rivett, D. . The presence of glycoproteins in the cell membrane complex of a variety of keratin fibres. Biochem. Biophys. Acta 1074, 331 – 333 (1991).
140. Kreplak, L. et al. Profiling lipids across Caucasian and Afro-American hair transverse cuts , using synchrotron infrared microspectrometry. 369–374 (2001).
141. Jones, L. . & Rivett, D. . The role of 18-methyleicosanoic acid in the structure and formation of mammalian hair fibres. Micron 28, 469 – 485 (1997).
142. Bertrand, L., Doucet, J., Simionovici, A., Tsoucaris, G. & Walter, P. Lead-revealed lipid organization in human hair. Biochim. Biophys. Acta - Gen. Subj. 1620, 218–224 (2003).

130
143. Bramanti, E. et al. A new approach to the study of human hair by means of FT-IR microspectroscopy. 296, 285–296 (1992).
144. Doyle, W. M. Principles and Applications of Fourier Transform Infrared (FTIR) Process Analysis.
145. Staurt, B. Infrared Spectroscopy: Fundamentals and Applications. (2004).
146. Gallagher, W. FTIR Analysis of Protein Structure. 662–666 (1997).
147. Panayiotou, H. & Kokot, S. Matching and discrimination of single human-scalp hairs by FT-IR micro-spectroscopy and chemometrics. Anal. Chim. Acta 392, 223–235 (1999).
148. Cheng, Y.-S., Zheng, Y. & VanderGheynst, J. Rapid Quantitative Analysis of Lipids Using a Colorimetric Method in a Microplate Format. Lipids 46, 95–103 (2011).
149. Knight, J. A., Anderson, S. & Rawle, J. M. Chemical basis of the sulfo-phospho-vanillin reaction for estimating total serum lipids. Clin. Chem. 18, 199–202 (1972).
150. Johnson, K. R., Ellis, G. & Toothill, C. The sulfophosphovanillin reaction for serum lipids: a reappraisal. Clin. Chem. 23, 1669–1678 (1977).
151. Kyriacou, K. COASTAL RESOURCES AND NUTRITION AMONG MIDDLE STONE AGE HUNTER-GATHERERS IN THE SOUTHWESTERN CAPE. (2014).
152. Centerchem, I. Sunflower Oil.
153. McMahon, A., Lu, H. & Butovich, I. A. The Spectrophotometric Sulfo-Phospho-Vanillin Assessment of Total Lipids in Human Meibomian Gland Secretions. Lipids 48, 513–525 (2013).
154. Mishra, S. K. et al. Rapid quantification of microalgal lipdis in aqueous medium by a simple colorimetric method. Bioresour. Technol. 155, 330 –

131
333 (2014).
155. Takahashi, T. & Yoshida, S. Distribution of Glycolipid an Unasturated Fatty Acids in Human hair. Lipids 49, 905 – 917 (2014).
156. Ning, Y.-C. Interpretation of Organic Spectra. (John WIley & Sons (Asia) Pte Ltd, 2011).
157. Zhang, G., Moore, D. J., Zhang, G., Senak, L. & Moore, D. J. Measuring changes in chemistry , composition , and molecular structure within hair fibers by infrared and Raman spectroscopic imaging Measuring changes in chemistry , composition , and molecular structure within hair fibers by infrared and Raman spectrosc. doi:10.1117/1.3580286
158. Loussouarn, G., Rawadi, E. & Genain, G. Diversity of hair growth profiles. Int. J. Dermatol. 44, 6 – 9 (2005).
159. Saint Olive Baque, C. et al. Relationships between hair growth rate and morphological parameters of human straight hair: A same law above ethnical origins? Int. J. Cosmet. Sci. 34, 111–116 (2012).
160. Seshadri, I. P. & Bhushan, B. Effect of ethnicity and treatments on in situ tensile response and morphological changes of human hair characterized by atomic force microscopy. Acta Mater. 56, 3585–3597 (2008).
161. Loussouarn, G. African hair growth parameters. Br. J. Dermatol. 145, 294–7 (2001).
162. McMicheal, A. Ethnic hair update: past and present. J. Am. Acad. Dermatol. 48, S127–33 (2003).
163. L.M. Dowling, R. D. R. K. F. L. A Novel Route to the Isolation of Ortho and Para Cortical Cells from Merino Wool. in Proc. 8th Int. Wool Text. Res. Conf. I, 214 –224 (1990).
164. Abramoff, M. D., Magalhaes, P. J. & Ram, S. J. Image processing with ImageJ. Biophotonics Int. 11, 36 – 42 (2004).

132
165. Swift, J. a. The mechanics of fracture of human hair. Int. J. Cosmet. Sci. 21, 227–239 (1999).
166. Hoffmann, R. TrichoScan: A Novel Tool For The Analysis of Hair Growth In Vivo. J Investig Dermatol Symp Proc 8, 109–115 (2003).
167. Gassmueller, J., Rowold, E., Frase, T. & Hughes-Formella, B. Validation of TrichoScan technology as a fully-automated tool for evaluation of hair growth parameters. Eur. J. Dermatol. 19, 224–231 (2009).
168. Swift, J. A. in Form. Struct. Hair (Jolles, P., Zahn, H. & Hocker, H.) 171 (Birkhauser Verlag, Basel, 1997).
169. Marques, P. R. Factors To Consider When Using Hair as a Cocaine-Exposure Measure for Mothers or Newborns. 183–197 (1991).
170. Menefee, E. Component distributions in keratins and their estimation from amino acid analyses. 30, 17–30 (1985).
171. Barba, C., Martí, M., Carilla, J., Manich, A. . & Coderch, L. The effect of internal lipids on the water soprtion kinetics of keratinized tissues. J Therm Anal Calorim (2015).
172. Lee, J. & Kwon, H. J. Measurement of stress-strain behaviour of human hair fibres using optical techniques. Int. J. Cosmet. Sci. 35, 238–243 (2013).

133
ADDENDUM 1:
Absorption of cancer associated lipid band across hair groups
Absorption of C-H lipid band at 1481cm-1
I II III IV V VI VII VIII0.00
0.02
0.04
0.06
**
**//
//
\\
\\
* *++ ++
+++
+++
***
***
$$$
$$$
!!! !!!
Hair Curl Group
Pe
ak
Inte
nsi
ty (
Ab
s)
1 2 3 4 5 60.00
0.02
0.04
0.06Absorption of C-H lipid band at 1481cm
-1
**
Hair Curl Group
Pe
ak I
nte
nsity (
Ab
s)
When the absorption of the cancer associated lipid peak (1400 – 1500 cm-1) was
investigated, spurious results were observed for the 8-group classification. The
absorption of this C-H band was observed to be uniform for the 6-group classification,
although hair group 3 was significantly higher than 1. The absorbance for this band
ranged from 0.0220 to 0.00240 across the 6 groups. No major differences were
observed for the adsorption of the C-H 1481 cm-1 with variations in hair morphology
for the 6-group classification.
This uniformity of this peak (at 1481 cm-1) in healthy patients confirms that this band
is suitable region for indications of baseline characteristics of lipids. Elevated peak
intensities in this region have been reported in hair samples from patients with breast
cancer107. Interestingly, this peak did not require derivatization to separate it from other
peaks, as reported in the cancer study107. Other peaks might however be present in
this range (1400 – 1500 cm-1) that might require spectral processing.

134
ADDENDUM 2:
Kappa statistics for 4-group classification
Following indications from FTIR data analysis that a 4-group classification might be
more reliable, the reliability of this classification was investigated. The 8-group
classification was merged into 4 groups (I & II (A), III & IV (B), V & VI (C) and VII & VIII
(D)). Improved inter and intrarater statistics for this merged classification were
observed and are shown in Table 1 and Table 2 below.
An improved inter-rater agreement was observed for the 4-group classification, k =
0.610 (95% CI 0.513 – 0.707), compared to the 8-groups (k = 0.380, 95% CI 0.313 –
0.447). The intra-rater agreement ranged for the between evaluators for the 4 groups
was k =0.581 (95% CI: 0.421 – 0.741) to k = 0.701 (95% CI 0.525 – 0.8277) while that
for the 8 groups had been k = 0.444 (95% CI; 0.334 – 0.553) to k = 0.648 (95% CI;
0.525 – 0.771). The results for the 8-group classification are reported in Chapter Two
( Tables 2-1 and 2-2).
Table 1: Inter-rater agreement when 8-group classification n is reduced to 4
groups: 3 evaluators
Hair Group Kappa 95% CI
A 0.699 0.533 – 0.866
B 0.658 0.491 – 0.825
C 0.447 0.281 – 0.614
D 0.601 0.435 – 0.787
Combined 0.610 0.513 – 0.707
Table 2: Intra-rater agreement (3 evaluators, 4-group classification)
Agreement Exp. Agreement Kappa 95% CI
Evaluator 1 75.00% 25.35% 0.665 0.503 - 0.827
Evaluator 2 68.75% 25.43% 0.581 0.421 - 0.741
Evaluator 3 79.17% 30.25% 0.701 0.525 - 0.877