
Mitochondrial DNA markers of loggerhead marine turtles (Caretta caretta) (Testudines: Cheloniidae)...
10
Mitochondrial DNA markers of loggerhead marine turtles (Caretta caretta) (Testudines: Cheloniidae) nesting at Kyparissia Bay, Greece, confirm the western Greece unit and regional structuring Carlos Carreras 1 , ALan F. Rees 1,2 , Annette C. Broderick 1 , Brendan J. Godley 1 , Dimitris Margaritoulis 2 1 Marine Turtle Research Group, College of Life and Environmental Sciences, University of Exeter, Cornwall Campus, Penryn, Cornwall, TR10 9EZ, UK. E-mail. [email protected] 2 ARCHELON, the Sea Turtle Protection Society of Greece, Solomou 57, GR-104 32, Athens, Greece. Summary: Genetic markers have been widely used in marine turtles to assess population structuring and origin of individuals in common feeding grounds, which are key elements for understanding their ecology and for developing conservation strategies. However, these analyses are very sensitive to missing information, especially from abundant nesting sites. Kyparissia Bay (western Greece) hosts the second largest Mediterranean nesting aggregation of the loggerhead turtle (Caretta caretta), but the genetic profile of this nesting site has not, as yet, been described using the extended version of the historically used mitochondrial DNA (mtDNA) marker. This marker was genotyped for 36 individuals nesting at Kyparissia Bay and haplotype frequencies obtained were compared with published data from other Mediterranean nesting sites. The results confirmed the connection between Kyparissia and other western Greek nesting sites and the isolation of this western Greek group from other Mediterranean nesting areas. As a consequence of this isolation, this abundant group of nesting aggregations (almost 30% of the Mediterranean stock) is not likely to significantly contribute to the recovery of other declining Mediterranean units. Keywords: population structure; endangered species; conservation; Caretta; Mediterranean; mitochondrial DNA. El uso de marcadores de ADN mitocondrial en tortuga boba (Caretta caretta) (Testudines: Cheloniidae) nidificando en la bahía de Kyparissia, Grecia, confirma la unidad de Grecia oriental y la estructuración regional Resumen: El uso de marcadores genéticos ha sido muy extendido en tortugas marinas con el fin de determinar la estructura poblacional y el origen de individuos en zonas comunes de alimentación; elementos clave para entender su ecología y desa- rrollar estrategias efectivas de conservación. Sin embargo, este tipo de análisis es muy sensible a la falta de información de ciertas zonas de nidificación, especialmente de aquellas muy abundantes. El perfil genético de las tortugas nidificantes de la bahía de Kyparissia (Grecia occidental) todavía no ha sido descrito usando la versión extendida del marcador mitocon- drial (mtDNA) usado históricamente en esta especie, a pesar de ser la segunda zona de nidificación más abundante de todo el Mediterráneo. Con el fin de cubrir este vacío de información, se secuenciaron 36 individuos nidificantes de la bahía de Kyparissia y se compararon las frecuencias de haplotipos obtenidas con datos publicados de otras zonas de nidificación del Mediterráneo. Los resultados confirmaron la conexión entre Kyparissia y otras zonas de nidificación de Grecia así como el aislamiento de este grupo de Grecia occidental con el resto de zonas de nidificación del Mediterráneo. Como consecuencia de este aislamiento, todo parece indicar que este abundante grupo de zonas de nidificación (casi el 30% de la producción del Mediterráneo) no podría contribuir de forma significativa a la recuperación del número de hembras nidificantes en otras poblaciones en declive del Mediterráneo. Palabras clave: estructura poblacional; especie amenazada; conservación; Caretta; Mediterráneo; ADN mitocondrial. Citation/Como citar este artículo: Carreras C., Rees A.F., Broderick A.C., Godley B.J., Margaritoulis D. 2014. Mitochondrial DNA markers of loggerhead marine turtles (Caretta caretta) (Testudines: Cheloniidae) nesting at Kyparissia Bay, Greece, confirm the western Greece unit and regional structuring. Sci. Mar. 78(1): 115-124. doi: http://dx.doi. org/10.3989/scimar.03865.27B Editor: J. Viñas. Received: April 12, 2013. Accepted: October 25, 2013. Published: February 21, 2014. Copyright: © 2014 CSIC. This is an open-access article distributed under the Creative Commons Attribution-Non Commercial Lisence (by-nc) Spain 3.0. SCIENTIA MARINA 78(1) March 2014, 115-124, Barcelona (Spain) ISSN-L: 0214-8358 doi: http://dx.doi.org/10.3989/scimar.03865.27B
Transcript of Mitochondrial DNA markers of loggerhead marine turtles (Caretta caretta) (Testudines: Cheloniidae)...

Mitochondrial DNA markers of loggerhead marine turtles (Caretta caretta) (Testudines: Cheloniidae)
nesting at Kyparissia Bay, Greece, confirm the western Greece unit and regional structuring
Carlos Carreras 1, ALan F. Rees 1,2, Annette C. Broderick 1, Brendan J. Godley 1, Dimitris Margaritoulis 2
1 Marine Turtle Research Group, College of Life and Environmental Sciences, University of Exeter, Cornwall Campus, Penryn, Cornwall, TR10 9EZ, UK. E-mail. [email protected]
2 ARCHELON, the Sea Turtle Protection Society of Greece, Solomou 57, GR-104 32, Athens, Greece.
Summary: Genetic markers have been widely used in marine turtles to assess population structuring and origin of individuals in common feeding grounds, which are key elements for understanding their ecology and for developing conservation strategies. However, these analyses are very sensitive to missing information, especially from abundant nesting sites. Kyparissia Bay (western Greece) hosts the second largest Mediterranean nesting aggregation of the loggerhead turtle (Caretta caretta), but the genetic profile of this nesting site has not, as yet, been described using the extended version of the historically used mitochondrial DNA (mtDNA) marker. This marker was genotyped for 36 individuals nesting at Kyparissia Bay and haplotype frequencies obtained were compared with published data from other Mediterranean nesting sites. The results confirmed the connection between Kyparissia and other western Greek nesting sites and the isolation of this western Greek group from other Mediterranean nesting areas. As a consequence of this isolation, this abundant group of nesting aggregations (almost 30% of the Mediterranean stock) is not likely to significantly contribute to the recovery of other declining Mediterranean units.
Keywords: population structure; endangered species; conservation; Caretta; Mediterranean; mitochondrial DNA.
El uso de marcadores de ADN mitocondrial en tortuga boba (Caretta caretta) (Testudines: Cheloniidae) nidificando en la bahía de Kyparissia, Grecia, confirma la unidad de Grecia oriental y la estructuración regional
Resumen: El uso de marcadores genéticos ha sido muy extendido en tortugas marinas con el fin de determinar la estructura poblacional y el origen de individuos en zonas comunes de alimentación; elementos clave para entender su ecología y desa-rrollar estrategias efectivas de conservación. Sin embargo, este tipo de análisis es muy sensible a la falta de información de ciertas zonas de nidificación, especialmente de aquellas muy abundantes. El perfil genético de las tortugas nidificantes de la bahía de Kyparissia (Grecia occidental) todavía no ha sido descrito usando la versión extendida del marcador mitocon-drial (mtDNA) usado históricamente en esta especie, a pesar de ser la segunda zona de nidificación más abundante de todo el Mediterráneo. Con el fin de cubrir este vacío de información, se secuenciaron 36 individuos nidificantes de la bahía de Kyparissia y se compararon las frecuencias de haplotipos obtenidas con datos publicados de otras zonas de nidificación del Mediterráneo. Los resultados confirmaron la conexión entre Kyparissia y otras zonas de nidificación de Grecia así como el aislamiento de este grupo de Grecia occidental con el resto de zonas de nidificación del Mediterráneo. Como consecuencia de este aislamiento, todo parece indicar que este abundante grupo de zonas de nidificación (casi el 30% de la producción del Mediterráneo) no podría contribuir de forma significativa a la recuperación del número de hembras nidificantes en otras poblaciones en declive del Mediterráneo.
Palabras clave: estructura poblacional; especie amenazada; conservación; Caretta; Mediterráneo; ADN mitocondrial.
Citation/Como citar este artículo: Carreras C., Rees A.F., Broderick A.C., Godley B.J., Margaritoulis D. 2014. Mitochondrial DNA markers of loggerhead marine turtles (Caretta caretta) (Testudines: Cheloniidae) nesting at Kyparissia Bay, Greece, confirm the western Greece unit and regional structuring. Sci. Mar. 78(1): 115-124. doi: http://dx.doi.org/10.3989/scimar.03865.27B
Editor: J. Viñas.
Received: April 12, 2013. Accepted: October 25, 2013. Published: February 21, 2014.
Copyright: © 2014 CSIC. This is an open-access article distributed under the Creative Commons Attribution-Non Commercial Lisence (by-nc) Spain 3.0.
Scientia Marina 78(1)March 2014, 115-124, Barcelona (Spain)
ISSN-L: 0214-8358doi: http://dx.doi.org/10.3989/scimar.03865.27B

116 • C. Carreras et al.
SCI. MAR., 78(1), March 2014, 115-124. ISSN-L 0214-8358 doi: http://dx.doi.org/10.3989/scimar.03865.27B
INTRODUCTION
The loggerhead marine turtle (Caretta caretta) is distributed in worldwide subtropical regions (Pritchard 1997). As with other marine turtle species (Meylan et al. 1990), this species is philopatric (Bowen et al. 1993), a behaviour that contrasts with this wide distribution (Bowen 2003). As a consequence of natal homing, fe-males generally return to nest to the beaches where they hatched, creating a spatial genetic structuring that can be easily detected using maternally inherited markers, such as those found in the mitochondrial DNA (mtD-NA) (Bowen et al. 1993, Laurent et al. 1993, Encalada et al. 1998, Bowen et al. 2005, Bowen and Karl 2007, Carreras et al. 2007, Lee 2008). The definition of these genetic management units (Moritz 1994) is considered a milestone in conservation of these endangered ani-mals (Hamann et al. 2010, Wallace et al. 2011).
Furthermore, this genetic structuring has been used in the determination of the origin of turtles in feeding grounds. A loggerhead sea turtle may undertake vast migrations across the oceans during its life (Bowen et al. 1995, Bolten et al. 1998). Thus, turtles produced at very different distant nesting sites might use the same feeding grounds during their development stages (Laurent et al. 1998, Carreras et al. 2006, Maffucci et al. 2006). Fisher-ies interactions in these feeding grounds are one of the major threats to the species (Carreras et al. 2004, Cami-ñas et al. 2006, Álvarez de Quevedo et al. 2010, Baez et al. 2010), often resulting in high levels of mortality (Casale et al. 2007, 2008b). Mixed stock analyses using mtDNA markers (Grant et al. 1980, Pella and Milner 1987, Pella and Masuda 2001, Bolker et al. 2007) have been used to assess relative impacts of threats (Bowen and Karl 2007, Lee 2008). Both the metapopulation genetic and mixed stock analyses are very sensitive to significant gaps of information in the description of the genetic signature of the nesting areas. For several nest-ing beaches, the sample size for genetic characterization is low in comparison with the numbers of adult females nesting there, while no samples at all have been col-lected for others.
The Mediterranean Sea hosts an independent re-gional management unit (Wallace et al. 2010) of log-gerhead sea turtles, genetically separated from those in the Atlantic Ocean (Carreras et al. 2011). Although individuals are found at sea throughout the region, regular nesting is concentrated in the eastern basin (Broderick et al. 2002, Margaritoulis et al. 2003, Casa-le and Margaritoulis 2010) with only sporadic nesting in the western basin (Delaugerre and Cesarini 2004, Bentivegna et al. 2008, Tomás et al. 2008, Casale et al. 2012). Genetic studies of Mediterranean nesting popu-lations started two decades ago, measuring restriction length polymorphisms (RLPFs) of the mtDNA (Bowen et al. 1993, Laurent et al. 1993). However, only one of those studies (Laurent et al. 1993) sampled multiple nesting areas within the Mediterranean and suggested that internal structuring might exist. A fine scale sam-pling effort within Turkey confirmed this hypothesis at a local level (Schroth et al. 1996). The sequencing of a 380-bp fragment of the hyper-variable region of the
D-loop of the mtDNA and the increasing of sampled locations has markedly improved the knowledge of Mediterranean genetic structure and different manage-ment units (Moritz 1994) were defined (Encalada et al. 1998, Laurent et al. 1998, Carreras et al. 2007, Chaieb et al. 2010). A recently designed set of primers (Abreu-Grobois et al. 2006) notably increased the length of the fragment sequenced, allowing enhanced description of management units, inter-population connections and genetic barriers within the Mediterranean (Yilmaz et al. 2011, Saied et al. 2012, Clusa et al. 2013).
Despite these recent efforts, one notable omission from profiling using longer sequences is the breed-ing aggregation of Kyparissia Bay, which represents the second largest loggerhead nesting aggregation in the region (Margaritoulis et al. 2003, Casale and Mar-garitoulis 2010). Genetic samples for this population remain limited to those 21 first published two dec-ades ago in an RLPF study (Bowen et al. 1993) and sequenced later using the 380-bp primers (Encalada et al. 1998). Studies of other Greek aggregations using these primers suggested that western Greek sites could be grouped, as no differences were detected among them (Carreras et al. 2007). However, the extra length of the new sequences is highly polymorphic (Monzon-Arguello et al. 2010) and haplotypes that are common among different nesting areas often split into different regional variants thus increasing the power to detect differentiation among populations (Monzon-Arguello et al. 2010, Shamblin et al. 2012, Clusa et al. 2013). For instance, two nesting areas in Libya that were indistin-guishable using short fragments became significantly different using the longer ones (Saied et al. 2012). Thus, it is clear that the relationship of the important nesting beach of Kyparissia within the Mediterranean needs to be elaborated using the new sequences. This will complete the knowledge of genetic structuring within the region and will inform an important part of the baseline for future MSA analysis.
In this study, we analysed the mtDNA diversity of the Kyparissia Bay nesting population using the 800-bp fragment with a primer set that includes the traditional 380-bp mtDNA fragment (Abreu-Grobois et al. 2006) and we compared the results obtained with haplotype frequencies obtained from the available pub-lished literature. The objectives of this study were to a) characterize the mtDNA diversity of the Kyparissia nesting population, b) to define the degree of genetic differentiation between the Kyparissia and the other nesting populations and c) to test whether the use of longer sequences and the inclusion of Kyparissia Bay changes the previously defined genetic structuring within the Mediterranean.
MATERIALS AND METHODS
Samples from the Kyparissia Bay nesting area (KYP, Fig. 1) were collected during the 2012 nesting season. Skin plug samples were collected from logger-head (C. caretta) nesting females, during the covering phase, after egg deposition. Pseudoreplication was avoided by taking only one sample from each uniquely

Mediterranean loggerhead turtle genetic structuring • 117
SCI. MAR., 78(1), March 2014, 115-124. ISSN-L 0214-8358 doi: http://dx.doi.org/10.3989/scimar.03865.27B
identified, tagged nesting turtle. Samples were stored in 90% ethanol.
We amplified a long (~800 bp) fragment of the mitochondrial DNA (mtDNA) control region using the primers LCM15382 (5’-GCTTAACCCTAAA-GCATTGG-3’) and H950 (5’-GTCTCGGATT-TAGGGGTTT-3’) (Abreu-Grobois et al. 2006), which includes the short region (~380 bp) historically surveyed for several marine turtle species in previ-ous studies (Encalada et al. 1998, Laurent et al. 1998, Carreras et al. 2007, Chaieb et al. 2010). Extraction and amplification were conducted using the Phire® Animal Tissue Direct PCR Kit (Finnzymes) following the manufacturer’s specifications. Each 50-μl reaction contained 0.5 mm of the sample skin, 1× Phire® Ani-mal Tissue PCR Buffer, 0.5 μM of each primer and 1 μL of Phire® Hot Start II DNA Polymerase. After an initial 5 min denaturing step (98°C), our PCR protocol consisted of 40 cycles of the following temperature regime: 5 s at 98°C (denaturing), 5 s at 60.6°C (an-nealing) and 20 s at 72°C (extension). In addition, we included a final extension step of 1 min at 72°C. The resulting PCR product were visualized in agarose gel and we removed single-stranded DNA by digesting 45 μL of PCR product with 9 μL of a combined Exo-nuclease I and Shrimp Alkaline Phosphatase solution (ExoSAP®). The reaction was incubated for 30 min at 37°C, followed by 10 min incubation at 80°C to inacti-vate the two enzymes. We sequenced both forward and reverse strands using a 3730XL Automatic Sequencer (Macrogen Inc. sequencing service). Sequences were aligned using Geneious v5.5 (Drummond et al. 2011) or BioEdit v7.1.11 (Hall 1999) and compared with known loggerhead haplotypes found in the database maintained by the Archie Carr Center for Sea Turtle Research (http://accstr.ufl.edu/), which includes all published long and short haplotypes.
We reviewed all published long (~800 bp) and short (~380 bp) mtDNA haplotype frequencies in Mediterra-nean nesting areas (Fig. 1). When different sample sets were available from the same location, we used only the one with the highest number of samples in order to avoid pseudoreplication. Only sample sets with at least 10 samples were considered for the analysis. Finally, sample sets covering an area that has been demon-strated to include genetically different units were also discarded. In order to assess the genetic diversity of Kyparissia compared with the other Mediterranean nesting sites, we calculated haplotype diversity (h) and nucleotide diversity (π) (Nei 1982) of each population using the program Arlequin 5.1 (Excoffier et al. 2005). Fu’s Fs neutrality test for the detection of population growth (Fu 1997) was undertaken with the DnaSP software package (Rozas et al. 2003). Fs tends to be negative under an excess of recent mutations and a sig-nificant negative value was taken as evidence of recent population expansion. Differentiation among popula-tion pairs was assessed considering genetic distances (Φst). Significance of differentiation was also tested by computing the exact test, based on haplotype fre-quencies (Goudet et al. 1996) and by chi-square tests, in which values were compared with the distributions observed by randomizing individuals among popula-tions using Monte-Carlo resampling (Rolf and Bentzen 1989). We also performed a locus by locus analysis of AMOVA in order to detect which polymorphisms of the sequence were more informative. All these analy-ses were performed using Arlequin 5.1 (Excoffier et al. 2005). Genetic distances were used to perform a principal coordinate analysis (PCA) with the pack-age GenAlEX 6.2 (Peakall and Smouse 2006) and a UPGMA consensus tree was build using the software TFPGA 1.3 as a result of 1000 permutations (Miller 1997). A sequential Bonferroni correction was not
Fig. 1. – Mediterranean nesting areas with mtDNA haplotype frequencies as shown in Tables 1 and 2. CAL, Calabria; CRE, Crete (Rethymno); CYP, Cyprus; DLM, Dalaman; DLY, Dalyan; ETU, eastern Turkey; ISR, Israel; KYP, Kyparissia Bay; LAK, Lakonikos Bay; LAM, Lampe-dusa; LEB, Lebanon; MIS, Misurata; MTU, Mid Turkey; SIR, Sirte; TUN, Tunisia; WTU, western Turkey; ZAK, Zakynthos. ETU, MTU and WTU are groups of nesting beaches as defined in (Yilmaz et al. 2011). Map created using MAPTOOL (SEATURTLE.ORG Maptool 2002,
aquisition date 06 Feb 2013).

118 • C. Carreras et al.
SCI. MAR., 78(1), March 2014, 115-124. ISSN-L 0214-8358 doi: http://dx.doi.org/10.3989/scimar.03865.27B
applied for multiple pairwise comparisons, since they dramatically increase the probability for type II error (β: assume no differentiation when it does exist), an ef-fect that becomes worse as many p-values are discard-ed (Perneger 1998, Cabin and Mitchell 2000, Moran 2003). However, we included a false discovered rate (FDR) correction that calculates the most appropriate threshold for the P-value significance considering the multiple comparisons involved in the analysis under an expected original threshold of P<0.05 (Narum 2006).
Finally, we used the program POWSIM 4.1 (Ry-man and Palm 2006) to evaluate the statistical power of the long (~800 bp) mtDNA marker in the Mediter-ranean. Statistical power is defined as the probability of rejecting H0, thus accepting H1 (no differentiation among populations), and is an essential complement to assess the reliability of the non-significant pairwise comparisons. The program simulates the divergence of different populations and estimates the probability of false negatives by resampling them. Thus, statistical
Table 1. – Published short (~380 bp) mtDNA sequences in Mediterranean loggerhead nesting areas.
CC
-A2
CC
-A3
CC
-A6
CC
-A10
Cc-
A13
CC
-A20
CC
-A26
CC
-A29
CC
-A31
CC
-A32
CC
-A43
CC
-A50
CC
-A52
CC
-A53
CC
-A65
CC
-A68
n Ref.
Italy Calabria -CAL 22 14 2 38 ALampedusa -LAM# 2 2 B
Tunisia Tunisia-TUN 16 16 CLibya Misurata-MIS 13 1 14 D
Sirte -SIR 28 2 4 1 35 DSirte-SIR # 21 3 1 2 27 ESirte-SIR # 7 7 B
Greece Zakynthos-ZAK 16 2 1 19 E-FKyparissia-KYP 33 2 1 36 GKyparissia-KYP# 19 2 21 HLakonikos-LAK 18 1 19 E-FGreece general # 10 1 11 BRethymno, Crete-CRE 20 20 E-F
Cyprus Cyprus-CYP 44 1 45 ECyprus-CYP# 35 35 B
Turkey Dalyan-DLY 25 15 40 IDalaman-DLM 5 15 20 IWestern Turkey-WTU 60 9 1 1 1 72 IMid Turkey-MTU 46 1 47 IEastern Turkey-ETU 60 16 76 ITurkey General# 19 13 32 B
Lebanon Lebanon-LEB 17 2 19 EIsrael Israel -ISR 17 2 19 E
Israel -ISR # 6 6 B
Total 559 76 7 1 1 14 5 2 3 1 1 1 1 1 2 1 676
References : A, Garofalo et al. (2009); B, Laurent et al. (1998); C, Chaieb et al. (2010); D, Saied et al. (2012); E, Clusa et al. (2013); F, Carreras et al. (2007); G, present study; H, Encalada et al. (1998); I, Yilmaz et al. (2011). Turkish samples from Carreras et al. (2007) were included in the Yilmaz et al. (2011) sampling set; Cyprus samples from Carreras et al. (2007) were included in the Clusa et al. (2013) sampling set. # Sample set discarded for analysis after filtering process. WTU, MTU and ETU are groups of nesting beaches as defined in Yilmaz et al. (2011).
Table 2. – Published long (~800 bp) mtDNA sequences in Mediterranean loggerhead nesting areas
CC
-A2.
1
CC
-A2.
8
CC
-A2.
9
CC
-A3.
1
CC
-A3.
2
CC
-A6.
1
CC
-A13
.1
CC
-A20
.1
CC
-A26
.1
CC
-A29
.1
CC
-A31
.1
CC
-A32
.1
CC
-A43
.1
CC
-A50
.1
CC
-A52
.1
CC
-A53
.1
CC
-A65
.1
CC
-A68
.1
n Ref.
Italy Calabria-CAL 22 14 2 38 ALibya Misurata-MIS 12 1 1 14 B
Sirte-SIR 16 12 2 4 1 35 BSirte-SIR # 11 10 3 1 2 27 C
Greece Zakynthos-ZAK 16 2 1 19 CKyparissia-KYP 33 2 1 36 DLakonikos-LAK 18 1 19 CRethymno, Crete-CRE 16 4 20 C
Cyprus Cyprus-CYP 44 1 45 CTurkey Dalyan-DLY 25 15 40 E
Dalaman-DLM 5 15 20 EWestern Turkey-WTU 60 16 76 EMid Turkey-MTU 46 1 47 EEastern Turkey-ETU 60 8 1 1 1 1 72 E
Lebanon Lebanon-LEB 17 2 19 CIsrael Israel -ISR 15 2 2 19 C
Total 366 4 25 62 1 5 14 5 2 3 3 1 1 1 1 1 2 1 546
A, Garofalo et al. (2009); B, Saied et al. (2012); C, Clusa et al. (2013); D, present Study; E, Yilmaz et al. (2011); # Sample set discarded for analysis after filtering process. WTU, MTU and ETU are groups of nesting beaches as defined in Yilmaz et al. (2011).

Mediterranean loggerhead turtle genetic structuring • 119
SCI. MAR., 78(1), March 2014, 115-124. ISSN-L 0214-8358 doi: http://dx.doi.org/10.3989/scimar.03865.27B
power is expressed as the proportion of non-significant outcomes (1000 replicates) of the diverged popula-tions. We simulated different levels of divergence (Fst) by fixing the number of effective population size (Ne) at 500 and modifying the number of generations of di-vergence (t) (Ryman et al. 2006). We determined the statistical power of our marker by considering sample sizes of 10, 20, 30, 50 and 100, thus covering the range of sample sizes from Mediterranean nesting beaches, and adjusting the program for organelle (mtDNA) data (Larsson et al. 2009).
RESULTS
A total of 36 sequences were obtained from fe-males at the Kyparissia Bay nesting aggregation, and three haplotypes were found, when either the short or the long fragment was considered. These haplotypes
were the widespread CC-A2/CC-A2.1 (Genebank EU179445, (Shamblin et al. 2012)), the Greek haplo-type CC-A6/CC-A6.1 (Genebank JQ350705, (Yilmaz et al. 2012, Clusa et al. 2013)) and the haplotype CC-A31/CC-A31.1 (Genebank AM949678, (Garofalo et al. 2009)), previously found only in Calabria (Italy; Tables 1 and 2). The Kyparissia Bay nesting area showed moderate levels of variability compared with the other Mediterranean nesting populations (Table 3) and no recent expansion was suggested irrespective of the length of the marker (Fu’s Fs neutrality test P>0.05 in both cases).
With the addition of our results, we compiled a to-tal of 676 individuals with genetic information for the short fragment and 546 individuals with genetic infor-mation for the long fragment (Tables 1, 2). After fil-tering the data to avoid pseudoreplication, we had 535 samples from 16 nesting populations for the short frag-
Table 3. – Comparison of the Kyparissia Bay nesting aggregation and the other Mediterranean nesting areas using either the short (~380 bp) or the long (~800 bp) mtDNA sequences
Nesting area ~380bp ~800bp Population sizeΦst h π Φst h π nests/year (range)
KYP - 0.160(0.080) 0.0004(0.0007) - 0.160 (0.080) 0.0002 (0.0003) 621 (286-927)CAL 0.255 A,B 0.541(0.049) 0.0015(0.0014) 0.255 A,B 0.540 (0.049) 0.0007 (0.0007) 17 (15-20)TUN -0.012 0.000(0.000) 0.0000(0.0000) - - - 18MIS 0.007 0.143(0.119) 0.0004(0.0006) 0.022 0.275 (0.148) 0.0004(0.0004) 592SIR 0.048 A,b 0.353(0.097) 0.0010(0.0011) 0.317 A,B 0.676 (0.050) 0.0011(0.0009) 343ZAK 0.018 0.292(0.127) 0.0010(0.0011) 0.018 0.292 (0.127) 0.0005 (0.0005) 1,244 (833-2,018)LAK -0.036 0.105(0.092) 0.0003(0.0005) -0.036 0.105 (0.092) 0.0001 (0.0003) 197 (107-288)CRE -0.003 0.000(0.000) 0.0000(0.0000) 0.135 b 0.337 ( 0.110) 0.0004 (0.0005) 324 (166-516)CYP 0.019 0.044(0.042) 0.0001(0.0003) 0.019 0.044 (0.042) 0.0001 (0.0002) 515DLY 0.291 A,B 0.481(0.042) 0.0013(0.0012) 0.291 A,B 0.481 (0.042) 0.0006 (0.0006) (57-330)DLM 0.695 A,B 0.395(0.101) 0.0010(0.0011) 0.695 A,B 0.395 ( 0.101) 0.0005 (0.0006) (69-112)WTU 0.131 A,B 0.337(0.055) 0.0009(0.0010) 0.131 A,B 0.337 ( 0.055) 0.0004 (0.0005) (169-523)MTU 0.021 0.043(0.040) 0.0001(0.0003) 0.021 0.043 ( 0.040) 0.0001 (0.0002) (136-1165)ETU 0.062 a,b 0.293(0.065) 0.0009(0.0010) 0.058 a,b 0.297 ( 0.067) 0.0004 (0.0005) (212-936)LEB 0.043 0.199(0.112) 0.0005(0.0008) 0.043 0.199 ( 0.112) 0.0002 (0.0004) 60 (40-122)ISR 0.043 0.199(0.112) 0.0005(0.0008) 0.063 a,b 0.374 (0.130) 0.0005 (0.0005) 57
Abbreviations as Table 1 and Table 2. Φst, genetic distance compared with Kyparissia; h, haplotype diversity; π, nucleotide diversity. Bold values indicate a genetic distance significantly different (p<0.05) from 0 using either a, chi-square test or b, exact test. Uppercase of these tests (A or B) denotes p-values remaining significant after FDR correction. No long (~800 bp) information exists from TUN (Tunisia). Popu-lation sizes (nests/year) obtained from (Casale and Margaritoulis 2010) and considering the nesting beaches sampled for each population (Tables 1 and 2).
Fig. 2. – UPGMA tree including Mediterranean nesting populations using Φst, with the long (~800 bp) mtDNA sequences. CAL, Calabria; CRE, Crete; CYP, Cyprus; DLM, Dalaman; DLY, Dalyan; ETU, eastern Turkey; ISR, Israel; KYP, Kyparissia Bay; LAK, Lakonikos Bay; LAM, Lampedusa; LEB, Lebanon; MIS, Misurata; MTU, Mid Turkey; SIR, Sirte; WTU, western Turkey; ZAK, Zakynthos. ETU, MTU and
WTU are groups of nesting beaches as defined in (Yilmaz et al. 2011). Bootstrap values are given at each node.
120 • C. Carreras et al.
SCI. MAR., 78(1), March 2014, 115-124. ISSN-L 0214-8358 doi: http://dx.doi.org/10.3989/scimar.03865.27B
ment and 519 samples from 15 nesting populations for the long fragment, since the Tunisia nesting population has only been analysed with short sequences (Tables 1, 2). The long fragment showed deeper differentiation (8 of 14 significant values) between Kyparissia Bay and other Mediterranean nesting areas than the short one (6 of 15 significant values; Table 3). The Kyparissia Bay nesting population was not different to the other west-ern Greek nesting populations (Lakonikos Bay and Zakynthos) when either short or long fragments were compared (Table 3) and was also grouped with these populations by the UPGMA tree with a 64% bootstrap value (Fig. 2). Considering these results and the fact that the three nesting areas exhibited the Greek hap-lotype CC-A6.1 and the common haplotype CC-A2.1 in similar proportions we grouped them as western Greece (WGR) for subsequent analysis.
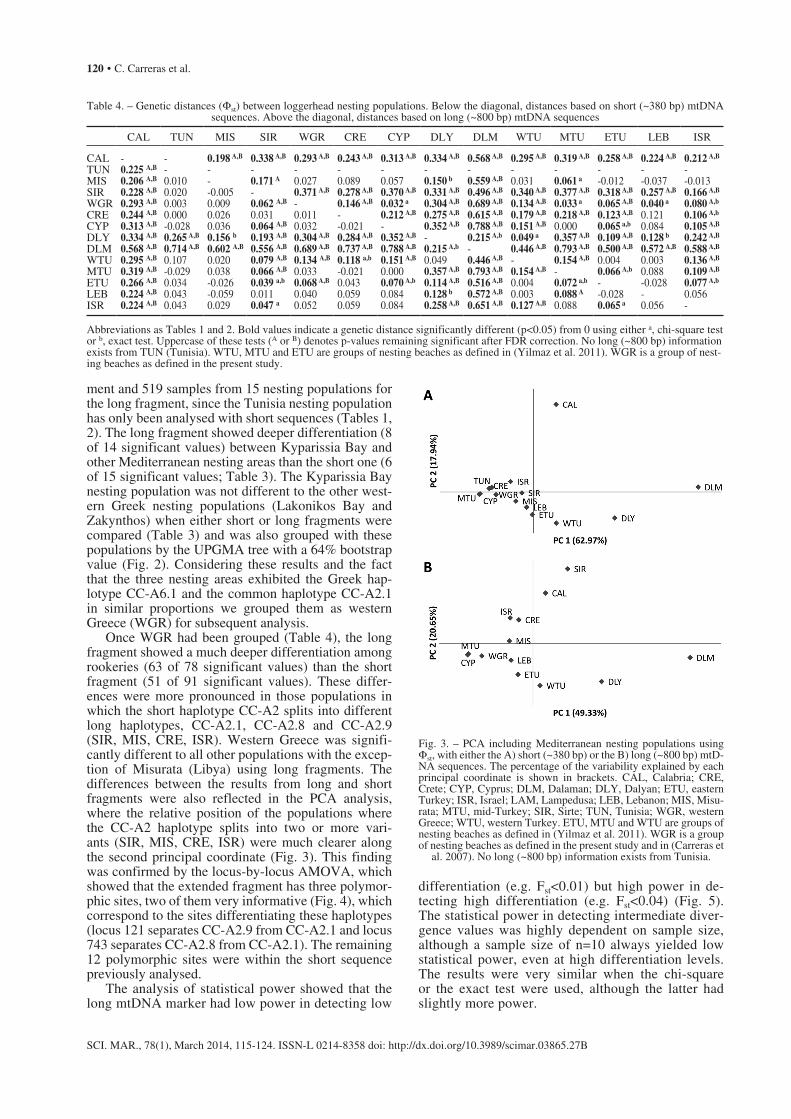
Once WGR had been grouped (Table 4), the long fragment showed a much deeper differentiation among rookeries (63 of 78 significant values) than the short fragment (51 of 91 significant values). These differ-ences were more pronounced in those populations in which the short haplotype CC-A2 splits into different long haplotypes, CC-A2.1, CC-A2.8 and CC-A2.9 (SIR, MIS, CRE, ISR). Western Greece was signifi-cantly different to all other populations with the excep-tion of Misurata (Libya) using long fragments. The differences between the results from long and short fragments were also reflected in the PCA analysis, where the relative position of the populations where the CC-A2 haplotype splits into two or more vari-ants (SIR, MIS, CRE, ISR) were much clearer along the second principal coordinate (Fig. 3). This finding was confirmed by the locus-by-locus AMOVA, which showed that the extended fragment has three polymor-phic sites, two of them very informative (Fig. 4), which correspond to the sites differentiating these haplotypes (locus 121 separates CC-A2.9 from CC-A2.1 and locus 743 separates CC-A2.8 from CC-A2.1). The remaining 12 polymorphic sites were within the short sequence previously analysed.
The analysis of statistical power showed that the long mtDNA marker had low power in detecting low
differentiation (e.g. Fst<0.01) but high power in de-tecting high differentiation (e.g. Fst<0.04) (Fig. 5). The statistical power in detecting intermediate diver-gence values was highly dependent on sample size, although a sample size of n=10 always yielded low statistical power, even at high differentiation levels. The results were very similar when the chi-square or the exact test were used, although the latter had slightly more power.
Table 4. – Genetic distances (Φst) between loggerhead nesting populations. Below the diagonal, distances based on short (~380 bp) mtDNA sequences. Above the diagonal, distances based on long (~800 bp) mtDNA sequences
CAL TUN MIS SIR WGR CRE CYP DLY DLM WTU MTU ETU LEB ISR
CAL - - 0.198 A,B 0.338 A,B 0.293 A,B 0.243 A,B 0.313 A,B 0.334 A,B 0.568 A,B 0.295 A,B 0.319 A,B 0.258 A,B 0.224 A,B 0.212 A,B
TUN 0.225 A,B - - - - - - - - - - - - -MIS 0.206 A,B 0.010 - 0.171 A 0.027 0.089 0.057 0.150 b 0.559 A,B 0.031 0.061 a -0.012 -0.037 -0.013SIR 0.228 A,B 0.020 -0.005 - 0.371 A,B 0.278 A,B 0.370 A,B 0.331 A,B 0.496 A,B 0.340 A,B 0.377 A,B 0.318 A,B 0.257 A,B 0.166 A,B
WGR 0.293 A,B 0.003 0.009 0.062 A,B - 0.146 A,B 0.032 a 0.304 A,B 0.689 A,B 0.134 A,B 0.033 a 0.065 A,B 0.040 a 0.080 A,b
CRE 0.244 A,B 0.000 0.026 0.031 0.011 - 0.212 A,B 0.275 A,B 0.615 A,B 0.179 A,B 0.218 A,B 0.123 A,B 0.121 0.106 A,b
CYP 0.313 A,B -0.028 0.036 0.064 A,B 0.032 -0.021 - 0.352 A,B 0.788 A,B 0.151 A,B 0.000 0.065 a,b 0.084 0.105 A,B
DLY 0.334 A,B 0.265 A,B 0.156 b 0.193 A,B 0.304 A,B 0.284 A,B 0.352 A,B - 0.215 A,b 0.049 a 0.357 A,B 0.109 A,B 0.128 b 0.242 A,B
DLM 0.568 A,B 0.714 A,B 0.602 A,B 0.556 A,B 0.689 A,B 0.737 A,B 0.788 A,B 0.215 A,b - 0.446 A,B 0.793 A,B 0.500 A,B 0.572 A,B 0.588 A,B
WTU 0.295 A,B 0.107 0.020 0.079 A,B 0.134 A,B 0.118 a,b 0.151 A,B 0.049 0.446 A,B - 0.154 A,B 0.004 0.003 0.136 A,B
MTU 0.319 A,B -0.029 0.038 0.066 A,B 0.033 -0.021 0.000 0.357 A,B 0.793 A,B 0.154 A,B - 0.066 A,b 0.088 0.109 A,B
ETU 0.266 A,B 0.034 -0.026 0.039 a,b 0.068 A,B 0.043 0.070 A,b 0.114 A,B 0.516 A,B 0.004 0.072 a,b - -0.028 0.077 A,b
LEB 0.224 A,B 0.043 -0.059 0.011 0.040 0.059 0.084 0.128 b 0.572 A,B 0.003 0.088 A -0.028 - 0.056ISR 0.224 A,B 0.043 0.029 0.047 a 0.052 0.059 0.084 0.258 A,B 0.651 A,B 0.127 A,B 0.088 0.065 a 0.056 -
Abbreviations as Tables 1 and 2. Bold values indicate a genetic distance significantly different (p<0.05) from 0 using either a, chi-square test or b, exact test. Uppercase of these tests (A or B) denotes p-values remaining significant after FDR correction. No long (~800 bp) information exists from TUN (Tunisia). WTU, MTU and ETU are groups of nesting beaches as defined in (Yilmaz et al. 2011). WGR is a group of nest-ing beaches as defined in the present study.
Fig. 3. – PCA including Mediterranean nesting populations using Φst, with either the A) short (~380 bp) or the B) long (~800 bp) mtD-NA sequences. The percentage of the variability explained by each principal coordinate is shown in brackets. CAL, Calabria; CRE, Crete; CYP, Cyprus; DLM, Dalaman; DLY, Dalyan; ETU, eastern Turkey; ISR, Israel; LAM, Lampedusa; LEB, Lebanon; MIS, Misu-rata; MTU, mid-Turkey; SIR, Sirte; TUN, Tunisia; WGR, western Greece; WTU, western Turkey. ETU, MTU and WTU are groups of nesting beaches as defined in (Yilmaz et al. 2011). WGR is a group of nesting beaches as defined in the present study and in (Carreras et
al. 2007). No long (~800 bp) information exists from Tunisia.

Mediterranean loggerhead turtle genetic structuring • 121
SCI. MAR., 78(1), March 2014, 115-124. ISSN-L 0214-8358 doi: http://dx.doi.org/10.3989/scimar.03865.27B
DISCUSSION
The present study confirmed the findings of previ-ous work (Monzon-Arguello et al. 2010, Shamblin et al. 2012, Clusa et al. 2013) that indicated that the new set of primers improves the resolution of population structuring of the loggerhead turtle within the Medi-terranean. This improvement is uneven, as it relies on the split of the common CC-A2 haplotype into a widespread haplotype (CC-A2.1) and several regional variants (CC-A2.8 and CC-A2.9) caused by two very informative polymorphic sites outside the short region. Thus, all populations including one of these regional
CC-A2 variants (Sirte, Misurata, Crete and Israel) resulted in a higher differentiation level detected with other Mediterranean nesting populations, either using common Φst statistics or the PCA. As a consequence, we strongly recommend the use of this new set of primers in future loggerhead turtle genetic studies, es-pecially for foraging areas where information is thus far only available for the short fragment.
The nesting area of Kyparissia Bay represents almost 9% of total nesting in the Mediterranean, con-sidering that recent estimates suggested a reproduc-tive output of approximately 7200 nests per year for the region (Casale and Margaritoulis 2010), although data of some places may be incomplete. Our study confirmed the genetic differentiation between nesters at this important nesting area and most of the other nesting areas in the Mediterranean, especially when the newer, longer markers were considered. However, it also confirmed the grouping of Kyparissia Bay with both Zakynthos and Lakonikos Bay as an independ-ent genetic unit, as suggested in previous studies with shorter markers (Carreras et al. 2007). This grouping is supported by other lines of evidence, as tagging stud-ies have demonstrated interchange of females between these nesting areas (Margaritoulis 1998), even within the same nesting season (Margaritoulis D, unpublished data). The three nesting areas included in the western Greece group produced more than 2000 nests per year on average, which is around one quarter of all Mediter-ranean nesting production.
As a consequence of this grouping, the overall structuring of Mediterranean nesting areas resulting from our study did not change significantly in relation to previous studies using the long fragment (Clusa et al. 2013). However, the increased sampling of this western Greece group increased the degree of differ-entiation detected between this and the populations of Cyprus, mid-Turkey, Lebanon and eastern Turkey, thus confirming its isolation and status as an independ-ent management unit. Misurata (Libya) was the only population that did not differ from western Greece, but this population showed a low degree of differen-
Fig. 4. – Loci by loci AMOVA of the ~800-bp fragment for the Mediterranean populations. For each locus the variance within populations (white squares), the variance among populations (grey circle) and the Fst values (black triangles) are plotted. The region that is covered by the short (~380 bp) sequence is indicated by a grey box. Note that the variance values are indicated on the left Y axis and the Fst values are
indicated on the right Y axis.
Fig. 5. – Statistical power of the A) chi-square and B) exact test for detecting genetic divergence at different Fst levels. Power is expressed as the proportion of significant values (p<0.05) when n individuals are sampled for the simulated diverged populations. Analysis was done considering the long (~800 bp) mtDNA se-quence found within the Mediterranean and considering different
sampling sizes (n).

122 • C. Carreras et al.
SCI. MAR., 78(1), March 2014, 115-124. ISSN-L 0214-8358 doi: http://dx.doi.org/10.3989/scimar.03865.27B
tiation with almost all Mediterranean nesting popula-tions, probably because of the low sample size of the molecular data defining it. The authors who analysed this population recognized that this low sample size could affect the ability to detect differentiation (Saied et al. 2012), although they did not test it. Our statistical power analysis clearly shows that sample sizes below 20 might fail when detecting differentiation and thus higher numbers are desirable, and this could explain why all but one non-significant value involve one of the two populations with the lowest sample size (Misu-rata and Lebannon).
Many genetic studies have been conducted in the Mediterranean nesting beaches over the last two dec-ades (Encalada et al. 1998, Laurent et al. 1998, Car-reras et al. 2007, Garofalo et al. 2009, Chaieb et al. 2010, Yilmaz et al. 2011, Saied et al. 2012, Clusa et al. 2013), sometimes resulting in the production of several sample sets for the same locations. The risk of pseudoreplication between different sample sets is very high, especially in view of the small population sizes of some of the nesting beaches. Thus, although all studies took precautions to avoid pseudoreplication of their samples, a filtering process like the one conducted in this study has to be used when different studies of the same location are considered. However, this filter-ing process has some shortcomings. Firstly, we have shown that statistical power to detect differentiation decreases as the total number of samples decreases. For instance, a total of 25 samples were analysed from Israel and a total of 69 samples were analysed from Sirte, Libya. However, after filtering, only 19 for Israel or 35 for Sirte were used for the analysis. Secondly, some exclusive haplotypes have been found by chance only in sample sets that were not optimal considering the filtering criteria. It is noteworthy that the haplotype CC-A10 has been found in the Mediterranean only in a Greek sample set of ten samples (Table 1). By discard-ing this sample set, we are ignoring that this haplotype is present not only in Greece but also in the whole Mediterranean Sea. A similar issue can be seen in two of the three sample sets of Sirte (Libya), one with the single sample with a CC-A65.1 and the other with the single sample with a CC-A68 found in the whole Medi-terranean (Table 1).
The existence of orphan haplotypes (haplotypes not detected in nesting areas but in feeding grounds) is one of the shortcomings of the mixed stock analysis and leads to mis-assignations. For instance, several individ-uals exhibiting the CC-A10 haplotype have been found in feeding grounds within the Mediterranean Sea, such as northeastern Spain (Carreras et al. 2006), the Albo-ran region (Revelles et al. 2007), the northern Tunisian Coast, and the Gulf of Gabes (Chaieb et al. 2012). Thus, although a filtering process is always desirable to avoid pseudoreplication problems in population genetic stud-ies (like the present study), its application in future mixed stock analysis should be carefully considered. Considering the pros and cons of each approach, some studies in the past have pooled all samples available from nesting areas (Carreras et al. 2006, Maffucci et al. 2006, Casale et al. 2008a, Chaieb et al. 2012), while
others used only the best available sample set per site (Monzon-Arguello et al. 2009, Giovannotti et al. 2010, Carreras et al. 2011, Saied et al. 2012).
These results have implications for the conserva-tion of the species as there are large differences in abundance and conservation status among Mediter-ranean nesting aggregations. While the Greek nesting beaches host the largest aggregations, populations such as those found on the Levantine Mediterranean shores have extremely low numbers of nesting females (Ca-sale and Margaritoulis 2010). The structuring found among Mediterranean nesting populations (Clusa et al. 2013, present study) suggests that the recolonization of other nesting beaches from the nesting females from the abundant populations of Greece in case of local extinctions would be difficult. However, the mtDNA fragment analysed in these studies is maternally inher-ited, so the contribution of males to gene flow among western Greece and the other Mediterranean popula-tions is not considered. This issue remains to be tested using nuclear markers, although previous studies sug-gested that some male-mediated gene flow may exist within the Mediterranean (Carreras et al. 2007, Yilmaz et al. 2011).
Knowledge of the genetic structuring of the Medi-terranean nesting beaches has been improving since the first studies (Bowen et al. 1993, Laurent et al. 1993), through the use of better markers or better sample sets. The present study aimed to fill one of the remaining gaps by describing one of the largest nesting beaches in the area, but there is still significant work to do. As an example, Libya is thought to host a significant portion of the Mediterranean nesting turtles and possibly has some internal genetic structuring (Saied et al. 2012). A better sample size for Misurata, or samples from other unsampled Libyan nesting beaches, are needed for a full understanding of the regional structuring.
ACKNOWLEDGEMENTS
We wish to thank Brian Ground and the ARCH-ELON volunteers in Greece who collected the samples. The authors wish to acknowledge use of the Maptool program in Figure 1 of this paper. Maptool is a prod-uct of SEATURTLE.ORG (information is available at www.seaturtle.org). C. Carreras is supported by the Beatriu de Pinós programme of the Departament d’Universitats, Recerca i Societat de la Informació de la Generalitat de Catalunya. The manuscript was im-proved by the input of two anonymous reviewers.
REFERENCES
Abreu-Grobois A., Horrocks J., Formia A., Leroux R., Velez-Zuazo X., Dutton P.H., Soares L., Meylan A., Browne D. 2006. New mtDNA d-loop primers which work for a variety of marine turtle species may increase the resolution capacity of mixed stock analysis. Proceedings of the 26th Annual Symposium on Sea Turtle Biology and Conservation, p. 179.
Álvarez de Quevedo I., Cardona L., De Haro A., Pubill E., Aguilar A. 2010. Sources of bycatch of loggerhead sea turtles in the western Mediterranean other than drifting longlines. ICES J. Mar. Sci. 67: 677-685. http://dx.doi.org/10.1093/icesjms/fsp278
Baez J.C., Real R., Macias D., de la Serna J.M., Bellido J.J., Cami-ñas J.A. 2010. Captures of swordfish Xiphias gladius (Linnaeus

Mediterranean loggerhead turtle genetic structuring • 123
SCI. MAR., 78(1), March 2014, 115-124. ISSN-L 0214-8358 doi: http://dx.doi.org/10.3989/scimar.03865.27B
1758) and loggerhead sea turtles Caretta caretta (Linnaeus 1758) associated with different bait combinations in the Western Mediterranean surface longline fishery. J. Appl. Ichthyol. 26: 126-127. http://dx.doi.org/10.1111/j.1439-0426.2009.01342.x
Bentivegna F., Treglia G., Hochscheid S. 2008. The first report of a loggerhead turtle Caretta caretta nest on the central Tyrrhenian coast (western Mediterranean). Mar. Biodiv. Rec. 1: 1-3. http://dx.doi.org/10.1017/S1755267205001430
Bolker B.M., Okuyama T., Bjorndal K.A., Bolten A.B. 2007. Incor-porating multiple mixed stocks in mixed stock analysis: ‘many-to-many’ analyses. Mol. Ecol. 16: 685-695. http://dx.doi.org/10.1111/j.1365-294X.2006.03161.x
Bolten A.B., Bjorndal K.A., Martins H.R., Dellinger T., Biscoito M.J., Encalada S.E., Bowen B.W. 1998. Transatlantic devel-opmental migrations of loggerhead sea turtles demonstrated by mtDNA sequence analysis. Ecol. Appl. 8: 1-7. http://dx.doi.org/10.1890/1051-0761(1998)008[0001:TDMOLS]2.0.CO;2
Bowen B.W. 2003. What is a Loggerhead Turtle? The genetic per-spective. In: Bolten A., Witherington B. (eds), Loggerhead Sea Turtles. Smithsonian Institution Press, Washington D.C. pp. 7-27.
Bowen B.W., Karl S.A. 2007. Population genetics and phylogeogra-phy of sea turtles. Mol. Ecol. 16: 4886-4907. http://dx.doi.org/10.1111/j.1365-294X.2007.03542.x
Bowen B.W., Avise J.C., Richardson J.I., Meylan A., Margaritoulis D., Hopkins-Murphy S.R. 1993. Population structure of log-gerhead turtles (Caretta caretta) in the Northwestern Atlantic Ocean and Mediterranean Sea. Conserv. Biol. 7: 834-844.http://dx.doi.org/10.1046/j.1523-1739.1993.740834.x
Bowen B.W., Abreu-Grobois A., Balazs G.H., Kamezaki N., Lim-pus C.J., Ferl R.J. 1995. Trans-Pacific migrations of the logger-head turtle (Caretta caretta) demonstrated with mitochondrial DNA markers. Proc. Natl. Acad. Sci. USA 92: 3731-3734http://dx.doi.org/10.1073/pnas.92.9.3731
Bowen B.W., Bass A.L., Soares L., Toonen R.J. 2005. Conservation implications of complex population structure: lessons from the loggerhead turtle (Caretta caretta). Mol. Ecol. 14: 2389-2402.http://dx.doi.org/10.1111/j.1365-294X.2005.02598.x
Broderick A.C., Glen F., Godley B.J., Hays G.C. 2002. Estimating the number of green and loggerhead turtles nesting annually in the Mediterranean. Oryx 36: 227-235. http://dx.doi.org/10.1017/S0030605302000431
Cabin R.J., Mitchell R.J. 2000. To Bonferroni or not to bonfer-roni: when and how are the questions. Bull. Ecol. Soc. Am. 81: 246-248.
Camiñas J.A., Baez J.C., Valeiras X., Real R. 2006. Differential log-gerhead by-catch and direct mortality due to surface longlines according to boat strata and gear type. Sci. Mar. 70: 661-665.http://dx.doi.org/10.3989/scimar.2006.70n4661
Carreras C., Cardona L., Aguilar A. 2004. Incidental catch of the loggerhead turtle Caretta caretta off the Balearic Islands (west-ern Mediterranean). Biol. Conserv. 117: 321-329. http://dx.doi.org/10.1016/j.biocon.2003.12.010
Carreras C., Pont S., Maffucci F., Pascual M., Barcelo A., Ben-tivegna F., Cardona L., Alegre F., SanFelix M., Fernandez G., Aguilar A. 2006. Genetic structuring of immature loggerhead sea turtles (Caretta caretta) in the Mediterranean Sea reflects water circulation patterns. Mar. Biol. 149: 1269-1279. http://dx.doi.org/10.1007/s00227-006-0282-8
Carreras C., Pascual M., Cardona L., Aguilar A., Margaritoulis D., Rees A.F., Turkozan O., Levy Y., Gasith A., Aureggi M., Khalil M. 2007. The genetic structure of the loggerhead sea turtle (Caretta caretta) in the Mediterranean as revealed by nuclear and mitochondrial DNA and its conservation implications. Con-serv. Genet. 8: 761-775. http://dx.doi.org/10.1007/s10592-006-9224-8
Carreras C., Pascual M., Cardona L., Marco A., Bellido J.J., Castillo J.J., Tomás J., Raga J.A., Sanfelix M., Fernandez G., Aguilar A. 2011. Living Together but Remaining Apart: Atlantic and Mediterranean Loggerhead Sea Turtles (Caretta caretta) in Shared Feeding Grounds. J. Hered. 102: 666-677. http://dx.doi.org/10.1093/jhered/esr089
Casale P., Margaritoulis D. 2010. Sea turtles in the Mediterranean: distribution, threats and conservation priorities. IUCN/SSC Ma-rine Turtle Specialist Group, Gland, Switzerland.
Casale P., Mazaris A.D., Freggi D., Basso R., Argano R. 2007. Sur-vival probabilities of loggerhead sea turtles (Caretta caretta) estimated from capture-mark-recapture data in the Mediterra-nean Sea. Sci. Mar. 71: 365-372. http://dx.doi.org/10.3989/scimar.2007.71n2365
Casale P., Freggi D., Gratton P., Argano R., Oliverio M. 2008a. Mi-
tochondrial DNA reveals regional and interregional importance of the central Mediterranean African shelf for loggerhead sea turtles (Caretta caretta). Sci. Mar. 72: 541-548. http://dx.doi.org/10.3989/scimar.2008.72n3541
Casale P., Freggi D., Rocco M. 2008b. Mortality induced by drifting longline hooks and branchlines in loggerhead sea turtles, esti-mated through observation in captivity. Aquatic Conservation-Marine and Freshwater Ecosystems 18: 945-954. http://dx.doi.org/10.1002/aqc.894
Casale P., Palilla G., Salemi A., Napoli A., Prinzi M., Genco L., Bonaviri D., Mastrogiacomo A., Oliverio M., Lo Valvo M. 2012. Exceptional sea turtle nest records in 2011 suggest an un-derestimated nesting potential in Sicily (Italy). Acta Herpetol. 7: 181-188.
Chaieb O., Ouaer A.E., Maffucci F., Bradai M.N., Bentivegna F., Said K., Chatti N. 2010. Genetic survey of loggerhead sea turtle Caretta caretta nesting population in Tunisia. Marine Biodiver-sity Records 3: 1-6. http://dx.doi.org/10.1017/S175526721000014X
Chaieb O., Elouaer A., Maffucci F., Karaa S., Bradai M.N., ElHili H., Bentivegna F., Said K., Chatti N. 2012. Population structure and dispersal patterns of loggerhead sea turtles Caretta caretta in Tunisian coastal waters, central Mediterranean. Endang. Spe-cies Res. 18: 35-45. http://dx.doi.org/10.3354/esr00428
Clusa M., Carreras C., Pascual M., Demetropoulos A., Margaritou-lis D., Rees A.F., Hamza A.A., Khalil M., Aureggi M., Levy Y., Turkozan O., Marco A., Aguilar A., Cardona L. 2013. Mitochondrial DNA reveals Pleistocenic colonisation of the Mediterranean by loggerhead turtles (Caretta caretta). J. Exp. Mar. Biol. Ecol. 439: 15-24. http://dx.doi.org/10.1016/j.jembe.2012.10.011
Delaugerre M., Cesarini C. 2004. Confirmed nesting of the logger-head turtle in Corsica. Marine Turtle Newsletter 104: 12.
Drummond A.J., Ashton B., Buxton S., Cheung M., Cooper A., He-led J., Moir R., Stones-Havas S., Sturrock S., Thierer T., Wilson A. 2011. Geneious v5.5 created by Biomatters. Available from http://www.geneious.com
Encalada S.E., Bjorndal K.A., Bolten A.B., Zurita J.C., Schroeder B., Possardt E., Sears C.J., Bowen B.W. 1998. Population struc-ture of loggerhead turtle (Caretta caretta) nesting colonies in the Atlantic and Mediterranean as inferred from mitochondrial DNA control region sequences. Mar. Biol. 130: 567-575. http://dx.doi.org/10.1007/s002270050278
Excoffier L., Laval G., Schneider S. 2005. Arlequin (version 3.0): An integrated software package for population genetics data analysis. Evol. Bioinform. 1: 47-50.
Fu Y.X. 1997. Statistical tests of neutrality of mutations against population growth, hitchhiking and background selection. Ge-netics 147: 915-925.
Garofalo L., Mingozzi T., Mico A., Novelletto A. 2009. Loggerhead turtle (Caretta caretta) matrilines in the Mediterranean: further evidence of genetic diversity and connectivity. Mar. Biol. 156: 2085-2095. http://dx.doi.org/10.1007/s00227-009-1239-5
Giovannotti M., Franzellitti S., Cerioni P.N., Fabbri E., Guccione S., Vallini C., Tinti F., Caputo V. 2010. Genetic characteriza-tion of loggerhead turtle (Caretta caretta) individuals stranded and caught as bycatch from the North-Central Adriatic Sea. Amphibia-Reptilia 31: 127-133. http://dx.doi.org/10.1163/156853810790457902
Goudet J., Raymond M., de Meeüs T. 1996. Testing differentiation in diploid populations. Genetics 144: 1931-1938.
Grant W.S., Milner G.B., Krasnowski P., Utter F.M. 1980. Use of biochemical genetic variants for identification of Sockeye salmon (Oncorhynchus nerca) stocks in Cook Inlet, Alaska. Can. J. Fish. Aquat. Sci. 37: 1236-1247. http://dx.doi.org/10.1139/f80-159
Hall T.A. 1999. BioEdit: a user-friendly biological sequence align-ment editor and analysis program for Windows 95/98/NT. Nu-cleic Acids Symposium Series 41: 95-98.
Hamann M., Godfrey M.H., Seminoff J.A., Arthur K., Barata P.C.R., Bjorndal K.A., Bolten A., Broderick A.C., Campbell L.M., Car-reras C., Dutton P.H., Epperly S., Fitzsimmons N.N., Formia A., Girondot M., Hays G.C., Jiunn C.I., Kaska Y., Lewison R., Mortimer J.A., Nichols W.J., Reina R.D., Shanker K., Spotila J.R., Tomás J., Wallace B.P., Work T.M., Zbinden J.A., Godley B.J. 2010. Global research priorities for sea turtles: informing management and conservation in the 21st century. Endang. Spe-cies Res. 11: 245-269. http://dx.doi.org/10.3354/esr00279
Larsson L.C., Charlier J., Laikre L., Ryman N. 2009. Statistical power for detecting genetic divergence-organelle versus nuclear

124 • C. Carreras et al.
SCI. MAR., 78(1), March 2014, 115-124. ISSN-L 0214-8358 doi: http://dx.doi.org/10.3989/scimar.03865.27B
markers. Conserv. Genet. 10: 1255-1264. http://dx.doi.org/10.1007/s10592-008-9693-z
Laurent L., Lescure J., Excoffier L., Bowen B.W., Domingo M., Hadjichristophorou M., Kornaraky L., Trabucht G. 1993. Genetic studies of relationships between Mediterranean and Atlantic populations of loggerhead turtle Caretta caretta with a mitochondrial marker. Comptes Rendus de l’Académie des Sciences de la Vie. Sciences de la Vie, Paris 316: 1233-1239.
Laurent L., Casale P., Bradai M.N., Godley B.J., Gerosa G., Brod-erick A.C., Schroth W., Schierwater B., Levy A.M., Freggi D., Abd El-Mawla E.M., Hadoud D.A., Gomati H.E., Domingo M., Hadjichristophorou M., Kornaraky L., Demirayak F., Gautier C. 1998. Molecular resolution of marine turtle stock composi-tion in fishery bycatch: a case study in the Mediterranean. Mol. Ecol. 7: 1529-1542. http://dx.doi.org/10.1046/j.1365-294x.1998.00471.x
Lee P.L.M. 2008. Molecular ecology of marine turtles: New ap-proaches and future directions. J. Exp. Mar. Biol. Ecol. 356: 25-42. http://dx.doi.org/10.1016/j.jembe.2007.12.021
Maffucci F., Kooistra W., Bentiveyna F. 2006. Natal origin of log-gerhead turtles, Caretta caretta, in the neritic habitat off the Italian coasts, Central Mediterranean. Biol. Conserv. 127: 183-189. http://dx.doi.org/10.1016/j.biocon.2005.08.009
Margaritoulis D. 1998. Interchange of nesting loggerheads among Greek beaches. In: Epperly S., Braun-McNeill J. (eds), Proceed-ings of the seventeenth annual sea turtle symposium. NOAA Tech-nical Memorandum, National Marine Fisheries Service, Southeast Fisheries Science Center, Orlando, Florida, pp. 225-227.
Margaritoulis D., Argano R., Baran I., Bentivegna F., Bradai M.N., Cami-as J.A., Casale P., De Metrio G., Demetropoulos A., Gerosa G., Godley B.J., Hadoud D.A., Houghton J., Laurent L., Lazar B. 2003. Loggerhead Turtles in the Mediterranean Sea: Present Knowledge and Conservation Perspectives. In: Bolten A, Witherington BE (eds), Loggerhead Sea Turtles. Smithson-ian Books, Washington D.C. pp. 175-198.
Meylan A.B., Bowen B.W., Avise J.C. 1990. A genetic test of the natal homing versus social facilitation models for green turtle migration. Science 248: 724-727. http://dx.doi.org/10.1126/science.2333522
Miller M. 1997. Tools for population genetic analyses (TFPGA) 1.3; a Windows program for the analysis of allozyme and mo-lecular population genetic data. Documentation file. Available at: http://www.marksgeneticsoftware.net/tfpga.htm
Monzon-Arguello C., Rico C., Carreras C., Calabuig P., Marco A., Lopez-Jurado L.F. 2009. Variation in spatial distribution of juvenile loggerhead turtles in the eastern Atlantic and western Mediterranean Sea. J. Exp. Mar. Biol. Ecol. 373: 79-86. http://dx.doi.org/10.1016/j.jembe.2009.03.007
Monzon-Arguello C., Rico C., Naro-Maciel E., Varo-Cruz N., Lopez P., Marco A., Lopez-Jurado L.F. 2010. Population struc-ture and conservation implications for the loggerhead sea turtle of the Cape Verde Islands. Conserv. Genet. 11: 1871-1884.http://dx.doi.org/10.1007/s10592-010-0079-7
Moran M.D. 2003. Arguments for rejecting the sequential Bonfer-roni in ecological studies. Oikos 100: 403-405. http://dx.doi.org/10.1034/j.1600-0706.2003.12010.x
Moritz C. 1994. Defining Evolutionarily Significant Units for Con-servation. Trends Ecol. Evol. 9: 373-375. http://dx.doi.org/10.1016/0169-5347(94)90057-4
Narum S.R. 2006. Beyond Bonferroni: Less conservative analyses for conservation genetics. Conserv. Genet. 7: 783-787. http://dx.doi.org/10.1007/s10592-005-9056-y
Nei M. 1982. Evolution of Human Races at the Gene Level. In: Bonne-Tamir B., Cohen T., Goodman R.M. (eds), Human Ge-netics Part A: The Unfolding Genome. Alan R. Liss, New York, pp. 167-181.
Peakall R., Smouse P.E. 2006. GENALEX 6: genetic analysis in Ex-cel. Population genetic software for teaching and research. Mol. Ecol. Notes 6: 288-295. http://dx.doi.org/10.1111/j.1471-8286.2005.01155.x
Pella J., Masuda M. 2001. Bayesian methods for analysis of stock mixtures from genetic characters. Fish. Bull. 99: 151-167.
Pella J.J., Milner G.B. 1987. Use of genetic marks in stock composi-tion analysis. In Ryman N., Utter F. (eds), Population Genetics and Fishery Management. Univ. Washington Press, Seattle and London, pp. 247-276.
Perneger T.V. 1998. What’s wrong with Bonferroni adjustments. British Med. J. 316: 1236-1238. http://dx.doi.org/10.1136/bmj.316.7139.1236
Pritchard P.C.H. 1997. Evolution, phylogeny, and current status. In: Lutz P.L., Musick J.A. (eds), The biology of sea turtles. CRC Press, Boca Raton, FL, pp. 1-28.
Revelles M., Carreras C., Cardona L., Marco A., Bentivegna F., Castillo J.J., De Martino G., Mons J.L., Smith M.B., Rico C., Pascual M., Aguilar A. 2007. Evidence for an asymmetrical size exchange of loggerhead sea turtles between the Mediterranean and the Atlantic through the Straits of Gibraltar. J. Exp. Mar. Biol. Ecol. 349: 261-271. http://dx.doi.org/10.1016/j.jembe.2007.05.018
Rolf D.A., Bentzen P. 1989. The statistical analysis of mitochondri-al DNA polymorphisms: X2 and the problem of small samples. Mol. Biol. Evol. 6: 539-545.http://dx.doi.org/10.1093/bioinformatics/btg359
Ryman N., Palm S. 2006. POWSIM: a computer program for as-sessing statistical power when testing for genetic differentia-tion. Mol. Ecol. Notes 6: 600-602. http://dx.doi.org/10.1111/j.1471-8286.2006.01378.x
Ryman N., Palm S., Andre C., Carvalho G.R., Dahlgren T.G., Jorde P.E., Laikre L., Larsson L.C., Palme A., Ruzzante D.E. 2006. Power for detecting genetic divergence: differences between statistical methods and marker loci. Mol. Ecol. 15: 2031-2045. http://dx.doi.org/10.1111/j.1365-294X.2006.02839.x
Saied A., Maffucci F., Hochscheid S., Dryag S., Swayeb B., Borra M., Ouerghi A., Procaccini G., Bentivegna F. 2012. Loggerhead turtles nesting in Libya: an important management unit for the Mediterranean stock. Mar. Ecol. Prog. Ser. 450: 207-224.http://dx.doi.org/10.3354/meps09548
Schroth W., Streit B., Schierwater B. 1996. Evolutionary handicap for turtles. Nature 384: 521-522. http://dx.doi.org/10.1038/384521a0
SEATURTLE.ORG Maptool 2002. http://www.seaturtle.org/map-tool/. SEATURTLE.ORG, Inc.
Shamblin B.M., Bolten A.B., Bjorndal K.A., Dutton P.H., Nielsen J.T., Abreu-Grobois F.A., Reich K.J., Witherington B.E., Bagley D.A., Ehrhart L.M., Tucker A.D., Addison D.S., Arenas A., Johnson C., Carthy R.R., Lamont M.M., Dodd M.G., Gaines M.S., LaCasella E., Nairn C.J. 2012. Expanded mitochondrial control region sequences increase resolution of stock structure among North Atlantic loggerhead turtle rookeries. Mar. Ecol. Prog. Ser. 469: 145-160. http://dx.doi.org/10.3354/meps09980
Tomás J., Gazo M., Alvarez C., Gozalbes P., Perdiguero D., Raga J.A., Alegre F. 2008. Is the Spanish coast within the regular nesting range of the Mediterranean loggerhead sea turtle (Caretta caretta)? J. Mar. Biol. Ass. U. K. 88: 1509-1512.http://dx.doi.org/10.1017/S0025315408001768
Wallace B.P., DiMatteo A.D., Hurley B.J., Finkbeiner E.M., Bolten A.B., Chaloupka M.Y., Hutchinson B.J., Alberto Abreu-Grobois F., Amorocho D., Bjorndal K.A., Bourjea J., Bowen B.W., Briseno Duenas R., Casale P., Choudhury B.C., Costa A., Dutton P.H., Fallabrino A., Girard A., Girondot M., Godfrey M.H., Hamann M., Lopez-Mendilaharsu M., Marcovaldi M.A., Mortimer J.A., Musick J.A., Nel R., Pilcher N.J., Seminoff J.A., Troeng S., Witherington B., Mast R.B. 2010. Regional Management Units for Marine Turtles: A Novel Framework for Prioritizing Conservation and Research across Multiple Scales. PLoS One 5(12): e15465. http://dx.doi.org/10.1371/journal.pone.0015465
Wallace B.P., DiMatteo A.D., Bolten A.B., Chaloupka M.Y., Hutchinson B.J., Abreu-Grobois F.A., Mortimer J.A., Seminoff J.A., Amorocho D., Bjorndal K.A., Bourjea J., Bowen B.W., Duenas R.B., Casale P., Choudhury B.C., Costa A., Dutton P.H., Fallabrino A., Finkbeiner E.M., Girard A., Girondot M., Hamann M., Hurley B.J., Lopez-Mendilaharsu M., Marcovaldi M.A., Musick J.A., Nel R., Pilcher N.J., Troeng S., Wither-ington B., Mast R.B. 2011. Global Conservation Priorities for Marine Turtles. PLoS One 6(9): e24510. http://dx.doi.org/10.1371/journal.pone.0024510
Yilmaz C., Turkozan O., Bardakci F. 2011. Genetic structure of loggerhead turtle (Caretta caretta) populations in Turkey. Bio-chem. Syst. Ecol. 39: 266-276. http://dx.doi.org/10.1016/j.bse.2011.08.018
Yilmaz C., Turkozan O., Bardakci F., White M., Kararaj E. 2012. Loggerhead turtles (Caretta caretta) foraging at Drini Bay in Northern Albania: Genetic characterisation reveals new haplo-types. Acta Herpetol. 7: 155-162.


![TOURISM | Greece - Bulgaria: People & Statistics [GR]](https://static.fdokumen.com/doc/165x107/6321d64d61d7e169b00c591b/tourism-greece-bulgaria-people-statistics-gr.jpg)


![Cult Poetry in Archaic Greece [2012]](https://static.fdokumen.com/doc/165x107/6317a4a0bc8291e22e0e59eb/cult-poetry-in-archaic-greece-2012.jpg)

