Automated analysis of neuronal morphology, synapse number and synaptic recruitment
9
Journal of Neuroscience Methods 195 (2011) 185–193 Contents lists available at ScienceDirect Journal of Neuroscience Methods journal homepage: www.elsevier.com/locate/jneumeth Automated analysis of neuronal morphology, synapse number and synaptic recruitment Sabine K. Schmitz a,1 , J.J. Johannes Hjorth b,1 , Raoul M.S. Joemai c , Rick Wijntjes a , Susanne Eijgenraam a , Petra de Bruijn a , Christina Georgiou a , Arthur P.H. de Jong a , Arjen van Ooyen b , Matthijs Verhage a , L. Niels Cornelisse a,1 , Ruud F. Toonen a,∗,1 , Wouter Veldkamp c,1 a Functional Genomics, Center for Neurogenomics and Cognitive Research (CNCR), VU University Amsterdam, De Boelelaan 1085, 1081 HV Amsterdam, The Netherlands b Integrative Neurophysiology, Center for Neurogenomics and Cognitive Research (CNCR), VU University Amsterdam, De Boelelaan 1085, 1081 HV Amsterdam, The Netherlands c Department of Radiology, Leiden University Medical Center, Albinusdreef 2, 2333 ZA Leiden, The Netherlands article info Article history: Received 3 November 2010 Received in revised form 30 November 2010 Accepted 1 December 2010 Keywords: Neuronal morphology Immuno-fluorescence Synapses Dendrites Image analysis Synaptopathies abstract The shape, structure and connectivity of nerve cells are important aspects of neuronal function. Genetic and epigenetic factors that alter neuronal morphology or synaptic localization of pre- and post-synaptic proteins contribute significantly to neuronal output and may underlie clinical states. To assess the impact of individual genes and disease-causing mutations on neuronal morphology, reliable methods are needed. Unfortunately, manual analysis of immuno-fluorescence images of neurons to quantify neuronal shape and synapse number, size and distribution is labor-intensive, time-consuming and subject to human bias and error. We have developed an automated image analysis routine using steerable filters and deconvolu- tions to automatically analyze dendrite and synapse characteristics in immuno-fluorescence images. Our approach reports dendrite morphology, synapse size and number but also synaptic vesicle density and synaptic accumulation of proteins as a function of distance from the soma as consistent as expert observers while reducing analysis time considerably. In addition, the routine can be used to detect and quantify a wide range of neuronal organelles and is capable of batch analysis of a large number of images enabling high-throughput analysis. © 2010 Elsevier B.V. All rights reserved. 1. Introduction Cognitive function relies on proper wiring and functional con- nections within neuronal circuits. Many brain disorders ranging from mental retardation and neurodegeneration, to psychiatric disorders (reviewed in Lin and Koleske (2010)) have defects in neu- ronal morphology. Genetic mouse models and in vitro studies are widely used to investigate the molecular mechanisms of these brain disorders (Groffen et al., 2010; Jockusch et al., 2007; Kawabe et al., 2010; Priller et al., 2007). Thorough and consistent quantification of different aspects of neuronal morphology is vital to gain insight in the underlying pathogenic pathways. Manual quantification of neuronal morphology is very labor- intense, especially when measurements of multiple aspects of morphology (ranging from soma and dendrite morphology, ∗ Corresponding author. Tel.: +31 20 5986946; fax: +31 20 5986926. E-mail address: [email protected] (R.F. Toonen). 1 These authors equally contributed to the work. synapse number and localization to synaptic recruitment of pro- teins of interest) are desired. However, most available programs focus on automation of single parameter analysis such as (semi)- automated neurite tracing in 2D and 3D preparations (Losavio et al., 2008; Meijering, 2010; Meijering et al., 2004; Narro et al., 2007; Scorcioni et al., 2008; Yu et al., 2009). To our knowledge, no software is available to automatically detect synaptic regions and report synapse intensity and synaptic recruitment of proteins of interest. Therefore, for analysis of these parameters, regions of interest need to be placed around synapses and in the soma man- ually by the observer. In addition to being time-consuming, manual analysis of neu- ronal morphology is prone to observer bias. Not only lack of consistency within an individual observer, but also variance between different observers can reduce the level of reproducibility. To overcome these problems, we have developed a synapse and neurite detection program called SynD (Synapse Detector) for automated analysis of neuronal morphology. SynD has an intu- itive user interface and can therefore easily be used by scientists without prior image processing experience. The program auto- 0165-0270/$ – see front matter © 2010 Elsevier B.V. All rights reserved. doi:10.1016/j.jneumeth.2010.12.011
-
Upload
independent -
Category
Documents
-
view
1 -
download
0
Transcript of Automated analysis of neuronal morphology, synapse number and synaptic recruitment

As
SSARa
b
c
a
ARR3A
KNISDIS
1
nfdrwd2oi
io
0d
Journal of Neuroscience Methods 195 (2011) 185–193
Contents lists available at ScienceDirect
Journal of Neuroscience Methods
journa l homepage: www.e lsev ier .com/ locate / jneumeth
utomated analysis of neuronal morphology, synapse number andynaptic recruitment
abine K. Schmitza,1, J.J. Johannes Hjorthb,1, Raoul M.S. Joemaic, Rick Wijntjesa,usanne Eijgenraama, Petra de Bruijna, Christina Georgioua, Arthur P.H. de Jonga,rjen van Ooyenb, Matthijs Verhagea, L. Niels Cornelissea,1,uud F. Toonena,∗,1, Wouter Veldkampc,1
Functional Genomics, Center for Neurogenomics and Cognitive Research (CNCR), VU University Amsterdam, De Boelelaan 1085, 1081 HV Amsterdam, The NetherlandsIntegrative Neurophysiology, Center for Neurogenomics and Cognitive Research (CNCR), VU University Amsterdam, De Boelelaan 1085, 1081 HV Amsterdam, The NetherlandsDepartment of Radiology, Leiden University Medical Center, Albinusdreef 2, 2333 ZA Leiden, The Netherlands
r t i c l e i n f o
rticle history:eceived 3 November 2010eceived in revised form0 November 2010ccepted 1 December 2010
eywords:euronal morphology
a b s t r a c t
The shape, structure and connectivity of nerve cells are important aspects of neuronal function. Geneticand epigenetic factors that alter neuronal morphology or synaptic localization of pre- and post-synapticproteins contribute significantly to neuronal output and may underlie clinical states. To assess the impactof individual genes and disease-causing mutations on neuronal morphology, reliable methods are needed.Unfortunately, manual analysis of immuno-fluorescence images of neurons to quantify neuronal shapeand synapse number, size and distribution is labor-intensive, time-consuming and subject to human biasand error.
mmuno-fluorescenceynapsesendrites
mage analysisynaptopathies
We have developed an automated image analysis routine using steerable filters and deconvolu-tions to automatically analyze dendrite and synapse characteristics in immuno-fluorescence images.Our approach reports dendrite morphology, synapse size and number but also synaptic vesicle densityand synaptic accumulation of proteins as a function of distance from the soma as consistent as expertobservers while reducing analysis time considerably. In addition, the routine can be used to detect andquantify a wide range of neuronal organelles and is capable of batch analysis of a large number of images
t ana
enabling high-throughpu. Introduction
Cognitive function relies on proper wiring and functional con-ections within neuronal circuits. Many brain disorders ranging
rom mental retardation and neurodegeneration, to psychiatricisorders (reviewed in Lin and Koleske (2010)) have defects in neu-onal morphology. Genetic mouse models and in vitro studies areidely used to investigate the molecular mechanisms of these brainisorders (Groffen et al., 2010; Jockusch et al., 2007; Kawabe et al.,010; Priller et al., 2007). Thorough and consistent quantificationf different aspects of neuronal morphology is vital to gain insight
n the underlying pathogenic pathways.Manual quantification of neuronal morphology is very labor-ntense, especially when measurements of multiple aspectsf morphology (ranging from soma and dendrite morphology,
∗ Corresponding author. Tel.: +31 20 5986946; fax: +31 20 5986926.E-mail address: [email protected] (R.F. Toonen).
1 These authors equally contributed to the work.
165-0270/$ – see front matter © 2010 Elsevier B.V. All rights reserved.oi:10.1016/j.jneumeth.2010.12.011
lysis.© 2010 Elsevier B.V. All rights reserved.
synapse number and localization to synaptic recruitment of pro-teins of interest) are desired. However, most available programsfocus on automation of single parameter analysis such as (semi)-automated neurite tracing in 2D and 3D preparations (Losavioet al., 2008; Meijering, 2010; Meijering et al., 2004; Narro et al.,2007; Scorcioni et al., 2008; Yu et al., 2009). To our knowledge,no software is available to automatically detect synaptic regionsand report synapse intensity and synaptic recruitment of proteinsof interest. Therefore, for analysis of these parameters, regions ofinterest need to be placed around synapses and in the soma man-ually by the observer.
In addition to being time-consuming, manual analysis of neu-ronal morphology is prone to observer bias. Not only lack ofconsistency within an individual observer, but also variancebetween different observers can reduce the level of reproducibility.
To overcome these problems, we have developed a synapseand neurite detection program called SynD (Synapse Detector) forautomated analysis of neuronal morphology. SynD has an intu-itive user interface and can therefore easily be used by scientistswithout prior image processing experience. The program auto-

1 roscien
mswIsystahot
llcbw
2
2
inmes(
2
ipmo(9(v5(wao4
ooppct1mfippTstsws
86 S.K. Schmitz et al. / Journal of Neu
atically detects the soma, dendrites (using steerable filters) andynapses (using deconvolution and thresholding) and quantifies aide spectrum of neuronal morphology measures simultaneously.
n addition to classical parameters such as dendrite length andynapse number, it measures dendritic branching using Sholl anal-sis, reports the localization of synapses, synapse area and somaize. Finally, SynD quantifies synaptic fluorescence intensity in upo 3 channels in the soma and synapses and calculates their ratiosnd cumulative probability. We tested SynD by comparing to threeuman observers and show that it operates at the level of expertbservers and demonstrate its use to detect synaptic levels of pro-eins of interest.
Importantly, SynD also accurately reports the number, size,ocalization and density of other cellular organelles such asysomes, endosomes and secretory vesicles and can be used onultured neurons and fixed and living brain slices. SynD cane freely downloaded from www.cncr.nl/resources or from soft-are.incf.org/software/synd.
. Materials and methods
.1. Neuronal cell culture
Isolated hippocampal neurons were plated on astrocyte micro-slands (Bekkers and Stevens, 1991). Astrocytes and hippocampaleurons from either wild-type or munc18-1 heterozygous nullutant mice were prepared as described previously (de Wit
t al., 2009; Toonen et al., 2006; Wierda et al., 2007). High den-ity neuronal cultures were prepared according to de Wit et al.2009).
.2. Immunocytochemistry and image acquisition
Neurons were fixed in 4% paraformaldehyde at 14 daysn vitro. Cells were labeled with antibodies against MAP2 (chickenolyclonal, 1:20000, Abcam, Cat. No. ab5392), VAMP2 (mouseonoclonal, 1:2000, SySy, Cat. No. 104 211), LAMP1 (mouse mon-
clonal, 1:100, Stressgen, Cat. No. Ly1C6), transferrin receptorTfR) (mouse monoclonal, 1:500, Zymed, Cat. No. 136800), PSD-5 (mouse monoclonal, 1:250, Abcam, Cat. No. AB2723) or Munc18rabbit polyclonal, 1:500, SySy, Cat. No. 116 002) as described pre-iously (Wierda et al., 2007). Secondary antibodies were Alexa488,64 and 647-coupled anti-chicken, rabbit or mouse antibodies1:1000, Invitrogen). Overexpression of neuropeptide (NPY)-Venusas used to label secretory vesicles. All images were captured onlaser confocal system (LSM510 meta, Carl Zeiss) with a 40× oil
bjective (NA 1.3) at 0.7 zoom using LSM software release version.2 SP1 (license basic software R 3.0).
For Fig. 6I, a layer 2/3 pyramidal neuron from a 300 �m slicef the barrel region of the somatosensory cortex of an 8 weekld mouse was filled with biocytin (0.2%) using an intracellularatch-clamp recording pipette. The slice preparation was fixed inaraformaldhyde in PBS and then processed for staining with thehromogen 3,3′diaminobenzidine tetrahydrochloride (DAB) usinghe avidin–biotin–peroxidase method (Horikawa and Armstrong,988). For Fig. 6K, a layer 2/3 pyramidal neuron from a 300 �medial prefrontal cortex coronal brain slice of a P14 mouse was
lled with Alexa 594 (40 �M, Molecular Probes) via an intracellularatch pipette. The dye was allowed to diffuse for 20 min before theipette was withdrawn, causing the somatic membrane to reseal.he neuron was then imaged using a LEICA RS2 two-photon laser
canning microscope with a 63× objective and Ti:Sapphire laseruned to 840 nm excitation. Z-stacks were taken using 1 �m Ztep intervals of overlapping regions of the neuron. These imagesere then stitched together and Z-compressed using Image J (NIH)oftware.
ce Methods 195 (2011) 185–193
2.3. Image processing
SynD utilizes the MATLAB platform version 2009a (or later)requiring the statistics and imaging toolboxes. The program alsoruns as a stand-alone version in Windows and MacOS. Detectionand analysis is divided into five steps (Fig. 1B). In the first stepthe user selects an RGB image to load and specifies the channelsand resolution. The second step is soma detection. The third stepis automatic neurite detection with the option to edit the neuritemask. This is followed by synapse detection as the fourth step. Thefifth and final step is analysis and exporting the data as XML file toMicrosoft Excel (Microsoft, Redmond, WA, USA) or OpenOffice.
Step 1: Loading the imageThe user selects an RGB TIFF or LSM file to load, and then specifies
which channels contain morphology information, synapse stain-ing and the staining of a protein of interest, and in which colorsthey should be represented. The image resolution is read from theLSM file or, when importing TIFF files, the user can specify pixelsize manually.
Step 2: Soma detectionFirst the image is low-pass filtered using a 2D adaptive Wiener
filter (Lim, 1990) to reduce noise levels (Supplementary Fig. 1A andB). The function filters the image adaptively, using neighborhoodsof 7 × 7 pixels and assuming the noise is Gaussian distributed.The image is then thresholded to separate image background andforeground (Supplementary Fig. 1C). The soma is separated fromconnected neurites by performing a morphological opening (ero-sion followed by dilation) using a disk with radius 15 pixels asthe structural element (Supplementary Fig. 1D and E). The pro-gram then randomly places ten non-overlapping circular regionsof interest in the soma to quantify protein expression. If needed,the user can select regions of the image (for example bright regionsdue to air bubbles in the mounting medium) to be excluded fromthe analysis in this step.
Step 3: Neurite detectionNeurites appear as bright ridges surrounded by dark regions.
Starting from the soma the neurites are traced using local cri-teria. To identify which pixels are part of the neurite structurea steerable filter is applied to the image (Meijering et al., 2004)(Supplementary Fig. 2A). The filter is based on higher order deriva-tives of Gaussians G and is applied to the image f.
fij = −(f ∗ Gij)
Gij = ∂2G
∂i∂j
(1)
where * denotes the spatial convolution, and the indexes i, j can bein the directions x or y. The optimal direction of the steerable filterand the similarity to a neurite is calculated from the eigenvaluesand eigenvectors of the Hessian matrix H.
Hf (x) =[
fxx fxy
fyx fyy
]where fxy = fyx (2)
To determine whether a pixel should be added to a neurite bythe neurite tracing algorithm we use a cost function previouslydefined in Meijering et al. (2004).
C(p, q) = �C�(q) + (1 − �)Cv(p, q) (3)
where � ∈ [0,1] determines the relative contributions of the twocost components. The first part of the cost function (C�) indicateshow similar the surrounding of the new pixel is to a ridge, thesecond part of the cost function (Cv) indicates how similar thedirection from the old to the new pixel is with the directions of

S.K. Schmitz et al. / Journal of Neuroscience Methods 195 (2011) 185–193 187
F y SynDS within5 s by S( alizes
ig. 1. Schematic representation of the 5 steps of neuronal morphology analysis bynD: single neuron micro-island cultures (A1), single filled or transfected neuron0 �m. (B) Schematic representation of the 5 steps of neuronal morphology analysired) as synaptic marker and Munc18 (blue) as protein of interest, which mostly loc
the ridge around the new pixel (Supplementary Fig. 2B). Here
C�(q) = 1 − �(q)
�(q) ={
�(q)/�max � > 00 � ≤ 0
(4)
where �max denotes the largest eigenvalue (�) in the image.
Cv(p, q) = 12 (
√1 − ϕ(p, q) +
√1 − ϕ(p, q)) (5)
with p and q two points in the image, and
ϕ(p, q) =∣∣w(p) · d(p, q)
∣∣where w(p) is the normalized eigenvector at p and d(p, q) = (q −p)/ ‖q − p‖ is the normalized direction vector between the pointsp and q. The algorithm starts with a seed point, and then calculatesthe cost of all pixels surrounding the seed point using Eq. (3). Pixelsbelow the cost threshold are added to the neurite. This procedure iscontinued until there are no more pixels below the cost thresholdto add (Supplementary Fig. 2C). A second pass of the steerable filterdetection using smaller filter kernel allows detection of thinnerneurites. Our approach differs from the tracing in Meijering et al.(2004) where two manually selected points are connected by the
most likely path (as defined by the lowest cost), whereas we startfrom the soma and detect all connecting neurites by adding newpixels as long as the cost is lower than a threshold (here 0.9 washigh enough to allow inclusion of most neurites without addingspurious regions to the detected neurite tree).. (A) Representative pictures of neuronal culture types that can be analyzed witha neuronal network (A2) and neuronal population (A3). Grey scale bars represent
ynD. Pictures show a neuron stained for MAP2 (green) as dendritic marker, VAMP2into axons.
The intensity of the neurite staining might vary, with parts ofa neurite being weakly stained, leading to partial detection ofneurites. To address this problem, SynD automatically reconnectsorphaned branches: from the neurites’ end points the algorithmtakes a small step of 5 �m outward to try and bypass weakerstained parts of the neurite scanning a region within ±15◦ of theneurite axis to search for potential neurites as defined by the costfunction. Detected neurites are automatically connected to therest of the neuron. The user can inspect the final neurite tree andmake corrections if necessary. The program shows unconnectedbranches in a darker color than those connected to the soma,allowing for easy identification of orphaned branches.
Step 4: Synapse detectionSynapses appear as bright regions in the synapse channel. The
algorithm first identifies putative synapse pixels by threshold-ing the image, requiring putative synapses to be one standarddeviation above the mean synapse channel intensity. As synapsesare formed on the postsynaptic dendrites, putative synapse pix-els more than 1 �m from a neurite are excluded. Also regionssmaller than 0.35 �m2 are considered to be noise and discarded.In order to identify individual synapses it is necessary to separatesynapses with overlapping pixels in synapse clusters. Therefore,the program looks for synapse regions with unique local intensity
maxima. These single-synapse regions are then averaged togetherto generate a typical single synapse kernel. To identify individ-ual synapses in synapse clusters, the image is deconvolved withthe single synapse kernel. For synapse clusters that contain multi-ple centers, each synapse pixel is assigned to the closest center to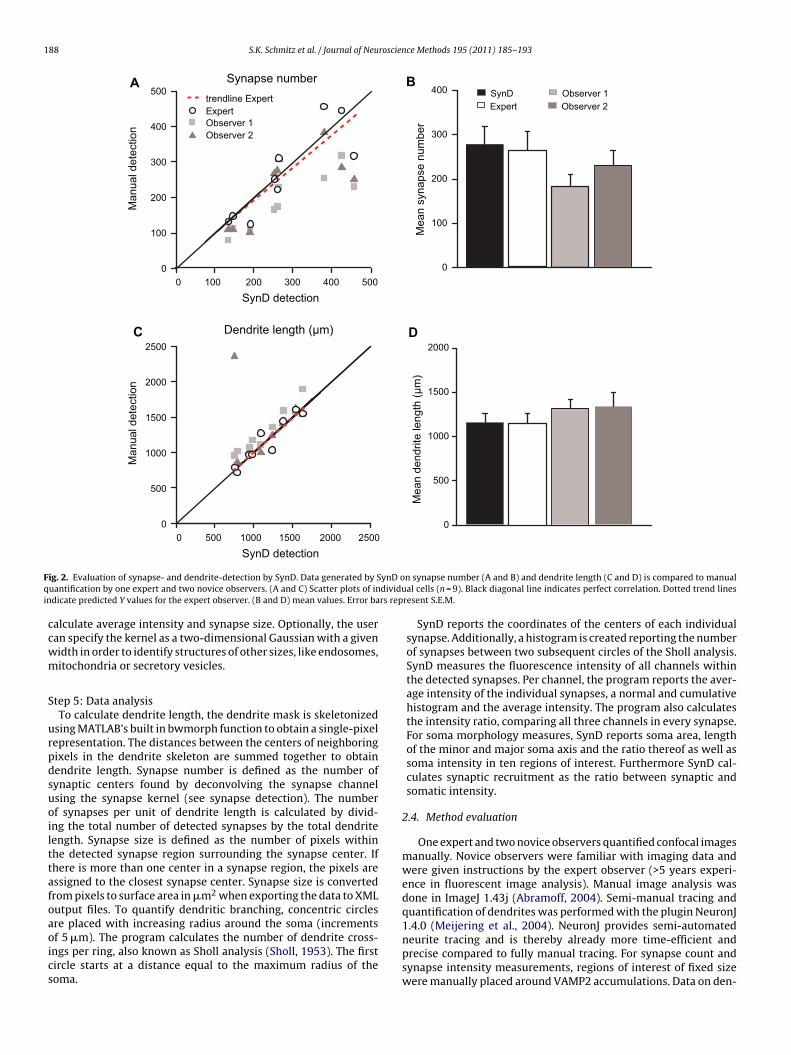
188 S.K. Schmitz et al. / Journal of Neuroscience Methods 195 (2011) 185–193
0 15001000500 2000 2500
0
1000
500
1500
2000
Man
ual d
etec
tion
2500
Dendrite length (µm)
Observer 1Observer 2
Experttrendline Expert
Synapse number
0 300200100 400
SynD detection
500
0
200
100
300
400M
anua
l det
ectio
n
500
0
1000
500
1500
2000
Mea
n de
ndrit
e le
ngth
(µ
m)
Observer 1Observer 2Expert
SynD
0
200
100
300
400
Mea
n sy
naps
e nu
mbe
r
BA
DC
F ynD oq dividui rs rep
SynD detection
ig. 2. Evaluation of synapse- and dendrite-detection by SynD. Data generated by Suantification by one expert and two novice observers. (A and C) Scatter plots of in
ndicate predicted Y values for the expert observer. (B and D) mean values. Error ba
calculate average intensity and synapse size. Optionally, the usercan specify the kernel as a two-dimensional Gaussian with a givenwidth in order to identify structures of other sizes, like endosomes,mitochondria or secretory vesicles.
Step 5: Data analysisTo calculate dendrite length, the dendrite mask is skeletonized
using MATLAB’s built in bwmorph function to obtain a single-pixelrepresentation. The distances between the centers of neighboringpixels in the dendrite skeleton are summed together to obtaindendrite length. Synapse number is defined as the number ofsynaptic centers found by deconvolving the synapse channelusing the synapse kernel (see synapse detection). The numberof synapses per unit of dendrite length is calculated by divid-ing the total number of detected synapses by the total dendritelength. Synapse size is defined as the number of pixels withinthe detected synapse region surrounding the synapse center. Ifthere is more than one center in a synapse region, the pixels areassigned to the closest synapse center. Synapse size is convertedfrom pixels to surface area in �m2 when exporting the data to XMLoutput files. To quantify dendritic branching, concentric circles
are placed with increasing radius around the soma (incrementsof 5 �m). The program calculates the number of dendrite cross-ings per ring, also known as Sholl analysis (Sholl, 1953). The firstcircle starts at a distance equal to the maximum radius of thesoma.n synapse number (A and B) and dendrite length (C and D) is compared to manualal cells (n = 9). Black diagonal line indicates perfect correlation. Dotted trend lines
resent S.E.M.
SynD reports the coordinates of the centers of each individualsynapse. Additionally, a histogram is created reporting the numberof synapses between two subsequent circles of the Sholl analysis.SynD measures the fluorescence intensity of all channels withinthe detected synapses. Per channel, the program reports the aver-age intensity of the individual synapses, a normal and cumulativehistogram and the average intensity. The program also calculatesthe intensity ratio, comparing all three channels in every synapse.For soma morphology measures, SynD reports soma area, lengthof the minor and major soma axis and the ratio thereof as well assoma intensity in ten regions of interest. Furthermore SynD cal-culates synaptic recruitment as the ratio between synaptic andsomatic intensity.
2.4. Method evaluation
One expert and two novice observers quantified confocal imagesmanually. Novice observers were familiar with imaging data andwere given instructions by the expert observer (>5 years experi-ence in fluorescent image analysis). Manual image analysis wasdone in ImageJ 1.43j (Abramoff, 2004). Semi-manual tracing andquantification of dendrites was performed with the plugin NeuronJ
1.4.0 (Meijering et al., 2004). NeuronJ provides semi-automatedneurite tracing and is thereby already more time-efficient andprecise compared to fully manual tracing. For synapse count andsynapse intensity measurements, regions of interest of fixed sizewere manually placed around VAMP2 accumulations. Data on den-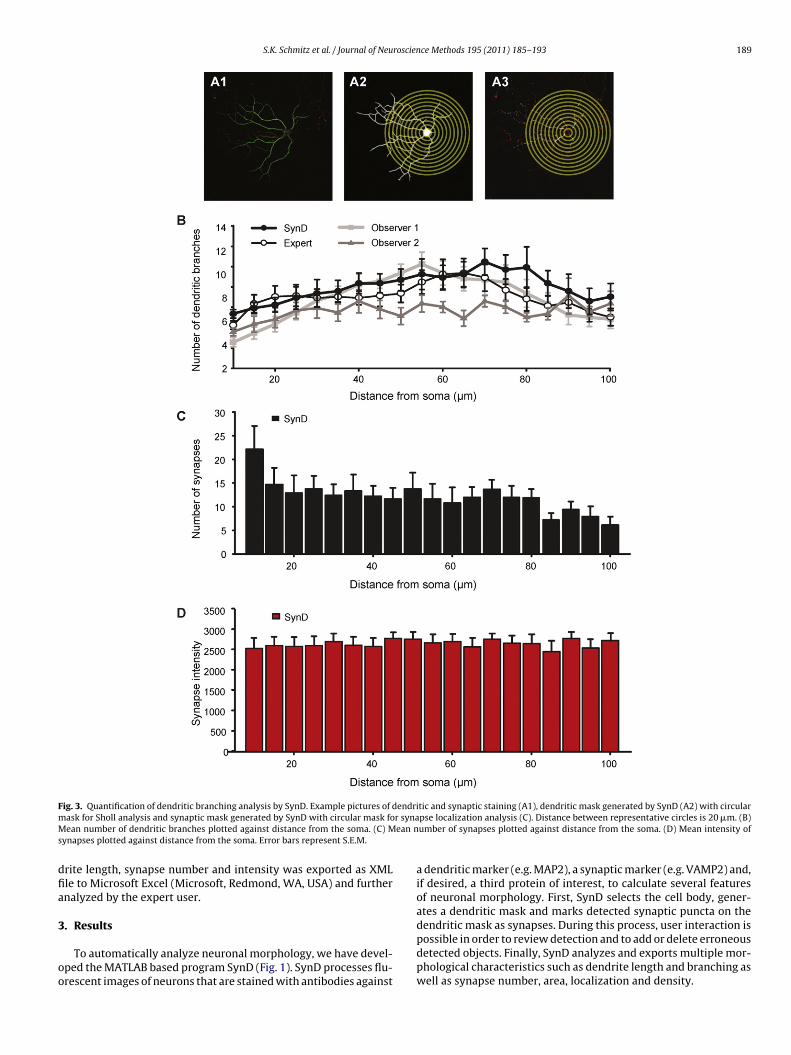
S.K. Schmitz et al. / Journal of Neuroscience Methods 195 (2011) 185–193 189
F endrim r synaM ean ns
dfia
3
oo
ig. 3. Quantification of dendritic branching analysis by SynD. Example pictures of dask for Sholl analysis and synaptic mask generated by SynD with circular mask foean number of dendritic branches plotted against distance from the soma. (C) M
ynapses plotted against distance from the soma. Error bars represent S.E.M.
rite length, synapse number and intensity was exported as XMLle to Microsoft Excel (Microsoft, Redmond, WA, USA) and furthernalyzed by the expert user.
. Results
To automatically analyze neuronal morphology, we have devel-ped the MATLAB based program SynD (Fig. 1). SynD processes flu-rescent images of neurons that are stained with antibodies against
tic and synaptic staining (A1), dendritic mask generated by SynD (A2) with circularpse localization analysis (C). Distance between representative circles is 20 �m. (B)umber of synapses plotted against distance from the soma. (D) Mean intensity of
a dendritic marker (e.g. MAP2), a synaptic marker (e.g. VAMP2) and,if desired, a third protein of interest, to calculate several featuresof neuronal morphology. First, SynD selects the cell body, gener-ates a dendritic mask and marks detected synaptic puncta on the
dendritic mask as synapses. During this process, user interaction ispossible in order to review detection and to add or delete erroneousdetected objects. Finally, SynD analyzes and exports multiple mor-phological characteristics such as dendrite length and branching aswell as synapse number, area, localization and density.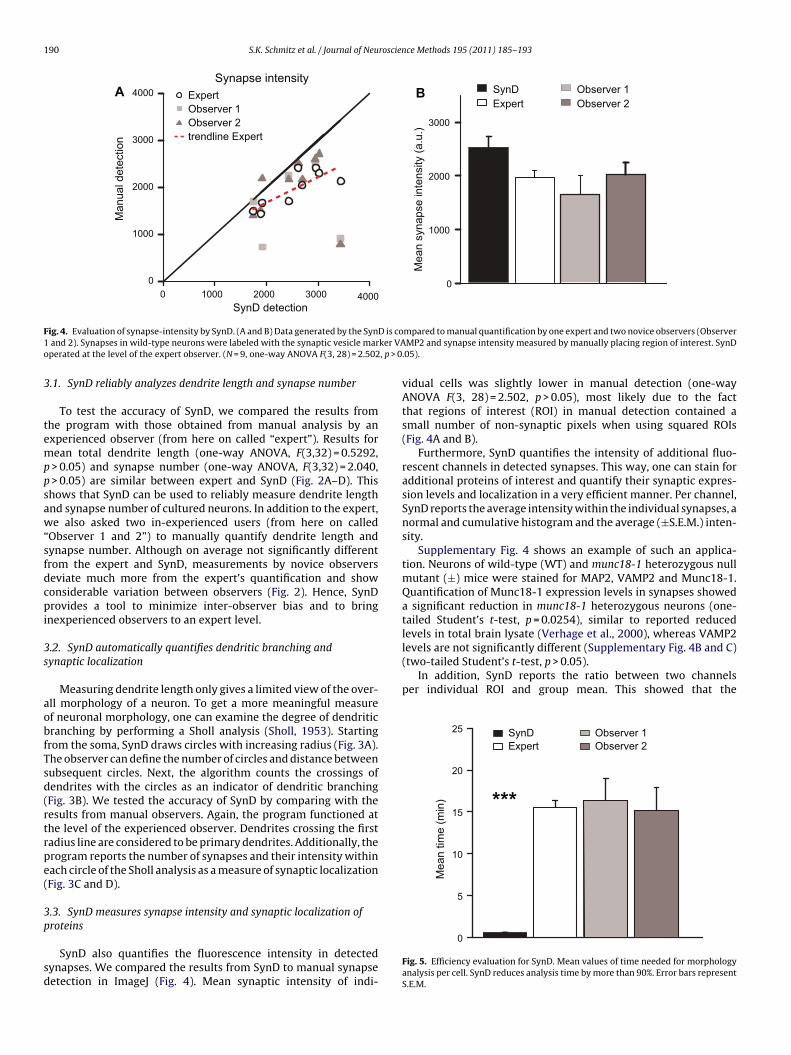
190 S.K. Schmitz et al. / Journal of Neuroscience Methods 195 (2011) 185–193
0 20001000 3000
SynD detection4000
0
1000
2000
3000
Man
ual d
etec
tion
4000
Synapse intensity
Observer 1Observer 2
Expert
trendline Expert
0
1000
2000
3000
Mea
n sy
naps
e in
tens
ity (
a.u.
)
Observer 1Observer 2Expert
SynDBA
F D is co1 ker VAo , p > 0
3
temppsaw“sfdcpi
3s
aobfTsd(rtrpe(
3p
sd
levels are not significantly different (Supplementary Fig. 4B and C)(two-tailed Student’s t-test, p > 0.05).
In addition, SynD reports the ratio between two channelsper individual ROI and group mean. This showed that the
Observer 1Observer 2Expert
SynD
10
20
25
Mea
n tim
e (m
in)
5
15***
ig. 4. Evaluation of synapse-intensity by SynD. (A and B) Data generated by the Synand 2). Synapses in wild-type neurons were labeled with the synaptic vesicle marperated at the level of the expert observer. (N = 9, one-way ANOVA F(3, 28) = 2.502
.1. SynD reliably analyzes dendrite length and synapse number
To test the accuracy of SynD, we compared the results fromhe program with those obtained from manual analysis by anxperienced observer (from here on called “expert”). Results forean total dendrite length (one-way ANOVA, F(3,32) = 0.5292,> 0.05) and synapse number (one-way ANOVA, F(3,32) = 2.040,> 0.05) are similar between expert and SynD (Fig. 2A–D). This
hows that SynD can be used to reliably measure dendrite lengthnd synapse number of cultured neurons. In addition to the expert,e also asked two in-experienced users (from here on called
Observer 1 and 2”) to manually quantify dendrite length andynapse number. Although on average not significantly differentrom the expert and SynD, measurements by novice observerseviate much more from the expert’s quantification and showonsiderable variation between observers (Fig. 2). Hence, SynDrovides a tool to minimize inter-observer bias and to bring
nexperienced observers to an expert level.
.2. SynD automatically quantifies dendritic branching andynaptic localization
Measuring dendrite length only gives a limited view of the over-ll morphology of a neuron. To get a more meaningful measuref neuronal morphology, one can examine the degree of dendriticranching by performing a Sholl analysis (Sholl, 1953). Startingrom the soma, SynD draws circles with increasing radius (Fig. 3A).he observer can define the number of circles and distance betweenubsequent circles. Next, the algorithm counts the crossings ofendrites with the circles as an indicator of dendritic branchingFig. 3B). We tested the accuracy of SynD by comparing with theesults from manual observers. Again, the program functioned athe level of the experienced observer. Dendrites crossing the firstadius line are considered to be primary dendrites. Additionally, therogram reports the number of synapses and their intensity withinach circle of the Sholl analysis as a measure of synaptic localizationFig. 3C and D).
.3. SynD measures synapse intensity and synaptic localization of
roteinsSynD also quantifies the fluorescence intensity in detectedynapses. We compared the results from SynD to manual synapseetection in ImageJ (Fig. 4). Mean synaptic intensity of indi-
mpared to manual quantification by one expert and two novice observers (ObserverMP2 and synapse intensity measured by manually placing region of interest. SynD
.05).
vidual cells was slightly lower in manual detection (one-wayANOVA F(3, 28) = 2.502, p > 0.05), most likely due to the factthat regions of interest (ROI) in manual detection contained asmall number of non-synaptic pixels when using squared ROIs(Fig. 4A and B).
Furthermore, SynD quantifies the intensity of additional fluo-rescent channels in detected synapses. This way, one can stain foradditional proteins of interest and quantify their synaptic expres-sion levels and localization in a very efficient manner. Per channel,SynD reports the average intensity within the individual synapses, anormal and cumulative histogram and the average (±S.E.M.) inten-sity.
Supplementary Fig. 4 shows an example of such an applica-tion. Neurons of wild-type (WT) and munc18-1 heterozygous nullmutant (±) mice were stained for MAP2, VAMP2 and Munc18-1.Quantification of Munc18-1 expression levels in synapses showeda significant reduction in munc18-1 heterozygous neurons (one-tailed Student’s t-test, p = 0.0254), similar to reported reducedlevels in total brain lysate (Verhage et al., 2000), whereas VAMP2
0
Fig. 5. Efficiency evaluation for SynD. Mean values of time needed for morphologyanalysis per cell. SynD reduces analysis time by more than 90%. Error bars representS.E.M.
S.K. Schmitz et al. / Journal of Neuroscience Methods 195 (2011) 185–193 191
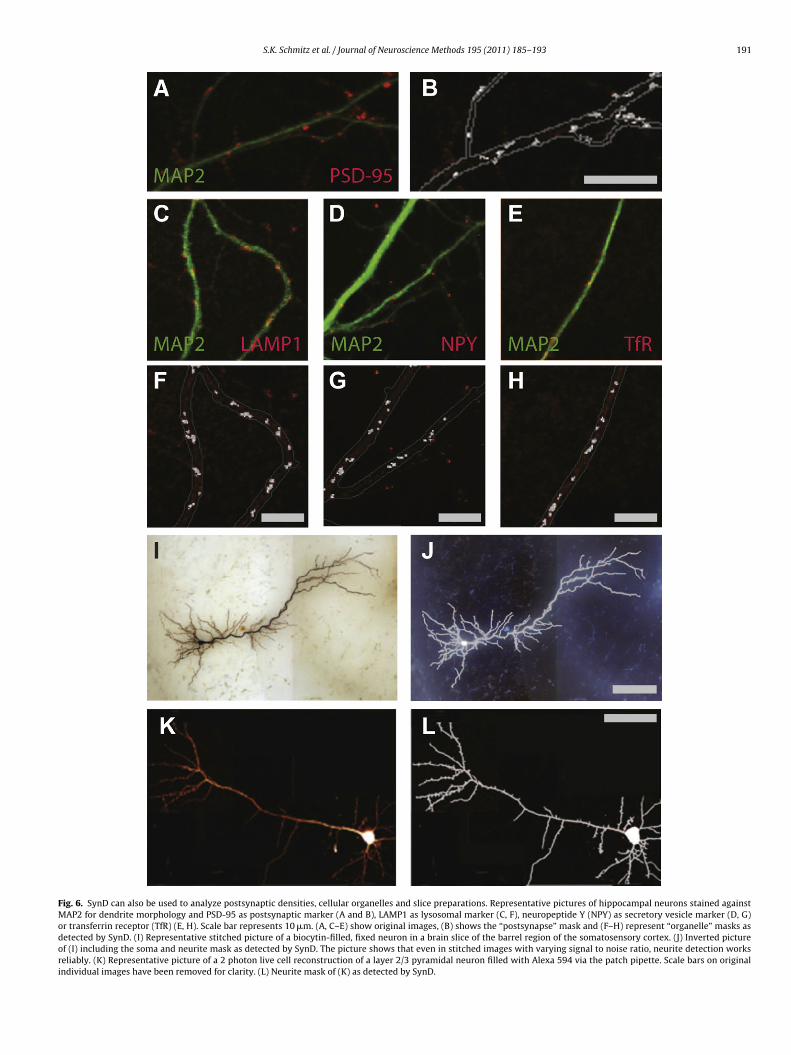
Fig. 6. SynD can also be used to analyze postsynaptic densities, cellular organelles and slice preparations. Representative pictures of hippocampal neurons stained againstMAP2 for dendrite morphology and PSD-95 as postsynaptic marker (A and B), LAMP1 as lysosomal marker (C, F), neuropeptide Y (NPY) as secretory vesicle marker (D, G)or transferrin receptor (TfR) (E, H). Scale bar represents 10 �m. (A, C–E) show original images, (B) shows the “postsynapse” mask and (F–H) represent “organelle” masks asdetected by SynD. (I) Representative stitched picture of a biocytin-filled, fixed neuron in a brain slice of the barrel region of the somatosensory cortex. (J) Inverted pictureof (I) including the soma and neurite mask as detected by SynD. The picture shows that even in stitched images with varying signal to noise ratio, neurite detection worksreliably. (K) Representative picture of a 2 photon live cell reconstruction of a layer 2/3 pyramidal neuron filled with Alexa 594 via the patch pipette. Scale bars on originalindividual images have been removed for clarity. (L) Neurite mask of (K) as detected by SynD.
1 roscien
MgWrin(prmp
3
namiotthwTnyi
3
qnmpaaaqbrnafdatSnnm
4
oldtari
ao
92 S.K. Schmitz et al. / Journal of Neu
unc18/VAMP ratio is reduced by 41% in munc18 heterozy-ous neurons (Supplementary Fig. 4D) (unpaired t-test withelsh correction, p = 0.0109). Finally, SynD calculates the fluo-
escent intensity in the cell soma by randomly placing 10 ROIsn the soma. Munc18 somatic levels in munc18 heterozygoteull mutant neurons are reduced by 48% compared to wild-typeSupplementary Fig. 4E, unpaired t-test with Welsh correction,= 0.0039). The ratio of synaptic expression and somatic expression
eports the synaptic recruitment of Munc18 in wild-type and nullutant neurons (Supplementary Fig. 4F, two-tailed Student’s t-test,> 0.05).
.4. SynD is time-efficient
To evaluate the efficiency of SynD, we measured the timeeeded to analyze neuronal morphology automatically or manu-lly. Fig. 5 shows that both expert and novices need on averageore than 15 min for manual analysis of a single neuron. Strik-
ngly, SynD can do the same quantification in less than a minuten a modern desktop computer, saving more than 90% analysisime (one-way ANOVA, F(3,32) = 14.956, p < 0.0001). Importantly,he program can also operate in batch mode: once the first neuronas been analyzed the operator can select an image folder, SynDill analyze all images in this folder with the selected settings.
hus, the program allows reliable and time-efficient analysis ofeuronal morphology and has the capacity to perform this anal-sis on a large number of images without the need for humanntervention.
.5. SynD is not limited to synapse detection in cultured neurons
In addition to single neuron micro-island cultures, SynD can alsouantify neuronal morphology of individual neurons grown in aetwork (examples in Fig. 1A2 and A3). In addition to presynapticarkers such as VAMP2 or synapsin, SynD also allows analysis of
ostsynaptic densities (Fig. 6A and B). Supplementary Fig. 5 showsrepresentative image in which dendrites were stained with an
ntibody against MAP2 and postsynaptic densities were quantifieds PSD-95 positive puncta on the dendrites. Furthermore, besidesuantification of pre- and post-synaptic terminals, SynD can alsoe used to quantify the number of intra-cellular organelles in neu-ites. Fig. 6C–H shows examples where SynD is used to count theumber of lysosomes, secretory vesicles and transferrin receptorccumulations in cultured neurons. Here, dendrites were stainedor MAP2 and only organelles in the dendrite were identified. Ifesired, organelles can also be detected in axons when using anxonal marker or, when a space filling protein like EGFP is used,he program reports the total amount of organelles. In addition,ynD can also be used to analyze the morphology of biocytin-filledeurons in brain slices (Fig. 6I and J) or the morphology of livingeurons filled with Alexa 594 in brain slices imaged with 2-photonicroscopy (Fig. 6K and L).
. Discussion
Reliable and comprehensive analysis of neuronal morphol-gy together with quantitative measurements on synaptic proteinocalization and levels is an important first step in the analysis ofisease-causing mutations or other genetic perturbations in synap-ic proteins. Unfortunately, most of the available software is notble to provide a comprehensive analysis of all aspects of neu-
onal morphology, while manual analysis of neuronal morphologys labor-intensive and prone to observer-bias.To overcome these shortcomings, we developed an imagenalysis routine for automated analysis of neuronal morphol-gy. SynD is unbiased, reliable and accurate and performs at the
ce Methods 195 (2011) 185–193
level of an expert observer. In addition, the program is highlyautomated and can operate on multiple images without humanintervention. This enables simultaneous analysis of multiple mor-phological features and high throughput screening of differentgenetic and pharmacological treatments. Although SynD is highlyautomated, user interaction is possible during all detection stepsallowing optimal control for the scientist, even without anyprogramming or image processing experience. SynD minimizesinter-observer bias and brings inexperienced observers to an expertlevel.
The program integrates two important novel features that willaid in the analysis of genetic perturbations that may have an impactupon synapse development or synaptic recruitment of proteins ofinterest. First, SynD provides information on the localization ofdetected synapses by reporting the number of detected synapsesas a function of distance from the soma (Fig. 3C). This distinguishesbetween effects on proximal synapses and more distal synapsesas for instance in the case of acute overexpression of the polo-likekinase 2 protein (Pak and Sheng, 2003). Second, SynD measures theexpression level of proteins of interest in these detected synapsesand compares the synaptic levels with the level in the cell soma(Fig. 3D and Supplementary Fig. 4E and F). This generates informa-tion on protein transport and synaptic recruitment as a function ofdistance traveled from the soma. In this way, it will be feasible totest the effect of genetically perturbing for instance a presynapticscaffolding protein on the recruitment of a large number of proteinsof interest.
Finally, SynD is not restricted to synapse measurements but canbe applied to report on a wide variety of cellular features rangingfrom synapse to organelle analysis and can be used for differenttypes of cell cultures and brain slices (Fig. 6).
Taken together, SynD is a powerful tool for automated and stan-dardized analysis of neuronal morphology.
Acknowledgements
The authors would like to thank Dr. Rhiannon Meredith for pro-viding images of brain slices, Dr. Tatiana Boiko for providing imagesof neuronal networks, Juliane Lauks for providing images of differ-ent organelle markers and Desiree Schut for testing earlier versionsof the software. This work was supported by a Neuromics MarieCurie Early stage Training grant (MEST-CT-2005-020919; SKS). SKSis a recipient of the Netherlands Scientific Organization Toptal-ent grant (NWO 021.001.076) and JH is supported by NWO grant635.100.017.
Appendix A. Supplementary data
Supplementary data associated with this article can be found, inthe online version, at doi:10.1016/j.jneumeth.2010.12.011.
References
Abramoff MD. Image processing with imageJ. In: Magelhaes PJ, editor. Biophotonicsinternational; 2004.
Bekkers J, Stevens C. Excitatory and inhibitory autaptic currents in isolatedhippocampal neurons maintained in cell culture. Proc Natl Acad Sci USA1991;88:7834–8.
de Wit J, Toonen RF, Verhage M. Matrix-dependent local retention of secretoryvesicle cargo in cortical neurons. J Neurosci 2009;29:23–37.
Groffen A, Martens S, Díez Arazola R, Cornelisse L, Lozovaya N, de Jong A, et al. Doc2bis a high-affinity Ca2+ sensor for spontaneous neurotransmitter release. Science2010;327:1614–8.
Horikawa K, Armstrong W. A versatile means of intracellular labeling: injec-tion of biocytin and its detection with avidin conjugates. J Neurosci Methods1988;25:1–11.
Jockusch W, Speidel D, Sigler A, Sørensen J, Varoqueaux F, Rhee J, et al. CAPS-1 and CAPS-2 are essential synaptic vesicle priming proteins. Cell 2007;131:796–808.
roscien
K
L
L
L
MM
N
P
S.K. Schmitz et al. / Journal of Neu
awabe H, Neeb A, Dimova K, Young SJ, Takeda M, Katsurabayashi S, et al. Regulationof Rap2A by the ubiquitin ligase Nedd4-1 controls neurite development. Neuron2010;65:358–72.
im JS. Two-dimensional signal and image processing. Englewood Cliffs, NJ: PrenticeHall; 1990. p. 548.
in Y, Koleske A. Mechanisms of synapse and dendrite maintenance and their dis-ruption in psychiatric and neurodegenerative disorders. Annu Rev Neurosci2010;33:349–78.
osavio B, Liang Y, Santamaría-Pang A, Kakadiaris I, Colbert C, Saggau P. Live neu-ron morphology automatically reconstructed from multiphoton and confocalimaging data. J Neurophysiol 2008;100:2422–9.
eijering E. Neuron tracing in perspective. Cytometry A 2010;77:693–704.eijering E, Jacob M, Sarria J, Steiner P, Hirling H, Unser M. Design and validation
of a tool for neurite tracing and analysis in fluorescence microscopy images.
Cytometry A 2004;58:167–76.arro M, Yang F, Kraft R, Wenk C, Efrat A, Restifo L. NeuronMetrics: software forsemi-automated processing of cultured neuron images. Brain Res 2007;1138:57–75.
ak D, Sheng M. Targeted protein degradation and synapse remodeling by aninducible protein kinase. Science 2003;302:1368–73.
ce Methods 195 (2011) 185–193 193
Priller C, Dewachter I, Vassallo N, Paluch S, Pace C, Kretzschmar H, et al. Mutantpresenilin 1 alters synaptic transmission in cultured hippocampal neurons. JBiol Chem 2007;282:1119–27.
Scorcioni R, Polavaram S, Ascoli G. L-Measure: a web-accessible tool for the analysis,comparison and search of digital reconstructions of neuronal morphologies. NatProtoc 2008;3:866–76.
Sholl D. Dendritic organization in the neurons of the visual and motor cortices ofthe cat. J Anat 1953;87:387–406.
Toonen RFG, Wierda K, Sons MS, de Wit H, Cornelisse LN, Brussaard A, et al. Munc18-1 expression levels control synapse recovery by regulating readily releasablepool size. Proc Natl Acad Sci USA 2006;103:18332–7.
Verhage M, Maia AS, Plomp JJ, Brussaard AB, Heeroma JH, Vermeer H, et al. Synap-tic assembly of the brain in the absence of neurotransmitter secretion. Science2000;287:864–9.
Wierda KDB, Toonen RFG, de Wit H, Brussaard AB, Verhage M. Interdependenceof PKC-dependent and PKC-independent pathways for presynaptic plasticity.Neuron 2007;54:275–90.
Yu W, Lee H, Hariharan S, Bu W, Ahmed S. Quantitative neurite outgrowth measure-ment based on image segmentation with topological dependence. Cytometry A2009;75:289–97.