Neuronal Avalanches in Neocortical Circuits
11
Behavioral/Systems/Cognitive Neuronal Avalanches in Neocortical Circuits John M. Beggs and Dietmar Plenz Unit of Neural Network Physiology, Laboratory of Systems Neuroscience, National Institute of Mental Health, Bethesda, Maryland 20892 Networks of living neurons exhibit diverse patterns of activity, including oscillations, synchrony, and waves. Recent work in physics has shown yet another mode of activity in systems composed of many nonlinear units interacting locally. For example, avalanches, earth- quakes, and forest fires all propagate in systems organized into a critical state in which event sizes show no characteristic scale and are described by power laws. We hypothesized that a similar mode of activity with complex emergent properties could exist in networks of cortical neurons. We investigated this issue in mature organotypic cultures and acute slices of rat cortex by recording spontaneous local field potentials continuously using a 60 channel multielectrode array. Here, we show that propagation of spontaneous activity in cortical networks is described by equations that govern avalanches. As predicted by theory for a critical branching process, the propagation obeys a power law with an exponent of 3/2 for event sizes, with a branching parameter close to the critical value of 1. Simulations show that a branching parameter at this value optimizes information transmission in feedforward networks, while preventing runaway network excitation. Our findings suggest that “neuronal avalanches” may be a generic property of cortical networks, and represent a mode of activity that differs profoundly from oscillatory, synchronized, or wave-like network states. In the critical state, the network may satisfy the competing demands of information transmission and network stability. Key words: cortex; organotypic culture; branching process; self-organized criticality; multielectrode array; power law Introduction During neuronal processing, individual neurons can integrate inputs from thousands of other neurons and, after reaching threshold, distribute their activity back to the network. This basic process of neuronal integration and redistribution is similar to that seen in many other complex systems in which simple units with thresholds integrate and then dissipate energy back to the system (Paczuski et al., 1996). In such systems, events like earth- quakes (Gutenberg and Richter, 1956), forest fires (Malamud et al., 1998), and nuclear chain reactions (Harris, 1989) emerge as one unit exceeds threshold and causes other units to do so in turn, thereby initiating a cascade that propagates through the larger system. The spatial and temporal distributions of such cascades or “avalanches” have been well described by power laws (Pac- zuski et al., 1996), indicating that the system is in a critical state (Bak et al., 1987) and that the dynamics can be seen at many different scales. This type of avalanche propagation typically oc- curs in these systems without oscillations, synchrony, or waves. Neuronal activity could similarly be considered as a kind of neu- ronal avalanche in which activity propagates as individual neu- rons trigger action potential firing in subsequent neurons. Al- though just such a process has been suggested by several neuronal network models (Chen et al., 1995; Corral et al., 1995; Herz and Hopfield, 1995; Eurich et al., 2002), it has been unclear so far whether actual neuronal networks display such critical behavior and whether such criticality is a robust feature of neuronal orga- nization. If present, neuronal avalanches would constitute a new mode of network activity, and could have important implications for information processing. To examine these issues, we studied propagation of spontane- ous neuronal activity in cultured and acute slices of rat cortex on 60-channel multielectrode arrays (Plenz and Aertsen, 1996; Plenz and Kitai, 1998; Karpiak and Plenz, 2002). We also used comple- mentary network simulations to examine how propagation like that observed in the cultures would influence information pro- cessing in a simple feedforward network. Using these methods, the present study was conducted to examine two issues: (1) Do cortical networks in vitro produce avalanches that comply with physical theories of critical systems? (2) If cortical networks are in the critical state, what consequences does this have for informa- tion processing? Materials and Methods Organotypic culture experiments. Organotypic cultures from coronal slices of rat somatosensory cortex were prepared in accordance with National Institutes of Health guidelines (Plenz and Kitai, 1998), with the cortical slice placed onto the 8 8 multielectrode array (interelectrode distance, 200 m; electrode diameter, 30 m; Multichannelsystems, Re- utlingen, Germany) (Egert et al., 1998; Karpiak and Plenz, 2002). Acute coronal slices were cut at 350 m thickness and were 1.5 mm deep and 2–3 mm wide. The array covered 50 –70% of the cortical tissue, with the basal row aligned to the white matter and the upper row extending into the supragranular layers (see Fig. 1 A). In three of seven cultures, a coronal striatal and nigral slice (500 m thickness) were cocultured out- Received June 26, 2003; revised Oct. 15, 2003; accepted Oct. 17, 2003. We thank Veronica Karpiak and Craig Stewart for preparation of the cultures, Craig Stewart for help with phar- macological and acute slice experiments, David Greenberg for discussions on the branching parameter, David Ide and Larry Pfeffer for help with the incubator design, and Barry Richmond, Dante Chialvo, Steve Wise, and Chip Gerfen for their helpful comments on a previous version of this manuscript. Correspondence should be addressed to Dr. Dietmar Plenz, Unit of Neural Network Physiology, Laboratory of Systems Neuroscience–National Institute of Mental Health, Building 36, Room 2D-26, 9000 Rockville Pike, Be- thesda, MD 20892-4075. E-mail: [email protected]. J. M. Beggs’ present address: Department of Physics, Biocomplexity Institute, Swain Hall West 169, 727 East Third Street, Indiana University, Bloomington, IN 47405. Copyright © 2003 Society for Neuroscience 0270-6474/03/2311167-11$15.00/0 The Journal of Neuroscience, December 3, 2003 • 23(35):11167–11177 • 11167
-
Upload
independent -
Category
Documents
-
view
4 -
download
0
Transcript of Neuronal Avalanches in Neocortical Circuits
Behavioral/Systems/Cognitive
Neuronal Avalanches in Neocortical Circuits
John M. Beggs and Dietmar PlenzUnit of Neural Network Physiology, Laboratory of Systems Neuroscience, National Institute of Mental Health, Bethesda, Maryland 20892
Networks of living neurons exhibit diverse patterns of activity, including oscillations, synchrony, and waves. Recent work in physics hasshown yet another mode of activity in systems composed of many nonlinear units interacting locally. For example, avalanches, earth-quakes, and forest fires all propagate in systems organized into a critical state in which event sizes show no characteristic scale and aredescribed by power laws. We hypothesized that a similar mode of activity with complex emergent properties could exist in networks ofcortical neurons. We investigated this issue in mature organotypic cultures and acute slices of rat cortex by recording spontaneous localfield potentials continuously using a 60 channel multielectrode array. Here, we show that propagation of spontaneous activity in corticalnetworks is described by equations that govern avalanches. As predicted by theory for a critical branching process, the propagation obeysa power law with an exponent of �3/2 for event sizes, with a branching parameter close to the critical value of 1. Simulations show that abranching parameter at this value optimizes information transmission in feedforward networks, while preventing runaway networkexcitation. Our findings suggest that “neuronal avalanches” may be a generic property of cortical networks, and represent a mode ofactivity that differs profoundly from oscillatory, synchronized, or wave-like network states. In the critical state, the network may satisfythe competing demands of information transmission and network stability.
Key words: cortex; organotypic culture; branching process; self-organized criticality; multielectrode array; power law
IntroductionDuring neuronal processing, individual neurons can integrateinputs from thousands of other neurons and, after reachingthreshold, distribute their activity back to the network. This basicprocess of neuronal integration and redistribution is similar tothat seen in many other complex systems in which simple unitswith thresholds integrate and then dissipate energy back to thesystem (Paczuski et al., 1996). In such systems, events like earth-quakes (Gutenberg and Richter, 1956), forest fires (Malamud etal., 1998), and nuclear chain reactions (Harris, 1989) emerge asone unit exceeds threshold and causes other units to do so in turn,thereby initiating a cascade that propagates through the largersystem. The spatial and temporal distributions of such cascadesor “avalanches” have been well described by power laws (Pac-zuski et al., 1996), indicating that the system is in a critical state(Bak et al., 1987) and that the dynamics can be seen at manydifferent scales. This type of avalanche propagation typically oc-curs in these systems without oscillations, synchrony, or waves.Neuronal activity could similarly be considered as a kind of neu-ronal avalanche in which activity propagates as individual neu-rons trigger action potential firing in subsequent neurons. Al-
though just such a process has been suggested by several neuronalnetwork models (Chen et al., 1995; Corral et al., 1995; Herz andHopfield, 1995; Eurich et al., 2002), it has been unclear so farwhether actual neuronal networks display such critical behaviorand whether such criticality is a robust feature of neuronal orga-nization. If present, neuronal avalanches would constitute a newmode of network activity, and could have important implicationsfor information processing.
To examine these issues, we studied propagation of spontane-ous neuronal activity in cultured and acute slices of rat cortex on60-channel multielectrode arrays (Plenz and Aertsen, 1996; Plenzand Kitai, 1998; Karpiak and Plenz, 2002). We also used comple-mentary network simulations to examine how propagation likethat observed in the cultures would influence information pro-cessing in a simple feedforward network. Using these methods,the present study was conducted to examine two issues: (1) Docortical networks in vitro produce avalanches that comply withphysical theories of critical systems? (2) If cortical networks are inthe critical state, what consequences does this have for informa-tion processing?
Materials and MethodsOrganotypic culture experiments. Organotypic cultures from coronalslices of rat somatosensory cortex were prepared in accordance withNational Institutes of Health guidelines (Plenz and Kitai, 1998), with thecortical slice placed onto the 8 � 8 multielectrode array (interelectrodedistance, 200 �m; electrode diameter, 30 �m; Multichannelsystems, Re-utlingen, Germany) (Egert et al., 1998; Karpiak and Plenz, 2002). Acutecoronal slices were cut at 350 �m thickness and were �1.5 mm deep and�2–3 mm wide. The array covered �50 –70% of the cortical tissue, withthe basal row aligned to the white matter and the upper row extendinginto the supragranular layers (see Fig. 1 A). In three of seven cultures, acoronal striatal and nigral slice (500 �m thickness) were cocultured out-
Received June 26, 2003; revised Oct. 15, 2003; accepted Oct. 17, 2003.We thank Veronica Karpiak and Craig Stewart for preparation of the cultures, Craig Stewart for help with phar-
macological and acute slice experiments, David Greenberg for discussions on the branching parameter, David Ideand Larry Pfeffer for help with the incubator design, and Barry Richmond, Dante Chialvo, Steve Wise, and Chip Gerfenfor their helpful comments on a previous version of this manuscript.
Correspondence should be addressed to Dr. Dietmar Plenz, Unit of Neural Network Physiology, Laboratory ofSystems Neuroscience–National Institute of Mental Health, Building 36, Room 2D-26, 9000 Rockville Pike, Be-thesda, MD 20892-4075. E-mail: [email protected].
J. M. Beggs’ present address: Department of Physics, Biocomplexity Institute, Swain Hall West 169, 727 East ThirdStreet, Indiana University, Bloomington, IN 47405.Copyright © 2003 Society for Neuroscience 0270-6474/03/2311167-11$15.00/0
The Journal of Neuroscience, December 3, 2003 • 23(35):11167–11177 • 11167
side the array (Plenz and Kitai, 1998). These areas do not project tocortex, and no differences in cortical activity were found for single orcombined cortex cultures. Photographs taken at 1–3 d in vitro (DIV) andafter recording sessions confirmed that recording electrodes were locatedin the cortical culture. Most recordings were performed with culturessubmerged in standard culture medium at a flow rate of 1 ml/min.
Acute slice experiments. Coronal sections from adult rat brains (6 – 8weeks) were cut at 350 – 400 �m in chilled artificial CSF (ACSF) contain-ing the following (in mM): 124 NaCl, 0.3 NaH2PO4, 3.5 KCl, 1.2 CaCl2, 1MgSO4, 26.2 NaHCO3, 10 D-glucose, and 50 �M D,L-2-amino-5-phosphonovalerate (APV; Sigma, St. Louis, MO), saturated with 95% O2
and 5% CO2 (310 � 5 mOsm). Slices were stored submerged for 1–2 hrin ACSF without APV at room temperature before recording. For record-ing, slices were gently transferred onto the multielectrode array. Theelectrode array covered mostly supragranular layers of primary motorand somatosensory cortex. Electrode positions were reconstructed usingpictures taken at the end of each recording session (see Fig. 6 A). Sliceswere submerged in ACSF without APV at 35.5 � 0.5°C saturated with95% O2 and 5% CO2 and recordings were performed at a flow rate of 2ml/min.
Pharmacology. To study propagation under reduced inhibition, thenoncompetitive GABAA-receptor antagonist picrotoxin (2 �M; Invitro-gen, Gaithersburg, MD) was bath-applied. Event size distributions werecalculated based on 5 hr spontaneous activity before and during drugapplication and 24 hr after recovery (see below).
In acute slices, spontaneous activity was induced by bath perfusionwith the glutamate-receptor agonist NMDA (6 �M in ACSF; Sigma) incombination with the dopamine D1-receptor agonist (�)-SKF-38393 (5�M in ACSF; Sigma). Preliminary experiments revealed that the combi-nation of both drugs at those concentrations robustly induced synchro-nized local field potentials (LFPs), for an average of �0.4 hr in the acuteslice.
Signal processing. Extracellular signals were continuously sampled at 1kHz, low-pass-filtered at 50 Hz, and binned at �t � 1, 2, 4, 8, or 16 msec.A threshold was used to determine events of interest, and this thresholdwas given by the receiver operating characteristic curve produced by thefiltered data and a Gaussian noise distribution (Gabbiani and Koch,1998). Noise was not significantly different from a Gaussian distribution(Kolmogorov–Smirnov test; p � 0.05), and produced an average thresh-old of �2.86 � 0.23 SD. The filtered voltage traces were searched fortimes at which they crossed this threshold, and it was found that LFPstypically crossed over the threshold for 20 msec before crossing back.During this 20 msec interval of threshold crossing, the LFPs often dis-played a sharp negative peak, indicative of a population spike, that had adistinct point of maximum excursion. Algorithms were used to identifythe time of occurrence of this maximum excursion and to record itsamplitude. The processed data thus contained both a time point and anamplitude value for every LFP that crossed the threshold (see Fig. 1C). Arefractory period of 20 msec was imposed after each maximum to pre-vent counting large excursions more than once. For control, a refractoryperiod of 2 msec, much shorter than 20 msec, was also used.
Cross-correlation functions and contiguity index. Cross-correlationfunctions were calculated from 3 hr (cultures) or 0.4 hr (acute slice) ofdata over a window of �0.2– 0.2 sec at a bin width of 1 msec. The conti-guity index measured the extent to which propagation in cortical net-works was wave-like. The index is given by the fraction of activeelectrodes whose activity was preceded by activity on at least one nearest-neighbor electrode (n � 8 neighbors/electrode except for border elec-trodes). Note that active electrodes in the first time bin of an avalancheare counted as not preceding the nearest-neighbor activity.
Average interevent interval calculation. Traditionally, the interevent in-terval (IEI) has been defined as the interval between events at a singleelectrode. In the sense used in the current paper, the IEI denotes theinterval between LFPs occurring at all electrodes. For example, an LFPmight occur on electrode 1 at time t � 0, and the next LFP recorded by thearray might occur on electrode 24 at time t � 4 msec. In this case, the IEIwould be 4 msec. Thus, the IEI distributions plotted in this report takeinto account the interval between LFPs recorded over all electrodes. Be-cause activity did not generally propagate directly between nearest-
neighbor electrodes, the average IEI (IEIavg) was obtained by calculating theaverage value of the IEI distribution over the time from 0 to Tmax. Tmax wasgiven by the time at which the population cross-correlation functiondropped to a constant, near zero baseline. Tmax ranged between 150 and 200msec in cultures and 50 and 80 msec in acute slices (see Fig. 1E).
Rescaling of arrays. Each electrode array was a square 8 by 8 grid with-out the corners, thus having 60 electrodes. The interelectrode distance(IED) between each electrode and its nearest neighbor was 200 �m. Toexamine how the spatial scale given by the IED influences the power lawdistributions, we performed two types of manipulations to the arraysduring analysis.
First, rescaling the arrays tested whether or not the slope of the powerlaw found to describe event size distributions (see Results) was depen-dent on the IED. Rescaling was accomplished by removing some of theintercalated electrodes from the analysis, while still maintaining a squarearray. This also reduced the number of electrodes considered in the anal-ysis. For example, to create an IED of 400 �m, a regular array of 4 by 4electrodes was chosen from the 8 by 8 array (see Fig. 4D), which resultedin twice the distance between the electrodes from the original array. Thisrescaled array could be fit onto the original array in four ways, althougheach way caused one of the corner electrodes to be missing, leaving only15 electrodes. The data for this rescaled array was obtained from 15electrodes for each of the four ways and averaged. A similar rescaling wasdone to create an IED of 600 �m, leaving only eight electrodes (a 3 by 3array with one corner missing). As before, this rescaling could be done infour possible ways, so the result reported was from an average of the dataobtained from arrays positioned these four ways. Increasing the IEDresulted in a longer IEI for the rescaled arrays (see Fig. 4 A), and data fromthe rescaled arrays were always binned at the nearest integer value to thecorresponding IEI.
Second, reducing the number of electrodes in the arrays tested whetherthe cutoff point in the power law (the point at which the linear portion ofthe graph shows a break; see Results and Figs. 3 A, 4B,D,F) was dependenton the number of electrodes. To explore this issue, we effectively cut thearray into halves and quarters without changing the IED. For example, tocreate an array with 30 electrodes, only electrodes on the left side of thearray would be chosen for analysis. The array was bisected in two ways,producing four half-size arrays (see Fig. 4 F). The results from these fourarrays were averaged to produce the power law for the half-sized array. Ina similar manner, the array could also be divided into quarters, eachcontaining 15 electrodes for analysis. Although quartering could be donein more than four ways, only the four quarters near the corners were usedin this study for creating an average power law.
Branching parameter. The branching parameter � was used to describeactivity propagation in the cortical cultures. By definition, � is the aver-age number of descendants from one ancestor (de Carvalho and Prado,2000) and, intuitively, was defined in our system as the average numberof electrodes activated in the next time bin, given a single electrode beingactive in the current time bin. Mathematically, the average branchingparameter � for the electrode array in the case of one ancestor electrodeis simply given by
� � �d�0
nmax
d � p�d, (1)
where d is the number of electrode descendants, p(d) is the probability ofobserving d descendants, and nmax is the maximal number of active elec-trodes. Note that formula (1) does not describe a probability density, andtheoretically � can take any value �0. Because of refractoriness in activityat single electrodes, � was estimated only from the first and second timebin of an avalanche. Although strictly speaking, � is only defined for oneancestor, we also estimated � when there were multiple ancestors. Underthese conditions, d is given by:
d � round�nd
na� , (2)
where na is the number of electrode ancestors observed in the first timebin, nd is the number of active electrodes in the second time bin of an
11168 • J. Neurosci., December 3, 2003 • 23(35):11167–11177 Beggs and Plenz • Power Laws in Cortical Networks
avalanche, and round is the rounding operation to the nearest integer.The likelihood of observing d descendants was approximated by:
p�d � �avalanches
�na�d
na�� nmax � 1
nmax � na� , (3)
where na�d was the total number of electrode ancestors in all avalancheswhen nd descendants were observed, na was the total number of ances-tors observed in all avalanches, and
� nmax � 1
nmax � na�
was a factor that provided an approximate correction for the reducednumber of electrodes available in the next time bin because of refracto-riness. Note that the branching parameter is not defined for 0 ancestorsand thus does not provide information about the initiation of bursts. Incases in which there was only one ancestor, the formula for � was math-ematically equivalent to (1).
Network simulations. Simulations were used to explore the implica-tions of a critical branching process on information transmission. Feed-forward networks had N processing units per layer and L layers. Binaryunits (on or off) made C randomly assigned connections to units in thenext layer. Each connection had a probability pi of transmitting that wasrandomly chosen, but the sum of probabilities emanating from a unit wasconstrained to be equal to
� � �i�1
C
pi , (4)
where 0 � pi � 1 and 0 � � � C. Note that this formulation allows thebranching parameter � to be adjusted in the network. A unit in the nextlayer became active only if a unit in the previous layer was active and theconnection between them transmitted. A given network type was deter-mined by the choice of N, L, and C. Results from 20 network types arereported: (N: 6, 8, 10, 12, 14; L: 3, 4; C: 2, 3). Ten networks of each typewere constructed, and each was run five times for each value of � (� �0.1–3.0, in increments of 0.1 for 30,000 total simulations). All possiblebinary input patterns (2N) were presented to the input layer as a stimulusset S. Binary patterns appeared in the output layer as a response set R.Information I transmitted through the network was given by: I(S; R) �H( R) � H(R/S), where H( R)was the entropy of the response set, andH(R/S) was the entropy of a response, given a stimulus, calculated over allresponses and all stimuli (Cover and Thomas, 1991).
All values are expressed as means � SD unless stated otherwise.
ResultsThe results are composed of four main sections. First, we derivethe power laws that characterize propagation of spontaneous ac-tivity in mature organotypic cortex cultures. Second, we demon-strate that these laws also describe propagation of spontaneousactivity in acute, mature cortex slices. Third, we demonstrate thatthe spontaneous activity observed indicates that the cortical net-work operates in a critical state. Finally, we describe the outputsof feedforward neural network models that were used to explorethe consequences of the critical state on informationtransmission.
General characteristics of spontaneous activityWe analyzed the propagation of neuronal activity in seven orga-notypic cultures prepared from rat somatosensory cortex andgrown on 60-channel multielectrode arrays (Fig. 1A). After 28 �3 DIV, spontaneous LFPs were recorded continuously from thecortex for at least 10 hr in each culture at a 1 kHz sampling rate.The present analysis is based on a total of 70 hr of recording. Atypical LFP consisted of a negative population spike superim-
posed on a positive envelope (Fig. 1B), as has been describedpreviously (Jimbo and Robinson, 2000). This general LFP shapewas consistent over time at individual electrodes and across elec-trodes (Fig. 1C). Time interval distributions for successive LFPson individual electrodes revealed that LFPs were at least 24 msecapart from each other (calculated with refractory period tref � 2msec), which allowed us to reliably extract LFPs with a refractoryperiod set to tref � 20 msec (Fig. 1D) (see Materials and Meth-ods). On average, 58.9 � 0.4 electrodes per culture were active;i.e., they had negative population spikes that crossed an optimumthreshold as determined by receiver-operating characteristiccurves (see Materials and Methods). The rate of LFPs differedwidely between individual cultures and was on average 58,000 �55,000 LFPs per hour (mean � SD; range, 10,000 –240,000 LFPs/hr). The total voltage produced by each network when expressedas sum of LFP amplitudes was on average �2 � 10 3 mV � 3 �10 3 per hr (n � 7 cultures).
Synchronized bursting separated by many seconds of quies-cence is considered a hallmark of mature cortical networks grownin isolation (Crain, 1966; Calvet, 1974; Gutnick et al., 1989;Maeda et al., 1995; Gopal and Gross, 1996; Kamioka et al., 1996;Plenz and Aertsen, 1996; Corner et al., 2002). In agreement withthese previous reports, LFPs appeared on many electrodes almostsimultaneously when viewed at low temporal resolution, formingsynchronized activity epochs separated by many seconds with noactivity (Fig. 1B). Despite this apparent synchrony, cross-correlation functions suggested a different picture. Within a sin-gle network, cross-correlation functions between pairs of elec-
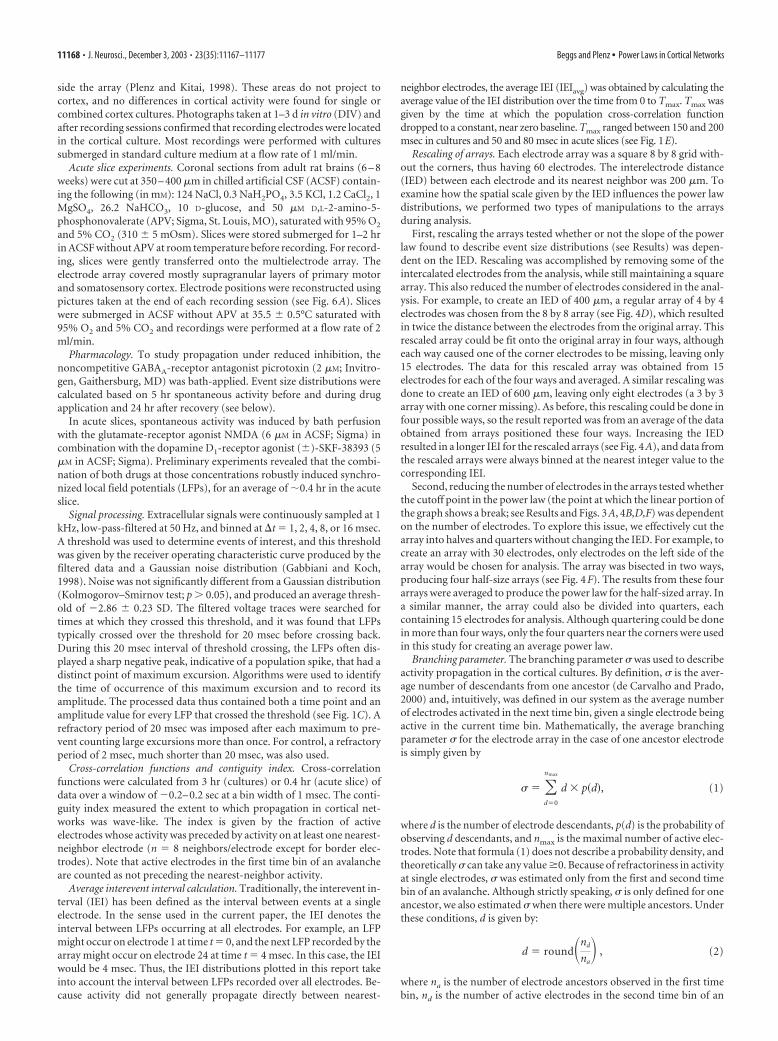
Figure 1. Spontaneous, correlated neuronal activity in organotypic cortex cultures. A, Orga-notypic coronal cortex slice culture on 8 � 8 multielectrode array (IED, 200 �m). WM, Whitematter. B, Spontaneous LFP from 60 electrodes (linear order) with two periods of correlatedactivity. C, Overplot of LFPs from a single electrode (left,�1 min spontaneous activity) and fromall electrodes during one correlated period of activity (right, aligned to negative peaks). Notetypical negative peaks riding on a longer-lasting depolarization. Broken line, �3 SD. D, Succes-sive LFPs on individual electrodes are �20 msec apart in time. Average time interval distribu-tions for successive LFPs on one electrode for four representative cultures (1 hr spontaneousactivity). E, Representative cluster of 59 cross-correlation functions for one electrode in relationto all other electrodes (single culture). F, Population cross-correlogram shows correlation falls tozero within � 100 –200 msec. red, Average; black, individual cultures.
Beggs and Plenz • Power Laws in Cortical Networks J. Neurosci., December 3, 2003 • 23(35):11167–11177 • 11169
trodes were highly variable, but quickly declined within � 100 –200 msec (Fig. 1E), which was found in all networks analyzed(Fig. 1F). The variability in correlation at higher temporal reso-lution across electrodes suggested that “synchronous” eventswere composed of more complex spatiotemporal patterns, forwhich currently no exhaustive description is available. In the fol-lowing paragraph, we will derive such a statistical description ofthis activity at high temporal resolution.
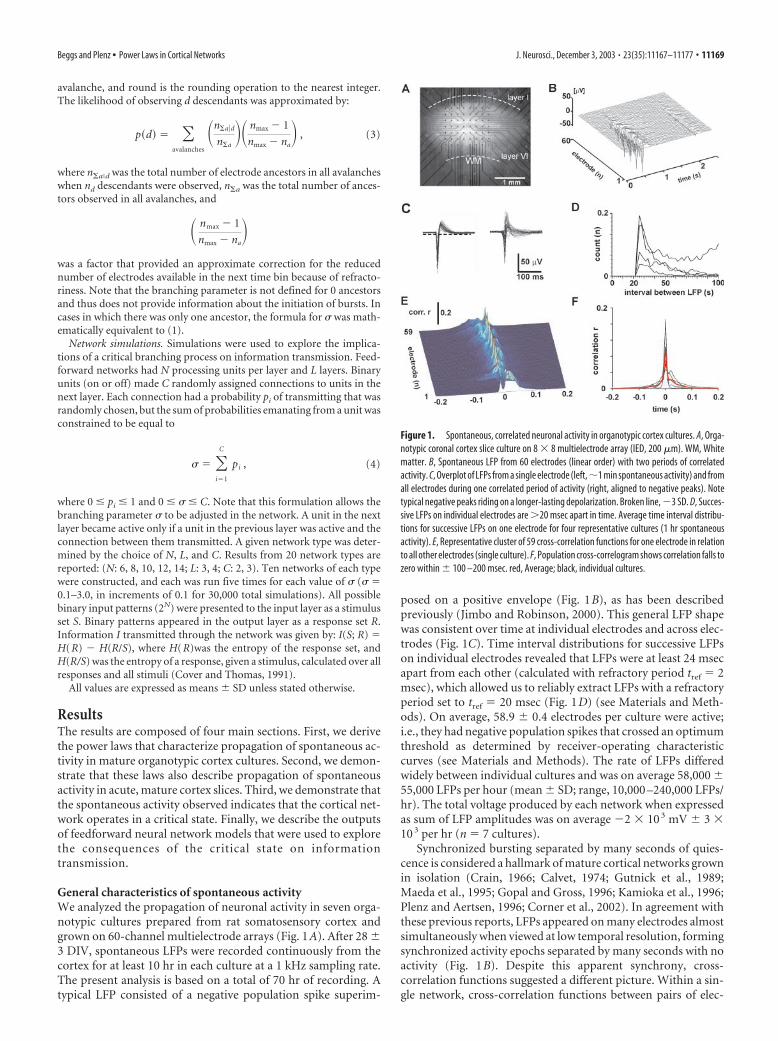
The definition of neuronal avalanchesAs predicted from cross-correlation analysis, when the LFP datawere binned at finer temporal resolution (e.g., bin width �t � 4msec), it became clear that LFPs did not appear on all electrodesat exactly the same time (Fig. 2A). Rather, some LFPs occurredbefore others, forming spatiotemporal patterns on the electrodearray. To begin to characterize these patterns, two terms weredefined. The spatial pattern of active electrodes on the multielec-trode array during one time bin �t was called a frame and asequence of consecutively active frames that was preceded by ablank frame and ended by a blank frame was called an avalanche(Fig. 2A). When activity was classified using this definition, thecortical cultures were found to produce numerous avalanches perhour at various lengths (Fig. 2B). The distribution of avalanchesranged from several thousand avalanches with just one frame to afew dozen avalanches at longer duration and was similar for allbin sizes tested (�t � 1–16). Thus, within the synchronous ep-ochs there existed an entirely different form of activity, ava-lanches of different durations, in which nonsynchronous activitywas spread over space and time.
The fact that LFPs occurred consecutively within an avalanchesuggested that activity initiated at one electrode might spreadlater to other electrodes. Because activity has been reported topropagate successively, but in a wave-like manner in the devel-oping retina (Meister et al., 1991), in slow cortical oscillations(Sanchez-Vives and McCormick, 2000), and in the epileptic cor-tical slice (Chervin et al., 1988), it was of interest to test how thisactivity might differ from a wave-like propagation. An index ofcontiguity (see Materials and Methods) was developed to mea-sure how often activity spread from a given electrode to its nearestneighbors. In a perfect wave, almost 100% of activity would pro-ceed from the nearest neighbors, but in the cortical cultures only39.3 � 8% of the electrodes showed activity that was preceded byactivity from nearest neighbors (bin width �t � 4 msec for allnetworks). Thus, most of the time, LFPs in the cortical networksdid not propagate in a spatially contiguous way.
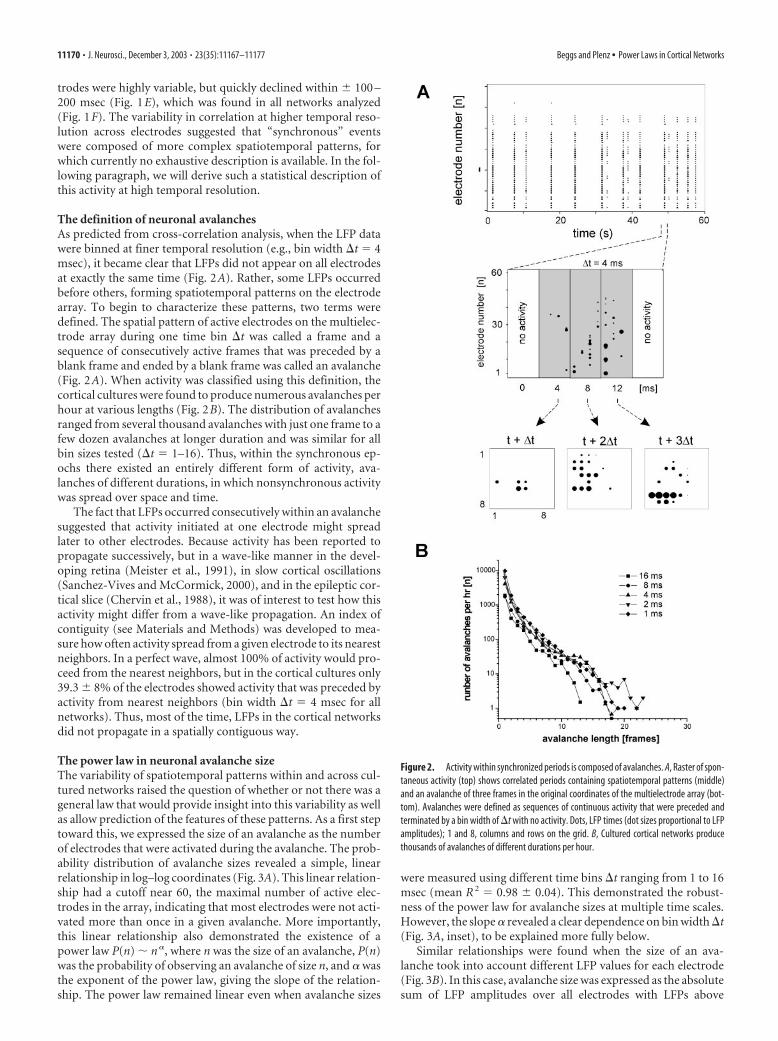
The power law in neuronal avalanche sizeThe variability of spatiotemporal patterns within and across cul-tured networks raised the question of whether or not there was ageneral law that would provide insight into this variability as wellas allow prediction of the features of these patterns. As a first steptoward this, we expressed the size of an avalanche as the numberof electrodes that were activated during the avalanche. The prob-ability distribution of avalanche sizes revealed a simple, linearrelationship in log–log coordinates (Fig. 3A). This linear relation-ship had a cutoff near 60, the maximal number of active elec-trodes in the array, indicating that most electrodes were not acti-vated more than once in a given avalanche. More importantly,this linear relationship also demonstrated the existence of apower law P(n) � n �, where n was the size of an avalanche, P(n)was the probability of observing an avalanche of size n, and � wasthe exponent of the power law, giving the slope of the relation-ship. The power law remained linear even when avalanche sizes
were measured using different time bins �t ranging from 1 to 16msec (mean R 2 � 0.98 � 0.04). This demonstrated the robust-ness of the power law for avalanche sizes at multiple time scales.However, the slope � revealed a clear dependence on bin width �t(Fig. 3A, inset), to be explained more fully below.
Similar relationships were found when the size of an ava-lanche took into account different LFP values for each electrode(Fig. 3B). In this case, avalanche size was expressed as the absolutesum of LFP amplitudes over all electrodes with LFPs above
Figure 2. Activity within synchronized periods is composed of avalanches. A, Raster of spon-taneous activity (top) shows correlated periods containing spatiotemporal patterns (middle)and an avalanche of three frames in the original coordinates of the multielectrode array (bot-tom). Avalanches were defined as sequences of continuous activity that were preceded andterminated by a bin width of �t with no activity. Dots, LFP times (dot sizes proportional to LFPamplitudes); 1 and 8, columns and rows on the grid. B, Cultured cortical networks producethousands of avalanches of different durations per hour.
11170 • J. Neurosci., December 3, 2003 • 23(35):11167–11177 Beggs and Plenz • Power Laws in Cortical Networks
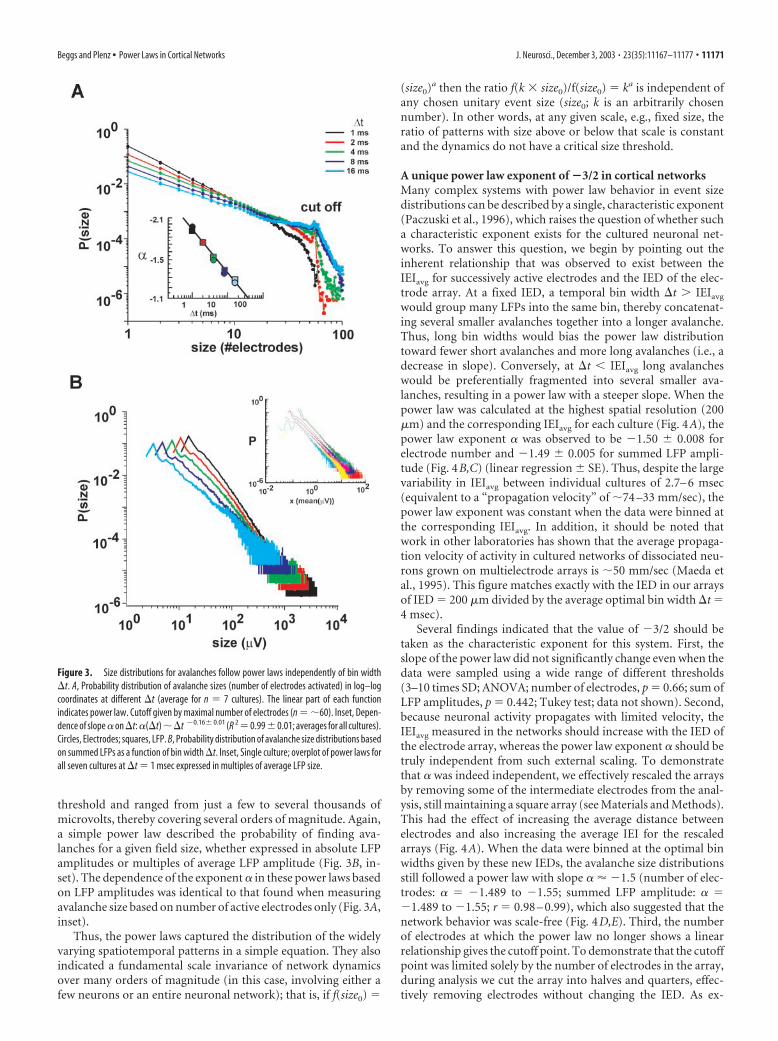
threshold and ranged from just a few to several thousands ofmicrovolts, thereby covering several orders of magnitude. Again,a simple power law described the probability of finding ava-lanches for a given field size, whether expressed in absolute LFPamplitudes or multiples of average LFP amplitude (Fig. 3B, in-set). The dependence of the exponent � in these power laws basedon LFP amplitudes was identical to that found when measuringavalanche size based on number of active electrodes only (Fig. 3A,inset).
Thus, the power laws captured the distribution of the widelyvarying spatiotemporal patterns in a simple equation. They alsoindicated a fundamental scale invariance of network dynamicsover many orders of magnitude (in this case, involving either afew neurons or an entire neuronal network); that is, if f(size0) �
(size0)a then the ratio f(k � size0)/f(size0) � ka is independent ofany chosen unitary event size (size0; k is an arbitrarily chosennumber). In other words, at any given scale, e.g., fixed size, theratio of patterns with size above or below that scale is constantand the dynamics do not have a critical size threshold.
A unique power law exponent of �3/2 in cortical networksMany complex systems with power law behavior in event sizedistributions can be described by a single, characteristic exponent(Paczuski et al., 1996), which raises the question of whether sucha characteristic exponent exists for the cultured neuronal net-works. To answer this question, we begin by pointing out theinherent relationship that was observed to exist between theIEIavg for successively active electrodes and the IED of the elec-trode array. At a fixed IED, a temporal bin width �t � IEIavg
would group many LFPs into the same bin, thereby concatenat-ing several smaller avalanches together into a longer avalanche.Thus, long bin widths would bias the power law distributiontoward fewer short avalanches and more long avalanches (i.e., adecrease in slope). Conversely, at �t � IEIavg long avalancheswould be preferentially fragmented into several smaller ava-lanches, resulting in a power law with a steeper slope. When thepower law was calculated at the highest spatial resolution (200�m) and the corresponding IEIavg for each culture (Fig. 4A), thepower law exponent � was observed to be �1.50 � 0.008 forelectrode number and �1.49 � 0.005 for summed LFP ampli-tude (Fig. 4B,C) (linear regression � SE). Thus, despite the largevariability in IEIavg between individual cultures of 2.7– 6 msec(equivalent to a “propagation velocity” of �74 –33 mm/sec), thepower law exponent was constant when the data were binned atthe corresponding IEIavg. In addition, it should be noted thatwork in other laboratories has shown that the average propaga-tion velocity of activity in cultured networks of dissociated neu-rons grown on multielectrode arrays is �50 mm/sec (Maeda etal., 1995). This figure matches exactly with the IED in our arraysof IED � 200 �m divided by the average optimal bin width �t �4 msec).
Several findings indicated that the value of �3/2 should betaken as the characteristic exponent for this system. First, theslope of the power law did not significantly change even when thedata were sampled using a wide range of different thresholds(3–10 times SD; ANOVA; number of electrodes, p � 0.66; sum ofLFP amplitudes, p � 0.442; Tukey test; data not shown). Second,because neuronal activity propagates with limited velocity, theIEIavg measured in the networks should increase with the IED ofthe electrode array, whereas the power law exponent � should betruly independent from such external scaling. To demonstratethat � was indeed independent, we effectively rescaled the arraysby removing some of the intermediate electrodes from the anal-ysis, still maintaining a square array (see Materials and Methods).This had the effect of increasing the average distance betweenelectrodes and also increasing the average IEI for the rescaledarrays (Fig. 4A). When the data were binned at the optimal binwidths given by these new IEDs, the avalanche size distributionsstill followed a power law with slope � �1.5 (number of elec-trodes: � � �1.489 to �1.55; summed LFP amplitude: � ��1.489 to �1.55; r � 0.98 – 0.99), which also suggested that thenetwork behavior was scale-free (Fig. 4D,E). Third, the numberof electrodes at which the power law no longer shows a linearrelationship gives the cutoff point. To demonstrate that the cutoffpoint was limited solely by the number of electrodes in the array,during analysis we cut the array into halves and quarters, effec-tively removing electrodes without changing the IED. As ex-
Figure 3. Size distributions for avalanches follow power laws independently of bin width�t. A, Probability distribution of avalanche sizes (number of electrodes activated) in log–logcoordinates at different �t (average for n � 7 cultures). The linear part of each functionindicates power law. Cutoff given by maximal number of electrodes (n � �60). Inset, Depen-dence of slope � on�t: �(�t)��t �0.16� 0.01 (R 2 �0.99�0.01; averages for all cultures).Circles, Electrodes; squares, LFP. B, Probability distribution of avalanche size distributions basedon summed LFPs as a function of bin width �t. Inset, Single culture; overplot of power laws forall seven cultures at �t � 1 msec expressed in multiples of average LFP size.
Beggs and Plenz • Power Laws in Cortical Networks J. Neurosci., December 3, 2003 • 23(35):11167–11177 • 11171
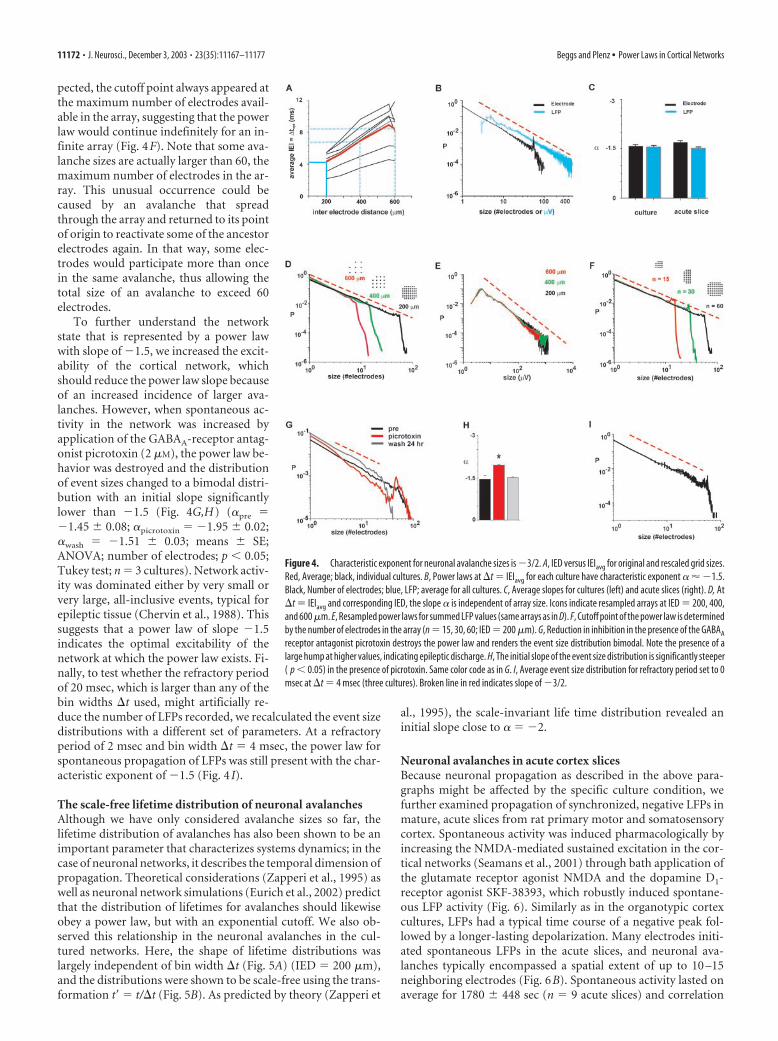
pected, the cutoff point always appeared atthe maximum number of electrodes avail-able in the array, suggesting that the powerlaw would continue indefinitely for an in-finite array (Fig. 4F). Note that some ava-lanche sizes are actually larger than 60, themaximum number of electrodes in the ar-ray. This unusual occurrence could becaused by an avalanche that spreadthrough the array and returned to its pointof origin to reactivate some of the ancestorelectrodes again. In that way, some elec-trodes would participate more than oncein the same avalanche, thus allowing thetotal size of an avalanche to exceed 60electrodes.
To further understand the networkstate that is represented by a power lawwith slope of �1.5, we increased the excit-ability of the cortical network, whichshould reduce the power law slope becauseof an increased incidence of larger ava-lanches. However, when spontaneous ac-tivity in the network was increased byapplication of the GABAA-receptor antag-onist picrotoxin (2 �M), the power law be-havior was destroyed and the distributionof event sizes changed to a bimodal distri-bution with an initial slope significantlylower than �1.5 (Fig. 4G,H) (�pre ��1.45 � 0.08; �picrotoxin � �1.95 � 0.02;�wash � �1.51 � 0.03; means � SE;ANOVA; number of electrodes; p � 0.05;Tukey test; n � 3 cultures). Network activ-ity was dominated either by very small orvery large, all-inclusive events, typical forepileptic tissue (Chervin et al., 1988). Thissuggests that a power law of slope �1.5indicates the optimal excitability of thenetwork at which the power law exists. Fi-nally, to test whether the refractory periodof 20 msec, which is larger than any of thebin widths �t used, might artificially re-duce the number of LFPs recorded, we recalculated the event sizedistributions with a different set of parameters. At a refractoryperiod of 2 msec and bin width �t � 4 msec, the power law forspontaneous propagation of LFPs was still present with the char-acteristic exponent of �1.5 (Fig. 4 I).
The scale-free lifetime distribution of neuronal avalanchesAlthough we have only considered avalanche sizes so far, thelifetime distribution of avalanches has also been shown to be animportant parameter that characterizes systems dynamics; in thecase of neuronal networks, it describes the temporal dimension ofpropagation. Theoretical considerations (Zapperi et al., 1995) aswell as neuronal network simulations (Eurich et al., 2002) predictthat the distribution of lifetimes for avalanches should likewiseobey a power law, but with an exponential cutoff. We also ob-served this relationship in the neuronal avalanches in the cul-tured networks. Here, the shape of lifetime distributions waslargely independent of bin width �t (Fig. 5A) (IED � 200 �m),and the distributions were shown to be scale-free using the trans-formation t� � t/�t (Fig. 5B). As predicted by theory (Zapperi et
al., 1995), the scale-invariant life time distribution revealed aninitial slope close to � � �2.
Neuronal avalanches in acute cortex slicesBecause neuronal propagation as described in the above para-graphs might be affected by the specific culture condition, wefurther examined propagation of synchronized, negative LFPs inmature, acute slices from rat primary motor and somatosensorycortex. Spontaneous activity was induced pharmacologically byincreasing the NMDA-mediated sustained excitation in the cor-tical networks (Seamans et al., 2001) through bath application ofthe glutamate receptor agonist NMDA and the dopamine D1-receptor agonist SKF-38393, which robustly induced spontane-ous LFP activity (Fig. 6). Similarly as in the organotypic cortexcultures, LFPs had a typical time course of a negative peak fol-lowed by a longer-lasting depolarization. Many electrodes initi-ated spontaneous LFPs in the acute slices, and neuronal ava-lanches typically encompassed a spatial extent of up to 10 –15neighboring electrodes (Fig. 6B). Spontaneous activity lasted onaverage for 1780 � 448 sec (n � 9 acute slices) and correlation
Figure 4. Characteristic exponent for neuronal avalanche sizes is �3/2. A, IED versus IEIavg for original and rescaled grid sizes.Red, Average; black, individual cultures. B, Power laws at �t � IEIavg for each culture have characteristic exponent � �1.5.Black, Number of electrodes; blue, LFP; average for all cultures. C, Average slopes for cultures (left) and acute slices (right). D, At�t � IEIavg and corresponding IED, the slope � is independent of array size. Icons indicate resampled arrays at IED � 200, 400,and 600 �m. E, Resampled power laws for summed LFP values (same arrays as in D). F, Cutoff point of the power law is determinedby the number of electrodes in the array (n � 15, 30, 60; IED � 200 �m). G, Reduction in inhibition in the presence of the GABAA
receptor antagonist picrotoxin destroys the power law and renders the event size distribution bimodal. Note the presence of alarge hump at higher values, indicating epileptic discharge. H, The initial slope of the event size distribution is significantly steeper( p � 0.05) in the presence of picrotoxin. Same color code as in G. I, Average event size distribution for refractory period set to 0msec at �t � 4 msec (three cultures). Broken line in red indicates slope of �3/2.
11172 • J. Neurosci., December 3, 2003 • 23(35):11167–11177 Beggs and Plenz • Power Laws in Cortical Networks
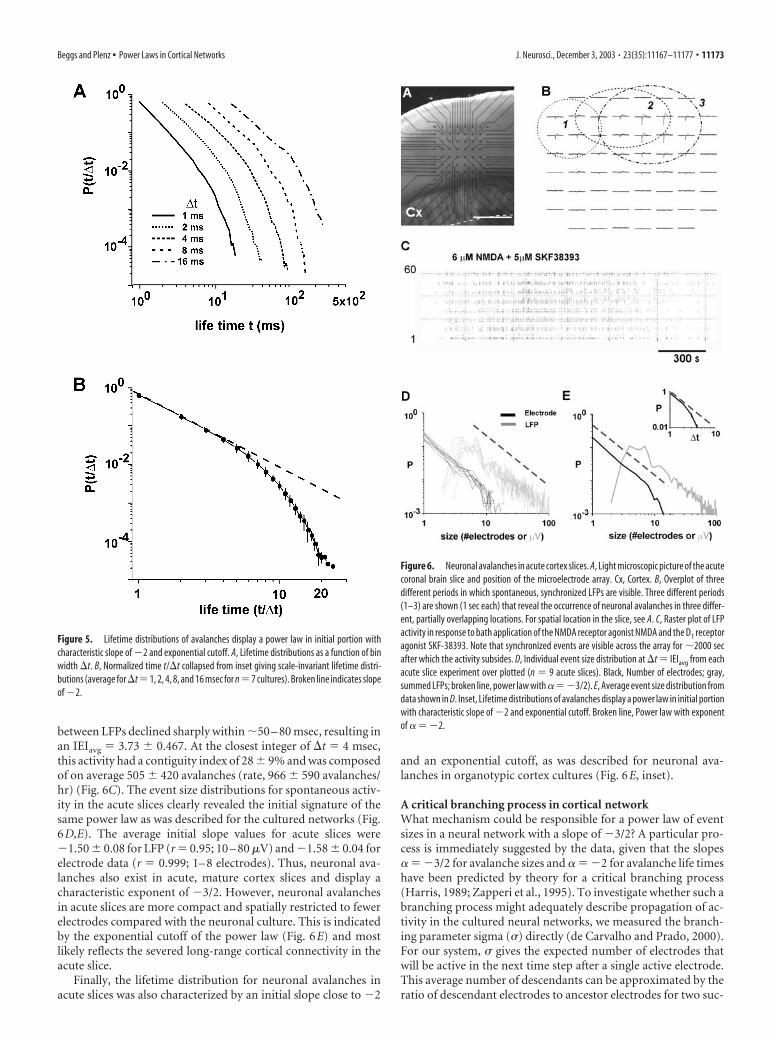
between LFPs declined sharply within �50 – 80 msec, resulting inan IEIavg � 3.73 � 0.467. At the closest integer of �t � 4 msec,this activity had a contiguity index of 28 � 9% and was composedof on average 505 � 420 avalanches (rate, 966 � 590 avalanches/hr) (Fig. 6C). The event size distributions for spontaneous activ-ity in the acute slices clearly revealed the initial signature of thesame power law as was described for the cultured networks (Fig.6D,E). The average initial slope values for acute slices were�1.50 � 0.08 for LFP (r � 0.95; 10 – 80 �V) and �1.58 � 0.04 forelectrode data (r � 0.999; 1– 8 electrodes). Thus, neuronal ava-lanches also exist in acute, mature cortex slices and display acharacteristic exponent of �3/2. However, neuronal avalanchesin acute slices are more compact and spatially restricted to fewerelectrodes compared with the neuronal culture. This is indicatedby the exponential cutoff of the power law (Fig. 6E) and mostlikely reflects the severed long-range cortical connectivity in theacute slice.
Finally, the lifetime distribution for neuronal avalanches inacute slices was also characterized by an initial slope close to �2
and an exponential cutoff, as was described for neuronal ava-lanches in organotypic cortex cultures (Fig. 6E, inset).
A critical branching process in cortical networkWhat mechanism could be responsible for a power law of eventsizes in a neural network with a slope of �3/2? A particular pro-cess is immediately suggested by the data, given that the slopes� � �3/2 for avalanche sizes and � � �2 for avalanche life timeshave been predicted by theory for a critical branching process(Harris, 1989; Zapperi et al., 1995). To investigate whether such abranching process might adequately describe propagation of ac-tivity in the cultured neural networks, we measured the branch-ing parameter sigma (�) directly (de Carvalho and Prado, 2000).For our system, � gives the expected number of electrodes thatwill be active in the next time step after a single active electrode.This average number of descendants can be approximated by theratio of descendant electrodes to ancestor electrodes for two suc-
Figure 5. Lifetime distributions of avalanches display a power law in initial portion withcharacteristic slope of �2 and exponential cutoff. A, Lifetime distributions as a function of binwidth �t. B, Normalized time t/�t collapsed from inset giving scale-invariant lifetime distri-butions (average for�t �1, 2, 4, 8, and 16 msec for n �7 cultures). Broken line indicates slopeof �2.
Figure 6. Neuronal avalanches in acute cortex slices. A, Light microscopic picture of the acutecoronal brain slice and position of the microelectrode array. Cx, Cortex. B, Overplot of threedifferent periods in which spontaneous, synchronized LFPs are visible. Three different periods(1–3) are shown (1 sec each) that reveal the occurrence of neuronal avalanches in three differ-ent, partially overlapping locations. For spatial location in the slice, see A. C, Raster plot of LFPactivity in response to bath application of the NMDA receptor agonist NMDA and the D1 receptoragonist SKF-38393. Note that synchronized events are visible across the array for �2000 secafter which the activity subsides. D, Individual event size distribution at �t � IEIavg from eachacute slice experiment over plotted (n � 9 acute slices). Black, Number of electrodes; gray,summed LFPs; broken line, power law with ���3/2). E, Average event size distribution fromdata shown in D. Inset, Lifetime distributions of avalanches display a power law in initial portionwith characteristic slope of �2 and exponential cutoff. Broken line, Power law with exponentof � � �2.
Beggs and Plenz • Power Laws in Cortical Networks J. Neurosci., December 3, 2003 • 23(35):11167–11177 • 11173
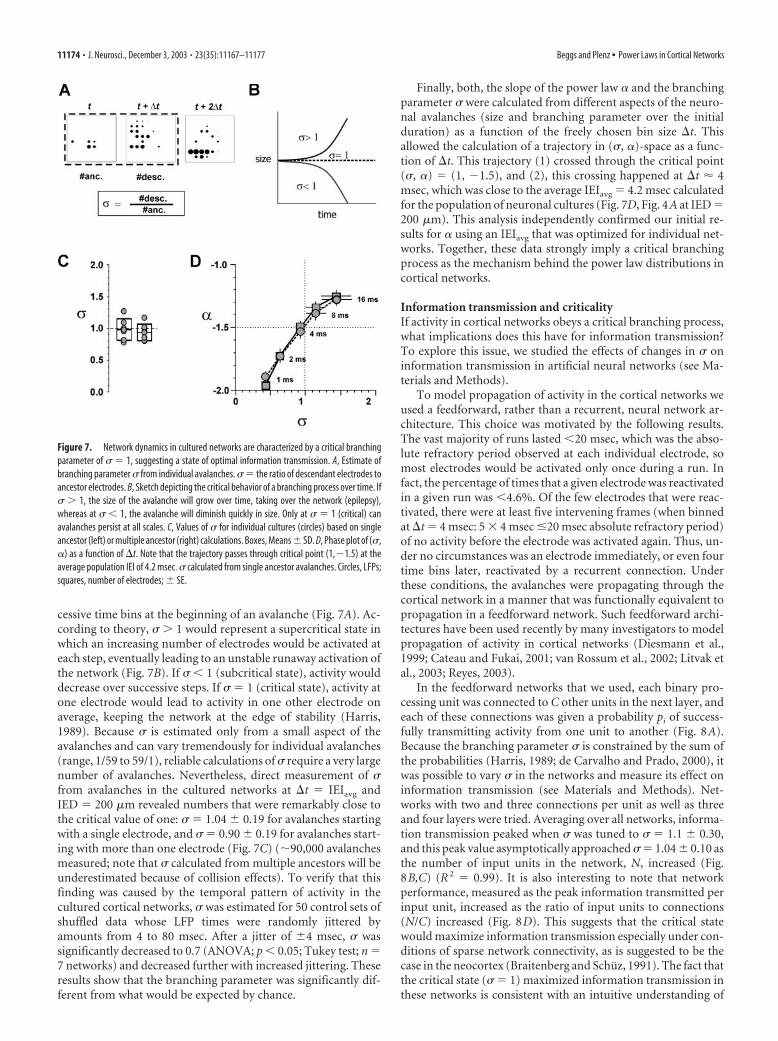
cessive time bins at the beginning of an avalanche (Fig. 7A). Ac-cording to theory, � � 1 would represent a supercritical state inwhich an increasing number of electrodes would be activated ateach step, eventually leading to an unstable runaway activation ofthe network (Fig. 7B). If � � 1 (subcritical state), activity woulddecrease over successive steps. If � � 1 (critical state), activity atone electrode would lead to activity in one other electrode onaverage, keeping the network at the edge of stability (Harris,1989). Because � is estimated only from a small aspect of theavalanches and can vary tremendously for individual avalanches(range, 1/59 to 59/1), reliable calculations of � require a very largenumber of avalanches. Nevertheless, direct measurement of �from avalanches in the cultured networks at �t � IEIavg andIED � 200 �m revealed numbers that were remarkably close tothe critical value of one: � � 1.04 � 0.19 for avalanches startingwith a single electrode, and � � 0.90 � 0.19 for avalanches start-ing with more than one electrode (Fig. 7C) (�90,000 avalanchesmeasured; note that � calculated from multiple ancestors will beunderestimated because of collision effects). To verify that thisfinding was caused by the temporal pattern of activity in thecultured cortical networks, � was estimated for 50 control sets ofshuffled data whose LFP times were randomly jittered byamounts from 4 to 80 msec. After a jitter of �4 msec, � wassignificantly decreased to 0.7 (ANOVA; p � 0.05; Tukey test; n �7 networks) and decreased further with increased jittering. Theseresults show that the branching parameter was significantly dif-ferent from what would be expected by chance.
Finally, both, the slope of the power law � and the branchingparameter � were calculated from different aspects of the neuro-nal avalanches (size and branching parameter over the initialduration) as a function of the freely chosen bin size �t. Thisallowed the calculation of a trajectory in (�, �)-space as a func-tion of �t. This trajectory (1) crossed through the critical point(�, �) � (1, �1.5), and (2), this crossing happened at �t 4msec, which was close to the average IEIavg � 4.2 msec calculatedfor the population of neuronal cultures (Fig. 7D, Fig. 4A at IED �200 �m). This analysis independently confirmed our initial re-sults for � using an IEIavg that was optimized for individual net-works. Together, these data strongly imply a critical branchingprocess as the mechanism behind the power law distributions incortical networks.
Information transmission and criticalityIf activity in cortical networks obeys a critical branching process,what implications does this have for information transmission?To explore this issue, we studied the effects of changes in � oninformation transmission in artificial neural networks (see Ma-terials and Methods).
To model propagation of activity in the cortical networks weused a feedforward, rather than a recurrent, neural network ar-chitecture. This choice was motivated by the following results.The vast majority of runs lasted �20 msec, which was the abso-lute refractory period observed at each individual electrode, somost electrodes would be activated only once during a run. Infact, the percentage of times that a given electrode was reactivatedin a given run was �4.6%. Of the few electrodes that were reac-tivated, there were at least five intervening frames (when binnedat �t � 4 msec: 5 � 4 msec �20 msec absolute refractory period)of no activity before the electrode was activated again. Thus, un-der no circumstances was an electrode immediately, or even fourtime bins later, reactivated by a recurrent connection. Underthese conditions, the avalanches were propagating through thecortical network in a manner that was functionally equivalent topropagation in a feedforward network. Such feedforward archi-tectures have been used recently by many investigators to modelpropagation of activity in cortical networks (Diesmann et al.,1999; Cateau and Fukai, 2001; van Rossum et al., 2002; Litvak etal., 2003; Reyes, 2003).
In the feedforward networks that we used, each binary pro-cessing unit was connected to C other units in the next layer, andeach of these connections was given a probability pi of success-fully transmitting activity from one unit to another (Fig. 8A).Because the branching parameter � is constrained by the sum ofthe probabilities (Harris, 1989; de Carvalho and Prado, 2000), itwas possible to vary � in the networks and measure its effect oninformation transmission (see Materials and Methods). Net-works with two and three connections per unit as well as threeand four layers were tried. Averaging over all networks, informa-tion transmission peaked when � was tuned to � � 1.1 � 0.30,and this peak value asymptotically approached � � 1.04 � 0.10 asthe number of input units in the network, N, increased (Fig.8B,C) (R 2 � 0.99). It is also interesting to note that networkperformance, measured as the peak information transmitted perinput unit, increased as the ratio of input units to connections(N/C) increased (Fig. 8D). This suggests that the critical statewould maximize information transmission especially under con-ditions of sparse network connectivity, as is suggested to be thecase in the neocortex (Braitenberg and Schuz, 1991). The fact thatthe critical state (� � 1) maximized information transmission inthese networks is consistent with an intuitive understanding of
Figure 7. Network dynamics in cultured networks are characterized by a critical branchingparameter of � � 1, suggesting a state of optimal information transmission. A, Estimate ofbranching parameter � from individual avalanches. � � the ratio of descendant electrodes toancestor electrodes. B, Sketch depicting the critical behavior of a branching process over time. If� � 1, the size of the avalanche will grow over time, taking over the network (epilepsy),whereas at � � 1, the avalanche will diminish quickly in size. Only at � � 1 (critical) canavalanches persist at all scales. C, Values of � for individual cultures (circles) based on singleancestor (left) or multiple ancestor (right) calculations. Boxes, Means � SD. D, Phase plot of (�,�) as a function of �t. Note that the trajectory passes through critical point (1,�1.5) at theaverage population IEI of 4.2 msec. � calculated from single ancestor avalanches. Circles, LFPs;squares, number of electrodes; � SE.
11174 • J. Neurosci., December 3, 2003 • 23(35):11167–11177 Beggs and Plenz • Power Laws in Cortical Networks
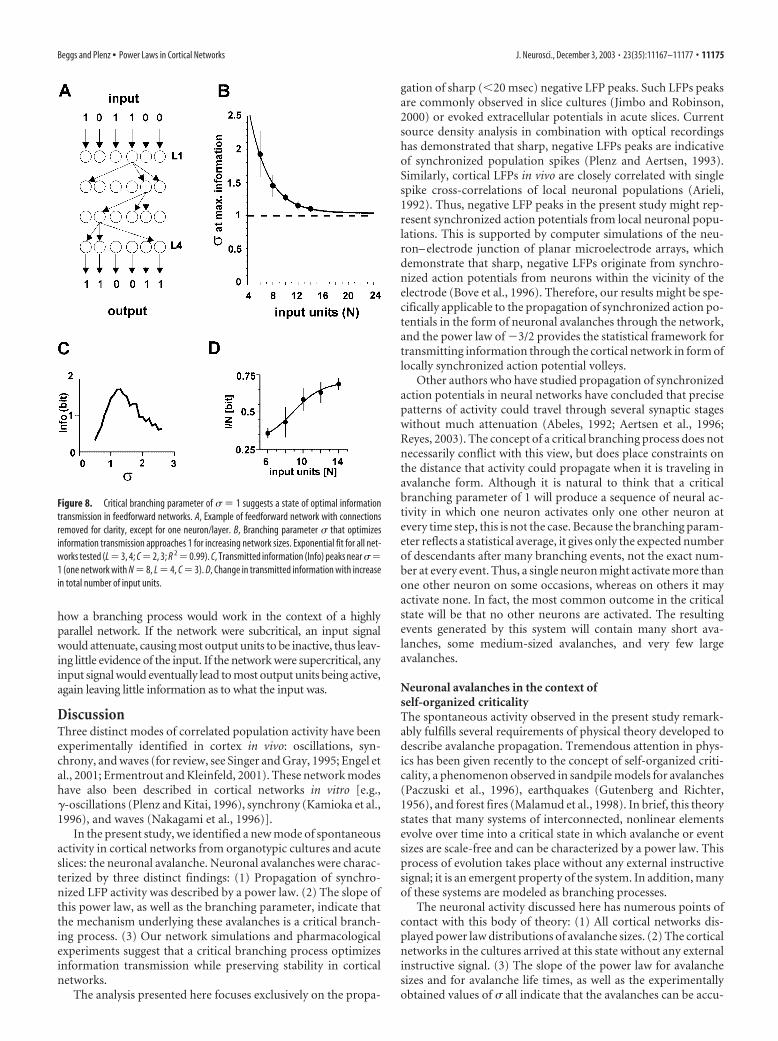
how a branching process would work in the context of a highlyparallel network. If the network were subcritical, an input signalwould attenuate, causing most output units to be inactive, thus leav-ing little evidence of the input. If the network were supercritical, anyinput signal would eventually lead to most output units being active,again leaving little information as to what the input was.
DiscussionThree distinct modes of correlated population activity have beenexperimentally identified in cortex in vivo: oscillations, syn-chrony, and waves (for review, see Singer and Gray, 1995; Engel etal., 2001; Ermentrout and Kleinfeld, 2001). These network modeshave also been described in cortical networks in vitro [e.g.,-oscillations (Plenz and Kitai, 1996), synchrony (Kamioka et al.,1996), and waves (Nakagami et al., 1996)].
In the present study, we identified a new mode of spontaneousactivity in cortical networks from organotypic cultures and acuteslices: the neuronal avalanche. Neuronal avalanches were charac-terized by three distinct findings: (1) Propagation of synchro-nized LFP activity was described by a power law. (2) The slope ofthis power law, as well as the branching parameter, indicate thatthe mechanism underlying these avalanches is a critical branch-ing process. (3) Our network simulations and pharmacologicalexperiments suggest that a critical branching process optimizesinformation transmission while preserving stability in corticalnetworks.
The analysis presented here focuses exclusively on the propa-
gation of sharp (�20 msec) negative LFP peaks. Such LFPs peaksare commonly observed in slice cultures (Jimbo and Robinson,2000) or evoked extracellular potentials in acute slices. Currentsource density analysis in combination with optical recordingshas demonstrated that sharp, negative LFPs peaks are indicativeof synchronized population spikes (Plenz and Aertsen, 1993).Similarly, cortical LFPs in vivo are closely correlated with singlespike cross-correlations of local neuronal populations (Arieli,1992). Thus, negative LFP peaks in the present study might rep-resent synchronized action potentials from local neuronal popu-lations. This is supported by computer simulations of the neu-ron– electrode junction of planar microelectrode arrays, whichdemonstrate that sharp, negative LFPs originate from synchro-nized action potentials from neurons within the vicinity of theelectrode (Bove et al., 1996). Therefore, our results might be spe-cifically applicable to the propagation of synchronized action po-tentials in the form of neuronal avalanches through the network,and the power law of �3/2 provides the statistical framework fortransmitting information through the cortical network in form oflocally synchronized action potential volleys.
Other authors who have studied propagation of synchronizedaction potentials in neural networks have concluded that precisepatterns of activity could travel through several synaptic stageswithout much attenuation (Abeles, 1992; Aertsen et al., 1996;Reyes, 2003). The concept of a critical branching process does notnecessarily conflict with this view, but does place constraints onthe distance that activity could propagate when it is traveling inavalanche form. Although it is natural to think that a criticalbranching parameter of 1 will produce a sequence of neural ac-tivity in which one neuron activates only one other neuron atevery time step, this is not the case. Because the branching param-eter reflects a statistical average, it gives only the expected numberof descendants after many branching events, not the exact num-ber at every event. Thus, a single neuron might activate more thanone other neuron on some occasions, whereas on others it mayactivate none. In fact, the most common outcome in the criticalstate will be that no other neurons are activated. The resultingevents generated by this system will contain many short ava-lanches, some medium-sized avalanches, and very few largeavalanches.
Neuronal avalanches in the context ofself-organized criticalityThe spontaneous activity observed in the present study remark-ably fulfills several requirements of physical theory developed todescribe avalanche propagation. Tremendous attention in phys-ics has been given recently to the concept of self-organized criti-cality, a phenomenon observed in sandpile models for avalanches(Paczuski et al., 1996), earthquakes (Gutenberg and Richter,1956), and forest fires (Malamud et al., 1998). In brief, this theorystates that many systems of interconnected, nonlinear elementsevolve over time into a critical state in which avalanche or eventsizes are scale-free and can be characterized by a power law. Thisprocess of evolution takes place without any external instructivesignal; it is an emergent property of the system. In addition, manyof these systems are modeled as branching processes.
The neuronal activity discussed here has numerous points ofcontact with this body of theory: (1) All cortical networks dis-played power law distributions of avalanche sizes. (2) The corticalnetworks in the cultures arrived at this state without any externalinstructive signal. (3) The slope of the power law for avalanchesizes and for avalanche life times, as well as the experimentallyobtained values of � all indicate that the avalanches can be accu-
Figure 8. Critical branching parameter of � � 1 suggests a state of optimal informationtransmission in feedforward networks. A, Example of feedforward network with connectionsremoved for clarity, except for one neuron/layer. B, Branching parameter � that optimizesinformation transmission approaches 1 for increasing network sizes. Exponential fit for all net-works tested (L � 3, 4; C � 2, 3; R 2 � 0.99). C, Transmitted information (Info) peaks near ��1 (one network with N � 8, L � 4, C � 3). D, Change in transmitted information with increasein total number of input units.
Beggs and Plenz • Power Laws in Cortical Networks J. Neurosci., December 3, 2003 • 23(35):11167–11177 • 11175
rately modeled as a critical branching process. For these reasons,the activity observed in the cortical networks should be consid-ered as neuronal avalanches.
Neuronal avalanches as a new mode of network activityAlthough some power law statistics have been observed before inthe temporal domain of neuronal activity [e.g., time series of ionchannel fluctuations (Toib et al., 1998), transmitter secretion(Lowen et al., 1997), interevent times of neuronal bursts (Segev etal., 2002), and EEG time series in humans (Linkenkaer-Hansen etal., 2001; Worrell et al., 2002)] our results go beyond the phe-nomenological description of a power law only. We provide twoindependent approaches to understanding neuronal propagationin cortical networks (unique exponent of �3/2 and criticalbranching parameter) that lead to a statistical description of neu-ronal propagation that can be viewed in the framework of infor-mation processing. To our knowledge, no previous evidence hasbeen presented for the existence of a critical branching processoperating in the spatiotemporal dynamics of a living neuralnetwork.
The power law in the present study basically says that thenumber of avalanches observed in the data scales with the size ofthe avalanche, raised to the �1.5 power. This allows for a predic-tion of very large avalanches. They are a natural consequence ofthe local rule for optimized propagation, and are expected tooccur even in normal (i.e., nonepileptic) networks, and are notparticularly rare. For example, in a network with �10,000 ava-lanches/hr that engage just one electrode, at least 21 avalancheswill occur every hour that will encompass exactly all 60 elec-trodes. Thus, on average, activity on every electrode will be cor-related with every other electrode in the network at least onceevery 3 min.
The neuronal avalanches described here are profoundly dif-ferent from previously observed modes of network operation. Asshown by the correlograms, activity in the cortical networks wasnot periodic or oscillatory within the duration of maximal ava-lanche lifetimes. In addition, the contiguity index revealed thatactivity at one electrode most often skipped over the nearestneighbors, indicating that propagation was not wave-like. Fi-nally, although the spontaneous activity did display notable syn-chrony at relatively long time scales, the avalanches that we de-scribe here actually occurred within such synchronous epochs ata much shorter time scale (�100 msec). At this shorter time scale,the avalanches themselves did not display synchrony, regardlessof the threshold level, IED, or number of electrodes used to ob-tain the data. These are compelling reasons for neuronal ava-lanches to be considered a new mode of network activity.
Features of the critical stateIt should be noted that the branching parameter used to charac-terize the critical state is a statistical measure and does not sayanything about the specific biological processes that could pro-duce a particular value of �. There are several mechanisms oper-ative in cortical networks that are likely to influence �: the degreeof fan-in or fan-out of excitatory connections, the degree offan-in or fan-out of inhibitory connections, the ratio of inhibi-tory synaptic drive to excitatory drive, the timing of inhibitoryresponses relative to excitatory responses, and the amount ofadaptation seen in both excitatory and inhibitory neurons, toname a few. To clearly distinguish the specific role each of thesemechanisms would play in the branching process will be the sub-ject of future experiments.
Previous theoretical work has discussed the importance of a
balance between excitation and inhibition in network dynamics(Van Vreeswijk and Sompolinsky, 1996; Shadlen and Newsome,1998). This balance has been implicated in proportional amplifi-cation in cortical networks (Douglas et al., 1995) as well as in themaintenance of cortical up states (Shu et al., 2003). Here, weextend the idea of balance by using the branching parameter, aconcept that allows us to explore information transmission at thenetwork level. Although a branching parameter well below unitywould confer stability on a network, the simulations suggest thatthis stability would come at the rather severe price of greatlyreduced information transmission. In contrast, a branching pa-rameter hovering near unity would optimize information trans-mission, but at the risk of losing stability every time the networkbecame supercritical. Although these neural network simulationsare vastly oversimplified representations of the dynamics thatoccur in cortical networks in vivo, they may nonetheless offersome insight as to why the cerebral cortex is so often at risk fordeveloping epilepsy. In fact, our experimental results demon-strate that removal of inhibition to increase propagation in theneuronal network to obtain a power law with slope � � �1.5results in epileptic activity. The competing demands of stabilityand information transmission may both be satisfied in a networkwhose branching parameter is at or slightly below the criticalvalue of 1. Thus, calculating the power law exponent and/orbranching parameter might offer quantitative means to evaluatethe efficacy of cortical networks to transmit information.
ReferencesAbeles M (1992) Corticonics. New York: Cambridge UP.Aertsen A, Diesmann M, Gewaltig MO (1996) Propagation of synchronous
spiking activity in feedforward neural networks. J Physiol (Paris)90:243–247.
Arieli A (1992) Novel strategies to unravel mechanisms of cortical function:from macro- to micro-electrophysiological recordings. In: Informationprocessing in the cortex (Aertsen A, Braitenberg V, eds), pp 123–137. NewYork: Springer.
Bak P, Tang C, Wiesenfeld K (1987) Self-organized criticality: an explana-tion of the 1/f noise. Phys Rev Lett 59:381–384.
Bove M, Genta G, Verreschi G, Grattarola M (1996) Characterization andinterpretation of electrical signals from random networks of culturedneurons. Technol Health Care 4:77– 86.
Braitenberg V, Schuz A (1991) Anatomy of the cortex. New York: Springer.Calvet M-C (1974) Patterns of spontaneous electrical activity in tissue cul-
tures of mammalian cerebral cortex vs. cerebellum. Brain Res 69:281–295.Cateau H, Fukai T (2001) Fokker-Planck approach to the pulse packet
propagation in synfire chain. Neural Netw 14:675– 685.Chen D-M, Wu S, Guo A, Yang ZR (1995) Self-organized criticality in a
cellular automaton model of pulse-coupled integrate-and-fire neurons.J Physiol A Math Gen 28:5177–5182.
Chervin RD, Pierce PA, Connors BW (1988) Periodicity and directionalityin the propagation of epileptiform discharges across neocortex. J Neuro-physiol 60:1695–1713.
Corner MA, van Pelt J, Wolters PS, Baker RE, Nuytinck RH (2002) Physio-logical effects of sustained blockade of excitatory synaptic transmissionon spontaneously active developing neuronal networks–an inquiry intothe reciprocal linkage between intrinsic biorhythms and neuroplasticityin early ontogeny. Neurosci Biobehav Rev 26:127–185.
Corral A, Perez CJ, Diaz-Guilera A, Arenas A (1995) Self-organized critical-ity and synchronization in a lattice model of integrate-and-fire oscillators.Phys Rev Lett 74:118 –121.
Cover TM, Thomas JA (1991) Elements of information theory. New York,Wiley.
Crain SM (1966) Development of “organotypic” bioelectric activity in cen-tral nervous tissues during maturation in culture. Int Rev Neurobiol9:1– 43.
de Carvalho JX, Prado CP (2000) Self-organized criticality in the Olami–Feder–Christensen model. Phys Rev Lett 84:4006 – 4009.
Diesmann M, Gewaltig MO, Aertsen A (1999) Stable propagation of syn-chronous spiking in cortical neural networks. Nature 402:529 –533.
11176 • J. Neurosci., December 3, 2003 • 23(35):11167–11177 Beggs and Plenz • Power Laws in Cortical Networks
Douglas RJ, Koch C, Mahowald M, Martin KA, Suarez HH (1995) Recur-rent excitation in neocortical circuits. Science 269:981–985.
Egert U, Schlosshauer B, Fennrich S, Nisch W, Fejtl M, Knott T, Muller T,Hammerle H (1998) A novel organotypic long-term culture of the rathippocampus on substrate-integrated multielectrode arrays. Brain ResBrain Res Protoc 2:229 –242.
Engel AK, Fries P, Singer W (2001) Dynamic predictions: oscillations andsynchrony in top-down processing. Nat Rev Neurosci 2:704 –716.
Ermentrout GB, Kleinfeld D (2001) Traveling electrical waves in cortex: in-sights from phase dynamics and speculation on a computational role.Neuron 29:33– 44.
Eurich CW, Herrmann JM, Ernst UA (2002) Finite-size effects of avalanchedynamics. Phys Rev E Stat Nonlin Soft Matter Phys 66:066137.
Gabbiani F, Koch C (1998) Principles of spike train analysis. methods inneuronal modeling. Cambridge, MA: MIT.
Gopal KV, Gross GW (1996) Auditory cortical neurons in vitro: cell culture andmultichannel extracellular recording. Acta Otolaryngol 116:690–696.
Gutenberg B, Richter CF (1956) Seismicity of the earth. Princeton, NJ:Princeton UP.
Gutnick MJ, Wolfson B, Baldino F (1989) Synchronized neuronal activitiesin neocortical explant cultures. Exp Brain Res 76:131–140.
Harris TE (1989) The theory of branching processes. New York: Dover.Herz AV, Hopfield JJ (1995) Earthquake cycles and neural reverberations:
collective oscillations in systems with pulse-coupled threshold elements.Phys Rev Lett 75:1222–1225.
Jimbo Y, Robinson HP (2000) Propagation of spontaneous synchronizedactivity in cortical slice cultures recorded by planar electrode arrays. Bio-electrochemistry 51:107–115.
Kamioka H, Maeda E, Jimbo Y, Robinson HP, Kawana A (1996) Spontane-ous periodic synchronized bursting during formation of mature patternsof connections in cortical cultures. Neurosci Lett 206:109 –112.
Karpiak V, Plenz D (2002) Preparation and maintenance of organotypiccultures for multielectrode array recordings. In: Current protocols inneuroscience (Crawley JN, Gerfen CR, Rogawski MA, Sibley DR, SkolnickP, Wray S, eds) pp 1, 6.15.1– 6.15.5. New York: Wiley.
Linkenkaer-Hansen K, Nikouline VV, Palva JM, Ilmoniemi RJ (2001)Long-range temporal correlations and scaling behavior in human brainoscillations. J Neurosci 21:1370 –1377.
Litvak V, Sompolinsky H, Segev I, Abeles M (2003) On the transmission ofrate code in long feedforward networks with excitatory-inhibitory bal-ance. J Neurosci 23:3006 –3015.
Lowen SB, Cash SS, Poo MM, Teich MC (1997) Quantal neurotransmittersecretion rate exhibits fractal behavior. J Neurosci 17:5666 –5677.
Maeda E, Robinson HP, Kawana A (1995) The mechanisms of generationand propagation of synchronized bursting in developing networks of cor-tical neurons. J Neurosci 15:6834 – 6845.
Malamud BD, Morein G, Turcotte DL (1998) Forest fires: an example ofself-organized critical behavior. Science 281:1840 –1842.
Meister M, Wong RO, Baylor DA, Shatz CJ (1991) Synchronous bursts of
action potentials in ganglion cells of the developing mammalian retina.Science 252:939 –943.
Nakagami Y, Saito H, Matsuki N (1996) Optical recording of rat entorhino-hippocampal system in organotypic culture. Neurosci Lett 216:211–213.
Paczuski M, Maslov S, Bak P (1996) Avalanche dynamics in evolution,growth, and depinning models. Phys Rev E 53:414 – 443.
Plenz D, Aertsen A (1993) Current source density profiles of optical record-ing maps: a new approach to the analysis of spatio-temporal neural activ-ity patterns. Eur J Neurosci 5:437– 448.
Plenz D, Aertsen A (1996) Neuronal dynamics in cortex-striatum co-cultures. II. Spatio-temporal characteristics of neuronal activity. Neuro-science 70:893–924.
Plenz D, Kitai ST (1996) Generation of high frequency oscillations in corticalcircuits of somatosensory cortex cultures. J Neurophysiol 76:4001–4005.
Plenz D, Kitai ST (1998) “Up” and “down” states in striatal medium spinyneurons simultaneously recorded with spontaneous activity in fast-spiking interneurons studied in cortex-striatum-substantia nigra organo-typic cultures. J Neurosci 18:266 –283.
Reyes AD (2003) Synchrony-dependent propagation of firing rate in itera-tively constructed networks in vitro. Nat Neurosci 6:593–599.
Sanchez-Vives MV, McCormick DA (2000) Cellular and network mecha-nisms of rhythmic recurrent activity in neocortex. Nat. Neurosci3:1027–1034.
Seamans JK, Durstewitz D, Christie BR, Stevens CF, Sejnowski TJ (2001)Dopamine D1/D5 receptor modulation of excitatory synaptic inputs tolayer V prefrontal cortex neurons. Proc Natl Acad Sci USA 98:301–306.
Segev R, Benveniste M, Hulata E, Cohen N, Palevski A, Kapon E, Shapira Y,Ben Jacob E (2002) Long term behavior of lithographically prepared invitro neuronal networks. Phys Rev Lett 88:118102.
Shadlen MN, Newsome WT (1998) The variable discharge of cortical neu-rons: implications for connectivity, computation, and information cod-ing. J Neurosci 18:3870 –3896.
Shu Y, Hasenstaub A, McCormick DA (2003) Turning on and off recurrentbalanced cortical activity. Nature 423:288 –293.
Singer W, Gray CM (1995) Visual feature integration and the temporal cor-relation hypothesis. Annu Rev Neurosci 18:555–586.
Toib A, Lyakhov V, Marom S (1998) Interaction between duration of activ-ity and time course of recovery from slow inactivation in mammalianbrain Na � channels. J Neurosci 18:1893–1903.
van Rossum MC, Turrigiano GG, Nelson SB (2002) Fast propagation offiring rates through layered networks of noisy neurons. J Neurosci22:1956 –1966.
Van Vreeswijk C, Sompolinsky H (1996) Chaos in neuronal networks withbalanced excitatory and inhibitory activity. Science 274:1724 –1726.
Worrell GA, Cranstoun SD, Echauz J, Litt B (2002) Evidence for self-organized criticality in human epileptic hippocampus. NeuroReport13:2017–2021.
Zapperi S, Baekgaard LK, Stanley HE (1995) Self-organized branching pro-cesses: mean-field theory for avalanches. Phys Rev Lett 75:4071– 4074.
Beggs and Plenz • Power Laws in Cortical Networks J. Neurosci., December 3, 2003 • 23(35):11167–11177 • 11177