Calcium and synaptic dynamics underlying reverberatory activity in neuronal networks
38
arXiv:0706.1611v1 [q-bio.NC] 12 Jun 2007 Calcium and synaptic dynamics underlying reverberatory activity in neuronal networks Vladislav Volman 1,2,5,† , Richard C. Gerkin 3,4 , Pak-Ming Lau 3 , Eshel Ben-Jacob 1,2 , and Guo-Qiang Bi 3,4 1. School of Physics and Astronomy, Raymond & Beverly Sackler Faculty of Exact Sciences, Tel-Aviv Univ., Tel-Aviv 69978, Israel 2. Center for Theoretical Biological Physics, University of California at San Diego, La Jolla, CA 92093, USA 3. Department of Neurobiology, University of Pittsburgh School of Medicine, Pittsburgh, PA 15261, USA 4. Center for Neuroscience and Center for the Neural Basis of Cognition, University of Pittsburgh, Pittsburgh, PA 15213, USA 5. Computational Neurobiology Laboratory, The Salk Institute for Biological Studies, La Jolla, CA 92037, USA † communicating author (e-mail: [email protected]) June 14, 2013 Abstract Persistent activity is postulated to drive neural network plasticity and learn- ing. To investigate its underlying cellular mechanisms, we developed a bio- physically tractable model that explains the emergence, sustenance, and eventual termination of short-term persistent activity. Using the model, we reproduced the features of reverberating activity that were observed in small (50-100 cells) networks of cultured hippocampal neurons, such as the ap- pearance of polysynaptic current clusters, the typical inter-cluster intervals, the typical duration of reverberation, and the response to changes in extra- cellular ionic composition. The model relies on action potential-triggered 1
-
Upload
independent -
Category
Documents
-
view
2 -
download
0
Transcript of Calcium and synaptic dynamics underlying reverberatory activity in neuronal networks

arX
iv:0
706.
1611
v1 [
q-bi
o.N
C]
12
Jun
2007
Calcium and synaptic dynamics underlying
reverberatory activity in neuronal networks
Vladislav Volman1,2,5,†, Richard C. Gerkin3,4, Pak-Ming Lau3,Eshel Ben-Jacob1,2, and Guo-Qiang Bi3,4
1. School of Physics and Astronomy, Raymond & Beverly Sackler Faculty of Exact Sciences,Tel-Aviv Univ., Tel-Aviv 69978, Israel
2. Center for Theoretical Biological Physics, University of California at San Diego,La Jolla, CA 92093, USA
3. Department of Neurobiology, University of Pittsburgh School of Medicine,
Pittsburgh, PA 15261, USA4. Center for Neuroscience and Center for the Neural Basis of Cognition,
University of Pittsburgh, Pittsburgh, PA 15213, USA5. Computational Neurobiology Laboratory, The Salk Institute for Biological Studies,
La Jolla, CA 92037, USA† communicating author (e-mail: [email protected])
June 14, 2013
Abstract
Persistent activity is postulated to drive neural network plasticity and learn-
ing. To investigate its underlying cellular mechanisms, we developed a bio-
physically tractable model that explains the emergence, sustenance, and
eventual termination of short-term persistent activity. Using the model, we
reproduced the features of reverberating activity that were observed in small
(50-100 cells) networks of cultured hippocampal neurons, such as the ap-
pearance of polysynaptic current clusters, the typical inter-cluster intervals,
the typical duration of reverberation, and the response to changes in extra-
cellular ionic composition. The model relies on action potential-triggered
1
residual presynaptic calcium, which we suggest plays an important role in
sustaining reverberations. We show that reverberatory activity is maintained
by enhanced asynchronous transmitter release from pre-synaptic terminals,
which in itself depends on the dynamics of residual presynaptic calcium.
Hence, asynchronous release, rather than being a ”synaptic noise”, can play
an important role in network dynamics. Additionally, we found that a fast
timescale synaptic depression is responsible for oscillatory network activa-
tion during reverberations, whereas the onset of a slow timescale depression
leads to the termination of reverberation. The simplicity of our model en-
abled a number of predictions that were confirmed by additional analyses of
experimental manipulations.
2

1 Introduction
Persistent neuronal activity likely underlies the operation of working memory
and other cellular and network functions [1, 2, 3]. The idea that reverberatory
activity is maintained in neuronal circuits by virtue of recurrent excitation
was first proposed by Lorente de No and Hebb [4, 5], and has been developed
into attractor models [1, 2]. Biophysically realistic models have focused on a
form of reverberation during which neurons in the network fire in an uncor-
related fashion [2]. Although the cellular mechanisms underlying the emer-
gence of such persistent activity in cortical networks are still being unravelled
[6], the slow kinetics of the N-Methyl-D-Aspartate receptor (NMDAR) cur-
rent has been proposed to maintain persistent activity [2], while negative
feedback from slow, activity-dependent K+ currents has been proposed to
terminate it [7]. At the same time, modelling studies of spontaneous activity
in developing spinal cord underscore the importance of multiple timescale
activity-dependent depression in episodic network oscillations [8].
Recently we discovered that in small networks of cultured hippocampal
neurons, brief stimulation of one neuron can result in correlated, reverber-
atory activity persisting for seconds [9]. Using voltage-clamp recordings,
rhythmic repetition of polysynaptic current events can be monitored from
single neurons in the network. Typically, each event lasts for ≈ 100msec and
repeats at 5-10 Hz [9] (see also figure 2A). Such reverberatory activity is in-
triguing in light of the role of network oscillations in information processing
and storage [10]. Mechanistically, such rhythmic reverberation may differ
from the uncorrelated persistent activity studied previously [2, 11]. In par-
ticular, these reverberations are maintained primarily by amino-3-hydyroxy-
5-methyl-4-isoxazolepropionic acid receptors (AMPARs) and are virtually
abolished by pharmacological manipulations that block asynchronous trans-
mitter release. Asynchronous transmitter release is a fundamental property
of synaptic transmission, corresponding to an increased probability of synap-
tic vesicle fusion that lasts for hundreds of milliseconds following an action
potential due to presynaptic residual calcium elevation [9]. Since the rate
of asynchronous release is intimately linked to pre-synaptic calcium dynam-
3

ics, these results suggest that the latter might play an important role in
sustaining reverberations. Importantly, in most experiments no spontaneous
activity was observed, indicating that network reverberation in small cultures
is likely to be mediated by synaptic, rather than intrinsic, mechanisms.
In this theoretical work we propose a minimal biophysical model address-
ing the persistence and termination of rhythmic reverberatory activity as
observed in small neuronal circuits. The model describes essential biophys-
ical processes such as calcium and synaptic dynamics that may underlie re-
verberation, yet is controlled by a small parameter set, leading to testable
predictions. We demonstrate that the emergence of rhythmic reverberatory
activity can be explained by considering the dynamics of residual presynap-
tic calcium. Specifically, activity-dependent elevations of residual calcium
lead to enhanced levels of asynchronous transmitter release, thus enabling a
network to sustain reverberatory activity. We also show that reverberations
can be terminated by a slow timescale synaptic depression. Furthermore, we
associate model parameters with known biophysical processes. Thus, we can
compare model behavior as these parameters change against experimental
recordings obtained under corresponding changes in physiological conditions.
We conclude that multiple timescale synaptic depression and the dynamics of
residual presynaptic calcium are essential mechanisms underlying rhythmic
reverberatory activity in small neuronal networks.
2 Methods
2.1 Cell culture and electrophysiology
Island cultures of dissociated rat hippocampal neurons were prepared as de-
scribed previously [9]. Briefly, glass cover-slips were coated with patterns
of poly-l-lysine spots (≈ 1mm diameter) with custom-made rubber stamps.
Dissociated cells from embryonic day 17-18 rats were plated on the cover-slips
in 35-mm Petri dishes at densities of 45 · 103 − 90 · 103 cells per dish. The
culture medium was DMEM (BioWhittaker) supplemented with 10% heat-
inactivated bovine calf serum (HyClone), 10% Hames F-12 with glutamine,
4

50 units/ml penicillin/streptomycin (Sigma) and 1x B-27 supplement (Invit-
rogen). Cultures were used at 14-21 days in vitro when reverberation was
commonly observed in isolated networks of ≈ 50 neurons on an island of
monolayer glial cells.
Perforated whole-cell patch clamp recordings were carried out with patch
clamp amplifiers (Axopatch 700A, Axon Instruments) at room temperature.
The pipette solution contained 136.5 mM K-gluconate, 17.5 mM KCl, 9
mM NaCl, 1 mM MgCl2, 10mM Hepes, 0.2 mM EGT, and 200 g/ml am-
photericin B (pH7.3). The external bath solution was a Hepes-buffered saline
containing (unless otherwise indicated) 150 mM NaCl, 3 mM KCl, 3 mM
CaCl2, 2 mM MgCl2, 10 mM Hepes, and 5 mM glucose (pH 7.3). Through-
out the recording, the culture was perfused with fresh bath solution at a
constant rate of ≈ 1ml/min. Synaptic transmission in networks cultured
under these experimental conditions is primarily characterized by a mod-
erate depression (PML and GQB, unpublished observations). Polysynaptic
current traces were recorded under a voltage clamp at a holding potential of
-70 mV. Voltage traces were recorded under a current clamp. Stimulation
pulses were 1-msec, 100-mV step depolarization (voltage clamp) or 1-ms, 2-
nA current injection (current clamp) delivered at inter-stimulus intervals of
at least 30 seconds. Signals were filtered at 2 kHz and acquired by using
a 16-bit digitizing board (DigiData 3200, Axon Instruments) and processed
with the pClamp software (Axon Instrument) and custom MATLAB (Math-
works) and IGOR Pro (Wavemetrics) programs. Reverberation duration was
defined as the time period from the point when the rising phase of the first
polysynaptic current (PSC) cluster crossed a threshold (≈ half of the av-
erage PSC amplitude) to the time point when the falling phase of the last
PSC cluster crossed the threshold with no additional threshold crossing in
the next 500msec.
5
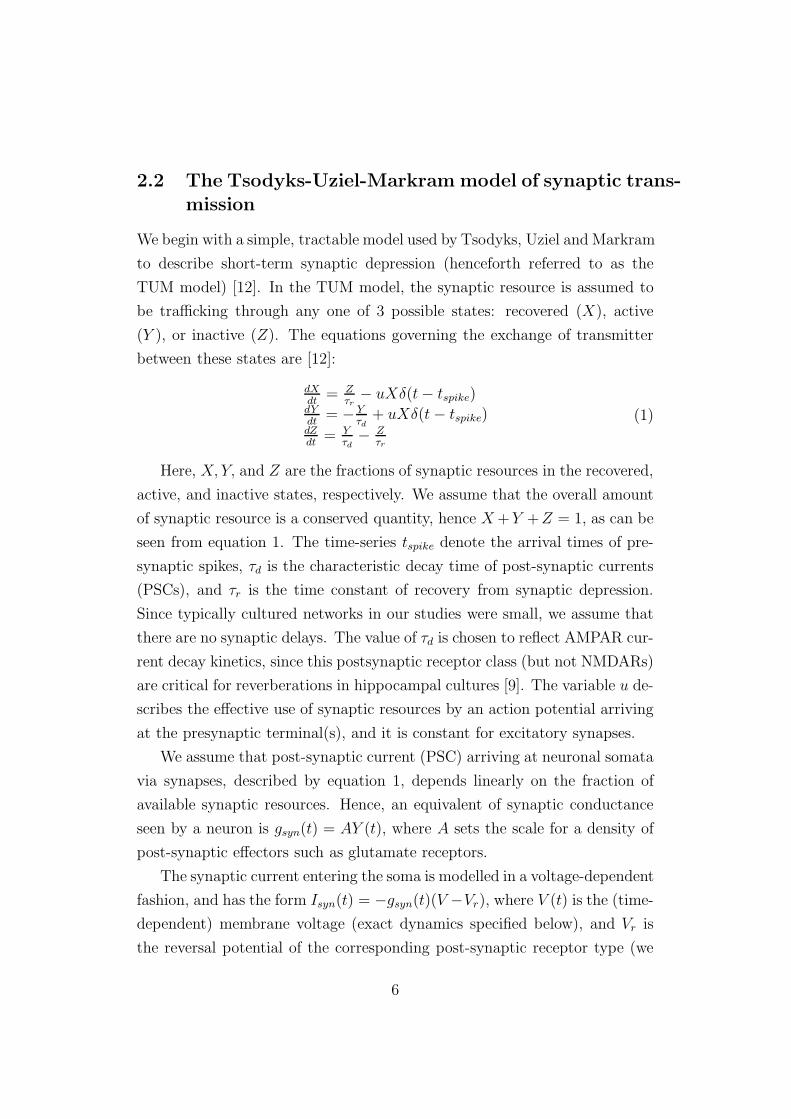
2.2 The Tsodyks-Uziel-Markram model of synaptic trans-mission
We begin with a simple, tractable model used by Tsodyks, Uziel and Markram
to describe short-term synaptic depression (henceforth referred to as the
TUM model) [12]. In the TUM model, the synaptic resource is assumed to
be trafficking through any one of 3 possible states: recovered (X), active
(Y ), or inactive (Z). The equations governing the exchange of transmitter
between these states are [12]:
dXdt
= Zτr− uXδ(t− tspike)
dYdt
= − Yτd
+ uXδ(t − tspike)dZdt
= Yτd
− Zτr
(1)
Here, X, Y, and Z are the fractions of synaptic resources in the recovered,
active, and inactive states, respectively. We assume that the overall amount
of synaptic resource is a conserved quantity, hence X +Y +Z = 1, as can be
seen from equation 1. The time-series tspike denote the arrival times of pre-
synaptic spikes, τd is the characteristic decay time of post-synaptic currents
(PSCs), and τr is the time constant of recovery from synaptic depression.
Since typically cultured networks in our studies were small, we assume that
there are no synaptic delays. The value of τd is chosen to reflect AMPAR cur-
rent decay kinetics, since this postsynaptic receptor class (but not NMDARs)
are critical for reverberations in hippocampal cultures [9]. The variable u de-
scribes the effective use of synaptic resources by an action potential arriving
at the presynaptic terminal(s), and it is constant for excitatory synapses.
We assume that post-synaptic current (PSC) arriving at neuronal somata
via synapses, described by equation 1, depends linearly on the fraction of
available synaptic resources. Hence, an equivalent of synaptic conductance
seen by a neuron is gsyn(t) = AY (t), where A sets the scale for a density of
post-synaptic effectors such as glutamate receptors.
The synaptic current entering the soma is modelled in a voltage-dependent
fashion, and has the form Isyn(t) = −gsyn(t)(V −Vr), where V (t) is the (time-
dependent) membrane voltage (exact dynamics specified below), and Vr is
the reversal potential of the corresponding post-synaptic receptor type (we
6

set Vr = 0mV for AMPA receptors). Summing the pre-synaptic contribu-
tions, the total PSC entering the post-synaptic membrane of the i-th neuron
is:
I isyn(t) = −ΣjAijYij(t)(V
i(t) − V ijr ) (2)
2.3 Multiple time-scale depression
Synaptic dynamics are usually characterized by a diversity of timescales,
endowing synapses with short-term plasticity in response to ongoing activity
[13, 14]. It has also been demonstrated that hippocampal synapses utilize at
least 3 distinct modes for vesicle recycling [14], each marked by a different
timescale. To take into account the notion of multiple time-scales for short-
term synaptic plasticity on the phenomenological level, we extended the TUM
model by introducing an additional synaptic state (called the super-inactive
state). Once in the inactive state (described by Z-variable), most of the
synaptic resource is directly transferred to the recovered state (X-variable),
while a small fraction leaks to the super-inactive S-state, and then slowly
reverts to the recovered state. During periods of elevated neuronal activity,
the super-inactive state acts as a sink for synaptic resources thus providing
negative feedback at a slow timescale. The trafficking of synaptic resource is
shown schematically in figure 1. The augmented TUM model is thus:
dXdt
= Sτs
+ Zτr− uXδ(t − tspike)
dYdt
= − Yτd
+ uXδ(t − tspike)dZdt
= Yτd
− Zτr− Z
τldSdt
= Zτl− S
τs
(3)
The extent to which a super-inactive state influences persistent activity is
determined by the two parameters, τl and τs, which define the characteristic
time of transmitter deposition into the state and a typical time of recov-
ery from the slow depression, respectively. As shown below, varying these
parameters directly affects the duration of persistent activity in the model
network.
7

2.4 The dynamics of residual Ca2+
The basic behavior of a synapse is well captured by the above phenomeno-
logical model. However, more detailed synaptic biophysical processes often
turn out to be of great importance due to their special role in the activity-
dependent modulation of synaptic transmission. Upon the arrival of an action
potential, the pre-synaptic terminal is depolarized, enabling calcium influx
through voltage-gated calcium channels. Pre-synaptic calcium influx trig-
gers a variety of processes, such as vesicular release of neurotransmitter. As
prolonged elevation of calcium concentration can be detrimental to cell func-
tion, there exists sophisticated machinery for calcium clearance. Most pre-
synaptic free calcium is rapidly extruded through the plasma membrane to
extra-cellular space [15, 16], but a small portion is taken up, at a much slower
rate, by pre-synaptic organelles. The latter constitute pre-synaptic calcium
stores, and complex dynamics associated with these stores have been sug-
gested to play an important role in the regulation of synaptic function [17].
Nonetheless, after each action potential a small amount of free (not buffered)
calcium is accumulated in the cytosol of the synapse. This ”residual cal-
cium” has been postulated to affect many of the characteristics of synaptic
transmission, most notably short-term synaptic dynamics and asynchronous
transmitter release [16, 18].
Let us denote by [Ca2+]r the concentration of residual cytosolic calcium.
We also assume that the extra-synaptic concentration of calcium (formally
denoted [Ca2+]o) is constant. The values of [Ca2+]o are on the order of mM ,
while a typical concentration of residual calcium is in sub-micro-molar region
[16]. The evolution of residual pre-synaptic calcium is described by:
d[Ca2+]rdt
=−β([Ca2+]r)
n
knr + ([Ca2+]r)n
+ Ip + γlog([Ca2+]o[Ca2+]r
)δ(t − tspike) (4)
The first term in the above equation describes the action of calcium
pumps, extruding calcium from the cytoplasm back to the extra-cellular
space. The second term, Ip, corresponds to passive flux of calcium into
the cytosol. Finally, the third term represents the influx of calcium into the
cytosol upon arrival of an action potential. This activity-dependent increase
8
of residual calcium occurs at each action potential arrival time tspike, and is
driven by the electro-chemical gradient across the membrane. The parame-
ter γ was tuned so as to result in ≈ 100nM per spike increment of residual
calcium [16]. The steady-state pre-synaptic concentration of residual calcium
is therefore determined by setting the third term equal to zero (no spikes),
and setting d[Ca2+]rdt
= 0. This gives [Ca2+]ss = kr
√
Ip
β−Ip. Note that because
the dynamics of calcium in the synchronous phase of transmission are much
faster, the above model essentially describes only the dynamics of residual
calcium.
The exponent n defines the degree of the cooperation required to activate
the pump, whereas the value of kr sets the transition from decay kinetics in
the low-concentration regime to those in the high-concentration regime. For
calcium extrusion pumps, the values of these parameters have been estimated
as kr = 0.4µM, n = 2 [15]. Note also that while the maximal rate of calcium
extrusion, β, is constant, the effective rate of pumping depends upon pre-
synaptic calcium concentration, thus ensuring regulatory feedback.
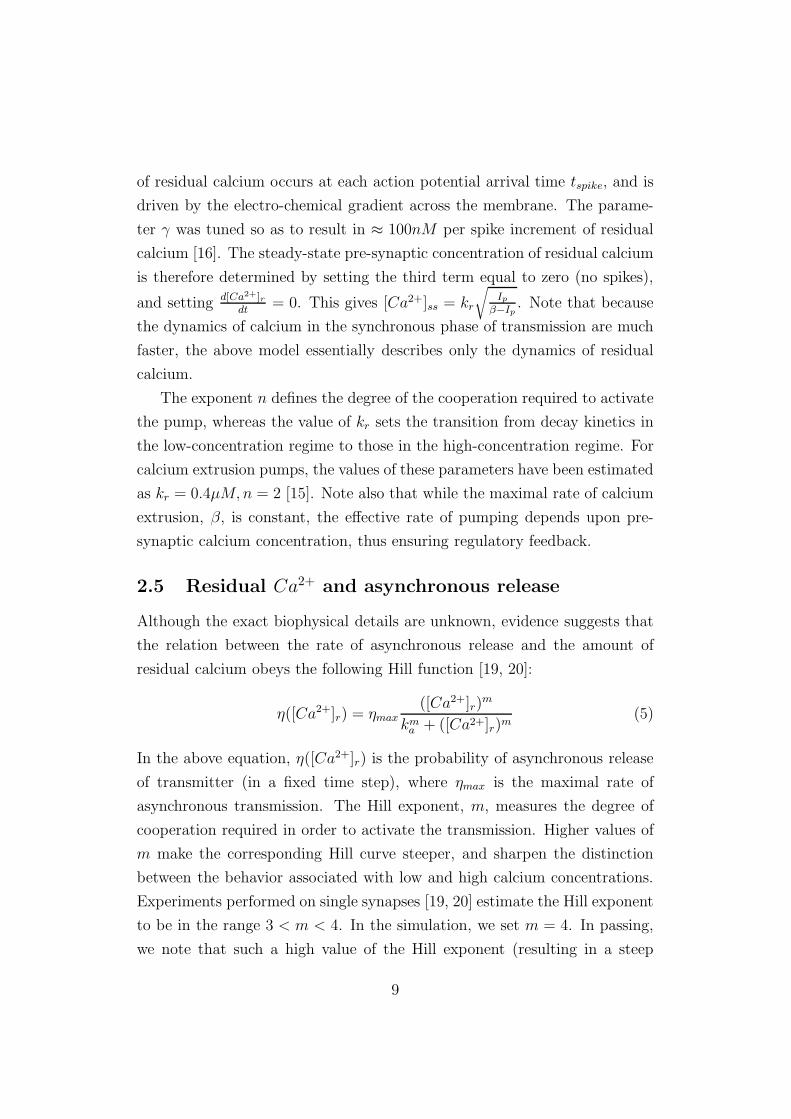
2.5 Residual Ca2+ and asynchronous release
Although the exact biophysical details are unknown, evidence suggests that
the relation between the rate of asynchronous release and the amount of
residual calcium obeys the following Hill function [19, 20]:
η([Ca2+]r) = ηmax
([Ca2+]r)m
kma + ([Ca2+]r)m
(5)
In the above equation, η([Ca2+]r) is the probability of asynchronous release
of transmitter (in a fixed time step), where ηmax is the maximal rate of
asynchronous transmission. The Hill exponent, m, measures the degree of
cooperation required in order to activate the transmission. Higher values of
m make the corresponding Hill curve steeper, and sharpen the distinction
between the behavior associated with low and high calcium concentrations.
Experiments performed on single synapses [19, 20] estimate the Hill exponent
to be in the range 3 < m < 4. In the simulation, we set m = 4. In passing,
we note that such a high value of the Hill exponent (resulting in a steep
9

threshold) seems to be an important component for network reverberations.
For smaller values of the Hill exponent (m = 2), less residual synaptic calcium
is required to produce significant levels of asynchronous activity. This can
result in dynamical instability of network dynamics, leading to spontaneous
outbreaks of reverberatory activity and to the de-coordination of population
dynamics (data not shown).
The threshold values of residual calcium needed to activate the asyn-
chronous release of transmitter vary from < 0.2µM for chromaffin cells [21] to
> 20µM for retinal bipolar nerve terminals [22]. This large variability across
different synapses might be attributed to the existence of distinct Ca2+ sen-
sors or different molecular organizations at the active zone [23]. Guided by
the reported importance of asynchronous transmitter release at hippocampal
synapses [24, 9], by the fact that variations as small as ∆[Ca2+]r ∼ 100nM
can significantly increase the frequency of release, and by the realization
that the affinity for asynchronous release is evidently higher than the affin-
ity for Ca2+ clearance, we propose a sub-micro-molar value for ka, and use
ka = 0.1µM in the simulations.
2.6 The enhanced (noisy) version of TUM model
With the above relations between the rate of asynchronous release and con-
centration of pre-synaptic free calcium, the equations of synaptic transmis-
sion are modified, and take the following form:
dXdt
= Sτs
+ Zτr− uXδ(t − tspike) − Xξ
dYdt
= − Yτd
+ uXδ(t − tspike) + XξdZdt
= Yτd
− Zτr− Z
τldSdt
= Zτl− S
τs
(6)
where ξ is an amplitude of the miniature synaptic event, modelled as a ran-
dom variable from a Gaussian distribution with positive mean 〈ξ〉. We as-
sume very weak variations in the amplitude of miniature events, since these
are believed to be a release of a single vesicle, but still there could be some
variability in vesicle size. Such spontaneous events of stochastic amplitude
are generated with the calcium-dependent rate η([Ca2+]r). The stochastic
10

term is added in such a way so as to satisfy the resource conservation con-
straint, X + Y + Z + S = 1. Note also that the quantity of spontaneously
released resource is proportional to the quantity of recovered synaptic re-
source, X. Thus, the greater the recovered resource there is, the greater the
effective amplitude of asynchronous release.
2.7 Neuronal Model
Choosing a plausible description for neuronal dynamics constitutes an im-
portant step in the construction of model that aims to describe dynamical
behavior of neuronal network. Single neuron dynamics are usually studied
using detailed compartmental models [25]. This approach, however, becomes
computationally expensive when large assemblies of coupled neurons are con-
sidered. A rule of thumb is to pick a simplified description of individual
neuron dynamics when large assemblies of cells are simulated, or when a
detailed membrane model is believed to be not critical to the phenomena
under study. As applied to the study of reverberation in the cultured net-
works described here, we note that: 1) since reverberating activity is marked
by depolarization of neuronal membrane and action potentials are of graded
magnitude, the dynamics and fluctuations of membrane voltage are likely to
be important; 2) studies of network dynamics and synaptic kinetics become
computationally expensive, especially when longer periods of simulation (as
is needed for the exploration of parametric space) are needed. Guided by
the desire to retain a plausible model of neuronal dynamics, and at the same
time to have at hand an efficient (from a computational point of view) sys-
tem, we have chosen to describe the neuronal dynamics with a simplified
two-component, single compartment Morris-Lecar model [26, 27]:
C dVdt
= −Iion(V, W ) + Iext(t)dWdt
= θW∞(V )−W (V )τW (V )
τW (V ) = (cosh(V −V3
2V4))−1
(7)
with Iion(V, W ) representing the contribution of the internal ionic Ca2+, K+
and leakage currents with their corresponding channel conductivities gCa, gK ,
11

and gL being constant:
Iion(V, W ) = gCam∞(V − VCa) + gKW (V − VK) + gL(V − VL) (8)
The current Iext(t) represents all the external current sources stimulating the
neuron, such as signals received through its synapses, glia-derived currents,
artificial stimulation as well as any noise sources.
The equations for steady-state fractions of open potassium and calcium chan-
nels are:W
∞(V ) = 1
2(1 + tanh(V −V3
V4))
m∞
(t) = 12(1 + tanh(V −V1
V2))
(9)
The advantage of Morris-Lecar model is that it can be easily set to de-
scribe either Type-I (saddle-node on invariant circle) or Type-II (Hopf) dy-
namics of neuronal somata; the two types describe the two qualitatively dif-
ferent ways in which the transition from the quiescent to the spiking phase
is accomplished [27]. Because experiments indicate that during the reverber-
ation phase neuronal somata are depolarized and neuronal spike responses
are of graded amplitude [9], we modelled the dynamics of individual neurons
as Type-II. While transmitter release in hippocampal neurons is coupled to
sodium spikes, rather than calcium spikes, the exact form of the neuronal
model is unimportant, provided that simulations of membrane potential evo-
lution roughly match experimental data. We were able to obtain reverbera-
tory activity in model networks using either Type-II or Type-I neurons, in-
dicating that the detailed form of transition from quiescent to spiking states
is not crucial to reverberation; nonetheless, we note that model reverbera-
tions with Type-II neurons better resemble those observed in hippocampal
networks. Note also that although our model describes calcium dynamics
in both neuronal somata and synaptic boutons, the two calcium concentra-
tions (in soma and in synaptic bouton) are different dynamical quantities.
Thus only the synaptic calcium variable is relevant for synaptic transmis-
sion, whereas the somatic calcium variable is just for controlling membrane
potential dynamics as described by the Morris-Lecar model.
12
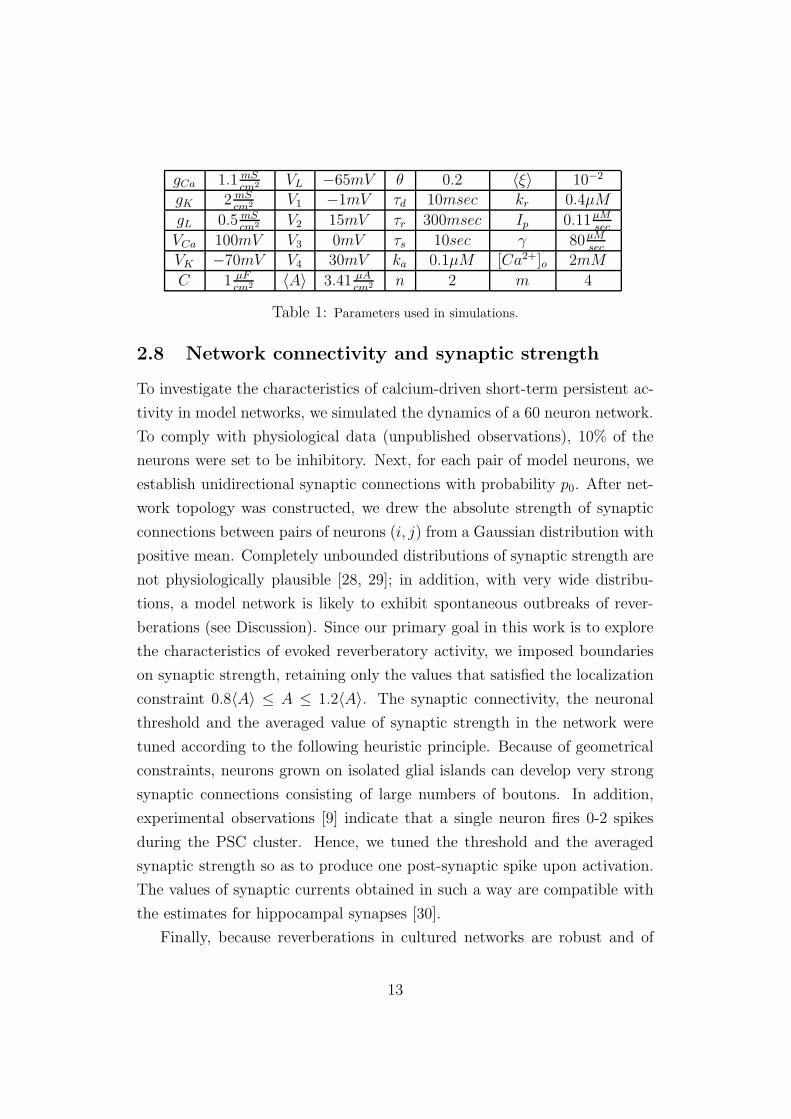
gCa 1.1 mScm2 VL −65mV θ 0.2 〈ξ〉 10−2
gK 2 mScm2 V1 −1mV τd 10msec kr 0.4µM
gL 0.5 mScm2 V2 15mV τr 300msec Ip 0.11µM
sec
VCa 100mV V3 0mV τs 10sec γ 80µMsec
VK −70mV V4 30mV ka 0.1µM [Ca2+]o 2mM
C 1 µFcm2 〈A〉 3.41 µA
cm2 n 2 m 4
Table 1: Parameters used in simulations.
2.8 Network connectivity and synaptic strength
To investigate the characteristics of calcium-driven short-term persistent ac-
tivity in model networks, we simulated the dynamics of a 60 neuron network.
To comply with physiological data (unpublished observations), 10% of the
neurons were set to be inhibitory. Next, for each pair of model neurons, we
establish unidirectional synaptic connections with probability p0. After net-
work topology was constructed, we drew the absolute strength of synaptic
connections between pairs of neurons (i, j) from a Gaussian distribution with
positive mean. Completely unbounded distributions of synaptic strength are
not physiologically plausible [28, 29]; in addition, with very wide distribu-
tions, a model network is likely to exhibit spontaneous outbreaks of rever-
berations (see Discussion). Since our primary goal in this work is to explore
the characteristics of evoked reverberatory activity, we imposed boundaries
on synaptic strength, retaining only the values that satisfied the localization
constraint 0.8〈A〉 ≤ A ≤ 1.2〈A〉. The synaptic connectivity, the neuronal
threshold and the averaged value of synaptic strength in the network were
tuned according to the following heuristic principle. Because of geometrical
constraints, neurons grown on isolated glial islands can develop very strong
synaptic connections consisting of large numbers of boutons. In addition,
experimental observations [9] indicate that a single neuron fires 0-2 spikes
during the PSC cluster. Hence, we tuned the threshold and the averaged
synaptic strength so as to produce one post-synaptic spike upon activation.
The values of synaptic currents obtained in such a way are compatible with
the estimates for hippocampal synapses [30].
Finally, because reverberations in cultured networks are robust and of
13
finite duration even under the complete blockade of GABAergic synapses [9]
we mimic this condition by nullifying the strength of all inhibitory synapses
in our network. Note that even under the complete blockade of inhibition,
cultured neurons in small networks fire at a moderate rate of ∼ 10Hz during
reverberation. This is much lower than the high frequency firing character-
istic of paroxysmal discharges during epileptic seizure.
3 Results and Discussion
3.1 The emergence of network reverberations
We begin with general observations regarding the dynamical behavior of the
model network. We found that in a typical simulation (parameter choices
specified in Table 1) the network response to brief stimulation (5 msec du-
ration) of one neuron is characterized by the appearance of a recurrent, ex-
citatory reverberation. This is seen clearly from figure 2A (top), in which
the total post-synaptic current experienced by a sample neuron (in voltage
clamp) from the model is shown. The temporal profile of the post-synaptic
current resembles that observed in small networks of cultured neurons (figure
2A, lower panel). Similar to the experimental results, the reverberating activ-
ity in the model network terminates after several seconds. We subsequently
show that both the temporal gaps between the adjacent current clusters and
the duration of network reverberation are controlled by specific biophysical
parameters.
In figure 2B, we show the dynamics of pre-synaptic residual calcium in
the model. Each action potential invading the pre-synaptic terminal during
a PSC cluster contributes to the build-up of such calcium. When a PSC
cluster is terminated (due to short-term synaptic depression of evoked trans-
mitter release), residual calcium levels are sufficiently elevated to generate
abundant asynchronous transmitter release, consistent with observations in
various types of synapses [31, 32]. While the concentration of presynaptic
calcium slowly decays due to pump-related active extrusion, the fraction of
synaptic resource recovered from depression simultaneously rises. At a crit-
14
ical point, synaptic resource recovery permits asynchronous post-synaptic
current to trigger the next PSC cluster.
Reverberatory activity in the model network terminates due to the accu-
mulation of synaptic resource in the super-inactive state (as shown in figure
2C). Thus our model demonstrates that presynaptic dynamics alone have
the capacity to account for important features such as the initiation, con-
tinuance, and eventual termination of reverberatory activity similar to that
observed in networks of hippocampal neurons [9]. This conclusion is further
supported by the raster plot of network activity in the model, shown in figure
3B. The appearance of PSC clusters reflects the existence of short time win-
dows during which the spiking activity of the network population is highly
correlated. Note that there are no spikes in the quiescent periods between
clusters, indicating that asynchronous release alone might be sufficient to
provide the driving force for the initiation of the next cluster. Somatic cal-
cium imaging data also indicates that the inter-PSC cluster periods contain
few or no spikes (PML and GQB, unpublished observations).
Note that the 4-state model of synaptic resources utilized by us is crucial
for persistent activity. In our model, a network has to accumulate a certain
”critical mass” of available neuro-transmitter in order to sustain its activity.
Using a 3-state model (with one depression state) and a very long recovery
time-scale will lead either to a failure to evoke reverberations (for strong
depression), or to a transition to an asynchronous mode of activity (for weak
depression). Neither corresponds to experimentally observed reverberations
of finite duration.
To test how the emergence of reverberatory activity in model networks is
determined by the overall synaptic strength distribution in the network, we
evaluated the duration of evoked reverberations for a range of systematically
varied values of the mean strength of model synapses. Figure 2D demon-
strates that, for low values of mean synaptic strength, stimulation failed to
induce reverberations in a model network. For higher values of synaptic
strength, short reverberations (1-2 PSC clusters) were obtained. Finally, a
transition to reverberations lasting for several seconds occurred slightly below
the point that we used in the rest of the model simulations. Increasing the
15

variance of the synaptic strengths (replacing the 20% constraint with the 80%
constraint, i.e using 0.2〈A〉 ≤ A ≤ 1.8〈A〉) did not lead to any qualitative
changes in the profile of transition from non-reverberatory to reverberatory
phases (figure 2D). These results indicate that in our model reverberation is
a robust phenomenon with respect to variations in synaptic strength distri-
butions. Meanwhile, the mean connection strength in the network plays a
critical role in the emergence of reverberation, consistent with experimental
observations [9].
The membrane voltage profile for a sample model neuron (figure 3A, up-
per panel) shows that the phase of persistent network activity is characterized
by neuronal membrane depolarization (driven by polysynaptic inputs). This
observation is again in qualitative agreement with experimental findings (fig-
ure 3A, lower panel), yet quantitatively the range of the model’s membrane
potential values appears to be off by a constant factor from those of cul-
tured neurons. This discrepancy follows from model neuron selection (ML),
and one might argue that selecting another model would lead to qualita-
tively different results. To test whether this is the case, we performed model
simulations with both type-I and type-II neurons (selecting two versions of
Morris-Lecar model). For both choices, we observed network reverberation
(data not shown). Hence, the choice of a particular spiking neuron model
does not appear to be critical for the emergence of reverberations.
3.2 Reverberation duration in small networks is deter-
mined by the rate of slow depression and the rateof pre-synaptic calcium extrusion
Earlier studies have explored the mechanisms responsible for the existence of
various types of persistent activity in large neuronal networks across differ-
ent preparations. For example, spindle oscillations in a large-scale thalamic
model were found to emerge from reciprocal interactions between excitatory
and inhibitory populations [33]. On the other hand, the synaptic basis of cor-
tical persistent activity is thought to be activation of NMDA receptors [2].
However, inhibition and NMDA-like excitation were shown to be not neces-
16
sary for network reverberations in small hippocampal cultures [9]. Instead,
the ability of a model network to exhibit reverberatory activity depends on
the factors that determine the readiness of the network to generate a new
PSC cluster at each time-point. Examples of such time-dependent factors are
effective synaptic strength and distance to action-potential threshold. The
parameters that determine whether sequential PSC cluster will continue to
be generated, and that control reverberation duration, are likely to be related
to underlying biophysical processes. Two prominent examples are the rate
of transmitter leakage into super-inactive state, and the maximal rate of pre-
synaptic residual calcium clearance. Since the exact physiological values for
these two rates are not known, we systematically varied them to investigate
their effects on the duration of reverberating activity in the model network.
As figure 4 demonstrates, lowering the rate of synaptic resource leakage
into the super-inactive state leads to an increase in reverberation duration.
When τs < τl, the recovery of transmitter from slow synaptic depression is
fast enough to enable the network to sustain reverberation indefinitely. At
the other extreme, making τl very rapid virtually abolishes reverberations.
We next proceeded to determine the effect of maximal calcium extrusion
rate on reverberation duration. As shown in figure 5, increasing the maximal
rates of calcium clearance, β, (i.e., faster effective extrusion time) decreases
the rate of asynchronous release, shortening reverberation duration. How-
ever, the extent to which a calcium clearance rate can affect the duration
of persistent activity is limited, because the maximal admissible duration is
determined by the value of τl (typical time of transmitter deposition into the
slow depression state).
3.3 Synchronous vs. asynchronous release
In the model network, the sustainability of a reverberation depends on the in-
terplay between synchronous and asynchronous release of neurotransmitter.
Hence, it is of interest to study the influence of model parameters describing
these two kinds of release on the emergence and characteristics of rever-
berations. To this end, we performed model simulations for systematically
17

varied values of the resource utilization parameter, u, and the maximal rate
of asynchronous release, ηmax (figure 6A). The values of τl and β were held
constant throughout these simulations, so as to fix the maximal admissible
reverberation duration.
The value of the resource utilization parameter contributes to the mag-
nitude of the postsynaptic event following the arrival of an action potential
at the pre-synaptic terminal. Consequently, the resource utilization param-
eter is one of the factors determining the ability of a network to evoke the
next PSC cluster. Low utilization of synaptic resource (small values of u)
might result in insufficient excitation to generate a PSC cluster. On the
other hand, high utilization can rapidly deplete the pool of transmitter, thus
leading to the termination of a reverberation due to rapid accumulation of
a synaptic resource in inactive states. In figure 6B we show the qualitative
change in duration of reverberation as the value of u is varied. Typically,
reverberation duration is inversely related to the value of u. However, below
a lower critical value for u, the synchronous phase of evoked release becomes
insignificant (relative to the asynchronous mode), and networks operate in an
uncoordinated regime, in which the network’s activity is marked by relatively
high-frequency non-coordinated neuronal discharges (data not shown).
We next evaluated the effect of varying ηmax, the maximal rate of asyn-
chronous release, on the duration of reverberatory activity. As shown in
figure 6C, increasing ηmax typically increases the duration of a reverbera-
tion. However, when ηmax is above a critical value, asynchronous release
dominates over synchronous release, and the network again switches to an
uncoordinated mode of activity (data not shown). At the other extreme,
for ηmax below a lower critical value reverberations are virtually abolished,
because the level of asynchronous release is too low to provide neurons with
sufficient tonic synaptic drive for subsequent PSC clusters to be generated.
The specific balance between synchronous and asynchronous release could
also affect the duration of the temporal gaps between adjacent PSC clusters.
To test whether this is the case, we computed the average frequency of rever-
beration (defined as ICI−1, where an inter-cluster-interval ICI is computed
as the mean interval between the peaks of adjacent PSC clusters) for differ-
18

ent values of the resource utilization parameter u and the maximal frequency
of asynchronous release ηmax. Figures 6D,E show the trend in reverberation
frequency as a function of synchronous and asynchronous release parameters.
While frequency tends to increase with increasing ηmax, the dependence is
much weaker than that of reverberation duration.
3.4 Testing the model with strontium experiments
The effects of asynchronous release and pre-synaptic calcium were studied
experimentally by replacing calcium with strontium in the extra-cellular
medium. Strontium is known to de-synchronize transmitter release, thus
enhancing the asynchronous mode of release. For experiments in which stron-
tium partially replaced calcium, the amplitude of the current at the peak of
each PSC cluster (synchronous phase) was reduced, while the amplitude of
the current between peaks (asynchronous phase) was enhanced [9]. Further-
more, reverberations lasted longer. These results imply that by manipulating
the ”trade-off” between the synchronous and asynchronous phases of synap-
tic transmission it is possible to influence the characteristics of reverberatory
activity.
In the framework of the model network, strontium-induced partial sup-
pression of stimulated synaptic transmission would correspond to a smaller
value of resource utilization parameter, u. On the other hand, enhancement
of asynchronous release corresponds to increasing the value of ηmax (max-
imal release frequency). In order to test the predictions of the model, we
made the simplifying assumption that the synchronous and asynchronous
modes of transmitter release can be manipulated independently. Thus, given
the approximate correspondence between model parameters and biophysical
processes, we compared the experimentally observed reverberation traces un-
der different conditions with their analogues in the model. As is seen from
figure 7, these parameter changes in the model correctly reproduce the ex-
perimental effects of strontium replacing calcium. Namely, upon treatment
with ”strontium”, the average amplitude of the model network’s PSC clus-
ters decreases, while the duration of reverberations is markedly increased.
19

An increase in the concentration of calcium has the opposite effect. In ad-
dition, the model predicts that the average temporal gap between adjacent
PSC clusters should decrease moderately in the presence of strontium (i.e.
the frequency at which the network reverberates should grow higher) (13 Hz
in ”strontium” vs. 10 Hz for ”control”). Quantitative analysis of reverber-
ation experiments indeed shows a slight increase in reverberation frequency,
consistent with this prediction (6.61 ± 0.13 Hz in strontium vs. 5.95 ± 0.21
Hz for controls, p < 0.01, Student’s t-test).
3.5 Spontaneous outbreaks of reverberation and unco-ordinated population activity
Enhanced network excitability raised the chances of observing spontaneous
network reverberation. When we relaxed the constraints on the variance of
synaptic strength, the model network could exhibit spontaneous reverbera-
tions (in the absence of any stimulus, figure 8A). This observation can be
attributed to the existence of a few very strong synaptic connections that
are themselves capable of initiating the first PSC cluster of a reverberation
with the help of a modest background current. Indeed, manipulations that
increase synaptic strength in cultured networks can also lead to spontaneous
reverberation in cultured networks (RCG and GQB, unpublished data). In
model networks we could control the appearance of reverberations by varying
the relevant parameters. Normally growing networks in culture may utilize
biophysical pathways to regulate their excitability in an activity-dependent
manner, thus ensuring that reverberations have the appropriate balance of
rarity, PSC cluster frequency, and duration. Examples of such mechanisms
could be spike timing dependent plasticity [28], activity-dependent scaling of
synaptic weights [34], or modulation from adjacent astro-glia [35]. Further
research should delineate the contribution of these to the ability of a network
to sustain healthy reverberations.
Although typically the reverberations in our model network followed the
patterns of recorded activity quite well, we observed some potentially inter-
esting distinctions between simulated and real networks. Namely, in some
20

cases the simulated reverberations were interrupted by periods of relatively
dense synaptic activity. During these windows, the electrical activity of the
neuronal population was uncoordinated. Such uncoordinated behavior was
not observed in cultured networks, and therefore has drawn our attention.
Upon closer examination, we found that uncoordinated activity could be
induced in networks with relatively elevated neuronal excitability. In addi-
tion to changes in the variance of the synaptic distribution described above,
the excitability can also be affected by a number of other parameters - for
example, the value of the background current, the maximal frequency of
asynchronous transmitter release, etc. As an example, elevating the value of
constant background current to I = 15 µA
cm2 (instead of I = 14 µA
cm2 , as used in
other simulations and as specified in Table 1) led to the appearance of unco-
ordinated activity under otherwise ”normal” conditions, as shown in figures
8B,C.
To test the idea that additional biophysical mechanisms might down-
regulate these otherwise unstable network states, we modified model synapses
to include an additional, high capacity low affinity calcium extrusion pump
[15, 17]. Equation 4 now reads:
d[Ca2+]rdt
=−β([Ca2+]r)
n
knr + ([Ca2+]r)n
−0.05([Ca2+]r)
2
4 + ([Ca2+]r)2+ Ip +
+γlog([Ca2+]o[Ca2+]r
)δ(t − tspike) (10)
Since the affinity of an additional pump is much lower than typical levels of
synaptic residual calcium, it is expected to have little effect during ”clean”
reverberations. However, as seen from figure 9, the residual calcium in model
synapses is rather high during outbreaks of uncoordinated activity. During
these outbreaks, the number of neurons active during a narrow time window
(roughly corresponding to the temporal ”localization” of PSC cluster) falls
low. In this situation, the addition of a low affinity pump proves beneficial,
as it can help to keep the network in the ”normal” reverberating state (figure
9).
21

4 Conclusion and Outlook
In this work, we provide a simple, yet biophysically tractable modelling
framework that aims to explain the emergence, persistence, and eventual
termination of reverberatory activity observed in small networks of cultured
neurons. Using this framework, we reproduced the salient features observed
in the activity of small cultured networks - network reverberations manifested
themselves in the appearance of polysynaptic current (PSC) clusters, with a
typical cluster width and inter-cluster separation matching those observed in
experiments. The appearance of clusters corresponded to the short periods of
time during which the activity of networks elements was highly coordinated.
This work also offers new insight into the mechanisms by which a network
could interdigitate highly coordinated population activity with periods of si-
lence. In order for activity to re-emerge after the silent periods, asynchronous
neurotransmitter release must be sufficient to maintain the excitability of the
network, while the recovery of neurotransmitter from short-term depression
eventually triggers a new round of activity. This represents a biophysical
implementation of the hypothesis that rapidly decaying negative feedback,
combined with slowly decaying positive feedback, could maintain persistent
activity in neuronal networks [36]. This may represent a general mechanism
by which such networks can sustain reverberation.
Cultured networks are also known to exhibit bouts of activity called syn-
chronized bursting events (SBEs) [37]. However, the reverberations seen here
in small networks differ from the SBEs observed in large networks in at least
two aspects: a) the width of a typical SBE is larger (by a factor of 2-4) than
the width of a typical PSC cluster, and b) the separation between a pair
of adjacent SBEs is several orders of magnitude larger than the inter-PSC-
cluster separation. This observation hints that the mechanism underlying the
generation of reverberatory phenomena in small networks differs from the one
responsible for the generation of SBEs in larger networks. Exactly how these
mechanisms and their expression depend on network size is a question that
should be resolved by further experimental and modelling studies.
It should be noted that our description of network dynamics assumes
22

that a single action potential arriving at the synaptic terminal can evoke a
spike in some of its post-synaptic targets (and generate a PSC cluster in an
avalanche-like manner). Contrary to this, experiments indicate that there
is a great deal of indeterminacy in neuronal responses; single stimuli were
not always successful in evoking reverberatory activity [9]. Interestingly,
enhanced activation of reverberation could be obtained with paired-pulse
stimulation, with each pulse separated by 200-400 msec. Such paired-pulse
stimuli produced greater levels of asynchronous release than one pulse alone.
This observation might indicate that physiologically relevant input stimuli
might drive the synapse into a resonant state with respect to presynaptic
residual calcium dynamics, ultimately imparting the network with the level
of excitability needed to sustain a reverberation.
In the present work, we have assumed that evoked synaptic transmission
is ”faithful” (i.e. each incoming action potential reliably leads to transmitter
release), whereas asynchronous transmitter release was modelled as a stochas-
tic process. In reality, transmitter release is inherently stochastic; yet, due
to the relatively large number of vesicles involved in evoked release in these
cultures, this process might be close to deterministic. Were the variability of
evoked transmitter release incorporated in our model, it would only lead to
a better match with experiments (see previous paragraph). However, such
a level of description should include detailed modelling of presynaptic bio-
physics, and might become computationally much more complex for network
simulations. Meanwhile, our hybrid system of deterministic evoked synap-
tic transmission and stochastic asynchronous release should be considered
as a first approximation towards the more realistic models of calcium-driven
network reverberations.
An important hypothesis concerning persistent network activity suggests
that the slow kinetics of postsynaptic NMDA receptors is necessary for such
activity to be sustained in an asynchronous fashion [2]. Our work, along with
recent experiments [9], indicates an alternative mechanism whereby asyn-
chronous release of neurotransmitter from presynaptic terminals, also with a
slow kinetics, is a critical factor for the emergence of rhythmic reverberations
in small neuronal circuits. It is important to note that our results do not
23
contradict the role of NMDARs - rather, given the sustained membrane depo-
larization (which relieves Mg2+ block of NMDARs) during reverberation, it
is plausible that NMDAR activation (a postsynaptic process that is enhanced
by membrane depolarization) might cooperate with asynchronous release (a
presynaptic process that is enhanced by repeated activation) to increase the
synaptic drive onto neurons during reverberations. While experimental re-
sults show that totally blocking NMDAR-mediated transmission can weaken
reverberation [9], partially supporting this view, a more systematic analysis
could be of interest.
Just as NMDA receptors increase network excitability, GABAergic in-
hibitory neurons can prevent reverberations or shorten their duration by
providing negative feedback. In the present model, we have considered net-
work reverberations in the absence of inhibition in order to delineate the
importance of presynaptic mechanisms of recurrent excitation. In so doing,
we relied on the experimental observation that in small networks normal
reverberatory activity is present (and in fact enhanced) even under the com-
plete blockade of GABAergic synapses [9]. Although beyond the scope of
the current study, it is likely that in larger networks with stronger excitatory
connections, inhibition plays critical roles in balancing network dynamics. In
such cases, presynaptic residual calcium may also be important in modulat-
ing the dynamics of GABAergic transmission as well.
Our explanation of persistent activity in small neuronal circuits is based
on an approximation of the biological complexity of the synapse. For exam-
ple, our model incorporates only a single calcium pump, which is especially
effective at clearing low Ca2+ concentrations. Real synapses contain many
more kinds of pumps and also Ca2+-storing organelles (such as mitochondria
and ER). The low affinity of mitochondria for Ca2+ (km] ∼ 10µM) is partic-
ularly suitable for regulation of Ca2+ under conditions when large influxes of
calcium occur and other homeostatic processes are unable to regulate Ca2+
levels [17]. This would be especially relevant when a network operates in a
regime of uncoordinated activity (see figure 9). More detailed models and
experimental studies may ultimately elucidate the role of pre-synaptic Ca2+-
storing organelles in the regulation of persistent network activity. Neverthe-
24
less, our results indicate that calcium regulation at the synaptic terminal
could play an important role in modulating the dynamic activity of neuronal
circuits.
Acknowledgements: The authors would like to thank Eugene Izhikevich and
Nadav Raichman for valuable comments on an earlier version of this manuscript.
This work has been supported in part by the NSF-sponsored Center for The-
oretical Biological Physics (grant numbers PHY-0216576 and PHY-0225630),
by the Israeli Science Foundation, by the Tauber Fund at Tel-Aviv University,
and by NIMH (R01 MH066962).
25

References
[1] D. Durstewitz, J.K. Seamans, and T.J. Sejnowski. Neurocomputational
models of working memory. Nat. Neurosci., 3:1184–1191, 2000.
[2] X.J. Wang. Synaptic reverberation underlying mnemonic persistent ac-
tivity. Trends in Neurosci., 24(8):455–463, 2001.
[3] E. Marder and D. Bucher. Central patterns generators and the control
of rhythmic movements. Current Biology, 11:R986–R996, 2001.
[4] R. Lorente de No. Vestibulo-ocular reflex arc. Arch. Neurol. Psychiatry,
30:245–291, 1933.
[5] D.O. Hebb. The organization of behavior - a neurophsychological theory.
Wiley, New York, 1949.
[6] D.A. McCormick, Y. Shu, A. Hasenstaub, M. Sanchez-Vives,
M. Badoual, and T. Bal. Persistent cortical activity: mechanisms of gen-
eration and effects on neuronal excitability. Cereb. Cortex, 13(11):1219–
1231, 2003.
[7] A. Compte, M.V. Sanchez-Vives, D.A. McCormick, and X.-J. Wang.
Cellular and network mechanisms of slow oscillatory activity (¡1 hz)
and wave propagations in a cortical network model. J. Neurophysiol.,
89:2707–2725, 2003.
[8] J. Tabak, M.J. O’Donovan, and J. Rinzel. Modeling of spontaneous
activity in developing spinal cord using activity-dependent depression
in an excitatory network. J. Neurosci., 20(8):3041–3056, 2000.
[9] P-M. Lau and G-Q. Bi. Synaptic mechanisms of persistent reverberatory
activity in neuronal networks. Proc. Nat. Acad. Sci. USA, 102:10333–
10338, 2005.
[10] T.J. Sejnowski and O. Paulsen. Network oscillations: emerging compu-
tational principles. J. Neurosci., 26(6):1673–1676, 2006.
26
[11] D. Hansel and G. Mato. Existence and stability of persistent states in
large neuronal networks. Phys. Rev. Lett., 86(18):4175–4178, 2001.
[12] M. Tsodyks, A. Uziel, and H. Markram. Synchrony generation in re-
current networks with frequency-dependent synapses. J. Neurosci., 20,
2000.
[13] J.D. Hunter and J.G. Milton. Synaptic heterogeneity and stimulus-
induced modulation of depression in central synapses. J. Neurosci.,
21(15):5781–5793, 2001.
[14] S.P. Gandhi and C.F. Stevens. Three modes of synaptic vesicular recy-
cling revealed by single-vesicle imaging. Nature, 423:607–613, 2003.
[15] E. Carafoli. Calcium signaling: a historical account. Biol. Res.,
37(4):497–505, 2004.
[16] R.S. Zucker. Exocytosis: a molecular and physiological perspective.
Neuron, 17:1049–1055, 1996.
[17] D.D. Friel. Mitochondrial and ER calcium uptake and release fluxes
and their interplay in intact nerve cells. in: Understanding calcium
dynamics, M. Falcke and D. Malchow (eds.), Springer, 2003.
[18] R.S. Zucker and W.G. Regehr. Short-term synaptic plasticity. Ann.
Rev. Physiol., 64:355–405, 2002.
[19] R. Ravin, M.E. Spira, H. Parnas, and I. Parnas. Simultaneous measure-
ment of intracellular ca2+ and asynchronous transmitter release from
the same crayfish bouton. J. Physiol., 501(2):251–262, 1997.
[20] S. Kirischuk and R. Grantyn. Intra-terminal ca2+ concentration and
asynchronous transmitter release at single gabaergic boutons in rat col-
licular cultures. J. Physiol., 548(3):753–764, 2003.
[21] G.J. Augustine and E. Neher. Calcium requirements for secretion in
bovine chromaffin cells. J. Physiol. (London), 450:533–568, 1992.
27

[22] R. Heidelberger, C. Heinemann, E. Neher, and G. Matthews. Calcium
dependence of the rate of exocytosis in a synaptic terminal. Nature,
371:513–515, 1994.
[23] R. Schneggenburger and E. Neher. Presynaptic calcium and control of
vesicle fusion. Curr. Opin. Neurobiol., 15:266–274, 2005.
[24] D.J. Hagler and Y. Goda. Properties of synchronous and asynchronous
release during pulse train depression in cultured hippocampal neurons.
J. Neurophysiol., 85:2324–2334, 2001.
[25] I. Segev, J.W. Fleshman, and R.E. Burke. Compartmental models of
complex neurons. in: Methods in neuronal modeling: from synapses to
networks, (C. Koch and I. Segev, eds.), 1989.
[26] C. Morris and H. Lecar. Voltage oscillations in the barnacle giant muscle
fiber. Biophys. J., 35:193–213, 1981.
[27] J. Rinzel and G.B. Ermentrout. Analysis of neural excitability and oscil-
lations. in: Methods in neuronal modeling: from synapses to networks,
(C. Koch and I. Segev, eds.), 1989.
[28] G.Q. Bi and M.M. Poo. Synaptic modification by correlated activity:
Hebbs postulate revisited. Annu. Rev. Neurosci., 24:139–166, 2001.
[29] M.C.W. van Rossum, G.Q. Bi, and G.G. Turrigiano. Stable heb-
bian learning from spike timing dependent plasticity. J. Neurosci.,
20(23):8812–8821, 2000.
[30] G. Chen, N.G. Harata, and R.W. Tsien. Paired-pulse depression of
unitary quantal amplitude at single hippocampal synapses. Proc. Natl.
Acad. Sci. USA, 101(4):1063–1068, 2001.
[31] Y.Goda and C.F. Stevens. Two components of transmitter release at a
central synapse. Proc. Natl. Acad. Sci. USA, 91:12942–12946, 1994.
[32] P.P. Atluri and W.G. Regehr. Delayed release of neurotransmitter from
cerebellar granule cells. J. Neurosci., 18(20):8214–8227, 1998.
28
[33] D. Golomb, X.J. Wang, and J. Rinzel. Synchronization properties of
spindle oscillations in a thalamic reticular nucleus model. J. Neurophys-
iol., 72(3):1109–1126, 1994.
[34] G.G. Turrigiano, K.R. Leslie, N.S. Desai, L.C. Rutherford, and S.B.
Nelson. Activity-dependent scaling of quantal amplitude in neocortical
neurons. Nature, 391(6670):845–846, 1998.
[35] M.C. Angulo, A.S. Kozlov, S. Charpak, and E. Audinat. Glutamate
released from glial cells synchronizes neuronal activity in the hippocam-
pus. J. Neurosci., 24(31):6920–6927, 2004.
[36] D. Golomb, A. Shedmi, R. Curtu, and G.B. Ermentrout. Persistent
synchronized bursting activity in cortical tissues with low magnesium
concentration: a modeling study. J. Neurophysiol., 95:1049–1067, 2005.
[37] R. Segev and E. Ben-Jacob. Spontaneous synchronized bursting activity
in 2d neural networks. Physica A, 302:64–69, 2001.
29
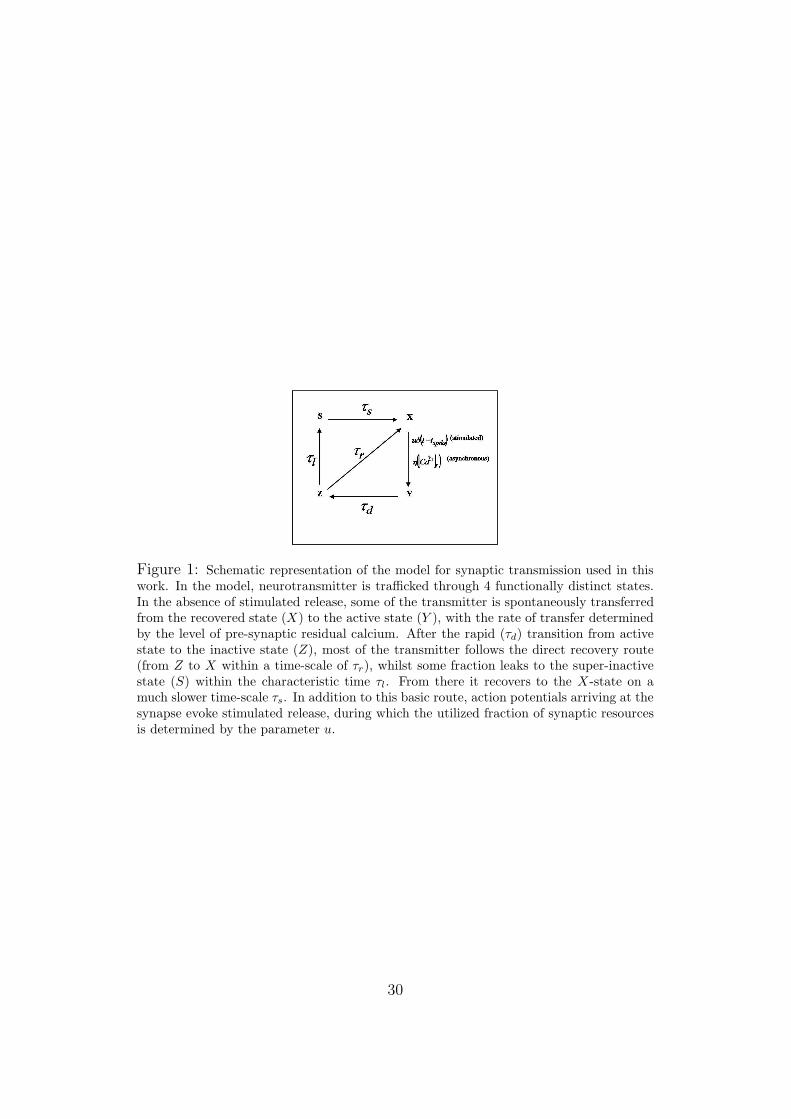
Figure 1: Schematic representation of the model for synaptic transmission used in thiswork. In the model, neurotransmitter is trafficked through 4 functionally distinct states.In the absence of stimulated release, some of the transmitter is spontaneously transferredfrom the recovered state (X) to the active state (Y ), with the rate of transfer determinedby the level of pre-synaptic residual calcium. After the rapid (τd) transition from activestate to the inactive state (Z), most of the transmitter follows the direct recovery route(from Z to X within a time-scale of τr), whilst some fraction leaks to the super-inactivestate (S) within the characteristic time τl. From there it recovers to the X-state on amuch slower time-scale τs. In addition to this basic route, action potentials arriving at thesynapse evoke stimulated release, during which the utilized fraction of synaptic resourcesis determined by the parameter u.
30
0 1 2 3 4 5−80−60−40−20
0
time [sec]
PSC
[µA/cm
2 ]
(A)
0 2 4 6−1.6
−0.8
0
PSC
[nA]
time [sec]
0 1 2 3 4 50
0.20.40.60.8
time [sec]
[Ca2+
] r [µM](B)
0 1 2 3 4 50
0.1
0.2
time [sec]
S
(C)
0 0.2 0.4 0.6 0.8 1 1.20
2
4
6
synaptic strength scale factor
dura
tion [
sec]
(D) 20%60%80%
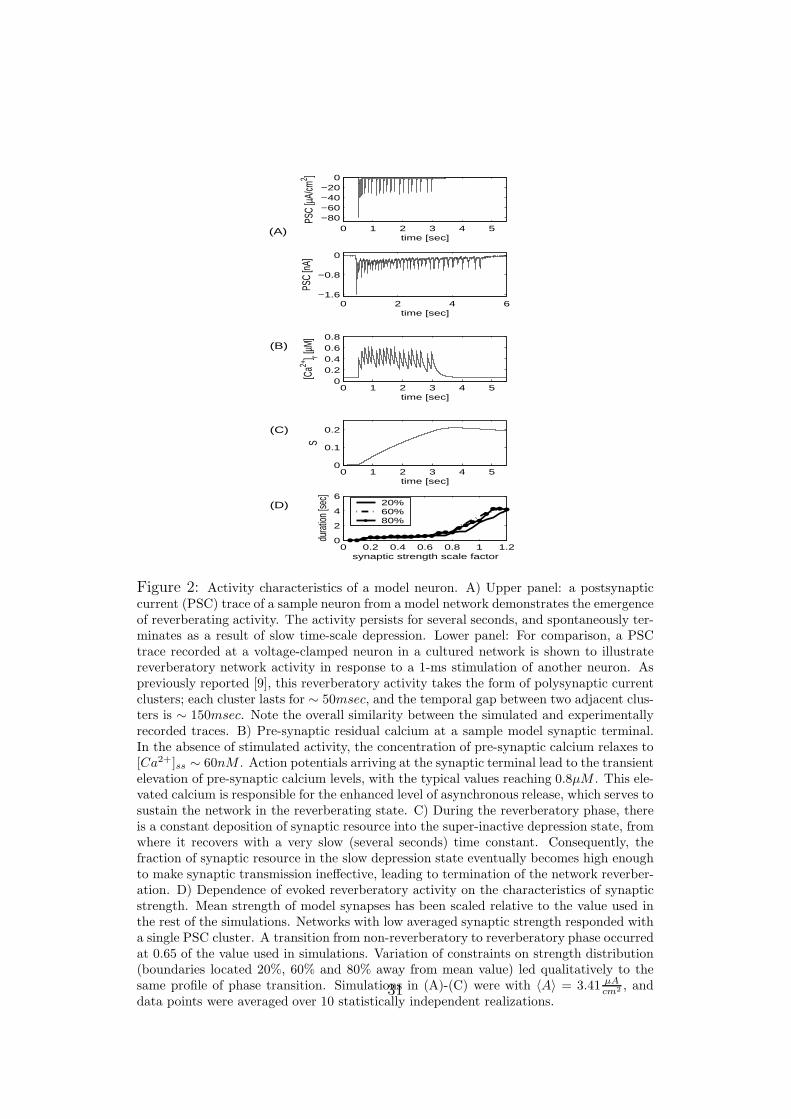
Figure 2: Activity characteristics of a model neuron. A) Upper panel: a postsynapticcurrent (PSC) trace of a sample neuron from a model network demonstrates the emergenceof reverberating activity. The activity persists for several seconds, and spontaneously ter-minates as a result of slow time-scale depression. Lower panel: For comparison, a PSCtrace recorded at a voltage-clamped neuron in a cultured network is shown to illustratereverberatory network activity in response to a 1-ms stimulation of another neuron. Aspreviously reported [9], this reverberatory activity takes the form of polysynaptic currentclusters; each cluster lasts for ∼ 50msec, and the temporal gap between two adjacent clus-ters is ∼ 150msec. Note the overall similarity between the simulated and experimentallyrecorded traces. B) Pre-synaptic residual calcium at a sample model synaptic terminal.In the absence of stimulated activity, the concentration of pre-synaptic calcium relaxes to[Ca2+]ss ∼ 60nM . Action potentials arriving at the synaptic terminal lead to the transientelevation of pre-synaptic calcium levels, with the typical values reaching 0.8µM . This ele-vated calcium is responsible for the enhanced level of asynchronous release, which serves tosustain the network in the reverberating state. C) During the reverberatory phase, thereis a constant deposition of synaptic resource into the super-inactive depression state, fromwhere it recovers with a very slow (several seconds) time constant. Consequently, thefraction of synaptic resource in the slow depression state eventually becomes high enoughto make synaptic transmission ineffective, leading to termination of the network reverber-ation. D) Dependence of evoked reverberatory activity on the characteristics of synapticstrength. Mean strength of model synapses has been scaled relative to the value used inthe rest of the simulations. Networks with low averaged synaptic strength responded witha single PSC cluster. A transition from non-reverberatory to reverberatory phase occurredat 0.65 of the value used in simulations. Variation of constraints on strength distribution(boundaries located 20%, 60% and 80% away from mean value) led qualitatively to thesame profile of phase transition. Simulations in (A)-(C) were with 〈A〉 = 3.41 µA
cm2 , anddata points were averaged over 10 statistically independent realizations.
31
0 1 2 3 4 5
−200
20
time [sec]
Vol
tage
[mV
]
(A)
0 1 2 3 4 5
−50
0
50
time [sec]
Vol
tage
[mV
]
time [sec]
neur
on #(B)
0 1 2 3 4 5
1
60
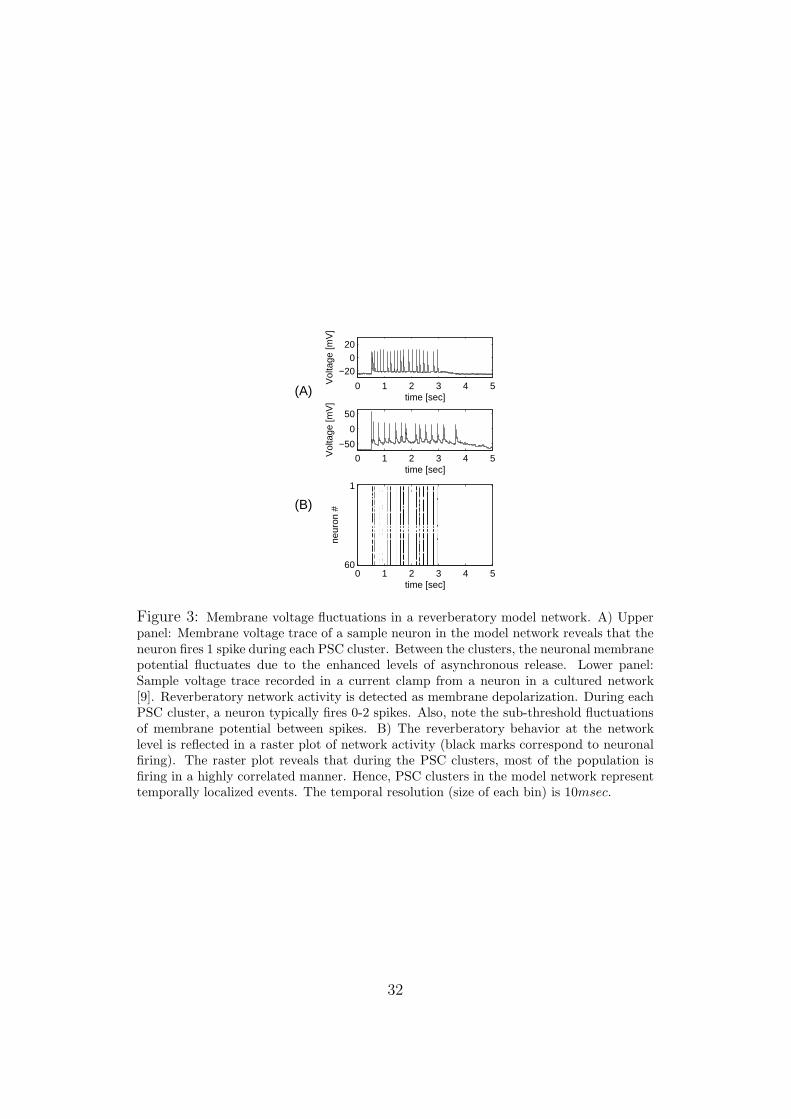
Figure 3: Membrane voltage fluctuations in a reverberatory model network. A) Upperpanel: Membrane voltage trace of a sample neuron in the model network reveals that theneuron fires 1 spike during each PSC cluster. Between the clusters, the neuronal membranepotential fluctuates due to the enhanced levels of asynchronous release. Lower panel:Sample voltage trace recorded in a current clamp from a neuron in a cultured network[9]. Reverberatory network activity is detected as membrane depolarization. During eachPSC cluster, a neuron typically fires 0-2 spikes. Also, note the sub-threshold fluctuationsof membrane potential between spikes. B) The reverberatory behavior at the networklevel is reflected in a raster plot of network activity (black marks correspond to neuronalfiring). The raster plot reveals that during the PSC clusters, most of the population isfiring in a highly correlated manner. Hence, PSC clusters in the model network representtemporally localized events. The temporal resolution (size of each bin) is 10msec.
32
0.1 0.5 5 5015
10
20
30
40
50
τl [sec]
dura
tion
[sec
]
τs=10 sec
τs=5 sec
0 3 6 9 12 15 18
−30−20−10
0
PS
C [µ
A/c
m2 ]
(B) τl=1 sec
0 3 6 9 12 15 18
−30−20−10
0
PS
C [µ
A/c
m2 ]
(C) τl=5 sec
0 3 6 9 12 15 18−40
−20
0
time [sec]
PS
C [µ
A/c
m2 ]
(D) τl=12.5 sec
(A)
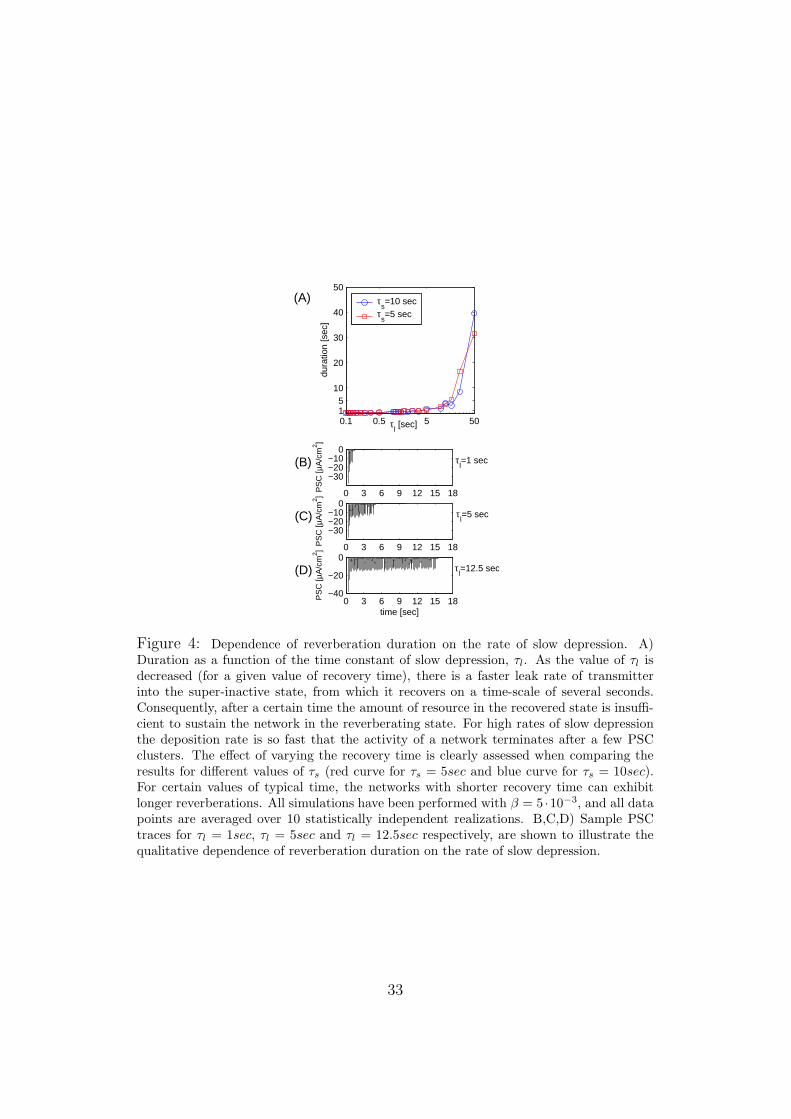
Figure 4: Dependence of reverberation duration on the rate of slow depression. A)Duration as a function of the time constant of slow depression, τl. As the value of τl isdecreased (for a given value of recovery time), there is a faster leak rate of transmitterinto the super-inactive state, from which it recovers on a time-scale of several seconds.Consequently, after a certain time the amount of resource in the recovered state is insuffi-cient to sustain the network in the reverberating state. For high rates of slow depressionthe deposition rate is so fast that the activity of a network terminates after a few PSCclusters. The effect of varying the recovery time is clearly assessed when comparing theresults for different values of τs (red curve for τs = 5sec and blue curve for τs = 10sec).For certain values of typical time, the networks with shorter recovery time can exhibitlonger reverberations. All simulations have been performed with β = 5 ·10−3, and all datapoints are averaged over 10 statistically independent realizations. B,C,D) Sample PSCtraces for τl = 1sec, τl = 5sec and τl = 12.5sec respectively, are shown to illustrate thequalitative dependence of reverberation duration on the rate of slow depression.
33
1 5 10 50
1
2
5
10
20
40
β [*10−3]
dura
tion
[sec
]
0 2 4 6 8 10−50
0
PS
C [µ
A/c
m2 ]
(B) β=6⋅10−3
0 2 4 6 8 10−50
0
PS
C [µ
A/c
m2 ]
(C) β=10−2
0 2 4 6 8 10−50
0
time [sec]
PS
C [µ
A/c
m2 ]
(D) β=2⋅10−2
(A)
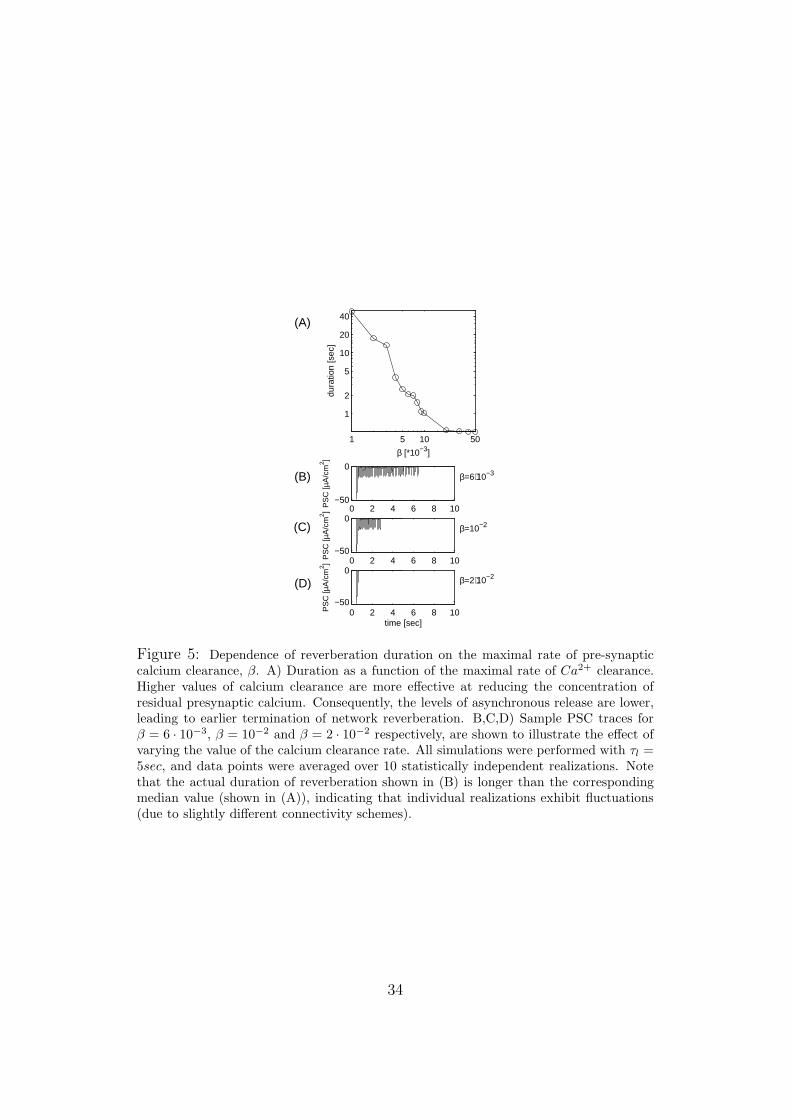
Figure 5: Dependence of reverberation duration on the maximal rate of pre-synapticcalcium clearance, β. A) Duration as a function of the maximal rate of Ca2+ clearance.Higher values of calcium clearance are more effective at reducing the concentration ofresidual presynaptic calcium. Consequently, the levels of asynchronous release are lower,leading to earlier termination of network reverberation. B,C,D) Sample PSC traces forβ = 6 · 10−3, β = 10−2 and β = 2 · 10−2 respectively, are shown to illustrate the effect ofvarying the value of the calcium clearance rate. All simulations were performed with τl =5sec, and data points were averaged over 10 statistically independent realizations. Notethat the actual duration of reverberation shown in (B) is longer than the correspondingmedian value (shown in (A)), indicating that individual realizations exhibit fluctuations(due to slightly different connectivity schemes).
34
0.40.6
0.8 0.050.15
0.25
1
2
3
ηmaxu
dura
tion
[sec
]
(A)
0.3 0.4 0.5 0.6 0.7 0.8
123
dura
tion
[sec
]
ηmax
=0.29
u
(B)
0.05 0.1 0.15 0.2 0.25 0.3
1
2
3
dura
tion
[sec
]
u=0.35
ηmax
(C)
0.3 0.4 0.5 0.6 0.7 0.8
10
15
freq
uenc
y [H
z]
ηmax
=0.29
u
(D)
0.05 0.1 0.15 0.2 0.25 0.3
10152025
freq
uenc
y [H
z]
u=0.3
ηmax
(E)
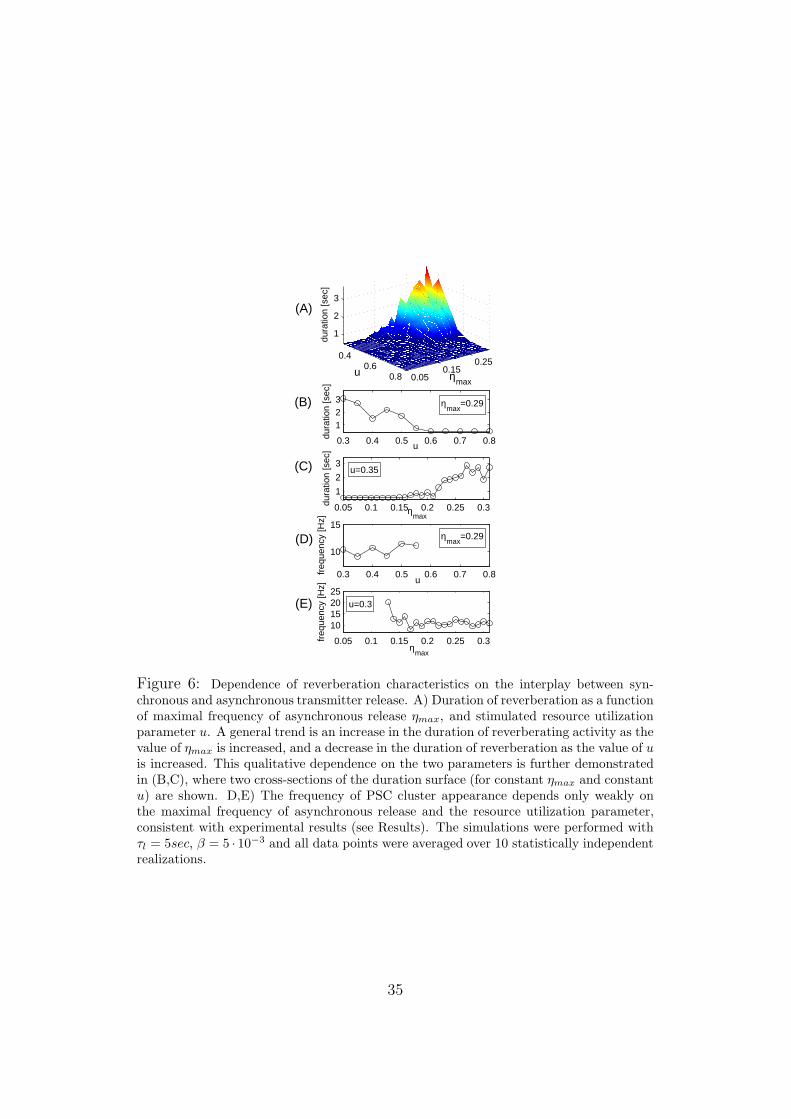
Figure 6: Dependence of reverberation characteristics on the interplay between syn-chronous and asynchronous transmitter release. A) Duration of reverberation as a functionof maximal frequency of asynchronous release ηmax, and stimulated resource utilizationparameter u. A general trend is an increase in the duration of reverberating activity as thevalue of ηmax is increased, and a decrease in the duration of reverberation as the value of u
is increased. This qualitative dependence on the two parameters is further demonstratedin (B,C), where two cross-sections of the duration surface (for constant ηmax and constantu) are shown. D,E) The frequency of PSC cluster appearance depends only weakly onthe maximal frequency of asynchronous release and the resource utilization parameter,consistent with experimental results (see Results). The simulations were performed withτl = 5sec, β = 5 · 10−3 and all data points were averaged over 10 statistically independentrealizations.
35
0 1 2 3 4 5time [sec]
(B)u=0.4η
max=0.24
u=0.3η
max=0.24
u=0.3η
max=0.31
0 2 4 6 8 10time [sec]
(A)[Ca
2+]=3mM
[Sr2+
]=0mM
[Ca2+
]=1.5mM[Sr
2+]=0mM
[Ca2+
]=1.5mM
[Sr2+
]=1.5mM
0 1 2 3 4 5time [sec]
(D)u=0.4η
max=0.24
u=0.45η
max=0.31
u=0.6
ηmax
=0.31
0 1 2 3 4 5time [sec]
(C)[Ca
2+]=2mM
[Sr2+
]=0mM
[Ca2+
]=2mM
[Sr2+
]=1mM
[Ca2+
]=5mM
[Sr2+
]=1mM
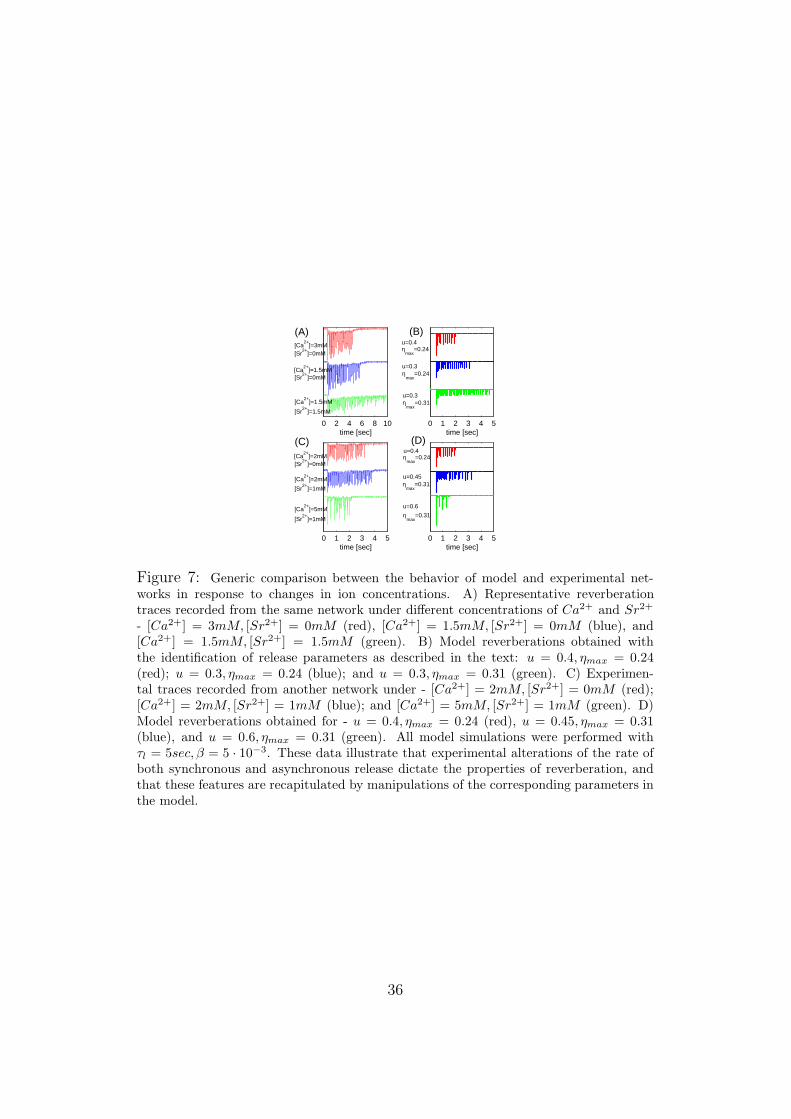
Figure 7: Generic comparison between the behavior of model and experimental net-works in response to changes in ion concentrations. A) Representative reverberationtraces recorded from the same network under different concentrations of Ca2+ and Sr2+
- [Ca2+] = 3mM, [Sr2+] = 0mM (red), [Ca2+] = 1.5mM, [Sr2+] = 0mM (blue), and[Ca2+] = 1.5mM, [Sr2+] = 1.5mM (green). B) Model reverberations obtained withthe identification of release parameters as described in the text: u = 0.4, ηmax = 0.24(red); u = 0.3, ηmax = 0.24 (blue); and u = 0.3, ηmax = 0.31 (green). C) Experimen-tal traces recorded from another network under - [Ca2+] = 2mM, [Sr2+] = 0mM (red);[Ca2+] = 2mM, [Sr2+] = 1mM (blue); and [Ca2+] = 5mM, [Sr2+] = 1mM (green). D)Model reverberations obtained for - u = 0.4, ηmax = 0.24 (red), u = 0.45, ηmax = 0.31(blue), and u = 0.6, ηmax = 0.31 (green). All model simulations were performed withτl = 5sec, β = 5 · 10−3. These data illustrate that experimental alterations of the rate ofboth synchronous and asynchronous release dictate the properties of reverberation, andthat these features are recapitulated by manipulations of the corresponding parameters inthe model.
36

0 1 2 3 4
−30
−20
−10
0
PS
C [µ
A/c
m2 ]
(B)
time [sec]
β=5⋅10−3
τl=5 sec
ηmax
=0.28
I=14µ A/cm2
0 20 40 60
−60
−40
−20
0
time [sec]
PS
C [µ
A/c
m2 ](A) β=4⋅10−3
τl=2.5 sec
ηmax
=0.32
I=14µ A/cm2
0 1 2 3 4−40
−30
−20
−10
0
PS
C [µ
A/c
m2 ]
(C)
time [sec]
β=4⋅10−3
τl=2.5 sec
ηmax
=0.32
I=15µ A/cm2
Figure 8: The effect of enhanced excitability on network activity. A) Spontaneousoutbreaks of reverberatory activity could be observed when the constraint on synapticstrength was relaxed. Parameters used: u = 0.4, ηmax = 0.28, τl = 5sec, β = 5 · 10−3
and I = 14 µAcm2 . Mean synaptic strength is as indicated in the Table, but no constraint
was used to obtain the values of absolute synaptic strength. B) In a typical simulation,a brief stimulation led to reverberatory activity lasting for several seconds. Parametersused: u = 0.4, ηmax = 0.32, β = 4 · 10−3, τl = 2.5sec, I = 14 µA
cm2 . Synaptic strengthdistribution was constrained as described in Methods. C) With an elevated value ofbackground current (I = 15 µA
cm2 , other parameters are the same as in (B)), simulationwith an otherwise identical set of model parameters resulted in the appearance of periodsof uncoordinated activity.
37
0 1 2 3 4
−40
−20
0
time [sec]
PS
C [µ
A/c
m2 ](A)
0 1 2 3 40
1
2
time [sec]
Ca2+
[µM
](B)
time [sec]
neur
on n
o.(C)
0 1 2 3 4
1
60
0 1 2 3 4
−40
−20
0
time [sec]
PS
C [µ
A/c
m2 ](E)
0 1 2 3 40
1
2
time [sec]C
a2+ [µ
M]
(F)
time [sec]
neur
on n
o.(G)
0 1 2 3 4
1
60
0 1 2 3 40
20
50
time [sec]
# ac
tive
cells
(D)
0 1 2 3 40
20
50
time [sec]
# ac
tive
cells
(H)
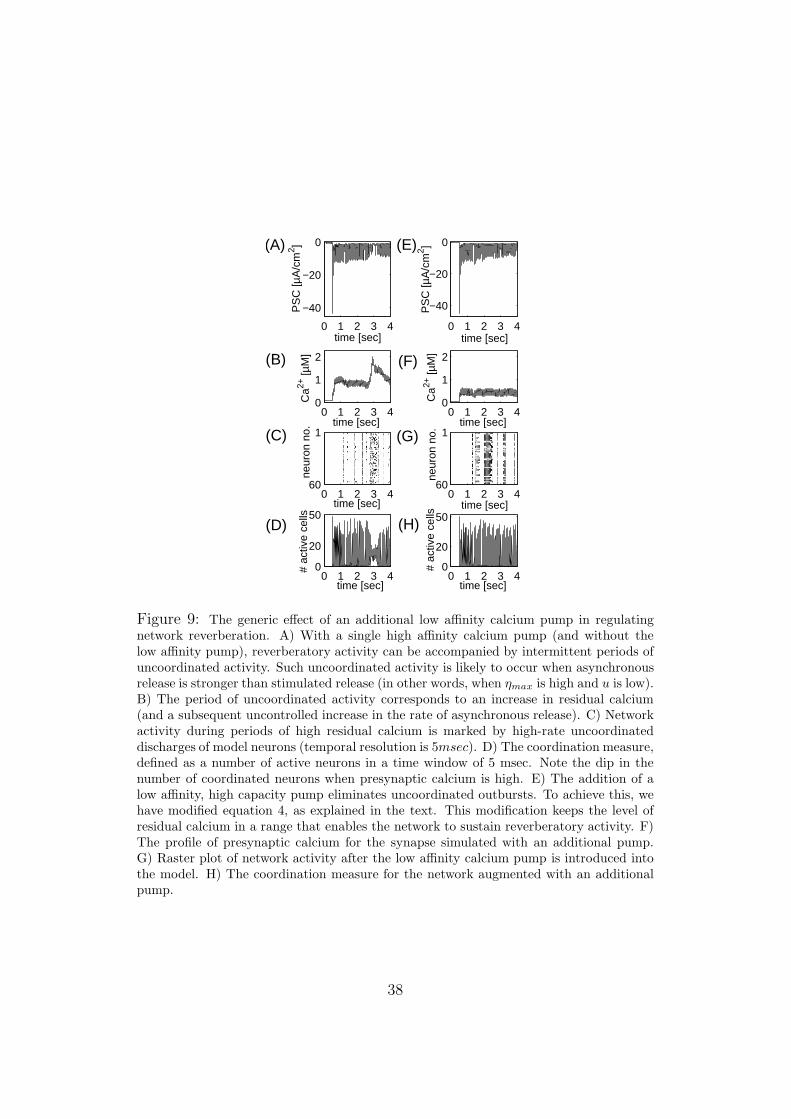
Figure 9: The generic effect of an additional low affinity calcium pump in regulatingnetwork reverberation. A) With a single high affinity calcium pump (and without thelow affinity pump), reverberatory activity can be accompanied by intermittent periods ofuncoordinated activity. Such uncoordinated activity is likely to occur when asynchronousrelease is stronger than stimulated release (in other words, when ηmax is high and u is low).B) The period of uncoordinated activity corresponds to an increase in residual calcium(and a subsequent uncontrolled increase in the rate of asynchronous release). C) Networkactivity during periods of high residual calcium is marked by high-rate uncoordinateddischarges of model neurons (temporal resolution is 5msec). D) The coordination measure,defined as a number of active neurons in a time window of 5 msec. Note the dip in thenumber of coordinated neurons when presynaptic calcium is high. E) The addition of alow affinity, high capacity pump eliminates uncoordinated outbursts. To achieve this, wehave modified equation 4, as explained in the text. This modification keeps the level ofresidual calcium in a range that enables the network to sustain reverberatory activity. F)The profile of presynaptic calcium for the synapse simulated with an additional pump.G) Raster plot of network activity after the low affinity calcium pump is introduced intothe model. H) The coordination measure for the network augmented with an additionalpump.
38