Computational mechanisms underlying social evaluation ...
21
This manuscript is a preprint and has not been peer reviewed Computational mechanisms underlying social evaluation learning and associations with depressive symptoms during adolescence *Jessica K. Bone 1 Alexandra C. Pike 2 Gemma Lewis 1 Glyn Lewis 1 Sarah-Jayne Blakemore 2,3 Jonathan P. Roiser 2 1 Division of Psychiatry, University College London 2 Instute of Cognive Neuroscience, University College London 3 Department of Psychology, University of Cambridge *Corresponding author: [email protected] Abstract There is a sharp increase in depression in adolescence, but why this occurs is not well understood. We invesgated how adolescents learn about social evaluaon and whether learning is associated with depressive symptoms. In a cross-seconal school-based study, 598 adolescents (aged 11-15 years) completed a social evaluaon learning task and the short Mood and Feelings Quesonnaire. We developed and validated reinforcement learning models, formalising the processes hypothesised to underlie learning about social evaluaon. Adolescents started the learning task with a posive expectaon that they and others would be liked, and this posive bias was larger for the self than others. Expectaons about the self were more resistant to feedback than expectaons about others. Only inial expectaons were associated with depressive symptoms; adolescents whose expectaons were less posive had more severe symptoms. Consistent with cognive theories, prior beliefs about social evaluaon may be a risk factor for depressive symptoms. 1
-
Upload
khangminh22 -
Category
Documents
-
view
1 -
download
0
Transcript of Computational mechanisms underlying social evaluation ...

This manuscript is a preprint and has not been peer reviewed
Computational mechanisms underlying social evaluation learning and associations with depressive symptoms during adolescence
*Jessica K. Bone1
Alexandra C. Pike2
Gemma Lewis1
Glyn Lewis1
Sarah-Jayne Blakemore2,3
Jonathan P. Roiser2
1 Division of Psychiatry, University College London2 Institute of Cognitive Neuroscience, University College London3 Department of Psychology, University of Cambridge
*Corresponding author: [email protected]
Abstract
There is a sharp increase in depression in adolescence, but why this occurs is not well understood. We investigated how adolescents learn about social evaluation and whether learning is associated with depressive symptoms. In a cross-sectional school-based study, 598 adolescents (aged 11-15 years) completed a social evaluation learning task and the short Mood and Feelings Questionnaire. We developed and validated reinforcement learning models, formalising the processes hypothesisedto underlie learning about social evaluation. Adolescents started the learning task with a positive expectation that they and others would be liked, and this positive bias was larger for the self than others. Expectations about the self were more resistant to feedback than expectations about others.Only initial expectations were associated with depressive symptoms; adolescents whose expectations were less positive had more severe symptoms. Consistent with cognitive theories, priorbeliefs about social evaluation may be a risk factor for depressive symptoms.
1

This manuscript is a preprint and has not been peer reviewed
Introduction
In order to have successful social relationships, it is useful to understand what others believe about us. Judgements about a person’s character, worth, and status are types of social evaluation, and maybe particularly important during adolescence. Adolescence is a period of physical, psychological, and social transition between childhood and adulthood spanning 10 to 24 years of age (1). Adolescents spend increasing amounts of time with their peers, whose beliefs strongly influence their evaluationsof their own worth (2–4). However, learning about social evaluation may be difficult and, in ambiguous situations, there is potential for bias. When learning about what others think of them, individuals may well be influenced by what they themselves believe. In general, adults exhibit consistent positive biases, making assumptions that they are liked (5–8). According to cognitive models of depression, less positive biases are a risk factor for depression (9,10). Reductions in these positive self-referential biases could lead to more negative interpretations of social interactions, more negative self-esteem, more negative mood, and social withdrawal, all of which are symptoms of depression. Consistent with this, there is evidence from a social evaluation learning task, which simulates social interactions, that adults are better at learning they are liked than disliked (6). This positive self-referential bias decreases with increasing social anxiety and depressive symptoms(6,7,11).
It is unclear whether adolescents demonstrate the same positive biases as healthy adults. Self-evaluations become more negative from early adolescence (aged 12-14 years) to mid-adolescence (aged 15-17 years), and mid-adolescents are more negatively influenced by comparing themselves topeers than late adolescents (aged 18-25 years; 12). Adolescents may also react more negatively to peer rejection and evaluation than adults (13–15). Coupled with the continuing development of the self-concept during adolescence (16), this raises the possibility that adolescents do not demonstrate robust positive biases during social interactions. There is some evidence that late adolescents have positive biases, predicting that peers will like them, whereas early adolescents may make fewer predictions that they will be liked, suggesting that positive biases develop throughout adolescence(17–22). Additionally, late adolescents with more severe depressive symptoms or lower self-esteem report being less certain that peers will like them (18,19,23). However, all these studies have measured adolescents’ predictions before interacting with peers, rather than testing how they learn during interactions. Assessing behaviour during learning is arguably more valid and useful than assessing how individuals predict that they will behave. This is particularly important as automatic processing of social evaluation may involve different cognitive mechanisms to explicit expectations(10,24,25).
Computational models can help to provide insight into the cognitive processes underlying learning. The framework of reinforcement learning can be used to model how individuals learn to gain positive feedback and avoid negative feedback, incrementally improving their choices to achieve the best outcome (26,27). These processes might be important for maintaining a positive self-referential bias. Reinforcement learning models of a social evaluation learning task have shown that adults update their expectations differently for learning about the self and others, and place more weight on positive information (28). However, reinforcement learning may differ between adolescence and adulthood, and even between different periods within adolescence (29–35). The capacity to represent the mental states of others and abstract social goals improves during adolescence (36,37). From childhood to adulthood, individuals become better at using feedback, and also become less exploratory in their decision making (38). It is less clear how specific aspects of learning, for example learning from positive and negative information, differ across development (38). It is also possible that social reinforcement learning develops differently to non-social reinforcement learning (34), as positive social feedback may become increasingly rewarding throughout adolescence (37). A recent
2

This manuscript is a preprint and has not been peer reviewed
review concluded that “next to nothing” is known about the development of learning about social evaluation during adolescence (30).
Although there is evidence for impairments in reinforcement learning in depression during adulthood (39), very few studies have tested whether reinforcement learning is associated with depressive symptoms in adolescence (30). In one study using a social evaluation learning task, late adolescents with lower self-esteem had a lower expectancy that they were liked, and also had lower learning rates for social evaluation, indicating a reduced tendency to update their expectations in response to social feedback (40). However, it remains unclear whether these biases are associated with depressive symptoms in early and mid-adolescence (around the ages of 10-15). This is a key developmental period in which to understand these processes. There is a sharp increase in the incidence of depression during adolescence, particularly in girls (41,42). Negative biases in learning about social evaluation may be a risk factor for depression, leading to increased depressive symptoms in adolescence, and this risk factor may be more prevalent in girls (43). However, it is unclear whether this risk factor would be present from early adolescence or emerge during adolescence.
We investigated learning about social evaluation in a large cross-sectional study. Adolescents were recruited from two age groups (young and mid-adolescents aged 11-12 and 13-15 years) to study social evaluation learning before and after the gender difference in depression emerges. We had twooverarching aims. First, we aimed to investigate how adolescents learn about social evaluation. To do this, we first analysed participants’ responses on the task to examine behaviour (model-agnostic analyses). We expected adolescents to demonstrate a positive self-referential bias, the magnitude ofwhich would be negatively associated with depressive symptoms. We then developed and validated reinforcement learning models, testing a range of models which formalised the processes hypothesised to be involved in learning about social evaluation. We hypothesised that several parameters would be necessary for reinforcement learning models to adequately describe adolescents’ behaviour, including separate learning rates for self-referential and other-referential information and parameters modelling a positive self-referential bias. Second, we aimed to examine whether the processes underlying learning about social evaluation were associated with gender, age, and depressive symptoms in adolescence. We hypothesised that any parameters relating to the positive self-referential bias and self-referential learning would be associated with depressive symptoms. We therefore also expected these parameters to be associated with gender, in line with the higher prevalence of depressive symptoms in girls during adolescence. Given the lack of previousevidence, we explored whether the processes underlying social evaluation learning changed from early to mid-adolescence but did not have any specific age-related hypotheses.
Results
Participants were recruited from eight diverse mixed-gender secondary schools across London. We sampled from two separate age groups, Year 7 (11-12 years old) and Years 9-10 (13-15 years old). We recorded participants’ age, gender, and school to include as confounders. Given that participantscompleted the study in classes of 2-31 adolescents, we also measured the size of the group in which they were tested. Additionally, participants completed an abbreviated nine-item version of the Raven Standard Progressive Matrices Test to measure non-verbal IQ score (range 0-9, not standardised; 44).
In total, 1829 adolescents were eligible, 687 (38%) of whom had parental consent to participate. Of these, 606 (88%) provided informed assent, 8 (1%) of whom were excluded due to not completing study measures. The final sample consisted of 598 adolescents. Overall, 141 (24%) adolescents were recruited from five schools with low parental consent rates (under 30%) and 457 (76%) adolescents
3

This manuscript is a preprint and has not been peer reviewed
were recruited from three schools with high parental consent rates (over 60%). Participants recruited from schools with low versus high consent did not differ in age, gender, or depressive symptoms, but those from schools with low consent had higher non-verbal IQ score (mean difference (MD)=1.29, 95%CI=0.92-1.66, p<0.001).
Of the 598 participants, 330 (55%) were young adolescents recruited from Year 7 (aged 11-12 years except one aged 13; mean (M)=11.56, standard deviation (SD)=0.50) and 268 (45%) were mid-adolescents from Years 9-10 (aged 13-15 years; M=14.18, SD=0.51). On average, non-verbal IQ score was higher in mid-adolescents (M=4.88, SD=0.12) than young adolescents (M=4.04, SD=0.11; coef=0.84, 95% CI=0.52-1.17, p<0.001). Table 1 shows sample characteristics and social evaluation learning task performance.
Depressive symptoms were measured with the short Mood and Feelings Questionnaire (SMFQ; 45). SMFQ score ranged from 0 to 23 (M=7.05, SD=5.48) in young adolescents and 0 to 26 (M=8.25, SD=5.88) in mid-adolescents. Depressive symptoms were higher in mid- than young adolescents (coef=1.19, 95% CI=0.28-2.11, p=0.01), and higher in girls than boys (coef=2.19, 95% CI=1.28-3.10, p<0.001). There were more depressive symptoms in girls than boys in both age groups (interaction p=0.07).
Task performance
The social evaluation learning task was a two-alternative forced choice task based on probabilistic reinforcement learning (7). Participants learnt whether a person was liked or disliked by a computer character (Figure 1). Learning occurred in two conditions: about the participant themselves (self-referential) or about another person (Taylor; other-referential). There were thus four blocks in this task: self like, self dislike, other like, and other dislike. Participants met a new character every block, and each character was represented by a name on the screen. The name Taylor, and the names of the characters participants met, were chosen to be gender neutral. Participants used trial and error to learn whether the character liked or disliked them (or Taylor) over 20 trials in each block. On each trial, a positive and negative personality characteristic were presented. Participants were asked to choose the word that best corresponded to what the character thought about them or Taylor. They received probabilistic feedback, with 80% contingency, about whether their choice was correct. To initially examine behaviour, we performed model-agonistic analyses of participants’ responses on this task. In these model-agnostic analyses, all models were adjusted for confounders (gender, age, non-verbal IQ score, school, and testing group size). Unadjusted results are included in Tables S2-S4. We then modelled how participants learnt about social evaluation using adaptions of Rescorla-Wagner reinforcement learning models (26).
Positive responses Positive responses were the total number of times participants chose the positive personality characteristic in each block (range 0-20). We first tested how task conditions (exposures) influenced responses (outcome) using multilevel linear regression models. There were 9.36 (95% CI=9.05-9.67, p<0.001) more positive responses in like than dislike rule blocks, demonstrating that participants acquired the task contingencies (Table S2). There was also evidence of a positive self-referential bias.Participants made 0.64 (95% CI=0.33-0.95, p<0.001) more positive responses in self-referential than other-referential blocks, and there was a rule-by-condition interaction (p=0.02, Table S3). Testing theconditions separately, there was a smaller difference in positive responses in like versus dislike blocks in the self-referential (coef=8.97, 95% CI=8.52-9.42) than in the other-referential condition (coef=9.74, 95% CI=9.32-10.17).
4
This manuscript is a preprint and has not been peer reviewed
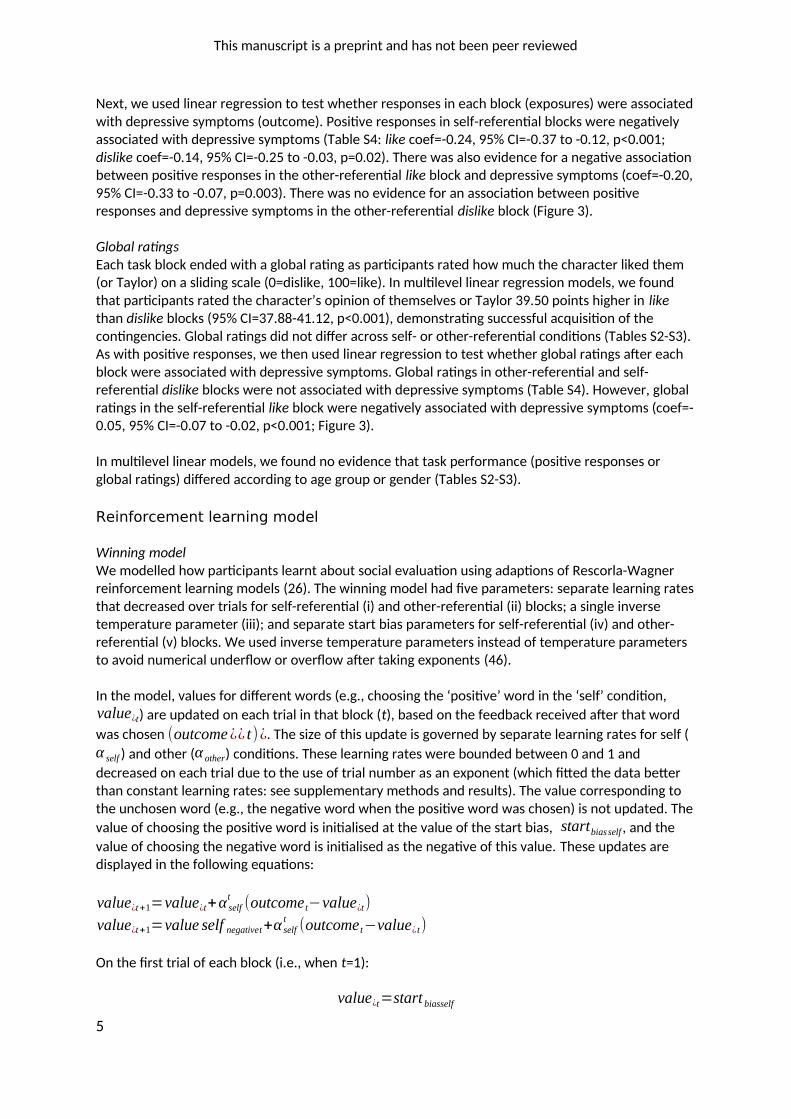
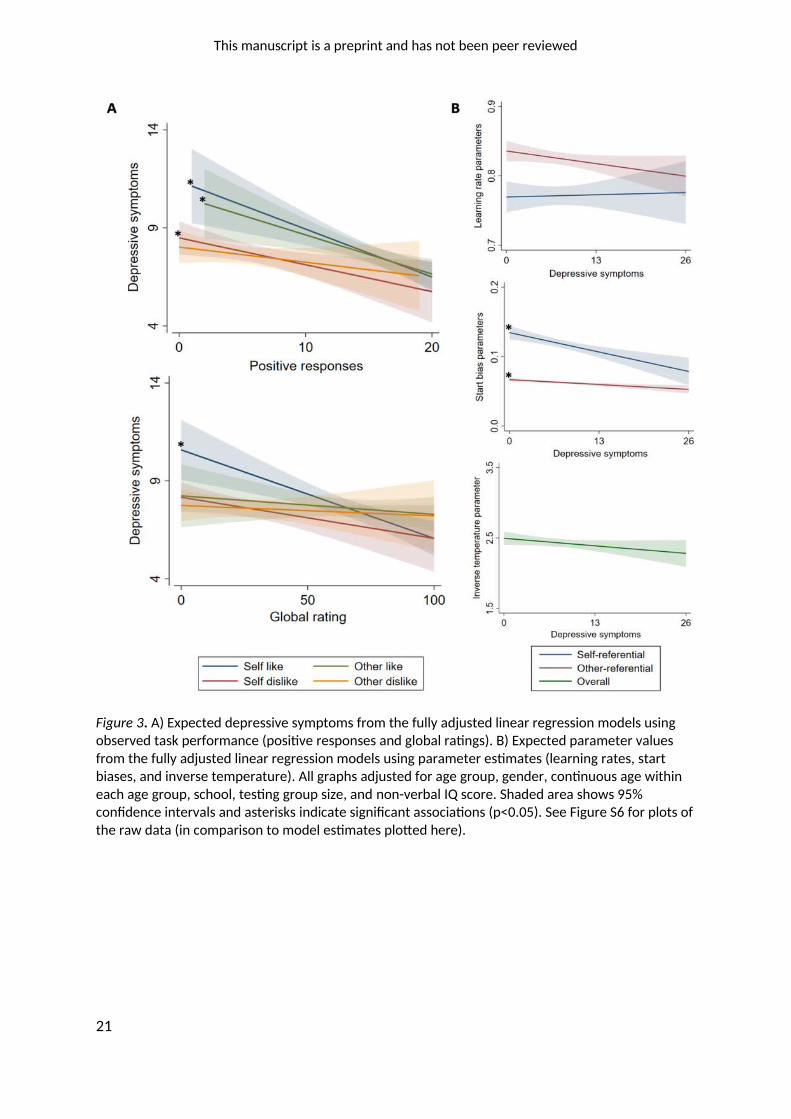
Next, we used linear regression to test whether responses in each block (exposures) were associatedwith depressive symptoms (outcome). Positive responses in self-referential blocks were negatively associated with depressive symptoms (Table S4: like coef=-0.24, 95% CI=-0.37 to -0.12, p<0.001; dislike coef=-0.14, 95% CI=-0.25 to -0.03, p=0.02). There was also evidence for a negative association between positive responses in the other-referential like block and depressive symptoms (coef=-0.20,95% CI=-0.33 to -0.07, p=0.003). There was no evidence for an association between positive responses and depressive symptoms in the other-referential dislike block (Figure 3).
Global ratingsEach task block ended with a global rating as participants rated how much the character liked them (or Taylor) on a sliding scale (0=dislike, 100=like). In multilevel linear regression models, we found that participants rated the character’s opinion of themselves or Taylor 39.50 points higher in like than dislike blocks (95% CI=37.88-41.12, p<0.001), demonstrating successful acquisition of the contingencies. Global ratings did not differ across self- or other-referential conditions (Tables S2-S3). As with positive responses, we then used linear regression to test whether global ratings after each block were associated with depressive symptoms. Global ratings in other-referential and self-referential dislike blocks were not associated with depressive symptoms (Table S4). However, global ratings in the self-referential like block were negatively associated with depressive symptoms (coef=-0.05, 95% CI=-0.07 to -0.02, p<0.001; Figure 3).
In multilevel linear models, we found no evidence that task performance (positive responses or global ratings) differed according to age group or gender (Tables S2-S3).
Reinforcement learning model
Winning modelWe modelled how participants learnt about social evaluation using adaptions of Rescorla-Wagner reinforcement learning models (26). The winning model had five parameters: separate learning ratesthat decreased over trials for self-referential (i) and other-referential (ii) blocks; a single inverse temperature parameter (iii); and separate start bias parameters for self-referential (iv) and other-referential (v) blocks. We used inverse temperature parameters instead of temperature parameters to avoid numerical underflow or overflow after taking exponents (46).
In the model, values for different words (e.g., choosing the ‘positive’ word in the ‘self’ condition,value¿t) are updated on each trial in that block (t), based on the feedback received after that word
was chosen (outcome¿¿ t)¿. The size of this update is governed by separate learning rates for self (
α self ) and other (α other) conditions. These learning rates were bounded between 0 and 1 and
decreased on each trial due to the use of trial number as an exponent (which fitted the data better than constant learning rates: see supplementary methods and results). The value corresponding to the unchosen word (e.g., the negative word when the positive word was chosen) is not updated. The
value of choosing the positive word is initialised at the value of the start bias, startbiasself , and the
value of choosing the negative word is initialised as the negative of this value. These updates are displayed in the following equations:
value¿t+1=value¿t+α selft
(outcome t−value¿t)
value¿t+1=value self negativet+α selft
(outcome t−value¿ t)
On the first trial of each block (i.e., when t=1):
value¿t=start biasself
5

This manuscript is a preprint and has not been peer reviewed
value¿t=−start¿
Learning in the other-referential block can be written equivalently, such that, value¿t becomes
value¿t for example. These values are then passed through a softmax function, with inverse
temperature β, such that the probability that on a particular trial t the participant will choose the positive word is as follows:
Probability¿t=exp (value¿t ∙ β )
exp (value¿ t ∙ β )+exp (value¿t ∙ β )
Again, this can be written equivalently for the other-referential condition.
The initial learning rate for self-referential information (M=0.77, SD=0.17) was smaller than for other-referential information (M=0.82, SD=0.11). This indicates that participants updated their value estimates less for self-referential than other-referential feedback. Additionally, the start bias on self-referential blocks (M=0.12, SD=0.07) was larger than the start bias for other-referential blocks (M=0.06, SD=0.07), signifying that participants had a larger initial positive bias when learning social evaluation about themselves than others. The inverse temperature parameter value (M=2.43, SD=0.75) suggested that participants’ choices were quite deterministic.
Associations between model parameters and age group, gender, and depressive symptomsUsing linear regression models, we tested whether any of the parameters derived from the above model differed between age groups or genders (Table 2). Each exposure was tested in a separate univariable linear regression with the model parameter as the outcome. In unadjusted models, therewas evidence that the inverse temperature parameter increased with age, indicating that older participants’ choices were more deterministic. However, this evidence was attenuated after adjustment for confounders. There was no evidence for associations between age group and other parameters, or any associations with gender.
We then tested whether any of the parameters derived from the above model differed according to depressive symptoms. Depressive symptoms were the exposures and model parameters were the outcomes in separate univariable linear regressions. The learning rate and inverse temperature parameters were not associated with depressive symptoms (Table 2; Figure 3). In contrast, both start bias parameters were negatively associated with depressive symptoms. Adolescents with more severe depressive symptoms were less likely to choose the positive word at the start of both self- and other-referential blocks (Figures 2-3).
Sensitivity analyses: effect of age groupIn the preceding analyses, we assumed that all adolescents represented a single population, with inter-individual variability such that young and mid-adolescents all lie on a continuum in parameter space. This model correctly accounted for 68.11% (SD=11.47%) of young adolescents’ choices versus 69.89% (SD=10.14%) of mid-adolescents’ choices (mean difference (MD)=1.79, 95% CI=0.03-3.55, p=0.05), a significant, albeit small, difference.
To check that this difference had not biased the results, we re-estimated the final model with separate priors, allowing for different means and distributions of parameters in each age group. This marginally improved model evidence (total BIC=57,928, AIC=50,805) compared to estimation with priors for the whole sample (total BIC=57,976, AIC=50,854). This implementation of the model also accounted for the observed choices of mid-adolescents (M=70.56%, SD=9.87%) better than young adolescents (M=68.33%, SD=11.65%; MD=2.23, 95%CI=0.50-3.96, p=0.01).
6

This manuscript is a preprint and has not been peer reviewed
In this implementation, there was no evidence that the self-referential learning rate (MD=0.02, 95% CI=-0.01-0.05, p=0.21) or other-referential start bias (MD=0.002, 95% CI=-0.004-0.01, p=0.44) differed between young versus mid-adolescents. However, the other-referential learning rate was higher in mid-adolescents (M=0.83, SD=0.11) than young adolescents (M=0.81, SD=0.13; MD=0.02, 95% CI=0.004-0.04, p=0.02), and the inverse temperate parameter was higher in mid-adolescents (M=2.58, SD=0.57) than young adolescents (M=2.33, SD=0.84; MD=0.25, 95% CI=0.13-0.37, p<0.001).Additionally, the self-referential start bias parameter was more positive in young adolescents (M=0.13, SD=0.08) than mid-adolescents (M=0.10, SD=0.06; MD=0.03, 95%CI=0.02-0.04, p<0.001). Adjusting for depressive symptoms did not alter the evidence for any of these age differences. In summary, in comparison to young adolescents, mid-adolescents updated their value estimates morefor other-referential feedback, made more deterministic choices, and had a less positive initial self-referential bias.
Using parameter estimates from this implementation of the model, there was still evidence that both start bias parameters were negatively associated with depressive symptoms (self-referential coef=-0.002, 95% CI=-0.003 to -0.001, p<0.001; other-referential coef=-0.001, 95% CI=-0.001 to -0.0001, p=0.03; both associations adjusted for confounders).
Discussion
In this study, we examined the processes underlying learning about social evaluation in adolescence.Consistent with our hypotheses, in model-agnostic analyses of behaviour, we found that adolescentsdemonstrated a positive self-referential bias during learning, as has been shown in adults (6,7). Also as in adults (11), the magnitude of this positive bias was negatively associated with depressive symptoms. We also found evidence that other-referential learning was negatively associated with depressive symptoms, which was not expected. Although participants demonstrated that they had learnt the task rules after each block, they did not rate the character’s opinion of themselves differently to the character’s opinion of another person. This has also been found in adults (7) and may reflect a distinction between biases in learning and more reflective global appraisals after the event, as proposed by dual-process models (25). Adolescents who rated themselves as less liked alsohad more severe depressive symptoms, as in adults (11).
Our reinforcement learning model showed that adolescents started with a positive expectation that they and others would be liked, and this positive bias was larger for the self than others. During learning, adolescents used feedback to update their expectations about social evaluation less for themselves than others. This suggests that adolescents have an initial positive self-referential bias when learning about social evaluation, which is more resistant to feedback than learning about others. Using parameters derived from our reinforcement learning model, we found that adolescents’ initial expectations about whether both they and others were liked were associated with depressive symptoms; adolescents with more severe depressive symptoms were less likely to act as if they and others were liked when meeting a new character. Contrary to previous studies(40), we did not find evidence that other learning processes were associated with depressive symptoms.
Our winning model was similar to the model of this task in adults, as it had separate initial learning rates for self-referential and other-referential evaluation and an initial positive bias parameter (28). However, in contrast to research in adults, we found no evidence that adolescents learnt differently from trials in which the positive or negative word was correct. Adolescents may learn about social evaluation more optimally than adults, learning equally well when outcomes are positive and negative. We also found no evidence that adolescents learnt differently according to whether they
7

This manuscript is a preprint and has not been peer reviewed
made the correct choice (i.e., if feedback was positive or negative). This differs to previous evidence that adolescents learn preferentially from positive, relative to negative, feedback (35,47,48). However, these studies did not use social reinforcement learning paradigms. One study of social reinforcement learning found lower learning rates for positive social feedback in adolescents than children and adults, but did not report whether learning from positive versus negative social feedback differed during adolescence (49). One possibility is that the highly salient nature of peer interactions during adolescence may increase the impact of all aspects of interactions, leading to equal learning from positive and negative feedback. This requires testing in future studies.
Our results indicate that it is prior beliefs that underlie the association between social evaluation learning and depressive symptoms in adolescence, and not other aspects of learning. Importantly, this finding was robust to the modelling approach chosen and adjustment for confounders. This is consistent with evidence that adolescents with higher self-esteem expect to be liked in another social reinforcement learning task (40) and corresponds to predictions about whether peers will like you in previous behavioural studies (18,19,21–23). These beliefs may be learnt during development and then applied to new situations, providing a mechanism through which adverse experiences could lead to depressive symptoms. For example, if an individual is repeatedly exposed to negative social experiences, such as being bullied, they could develop the belief that they are not liked by others. When performing the social evaluation task, these individuals might then have a less positiveprior, making them less likely to learn that they are liked by others. In this study, we cannot demonstrate a causal effect of these processes on depressive symptoms. Our findings are consistent with this hypothesis, as proposed by cognitive models of depression (9,10). However, it is equally possible that changes in depressive symptoms cause changes in the processes underlying learning, or that the association is bidirectional or caused by a third factor. Although the causal direction of these associations remains unclear, this study adds to our understanding of the psychopathology of depression by showing the importance of prior beliefs in social evaluation learning. Longitudinal datais needed to test the hypothesis that adverse experiences lead to less positive beliefs about social evaluation, which are then associated with increases in depressive symptoms during adolescence.
Contrary to our hypotheses, we found no evidence for gender differences in learning about social evaluation. This was surprising given the association between prior beliefs and depressive symptomsand the higher prevalence of depressive symptoms in girls than boys during adolescence. We have previously proposed that gender inequality may cause girls to have more negative self-schema, which could lead to more negative prior beliefs (43). It is possible that girls have more negative self-schema in adolescence, but this was not captured by performance on our social evaluation learning task. However, previous studies have also found no evidence that expectations of, or reactions to, social evaluation differed between boys and girls in adolescence (50–52). This suggests that other mechanisms may contribute to the emergence of the gender difference in depression during adolescence.
We initially found evidence that mid-adolescents made more deterministic (less random) choices than young adolescents, although this was attenuated after adjusting for confounders. This is likely to be because higher non-verbal IQ was associated with more deterministic choices. However, non-verbal IQ might be on the causal pathway, as adolescents with higher IQ might be better at completing the task (thus making less random choices), meaning we could be over-adjusting and obscuring the association with age. However, the age difference in the inverse temperature parameter might also be due to differences in the extent to which the model accurately described learning (35). Inverse temperature parameters might capture noise in estimates, leading to lower values when there is a larger mismatch between performance and model algorithms (35). When modelling the age groups using separate priors, we found that mid-adolescents made more deterministic choices, updated their expectations more for others, and had a less positive initial self-
8

This manuscript is a preprint and has not been peer reviewed
referential bias than young adolescents. These age differences were not a result of increases in depressive symptoms. This in line with evidence that individuals become less exploratory in their decision making (38) and better able to represent the mental states of others and abstract social goals during adolescence (36,37). The reduction in positive self-referential bias with age may occur because self-evaluations become more negative during adolescence (12,42).
This study has several strengths. Our sample was population-based and included participants scoringacross the full range of depressive symptoms, which we analysed continuously. This design boosts statistical sensitivity to detect any associations between learning about social evaluation and depressive symptoms (53). The sample was recruited from eight diverse schools, making it more representative than many previous experimental developmental studies. However, poor parental consent rates in several schools was a limitation. Selection bias may have occurred, as participants had higher non-verbal IQ in schools with low parental consent rates. Nevertheless, most of the sample were from schools with high consent and opt-out consent was used to recruit nearly half of the sample.
In computational analyses, we compared models representing assumptions about different mechanisms underlying behaviour and captured patterns which were not apparent in standard analyses. However, there are some limitations of the winning model. Despite the use of decreasing learning rates over trials, the initial learning exhibited by the model was slower than the observed behaviour. Start biases from the model were smaller than in observed behaviour and, for like blocks,the asymptote of positive choices was a little high. We used a hierarchical approach to parameter fitting that improves estimates, minimising extreme or incorrect parameter assumptions (54,55), butalso requires specification of the population structure of the data. We assumed that young and mid-adolescents represent a single population, which may have led to underestimation of age differences. In simulations, modelling groups separately provides a closer recovery of true effect sizes (55). However, simulations were based on diagnostic groups, whose task performance may differ more substantially than adolescents aged 11-12 versus 13-15 years. Additionally, modelling the age groups using separate priors in a sensitivity analysis did not substantially alter our findings.
In summary, we found robust evidence that adolescents have positive biases in learning what others think about both themselves and others. Reductions in these positive biases are associated with depressive symptoms. Consistent with cognitive models of depression (9,10), less positive beliefs about others’ opinion of the self could lead to a more negative self-image, lower self-esteem, more negative mood, and more negative information available for later rumination. This could in turn result in lower perceived social success and social withdrawal. Despite the gender difference in the prevalence of depressive symptoms, there was no evidence for gender differences in learning about social evaluation. However, we did find evidence for a decrease in positive self-referential biases with age, which was not explained by depressive symptoms, and may be due to the increase in negative self-evaluations during adolescence. Overall, these findings add to our understanding of thepsychopathology of depression in adolescence, indicating that it is adolescents’ prior beliefs that are associated with depressive symptoms, and not their learning rates. If our findings are replicated in longitudinal studies, prevention or treatment strategies for depression could target reinforcement learning processes, such as adolescents’ beliefs about what people will think of them and others, aiming to instil more positive biases.
Methods
ParticipantsParticipants were recruited from eight diverse mixed-gender secondary schools across London. We sampled from two separate age groups, Year 7 (11-12 years old) and Years 9-10 (13-15 years old),
9

This manuscript is a preprint and has not been peer reviewed
maximising power to test gender differences before and after the age at which rates of depression start increasing (42). There were no restrictions on whether adolescents had any mental or physical health problems or were receiving psychotropic medication or psychological therapy. We aimed to recruit 160 girls and 160 boys in each age group (total n=640) so that we had at least 90% power to detect gender differences in choices on the social evaluation learning task of 0.4 standard deviations or more within each age group (α=0.05). Our final sample (n=598) gave us 90% power to detect differences of this magnitude.
Ethical approvalEthical approval was obtained from University College London (project 3453/001). Informed consentwas provided by all parents/carers of participants and informed assent was provided by all participants. Participants’ parents provided informed opt-in or opt-out consent, dependent on the school their child was attending. Only seven (2%) parents chose to opt-out. All procedures complied with the ethical standards of the relevant committees on human experimentation, the Helsinki Declaration (2008 revision), and General Data Protection Regulation. Participants could opt-in to a prize draw to win one of ten £50 Amazon vouchers after completing questionnaires.
Measures
Social evaluation learning taskThis was a two-alternative forced choice task based on probabilistic reinforcement learning (7). Participants learnt whether a person was liked or disliked by a computer character (Figure 1). Learning occurred in two conditions: about the participant themselves (self-referential) or about another person (Taylor; other-referential). There were thus four blocks in this task: self like, self dislike, other like, and other dislike. Participants met a new character every block, and each characterwas represented by a name on the screen. The name Taylor, and the names of the characters participants met, were chosen to be gender neutral. On each trial, a positive and negative word pair was presented (e.g. funny/grumpy). Participants were asked to choose the word that best corresponded to what the character thought about them (self-referential) or Taylor (other-referential). Participants received probabilistic feedback, with 80% contingency, about whether theirchoice was correct. They used trial and error to learn whether the character liked or disliked them (or Taylor) over 20 trials in each block. Blocks ended with a global rating that asked participants to rate how much the character liked them (or Taylor) on a sliding scale (0=dislike, 100=like). We recorded choices (positive versus negative word selected) and feedback on each trial, the number of positive responses during each block, and global rating after each block.
Twenty word pairs were seen for the participant themselves, and 20 for Taylor (see supplementary methods). Words were emotive adjectives describing personality characteristics (e.g. cool/boring, funny/grumpy). Positive and negative words were selected from databases according to their age of acquisition (56–60). The oldest mean age of acquisition of any included word was 8.78 years (SD=1.99). Positive and negative words were paired, matched firstly on age of acquisition. We also aimed to pair semantically linked words, minimise differences in psycholinguistic parameters (number of syllables, usage frequency, meaningfulness, familiarity, arousal), and maximise differences in likeableness, valence, and desirability ratings. The name Taylor, and the names of the characters participants met, were chosen to be gender neutral.
Depressive symptomsParticipants completed the short Mood and Feelings Questionnaire (SMFQ), a 13-item self-report measure of depressive symptoms over the last two weeks (45). Items were rated on a scale of 0-2 (total 0-26), with higher scores indicating greater severity. Missing responses were imputed for
10

This manuscript is a preprint and has not been peer reviewed
participants who responded to 10 or more questions using each individual’s mean SMFQ score per item (n=116, 19%).
ConfoundersWe recorded participants’ age, gender, school, and the size of the group in which they were tested. Participants completed an abbreviated nine-item version of the Raven Standard Progressive Matrices Test (non-verbal IQ score; 48).
ProcedureGroups of 2-31 adolescents used computers, laptops, or tablets to access Gorilla (www.gorilla.sc) in class and complete measures online. After providing informed assent, participants completed a battery of measures, intended for use in several studies. Participants first completed the social evaluation learning task, followed by the Raven Standard Progressive Matrices Test, a recall task, and the SMFQ. We have previously reported performance on the recall task (61).
Statistical analysesTo initially examine behaviour, model-agonistic analyses were performed using Stata 16 (62). We first aimed to test how task conditions, age, and gender influenced responses. We analysed the number of positive responses (range 0-20) and the global rating (range 0-100) in each of the four blocks (self like, self dislike, other like, other dislike). If participants learnt the task rules, we would expect positive responses and global ratings to be higher in like than dislike blocks. Given that the four blocks were clustered within each individual, we used linear multilevel models to analyse responses, with positive responses and global ratings the outcomes in separate models. We includedrandom intercepts for participant, and estimated the task conditions (self/other, like/dislike), demographic variables of interest (age group, gender) and confounders as fixed effects. Next, we aimed to test whether task performance was associated with depressive symptoms. We used linear regression to test whether responses in each block were associated with depressive symptoms. We used linear regression and not multilevel models as depressive symptoms (the outcome) did not varywithin individuals. We included responses in all four blocks in the same model to adjust for overall task performance, for both positive responses and global ratings. Results from these analyses are described in more detail and all models are presented before and after adjustment for confounders in in the supplementary materials (Tables S2-S4).
Reinforcement learning modelsAll reinforcement learning analyses were performed using R version 3.6.0 and RStudio version 1.2.5001, with packages bbmle, boot, reshape2, Hmisc, ggplot2, and RStan (63–72). We aimed to model how participants learnt about social evaluation using adaptions of Rescorla-Wagner reinforcement learning models (26). Each reinforcement learning model consists of two parts, which formalise how participants use feedback to choose between the two possible actions in this task - selecting the positive word or selecting the negative word. The learning model defines how participants learn the value of each action, with values updated on each trial as participants receive feedback. The action model then describes how those values are turned into choices. These models, the fitting procedure, and how we selected a parsimonious model which provided a good fit to the data, are described in more detail in the supplementary materials.
To briefly summarise: we fit different models to the data, which varied in a) whether feedback obtained from choices in different conditions (self vs. other) or to words with different valences (positive vs. negative) had separate learning rates, b) whether learning rates were related to what the participant chose (i.e. if they chose the positive or negative word), the outcome word (i.e. whether the positive or negative word was correct), or the valence of the feedback they received, c) whether learning rates decreased over trials, as participants’ learning reached a plateau rapidly
11

This manuscript is a preprint and has not been peer reviewed
(Figure 2), d) the addition or omission of ‘bias’ parameters, capturing either a tendency at the start of a block to choose the positive/negative word, or a bias throughout the blocks towards positive/negative words (both of which could also be separated by self/other condition). The best-fitting model was determined using a combination of parameter recovery from synthetic data, generative performance (i.e. the extent to which fitted model parameters were able to recapitulate participants’ choices), and model evidence (as summarised using information criteria; 61). During theprocess of determining the best-fitting model, parameters were estimated using a hierarchical maximum a posteriori estimation approach, with multiple initial points and 20 iterations. Once the winning model had been determined, a Markov-Chain Monte-Carlo (MCMC) approach was taken to parameter estimation, which minimises error in parameter recovery (55).
Associations with age group, gender, and depressive symptomsNext, we examined whether any of the processes involved in learning differed by age group, gender, or depressive symptom severity. Using estimates from the winning model, we initially tested whether age group, gender, and depressive symptoms (exposures) were associated with each parameter (outcome) in univariable linear regression models. We then adjusted each model for confounders.
Sensitivity analysis: effect of age groupIn the preceding analyses, we assumed that all adolescents represented a single population, with inter-individual variability such that young and mid-adolescents all lie on a continuum in parameter space. This was based on the lack of previous evidence for age differences in social reinforcement learning from early to mid-adolescence. However, it is possible that young and mid-adolescents are two separate populations, with separate, overlapping, distributions of task performance. To investigate this, we first tested whether generative performance of the winning model differed according to age group. We used an independent samples t-test of the percentage of trials on which simulated choice matched observed choice. We then repeated parameter fitting, using hierarchical MCMC sampling with young and mid-adolescents as two groups with separate priors. We tested whether this was a better model of task performance by using the BIC and AIC and simulating task choices, which we then compared to observed performance. Finally, we examined whether parameter estimates differed across the two age groups using independent sample t-tests.
Author contributionsJKB was responsible for the original study proposal and securing funding, with input from GeL, JR, SJB, and GlL. JKB had overall responsibility for the study management, data collection, and drafting of the manuscript. JKB and ACP performed the analyses. ACP, GeL, JR, SJB, and GlL assisted with planning and interpreting analyses and writing of this manuscript. All authors contributed to, and approved, the final manuscript.
AcknowledgementsWe would like to thank the participants who took part in the study, and the schools and teachers for their help with recruitment. We also thank the students and researchers who assisted with data collection, and Alexandra Hopkins for advice on reinforcement learning modelling of this task.
FundingThis work was supported by an ESRC PhD studentship awarded to JKB. ACP is supported by an MRC Senior Non-Clinical Fellowship awarded to Dr Oliver Robinson (MR/R020817/1). GeL is funded by theNIHR, and GlL by the NIHR and MRC. SJB is funded by Wellcome (WT107496/Z/15/Z), the MRC, the Jacobs Foundation, the Wellspring Foundation, and the University of Cambridge. JPR is supported by
12

This manuscript is a preprint and has not been peer reviewed
the Wellcome Trust. The funders had no role in study design, the collection, analysis and interpretation of data, writing of the report, or the decision to submit the article for publication.
Conflict of interestJKB, GeL, GlL, SJB and JPR report no financial interests or potential conflicts of interest. ACP was the named secondee on an MRC Proximity-to-Discovery award with Roche (who provided in-kind contributions and have sponsored travel).
Data availabilityThe datasets generated during and analysed during the current study are available from the corresponding author on reasonable request.
Code availabilityThe code written and used during the current study is available from the corresponding author on reasonable request.
References1. Sawyer SM, Azzopardi PS, Wickremarathne D, Patton GC (2018): The age of adolescence. Lancet
Child Adolesc Heal 2: 223–228.2. O’Brien SF, Bierman KL (1988): Conceptions and Perceived Influence of Peer Groups: Interviews
with Preadolescents. Child Dev 59: 1360–1365.3. Lam CB, McHale SM, Crouter AC (2014): Time with peers from middle childhood to late
adolescence: Developmental course and adjustment correlates. Child Dev 85: 1677–1693.4. Steinberg L, Silverberg SB (1986): The Vicissitudes of Autonomy in Early Adolescence. Child Dev 57:
841–851.5. Sharot T (2011): The optimism bias. Curr Biol 21: R941–R945.6. Button KS, Browning M, Munafò MR, Lewis G (2012): Social inference and social anxiety: Evidence
of a fear-congruent self-referential learning bias. J Behav Ther Exp Psychiatry 43: 1082–1087.7. Button KS, Kounali DZ, Stapinski L, Rapee RM, Lewis G, Munafò MR (2015): Fear of negative
evaluation biases social evaluation inference: Evidence from a probabilistic learning task. PLoS One 10: 1–15.
8. Roiser JP, Sahakian BJ (2017): Information Processing in Mood Disorders. In: DeRubeis RJ, Strunk DR, editors. The Oxford Handbook of Mood Disorders. Oxford: Oxford University Press. https://doi.org/10.1093/oxfordhb/9780199973965.013.16
9. Beck AT, Bredemeier K (2016): A unified model of depression: Integrating clinical, cognitive, biological, and evolutionary perspectives. Clin Psychol Sci 4: 596–619.
10. Roiser JP, Elliott R, Sahakian BJ (2012): Cognitive mechanisms of treatment in depression. Neuropsychopharmacology 37: 117–36.
11. Hobbs C, Sue J, Kessler D, Munafò MR, Button KS (2018): Social evaluation learning in depression:Evidence of reduced self-referential learning bias using an individual participant data meta-analysis. Poster Presented at MQ Mental Health Science Meeting.
12. van der Aar LPE, Peters S, Crone EA (2018): The development of self-views across adolescence: Investigating self-descriptions with and without social comparison using a novel experimental paradigm. Cogn Dev 48: 256–270.
13. Sebastian CL, Viding E, Williams KD, Blakemore S-J (2010): Social brain development and the affective consequences of ostracism in adolescence. Brain Cogn 72: 134–145.
14. Silk JS, Siegle GJ, Lee KH, Nelson EE, Stroud LR, Dahl RE (2014): Increased neural response to peerrejection associated with adolescent depression and pubertal development. Soc Cogn Affect Neurosci 9: 1798–1807.
15. Somerville LH (2013): The Teenage Brain: Sensitivity to Social Evaluation. Curr Dir Psychol Sci 22:
13

This manuscript is a preprint and has not been peer reviewed
121–127.16. Sebastian CL, Burnett S, Blakemore S-J (2008): Development of the self-concept during
adolescence. Trends Cogn Sci 12: 441–446.17. Van der Molen MJW, Poppelaars ES, Van Hartingsveldt CTA, Harrewijn A, Moor BG, Westenberg
PM (2014): Fear of negative evaluation modulates electrocortical and behavioral responses when anticipating social evaluative feedback. Front Hum Neurosci 7: 1–12.
18. Somerville LH, Kelley WM, Heatherton TF (2010): Self-esteem modulates medial prefrontal cortical responses to evaluative social feedback. Cereb Cortex 20: 3005–3013.
19. Caouette JD, Guyer AE (2016): Cognitive distortions mediate depression and affective response to social acceptance and rejection. J Affect Disord 190: 792–799.
20. Guyer AE, Benson B, Choate VR, Bar-Haim Y, Perez-Edgar K, Jarcho JM, et al. (2014): Lasting associations between early-childhood temperament and late-adolescent reward-circuitry response to peer feedback. Dev Psychopathol 26: 229–243.
21. Gunther Moor B, van Leijenhorst L, Rombouts SARB, Crone EA, van der Molen MW (2010): Do you like me? Neural correlates of social evaluation and developmental trajectories. Soc Neurosci 5: 461–482.
22. Rodman AM, Powers KE, Somerville LH (2017): Development of self-protective biases in responseto social evaluative feedback. Proc Natl Acad Sci U S A 114: 13158–13163.
23. Guyer AE, Lau JYF, McClure-Tone EB, Parrish J, Shiffrin ND, Reynolds RC, et al. (2008): Amygdala and ventrolateral prefrontal cortex function during anticipated peer evaluation in pediatric social anxiety. Arch Gen Psychiatry 65: 1303–1312.
24. Kahneman D (2011): Thinking Fast and Slow. New York: Farrar, Straus and Giroux.25. Strack F, Deutsch R (2004): Reflective and impulsive determinants of social behavior. Personal
Soc Psychol Rev 8: 220–247.26. Rescorla RA, Wagner AR (1972): A theory of Pavlovian conditioning: variations in the
effectiveness of reinforcement and non reinforcement. In: Black A, Prokasy WF, editors. Classical Conditioning II: Current Research and Theory. New York: Appleton-Century-Crofts, pp 64–99.
27. Sutton RS, Barto AG (2018): Reinforcement Learning: An Introduction, 2nd ed. Cambridge, MA: The MIT Press. https://doi.org/10.1080/24699365.1977.11669658
28. Hopkins AK, Dolan RJ, Button KS, Moutoussis M (2019): Reduced positive evidence within activated self-schema may underpin increased sensitivity to negative evaluation in socially anxious individuals. PsyArXiv.
29. Van Der Schaaf ME, Warmerdam E, Crone EA, Cools R (2011): Distinct linear and non-linear trajectories of reward and punishment reversal learning during development: Relevance for dopamine’s role in adolescent decision making. Dev Cogn Neurosci 1: 578–590.
30. Hauser TU, Will GJ, Dubois M, Dolan RJ (2019): Annual Research Review: Developmental computational psychiatry. J Child Psychol Psychiatry Allied Discip 60: 412–426.
31. Cohen JR, Asarnow RF, Sabb FW, Bilder RM, Bookheimer SY, Knowlton BJ, Poldrack RA (2010): A unique adolescent response to reward prediction errors. Nat Neurosci 13: 669–671.
32. Hauser TU, Iannaccone R, Walitza S, Brandeis D, Brem S (2015): Cognitive flexibility in adolescence: Neural and behavioral mechanisms of reward prediction error processing in adaptive decision making during development. Neuroimage 104: 347–354.
33. Davidow JY, Foerde K, Galván A, Shohamy D (2016): An Upside to Reward Sensitivity: The Hippocampus Supports Enhanced Reinforcement Learning in Adolescence. Neuron 92: 93–99.
34. Bolenz F, Reiter AMF, Eppinger B (2017): Developmental changes in learning: Computational mechanisms and social influences. Front Psychol 8: 1–13.
35. Palminteri S, Kilford EJ, Coricelli G, Blakemore S-J (2016): The Computational Development of Reinforcement Learning during Adolescence. PLoS Comput Biol 12: 1–25.
36. Parker JG, Rubin KH, Erath SA, Wojslawowicz JC, Buskirk AA (2006): A developmental psychopathology perspective. In: Cicchetti D, Cohen DJ, editors. Developmental
14

This manuscript is a preprint and has not been peer reviewed
Psychopathology: Theory and Methods (Vol. 1), 2nd ed. New York: Wiley, pp 96–161.37. Davey CG, Yücel M, Allen NB (2008): The emergence of depression in adolescence: development
of the prefrontal cortex and the representation of reward. Neurosci Biobehav Rev 32: 1–19.38. Nussenbaum K, Hartley CA (2019): Reinforcement learning across development: What insights
can we draw from a decade of research? Dev Cogn Neurosci 40: 1–10.39. Halahakoon DC, Kieslich K, O’Driscoll C, Nair A, Lewis G, Roiser JP (2020): Reward Processing
Behaviour in Depression: A Systematic Review and Meta-analysis. JAMA Psychiatry. https://doi.org/10.1001/jamapsychiatry.2020.2139
40. Will GJ, Moutoussis M, Womack PM, Bullmore ET, Goodyer IM, Fonagy P, et al. (2020): Neurocomputational mechanisms underpinning aberrant social learning in young adults with low self-esteem. Transl Psychiatry 10: 1–14.
41. Hankin BL, Abramson LY, Moffitt TE, Silva PA, McGee R, Angell KE (1998): Development of depression from preadolescence to young adulthood: emerging gender differences in a 10-yearlongitudinal study. J Abnorm Psychol 107: 128–140.
42. Kwong ASF, Manley D, Timpson NJ, Pearson RM, Heron J, Sallis H, et al. (2019): Identifying CriticalPoints of Trajectories of Depressive Symptoms from Childhood to Young Adulthood. J Youth Adolesc 48: 815–827.
43. Bone JK, Lewis G, Lewis G (2020): The role of gender inequalities in adolescent depression. The Lancet Psychiatry 7: 471–472.
44. Bilker WB, Hansen JA, Brensinger CM, Richard J, Gur RE, Gur RC (2012): Development of Abbreviated Nine-Item Forms of the Raven’s Standard Progressive Matrices Test. Assessment 19: 354–369.
45. Angold A, Costello EJ, Messer SC, Pickles A (1995): Development of a short questionnaire for use in epidemiological studies of depression in children and adolescents. Int J Methods Psychiatr Res 5: 237–249.
46. Clarke HF, Cardinal RN, Rygula R, Hong YT, Fryer TD, Sawiak SJ, et al. (2014): Orbitofrontal dopamine depletion upregulates caudate dopamine and alters behavior via changes in reinforcement sensitivity. J Neurosci 34: 7663–7676.
47. Christakou A, Gershman SJ, Niv Y, Simmons A, Brammer M, Rubia K (2013): Neural and Psychological Maturation of Decision-making in Adolescence and Young Adulthood. J Cogn Neurosci 25: 1807–1823.
48. Van Den Bos W, Cohen MX, Kahnt T, Crone EA (2012): Striatum-medial prefrontal cortex connectivity predicts developmental changes in reinforcement learning. Cereb Cortex 22: 1247–1255.
49. Jones RM, Somerville LH, Li J, Ruberry EJ, Powers A, Mehta N, et al. (2014): Adolescent-specific patterns of behavior and neural activity during social reinforcement learning. Cogn Affect Behav Neurosci 14: 683–697.
50. Guyer AE, McClure-Tone EB, Shiffrin ND, Pine DS, Nelson EE (2009): Probing the neural correlatesof anticipated peer evaluation in adolescence. Child Dev 80: 1000–1015.
51. Guyer AE, Choate VR, Pine DS, Nelson EE (2012): Neural circuitry underlying affective response topeer feedback in adolescence. Soc Cogn Affect Neurosci 7: 81–92.
52. Guyer AE, Caouette JD, Lee CC, Ruiz SK (2014): Will they like me? Adolescents’ emotional responses to peer evaluation. Int J Behav Dev 38: 155–163.
53. Button KS, Ioannidis JPA, Mokrysz C, Nosek BA, Flint J, Robinson ESJ, Munafò MR (2013): Confidence and precision increase with high statistical power. Nat Rev Neurosci 14: 585.
54. Daw ND (2011): Trial-by-trial data analysis using computational models. In: Delgado MR, Phelps EA, Robbins TW, editors. Decision Making, Affect, and Learning: Attention and Performance XXIII. Oxford: Oxford University Press, pp 3–38.
55. Valton V, Wise T, Robinson OJ (2020): Recommendations for Bayesian hierarchical model specifications for case-control studies in mental health. Machine Learning for Health (ML4H) atNeurIPS 2020, 34th Conference on Neural Information Processing Systems (NeurIPS 2020).
15
This manuscript is a preprint and has not been peer reviewed
56. Brysbaert M, New B (2009): Moving beyond Kučera and Francis: A critical evaluation of current word frequency norms and the introduction of a new and improved word frequency measure for American English. Behav Res Methods 41: 977–990.
57. Grühn D (2016): An English word database of emotional terms (EMOTE). Psychol Rep 119: 290–308.
58. Kučera H, Francis WN (1967): Computational Analysis of Present-Day American English. Dartmouth Publishing Group.
59. Leech G, Rayson P, Wilson A (2014): Word Frequencies in Written and Spoken English: Based on the British National Corpus. London: Routledge.
60. Warriner AB, Kuperman V, Brysbaert M (2013): Norms of valence, arousal, and dominance for 13,915 English lemmas. Behav Res Methods 45: 1191–1207.
61. Bone JK, Lewis G, Roiser JP, Blakemore S-J, Lewis G (2020): Recall bias during adolescence: gender differences and associations with depressive symptoms. J Affect Disord 282: 299–307.
62. StataCorp (2019): Stata Statistical Software: Release 16. College Station, TX: StataCorp LP.63. R Core Team (2019): R: A language and environment for statistical computing. R Foundation for
Statistical Computing, Vienna, Austria.64. RStudio Team (2020): RStudio: Integrated Development for R. RStudio, PBC, Boston, MA.
Retrieved from http://www.rstudio.com/65. Bolker B, R Development Core Team (2020): bbmle: Tools for General Maximum Likelihood
Estimation. R package version 1.0.23.1. Retrieved from https://cran.r-project.org/package=bbmle
66. Canty A, Ripley B (2019): boot: Bootstrap R (S-Plus) Functions. R package version 1.3-24.67. Davison AC, Hinkley D V. (1997): Bootstrap Methods and Their Applications. Cambridge:
Cambridge University Press.68. Wickham H (2007): Reshaping Data with the reshape Package. J Stat Softw 21: 1–20.69. Harrell FEJ (2019): Hmisc: Harrell Miscellaneous. R package version 4.2-0. Retrieved from https://
cran.r-project.org/package=Hmisc70. Wickham H (2016): ggplot2: Elegant Graphics for Data Analysis. Springer-Verlag New York.71. Stan Development Team (2019): RStan: the R interface to Stan. R package version 2.18.2.
Retrieved from http://mc-stan.org/72. Carpenter B, Gelman A, Hoffman MD, Lee D, Goodrich B, Betancourt M, et al. (2017): Stan: A
probabilistic programming language. J Stat Softw 76: 1–32.73. Palminteri S, Wyart V, Koechlin E (2017): The Importance of Falsification in Computational
Cognitive Modeling. Trends Cogn Sci 21: 425–433.
16

This manuscript is a preprint and has not been peer reviewed
Table 1. Demographic characteristics and task performance of adolescents who completed all blocks of the social evaluation learning task.
Young adolescents Mid-adolescents
Boys(n=168)
Girls(n=152)
Boys(n=129)
Girls(n=138)
Mean (SD)
Age (years; range 11-15) 11.57 (0.50) 11.55 (0.51) 14.19 (0.47) 14.16 (0.56)
Raw non-verbal IQ score (range 0-9) 3.82 (2.05) 4.41 (1.87) 4.81 (2.02) 4.97 (2.03)
Depressive symptoms (range 0-26) 6.42 (5.10) 7.80 (5.85) 6.65 (4.94) 9.70 (6.30)
Positive responses (range 0-20)
Self like 14.73 (4.23) 15.95 (3.29) 15.74 (3.52) 15.47 (3.38)
Self dislike 7.05 (4.32) 6.58 (4.22) 6.23 (3.64) 5.98 (4.50)
Other like 14.93 (3.95) 14.82 (3.83) 15.54 (3.40) 15.57 (3.72)
Other dislike 5.72 (3.69) 5.63 (3.70) 5.20 (3.80) 5.22 (3.77)
Global ratings (range 0-100)
Self like64.19 (23.57) 64.70 (21.79) 68.50 (20.35)
66.41(20.83)
Self dislike28.92 (24.72) 25.76 (21.97) 26.84 (19.28)
24.72(18.46)
Other like65.75 (24.25) 66.46 (20.61) 67.57 (19.38)
68.12(19.75)
Other dislike27.66 (23.00) 27.12 (18.01) 27.02 (19.69)
26.01(17.68)
Note. For positive responses, 20 represented perfect performance in like blocks and 0 indicated perfect performance in dislike blocks. For global ratings 0=dislike, 100=like. Gender was missing for 10 young adolescents and 1 mid-adolescent. Age (years) was missing for 1 young adolescent boy. Depressive symptoms (SMFQ score) was missing for 4 young adolescents (3 boys, 1 girl).
17

This manuscript is a preprint and has not been peer reviewed
Table 2. Linear regression models testing associations between age group, gender, and depressive symptoms (exposures) and estimated model parameters (outcomes, tested in separate models).
Unadjusted models Adjusted models
Coef (95% CI)p
valueCoef (95% CI) p value
Self-referential learning rate
Age group 0.02 (-0.01 to 0.04) 0.25 -0.01 (-0.04 to 0.02) 0.70
Gender 0.02 (-0.01 to 0.05) 0.17 0.01 (-0.01 to 0.04) 0.30
Depressive symptoms 0.0005 (-0.002 to 0.003) 0.71 0.0002 (-0.002 to 0.003) 0.84
Other-referential learning rate
Age group 0.01 (-0.003 to 0.03) 0.11 0.01 (-0.01 to 0.03) 0.26
Gender 0.02 (-0.002 to 0.04) 0.07 0.02 (-0.001 to 0.04) 0.06
Depressive symptoms -0.001 (-0.003 to 0.0002) 0.09 -0.001 (-0.003 to 0.0002) 0.08
Inverse temperature
Age group 0.19 (0.07 to 0.31) 0.002 0.09 (-0.04 to 0.22) 0.18
Gender 0.07 (-0.05 to 0.19) 0.26 0.03 (-0.09 to 0.14) 0.66
Depressive symptoms -0.01 (-0.02 to 0.003) 0.19 -0.01 (-0.02 to 0.002) 0.10
Self-referential start bias
Age group -0.005 (-0.02 to 0.01) 0.42 -0.01 (-0.03 to 0.001) 0.07
Gender 0.01 (-0.01 to 0.02) 0.39 0.005 (-0.01 to 0.02) 0.42
Depressive symptoms -0.002 (-0.003 to -0.001) <0.001 -0.002 (-0.003 to -0.001) <0.001
Other-referential start bias
Age group 0.001 (-0.003 to 0.004) 0.69 0.0001 (-0.004 to 0.004) 0.98
Gender 0.001 (-0.002 to 0.005) 0.52 0.001 (-0.003 to 0.005) 0.60
Depressive symptoms -0.001 (-0.001 to -0.0002) 0.001 -0.001 (-0.001 to -0.0002) 0.001
Note. N=598. In unadjusted models, each exposure was tested in a separate univariable linear regression with the model parameter as the outcome. Each model was then adjusted for potential confounders (continuous age within each age group, school, testing group size, and non-verbal IQ score). Gender was missing for 10 participants and depressive symptoms (SMFQ score) were missing for 4 participants.
18

This manuscript is a preprint and has not been peer reviewed
Figure 1. Social Evaluation Learning task. An example of two trials from a self-referential block, in which the computer character is called Sam (character names differed on each block and were chosen to be gender neutral). The participant is learning what Sam thinks of them (self-referential). After viewing a fixation cross, the participant was presented with a positive and negative word pair and instructed to choose the word which best corresponded with what Sam thought about them. They then received feedback about whether their choice was correct (green tick) or incorrect (red cross). Participants used trial and error to learn whether the character liked or disliked them over 20 trials. In the first trial shown here, the participant selected the positive word, which was correct. In the second trial, the participant chose the negative word, which was incorrect. Both trials show true (as opposed to misleading) feedback. Feedback contingency was set at 80%, so that ‘correct’ responses received an 8:2 ratio of positive to negative feedback and ‘incorrect’ responses received an 8:2 ratio of negative to positive feedback.
19

This manuscript is a preprint and has not been peer reviewed
Figure 2. Proportion of participants who chose the positive word on each trial of each block (observed performance). A) Proportion of the whole sample. B) Proportion of participants choosing the positive word according to low versus high depressive symptoms. In order to illustrate this, a median split of depressive symptoms was performed. The solid line indicates participants with low depressive symptoms (SMFQ score ≤ 6; n=302). The dashed line indicates participants with high depressive symptoms (SMFQ score > 6; n=292).
20
This manuscript is a preprint and has not been peer reviewed
Figure 3. A) Expected depressive symptoms from the fully adjusted linear regression models using observed task performance (positive responses and global ratings). B) Expected parameter values from the fully adjusted linear regression models using parameter estimates (learning rates, start biases, and inverse temperature). All graphs adjusted for age group, gender, continuous age within each age group, school, testing group size, and non-verbal IQ score. Shaded area shows 95% confidence intervals and asterisks indicate significant associations (p<0.05). See Figure S6 for plots ofthe raw data (in comparison to model estimates plotted here).
21