Dissociation of Neural Mechanisms Underlying Orientation Processing in Humans
15
1 Dissociation of neural mechanisms underlying orientation processing in humans Sam Ling 1 , Joel Pearson 1,2 & Randolph Blake 1,3 1 Vanderbilt Vision Research Center, Vanderbilt University, Nashville, TN, USA 2 Department of Psychology, University of New South Wales, Sydney, Australia 3 Department of Brain and Cognitive Sciences, Seoul National University, Seoul, South Korea Summary Orientation selectivity is a fundamental, emergent property of neurons in early visual cortex, and discovery of that property [1, 2] dramatically shaped how we conceptualize visual processing [3-6]. However, much remains unknown about the neural substrates of these basic building blocks of perception, and what is known primarily stems from animal physiology studies. To probe the neural concomitants of orientation processing in humans, we employed repetitive transcranial magnetic stimulation (rTMS) to attenuate neural responses evoked by stimuli presented within a local region of the visual field. Previous physiological studies have shown that rTMS can significantly suppress the neuronal spiking activity, hemodynamic responses, and local field potentials within a focused cortical region [7, 8]. By suppressing neural activity with rTMS, we were able to dissociate components of the neural circuitry underlying two distinct aspects of orientation processing: selectivity and contextual effects. Orientation selectivity gauged by masking was unchanged by rTMS, whereas an otherwise robust orientation repulsion illusion was weakened following rTMS. This dissociation implies that orientation processing relies on distinct mechanisms, only one of which was impacted by rTMS. These results are consistent with models positing that orientation selectivity is largely governed by the patterns of convergence of thalamic afferents onto cortical neurons, with intracortical activity then shaping population responses contained within those orientation-selective cortical neurons.
Transcript of Dissociation of Neural Mechanisms Underlying Orientation Processing in Humans
1
Dissociation of neural mechanisms underlying orientation processing in humans Sam Ling1, Joel Pearson1,2 & Randolph Blake1,3 1Vanderbilt Vision Research Center, Vanderbilt University, Nashville, TN, USA 2Department of Psychology, University of New South Wales, Sydney, Australia 3Department of Brain and Cognitive Sciences, Seoul National University, Seoul, South Korea
Summary Orientation selectivity is a fundamental, emergent property of neurons in early visual cortex, and discovery of that property [1, 2] dramatically shaped how we conceptualize visual processing [3-6]. However, much remains unknown about the neural substrates of these basic building blocks of perception, and what is known primarily stems from animal physiology studies. To probe the neural concomitants of orientation processing in humans, we employed repetitive transcranial magnetic stimulation (rTMS) to attenuate neural responses evoked by stimuli presented within a local region of the visual field. Previous physiological studies have shown that rTMS can significantly suppress the neuronal spiking activity, hemodynamic responses, and local field potentials within a focused cortical region [7, 8]. By suppressing neural activity with rTMS, we were able to dissociate components of the neural circuitry underlying two distinct aspects of orientation processing: selectivity and contextual effects. Orientation selectivity gauged by masking was unchanged by rTMS, whereas an otherwise robust orientation repulsion illusion was weakened following rTMS. This dissociation implies that orientation processing relies on distinct mechanisms, only one of which was impacted by rTMS. These results are consistent with models positing that orientation selectivity is largely governed by the patterns of convergence of thalamic afferents onto cortical neurons, with intracortical activity then shaping population responses contained within those orientation-selective cortical neurons.
2
Results Experiment 1: Effect of rTMS on orientation selectivity Our first experiment psychophysically measured orientation-tuning curves for stimuli that fell inside and outside the region of the visual field associated with the retinotopically targeted rTMS. We reasoned that if the neural activity temporarily depressed by rTMS were prominently involved in defining the sharpness of orientation
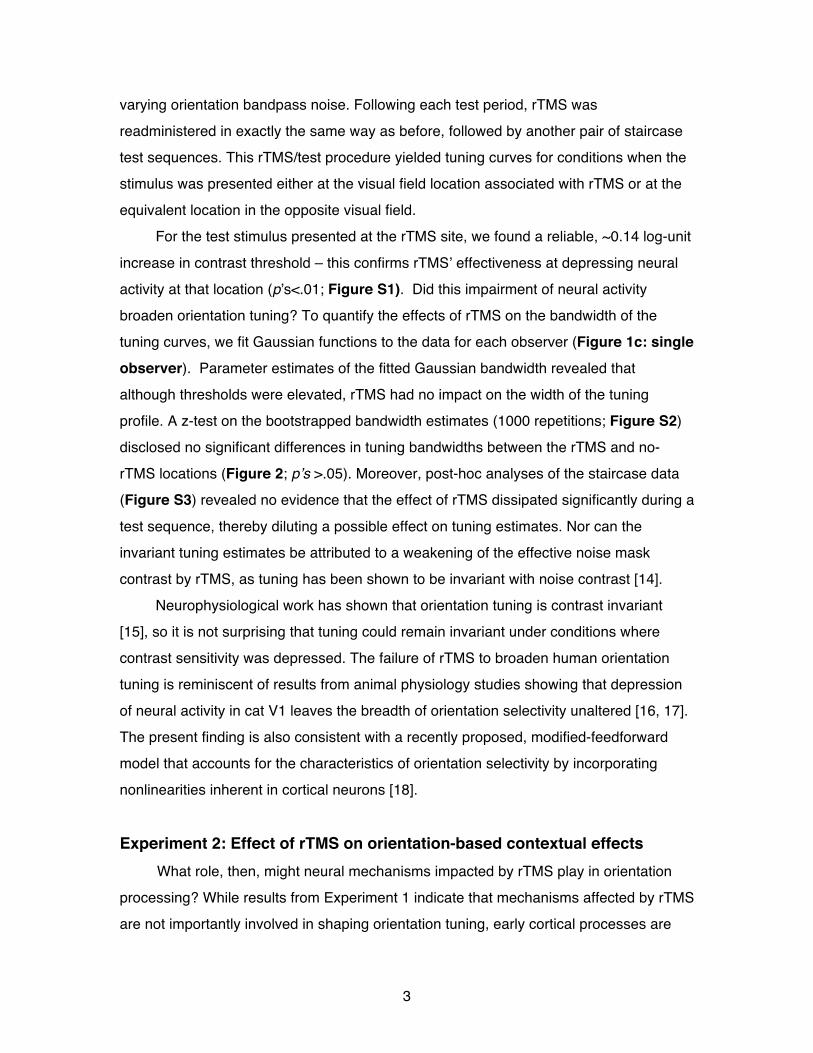
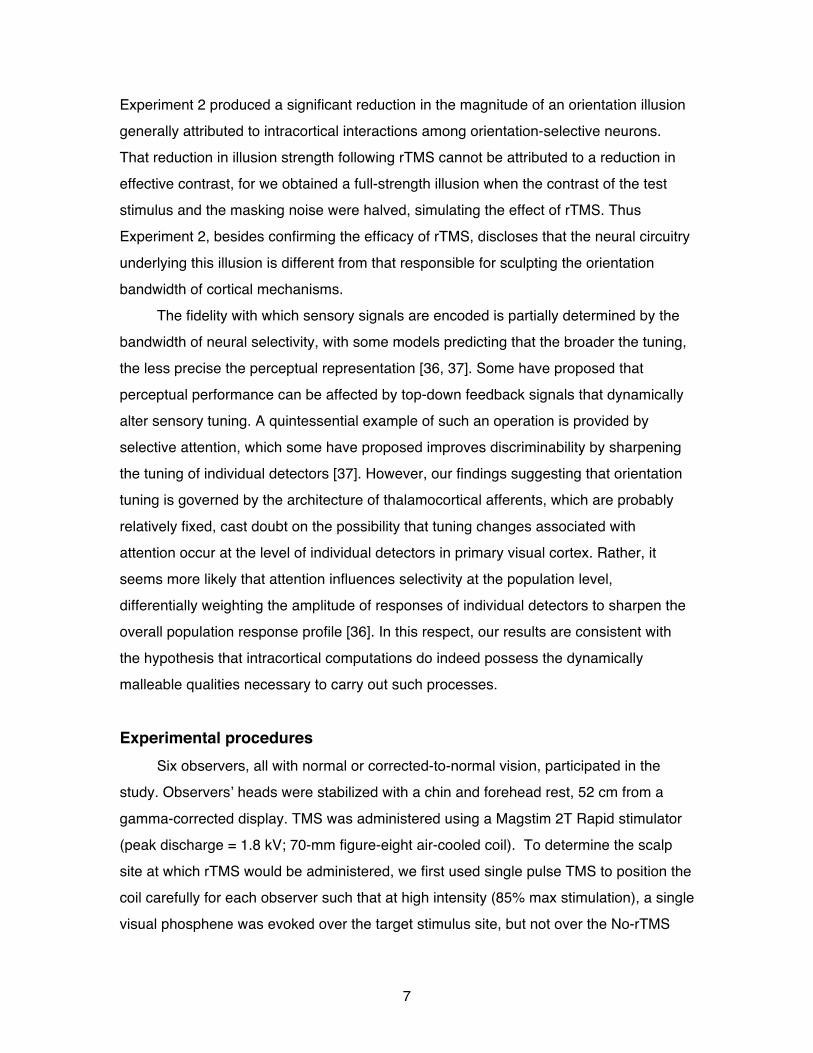
tuning, we should observe broader tuning at the retinotopic site where rTMS was applied; otherwise, the bandwidth of orientation tuning should be immune to rTMS. To obtain psychophysical orientation tuning functions we used a noise masking procedure (Figure 1b) – a well-established, behavioral technique for measuring orientation-tuning curves. With noise masking, the more similar the orientation content of the noise mask is to an embedded test stimulus, the greater the loss in sensitivity for detecting that embedded test [9-13]. This change in sensitivity as a function of noise content yields a psychophysical tuning curve, which allows us to infer the shape and sensitivity of the visual neurons used to detect the test stimulus: the broader the neuronal orientation tuning, the wider the range of noise mask orientations that impede visual sensitivity. This
psychophysical technique has consistently yielded orientation-tuning curves that closely mirror orientation-tuning curves obtained through physiological recordings in visual cortex [9-13]. Before each block of experimental trials, single pulse TMS was used to identify for each observer the precise region over the occipital pole where the TMS coil evoked a punctate, single phosphene at the designated site where visual stimuli were to be presented in the psychophysical experiment. Then, rTMS pulses were administered at that location at 1 Hz for 2.5 minutes, thereby depressing neural activity at a focal, retinotopically-defined site, most certainly including V1 and, in all likelihood, other visual structures innervated by V1 neurons. Immediately following each rTMS episode, a series of test trials was administered. On each trial, a filtered noise patch appeared either at or
remote from the retinotopic region corresponding to the rTMS site (Figure 1a). A grating stimulus was embedded within the upper or lower portion of this noise patch, and the observer reported the location of the grating (2-alternative, forced-choice task). Two interleaved staircases adaptively varied the contrast of the grating presented at the two test sites to estimate observersʼ contrast thresholds for the stimulus embedded within
3
varying orientation bandpass noise. Following each test period, rTMS was readministered in exactly the same way as before, followed by another pair of staircase test sequences. This rTMS/test procedure yielded tuning curves for conditions when the stimulus was presented either at the visual field location associated with rTMS or at the equivalent location in the opposite visual field.
For the test stimulus presented at the rTMS site, we found a reliable, ~0.14 log-unit
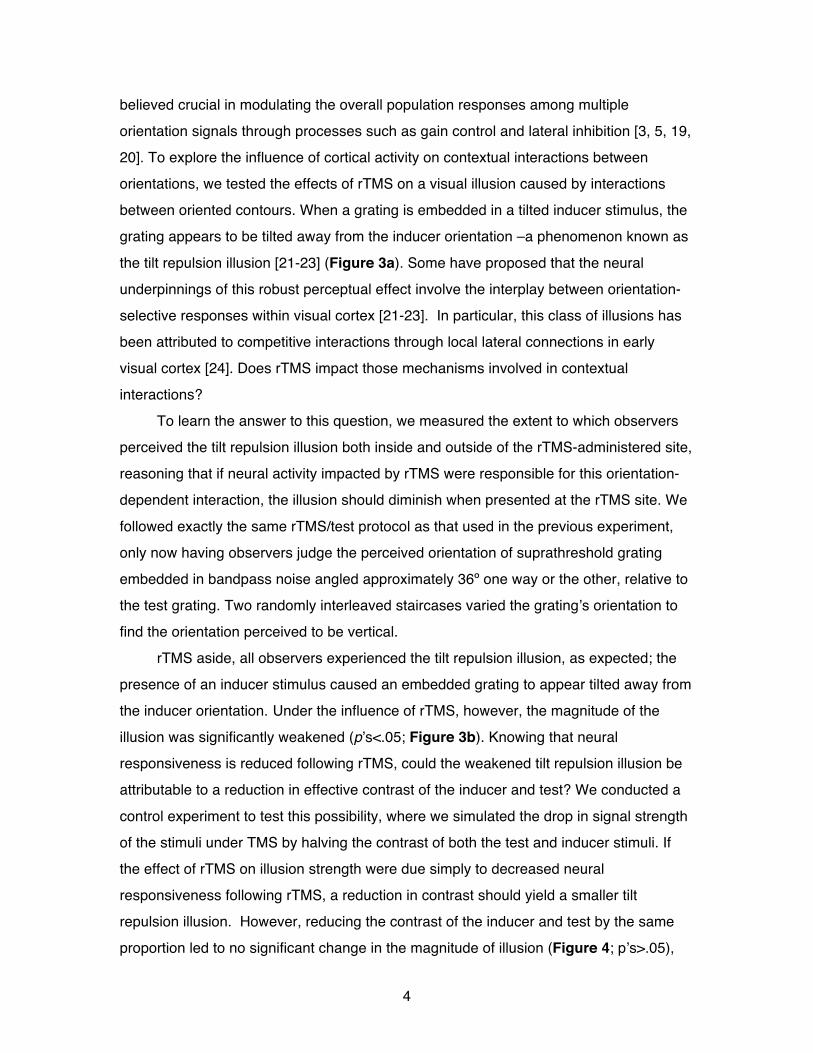
increase in contrast threshold – this confirms rTMSʼ effectiveness at depressing neural activity at that location (pʼs<.01; Figure S1). Did this impairment of neural activity broaden orientation tuning? To quantify the effects of rTMS on the bandwidth of the tuning curves, we fit Gaussian functions to the data for each observer (Figure 1c: single observer). Parameter estimates of the fitted Gaussian bandwidth revealed that although thresholds were elevated, rTMS had no impact on the width of the tuning profile. A z-test on the bootstrapped bandwidth estimates (1000 repetitions; Figure S2) disclosed no significant differences in tuning bandwidths between the rTMS and no-rTMS locations (Figure 2; pʼs >.05). Moreover, post-hoc analyses of the staircase data (Figure S3) revealed no evidence that the effect of rTMS dissipated significantly during a
test sequence, thereby diluting a possible effect on tuning estimates. Nor can the invariant tuning estimates be attributed to a weakening of the effective noise mask contrast by rTMS, as tuning has been shown to be invariant with noise contrast [14].
Neurophysiological work has shown that orientation tuning is contrast invariant [15], so it is not surprising that tuning could remain invariant under conditions where contrast sensitivity was depressed. The failure of rTMS to broaden human orientation tuning is reminiscent of results from animal physiology studies showing that depression of neural activity in cat V1 leaves the breadth of orientation selectivity unaltered [16, 17]. The present finding is also consistent with a recently proposed, modified-feedforward model that accounts for the characteristics of orientation selectivity by incorporating nonlinearities inherent in cortical neurons [18].
Experiment 2: Effect of rTMS on orientation-based contextual effects What role, then, might neural mechanisms impacted by rTMS play in orientation processing? While results from Experiment 1 indicate that mechanisms affected by rTMS are not importantly involved in shaping orientation tuning, early cortical processes are
4
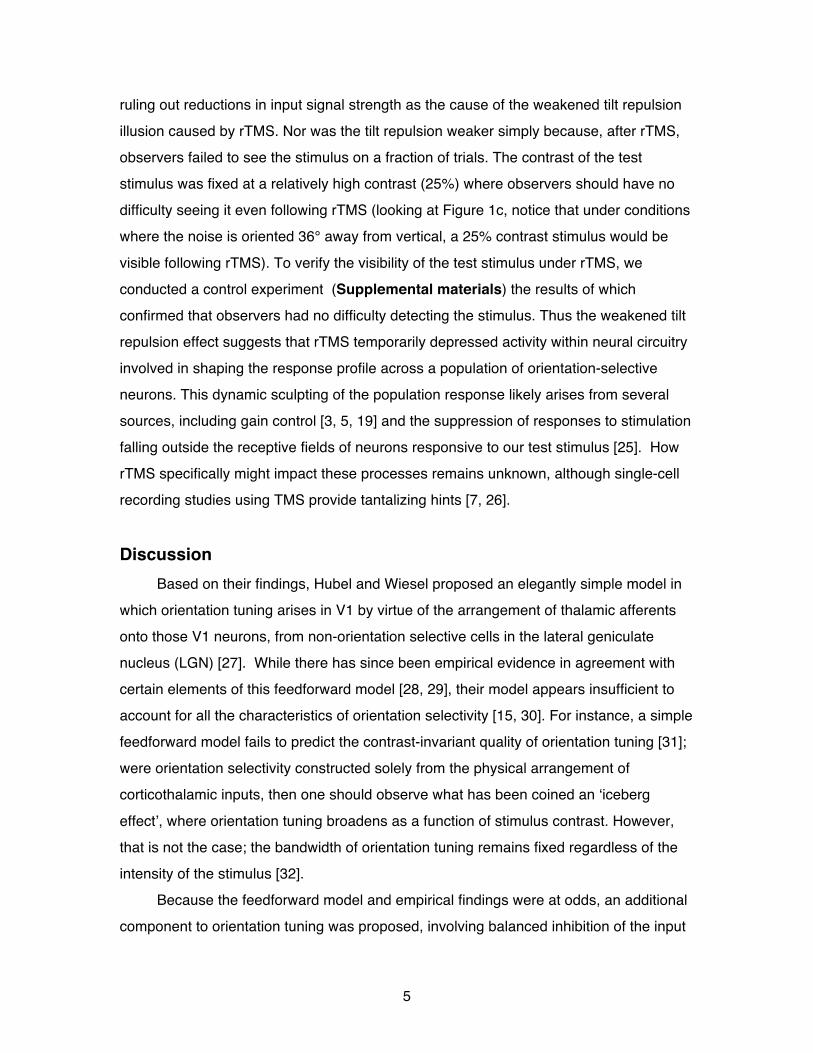
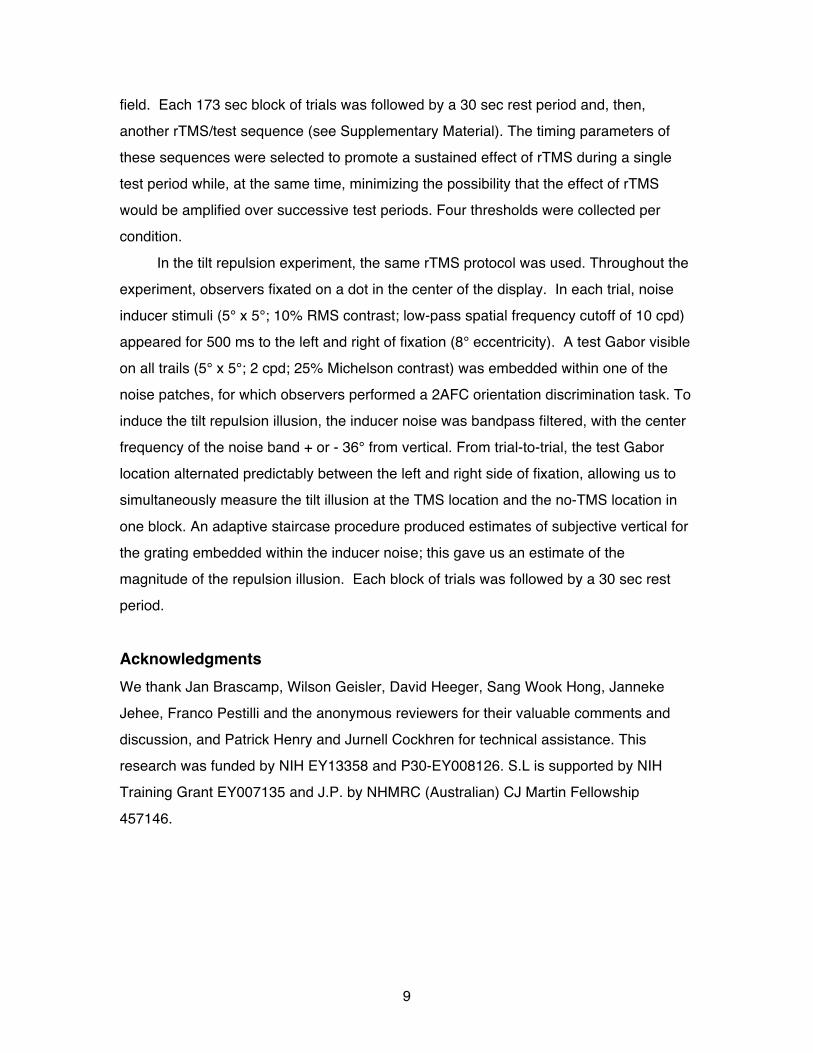
believed crucial in modulating the overall population responses among multiple orientation signals through processes such as gain control and lateral inhibition [3, 5, 19, 20]. To explore the influence of cortical activity on contextual interactions between orientations, we tested the effects of rTMS on a visual illusion caused by interactions between oriented contours. When a grating is embedded in a tilted inducer stimulus, the grating appears to be tilted away from the inducer orientation –a phenomenon known as
the tilt repulsion illusion [21-23] (Figure 3a). Some have proposed that the neural underpinnings of this robust perceptual effect involve the interplay between orientation-selective responses within visual cortex [21-23]. In particular, this class of illusions has been attributed to competitive interactions through local lateral connections in early visual cortex [24]. Does rTMS impact those mechanisms involved in contextual interactions? To learn the answer to this question, we measured the extent to which observers perceived the tilt repulsion illusion both inside and outside of the rTMS-administered site, reasoning that if neural activity impacted by rTMS were responsible for this orientation-dependent interaction, the illusion should diminish when presented at the rTMS site. We
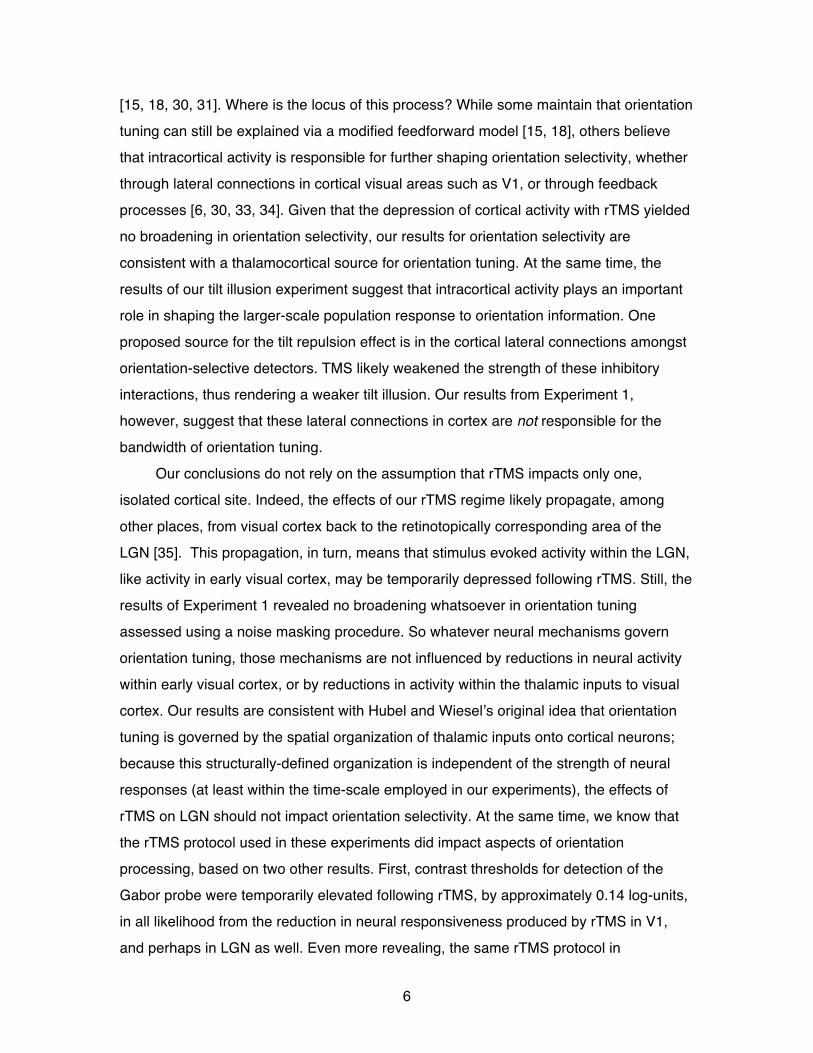
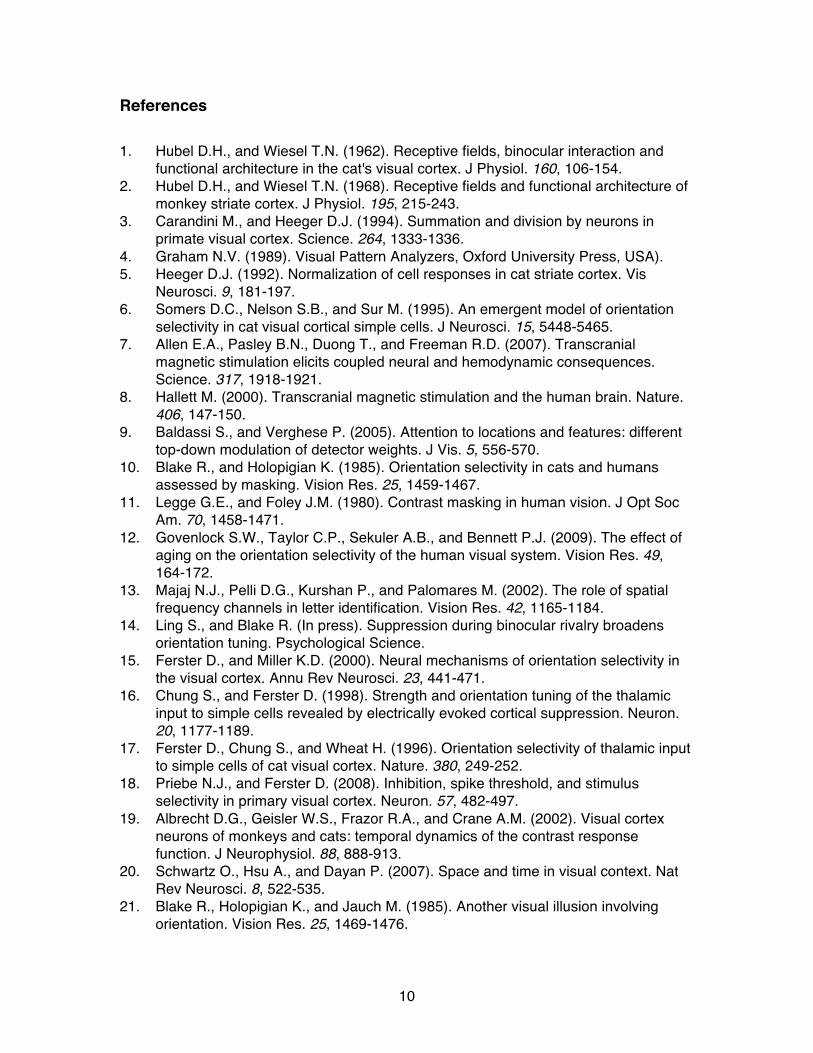
followed exactly the same rTMS/test protocol as that used in the previous experiment, only now having observers judge the perceived orientation of suprathreshold grating embedded in bandpass noise angled approximately 36º one way or the other, relative to the test grating. Two randomly interleaved staircases varied the gratingʼs orientation to find the orientation perceived to be vertical. rTMS aside, all observers experienced the tilt repulsion illusion, as expected; the presence of an inducer stimulus caused an embedded grating to appear tilted away from the inducer orientation. Under the influence of rTMS, however, the magnitude of the illusion was significantly weakened (pʼs<.05; Figure 3b). Knowing that neural responsiveness is reduced following rTMS, could the weakened tilt repulsion illusion be attributable to a reduction in effective contrast of the inducer and test? We conducted a
control experiment to test this possibility, where we simulated the drop in signal strength of the stimuli under TMS by halving the contrast of both the test and inducer stimuli. If the effect of rTMS on illusion strength were due simply to decreased neural responsiveness following rTMS, a reduction in contrast should yield a smaller tilt repulsion illusion. However, reducing the contrast of the inducer and test by the same proportion led to no significant change in the magnitude of illusion (Figure 4; pʼs>.05),
5
ruling out reductions in input signal strength as the cause of the weakened tilt repulsion illusion caused by rTMS. Nor was the tilt repulsion weaker simply because, after rTMS, observers failed to see the stimulus on a fraction of trials. The contrast of the test stimulus was fixed at a relatively high contrast (25%) where observers should have no difficulty seeing it even following rTMS (looking at Figure 1c, notice that under conditions where the noise is oriented 36° away from vertical, a 25% contrast stimulus would be
visible following rTMS). To verify the visibility of the test stimulus under rTMS, we conducted a control experiment (Supplemental materials) the results of which confirmed that observers had no difficulty detecting the stimulus. Thus the weakened tilt repulsion effect suggests that rTMS temporarily depressed activity within neural circuitry involved in shaping the response profile across a population of orientation-selective neurons. This dynamic sculpting of the population response likely arises from several sources, including gain control [3, 5, 19] and the suppression of responses to stimulation falling outside the receptive fields of neurons responsive to our test stimulus [25]. How rTMS specifically might impact these processes remains unknown, although single-cell recording studies using TMS provide tantalizing hints [7, 26].
Discussion Based on their findings, Hubel and Wiesel proposed an elegantly simple model in which orientation tuning arises in V1 by virtue of the arrangement of thalamic afferents onto those V1 neurons, from non-orientation selective cells in the lateral geniculate nucleus (LGN) [27]. While there has since been empirical evidence in agreement with certain elements of this feedforward model [28, 29], their model appears insufficient to account for all the characteristics of orientation selectivity [15, 30]. For instance, a simple feedforward model fails to predict the contrast-invariant quality of orientation tuning [31]; were orientation selectivity constructed solely from the physical arrangement of corticothalamic inputs, then one should observe what has been coined an ʻiceberg
effectʼ, where orientation tuning broadens as a function of stimulus contrast. However, that is not the case; the bandwidth of orientation tuning remains fixed regardless of the intensity of the stimulus [32]. Because the feedforward model and empirical findings were at odds, an additional component to orientation tuning was proposed, involving balanced inhibition of the input
6
[15, 18, 30, 31]. Where is the locus of this process? While some maintain that orientation tuning can still be explained via a modified feedforward model [15, 18], others believe that intracortical activity is responsible for further shaping orientation selectivity, whether through lateral connections in cortical visual areas such as V1, or through feedback processes [6, 30, 33, 34]. Given that the depression of cortical activity with rTMS yielded no broadening in orientation selectivity, our results for orientation selectivity are
consistent with a thalamocortical source for orientation tuning. At the same time, the results of our tilt illusion experiment suggest that intracortical activity plays an important role in shaping the larger-scale population response to orientation information. One proposed source for the tilt repulsion effect is in the cortical lateral connections amongst orientation-selective detectors. TMS likely weakened the strength of these inhibitory interactions, thus rendering a weaker tilt illusion. Our results from Experiment 1, however, suggest that these lateral connections in cortex are not responsible for the bandwidth of orientation tuning.
Our conclusions do not rely on the assumption that rTMS impacts only one, isolated cortical site. Indeed, the effects of our rTMS regime likely propagate, among
other places, from visual cortex back to the retinotopically corresponding area of the LGN [35]. This propagation, in turn, means that stimulus evoked activity within the LGN, like activity in early visual cortex, may be temporarily depressed following rTMS. Still, the results of Experiment 1 revealed no broadening whatsoever in orientation tuning assessed using a noise masking procedure. So whatever neural mechanisms govern orientation tuning, those mechanisms are not influenced by reductions in neural activity within early visual cortex, or by reductions in activity within the thalamic inputs to visual cortex. Our results are consistent with Hubel and Wieselʼs original idea that orientation tuning is governed by the spatial organization of thalamic inputs onto cortical neurons; because this structurally-defined organization is independent of the strength of neural responses (at least within the time-scale employed in our experiments), the effects of
rTMS on LGN should not impact orientation selectivity. At the same time, we know that the rTMS protocol used in these experiments did impact aspects of orientation processing, based on two other results. First, contrast thresholds for detection of the Gabor probe were temporarily elevated following rTMS, by approximately 0.14 log-units, in all likelihood from the reduction in neural responsiveness produced by rTMS in V1, and perhaps in LGN as well. Even more revealing, the same rTMS protocol in
7
Experiment 2 produced a significant reduction in the magnitude of an orientation illusion generally attributed to intracortical interactions among orientation-selective neurons. That reduction in illusion strength following rTMS cannot be attributed to a reduction in effective contrast, for we obtained a full-strength illusion when the contrast of the test stimulus and the masking noise were halved, simulating the effect of rTMS. Thus Experiment 2, besides confirming the efficacy of rTMS, discloses that the neural circuitry
underlying this illusion is different from that responsible for sculpting the orientation bandwidth of cortical mechanisms. The fidelity with which sensory signals are encoded is partially determined by the bandwidth of neural selectivity, with some models predicting that the broader the tuning, the less precise the perceptual representation [36, 37]. Some have proposed that perceptual performance can be affected by top-down feedback signals that dynamically alter sensory tuning. A quintessential example of such an operation is provided by selective attention, which some have proposed improves discriminability by sharpening the tuning of individual detectors [37]. However, our findings suggesting that orientation tuning is governed by the architecture of thalamocortical afferents, which are probably
relatively fixed, cast doubt on the possibility that tuning changes associated with attention occur at the level of individual detectors in primary visual cortex. Rather, it seems more likely that attention influences selectivity at the population level, differentially weighting the amplitude of responses of individual detectors to sharpen the overall population response profile [36]. In this respect, our results are consistent with the hypothesis that intracortical computations do indeed possess the dynamically malleable qualities necessary to carry out such processes.
Experimental procedures Six observers, all with normal or corrected-to-normal vision, participated in the study. Observersʼ heads were stabilized with a chin and forehead rest, 52 cm from a
gamma-corrected display. TMS was administered using a Magstim 2T Rapid stimulator (peak discharge = 1.8 kV; 70-mm figure-eight air-cooled coil). To determine the scalp site at which rTMS would be administered, we first used single pulse TMS to position the coil carefully for each observer such that at high intensity (85% max stimulation), a single visual phosphene was evoked over the target stimulus site, but not over the No-rTMS
8
site [38]. Because the distance between the two stimuli was large (16° center-to-center), there never were instances where the boundaries of a phosphene spread to the other stimulus location, nor did observers ever see paired phosphenes. The coil positioning varied among observers, with the placement ranging from 1-3 cm above the inion and 1-3 cm laterally into the left hemisphere. During the TMS administration periods, the stimulation intensity was reduced below phosphene threshold (60% max stimulation).
To depress cortical activity, we repeatedly applied brief TMS pulses (1 Hz) for 2.5 minutes. Previous physiological studies have shown that these parameters are quite effective in reducing spike rate, hemodynamic response, and local field potentials [7]. After each session of TMS administration, a block of staircase-controlled trials ensued, lasting 173 sec during which observers maintained fixation on a dot in the center of the display. On each trial, a noise patch (5° x 5°; 10% RMS contrast) appeared for 500 ms to the left and right of fixation (8° eccentricity). A test Gabor (4° x 2.5°; 6 cpd) was embedded within the upper or lower portion of one of the noise patches, for which observers performed a 2AFC location discrimination task (upper or lower portion of noise patch). The visual field location of the test Gabor (but not itʼs location within the noise
patch) alternated predictably between the left and right side of fixation; this procedure allowed us to measure sensitivity at the TMS location and the no-TMS location in one block of trials. In control measurements without TMS, we also confirmed that thresholds and tuning estimates were equivalent at these two visual locations. To measure psychophysical orientation-tuning curves, we used the noise-masking technique, in which the noise and probe ranged from being identical in orientation, to the noise orientations being nearly orthogonal to the test Gabor [9-13]. The noise was gaussian white noise that was bandpass filtered in the orientation domain, and the center frequency of this noise band could be 0°-72° from the Gabor orientation. To prevent off-channel looking [10], the noise bandpass orientations were symmetrically angled clockwise and counterclockwise relative to the Gabor orientation. The spatial
frequency content of the noise was low-pass filtered as well, with a cutoff frequency of 10 cpd. Randomly interleaved adaptive staircases (QUEST) produced estimates of contrast thresholds at 75% performance for the stimulus embedded within varying orientation bandpass noise, yielding tuning curves for conditions when the stimulus was presented at the TMS-administered site or at an equivalent site in the contralateral visual
9
field. Each 173 sec block of trials was followed by a 30 sec rest period and, then, another rTMS/test sequence (see Supplementary Material). The timing parameters of these sequences were selected to promote a sustained effect of rTMS during a single test period while, at the same time, minimizing the possibility that the effect of rTMS would be amplified over successive test periods. Four thresholds were collected per condition.
In the tilt repulsion experiment, the same rTMS protocol was used. Throughout the experiment, observers fixated on a dot in the center of the display. In each trial, noise inducer stimuli (5° x 5°; 10% RMS contrast; low-pass spatial frequency cutoff of 10 cpd) appeared for 500 ms to the left and right of fixation (8° eccentricity). A test Gabor visible on all trails (5° x 5°; 2 cpd; 25% Michelson contrast) was embedded within one of the noise patches, for which observers performed a 2AFC orientation discrimination task. To induce the tilt repulsion illusion, the inducer noise was bandpass filtered, with the center frequency of the noise band + or - 36° from vertical. From trial-to-trial, the test Gabor location alternated predictably between the left and right side of fixation, allowing us to simultaneously measure the tilt illusion at the TMS location and the no-TMS location in
one block. An adaptive staircase procedure produced estimates of subjective vertical for the grating embedded within the inducer noise; this gave us an estimate of the magnitude of the repulsion illusion. Each block of trials was followed by a 30 sec rest period.
Acknowledgments We thank Jan Brascamp, Wilson Geisler, David Heeger, Sang Wook Hong, Janneke Jehee, Franco Pestilli and the anonymous reviewers for their valuable comments and discussion, and Patrick Henry and Jurnell Cockhren for technical assistance. This research was funded by NIH EY13358 and P30-EY008126. S.L is supported by NIH Training Grant EY007135 and J.P. by NHMRC (Australian) CJ Martin Fellowship
457146.
10
References 1. Hubel D.H., and Wiesel T.N. (1962). Receptive fields, binocular interaction and
functional architecture in the cat's visual cortex. J Physiol. 160, 106-154. 2. Hubel D.H., and Wiesel T.N. (1968). Receptive fields and functional architecture of
monkey striate cortex. J Physiol. 195, 215-243. 3. Carandini M., and Heeger D.J. (1994). Summation and division by neurons in
primate visual cortex. Science. 264, 1333-1336. 4. Graham N.V. (1989). Visual Pattern Analyzers, Oxford University Press, USA). 5. Heeger D.J. (1992). Normalization of cell responses in cat striate cortex. Vis
Neurosci. 9, 181-197. 6. Somers D.C., Nelson S.B., and Sur M. (1995). An emergent model of orientation
selectivity in cat visual cortical simple cells. J Neurosci. 15, 5448-5465. 7. Allen E.A., Pasley B.N., Duong T., and Freeman R.D. (2007). Transcranial
magnetic stimulation elicits coupled neural and hemodynamic consequences. Science. 317, 1918-1921.
8. Hallett M. (2000). Transcranial magnetic stimulation and the human brain. Nature. 406, 147-150.
9. Baldassi S., and Verghese P. (2005). Attention to locations and features: different top-down modulation of detector weights. J Vis. 5, 556-570.
10. Blake R., and Holopigian K. (1985). Orientation selectivity in cats and humans assessed by masking. Vision Res. 25, 1459-1467.
11. Legge G.E., and Foley J.M. (1980). Contrast masking in human vision. J Opt Soc Am. 70, 1458-1471.
12. Govenlock S.W., Taylor C.P., Sekuler A.B., and Bennett P.J. (2009). The effect of aging on the orientation selectivity of the human visual system. Vision Res. 49, 164-172.
13. Majaj N.J., Pelli D.G., Kurshan P., and Palomares M. (2002). The role of spatial frequency channels in letter identification. Vision Res. 42, 1165-1184.
14. Ling S., and Blake R. (In press). Suppression during binocular rivalry broadens orientation tuning. Psychological Science.
15. Ferster D., and Miller K.D. (2000). Neural mechanisms of orientation selectivity in the visual cortex. Annu Rev Neurosci. 23, 441-471.
16. Chung S., and Ferster D. (1998). Strength and orientation tuning of the thalamic input to simple cells revealed by electrically evoked cortical suppression. Neuron. 20, 1177-1189.
17. Ferster D., Chung S., and Wheat H. (1996). Orientation selectivity of thalamic input to simple cells of cat visual cortex. Nature. 380, 249-252.
18. Priebe N.J., and Ferster D. (2008). Inhibition, spike threshold, and stimulus selectivity in primary visual cortex. Neuron. 57, 482-497.
19. Albrecht D.G., Geisler W.S., Frazor R.A., and Crane A.M. (2002). Visual cortex neurons of monkeys and cats: temporal dynamics of the contrast response function. J Neurophysiol. 88, 888-913.
20. Schwartz O., Hsu A., and Dayan P. (2007). Space and time in visual context. Nat Rev Neurosci. 8, 522-535.
21. Blake R., Holopigian K., and Jauch M. (1985). Another visual illusion involving orientation. Vision Res. 25, 1469-1476.
11
22. Pearson J., and Clifford C.W. (2005). Suppressed patterns alter vision during binocular rivalry. Curr Biol. 15, 2142-2148.
23. Poom L. (2000). Inter-attribute tilt effects and orientation analysis in the visual brain. Vision Res. 40, 2711-2722.
24. Clifford C.W., Wenderoth P., and Spehar B. (2000). A functional angle on some after-effects in cortical vision. Proc Biol Sci. 267, 1705-1710.
25. Blakemore C., and Tobin E.A. (1972). Lateral inhibition between orientation detectors in the cat's visual cortex. Experimental brain research Experimentelle Hirnforschung Expérimentation cérébrale. 15, 439-440.
26. Pasley B.N., Allen E.A., and Freeman R.D. (2009). State-dependent variability of neuronal responses to transcranial magnetic stimulation of the visual cortex. Neuron. 62, 291-303.
27. Shou T.D., and Leventhal A.G. (1989). Organized arrangement of orientation-sensitive relay cells in the cat's dorsal lateral geniculate nucleus. J Neurosci. 9, 4287-4302.
28. Alonso J.M., Usrey W.M., and Reid R.C. (2001). Rules of connectivity between geniculate cells and simple cells in cat primary visual cortex. J Neurosci. 21, 4002-4015.
29. Bullier J., and Henry G.H. (1979). Neural path taken by afferent streams in striate cortex of the cat. J Neurophysiol. 42, 1264-1270.
30. Sompolinsky H., and Shapley R. (1997). New perspectives on the mechanisms for orientation selectivity. Curr Opin Neurobiol. 7, 514-522.
31. Troyer T.W., Krukowski A.E., Priebe N.J., and Miller K.D. (1998). Contrast-invariant orientation tuning in cat visual cortex: thalamocortical input tuning and correlation-based intracortical connectivity. J Neurosci. 18, 5908-5927.
32. Sclar G., and Freeman R.D. (1982). Orientation selectivity in the cat's striate cortex is invariant with stimulus contrast. Exp Brain Res. 46, 457-461.
33. Shapley R., Hawken M., and Ringach D.L. (2003). Dynamics of orientation selectivity in the primary visual cortex and the importance of cortical inhibition. Neuron. 38, 689-699.
34. Marino J., Schummers J., Lyon D.C., Schwabe L., Beck O., Wiesing P., Obermayer K., and Sur M. (2005). Invariant computations in local cortical networks with balanced excitation and inhibition. Nat Neurosci. 8, 194-201.
35. Bestmann S., Baudewig J., Siebner H.R., Rothwell J.C., and Frahm J. (2004). Functional MRI of the immediate impact of transcranial magnetic stimulation on cortical and subcortical motor circuits. Eur J Neurosci. 19, 1950-1962.
36. Martinez-Trujillo J.C., and Treue S. (2004). Feature-based attention increases the selectivity of population responses in primate visual cortex. Curr Biol. 14, 744-751.
37. Spitzer H., Desimone R., and Moran J. (1988). Increased attention enhances both behavioral and neuronal performance. Science. 240, 338-340.
38. Kamitani Y., and Shimojo S. (1999). Manifestation of scotomas created by transcranial magnetic stimulation of human visual cortex. Nat Neurosci. 2, 767-771.
12
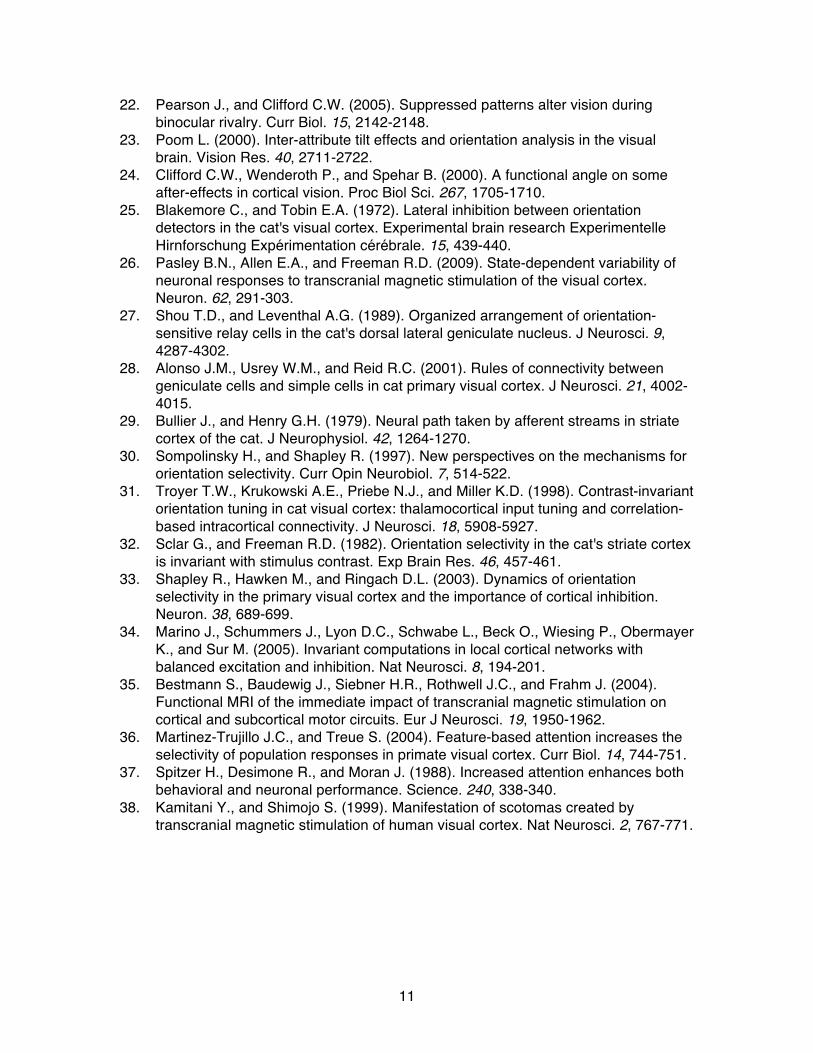
Figure 1. The stimulus display and a psychophysically measured orientation tuning function. (a) Example of display used to measure orientation tuning, within and outside of a TMS site (dotted circle; not in the actual display). In each trial, a grating was embedded within one of the two noise patches. Observers reported whether the grating was in the upper or lower region of the noise, and we obtained contrast thresholds based on their performance in this task. The green pointer at fixation indicated which side the stimulus would appear. (b) Demonstration of stimuli used to measure orientation tuning psychophysically. The only change in the three stimuli shown is the orientation content of the noise; the closer the orientation difference between the grating and the noise, the harder it is to see the embedded grating. This function yields a measure of the orientation tuning underlying the test grating detection. (c) Representative orientation tuning curve from one observer. Following rTMS, contrast thresholds were elevated, indicating the effectiveness of rTMS at depressing cortical activity. However, the width of the tuning curves remained unchanged (dropdown dotted lines; bandwidth estimates: rTMS = 18.98°, No TMS = 19.17°).
13
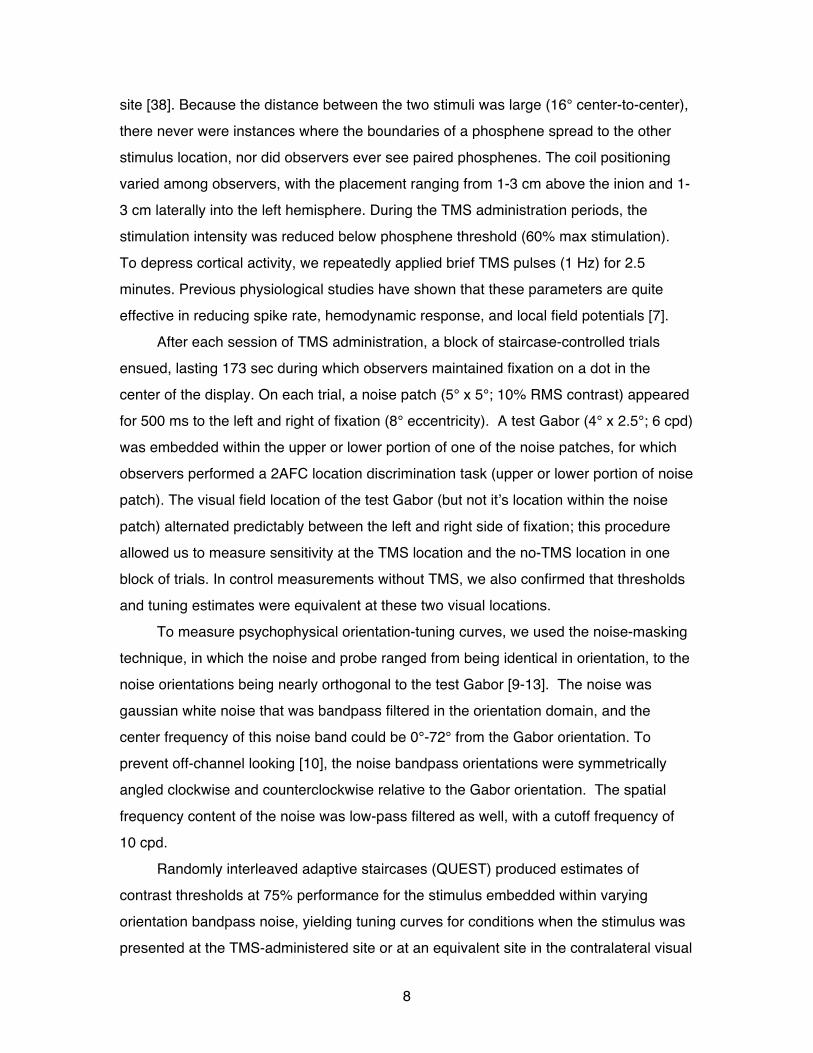
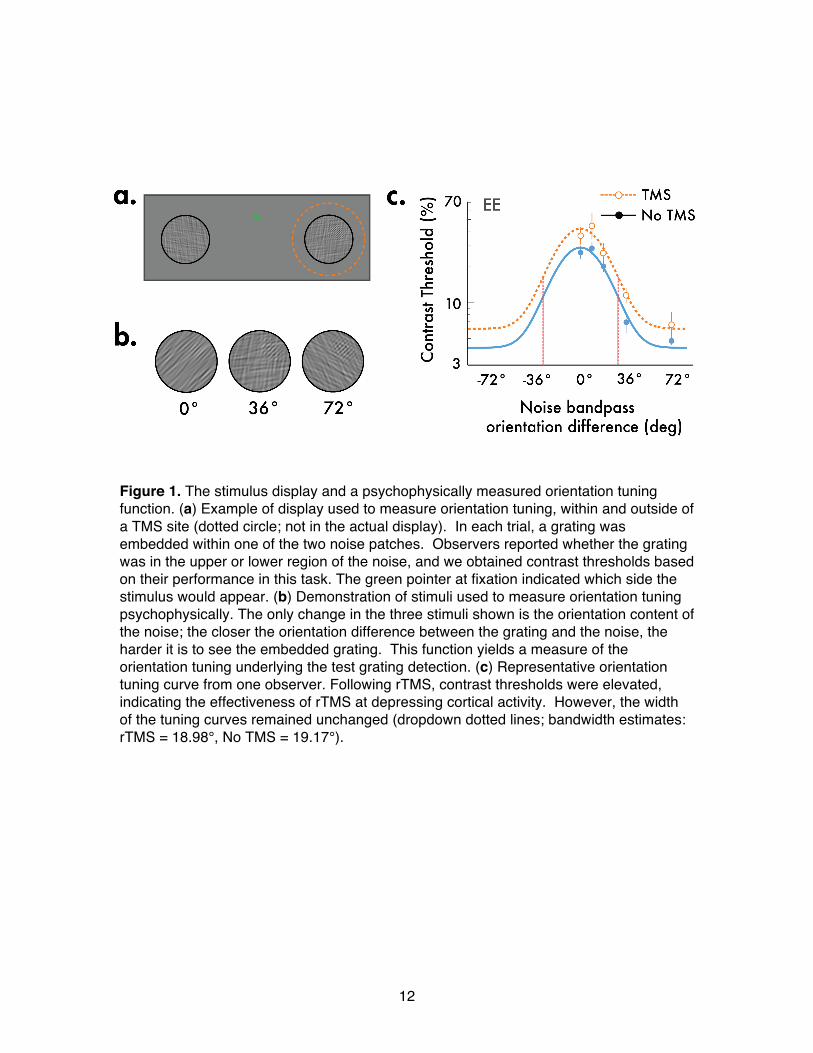
Figure 2. Orientation tuning bandwidth estimates measured inside and outside of the rTMS site. Although intracortical activity was depressed by TMS, there was no significant change in the bandwidth of orientation selectivity. Error bars correspond to the bootstrapped 95% confidence intervals.
14
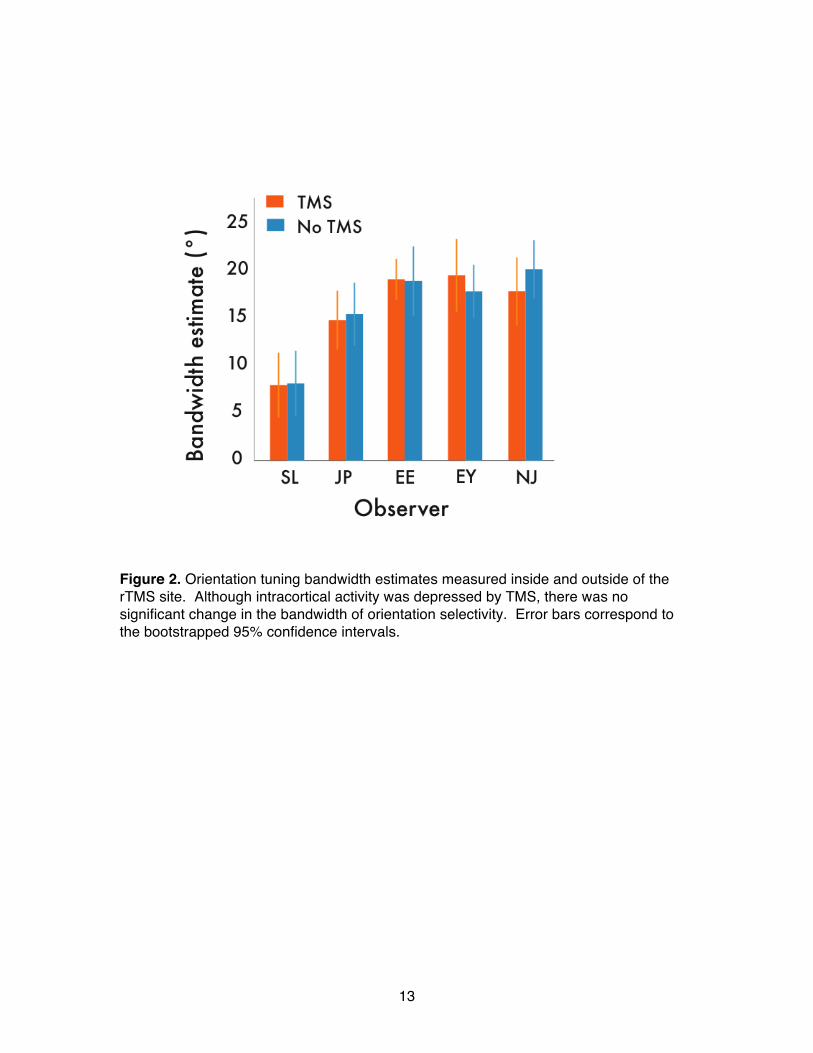
Figure 3. TMS diminishes the tilt repulsion illusion. (a) A demonstration of the tilt repulsion illusion. Although the physical orientation of the grating is vertical, when embedded within oriented noise, the grating appears to be tilted away from the noise orientation. This illusion is commonly attributed to lateral interactions in early visual cortex. (b) When the stimulus was presented outside the TMS site (blue bars), observers perceived the grating to be tilted away from vertical. However, under TMS, the magnitude of this illusion weakened.

15
Figure 4. Halving the contrast of the inducer and test stimuli did not significantly affect the magnitude of the tilt repulsion illusion. Error bars correspond to ±1 s.e.