Cortical processes underlying sound-induced flash fusion
26
Cortical Processes Underlying Sound-Induced Flash Fusion Jyoti Mishra 1 , Antigona Martinez 1,2 , and Steven A. Hillyard 1 1 Department of Neurosciences, University of California, San Diego, La Jolla, CA 92093 2 Nathan S. Kline Institute for Psychiatric Research, Orangeburg, NY 10962 Abstract When two brief flashes presented in rapid succession (< 100 ms apart) are paired with a single auditory stimulus, subjects often report perceiving only a single flash (Andersen et al., 2004, Shams et al., 2005). We used event-related potentials (ERPs) to investigate the timing and localization of the cortical processes that underlie this sound induced flash fusion, which is complementary to the sound-induced extra flash illusion that we analyzed previously (Mishra et al., 2007). The difference ERP that represented the cross-modal interaction between the visual (two flashes) and auditory (one sound) constituents of the bimodal stimulus revealed a positive component elicited 160–190 ms after stimulus onset, which was markedly attenuated in subjects who did not perceive the second flash. This component, previously designated as PD180 (Mishra et al., 2007), was localized by dipole modeling to polysensory superior temporal cortex. PD180 was found to covary in amplitude across subjects with the visual evoked N1 component (148–184 ms), suggesting that inter-individual differences in perceiving the illusion are based at least in part on differences in visual processing. A trial-by-trial analysis found that the PD180 as well as a subsequent modulation in visual cortex at 228–248 ms was diminished on trials when the two flashes were perceived as one relative to trials when two flashes were correctly reported. These results suggest that the sound induced flash fusion is based on an interaction between polysensory and visual cortical areas. Keywords ERPs; visual illusion; flash fusion; multisensory; cross-modal interaction; polymodal cortex 1. INTRODUCTION In our natural environment we constantly encounter stimulus events that have informative features in more than one sensory modality. Our sensory systems generally integrate such multimodal inputs rapidly to form a coherent percept of the sensory surroundings. The neural dynamics underlying multisensory integration have been extensively researched in electrophysiological and imaging studies, and the influence of key parameters such as spatial, temporal and semantic congruity have been characterized (Stein and Meredith, 1993; Calvert et al, 2004; Macaluso and Driver, 2005; Schroeder and Foxe, 2005; Ghazanfar and Schroeder, 2006). Interestingly, many studies have shown that our sensory systems do not always integrate external stimuli veridically. One sense may dominate another sense and influence its processing to produce perceptual illusions. For example, even though humans are generally considered to be visually dominant, there have been many reports of alteration of visual perception by Correspondence should be addressed to: Jyoti Mishra, University of California, San Diego, Dept. of Neurosciences - 0608, 9500 Gilman Drive, La Jolla, CA 92093-0608, Ph: +1-858-534-1389, Fax: +1-858-534-1566, [email protected]. NIH Public Access Author Manuscript Brain Res. Author manuscript; available in PMC 2009 November 25. Published in final edited form as: Brain Res. 2008 November 25; 1242: 102–115. doi:10.1016/j.brainres.2008.05.023. NIH-PA Author Manuscript NIH-PA Author Manuscript NIH-PA Author Manuscript
Transcript of Cortical processes underlying sound-induced flash fusion

Cortical Processes Underlying Sound-Induced Flash Fusion
Jyoti Mishra1, Antigona Martinez1,2, and Steven A. Hillyard11Department of Neurosciences, University of California, San Diego, La Jolla, CA 920932Nathan S. Kline Institute for Psychiatric Research, Orangeburg, NY 10962
AbstractWhen two brief flashes presented in rapid succession (< 100 ms apart) are paired with a singleauditory stimulus, subjects often report perceiving only a single flash (Andersen et al., 2004, Shamset al., 2005). We used event-related potentials (ERPs) to investigate the timing and localization ofthe cortical processes that underlie this sound induced flash fusion, which is complementary to thesound-induced extra flash illusion that we analyzed previously (Mishra et al., 2007). The differenceERP that represented the cross-modal interaction between the visual (two flashes) and auditory (onesound) constituents of the bimodal stimulus revealed a positive component elicited 160–190 ms afterstimulus onset, which was markedly attenuated in subjects who did not perceive the second flash.This component, previously designated as PD180 (Mishra et al., 2007), was localized by dipolemodeling to polysensory superior temporal cortex. PD180 was found to covary in amplitude acrosssubjects with the visual evoked N1 component (148–184 ms), suggesting that inter-individualdifferences in perceiving the illusion are based at least in part on differences in visual processing. Atrial-by-trial analysis found that the PD180 as well as a subsequent modulation in visual cortex at228–248 ms was diminished on trials when the two flashes were perceived as one relative to trialswhen two flashes were correctly reported. These results suggest that the sound induced flash fusionis based on an interaction between polysensory and visual cortical areas.
KeywordsERPs; visual illusion; flash fusion; multisensory; cross-modal interaction; polymodal cortex
1. INTRODUCTIONIn our natural environment we constantly encounter stimulus events that have informativefeatures in more than one sensory modality. Our sensory systems generally integrate suchmultimodal inputs rapidly to form a coherent percept of the sensory surroundings. The neuraldynamics underlying multisensory integration have been extensively researched inelectrophysiological and imaging studies, and the influence of key parameters such as spatial,temporal and semantic congruity have been characterized (Stein and Meredith, 1993; Calvertet al, 2004; Macaluso and Driver, 2005; Schroeder and Foxe, 2005; Ghazanfar and Schroeder,2006).
Interestingly, many studies have shown that our sensory systems do not always integrateexternal stimuli veridically. One sense may dominate another sense and influence its processingto produce perceptual illusions. For example, even though humans are generally considered tobe visually dominant, there have been many reports of alteration of visual perception by
Correspondence should be addressed to: Jyoti Mishra, University of California, San Diego, Dept. of Neurosciences - 0608, 9500 GilmanDrive, La Jolla, CA 92093-0608, Ph: +1-858-534-1389, Fax: +1-858-534-1566, [email protected].
NIH Public AccessAuthor ManuscriptBrain Res. Author manuscript; available in PMC 2009 November 25.
Published in final edited form as:Brain Res. 2008 November 25; 1242: 102–115. doi:10.1016/j.brainres.2008.05.023.
NIH
-PA Author Manuscript
NIH
-PA Author Manuscript
NIH
-PA Author Manuscript
audition (Stein et al., 1996; Sekuler et al., 1997; Fendrich and Corballis, 2001; Shams et al,2000, 2002; Recanzone, 2003; Vroomen and Gelder, 2004; McDonald et al., 2003, 2005). Theneurophysiological processes underlying such phenomena are only beginning to be understood.The sound-induced extra flash illusion, wherein a double flash percept results from presentationof a single flash concurrent with two rapid pulsed sounds, has been the focus of recentphysiological studies (Shams et al., 2001, 2005a; Arden et al., 2003; Watkins et al., 2006;Mishra et al., 2007). In a detailed analysis of the illusion using recordings of event relatedpotentials (ERPs) (Mishra et al., 2007) we showed that within 30–60 ms after delivery of thesecond sound a rapid, dynamic interplay between auditory and visual cortical areas emerged,closely followed by activity in polymodal superior temporal cortex activity. These early cross-modal interactions predicted the subject’s report of the illusory extra flash percept.
In the present study, we investigated the complement of the extra flash illusion, the so calledflash fusion effect, wherein only a single flash is perceived when two brief flashes are presentedin rapid succession accompanied by a single pulsed sound. This phenomenon has been observedin some previous behavioral studies (Andersen et al., 2004, Shams et al., 2005b), but was absentin others (Shams et al., 2002, Meylan and Murray, 2007). Recently, the flash fusion effect wasstudied in an fMRI investigation, which showed that modulation of primary visual cortex mayaccompany the altered visual percept (Watkins et al., 2007). In the present study, the neuralbasis of sound-induced flash fusion was analyzed using 64-channel ERP recordings inconjunction with anatomical source localization. The study was performed in a large cohort ofsubjects, which made it possible to investigate the underlying neural mechanisms in individualswho perceived the flash fusion effect versus those who did not. Accordingly, we studied thespatio-temporal patterns of neural activity associated with the flash fusion percept by makingboth between-subject comparisons and within-subject comparisons on a trial-by-trial basis.With the high temporal resolution of ERP recordings it was possible to investigate whethervisual cortex modulation, if involved as suggested by the fMRI findings, occurs at an earlyinput stage or via delayed feedback. The data in the present study were obtained as part of abroader ERP study that investigated not only the flash fusion effect but also the extra flashillusion generated by a two-sound-one-flash stimulus as well as other non-illusory cross-modalinteractions within the same design (Mishra et al., 2007). The analyses of these data thusallowed comparisons of the neural correlates of different types of illusory and non-illusoryintersensory interactions.
2. RESULTSBehavioral results
The experimental layout and the different auditory (A), visual (V) and audio-visual (AV)stimulus configurations presented to subjects in visual periphery are shown in Fig. 7. Subjectsindicated by pressing one of two buttons the number of flashes perceived (one or two) for eachstimulus combination that contained one or more flashes. The mean percentages of correctresponses and reaction times over all 34 subjects who participated in the study are shown inTable 1.
For the A1V1V2 stimulus that was the focus of the current study, perceptual reports of seeinga single flash (i.e., of flash-fusion) occurred on 44% of trials averaged over all subjects (s.e.m.5.2%). This proportion is in close agreement with behavioral findings in the recent fMRI studyof the phenomenon where flash-fusion occurred on 42% of all trials (Watkins et al., 2007).There was considerable variation among individuals, however, in the proportion of fusionpercepts, which ranged from less than 10% to over 90%. Hence, in order to relate the subjects’perceptual reports with brain physiology as indexed by ERPs, the 34 subject pool was dividedinto two groups (17 in each) by a median split of the percent fusion responses on theA1V1V2 stimulus. The SEE1 group was the group of subjects that reported seeing flash fusion
Mishra et al. Page 2
Brain Res. Author manuscript; available in PMC 2009 November 25.
NIH
-PA Author Manuscript
NIH
-PA Author Manuscript
NIH
-PA Author Manuscript
more frequently, and the SEE2 group included those who more frequently reported a veridicaltwo-flash percept of the A1V1V2 stimulus.
Figure 1 compares the behavioral performance of the SEE1 vs. SEE2 group over all stimulithat had a visual component. The SEE1 and SEE2 groups naturally differed substantially inthe percentage of A1V1V2 trials on which flash fusion was perceived (71% vs. 18%, t(32) =11.2, p< 0.0001), but unexpectedly these two groups also differed significantly in percentfusion responses for the V1V2 stimulus (41% vs. 17%, t(32) = 6.98, p< 0.0001). The groupsdid not significantly differ in performance for any other stimuli, nor did they show reactiontime differences on any stimulus condition. In particular the SEE1 and SEE2 groups did notdiffer significantly in perceiving the extra flash illusion to the A1V1A2 stimulus (43% vs. 31%,t(32) = 1.42, p = n.s.). The experimental design also included A1A2V1 catch trials that werestimulus matched to the A1V1A2 illusory stimulus. Within A1A2V1 the visual flash (V1) wasdissociated from the auditory A1A2 component by a 200 ms delay, rendering the stimulus non-illusory. Individuals in both SEE1 and SEE2 groups correctly discriminated the A1A2V1stimulus as containing a single flash (Fig. 1, 90% SEE1 grp. vs. 92% SEE2 grp., t(32) = 0.81,p = n.s.). These results suggest that group differences in SEE1/SEE2 responses were based onactual perceptual experience rather than a response bias to report the number of flashes basedon the number of sounds.
To further demonstrate that the behavioral differences between the SEE1 and SEE2 groups intheir responses to the A1V1V2 and V1V2 stimuli were due to differences in perceptualsensitivity rather than response or decision bias, signal detection estimates of sensitivity (d’)and decision criterion (β) were calculated (see Methods). Perceptual sensitivity in the SEE1group was significantly lower than in the SEE2 group for both the A1V1V2 (SEE1 vs. SEE2d’: 0.91 vs. 2.53, t(32) = 6.89, p<0.0001) and V1V2 (SEE1 vs. SEE2 d’: 1.49 vs. 2.30, t(32) =3.42, p<0.002) stimuli. Decision criteria, however, did not differ between the two groups foreither the A1V1V2 (SEE1 vs. SEE2 β: 3.28 vs. 3.34, t(32) = 0.05, p = n.s.) or V1V2 (SEE1 vs.SEE2 β: 0.94 vs. 0.68, t(32) = 0.85, p = n.s.) stimuli.
Across all subjects a significant correlation was found between percent fusion responses to theA1V1V2 and V1V2 stimuli (r(32) = 0.79, p < 0.0001), suggesting that subjects who perceivedthe flash fusion illusion had a general propensity to perceive rapid double flashes as unitary.Importantly, this propensity was not completely responsible for the flash fusion perception ofthe A1V1V2 stimulus, since the presence of the A1 sound significantly increased the perceptualreports of fusion (SEE1 group: 41% flash fusion on V1V2 and 71% fusion on A1V1V2; stimuluscondition × group interaction: F(1, 32) = 38.52, p < 0.0001).
ERP ResultsFig. 2A shows the grand-averaged ERPs (over all 34 subjects) elicited by the flash fusiongenerating A1V1V2 stimulus and by its unimodal components, A1 and V1V2. The auditoryERP to A1 showed the typical pattern of P1 (60 ms), N1 (100 ms) and P2 (180 ms) componentsat central electrode sites. The visual ERP to V1V2 also showed characteristic P1 (120 ms), N1(160–180 ms) and P2 (220 ms) components. Both auditory and visual evoked componentscould be discerned in the ERP waveform elicited by the bimodal A1V1V2 stimulus.
The Fusion_Diff difference waves, which represent the cross-modal interaction associated withperception of sound-induced flash fusion, are also shown in Fig 2A for each electrode site. Thesignificant positive (P) and negative (N) deflections in these difference waves will be referredto as ‘components’ for simplicity. The earliest significant component in these difference waveswas a large positivity in the 160–192 ms time interval peaking at 180 ms (PD180). PD180 hadan amplitude maximum at fronto-central sites with a significant right hemisphericpreponderance (hemisphere effect: F(1,33) = 11.63, p < 0.002) (Fig. 2B). The other significant
Mishra et al. Page 3
Brain Res. Author manuscript; available in PMC 2009 November 25.
NIH
-PA Author Manuscript
NIH
-PA Author Manuscript
NIH
-PA Author Manuscript
component characterized within the first 300 ms of the Fusion_Diff difference wave was anegativity within the 224–256 ms time interval peaking at 240 ms (ND240), which was largestover centro-parietal sites bilaterally. The mean amplitudes of these components relative tobaseline are shown in Table 2. Components occurring after 300 ms in the Fusion_Diff waveswere not analyzed because of the likelihood that activity related to decision making andresponse preparation would be confounded with activity related to cross-modal interaction andperceptual processing (Hillyard and Picton, 1987,Coles et al., 1995).
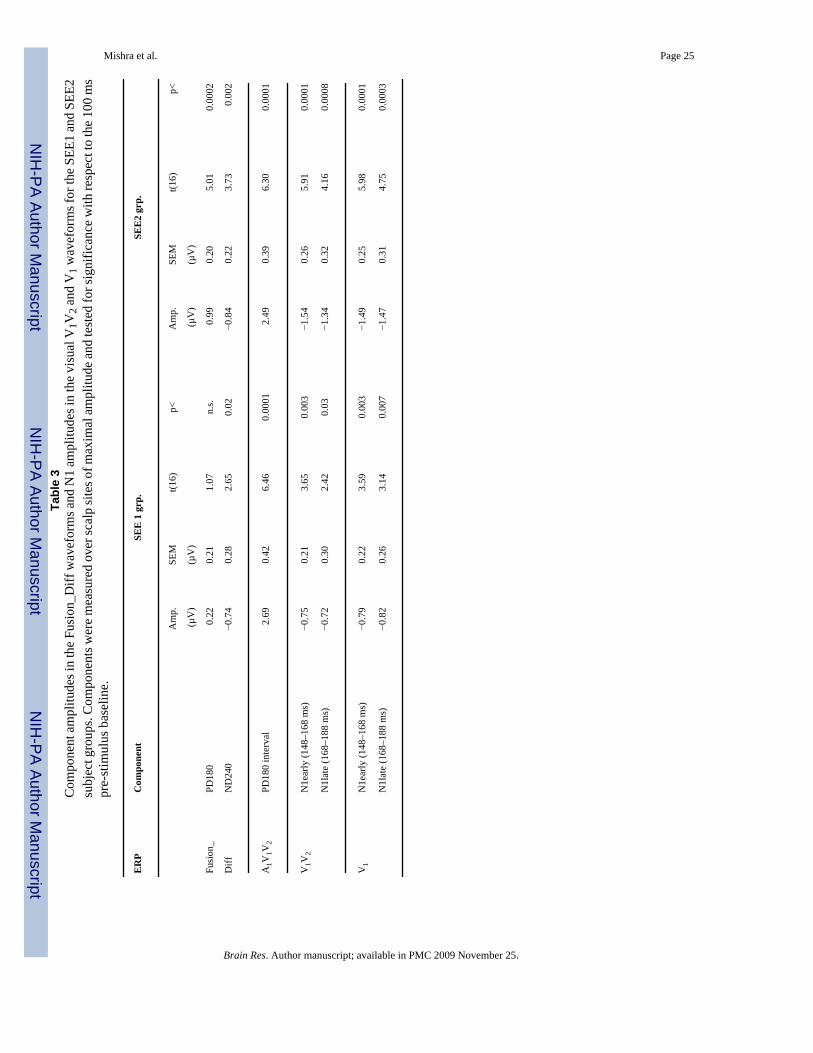
Between Subject AnalysisIn order to identify ERP components specifically associated with perception of the soundinduced flash fusion, the Fusion_Diff difference waveforms calculated over all trials werecompared between the SEE1 and SEE2 groups of subjects (Fig. 3). In the Fusion_Diffwaveforms, the PD180 component was found to be significantly larger in amplitude in theSEE2 vs. the SEE1 group (F(1,32) = 7.21, p < 0.02) (Fig. 3B and C). For the SEE1 group thePD180 mean amplitude did not even reach statistical significance with respect to pre-stimulusbaseline (Table 3). No between-group differences were found for the ND240 component (F(1,32) = 0.08, p = n.s.). The scalp topographies of the components were compared betweengroups following normalization according to the method of McCarthy & Wood (1985). Thetopography of the PD180 component differed between the SEE2 and SEE1 groups (Group ×Electrode interaction: F(37, 1184) = 1.49, p> 0.04), but this difference most likely arose becausePD180 amplitude was near noise levels in the SEE1 group. No group differences were foundin the topography of the ND240 component (F(37,1184) = 0.25, p = n.s.). Of note, the twogroups did not differ in their electro-ocular responses to the A1V1V2 stimulus (Fig. 3A, HEOGand VEOG) indicating that sound-evoked blinks were not responsible for the behavioraldifferences between the groups.
A correlational analysis was performed to further examine whether individual variations inPD180 amplitude corresponded with perceptual reports of the flash fusion phenomenon. Asignificant negative correlation was found for the PD180 component over all subjects, withgreater PD180 amplitudes associated with fewer reports of the fusion effect (r(32) = −0.39, p< 0.02). No significant correlation was found between behavioral performance and theamplitude of the ND240 component (r(32) = 0.04, p = n.s.).
As reported by Mishra et al. (2007) the PD180 component was also observed in the other cross-modal interaction difference waves calculated for the A1V1A2, A1V1, and A1V1A2V2 stimuli.The amplitudes of PD180 in these difference waves did not differ between the SEE1 and SEE2groups (A1V1A2: F(1,32) = 2.95, p = n.s.; A1V1: F(1,32) = 2.73, p = n.s., A1V1A2V2: F(1,32)= 3.63, p = n.s.). Thus, the PD180 component was found to differentiate the SEE1 and SEE2groups only for the A1V1V2 stimulus.
In the behavioral analyses (reported above) the SEE1 group showed more flash fusionresponses than the SEE2 group to the V1V2 stimulus as well as to the A1V1V2 stimulus. Thisbehavioral difference was paralleled by a group difference in the visual ERP to the V1V2stimulus (Fig. 4 and Table 3). The early phase of the visual evoked N1 (latency range 148–168ms), which had a voltage maximum over anterior sites, was found to be significantly smallerfor the SEE1 group compared to the SEE2 group (F(1,32) = 5.64, p< 0.03). A similar groupdifference was also found for the early phase of the N1 evoked by the single flash (V1) stimulus(F(1,32) = 4.42, p< 0.05) (Fig. 4C, Table 3). The SEE1 vs. SEE2 group difference approachedbut did not reach significance for the late phase of the N1 (168–188 ms), which had acontralateral occipital maximum, either for the double flash (V1V2) (F(1,32) = 2.80, p = n.s.)or the single flash (V1) stimulus (F(1,32) = 3.19, p = n.s., Fig. 4C). The scalp topographies ofthe N1 component in the ERPs to V1 vs. to V1V2 did not differ over the entire N1 interval(148–188 ms) (Condition × Electrode interaction: F(37,1221) = 0.17, p = n.s.). Also, there was
Mishra et al. Page 4
Brain Res. Author manuscript; available in PMC 2009 November 25.
NIH
-PA Author Manuscript
NIH
-PA Author Manuscript
NIH
-PA Author Manuscript

no difference between the SEE1 and SEE2 groups in the topography of the N1 component foreither visual stimulus (Group × Electrode interaction: V1V2: F(37,1184) = 0.36, p = n.s.; V1:F(37,1184) = 0.15, p = n.s.). These highly lateralized topographic distributions that did notdiffer between the two subject groups provided further evidence that the subjects in the twogroups maintained central fixation to the same extent and hence viewed the stimuli at the samelocation in their visual periphery.
The relationship between the visual evoked N1 and the flash fusion effect was further indicatedby a significant correlation across subjects between the amplitude of the early N1 to theV1V2 stimulus and the PD180 amplitude in the Fusion_Diff waveform (r(32) = −0.67,p<0.0001). A relatively weaker correlation was also observed for the late phase of the N1 toV1V2 and the PD180 component (r(32) = − 0.45, p<0.008). As shown in Table 3, the magnitudeof the SEE2-SEE1 group difference for the PD180 component was 0.77 µV. This wascomparable to the magnitude of the V1V2 evoked N1 group difference measured within thesame latency range (160–192 ms) and over the same electrode sites as the PD180 component(0.74 µV). Thus, the differences in amplitude of the visual evoked N1 between the SEE1 andSEE2 groups might have contributed substantially to the group difference observed for thecross-modal PD180 component. Within this latency range however, the amplitudes of the ERPsto A1V1V2 did not differ significantly between the two subject groups (Table 3, F(1,32) = 0.14,p = n.s.). With respect to behavior the correlations across subjects between the early/ late N1amplitudes to V1V2 and the percent fusion responses to the V1V2 stimulus approached but didnot reach significance (early N1: r(32) = 0.25, p = n.s.; late N1: r(32) = 0.20, p = n.s.).
ERPs to the auditory (A1) stimulus, which was the other sensory component of the Fusion_Diffdifference wave calculation, were also analyzed for SEE2 vs. SEE1 group differences; nodifferences were found in any component of the auditory ERP.
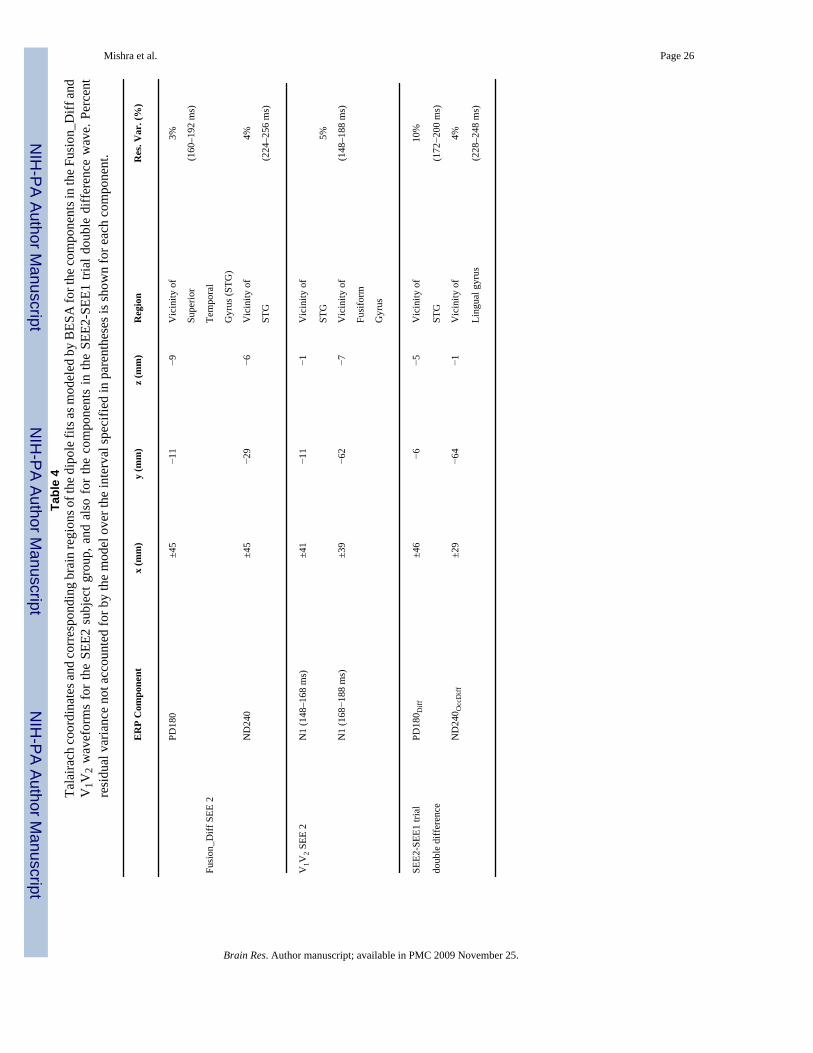
Source AnalysisThe neural generators of the components in the Fusion_Diff waveform and the N1 componentin the V1V2 ERP were modeled using dipole fitting for the SEE2 subject group wherein thesecomponents were largest. Pairs of dipoles were fit to the scalp topographies of the componentsusing the BESA algorithm (Scherg, 1990). The location of the BESA dipoles were transformedinto the standardized coordinate system of Talairach and Tournoux (1988) and superimposedon the rendered cortical surface of a single individual’s brain. Talairach coordinates of thedipole pairs and an estimate of their goodness of fit as reflected by residual variance are listedin Table 4.
The locations of the dipoles fit to the components that were correlated with perception of flashfusion (i.e., the PD180 component in the Fusion_Diff wave and the N1 component in theV1V2 ERP) are shown in Fig. 5. The PD180 component in the Fusion_Diff wave was localizedto the region of the superior temporal gyrus bilaterally with a greater source amplitude in theright hemisphere. The later ND240 component in the Fusion_Diff wave was similarly localizedto the superior temporal region (Table 4). The voltage distributions of the early (148–168 ms)and late (168–188 ms) phases of the visual N1 component elicited by V1V2 were modeledsequentially using a pair of dipoles in each phase (Fig. 5B). The source of the anterior N1 waslocalized to superior temporal cortex in close proximity to the PD180 dipoles in the Fusion_Diffwaveform. The posterior N1 was localized to ventro-lateral occipital extrastriate visual cortexnear the fusiform gyrus. For both phases of the N1 stronger dipole sources emerged in the righthemisphere relative to the left, contralateral to the side of stimulus presentation.
Mishra et al. Page 5
Brain Res. Author manuscript; available in PMC 2009 November 25.
NIH
-PA Author Manuscript
NIH
-PA Author Manuscript
NIH
-PA Author Manuscript
Trial based AnalysisIn order to study the neural correlates of the fusion percept more directly, a trial by trial analysisof the Fusion_Diff waves was performed. This trial based analysis was carried out for 15subjects whose behavioral reports of fusion percepts were centered around the overall medianlevel on A1V1V2 trials, such that each subject’s SEE2 and SEE1 trial difference waves had anapproximately equal number of trials (average SEE2 vs. SEE1 trials: 54%, vs. 46%).
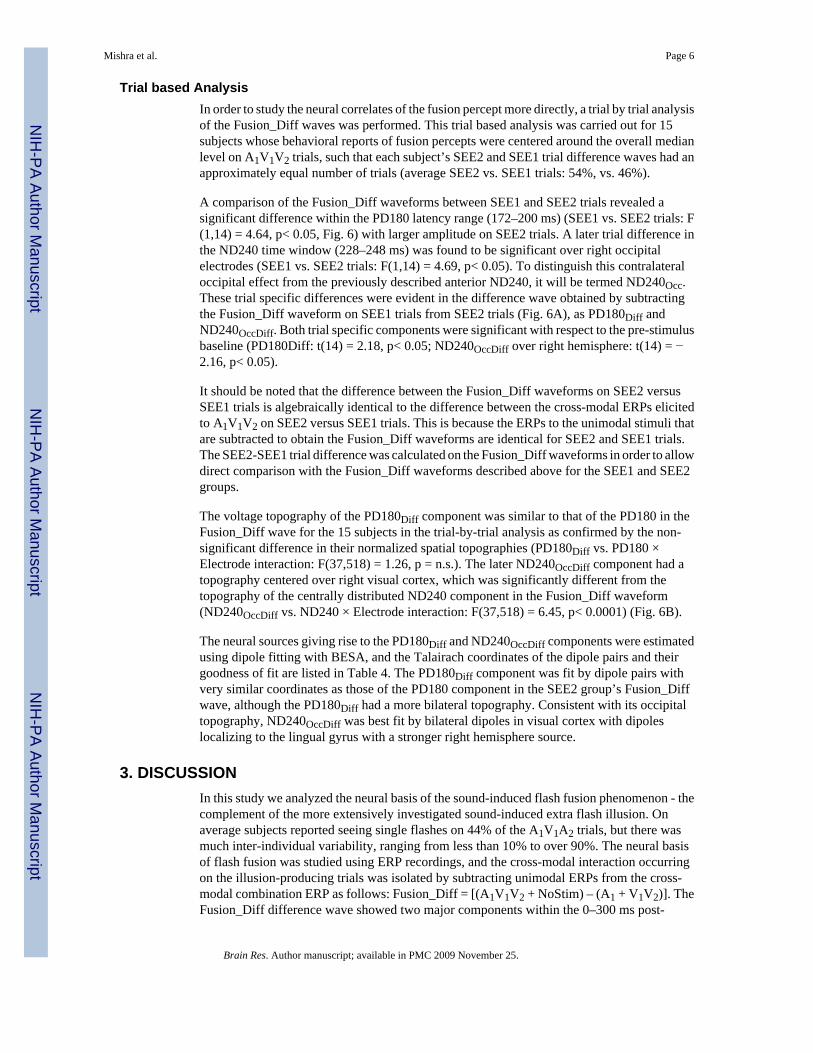
A comparison of the Fusion_Diff waveforms between SEE1 and SEE2 trials revealed asignificant difference within the PD180 latency range (172–200 ms) (SEE1 vs. SEE2 trials: F(1,14) = 4.64, p< 0.05, Fig. 6) with larger amplitude on SEE2 trials. A later trial difference inthe ND240 time window (228–248 ms) was found to be significant over right occipitalelectrodes (SEE1 vs. SEE2 trials: F(1,14) = 4.69, p< 0.05). To distinguish this contralateraloccipital effect from the previously described anterior ND240, it will be termed ND240Occ.These trial specific differences were evident in the difference wave obtained by subtractingthe Fusion_Diff waveform on SEE1 trials from SEE2 trials (Fig. 6A), as PD180Diff andND240OccDiff. Both trial specific components were significant with respect to the pre-stimulusbaseline (PD180Diff: t(14) = 2.18, p< 0.05; ND240OccDiff over right hemisphere: t(14) = −2.16, p< 0.05).
It should be noted that the difference between the Fusion_Diff waveforms on SEE2 versusSEE1 trials is algebraically identical to the difference between the cross-modal ERPs elicitedto A1V1V2 on SEE2 versus SEE1 trials. This is because the ERPs to the unimodal stimuli thatare subtracted to obtain the Fusion_Diff waveforms are identical for SEE2 and SEE1 trials.The SEE2-SEE1 trial difference was calculated on the Fusion_Diff waveforms in order to allowdirect comparison with the Fusion_Diff waveforms described above for the SEE1 and SEE2groups.
The voltage topography of the PD180Diff component was similar to that of the PD180 in theFusion_Diff wave for the 15 subjects in the trial-by-trial analysis as confirmed by the non-significant difference in their normalized spatial topographies (PD180Diff vs. PD180 ×Electrode interaction: F(37,518) = 1.26, p = n.s.). The later ND240OccDiff component had atopography centered over right visual cortex, which was significantly different from thetopography of the centrally distributed ND240 component in the Fusion_Diff waveform(ND240OccDiff vs. ND240 × Electrode interaction: F(37,518) = 6.45, p< 0.0001) (Fig. 6B).
The neural sources giving rise to the PD180Diff and ND240OccDiff components were estimatedusing dipole fitting with BESA, and the Talairach coordinates of the dipole pairs and theirgoodness of fit are listed in Table 4. The PD180Diff component was fit by dipole pairs withvery similar coordinates as those of the PD180 component in the SEE2 group’s Fusion_Diffwave, although the PD180Diff had a more bilateral topography. Consistent with its occipitaltopography, ND240OccDiff was best fit by bilateral dipoles in visual cortex with dipoleslocalizing to the lingual gyrus with a stronger right hemisphere source.
3. DISCUSSIONIn this study we analyzed the neural basis of the sound-induced flash fusion phenomenon - thecomplement of the more extensively investigated sound-induced extra flash illusion. Onaverage subjects reported seeing single flashes on 44% of the A1V1A2 trials, but there wasmuch inter-individual variability, ranging from less than 10% to over 90%. The neural basisof flash fusion was studied using ERP recordings, and the cross-modal interaction occurringon the illusion-producing trials was isolated by subtracting unimodal ERPs from the cross-modal combination ERP as follows: Fusion_Diff = [(A1V1V2 + NoStim) – (A1 + V1V2)]. TheFusion_Diff difference wave showed two major components within the 0–300 ms post-
Mishra et al. Page 6
Brain Res. Author manuscript; available in PMC 2009 November 25.
NIH
-PA Author Manuscript
NIH
-PA Author Manuscript
NIH
-PA Author Manuscript
stimulus interval, a prominent positivity at 180 ms (PD180) followed by a large negativity at240 ms (ND240). Subjects who more frequently reported perception of flash fusion had a muchdiminished PD180 component. A within subject trial-by-trial analysis also showed the PD180to be markedly reduced on trials on which the two flashes within the A1V1A2 stimulus wereperceptually fused to one (SEE1 trials) vs. trials on which they were seen veridically (SEE2trials). Using dipole modeling, PD180 was localized to the superior temporal cortex, whichincludes polysensory processing regions (Calvert et al., 2004). The SEE2 vs. SEE1 trialcomparison further revealed a reduced negativity in visual cortex at 240 ms (ND240OccDiff)on SEE1 trials. Thus, our results suggest that the veridical double flash percept is based on agreater cross-modal interaction within superior temporal cortex starting at around 100 ms afterpresentation of the second flash of the A1V1V2 stimulus, which was followed about 60 ms laterby differential activity in extrastriate visual cortex. The late onset of this ND240OccDiff suggeststhat it may result from feedback from polymodal cortex, or, alternatively, from a modulationof visual evoked activity to the second flash (V2). In any case, reduced amplitudes of the PD180and ND240OccDiff components were strongly linked to the flash fusion percept.
The individual differences between subjects observed in the present study, especially withrespect to their perceptual reports, can potentially explain why some previous studies failed tofind the sound-induced flash fusion phenomenon (Shams et al., 2002, Meylan and Murray,2007), while others reported it to be robustly present (Andersen et al., 2004, Shams et al.,2005b, Watkins et al., 2007). In the present study a large pool of 34 participants was sampledso that the heterogeneity between subjects could be characterized, and subjects could be dividedinto SEE1 and SEE2 groups based on whether they perceived sound-induced flash-fusion.Shams et al. (2005b) modeled audio-visual integration using a computational model based onBayesian statistics and proposed that the phenomena of sound-induced extra flash perceptionand sound-induced flash fusion both result from optimal integration between the twomodalities, which differ in information reliability. For both effects the auditory stimulus wasinferred to influence the visual percept because of its greater reliability in the time domain.Here we found that optimal integration took place on the average but did not necessarily applyto every subject. This was also found to hold true for the extra flash illusion (Mishra et al.,2007). Information reliability in a sensory modality appears to vary from one subject to another,and this diversity in cross-modal integration might possibly be shaped by development andexperience (Bavelier and Neville, 2002).
The earliest cross-modal modulation found in the Fusion_Diff waveforms was the PD180component (160–192 ms) that was localized to superior temporal cortex. The dipolar sourcesfor this component were in close agreement with the neural generators for the PD180 in thecross-modal interaction waveform associated with the A1V1A2 stimulus that was previouslylocalized using a distributed minimum-norm approach (Mishra et al., 2007). A componentclosely resembling the present PD180 has been found in many previous studies of cross-modalinteractions (Teder-Sälejärvi et al., 2002, 2005; Molholm et al., 2002; Talsma & Woldorff2005, Mishra et al., 2007), but this is the first report to our knowledge demonstrating itscovariation with perception. In particular, variations in PD180 were not found to be associatedwith the extra flash illusion, either between subjects or on a trial by trial basis (Mishra et al.,2007). This suggests that the underlying audio-visual interaction in the superior temporalregion is related more to the precise timing and segmenting of visual inputs than to thegeneration of an illusory visual percept.
Interestingly, in the present study a strong correlation was found between the subjects’perceptual reports on the unimodal V1V2 stimulus and the A1V1V2 stimulus. Subjects whomore frequently mis-perceived V1V2 as a single flash also had a greater propensity to reportsound-induced flash fusion. The single flash percept on A1V1V2 trials was not entirelydetermined by the paired visual stimuli, however, as illusory fusion occurred more frequently
Mishra et al. Page 7
Brain Res. Author manuscript; available in PMC 2009 November 25.
NIH
-PA Author Manuscript
NIH
-PA Author Manuscript
NIH
-PA Author Manuscript

in the presence of the A1 sound than in its absence (V1V2 stimulus). Paralleling these perceptualreports, the amplitude of the evoked N1, especially its early phase (148–168 ms) in the ERPto V1V2, was correlated with the PD180 amplitudes in the Fusion_Diff waveform. In otherwords, subjects who perceived sound-induced flash fusion not only had smaller PD180s in theFusion_Diff waveforms but also smaller visual-evoked N1s on V1V2 trials. The mean N1amplitude difference between subjects who fused the double flash stimuli (SEE1 group) versusthose who did not (SEE2 group) in the latency range of the PD180 component was found tobe almost equivalent to the mean group difference for the PD180 component itself. Thissuggests that the variation of the PD180 component across subjects could largely be accountedfor by differences in the visual evoked N1 for these subjects. Indeed, the anteriorly distributedearly phase of the visual N1 was found to have neural generators in close proximity to thePD180 source in superior temporal cortex. However, the larger N1 that was subtracted in theFusion_Diff waveform in the SEE2 group cannot account for all the PD180 difference, becauseERPs to A1V1V2 had the same (positive) amplitude in the two groups within the PD180 timewindow. This indicates greater cross-modal interaction in the A1V1V2 waveform in the SEE2group in which the presence of A1 reduced the larger N1 evoked to V1V2 such that A1V1V2amplitude in the N1/ PD180 latency range was equivalent in the two groups.
These results suggest that the neural basis of the flash fusion effect for both V1V2 andA1V1V2 stimuli may involve sensory processing reflected in the N1 within the same superiortemporal region. The early phase of the visual N1 has been reported to have multiple generators,both in temporal (Clark and Hillyard, 1996) and in parietal cortex (Di Russo et al., 2002,2003). Individual differences in unisensory processing that affected multisensory interactionshave been previously noted in a few studies (Giard and Peronnet, 1999, Fort et al., 2002). Inthose studies subjects were categorized as either “auditory dominant” or “visually dominant”based on their superior reaction times in one modality or the other, and these groups were foundto show differential cross-modal interaction effects in auditory/ visual sensory corticesdepending on which of their modalities was behaviorally dominant. Our findings suggest thatindividual differences in visual discrimination ability can also arise from processing differencesin the superior temporal region.
The trial-by-trial analysis of the ERPs in a group who saw flash fusion on about half the trialsrevealed diminished PD180 amplitudes on SEE1 vs. SEE2 trials. In contrast to the cross-modalFusion_Diff wave, this SEE2-SEE1 trial difference did not receive any contribution from theunimodal (A1 or V1V2) ERPs. Thus, the trial-by-trial difference in the PD180 latency rangeoriginated solely from differential processing of the A1V1V2 stimulus on SEE2 vs. SEE1 trialsand was not a consequence of subtracting a larger N1 amplitude in the Fusion_Diff wave, whichclearly contributed to the larger PD180 in the SEE2 vs. SEE1 groups as described above. In alater time window (228–248 ms) a SEE1 vs. SEE2 trial difference was also found in visualcortex (ND240OccDiff) that localized to ventral extrastriate areas near the fusiform gyrus. Thiscomponent was unique to the SEE2-SEE1 trial difference and differed in topography andsource localization from the ND240 component in the Fusion_Diff wave, whose neuralgenerators lay in the vicinity of superior temporal cortex. Since the ND240OccDiff modulationin visual cortex occurred after the PD180 modulation in polymodal superior temporal area, itmay be a result of feedback from the polymodal area. In a recent fMRI investigation Watkinset al. (2007) reported greater BOLD (blood oxygen level dependent) activity in primary visualcortex on SEE2 vs. SEE1 trials. In the present study the enhanced occipital ERP on the SEE2trials was localized primarily to ventral extrastriate visual cortex, but a primary cortexcontribution could not be entirely ruled out. The superior temporal resolution of the ERPrecordings, however, suggests that trial-specific visual cortex involvement did not occur in theinitial response phase but rather was probably driven by feedback from higher polymodal areas.Connectivity analyses in a recent fMRI study of audio-visual temporal correspondence also
Mishra et al. Page 8
Brain Res. Author manuscript; available in PMC 2009 November 25.
NIH
-PA Author Manuscript
NIH
-PA Author Manuscript
NIH
-PA Author Manuscript

provided evidence for feedback from the superior temporal area to primary visual cortex(Noesselt et al., 2007b).
A recent ERP study of auditory driving of visual perception used slow audio-visual flutter andflicker rates of 3–5 Hz and found that modulation of occipital visual areas occurred as late as500 ms after stimulus onset, subsequent to modulation at parietal and frontal recording sites(Noesselt et al., 2007a). Auditory driving has been considered an extended case of the sound-induced flash fusion/fission phenomena, and hence the later occipital modulations found byNoesselt et al. (2007a) may correspond to the trial specific occipital modulations observed inthe current study. Noesselt et al. (2007a) also suggested that the late occipital modulations intheir study may be a result of feedback from higher multisensory areas. Finally, a modulationwithin extrastriate visual areas was also observed within a similar latency range asND240OccDiff by Meylan and Murray (2007), who isolated activity to the second flash V2 ofthe A1V1V2 stimulus by subtracting ERPs to A1V1 from the ERPs to the cross-modal stimulus.Subjects in their study did not perceive the flash fusion illusion, however, which could be dueto their smaller subject pool of 8 participants or different stimulus parameters.
In conclusion, we investigated the neural correlates of the sound-induced flash fusion illusionusing whole head ERP recordings. For individuals with a reduced ability to discriminate thetwo flashes of A1V1V2 as being separate, the large cross-modal interaction component PD180,onsetting 80–112 ms after V2 and localizing to superior temporal area, was greatly diminished.Within these subjects the early phase of the anteriorly distributed N1 component to V1V2stimuli (148–168 ms) was also significantly reduced. This early N1 was localized to the samesuperior temporal region as the PD180, while the later phase (168–188 ms) that was localizedto extrastriate visual cortex did not show any group difference. The covariation of the PD180and N1 amplitudes across subjects suggested that individual differences in perception of thecross-modal flash fusion phenomenon are driven in large part by individual differences invisual processing. A modulation in the PD180 latency range localized to the superior temporalarea was also consistently observed in the trial-by-trial analysis of the ERPs, followed by adelayed modulation in extrastriate visual cortex (228–248 ms). These trial specific modulationswere attenuated when the second flash was not perceived by subjects. Overall, these neuralprocesses associated with flash fusion were found to be very different in their spatio-temporalpattern from the neural correlates of the sound-induced extra flash illusion (Mishra et al.,2007). The illusory extra flash generated to the A1V1A2 stimulus was found to depend on anearly sequence of activity (90–150 ms post-stimulus onset) involving auditory, visual andsuperior temporal cortices, all of which occurred before the emergence of the first corticalmodulation associated with the flash fusion percept (the PD180). Hence, although the extraflash illusion and flash fusion may appear to be reciprocal phenomena their neural counterpartsare very different. The present results suggest that the veridical perception of the two flashesin the V1V2 and A1V1V2 stimuli depends upon a larger visual evoked response and an enhancedcross-modal interaction in superior temporal cortex. Activation of this multisensory region andsubsequent feedback to visual cortex may enable accurate judgments of the timing andsequencing of visual stimuli in both unimodal and crossmodal contexts.
4. EXPERIMENTAL PROCEDURESSubjects
This paper reports additional analyses of the data obtained in the experiment previouslyreported by Mishra et al. (2007). Whereas our initial study was focused on the extra flashillusion, the present report analyzes the flash fusion effect observed in the same experiment.Thirty-four right-handed healthy adults (18 females, mean age 23.9 yrs) participated in thestudy after giving written informed consent as approved by the University of California, San
Mishra et al. Page 9
Brain Res. Author manuscript; available in PMC 2009 November 25.
NIH
-PA Author Manuscript
NIH
-PA Author Manuscript
NIH
-PA Author Manuscript

Diego Human Research Protections Program. Each participant had normal or corrected-to-normal vision and normal hearing.
Stimuli and TaskThe experiment, previously described in Mishra et al. (2007), was conducted in a sound-attenuated chamber having a background sound level of 32 dB and a background luminanceof 2 cd/m2. Subjects maintained fixation on a central cross positioned at a viewing distance of120 cm. Auditory (A) and visual (V) stimuli were delivered from a speaker and red lightemitting diode (LED), respectively, both positioned 20° of visual angle to the left of fixation(Fig. 7A). Each visual stimulus was a 5 ms 75 cd/m2 flash, and each auditory stimulus was a10 ms 76 dB noise burst. Ten different stimulus combinations were presented in random orderon each block of trials (Fig. 7B). These included unimodal auditory stimuli, occurring singly(A1) or in pairs (A1A2) and unimodal visual stimuli occurring singly (V1) or in pairs (V1V2).Bimodal stimulus combinations included the stimulus of interest in the current study:A1V1V2, as well as A1V1, A1V1A2V2, A1V1A2, and A1A2V1. In this terminology, suffixes 1or 2 denote the first or second occurrence of the auditory or visual component of each stimuluscombination. These various bimodal and unimodal stimuli (apart from illusory perceptgenerating stimuli: A1V1V2 and A1V1A2) were included to ensure that subjects wereresponding veridically on the basis of the number of perceived flashes (one or two) and not onthe basis of the number of sounds. Finally, on blank or no-stimulus (no-stim) trials ERPs wererecorded over the same epochs as for actual stimuli but with no stimulus presented.
The timing of the A and V components for all stimulus combinations (except no-stim) isillustrated in Fig. 7. Briefly, the SOA between the two stimuli in the A1A2 and V1V2 pairs was70 ms in every stimulus combination that included them. The A1V1 SOA was 10 ms in allbimodal stimulus combinations except for A1A2V1, where V1 followed A1 by 200 ms; thiscombination served as a delayed flash control for the A1V1A2 stimulus that produced the extra-flash illusion.
Stimuli were presented in 16 blocks with 20 trials of each of the ten stimulus combinationsoccurring on each block in a randomized sequence. All stimuli occurred with equal probabilityand were presented at irregular intervals of 1200–1800 ms. Subjects were instructed to reportthe number of flashes perceived (one or two) after each stimulus combination that containedone or more flashes. No responses were required to the unimodal auditory stimulation.
Behavioral AnalysisFor each stimulus configuration that contained one or two flashes, the percentages of one andtwo flash reports were calculated for each individual subject. Responses were scored within a200–1200 ms period post-stimulus onset, and mean reaction times (RTs) were also calculatedseparately for each response type and stimulus. Percent responses as well as RTs werecompared across stimulus conditions using t-tests. Given the variability among subjects inpercent fusion responses to the stimulus of interest, A1V1V2, behavioral measures were alsocompared between subjects. For this analysis, the pool of 34 subjects was divided into twogroups, designated SEE1 and SEE2 (17 in each), by a median split of the percent correctresponses on the A1V1V2 stimulus. The SEE1 group was the group of subjects that reportedseeing one flash (flash fusion) more frequently, and the SEE2 group included those who morefrequently reported a veridical two-flash percept of the A1V1V2 stimulus. The SEE1 and SEE2groups were equivalent in age and gender of subjects (SEE1 group: 9 females, mean age 23yrs; SEE2 group: 9 females, mean age 24.8 yrs).
In order to verify that differences in behavioral responses between the SEE1 and SEE2 subjectgroups were due to differences in perceptual sensitivity rather than decision bias, a signal
Mishra et al. Page 10
Brain Res. Author manuscript; available in PMC 2009 November 25.
NIH
-PA Author Manuscript
NIH
-PA Author Manuscript
NIH
-PA Author Manuscript
detection analysis was performed (MacMillan & Creelman, 1991). For the A1V1V2 stimulus,the average perceptual sensitivity estimate (d’) and the likelihood ratio criterion bias (β) werecalculated in each group. For each subject, correct two-flash responses to A1V1V2 werecategorized as ‘hits’ and one-flash responses as ‘misses’; incorrect two-flash responses toA1V1 were considered ‘false alarms’ and one-flash responses as ‘correct rejections’. Thesed’ and β estimates were compared between the SEE1 and SEE2 groups using t-tests. Thesesignal detection parameters were also compared between the two subject groups for theV1V2 stimulus; in this case accurate two-flash responses to V1V2 were categorized as hits andincorrect two-flash responses to V1 as false alarms.
Electrophysiological (ERP) RecordingsThe EEG was recorded from 62 electrode sites using a modified 10-10 system montage (Teder-Sälejärvi et al., 2005). Horizontal and vertical electro-oculograms (EOGs) were recorded bymeans of electrodes at the left and right external canthi and an electrode below the left eye,respectively. The importance of fixation was emphasized to subjects, and the experimentercontinually monitored the EOG and verified fixation in all blocks. All electrodes werereferenced to the right mastoid electrode. Electrode impedances were kept below 5 kΩ.
All signals were amplified with a gain of 10,000 and a bandpass of 0.1–80 Hz (−12 dB/octave;3dB attenuation) and were digitized at 250 Hz. Automated artifact rejection was performedprior to averaging to discard trials with eye movements, blinks or amplifier blocking. Signalswere averaged in 500 ms epochs with a 100 ms pre-stimulus interval and digitally low-passfiltered with a Gaussian finite impulse function (3 dB attenuation at 46 Hz). The filteredaverages were digitally re-referenced to the average of the left and right mastoids.
The three-dimensional coordinates of each electrode and of three fiducial landmarks (the leftand right pre-auricular points and the nasion) were determined by means of a Polhemus spatialdigitizer (Polhemus Corp., Colchester, VT). The mean cartesian coordinates for each site wereaveraged across all subjects and used for topographic mapping and source localizationprocedures.
Neural activity associated with perception of sound-induced flash fusion was isolated bycalculating the cross-modal interaction between the auditory and visual components of theA1V1V2 stimulus; in this calculation the ERPs elicited by the individual unimodal componentswere subtracted from the ERP elicited by the total configuration, as follows:
Neural activity associated with sound induced flash fusion: Fusion_Diff = [(A1V1V2) + no-stim] – [A1 + V1V2]
The blank or no-stimulus ERP (no-stim) was included in the calculation of the cross-modaldifference waves to balance any prestimulus activity (such as a negative going anticipatoryCNV) that was present on all trials and may extend into the early post-stimulus period. If theno-stim trials were not included such activity would be added once but subtracted twice in thedifference wave, possibly introducing an early deflection that could be mistaken for a truecross-modal interaction (Teder-Sälejärvi et al., 2002; Talsma & Woldorff 2005; Gondan &Röder 2006; Mishra et al., 2007).
Data AnalysisERP components observed in the Fusion_Diff difference wave were first tested for significancewith respect to the 100 ms prestimulus baseline and compared by t-tests over all subjects(n=34). The scalp distributions and underlying neural generators of these components werethen compared using methods described below. To characterize the neural correlates ofperception of the cross-modal flash fusion illusion, both between-subject and within-subject
Mishra et al. Page 11
Brain Res. Author manuscript; available in PMC 2009 November 25.
NIH
-PA Author Manuscript
NIH
-PA Author Manuscript
NIH
-PA Author Manuscript
(trial-by-trial) analyses were undertaken. The between-subject analysis was performed on theSEE1 and SEE2 subject groups described in the behavioral methods section above.
For all analyses difference wave components were quantified as mean amplitudes withinspecific latency windows around the peak for each identified positive difference (PD) ornegative difference (ND) component with respect to the mean voltage of a 100 ms prestimulusbaseline. Components in the Fusion_Diff difference wave were measured at 160–192 ms(PD180) and 224–256 ms (ND240). Each component was measured as the mean voltage overa specific cluster of electrodes where its amplitude was maximal. PD180 amplitude wasmeasured over fronto-central electrode clusters (8 in each hemisphere and 4 over midline) andND240 measured over similar central electrode clusters. Another component measured wasthe visual N1 (148−184 ms) elicited by the two unimodal visual stimuli (V1 and V1V2).
Scalp distributions of these ERP components were compared between the SEE1 and SEE2groups after normalizing their amplitudes prior to ANOVA according to the method describedby McCarthy and Wood (1985). For all components comparisons were made over 38 electrodesspanning frontal, central, parietal and occipital sites (15 in each hemisphere and 8 along themidline). Differences in scalp distribution were reflected in significant group by electrodeinteractions. Scalp topographies of PD180 in the Fusion_Diff waveform and the visual N1evoked by V1V2 were also compared in terms of the stimulus by electrode interaction.
Modeling of ERP SourcesSource localization was carried out to estimate the intracranial generators of components inthe grand-averaged ERPs and difference waves within the same time intervals as those usedfor statistical testing. Source locations were estimated by dipole modeling using BESA (BrainElectrical Source Analysis 2000, version 5). The BESA algorithm estimates the location andthe orientation of multiple equivalent dipolar sources by calculating the scalp distribution thatwould be obtained for a given dipole model (forward solution) and comparing it to the actualscalp-recorded ERP distribution (Scherg, 1990). The algorithm interactively adjusts (fits) thelocation and orientation of the dipole sources in order to minimize the relative variance (RV)between the model and the observed spatio-temporal ERP distribution. This analysis used thethree-dimensional coordinates of each electrode site as recorded by a spatial digitizer.Symmetrical pairs of dipoles were fit sequentially to the components of interest; dipole pairswere constrained to be mirror-symmetrical with respect to location but were free to vary inorientation.
To visualize the anatomical brain regions giving rise to the different components the locationsof BESA source dipoles were transformed into the standardized coordinate system of Talairachand Tournoux (1988) and projected onto a structural brain image supplied by MRIcro (Rordenand Brett, 2000) using AFNI (Analysis of Functional NeuroImaging: Cox, 1996) software.
Trial based AnalysisA trial-by-trial analysis of the ERPs elicited associated with flash fusion (in the Fusion_Diffwaveform) was performed by separating the A1V1V2 trials on which subjects correctly reportedseeing two flashes (SEE2 trials) from trials on which only a single flash (SEE1 trials) was seen.Fusion_Diff waves were averaged separately for the SEE2 trials and SEE1 trials, and the SEE2-SEE1 double difference wave was generated for every subject. The grand-averaged SEE2-SEE1 waveform was calculated for 15 subjects whose behavioral SEE1 responses to theA1V1V2 stimulus were nearest to the overall median; in these subjects the number of SEE2and SEE1 trials were approximately the same, 54% and 46% of the total trials, respectively,while other subjects were excluded due to non-equivalent trial sums in their SEE2 and SEE1waveforms.
Mishra et al. Page 12
Brain Res. Author manuscript; available in PMC 2009 November 25.
NIH
-PA Author Manuscript
NIH
-PA Author Manuscript
NIH
-PA Author Manuscript
The main components in the SEE2-SEE1-trials double difference wave were identified in thePD180 latency range (172–200 ms) and at 228–248 ms (ND240occ). PD180 differencesbetween SEE2 and SEE1 trials were quantified as the mean voltage over the same fronto-centralelectrode clusters as specified above. The ND240occ trial differences were measured overoccipital sites (6 lateral electrodes in each hemisphere) where the differences were maximal.
AcknowledgementsThis work was supported by the NEI Grant EY01698432.
REFERENCESAndersen TS, Tiippana K, Sams M. Factors influencing audiovisual fission and fusion illusions. Brain
Res Cogn Brain Res 2004;21:301–308. [PubMed: 15511646]Arden GB, Wolf JE, Messiter C. Electrical activity in visual cortex associated with combined auditory
and visual stimulation in temporal sequences known to be associated with a visual illusion. Vision Res2003;43:2469–2478. [PubMed: 12972396]
Bavelier D, Neville HJ. Cross-modal plasticity: where and how? Nat Rev Neurosci 2002;3:443–452.[PubMed: 12042879]
Calvert, GA.; Stein, BE.; Spence, C. The handbook of multisensory processing. Cambridge, MA: MIT;2004.
Clark VP, Hillyard SA. Spatial selective attention affects early extrastriate but not striate components ofthe visual evoked potential. J Cogn Neurosci 1996;8:387–402.
Coles, MGH.; Smid, HGOM.; Scheffers, MK.; Otten, LJ. Mental chronometry and the study of humaninformation processing. In: Rugg, MD.; Coles, MGH., editors. Electrophysiology of mind. New York:Oxford University Press; 1995. p. 86-131.
Cox RW. AFNI: software for analysis and visualization of functional magnetic resonance neuroimages.Comput Biomed Res 1996;29:162–173. [PubMed: 8812068]
Di Russo F, Martinez A, Hillyard SA. Source analysis of event-related cortical activity during visuo-spatial attention. Cereb Cortex 2003;13:486–499. [PubMed: 12679295]
Di Russo F, Martinez A, Sereno MI, Pitzalis S, Hillyard SA. Cortical sources of the early componentsof the visual evoked potential. Hum Brain Mapp 2002;15:95–111. [PubMed: 11835601]
Fendrich R, Corballis PM. The temporal cross-capture of audition and vision. Percept Psychophys2001;63:719–725. [PubMed: 11436740]
Fort A, Delpuech C, Pernier J, Giard MH. Early auditory-visual interactions in human cortex duringnonredundant target identification. Brain Res Cogn Brain Res 2002;14:20–30. [PubMed: 12063127]
Ghazanfar AA, Schroeder CE. Is neocortex essentially multisensory? Trends Cogn Sci 2006;10:278–285. [PubMed: 16713325]
Giard MH, Peronnet F. Auditory-visual integration during multimodal object recognition in humans: abehavioral and electrophysiological study. J Cogn Neurosci 1999;11:473–490. [PubMed: 10511637]
Gondan M, Roder B. A new method for detecting interactions between the senses in event-relatedpotentials. Brain Res 2006;1073–1074:389–397.
Hillyard, SA.; Picton, TW. Electrophysiology of cognition. In: Plum, F., editor. Handbook o PhysiologySection 1: The Nervous System. Higher Functions of the Brain, Part 2, Vol. V. Bethesda, Maryland:American Physiological Society; 1987. p. 519-584.
Macaluso E, Driver J. Multisensory spatial interactions: a window onto functional integration in thehuman brain. Trends Neurosci 2005;28:264–271. [PubMed: 15866201]
Macmillan, NA.; Creelman, CD. Detection theory: A user's guide. New York: Cambridge UniversityPress; 1991.
McCarthy G, Wood CC. Scalp distributions of event-related potentials: an ambiguity associated withanalysis of variance models. Electroencephalogr Clin Neurophysiol 1985;62:203–208. [PubMed:2581760]
Mishra et al. Page 13
Brain Res. Author manuscript; available in PMC 2009 November 25.
NIH
-PA Author Manuscript
NIH
-PA Author Manuscript
NIH
-PA Author Manuscript

McDonald JJ, Teder-Salejarvi WA, Di Russo F, Hillyard SA. Neural substrates of perceptualenhancement by cross-modal spatial attention. J Cogn Neurosci 2003;15:10–19. [PubMed:12590839]
McDonald JJ, Teder-Salejarvi WA, Di Russo F, Hillyard SA. Neural basis of auditory-induced shifts invisual time-order perception. Nat Neurosci 2005;8:1197–1202. [PubMed: 16056224]
Meylan RV, Murray MM. Auditory-visual multisensory interactions attenuate subsequent visualresponses in humans. Neuroimage 2007;35:244–254. [PubMed: 17215144]
Mishra J, Martinez A, Sejnowski TJ, Hillyard SA. Early cross-modal interactions in auditory and visualcortex underlie a sound-induced visual illusion. J Neurosci 2007;27:4120–4131. [PubMed:17428990]
Molholm S, Ritter W, Murray MM, Javitt DC, Schroeder CE, Foxe JJ. Multisensory auditory-visualinteractions during early sensory processing in humans: a high-density electrical mapping study.Brain Res Cogn Brain Res 2002;14:115–128. [PubMed: 12063135]
Noesselt T, Bonath B, Boehler CN, Schoenfeld MA, Heinze HJ. On perceived synchrony-neuraldynamics of audiovisual illusions and suppressions. Brain Res. 2007a
Noesselt T, Rieger JW, Schoenfeld MA, Kanowski M, Hinrichs H, Heinze HJ, Driver J. Audiovisualtemporal correspondence modulates human multisensory superior temporal sulcus plus primarysensory cortices. J Neurosci 2007b;27:11431–11441. [PubMed: 17942738]
Recanzone GH. Auditory influences on visual temporal rate perception. J Neurophysiol 2003;89:1078–1093. [PubMed: 12574482]
Rorden C, Brett M. Stereotaxic display of brain lesions. Behav Neurol 2000;12:191–200. [PubMed:11568431]
Scherg, M. Fundamentals of dipole source analysis. In: Grandori, F.; Hoke, M.; Roman, GL., editors.Auditory evoked magnetic fields and electric potentials. 1990. p. 40-69.
Schroeder CE, Foxe J. Multisensory contributions to low-level, 'unisensory' processing. Curr OpinNeurobiol 2005;15:454–458. [PubMed: 16019202]
Sekuler R, Sekuler AB, Lau R. Sound alters visual motion perception. Nature 1997;385:308. [PubMed:9002513]
Shams L, Iwaki S, Chawla A, Bhattacharya J. Early modulation of visual cortex by sound: an MEG study.Neurosci Lett 2005a;378:76–81. [PubMed: 15774261]
Shams L, Kamitani Y, Shimojo S. Illusions. What you see is what you hear. Nature 2000;408:788.[PubMed: 11130706]
Shams L, Kamitani Y, Shimojo S. Visual illusion induced by sound. Brain Res Cogn Brain Res2002;14:147–152. [PubMed: 12063138]
Shams L, Kamitani Y, Thompson S, Shimojo S. Sound alters visual evoked potentials in humans.Neuroreport 2001;12:3849–3852. [PubMed: 11726807]
Shams L, Ma WJ, Beierholm U. Sound-induced flash illusion as an optimal percept. Neuroreport 2005b;16:1923–1927. [PubMed: 16272880]
Stein BE, London R, Wilkinson LK, Price DD. Enhancement of perceived visual intensity by auditorystimuli: a psychophysical analysis. J Cogn Neurosci 1996;8:497–506.
Stein, BE.; Meredith, MA. The merging of the senses. Cambridge, MA: MIT; 1993.Talairach, J.; Tournoux, P. Co-planar stereotaxic atlas of the human brain. New York: Thieme: 1988.Talsma D, Woldorff MG. Selective attention and multisensory integration: multiple phases of effects on
the evoked brain activity. J Cogn Neurosci 2005;17:1098–1114. [PubMed: 16102239]Teder-Salejarvi WA, Di Russo F, McDonald JJ, Hillyard SA. Effects of spatial congruity on audio-visual
multimodal integration. J Cogn Neurosci 2005;17:1396–1409. [PubMed: 16197693]Teder-Salejarvi WA, McDonald JJ, Di Russo F, Hillyard SA. An analysis of audio-visual crossmodal
integration by means of event-related potential (ERP) recordings. Brain Res Cogn Brain Res2002;14:106–114. [PubMed: 12063134]
Vroomen J, de Gelder B. Sound enhances visual perception: cross-modal effects of auditory organizationon vision. J Exp Psychol Hum Percept Perform 2000;26:1583–1590. [PubMed: 11039486]
Watkins S, Shams L, Josephs O, Rees G. Activity in human V1 follows multisensory perception.Neuroimage 2007;37:572–578. [PubMed: 17604652]
Mishra et al. Page 14
Brain Res. Author manuscript; available in PMC 2009 November 25.
NIH
-PA Author Manuscript
NIH
-PA Author Manuscript
NIH
-PA Author Manuscript

Watkins S, Shams L, Tanaka S, Haynes JD, Rees G. Sound alters activity in human V1 in associationwith illusory visual perception. Neuroimage. 2006
Mishra et al. Page 15
Brain Res. Author manuscript; available in PMC 2009 November 25.
NIH
-PA Author Manuscript
NIH
-PA Author Manuscript
NIH
-PA Author Manuscript
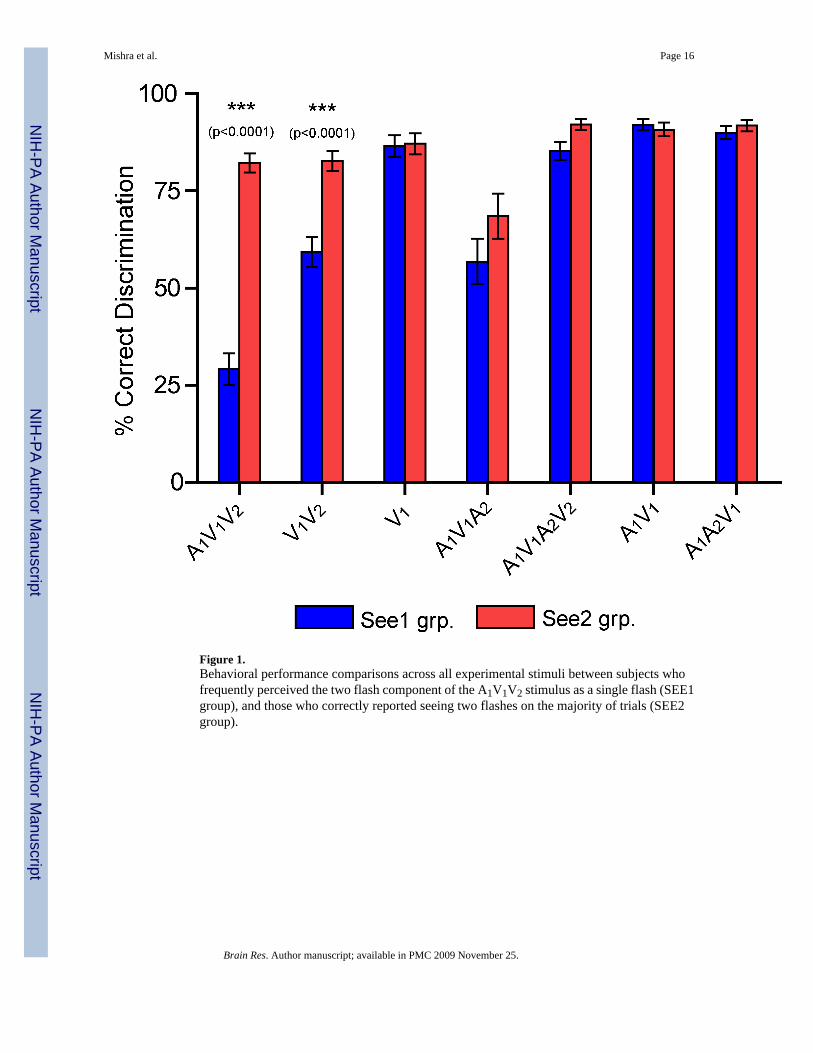
Figure 1.Behavioral performance comparisons across all experimental stimuli between subjects whofrequently perceived the two flash component of the A1V1V2 stimulus as a single flash (SEE1group), and those who correctly reported seeing two flashes on the majority of trials (SEE2group).
Mishra et al. Page 16
Brain Res. Author manuscript; available in PMC 2009 November 25.
NIH
-PA Author Manuscript
NIH
-PA Author Manuscript
NIH
-PA Author Manuscript
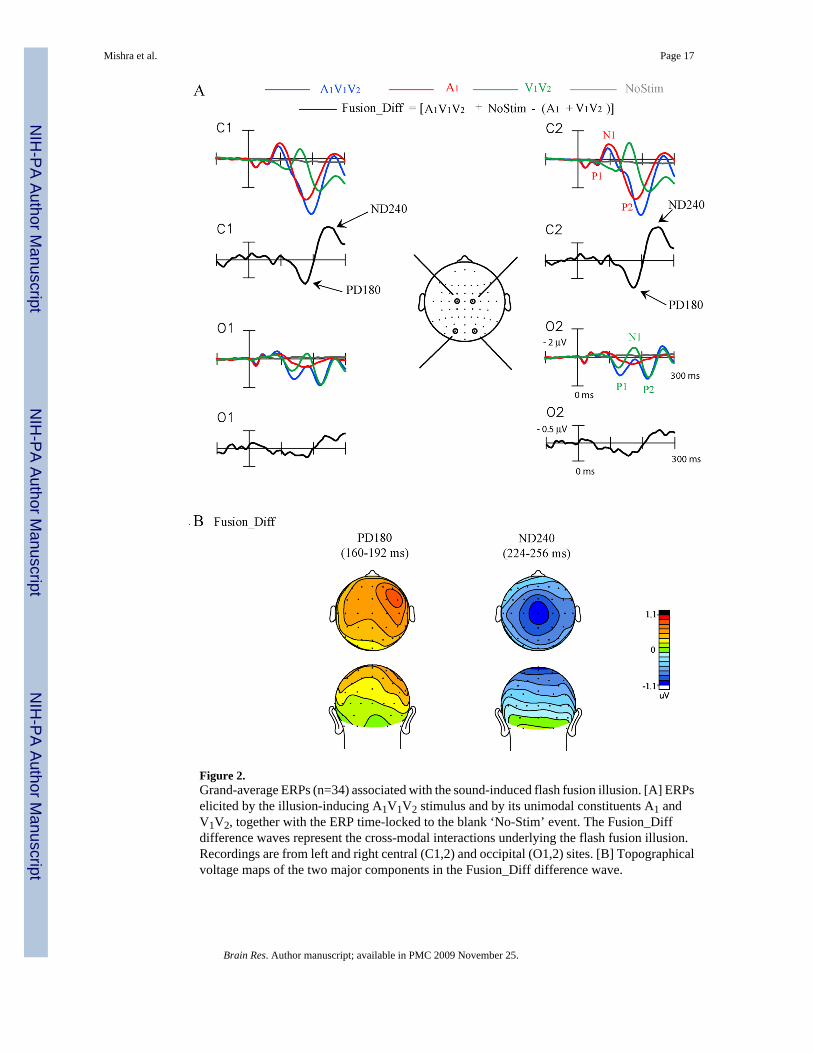
Figure 2.Grand-average ERPs (n=34) associated with the sound-induced flash fusion illusion. [A] ERPselicited by the illusion-inducing A1V1V2 stimulus and by its unimodal constituents A1 andV1V2, together with the ERP time-locked to the blank ‘No-Stim’ event. The Fusion_Diffdifference waves represent the cross-modal interactions underlying the flash fusion illusion.Recordings are from left and right central (C1,2) and occipital (O1,2) sites. [B] Topographicalvoltage maps of the two major components in the Fusion_Diff difference wave.
Mishra et al. Page 17
Brain Res. Author manuscript; available in PMC 2009 November 25.
NIH
-PA Author Manuscript
NIH
-PA Author Manuscript
NIH
-PA Author Manuscript
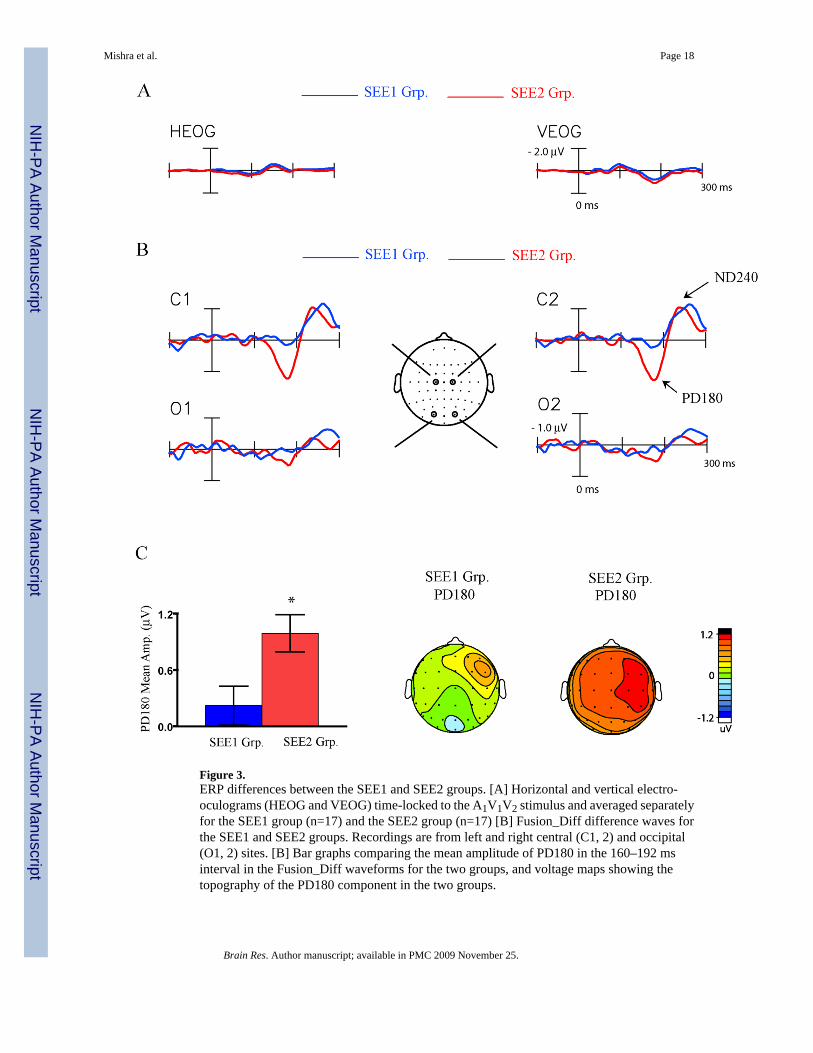
Figure 3.ERP differences between the SEE1 and SEE2 groups. [A] Horizontal and vertical electro-oculograms (HEOG and VEOG) time-locked to the A1V1V2 stimulus and averaged separatelyfor the SEE1 group (n=17) and the SEE2 group (n=17) [B] Fusion_Diff difference waves forthe SEE1 and SEE2 groups. Recordings are from left and right central (C1, 2) and occipital(O1, 2) sites. [B] Bar graphs comparing the mean amplitude of PD180 in the 160–192 msinterval in the Fusion_Diff waveforms for the two groups, and voltage maps showing thetopography of the PD180 component in the two groups.
Mishra et al. Page 18
Brain Res. Author manuscript; available in PMC 2009 November 25.
NIH
-PA Author Manuscript
NIH
-PA Author Manuscript
NIH
-PA Author Manuscript
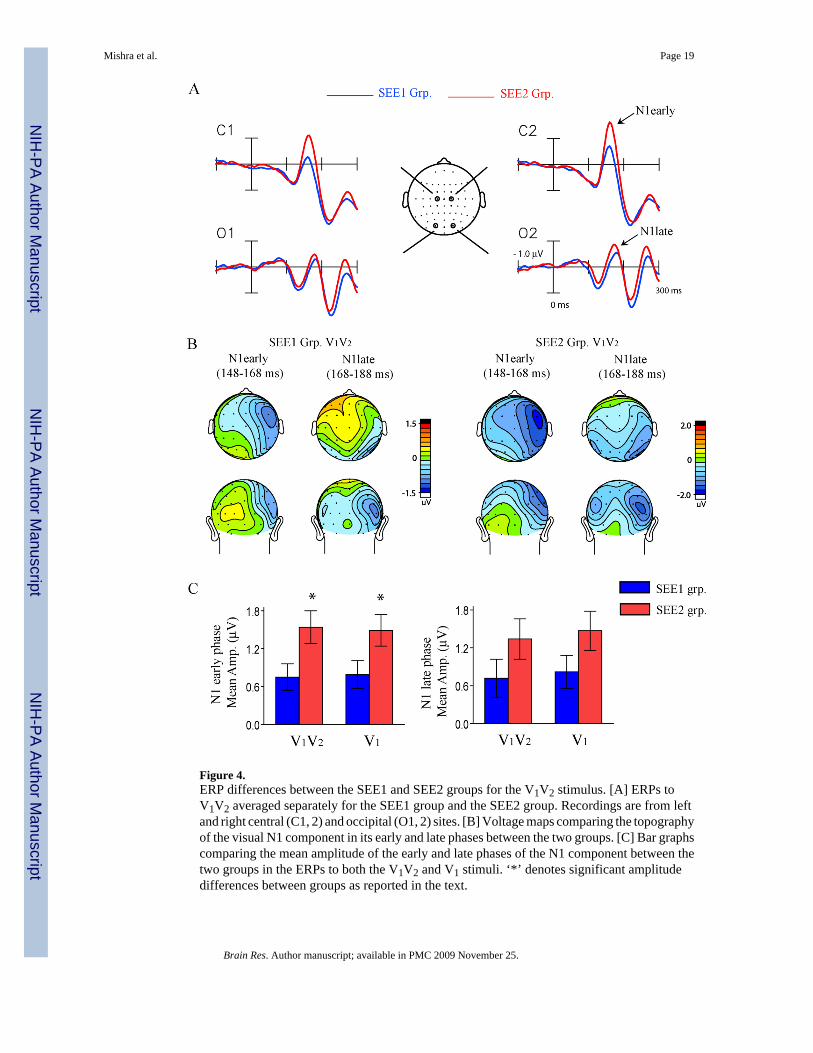
Figure 4.ERP differences between the SEE1 and SEE2 groups for the V1V2 stimulus. [A] ERPs toV1V2 averaged separately for the SEE1 group and the SEE2 group. Recordings are from leftand right central (C1, 2) and occipital (O1, 2) sites. [B] Voltage maps comparing the topographyof the visual N1 component in its early and late phases between the two groups. [C] Bar graphscomparing the mean amplitude of the early and late phases of the N1 component between thetwo groups in the ERPs to both the V1V2 and V1 stimuli. ‘*’ denotes significant amplitudedifferences between groups as reported in the text.
Mishra et al. Page 19
Brain Res. Author manuscript; available in PMC 2009 November 25.
NIH
-PA Author Manuscript
NIH
-PA Author Manuscript
NIH
-PA Author Manuscript
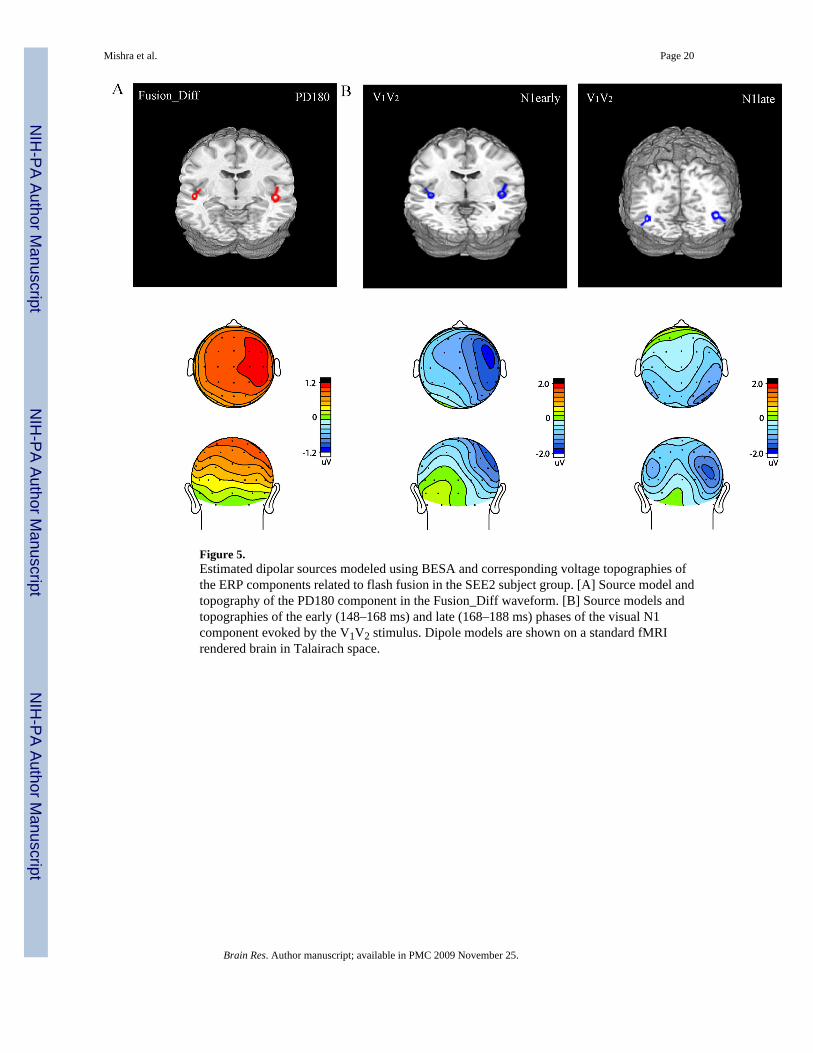
Figure 5.Estimated dipolar sources modeled using BESA and corresponding voltage topographies ofthe ERP components related to flash fusion in the SEE2 subject group. [A] Source model andtopography of the PD180 component in the Fusion_Diff waveform. [B] Source models andtopographies of the early (148–168 ms) and late (168–188 ms) phases of the visual N1component evoked by the V1V2 stimulus. Dipole models are shown on a standard fMRIrendered brain in Talairach space.
Mishra et al. Page 20
Brain Res. Author manuscript; available in PMC 2009 November 25.
NIH
-PA Author Manuscript
NIH
-PA Author Manuscript
NIH
-PA Author Manuscript
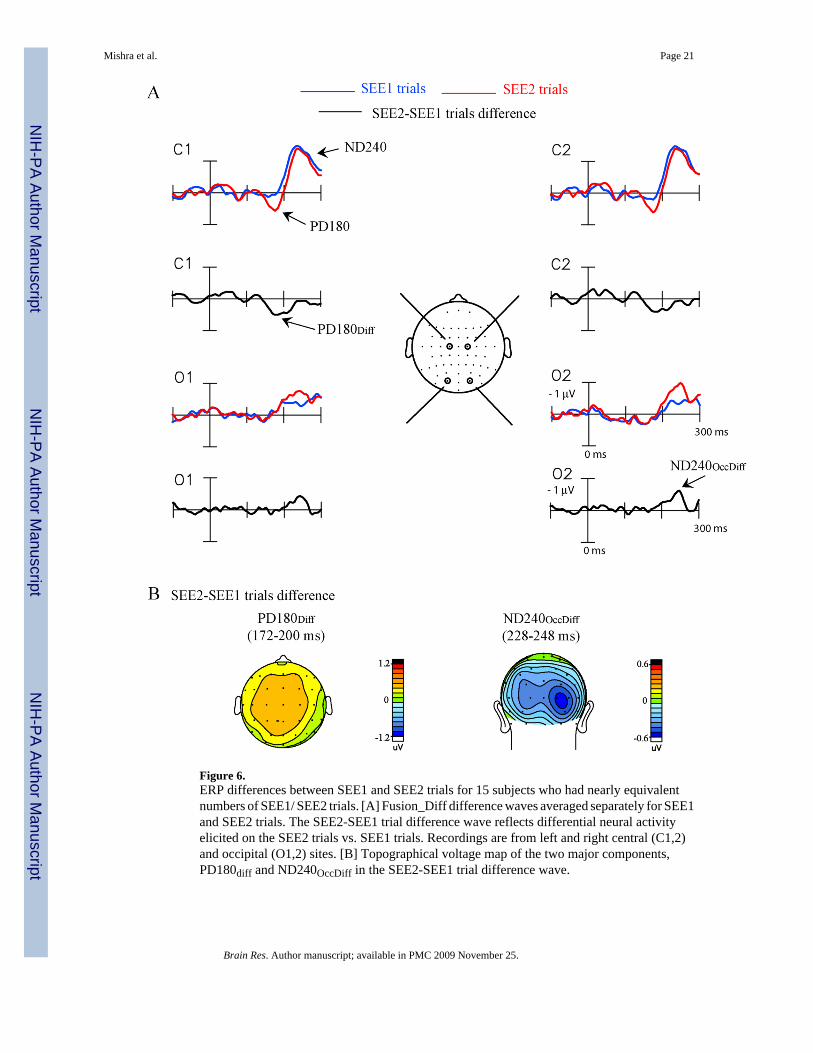
Figure 6.ERP differences between SEE1 and SEE2 trials for 15 subjects who had nearly equivalentnumbers of SEE1/ SEE2 trials. [A] Fusion_Diff difference waves averaged separately for SEE1and SEE2 trials. The SEE2-SEE1 trial difference wave reflects differential neural activityelicited on the SEE2 trials vs. SEE1 trials. Recordings are from left and right central (C1,2)and occipital (O1,2) sites. [B] Topographical voltage map of the two major components,PD180diff and ND240OccDiff in the SEE2-SEE1 trial difference wave.
Mishra et al. Page 21
Brain Res. Author manuscript; available in PMC 2009 November 25.
NIH
-PA Author Manuscript
NIH
-PA Author Manuscript
NIH
-PA Author Manuscript
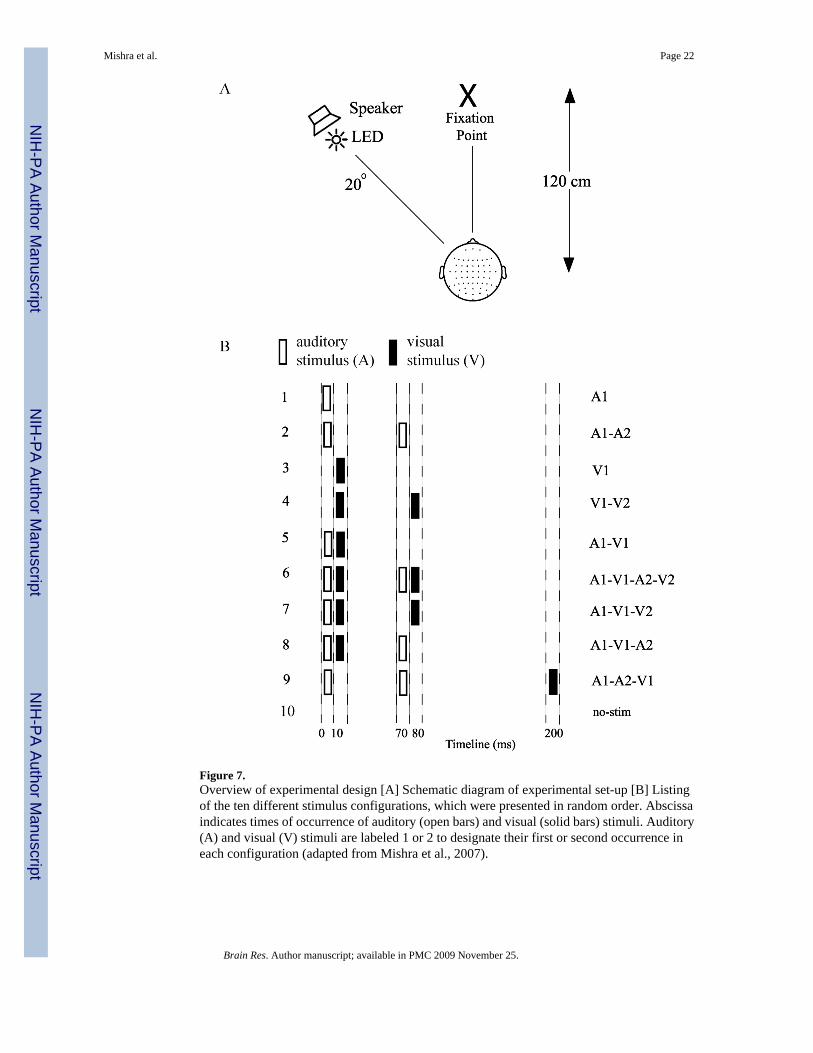
Figure 7.Overview of experimental design [A] Schematic diagram of experimental set-up [B] Listingof the ten different stimulus configurations, which were presented in random order. Abscissaindicates times of occurrence of auditory (open bars) and visual (solid bars) stimuli. Auditory(A) and visual (V) stimuli are labeled 1 or 2 to designate their first or second occurrence ineach configuration (adapted from Mishra et al., 2007).
Mishra et al. Page 22
Brain Res. Author manuscript; available in PMC 2009 November 25.
NIH
-PA Author Manuscript
NIH
-PA Author Manuscript
NIH
-PA Author Manuscript

NIH
-PA Author Manuscript
NIH
-PA Author Manuscript
NIH
-PA Author Manuscript
Mishra et al. Page 23
Table 1Mean behavioral performance for reporting the number of flashes seen (one or two) for stimulus combinationscontaining one or two visual stimuli. Percent trials on which the number of stimulus flashes were correctly reportedand the standard error of these percentages (s.e.m.) are reported over all 34 subjects. Mean response time (RT) measuresand the standard error of these RTs over all subjects are also shown (data from Mishra et al., 2007).
Stimulus Percent correctdiscrimination ofnumber of flashes
s.e.m.(% trials) Mean RT (ms) s.e.m. RT(ms)
V1 87 1.9 612 11
V1V2 67 3.5 660 13
A1V1 91 1.1 591 14
A1V1A2V2 87 1.7 615 14
A1V1V2 56 5.2 663 12
A1V1A2 63 4.2 684 12
A1A2V1 91 1.1 581 15
Brain Res. Author manuscript; available in PMC 2009 November 25.

NIH
-PA Author Manuscript
NIH
-PA Author Manuscript
NIH
-PA Author Manuscript
Mishra et al. Page 24Ta
ble
2M
ean
ampl
itude
s of E
RP
com
pone
nts i
n th
e di
ffer
ence
wav
es a
ssoc
iate
d w
ith so
und-
indu
ced
flash
fusi
on (F
usio
n_D
iff) a
vera
ged
over
all 3
4 su
bjec
ts. C
ompo
nent
s w
ere
mea
sure
d ov
er s
calp
site
s of
max
imal
am
plitu
de. S
igni
fican
ce le
vels
of c
ompo
nent
am
plitu
des
wer
ete
sted
with
resp
ect t
o th
e 10
0 m
s pre
-stim
ulus
bas
elin
e.
ER
P C
ompo
nent
Am
plitu
de (µ
V)
SEM
(µV
)t(3
3)p<
Fusi
on_D
iffPD
180
(160
–192
ms)
0.61
0.16
3.88
0.00
05
ND
240
(224
–256
ms)
−0.7
90.
18−4
.47
0.00
01
Brain Res. Author manuscript; available in PMC 2009 November 25.
NIH
-PA Author Manuscript
NIH
-PA Author Manuscript
NIH
-PA Author Manuscript
Mishra et al. Page 25Ta
ble
3C
ompo
nent
am
plitu
des i
n th
e Fu
sion
_Diff
wav
efor
ms a
nd N
1 am
plitu
des i
n th
e vi
sual
V1V
2 and
V1 w
avef
orm
s for
the
SEE1
and
SEE
2su
bjec
t gro
ups.
Com
pone
nts w
ere
mea
sure
d ov
er sc
alp
site
s of m
axim
al a
mpl
itude
and
test
ed fo
r sig
nific
ance
with
resp
ect t
o th
e 10
0 m
spr
e-st
imul
us b
asel
ine.
ER
PC
ompo
nent
SEE
1 g
rp.
SEE
2 gr
p.
Am
p.SE
Mt(1
6)p<
Am
p.SE
Mt(1
6)p<
(µV
)(µ
V)
(µV
)(µ
V)
Fusi
on_
PD18
00.
220.
211.
07n.
s.0.
990.
205.
010.
0002
Diff
ND
240
−0.7
40.
282.
650.
02−0
.84
0.22
3.73
0.00
2
A1V
1V2
PD18
0 in
terv
al2.
690.
426.
460.
0001
2.49
0.39
6.30
0.00
01
V1V
2N
1ear
ly (1
48–1
68 m
s)−0
.75
0.21
3.65
0.00
3−1
.54
0.26
5.91
0.00
01
N1l
ate
(168
–188
ms)
−0.7
20.
302.
420.
03−1
.34
0.32
4.16
0.00
08
V1
N1e
arly
(148
–168
ms)
−0.7
90.
223.
590.
003
−1.4
90.
255.
980.
0001
N1l
ate
(168
–188
ms)
−0.8
20.
263.
140.
007
−1.4
70.
314.
750.
0003
Brain Res. Author manuscript; available in PMC 2009 November 25.
NIH
-PA Author Manuscript
NIH
-PA Author Manuscript
NIH
-PA Author Manuscript
Mishra et al. Page 26Ta
ble
4Ta
laira
ch co
ordi
nate
s and
corr
espo
ndin
g br
ain
regi
ons o
f the
dip
ole f
its as
mod
eled
by
BES
A fo
r the
com
pone
nts i
n th
e Fus
ion_
Diff
and
V1V
2 w
avef
orm
s fo
r th
e SE
E2 s
ubje
ct g
roup
, and
als
o fo
r th
e co
mpo
nent
s in
the
SEE2
-SEE
1 tri
al d
oubl
e di
ffer
ence
wav
e. P
erce
ntre
sidu
al v
aria
nce
not a
ccou
nted
for b
y th
e m
odel
ove
r the
inte
rval
spec
ified
in p
aren
thes
es is
show
n fo
r eac
h co
mpo
nent
.
ER
P C
ompo
nent
x (m
m)
y (m
m)
z (m
m)
Reg
ion
Res
. Var
. (%
)
PD18
0±4
5−1
1−9
Vic
inity
of
3%
Supe
rior
(160
–192
ms)
Fusi
on_D
iff S
EE 2
Tem
pora
l
Gyr
us (S
TG)
ND
240
±45
−29
−6V
icin
ity o
f4%
STG
(224
–256
ms)
V1V
2 SEE
2N
1 (1
48–1
68 m
s)±4
1−1
1−1
Vic
inity
of
STG
5%
N1
(168−1
88 m
s)±3
9−6
2−7
Vic
inity
of
(148
–188
ms)
Fusi
form
Gyr
us
SEE2
-SEE
1 tri
alPD
180 D
iff±4
6−6
−5V
icin
ity o
f10
%
doub
le d
iffer
ence
STG
(172−2
00 m
s)
ND
240 O
ccD
iff±2
9−6
4−1
Vic
inity
of
4%
Ling
ual g
yrus
(228
–248
ms)
Brain Res. Author manuscript; available in PMC 2009 November 25.


![[Posterior cortical atrophy]](https://static.fdokumen.com/doc/165x107/6331b9d14e01430403005392/posterior-cortical-atrophy.jpg)