Seismic behaviour of single storey rat-trap bond masonry buildings retrofitted with GFRP

This article appeared in a journal published by Elsevier. The attachedcopy is furnished to the author for internal non-commercial researchand education use, including for instruction at the authors institution
and sharing with colleagues.
Other uses, including reproduction and distribution, or selling orlicensing copies, or posting to personal, institutional or third party
websites are prohibited.
In most cases authors are permitted to post their version of thearticle (e.g. in Word or Tex form) to their personal website orinstitutional repository. Authors requiring further information
regarding Elsevier’s archiving and manuscript policies areencouraged to visit:
http://www.elsevier.com/copyright
Author's personal copy
Investigation of structural behaviours of laterally restrained GFRP reinforcedconcrete slabs
Yu Zheng ⇑, Chunhong Li 1, Guoyou Yu 1
Department of Civil Engineering, Dongguan University of Technology, Dongguan, Guangdong Province 523808, PR China
a r t i c l e i n f o
Article history:Received 14 April 2011Received in revised form 10 August 2011Accepted 1 November 2011Available online 10 November 2011
Keywords:A. Glass fibresB. StrengthB. Mechanical propertiesC. Finite element analysis (FEA)D. Mechanical testing
a b s t r a c t
The corrosion of reinforcement in concrete bridge deck has been the cause of major deterioration and ofhigh costs in repair and maintenance. Glass fibre reinforced polymer (GFRP) reinforcement is a more dura-ble alternative to steel reinforcement and has higher strength to weight ratio. Due to the low value of elas-ticity and brittle behaviour of GFRP, the service behaviour of GFRP reinforced concrete structure is critical.However, laterally restrained slabs, such as those in bridge deck slabs, exhibit arching action or compres-sive membrane action (CMA) which has a beneficial influence on the service behaviour such as the deflec-tion. This paper presents the results of experimental tests and numerical analysis of laterally restrainedGFRP reinforced concrete slabs with varying some structural variables. The analysis results are discussedand conclusions on the compressive membrane action in GFRP reinforced concrete slabs are presented.
� 2011 Elsevier Ltd. All rights reserved.
1. Introduction
It has been increasingly evident that the corrosion of steel rein-forcement due to the de-icing salts has one of the major factors inthe deterioration of reinforced concrete bridge decks [1,2]. Onesolution to these corrosion problems is the use of alternativenon-corrosive materials to replace steel reinforcement, such as fi-bre reinforced polymers (FRPs) [3]. Because glass FRP bar is moreeconomical than the available types (carbon and aramid) of FRPreinforcing bars [4], it is more attractive for infrastructure applica-tions and to the construction industry. However, the majority of re-cent research using GFRP reinforcement has concentrated onsimply supported slabs. Due to the low elastic modulus and brittlebehaviours of GFRP, the deflection in the GFRP reinforced sectionsis greater compared to steel reinforced concrete slabs. Therefore,the deflection criterion tends to control the design of intermediateand long spanning sections reinforced with GFRP bars [5–8]. Con-versely, it is the ultimate strength governing the structural designof steel reinforced concrete sections. Interestingly, in laterallyrestrained slabs, such as bridge deck slabs, it is generally laterallyrestraint stiffness and concrete compressive strength which governthe structural behaviours and independent to the percentage andtype of reinforcement [9].
It has been recognised for some time [10–12] that laterally re-strained slabs exhibit strengths far in excess of those predicted
by most design codes. The load capacities are enhanced signifi-cantly due to the arching action or compressive membrane action(CMA), which are far larger than those predicted by flexural meth-ods [13]. Furthermore, research by Kirkpatrick et al. [14,15] hasshown that CMA also has a beneficial effect on the serviceabilityof laterally restrained slabs. As a result, it is possible to producean economic and durable concrete slabs by utilising the benefitsof GFRP reinforcement in combination of CMA.
The aim of this paper is to study the structural behaviours of GFRPreinforced concrete slabs with lateral restraint stiffness. A series ofexperimental tests was carried out to investigate the influences fromsome structural variables on the response of concrete slabs, whichincluded concrete compressive strengths, boundary conditions,reinforcement percentage and type of reinforcing materials. Theexperimental results were ultimate loads, deflections and reinforce-ment strains. To this end, a commercial software named ABAQUS[16], which accommodates non-linear 3D FEM models, can beemployed. The proposed numerical model showed good conver-gence ability and an excellent agreement of structural behaviourswith the validations of experimental tests by authors. Subsequently,the observed structural behaviours of laterally restrained slabs andeffect of CMA in this non-metallic structure were presented.
2. Experimental program
2.1. Details of test models
The experimental investigations were on slabs strips represen-tative of the typical sections of bridge deck slabs at full-scale. The
1359-8368/$ - see front matter � 2011 Elsevier Ltd. All rights reserved.doi:10.1016/j.compositesb.2011.11.012
⇑ Corresponding author. Tel.: +86 76922862691/15899662977; fax: +8676922862100.
E-mail address: [email protected] (Y. Zheng).1 Tel.: +86 76922862691/15899662977; fax: +86 76922862100.
Composites: Part B 43 (2012) 1586–1597
Contents lists available at SciVerse ScienceDirect
Composites: Part B
journal homepage: www.elsevier .com/locate /composi tesb

Author's personal copy
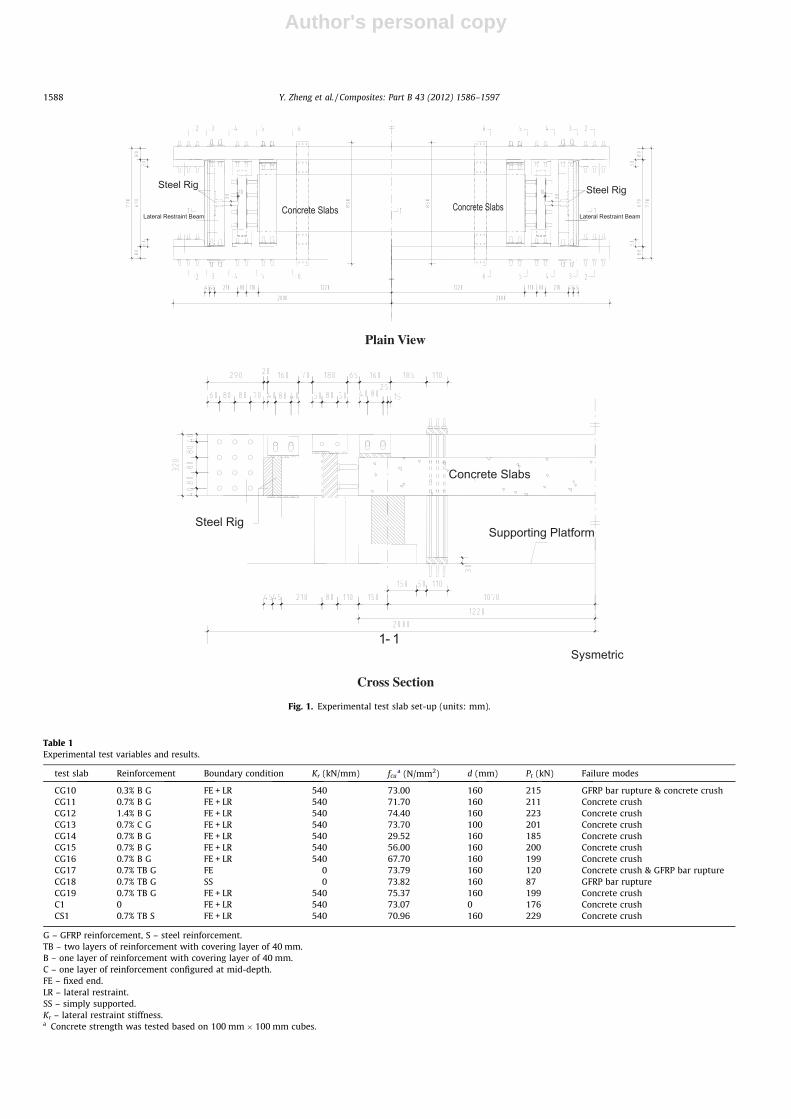
dimensions of slabs are shown in Fig. 1. This experimental studyfocused on one-way spanning slabs with varying reinforcementpercentages, concrete compressive strengths, boundary conditionsand reinforcing materials (see Table 1). The influences from GFRPreinforcement ratios were investigated by three slabs with per-centages varying from 0.3% to 1.4%. Furthermore, the reinforce-ment positions and reinforcing material types were also studiedin this laboratory test. In the investigation of structural behavioursin the slabs with different concrete compressive strengths, fourtest models were designed with the strengths changing from30 N/mm2 to 80 N/mm2. To achieve a noticeable arching effect,the comparisons of the models with different boundary conditionswere required. Therefore, two additional slabs without lateral re-straints were established.
The eleven slabs were made according to the trial mix resultsand the experimental variables are summarised in Table 1. TheGFRP reinforcing bars with 9 mm diameter were tested for theirultimate strength and elastic modulus. The test method was con-figured according to the research by Castro and Carion [17] withthe loading rate of 0.2 N/s. The test results are compared withthe manufacturer’s reported strength and modulus of elasticity asshown in Table 2.
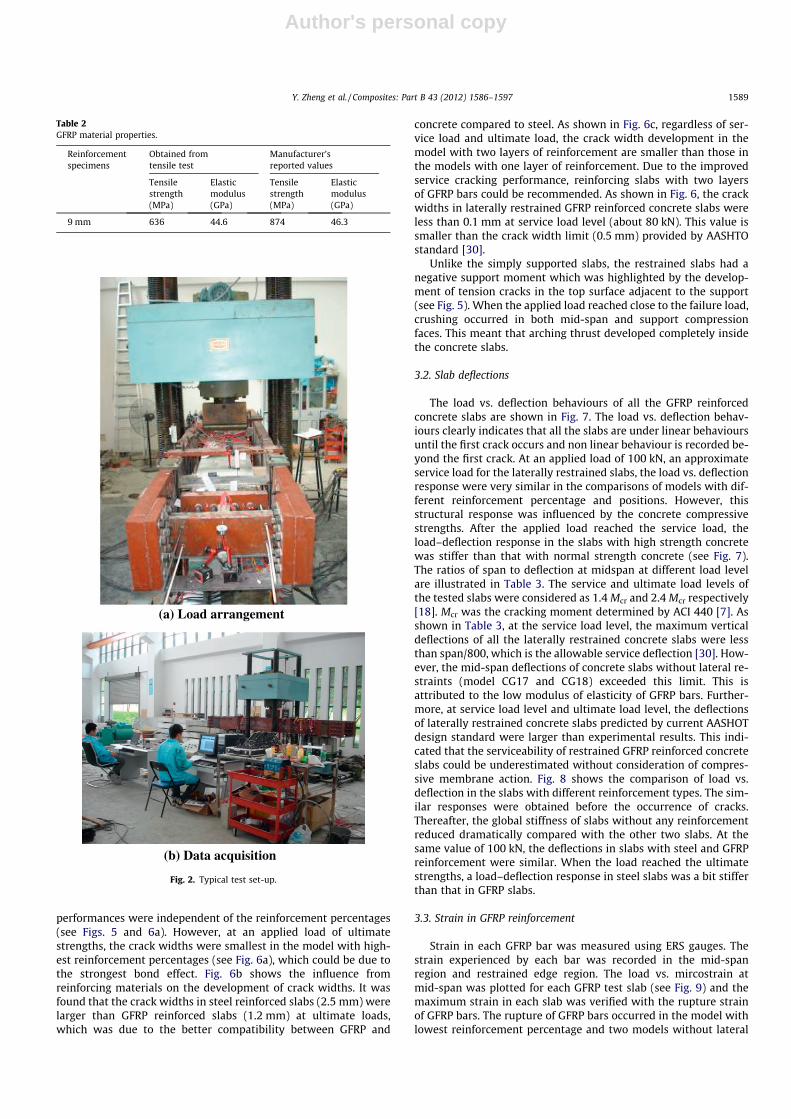
2.2. Test apparatus and instrumentation
The effectiveness of compressive membrane forces is dependenton the stiffness of lateral restraints. As shown in Figs. 1 and 2, asteel frame was used to provide restraints and was analogous tothe boundary conditions of the real bridge deck slabs. To ensurethe fully encastre support, provision was made for bolting at eachend. A layer of filler was placed on the slab prior to the bedding theend-clamp plates and each bolt were tightened to a similar torqurevalue of 80 N m to provide an even fixity.
In all the test slabs, a line load was applied across the mid-spanof each test slab (see Fig. 2a). Loading was applied through a stiffloading beam with a 20 mm knife edge loading plate. The applica-tion of load was from an accurately calibrated 500 kN capacityDartec electro hydraulic actuator. A spherical seating was locatedbetween the ram and the loading beam to minimise the effects
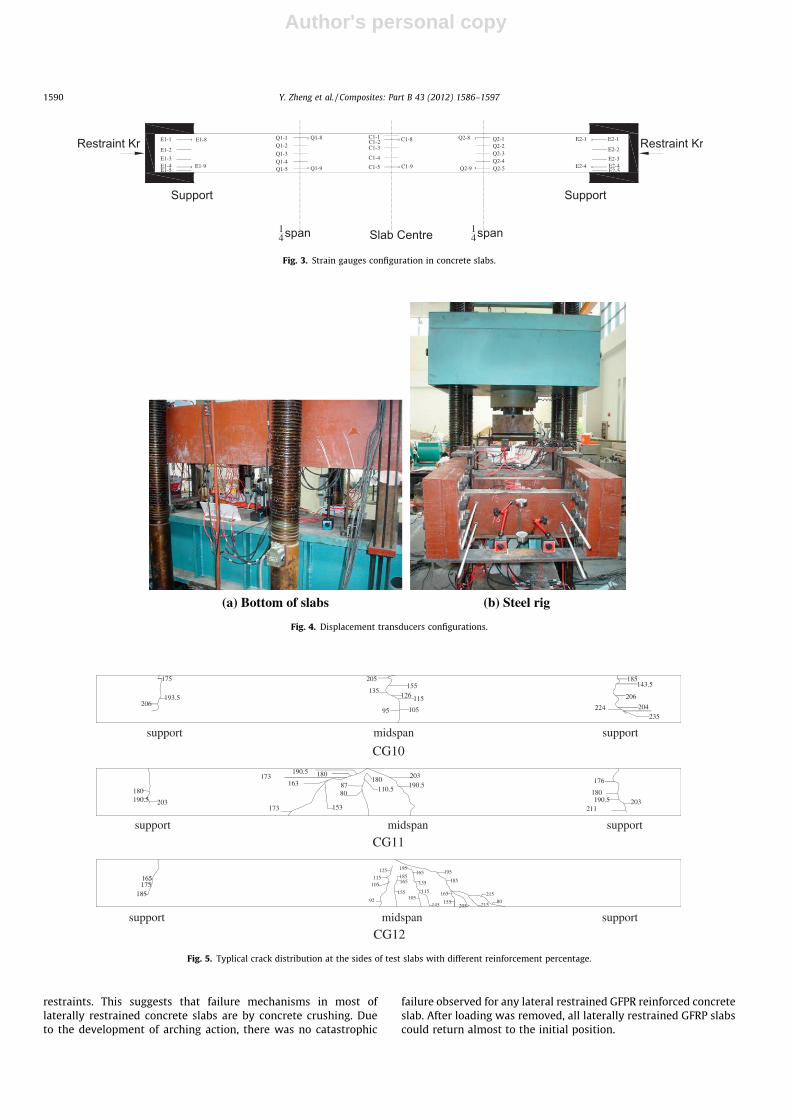
of any possible misalignment of load. After the test slabs werepositioned in the test frame, the strain gauges and transducerswere connected to a data acquisition system (see Fig. 2b). Beforethe experimental test, the sensitivity of the transducers was veri-fied by calibration. Readings were recorded at each load increment.Electrical resistant strain (ERS) gauges were embedded in GFRPbars to assess the strain development in both mid-span and sup-port location. The vibrating strain gauges were configured atmid-span, 1/4 span and support of sides of concrete slabs (seeFig. 3). Three electronic displacement transducers were located atthe mid-span and 1/4 span of the concrete slabs to measure thevertical deflections of test models (see Fig. 4a). The horizontalmovements of steel rigs were recorded by using displacementtransducers at the end of steel frames (see Fig. 4b).
2.3. Test procedure
All of the test slabs were required to be accurately positioned inthe restraining rig and the positioning the slabs relative to theloading frame should be taken care to minimise the eccentricity.In the loading procedure of each slab, two preliminary test loadswere applied the recovery was measured. Thereafter, the testsslabs loaded incrementally to failure. In the GFRP reinforced con-crete slabs, serviceability behaviour can be more significant thanultimate strength. Therefore, deflection of the slabs, crack widthdevelopment, strain in GFRP bars and concrete slabs were mea-sured in all the experimental models.
3. Behaviours and discussion of the test slabs
3.1. Crack formation and crack width development
In all the test slabs, the first crack appeared directly below theload point and propagated towards compressive face. Fig. 5illustrates the crack patterns in the restrained slabs with differentreinforcement percentages. The cracking was more pronounced inthe slabs with higher reinforcement ratios. Before the applied loadreached 100 kN, the crack patterns and crack widths were verysimilar among slabs CG10, CG11 and CG12. The structural
Nomenclature
fc compressive stressf 0c maximum stressec compressive straine0c strain when fc reaches f 0cn curve fitting factor (as n becomes higher the rising curve
becomes more linear)Ec elastic modulus of concrete materialr1,2,3 principle stressa coefficient determined from the initial equibiaxial and
uniaxial compressive yield stressb function of plastic strainI1 first invariant of stress tensorJ2 second invariant of stress deviator tensorhrmaxi algebraically maximum principle stressc for typical concrete, only appears in triaxial compres-
sionfb0 biaxial compressive yield stressfc0 uniaxial compressive yield stressft0 uniaxial tensile yield stressb width of the slabh full depth of the slabd effective depth of the slab
As area of the reinforcementfy (ry) yield stress of steel reinforcementey yield strain of steel reinforcementfcu compressive strength of concreteeft strain of concrete under ultimate tensile strengthrft the maximum tensile stress of concretedc compressive damage components of concretedt tensile damage components of concreteepl
c compressive plastic strainein
c compressive inelastic strainepl
t tensile plastic strainPt loading capacity obtained in experimental testsPp loading capacity predicted in NLFEAPAASHTO loading capacity predicted by current AASHTO standardKr lateral restraint stiffnessDt vertical deflection at midspan of concrete slabs from
experimental testsDp vertical deflection at midspan of concrete slabs from
NLFEADAASHTO vertical deflection at midspan of concrete slabs pre-
dicted by current AASHTO standardMcr cracking moment [7]
Y. Zheng et al. / Composites: Part B 43 (2012) 1586–1597 1587
Author's personal copy
Lateral Restraint Beam
Steel Rig
Concrete SlabsConcrete Slabs
Steel Rig
Lateral Restraint Beam
Plain View
Sysmetric
Supporting Platform
Concrete Slabs
Steel Rig
Cross Section
Fig. 1. Experimental test slab set-up (units: mm).
Table 1Experimental test variables and results.
test slab Reinforcement Boundary condition Kr (kN/mm) fcua (N/mm2) d (mm) Pt (kN) Failure modes
CG10 0.3% B G FE + LR 540 73.00 160 215 GFRP bar rupture & concrete crushCG11 0.7% B G FE + LR 540 71.70 160 211 Concrete crushCG12 1.4% B G FE + LR 540 74.40 160 223 Concrete crushCG13 0.7% C G FE + LR 540 73.70 100 201 Concrete crushCG14 0.7% B G FE + LR 540 29.52 160 185 Concrete crushCG15 0.7% B G FE + LR 540 56.00 160 200 Concrete crushCG16 0.7% B G FE + LR 540 67.70 160 199 Concrete crushCG17 0.7% TB G FE 0 73.79 160 120 Concrete crush & GFRP bar ruptureCG18 0.7% TB G SS 0 73.82 160 87 GFRP bar ruptureCG19 0.7% TB G FE + LR 540 75.37 160 199 Concrete crushC1 0 FE + LR 540 73.07 0 176 Concrete crushCS1 0.7% TB S FE + LR 540 70.96 160 229 Concrete crush
G – GFRP reinforcement, S – steel reinforcement.TB – two layers of reinforcement with covering layer of 40 mm.B – one layer of reinforcement with covering layer of 40 mm.C – one layer of reinforcement configured at mid-depth.FE – fixed end.LR – lateral restraint.SS – simply supported.Kr – lateral restraint stiffness.a Concrete strength was tested based on 100 mm � 100 mm cubes.
1588 Y. Zheng et al. / Composites: Part B 43 (2012) 1586–1597
Author's personal copy
performances were independent of the reinforcement percentages(see Figs. 5 and 6a). However, at an applied load of ultimatestrengths, the crack widths were smallest in the model with high-est reinforcement percentages (see Fig. 6a), which could be due tothe strongest bond effect. Fig. 6b shows the influence fromreinforcing materials on the development of crack widths. It wasfound that the crack widths in steel reinforced slabs (2.5 mm) werelarger than GFRP reinforced slabs (1.2 mm) at ultimate loads,which was due to the better compatibility between GFRP and
concrete compared to steel. As shown in Fig. 6c, regardless of ser-vice load and ultimate load, the crack width development in themodel with two layers of reinforcement are smaller than those inthe models with one layer of reinforcement. Due to the improvedservice cracking performance, reinforcing slabs with two layersof GFRP bars could be recommended. As shown in Fig. 6, the crackwidths in laterally restrained GFRP reinforced concrete slabs wereless than 0.1 mm at service load level (about 80 kN). This value issmaller than the crack width limit (0.5 mm) provided by AASHTOstandard [30].
Unlike the simply supported slabs, the restrained slabs had anegative support moment which was highlighted by the develop-ment of tension cracks in the top surface adjacent to the support(see Fig. 5). When the applied load reached close to the failure load,crushing occurred in both mid-span and support compressionfaces. This meant that arching thrust developed completely insidethe concrete slabs.
3.2. Slab deflections
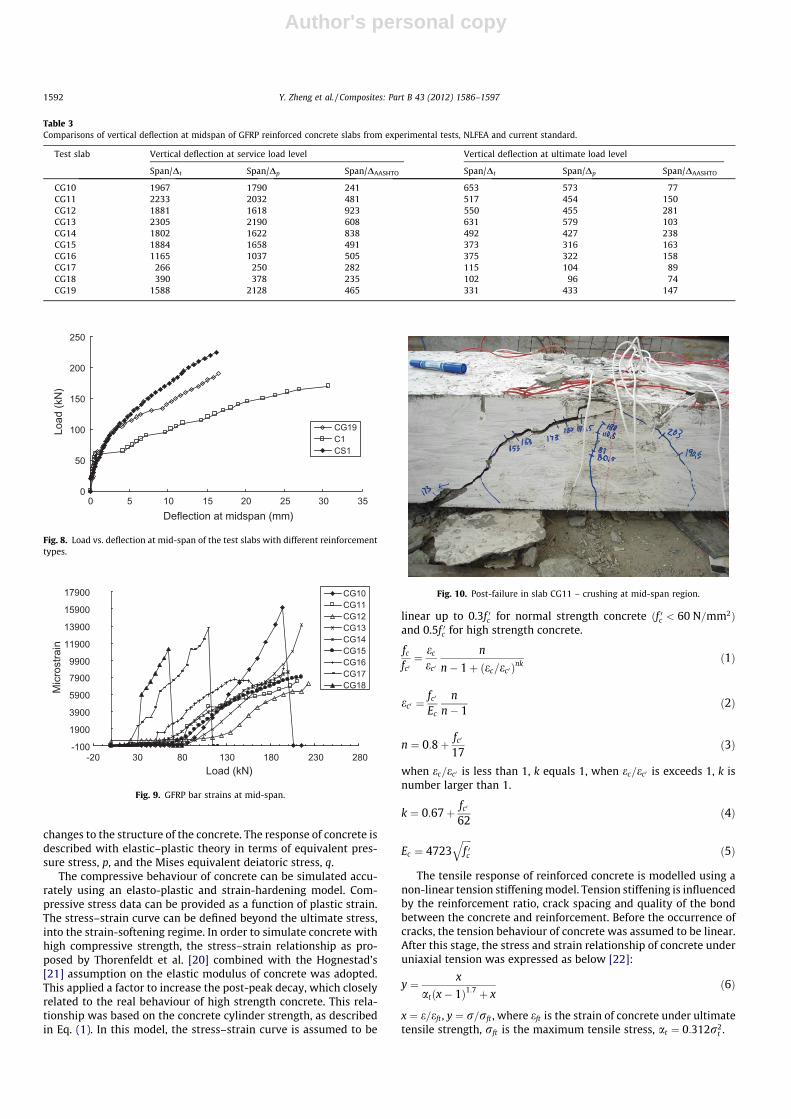
The load vs. deflection behaviours of all the GFRP reinforcedconcrete slabs are shown in Fig. 7. The load vs. deflection behav-iours clearly indicates that all the slabs are under linear behavioursuntil the first crack occurs and non linear behaviour is recorded be-yond the first crack. At an applied load of 100 kN, an approximateservice load for the laterally restrained slabs, the load vs. deflectionresponse were very similar in the comparisons of models with dif-ferent reinforcement percentage and positions. However, thisstructural response was influenced by the concrete compressivestrengths. After the applied load reached the service load, theload–deflection response in the slabs with high strength concretewas stiffer than that with normal strength concrete (see Fig. 7).The ratios of span to deflection at midspan at different load levelare illustrated in Table 3. The service and ultimate load levels ofthe tested slabs were considered as 1.4 Mcr and 2.4 Mcr respectively[18]. Mcr was the cracking moment determined by ACI 440 [7]. Asshown in Table 3, at the service load level, the maximum verticaldeflections of all the laterally restrained concrete slabs were lessthan span/800, which is the allowable service deflection [30]. How-ever, the mid-span deflections of concrete slabs without lateral re-straints (model CG17 and CG18) exceeded this limit. This isattributed to the low modulus of elasticity of GFRP bars. Further-more, at service load level and ultimate load level, the deflectionsof laterally restrained concrete slabs predicted by current AASHOTdesign standard were larger than experimental results. This indi-cated that the serviceability of restrained GFRP reinforced concreteslabs could be underestimated without consideration of compres-sive membrane action. Fig. 8 shows the comparison of load vs.deflection in the slabs with different reinforcement types. The sim-ilar responses were obtained before the occurrence of cracks.Thereafter, the global stiffness of slabs without any reinforcementreduced dramatically compared with the other two slabs. At thesame value of 100 kN, the deflections in slabs with steel and GFRPreinforcement were similar. When the load reached the ultimatestrengths, a load–deflection response in steel slabs was a bit stifferthan that in GFRP slabs.
3.3. Strain in GFRP reinforcement
Strain in each GFRP bar was measured using ERS gauges. Thestrain experienced by each bar was recorded in the mid-spanregion and restrained edge region. The load vs. mircostrain atmid-span was plotted for each GFRP test slab (see Fig. 9) and themaximum strain in each slab was verified with the rupture strainof GFRP bars. The rupture of GFRP bars occurred in the model withlowest reinforcement percentage and two models without lateral
(a) Load arrangement
(b) Data acquisition
Fig. 2. Typical test set-up.
Table 2GFRP material properties.
Reinforcementspecimens
Obtained fromtensile test
Manufacturer’sreported values
Tensilestrength(MPa)
Elasticmodulus(GPa)
Tensilestrength(MPa)
Elasticmodulus(GPa)
9 mm 636 44.6 874 46.3
Y. Zheng et al. / Composites: Part B 43 (2012) 1586–1597 1589
Author's personal copy
restraints. This suggests that failure mechanisms in most oflaterally restrained concrete slabs are by concrete crushing. Dueto the development of arching action, there was no catastrophic
failure observed for any lateral restrained GFPR reinforced concreteslab. After loading was removed, all laterally restrained GFRP slabscould return almost to the initial position.
(a) Bottom of slabs (b) Steel rig
Fig. 4. Displacement transducers configurations.
supportsupport midspan
175
193.5206
185143.5
206
204224235
205155
135126 115
10595
supportmidspansupport
176
180190.5 203
211
190.5 180173163
153173
180110.587
80
203190.5
180190.5 203
195
185165
155
165
135
115105
145
195
185
165
155205 215
215
80
125115
105
92
165175
185
midspan supportsupport
CG10
CG11
CG12
Fig. 5. Typlical crack distribution at the sides of test slabs with different reinforcement percentage.
Support
E1-1
E1-2
E1-3E1-4E1-5
Q1-1Q1-2
Q1-3Q1-4Q1-5
C1-1C1-2C1-3
C1-4
C1-5
E1-8
E1-9
Q1-8
Q1-9
C1-8
C1-9
Q2-8
Q2-9
Q2-1Q2-2Q2-3Q2-4Q2-5
E2-1
E2-4
E2-1
E2-2
E2-3E2-4E2-5
Slab Centre14span
Restraint Kr
Support
Restraint Kr
14span
Fig. 3. Strain gauges configuration in concrete slabs.
1590 Y. Zheng et al. / Composites: Part B 43 (2012) 1586–1597

Author's personal copy
3.4. Ultimate capacity of slabs and failure mode
Table 1 summarises the ultimate strengths and the correspond-ing failure modes. With the development of arching thrust insidethe laterally restrained slabs, crushing of concrete occurred inmid-span and support compression faces. At the ultimate loads,all the restrained slabs failed by crushing of concrete at top faceat mid-span as shown in Fig. 10 and Table 1. This structural perfor-mance was more pronounced in the slabs with higher concretestrength or larger reinforcement percentage. Due to the develop-ment of CMA, the rupture of GFRP bars did not occur in most of re-strained slabs except CG10 which is the model with lowestreinforcement percentage. The failure mode of simply supportedslab was the rupture of GFRP bars. This indicates that behavioursof lateral restrained slabs are similar to over-reinforced slabs,which is caused by the arching action from horizontal restraintstiffness.
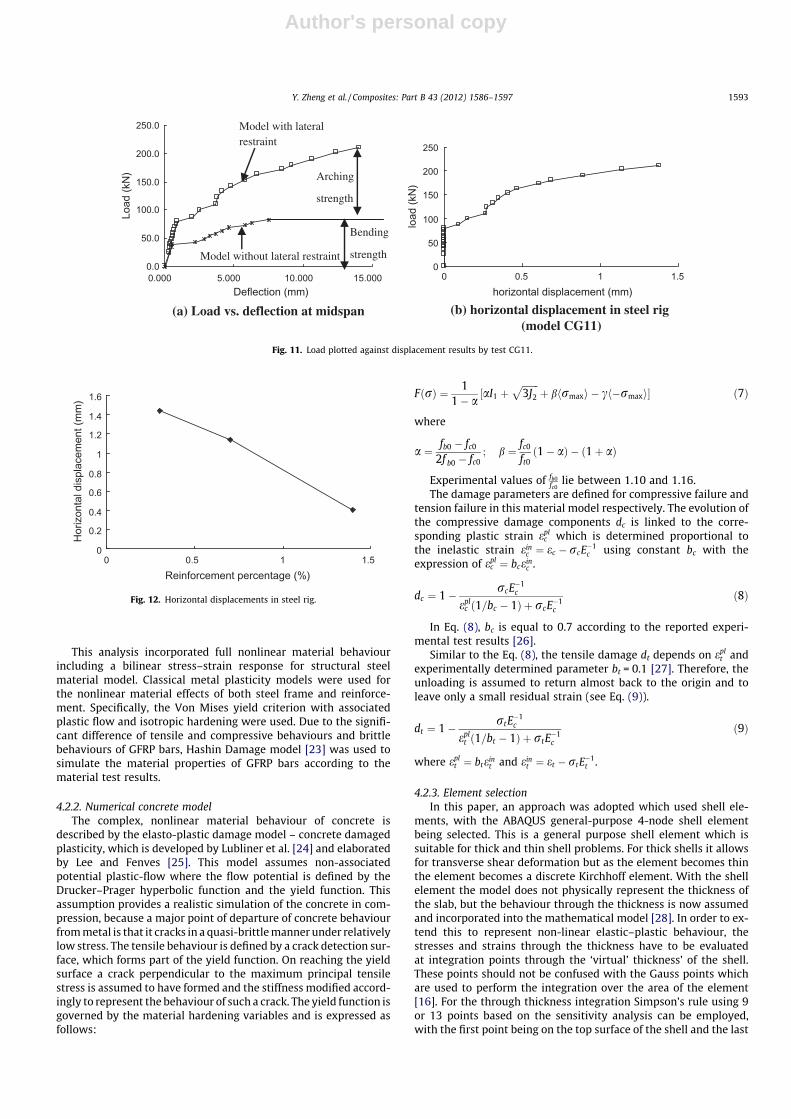
The load against deflection results for the test slabs named CG11are shown in Fig. 11a and b. It was noted that the arching action en-hanced the loading capacity significantly, which was far larger thanthe bending strength predicted by flexural theory (see Fig. 11a).After the applied load reached the bending strength of 90 kN, thehorizontal displacement at the end of the rig started to increasesignificantly indicating the corresponding development of CMA(see Fig. 11b). As shown in Table 1, the failure loads of restrainedGFRP slabs are independent of reinforcement percentages. Fig. 12illustrates that the horizontal displacements of restraint rigs areincreased with the reducing reinforcement ratios. This suggests thatcompressive membrane effects can be cut down by the increasing ofthis structural variable. It was found in Table 1 that the ultimatestrength was increased by around 14% after the concrete strengthwas enhanced by 60%. The increase in loading capacity with increas-ing concrete strength and evidence of high compressive forces char-acterised by concrete crushing indicated the development ofcompressive membrane action.
4. Nonlinear finite element analysis (NLFEA)
4.1. Introduction
The focus of this study was to attempt to establish NLFEA modelto simulate the arching effects in laterally restrained GFRP rein-forced concrete slabs. As a result, NLEFA could be used to optimisethe design of such slabs with some further parametric study, suchas lateral restraint stiffness. Commercial software named ABAQUS[16] was used. Due to the arching effects and brittle properties ofGFRP bars, the failure mode of GFRP reinforced concrete slabs issudden. This can cause numerical instability and convergenceproblems by the traditional static analysis–implicit analysis [19].Therefore, the explicit method was used with very small loadincrements to develop quasi-static analysis. However, the analysisprocedure does not terminate, after the ultimate strength isreached. Therefore, a failure criterion based on balances of forceswas used in this paper [1].
4.2. Finite element configuration
4.2.1. Constitutive modelThe constitutive model attempts to express mathematically the
ascending portion of the stress–strain curve for concrete when sub-jected to short-term static loading conditions. The mathematicaldescription of the deformation data on the behaviour is based onan analysis of experimental data on the behaviour of concrete underuniaxial stress. In the analysis, use is made of the assumption thatthe nonlinear material behaviour is dictated mainly by physical
0
50
100
150
200
250
0 0.5 1 1.5 2 2.5
CG10CG11CG12
(a) Influence from GFRP reinforcement percentages
0
50
100
150
200
250
0 0.5 1 1.5 2 2.5 3Crack width (mm)
Crack width (mm)
Load
(kN
)Lo
ad (k
N)
CG11CS1
(b) Influence from reinforcement types
0
50
100
150
200
250
0 0.5 1 1.5 2 2.5Crack width (mm)
Load
(kN
)
CG11CG19CG13
(c) Influence from GFRP reinforcement position
Fig. 6. Influences on crack widths from several structural variables.
0
50
100
150
200
250
0.000 5.000 10.000 15.000 20.000 25.000 30.000
CG10CG11CG12CG13CG14CG15CG16CG17CG18CG19
Deflection at midspan (mm)
Load
(kN
)
Fig. 7. Load vs. deflection at mid-span of the GFRP reinforced test slabs.
Y. Zheng et al. / Composites: Part B 43 (2012) 1586–1597 1591
Author's personal copy
changes to the structure of the concrete. The response of concrete isdescribed with elastic–plastic theory in terms of equivalent pres-sure stress, p, and the Mises equivalent deiatoric stress, q.
The compressive behaviour of concrete can be simulated accu-rately using an elasto-plastic and strain-hardening model. Com-pressive stress data can be provided as a function of plastic strain.The stress–strain curve can be defined beyond the ultimate stress,into the strain-softening regime. In order to simulate concrete withhigh compressive strength, the stress–strain relationship as pro-posed by Thorenfeldt et al. [20] combined with the Hognestad’s[21] assumption on the elastic modulus of concrete was adopted.This applied a factor to increase the post-peak decay, which closelyrelated to the real behaviour of high strength concrete. This rela-tionship was based on the concrete cylinder strength, as describedin Eq. (1). In this model, the stress–strain curve is assumed to be
linear up to 0.3f 0c for normal strength concrete ðf 0c < 60 N=mm2Þand 0.5f 0c for high strength concrete.
fc
fc0¼ ec
ec0
n
n� 1þ ðec=ec0 Þnkð1Þ
ec0 ¼fc0
Ec
nn� 1
ð2Þ
n ¼ 0:8þ fc0
17ð3Þ
when ec=ec0 is less than 1, k equals 1, when ec=ec0 is exceeds 1, k isnumber larger than 1.
k ¼ 0:67þ fc0
62ð4Þ
Ec ¼ 4723ffiffiffiffif 0c
qð5Þ
The tensile response of reinforced concrete is modelled using anon-linear tension stiffening model. Tension stiffening is influencedby the reinforcement ratio, crack spacing and quality of the bondbetween the concrete and reinforcement. Before the occurrence ofcracks, the tension behaviour of concrete was assumed to be linear.After this stage, the stress and strain relationship of concrete underuniaxial tension was expressed as below [22]:
y ¼ x
atðx� 1Þ1:7 þ xð6Þ
x ¼ e=eft , y ¼ r=rft , where eft is the strain of concrete under ultimatetensile strength, rft is the maximum tensile stress, at ¼ 0:312r2
t .
0
50
100
150
200
250
0 5 10 15 20 25 30 35
CG19C1CS1
Deflection at midspan (mm)
Load
(kN
)
Fig. 8. Load vs. deflection at mid-span of the test slabs with different reinforcementtypes.
-100
1900
3900
5900
7900
9900
11900
13900
15900
17900
-20 30 80 130 180 230 280Load (kN)
Mic
rost
rain
CG10CG11CG12CG13CG14CG15CG16CG17CG18
Fig. 9. GFRP bar strains at mid-span.
Fig. 10. Post-failure in slab CG11 – crushing at mid-span region.
Table 3Comparisons of vertical deflection at midspan of GFRP reinforced concrete slabs from experimental tests, NLFEA and current standard.
Test slab Vertical deflection at service load level Vertical deflection at ultimate load level
Span/Dt Span/Dp Span/DAASHTO Span/Dt Span/Dp Span/DAASHTO
CG10 1967 1790 241 653 573 77CG11 2233 2032 481 517 454 150CG12 1881 1618 923 550 455 281CG13 2305 2190 608 631 579 103CG14 1802 1622 838 492 427 238CG15 1884 1658 491 373 316 163CG16 1165 1037 505 375 322 158CG17 266 250 282 115 104 89CG18 390 378 235 102 96 74CG19 1588 2128 465 331 433 147
1592 Y. Zheng et al. / Composites: Part B 43 (2012) 1586–1597
Author's personal copy
This analysis incorporated full nonlinear material behaviourincluding a bilinear stress–strain response for structural steelmaterial model. Classical metal plasticity models were used forthe nonlinear material effects of both steel frame and reinforce-ment. Specifically, the Von Mises yield criterion with associatedplastic flow and isotropic hardening were used. Due to the signifi-cant difference of tensile and compressive behaviours and brittlebehaviours of GFRP bars, Hashin Damage model [23] was used tosimulate the material properties of GFRP bars according to thematerial test results.
4.2.2. Numerical concrete modelThe complex, nonlinear material behaviour of concrete is
described by the elasto-plastic damage model – concrete damagedplasticity, which is developed by Lubliner et al. [24] and elaboratedby Lee and Fenves [25]. This model assumes non-associatedpotential plastic-flow where the flow potential is defined by theDrucker–Prager hyperbolic function and the yield function. Thisassumption provides a realistic simulation of the concrete in com-pression, because a major point of departure of concrete behaviourfrom metal is that it cracks in a quasi-brittle manner under relativelylow stress. The tensile behaviour is defined by a crack detection sur-face, which forms part of the yield function. On reaching the yieldsurface a crack perpendicular to the maximum principal tensilestress is assumed to have formed and the stiffness modified accord-ingly to represent the behaviour of such a crack. The yield function isgoverned by the material hardening variables and is expressed asfollows:
FðrÞ ¼ 11� a
½aI1 þffiffiffiffiffiffiffi3J2
pþ bhrmaxi � ch�rmaxi� ð7Þ
where
a ¼ fb0 � fc0
2f b0 � fc0; b ¼ fc0
ft0ð1� aÞ � ð1þ aÞ
Experimental values of fb0fc0
lie between 1.10 and 1.16.The damage parameters are defined for compressive failure and
tension failure in this material model respectively. The evolution ofthe compressive damage components dc is linked to the corre-sponding plastic strain epl
c which is determined proportional tothe inelastic strain ein
c ¼ ec � rcE�1c using constant bc with the
expression of eplc ¼ bcein
c .
dc ¼ 1� rcE�1c
eplc ð1=bc � 1Þ þ rcE�1
c
ð8Þ
In Eq. (8), bc is equal to 0.7 according to the reported experi-mental test results [26].
Similar to the Eq. (8), the tensile damage dt depends on eplt and
experimentally determined parameter bt = 0.1 [27]. Therefore, theunloading is assumed to return almost back to the origin and toleave only a small residual strain (see Eq. (9)).
dt ¼ 1� rtE�1c
eplt ð1=bt � 1Þ þ rtE
�1c
ð9Þ
where eplt ¼ btein
t and eint ¼ et � rtE
�1t .
4.2.3. Element selectionIn this paper, an approach was adopted which used shell ele-
ments, with the ABAQUS general-purpose 4-node shell elementbeing selected. This is a general purpose shell element which issuitable for thick and thin shell problems. For thick shells it allowsfor transverse shear deformation but as the element becomes thinthe element becomes a discrete Kirchhoff element. With the shellelement the model does not physically represent the thickness ofthe slab, but the behaviour through the thickness is now assumedand incorporated into the mathematical model [28]. In order to ex-tend this to represent non-linear elastic–plastic behaviour, thestresses and strains through the thickness have to be evaluatedat integration points through the ‘virtual’ thickness’ of the shell.These points should not be confused with the Gauss points whichare used to perform the integration over the area of the element[16]. For the through thickness integration Simpson’s rule using 9or 13 points based on the sensitivity analysis can be employed,with the first point being on the top surface of the shell and the last
0.0
50.0
100.0
150.0
200.0
250.0
0.000 5.000 10.000 15.000Deflection (mm)
Load
(kN
)
0
50
100
150
200
250
0 0.5 1 1.5horizontal displacement (mm)
load
(kN
)
(a) Load vs. deflection at midspan (b) horizontal displacement in steel rig (model CG11)
Model without lateral restraint
Model with lateral restraint
Bending
strength
Arching
strength
Fig. 11. Load plotted against displacement results by test CG11.
0
0.2
0.4
0.6
0.8
1
1.2
1.4
1.6
0 0.5 1 1.5Reinforcement percentage (%)
Hor
izon
tal d
ispl
acem
ent (
mm
)
Fig. 12. Horizontal displacements in steel rig.
Y. Zheng et al. / Composites: Part B 43 (2012) 1586–1597 1593

Author's personal copy
on the bottom. The other points are evenly spaced between top andbottom. The stress or strain at any of these points can be obtainedfrom the post analysis results. Arching action occurs after a later-ally restraint concrete slab has cracked and an accurate numericalmodel for the nonlinear response of the concrete slabs was essen-tial to replicate arching effects.
4.3. Finite element idealisation of compressive membrane action inGFRP reinforced concrete slabs
Experimental tests presented above were selected as physicalmodels in numerical analysis. The basic NLFEA model of the exper-imental model is shown in Fig. 13. After a mesh sensitivity analysis,
the element size adopted was 25 mm and the number of integrationpoints through the thickness was 13. The in-plane restraint stiffnesswas simulated by spring elements with axial stiffness and equiva-lent to the restraint stiffness in the actual tests (see Fig. 13). Thespring element was represented by a one-way axial beam connec-tor element. One end of the connector was linked to the steel endplate which was in contact but structurally separate to the concreteslab (as in the experimental tests), while the other end was con-nected to the ground (the infinitely rigid point). In order to simulatethe contact relationship between external restraint and the con-crete slab, a small section of concrete with very low tensile strengthwas specified between the steel end plate and the concrete slab.This allowed for separation at the contact face in the tension zone.
Basic Model
The Mesh
Slab Strip (clear span = 2140 mm)
Support
Average size 25mm
Fig. 13. Basic NLFEA model for tests by authors (plan view).
Table 4Comparisons of ultimate strengths from experimental tests, NLFEA and current standards.
Test slab Reinforcement Boundary condition Kr (kN/mm) fcua (N/mm2) d (mm) Pt (kN) Pp (kM) PAASHTO (kN) Pt/Pp Pt/P AASHTO
CG10 0.3% B G FE + LR 540 73 160 215 204 71 1.05 3.03CG11 0.7% B G FE + LR 540 72 160 211 200 161 1.06 1.31CG12 1.4% B G FE + LR 540 74 160 223 218 278 1.02 0.80CG13 0.7% C G FE + LR 540 74 100 201 189 63 1.06 3.19CG14 0.7% B G FE + LR 540 30 160 185 178 145 1.04 1.28CG15 0.7% B G FE + LR 540 56 160 200 192 159 1.04 1.26CG16 0.7% B G FE + LR 540 68 160 199 202 162 0.99 1.23CG17 0.7% TB G FE 0 74 160 120 131 122 0.92 0.98CG18 0.7% TB G SS 0 74 160 87 86 81 1.01 1.07CG19 0.7% TB G FE + LR 540 75 160 199 208 163 0.96 1.22C1 0 FE + LR 540 73 0 176 150 0 1.17 –CS1 0.7% TB S FE + LR 540 71 160 229 230 89 1.00 2.56G-40-LR [27] 0.5% C G FE + LR 410 39 75 145 151 70 0.96 2.07G-70-LR [27] 0.5% CG FE + LR 410 68 75 200 210 72 0.95 2.78
Average= 1.02 1.75Standard deviation= 0.06 0.85Coeff. variation= 0.06 0.47
G – GFRP reinforcement, S – steel reinforcement.TB – two layers of reinforcement with covering layer of 40 mm.B – one layer of reinforcement with covering layer of 40 mm.C – one layer of reinforcement configured at mid-depth.FE – fixed end.LR – lateral restraint.SS – simply supported.a Concrete strength was tested based on 100 mm � 100 mm cubes.
1594 Y. Zheng et al. / Composites: Part B 43 (2012) 1586–1597
Author's personal copy
4.4. Validation with experimental tests
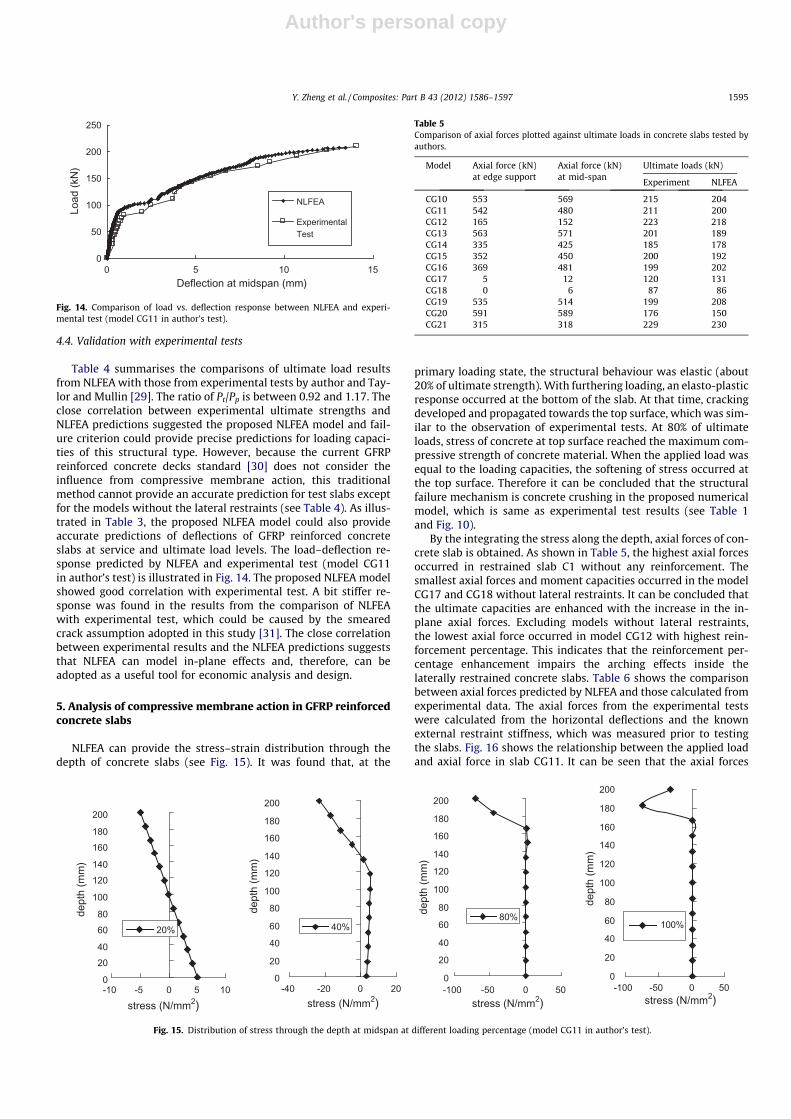
Table 4 summarises the comparisons of ultimate load resultsfrom NLFEA with those from experimental tests by author and Tay-lor and Mullin [29]. The ratio of Pt/Pp is between 0.92 and 1.17. Theclose correlation between experimental ultimate strengths andNLFEA predictions suggested the proposed NLFEA model and fail-ure criterion could provide precise predictions for loading capaci-ties of this structural type. However, because the current GFRPreinforced concrete decks standard [30] does not consider theinfluence from compressive membrane action, this traditionalmethod cannot provide an accurate prediction for test slabs exceptfor the models without the lateral restraints (see Table 4). As illus-trated in Table 3, the proposed NLFEA model could also provideaccurate predictions of deflections of GFRP reinforced concreteslabs at service and ultimate load levels. The load–deflection re-sponse predicted by NLFEA and experimental test (model CG11in author’s test) is illustrated in Fig. 14. The proposed NLFEA modelshowed good correlation with experimental test. A bit stiffer re-sponse was found in the results from the comparison of NLFEAwith experimental test, which could be caused by the smearedcrack assumption adopted in this study [31]. The close correlationbetween experimental results and the NLFEA predictions suggeststhat NLFEA can model in-plane effects and, therefore, can beadopted as a useful tool for economic analysis and design.
5. Analysis of compressive membrane action in GFRP reinforcedconcrete slabs
NLFEA can provide the stress–strain distribution through thedepth of concrete slabs (see Fig. 15). It was found that, at the
primary loading state, the structural behaviour was elastic (about20% of ultimate strength). With furthering loading, an elasto-plasticresponse occurred at the bottom of the slab. At that time, crackingdeveloped and propagated towards the top surface, which was sim-ilar to the observation of experimental tests. At 80% of ultimateloads, stress of concrete at top surface reached the maximum com-pressive strength of concrete material. When the applied load wasequal to the loading capacities, the softening of stress occurred atthe top surface. Therefore it can be concluded that the structuralfailure mechanism is concrete crushing in the proposed numericalmodel, which is same as experimental test results (see Table 1and Fig. 10).
By the integrating the stress along the depth, axial forces of con-crete slab is obtained. As shown in Table 5, the highest axial forcesoccurred in restrained slab C1 without any reinforcement. Thesmallest axial forces and moment capacities occurred in the modelCG17 and CG18 without lateral restraints. It can be concluded thatthe ultimate capacities are enhanced with the increase in the in-plane axial forces. Excluding models without lateral restraints,the lowest axial force occurred in model CG12 with highest rein-forcement percentage. This indicates that the reinforcement per-centage enhancement impairs the arching effects inside thelaterally restrained concrete slabs. Table 6 shows the comparisonbetween axial forces predicted by NLFEA and those calculated fromexperimental data. The axial forces from the experimental testswere calculated from the horizontal deflections and the knownexternal restraint stiffness, which was measured prior to testingthe slabs. Fig. 16 shows the relationship between the applied loadand axial force in slab CG11. It can be seen that the axial forces
0
50
100
150
200
250
0 5 10 15Deflection at midspan (mm)
Load
(kN
)
NLFEA
ExperimentalTest
Fig. 14. Comparison of load vs. deflection response between NLFEA and experi-mental test (model CG11 in author’s test).
0
20
40
60
80
100
120
140
160
180
200
-10 -5 0 5 10
stress (N/mm2) stress (N/mm2) stress (N/mm2)
dept
h (m
m)
dept
h (m
m)
dept
h (m
m)
20%
0
20
40
60
80
100
120
140
160
180
200
-40 -20 0 20
40%
0
20
40
60
80
100
120
140
160
180
200
-100 -50 0 50
80%
stress (N/mm2)
dept
h (m
m)
0
20
40
60
80
100
120
140
160
180
200
-100 -50 0 50
100%
Fig. 15. Distribution of stress through the depth at midspan at different loading percentage (model CG11 in author’s test).
Table 5Comparison of axial forces plotted against ultimate loads in concrete slabs tested byauthors.
Model Axial force (kN)at edge support
Axial force (kN)at mid-span
Ultimate loads (kN)
Experiment NLFEA
CG10 553 569 215 204CG11 542 480 211 200CG12 165 152 223 218CG13 563 571 201 189CG14 335 425 185 178CG15 352 450 200 192CG16 369 481 199 202CG17 5 12 120 131CG18 0 6 87 86CG19 535 514 199 208CG20 591 589 176 150CG21 315 318 229 230
Y. Zheng et al. / Composites: Part B 43 (2012) 1586–1597 1595
Author's personal copy
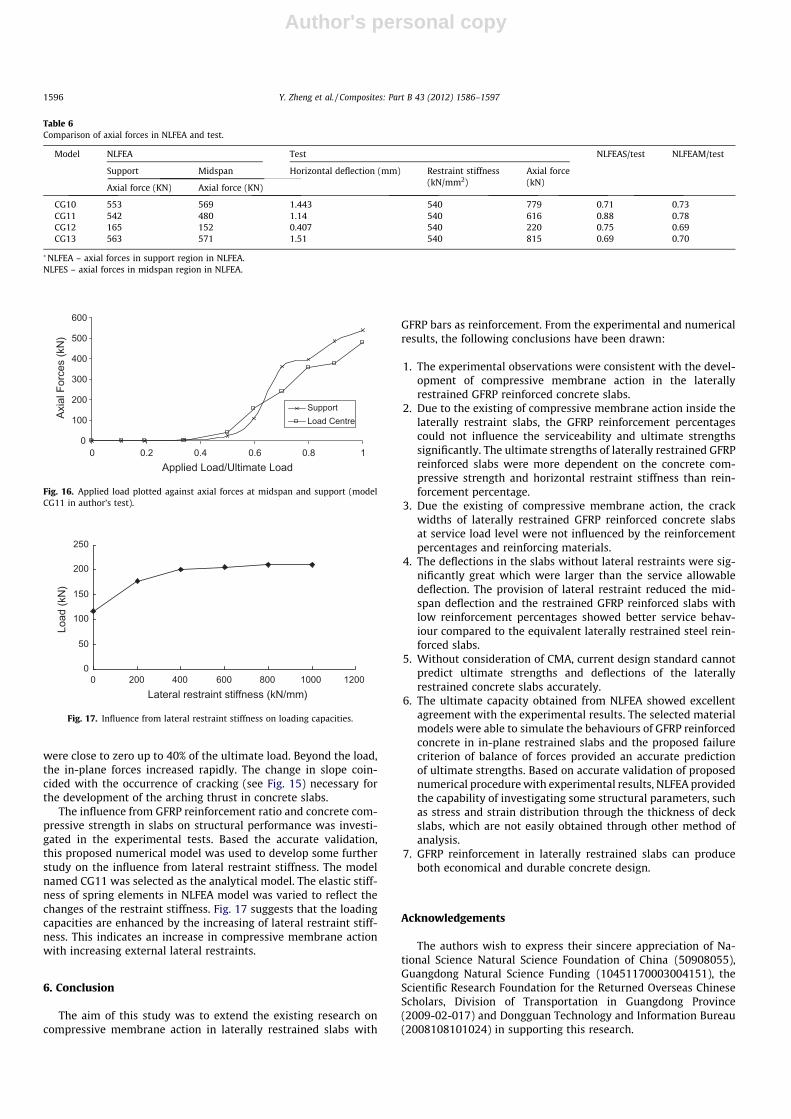
were close to zero up to 40% of the ultimate load. Beyond the load,the in-plane forces increased rapidly. The change in slope coin-cided with the occurrence of cracking (see Fig. 15) necessary forthe development of the arching thrust in concrete slabs.
The influence from GFRP reinforcement ratio and concrete com-pressive strength in slabs on structural performance was investi-gated in the experimental tests. Based the accurate validation,this proposed numerical model was used to develop some furtherstudy on the influence from lateral restraint stiffness. The modelnamed CG11 was selected as the analytical model. The elastic stiff-ness of spring elements in NLFEA model was varied to reflect thechanges of the restraint stiffness. Fig. 17 suggests that the loadingcapacities are enhanced by the increasing of lateral restraint stiff-ness. This indicates an increase in compressive membrane actionwith increasing external lateral restraints.
6. Conclusion
The aim of this study was to extend the existing research oncompressive membrane action in laterally restrained slabs with
GFRP bars as reinforcement. From the experimental and numericalresults, the following conclusions have been drawn:
1. The experimental observations were consistent with the devel-opment of compressive membrane action in the laterallyrestrained GFRP reinforced concrete slabs.
2. Due to the existing of compressive membrane action inside thelaterally restraint slabs, the GFRP reinforcement percentagescould not influence the serviceability and ultimate strengthssignificantly. The ultimate strengths of laterally restrained GFRPreinforced slabs were more dependent on the concrete com-pressive strength and horizontal restraint stiffness than rein-forcement percentage.
3. Due the existing of compressive membrane action, the crackwidths of laterally restrained GFRP reinforced concrete slabsat service load level were not influenced by the reinforcementpercentages and reinforcing materials.
4. The deflections in the slabs without lateral restraints were sig-nificantly great which were larger than the service allowabledeflection. The provision of lateral restraint reduced the mid-span deflection and the restrained GFRP reinforced slabs withlow reinforcement percentages showed better service behav-iour compared to the equivalent laterally restrained steel rein-forced slabs.
5. Without consideration of CMA, current design standard cannotpredict ultimate strengths and deflections of the laterallyrestrained concrete slabs accurately.
6. The ultimate capacity obtained from NLFEA showed excellentagreement with the experimental results. The selected materialmodels were able to simulate the behaviours of GFRP reinforcedconcrete in in-plane restrained slabs and the proposed failurecriterion of balance of forces provided an accurate predictionof ultimate strengths. Based on accurate validation of proposednumerical procedure with experimental results, NLFEA providedthe capability of investigating some structural parameters, suchas stress and strain distribution through the thickness of deckslabs, which are not easily obtained through other method ofanalysis.
7. GFRP reinforcement in laterally restrained slabs can produceboth economical and durable concrete design.
Acknowledgements
The authors wish to express their sincere appreciation of Na-tional Science Natural Science Foundation of China (50908055),Guangdong Natural Science Funding (10451170003004151), theScientific Research Foundation for the Returned Overseas ChineseScholars, Division of Transportation in Guangdong Province(2009-02-017) and Dongguan Technology and Information Bureau(2008108101024) in supporting this research.
Table 6Comparison of axial forces in NLFEA and test.
Model NLFEA Test NLFEAS/test NLFEAM/test
Support Midspan Horizontal deflection (mm) Restraint stiffness(kN/mm2)
Axial force(kN)
Axial force (KN) Axial force (KN)
CG10 553 569 1.443 540 779 0.71 0.73CG11 542 480 1.14 540 616 0.88 0.78CG12 165 152 0.407 540 220 0.75 0.69CG13 563 571 1.51 540 815 0.69 0.70
�NLFEA – axial forces in support region in NLFEA.NLFES – axial forces in midspan region in NLFEA.
0
100
200
300
400
500
600
0 0.2 0.4 0.6 0.8 1
Axia
l For
ces
(kN
)
SupportLoad Centre
Applied Load/Ultimate Load
Fig. 16. Applied load plotted against axial forces at midspan and support (modelCG11 in author’s test).
0
50
100
150
200
250
0 200 400 600 800 1000 1200Lateral restraint stiffness (kN/mm)
Load
(kN
)
Fig. 17. Influence from lateral restraint stiffness on loading capacities.
1596 Y. Zheng et al. / Composites: Part B 43 (2012) 1586–1597
Author's personal copy
References
[1] Zheng Y. Modelling of compressive membrane action in concrete bridge deckslabs. PhD thesis, Queen’s University of Belfast; 2007.
[2] Anoop MB, Rao KB, Rao TVSRA. Application of fuzzy sets for estimating servicelife of reinforced concrete structural members in corrosive environments. EngStruct 2002;24(9):1229–42.
[3] Clarke JL. The need for durable reinforcement, alternative materials forreinforcement and prestressing of concrete. Chapman & Hall; 1993.
[4] Hughes brothers. Price schedule for Aslan FRP, Hughes Brothers, Seward, NE,USA; 2008.
[5] El-Salakawy EF, Benmokrane B, El-Ragaby A, Nadeau D. Field investigation onthe first bridge deck slab reinforced with glass FRP bars constructed in Canada.J Compos Constr, ASCE 2005;9(6):470–9.
[6] AASHTO. Standard specifications for design of highway bridges. AmericanAssociation of State Highway and Transportation Officials, Washington, DC,USA; 2000.
[7] ACI 440.1R-03. Guide for the design and construction of concrete reinforcedwith FRP bars. American Concrete Institute, Farmington Hills, Michigan; 2003.p. 42.
[8] CAN/CSA-S6-00. Canadian highway bridge design code. Canadian StandardsAssociation (CSA) International, Rexdale, Toronto, Ontario, Canada; 2000. p.734.
[9] Zheng Yu, Taylor Su, Robinson Des, Cleland David. Investigation of the realultimate strengths in steel–concrete bridge decks. J ACI Struct J 2010;107(1).
[10] Department of regional development for northern Ireland (formerlyDepartment of the Environment or DOE) design of M-beam bridge decks –Amendment No. 3 to Bridge Design Code N.I. Roads Service Headquarters;1986. p. 11.1–.5.
[11] Canadian standards association. Canada: Canadian highway bridge designcode CAN/CSA-S6-00. New version available for comment 2005 CSA-TechnicalCommittee.
[12] UK highways agency, BD 81/02: Use of compressive membrane action inbridge decks. Design manual for roads and bridges 2002; 3(4).
[13] Muthu KU, Amarnath K, Ibrahim Azmi, Mattarneh Hashem. Load deflectionbehaviour of partially restrained slab strips. Eng Struct 2007;29(5):663–74.
[14] Kirkpatrick J, Rankin GIB, Long AE. Strength evaluation of Mbeam bridge deckslabs. Struct Eng 1984;62(3):60–8.
[15] Kirkpatrick J, Long AE, Rankin GIB. The influence of compressive membraneaction on serviceability of beam and slab bridge decks. Struct Eng1986;64B(1):6–9. 12.
[16] ABAQUS version 6.10 documentation; 2010.[17] Castro P, Carino N. Tensile and nondestructive testing FRP bars. J Compos
Constr 1998;2(1):17–27.[18] Ehab El-Salakawy, Brahim Benmokrane. Serviceability of concrete bridge deck
slabs reinforced with fiber-reinforced polymer composite bars. ACI Struct J2004;101(5):727–36.
[19] Zheng Yu, Robinson Des, Taylor Su, Cleland David. Finite element investigationof structural behaviours of deck slabs in composite bridges. J Eng Struct2009;31:1762–76.
[20] Thorenfeldt E, Tomaszemicz A, Jensen JJ. Mechanical properties of high-strength concrete application in design. In: Proceedings of the symposiumutilization of high strength concrete, Tapir Trondheim; 1978.
[21] Mattock AH, Kriz LB, Hognestad E. Rectangular concrete stress distribution inultimate strength design. Proc ACI 1961;57(8):875–928.
[22] GB 50012. Code for design of concrete structures (in Chinese); 2002.[23] Hashin Z. Failure criteria for unidirectional fiber composites. J Appl Mech
1980;47:329–34.[24] Lubliner J, Oliver J, Oller S, Oñate E. A plastic-damage model for concrete. Int J
Solids Struct 1989;25:299–329.[25] Lee J, Fenves GL. Plastic-damage model for cyclic loading of concrete
structures. J Eng Mech 1998;124(8):892–900.[26] Sinha BP, Gerstle KH, Tulin LG. Stress–strain relations for concrete under cyclic
loading. J ACI 1964;61(2):195–211.[27] Reineck K-H. Hintergründe zur Querkraftbemessung in DIN 1045-1 für Bauteile aus
Konstruktionsbeton mit Querkraftbewehrung. Bauingenieur 2001; 76: 168–79.[28] Lin C, Scordielis AC. Nonlinear analysis of RC shells of general form. J Struct Eng
ASCE 1975;101(3):23–538.[29] Taylor SE, Mullin B. Arching action in FRP reinforced concrete slabs. Constr
Build Mater 2006;20:71–80.[30] AASHTO. AASHTO LRFD bridge design guide specification for GFRP reinforced
concrete decks and deck systems. American Association of State Highway andTransport Officials, 1st ed., Washington, DC; 2009.
[31] Ricardo A. Einsfeld, Luiz F. Martha, tulio N. Bitttenourt. Combination ofsmeared and discrete approaches with the use of interface elements. In:European congress on computational methods in applied sciences andengineering; 2000.
Y. Zheng et al. / Composites: Part B 43 (2012) 1586–1597 1597
Copyright © 2022 FDOKUMEN