Flexural and Durability Performance of Seawater-Mixed GFRP ...
142
Please do not remove this page Flexural and Durability Performance of Seawater-Mixed GFRP-Reinforced Concrete Morales-Mangual, Carlos N. https://scholarship.miami.edu/discovery/delivery/01UOML_INST:ResearchRepository/12372038010002976?l#13372038000002976 Morales-Mangual. (2020). Flexural and Durability Performance of Seawater-Mixed GFRP-Reinforced Concrete [University of Miami]. https://scholarship.miami.edu/discovery/fulldisplay/alma991031524180302976/01UOML_INST:ResearchR epository Downloaded On 2022/09/13 18:33:34 -0400 Open Please do not remove this page
-
Upload
khangminh22 -
Category
Documents
-
view
4 -
download
0
Transcript of Flexural and Durability Performance of Seawater-Mixed GFRP ...

Please do not remove this page
Flexural and Durability Performance ofSeawater-Mixed GFRP-Reinforced ConcreteMorales-Mangual, Carlos N.https://scholarship.miami.edu/discovery/delivery/01UOML_INST:ResearchRepository/12372038010002976?l#13372038000002976
Morales-Mangual. (2020). Flexural and Durability Performance of Seawater-Mixed GFRP-ReinforcedConcrete [University of Miami].https://scholarship.miami.edu/discovery/fulldisplay/alma991031524180302976/01UOML_INST:ResearchRepository
Downloaded On 2022/09/13 18:33:34 -0400Open
Please do not remove this page

UNIVERSITY OF MIAMI
FLEXURAL AND DURABILITY PERFORMANCE OF SEAWATER-MIXED GFRP-
REINFORCED CONCRETE
By
Carlos N. Morales-Mangual
A DISSERTATION
Submitted to the Faculty
of the University of Miami
in partial fulfillment of the requirements for
the degree of Doctor of Philosophy
Coral Gables, Florida
December 2020

©2020
Carlos N. Morales-Mangual
All Rights Reserved

UNIVERSITY OF MIAMI
A dissertation submitted in partial fulfillment of
the requirements for the degree of
Doctor of Philosophy
FLEXURAL AND DURABILITY PERFORMANCE OF SEAWATER-MIXED GFRP-
REINFORCED CONCRETE
Carlos N. Morales-Mangual
Approved:
_______________________ ______________________
Antonio Nanni, Ph.D. Wimal Suaris, Ph.D.
Professor and Chair Associate Professor
Civil, Architectural, and Civil, Architectural, and
Environmental Engineering Environmental Engineering
_______________________ ______________________
Prannoy Suraneni, Ph.D. Mohamed W. Fahmy, Ph.D.
Assistant Professor Lecturer
Civil, Architectural, and Industrial Engineering
Environmental Engineering
_______________________ ______________________
Guillermo G. Claure, Ph.D. Guillermo Prado, Ph.D.
Sr. Researcher in Composite Materials Dean of the Graduate School
Sustainable and Resilient
Engineering LLC

MORALES-MANGUAL, CARLOS N. (Ph.D., Civil Engineering)
Flexural and Durability Performance of Seawater-Mixed (December 2020)
GFRP-Reinforced Concrete
Abstract of a dissertation at the University of Miami.
Dissertation supervised by Professor Antonio Nanni.
No. of pages in text. (124)
The corrosion of steel reinforcement is one of the main causes of chemical
deterioration in reinforced concrete (RC). The replacement of conventional steel bar
reinforcement by corrosion-resistant materials has been evaluated over the years. Fiber-
reinforced polymer (FRP) composite bars have been under constant development to be
used as internal reinforcement for concrete structures due to their high-strength,
lightweight, and, most importantly, non-corrosive properties. Among pultruded FRP bars,
glass fiber reinforced polymer (GFRP) bars are the most widely used. Using this type of
non-corrosive material provides an alternative to replace fresh water with seawater in the
production of concrete since the use of seawater in RC structures is prohibited due to its
high presence of chloride that favors the corrosion of steel reinforcement. This dissertation
focuses on the microstructural, flexural, and durability performance of GFRP bars in
seawater-mixed concrete.
First, the constituent contents of four (4) commercially available pultruded GFRP
bars were evaluated by quantitative analysis of scanning electron microscope (SEM)
micrograph of cross-sectional samples through digital image processing (DIP). The fiber
and resin matrix volume fractions acquired from the DIP method were converted to weight
fraction by means of constituent relationship equations and were compared to the

standardized resin burn-off technique (ASTM D2584). Comparable values were obtained
from both methods; however, the DIP method has the ability to provide additional
microstructural information. In addition, the correlation between void/defect content,
moisture absorption capacity, and tensile properties was also evaluated. The void/defect
content correlated with the moisture uptake at a substantially saturated condition. After the
absorption/desorption protocols, the tensile strength and ultimate strain rupture were
significantly affected, while the elastic modulus remained mostly unaltered.
Then, a total of forty-eight (48) GFRP-RC slabs reinforced with a 9.5 mm (.375 in.)
diameter GFRP bar were cast using two different seawater-mixed concrete mixtures. The
GFRP-RC slabs were exposed to accelerated aging [seawater at 60°C (140°F)] and field
[25°C (77°F)/71.2% RH] conditioning. After 1, 6, 12, and 24 months of exposure, three-
point bending tests were performed on all GFRP-RC slabs to investigate their flexural
behavior. Strength capacities were calculated using an analytical and simplified approach
(ACI 4401.R-15). The experimental test results were compared with the expected values
in terms of flexural performance (first crack, ultimate and design capacity, and deflection).
The type of concrete mix design, as well as the accelerated aging, seems to affect the
ultimate capacity of GFRP-RC slabs. Analytical and ACI approaches reasonably predicted
the experimental failure-moment capability of most of the seawater-mixed GFRP-RC
slabs, specifically those exposed to field conditioning. The ACI 440 equations were in good
agreement with the experimentally measured deflections, where the largest deviations were
observed for accelerated-aged specimens.
Finally, the residual physico-mechanical properties of GFRP bars embedded in
seawater-mixed concrete were evaluated over 24 months. The mechanical test results of

GFRP bars are provided as residual capacities of tensile strength, longitudinal elastic
modulus, transverse shear strength, and apparent horizontal shear strength. Physical
evaluations are reported in terms of glass transition temperature (Tg) and microstructural
integrity through scanning electron microscopy (SEM) images and energy-dispersive X-
ray spectroscopy (EDS) analysis. Among all tested properties, tensile strength was the most
affected by the environmental conditions. Based on an exponential degradation model, the
long-term prediction of the tensile strength capacity was on average 92% under field
exposure and 72% under the more aggressive conditioning [seawater at 60°C (140°F)].

iii
To my parents, for being my role models

iv
Acknowledgments
I would first like to extend my deepest gratitude to my advisor Dr. Antonio Nanni,
who, while I was pursuing my master’s degree, provided me with the opportunity to join
his course on ‘Advanced Topics’, which sparked my interest in pursuing doctoral studies
in this subject. His unparalleled knowledge, enthusiasm, and guidance helped me at every
stage of the process. I would like to express my deepest gratitude to my committee
members, Dr. Guillermo Claure, Dr. Prannoy Suraneni, Dr. Wimal Suaris, and Dr.
Mohamed Fahmy for their insightful comments and helpful contributions.
I would also like to extend my thanks to the research team at the University of
Miami’s Structures and Materials Laboratory, in particular: Dr. Francisco De Caso y
Basalo, Ana, and Roger, for their support and help. In addition, I would like to thank Jorge
Alvarez from the ‘Johnson & Johnson 3D Printing Center of Excellence’ at the University
of Miami for sharing his valuable experience. I also wish to thank Dr. Alvaro Ruiz
Emparanza and Dr. Morteza Khatibmasjedi whose contributions cannot be overestimated.
Last but certainly not least, I must express my very profound gratitude to my family.
The love, support, and continuous encouragement of my parents and siblings were crucial
throughout my academic studies. I am forever grateful to Joenid M. for all her love,
patience, and understanding. They all kept me going and this dissertation would not have
been possible without them.

v
Table of Contents List of Figures
List of Tables
Chapter 1 — Introduction ................................................................................................... 1
1.1 FRP Bars ................................................................................................................... 2
1.2 Seawater-Mixed Concrete ......................................................................................... 3
1.3 FRP-RC ..................................................................................................................... 4
1.4 FRP Degradation Mechanisms ................................................................................. 5
1.5 Research Objectives .................................................................................................. 7
Chapter 2 — Microstructural Investigation and Influence of Moisture on Tensile
Properties of GFRP Bars ................................................................................................... 10
2.1 Methodology ........................................................................................................... 12
2.1.1 GFRP Bar Samples .......................................................................................... 12
2.1.2 Specimen Preparation ...................................................................................... 14
2.2 SEM Imaging – DIP Method .................................................................................. 19
2.2.1 SEM Images Acquisition ................................................................................. 19
2.2.2 SEM Image Analysis ....................................................................................... 21
2.2.3 Constituent Content – Calculation ................................................................... 23
2.3 Results and Discussion ........................................................................................... 25
....................................................................................................................... xii
...................................................................................................................... viii

vi
2.3.1 Filament Glass Fibers ...................................................................................... 25
2.3.2 Constituent Content ......................................................................................... 26
2.3.3 Moisture Absorption ........................................................................................ 31
2.3.4 Correlation between degree of saturation and tensile properties ..................... 35
2.4 Concluding Remarks ............................................................................................... 39
2.5 Future Research ...................................................................................................... 40
Chapter 3 — Flexural Performance of Seawater-Mixed GFRP-RC Slabs ....................... 41
3.1 Methodology ........................................................................................................... 41
3.1.1 Seaconcrete ...................................................................................................... 42
3.1.2 GFRP Bar ......................................................................................................... 44
3.1.3 GFRP-RC Slabs ............................................................................................... 45
3.1.4 Environmental Conditioning ............................................................................ 46
3.1.5 Test Setup......................................................................................................... 47
3.2 Predicted Flexural Behavior – Calculation ............................................................. 49
3.2.1 Predicted and Design Capacity ........................................................................ 49
3.2.2 Prediction of Midspan Deflection .................................................................... 53
3.3 Results and Discussion ........................................................................................... 55
3.3.1 Characterization of Seaconcrete ...................................................................... 55
3.3.2 Flexural Test and General Behavior ................................................................ 59
3.3.3 Comparison of Predicted and Experimental Capacity ..................................... 64
3.3.4 Load-deflection Behavior ................................................................................ 68
3.3.5 Comparison of Experimental and Predicted Deflection .................................. 70
3.4 Concluding Remarks ............................................................................................... 72
3.5 Future Research ...................................................................................................... 73

vii
Chapter 4 — Durability of GFRP Reinforcing Bars in Seawater-Mixed Concrete .......... 75
4.1 Methodology ........................................................................................................... 79
4.1.1 Testing Plan ..................................................................................................... 80
4.2 Results and Discussion ........................................................................................... 85
4.2.1 Tensile Strength Retention ............................................................................... 88
4.2.2 Tensile Modulus of Elasticity Retention.......................................................... 91
4.2.3 Transverse Shear Strength Retention ............................................................... 93
4.2.4 Horizontal Shear Strength Retention ............................................................... 95
4.2.5 Glass Transition Temperature Assessment ...................................................... 97
4.2.6 Microstructural Evaluation .............................................................................. 99
4.2.7 Prediction of Long-term Behavior ................................................................. 102
4.3 Concluding Remark .............................................................................................. 107
4.4 Future Research .................................................................................................... 108
Chapter 5 — Conclusions ............................................................................................... 109
Bibliography .................................................................................................................. 115
Appendix A .................................................................................................................... 123
Appendix B .................................................................................................................... 124

viii
List of Figures
Figure 2-1: SEM sample preparation. (a) GFRP bars; (b) epoxy resin mounting; (c)
vacuum chamber to remove air bubbles; (d) sectioning; (e) griding/polishing; (f) final
product of epoxy-impregnated samples. ........................................................................... 15
Figure 2-2: Cross-sectional area of GFRP bars Type-A, -B, -C, and -D encased in epoxy
resin pucks. ....................................................................................................................... 17
Figure 2-3: Diagram of typical SEM image regions. ........................................................ 20
Figure 2-4: Typical digital image processing method. (a) Original SEM image and
histogram; (b) voids, i.e., low range threshold; (c) resin matrix, i.e., mid-range threshold;
(d) glass fibers, i.e., upper range threshold. ...................................................................... 22
Figure 2-5: Normalized frequency histogram of the filament diameter distribution. ....... 26
Figure 2-6: High concentration of voids in the core of GFRP bar Type-B. (a) Original
SEM image; (b) location of voids highlighted in red. ...................................................... 28
Figure 2-7: GFRP bars constituent content, in percentage by weight, determined by BO
and DIP methods. Error bars represent 95% confidence intervals. .................................. 29
Figure 2-8: Moisture uptake of GFRP bars. Error bars represent standard deviation of the
mean. ................................................................................................................................. 33

ix
Figure 2-9: GFRP bar Type-B with high presence of clustered voids/defects ................. 34
Figure 2-10: Moisture absorption curve for 914-mm long GFRP bars Type-A. .............. 35
Figure 2-11: Normalized tensile properties with respect to the degree of saturation for
GFRP Type-A. Error bars represent 95% confidence intervals. ....................................... 38
Figure 3-1: GFRP-RC slab geometry: cross-section (top) and top view (bottom). .......... 46
Figure 3-2: Diagram layout of accelerated curing tank. ................................................... 47
Figure 3-3: Experimental setup of simply supported GFRP-RC slab............................... 48
Figure 3-4: Concrete compressive strength over time of exposure. Error bars represent
standard deviation. ............................................................................................................ 56
Figure 3-5: Concrete pH measurements and carbonation depths. .................................... 59
Figure 3-6: Typical flexural crack pattern of tested GFRP-RC slabs after 24 months of
exposure. ........................................................................................................................... 60
Figure 3-7: GFRP-RC slab failure load versus concrete strain on the compression face. 61
Figure 3-8: Typical GFRP bar tensile rupture failure at midspan. ................................... 62
Figure 3-9: Average load capacity of GFRP-RC slabs made with concrete mix Type-F.
Error bars represent standard deviation. ........................................................................... 63
Figure 3-10: Average load capacity of GFRP-RC slabs made with concrete mix Type-S.
Error bars represent standard deviation. ........................................................................... 64
Figure 3-11: Experimental load-deflection curve of representative GFRP-RC slabs. Note:
𝑃𝑛 𝑎: nominal strength with 𝜙 and 𝐶𝑒= 1; 𝑃𝑛 𝑏: nominal strength with 𝜙 = 1 and 𝐶𝑒=
0.7; 𝑃𝑛 𝑐: nominal strength with 𝐶𝑒= 1 and 𝜙 = 0.55. .................................................... 69

x
Figure 4-1: Detail of surface condition and location of assessed GFRP bars: (a) pristine
GFRP bar, (b) extracted GFRP bar, (c) extraction activity (bottom view), (d) side view of
GFRP-RC slab and evaluated portion [610 mm (24 in.)]. ................................................ 81
Figure 4-2: Typical failure mode of extracted GFRP bars specimens after (a) tensile, (b)
transverse shear, and (c) horizontal shear tests. ................................................................ 87
Figure 4-3: Correlation between the ultimate capacity of GFRP-RC slabs and tensile
strength retention of extracted GFRP bars. ....................................................................... 87
Figure 4-4: Tensile strength retention of extracted GFRP bars aged in seaconcrete. Error
bars represent standard deviation. ..................................................................................... 90
Figure 4-5: Tensile modulus retention of extracted GFRP bars aged in seaconcrete. Error
bars represent standard deviation. ..................................................................................... 92
Figure 4-6: Transverse shear strength retention of extracted GFRP bars aged in
seaconcrete. Error bars represent standard deviation. ....................................................... 94
Figure 4-7: Horizontal shear strength retention of extracted GFRP bars aged in
seaconcrete. Error bars represent standard deviation. ....................................................... 96
Figure 4-
GFRP bar; S-SW60-24 GFRP bar. ................................................................................... 99
Figure 4-9: Typical SEM images of unconditioned (reference) and conditioned GFRP
bars cross-sections after 24 months of exposure........................................................... 100
Figure 4-10: Typical EDS spectrum of pristine GFRP bars: (a) fiberglass, (b) SEM/EDS
image, (c) resin matrix. ................................................................................................... 101
8: Typical cross-sectional area of GFRP bars. (a) pristine GFRP bar; F-SW60-24

xi
Figure 4-11: Exponential degradation model fitted to the tensile strength retention values.
......................................................................................................................................... 104
Figure 4-12: Service life predictions (based on the exponential degradation model). ... 106
Figure A-1: Normalized residual capacity of extracted GFRP bars. Note: TNS = tensile
strength; EM = tensile elastic modulus; TSS = transverse shear strength; HSS =
horizontal shear strength. Error bars represent standard deviation. ................................ 123

xii
List of Tables
Table 2-1: Surface treatment and measured physical properties of GFRP bars ............... 13
Table 2-2: SEM sample grinding and polishing protocol ................................................. 16
Table 2-3: Results of measured physical properties of glass filaments ............................ 25
Table 2-4: Measured SEM DIP constituent volume percentages ..................................... 27
Table 2-5: Fiber and resin weight fractions determined by BO and DIP methods ........... 29
Table 2-6: Tensile properties of GFRP Type-A after absorption/desorption protocol ..... 37
Table 3-1: Seaconcrete mix designs (adapted from Ref. [76]) ......................................... 43
Table 3-2: Physical and mechanical characterization of the GFRP bars .......................... 45
Table 3-3: Durability characterization of concrete after 24 months of exposure ............. 57
Table 3-4: The effect of 𝑓𝑐′ on the design moment capacity ........................................... 65
Table 3-5: Details of experimental and predicted nominal moment capacity .................. 66
Table 3-6: First cracking load for all tested slabs ............................................................. 68
Table 3-7: Comparison of measured and predicted deflections........................................ 71
Table 4-1: Summary of physical properties, strength retention, and conditioning regimes
of GFRP bars reported in previous studies ...................................................................... 76
Table 4-2: Summary of GFRP bar properties ................................................................... 80
Table 4-3: Experimental residual mechanical properties of extracted GFRP bars .......... 86

xiii
Table 4-4: Results of dynamic mechanical analysis (DMA) ............................................ 98
Table 4-5: Chemical composition of glass fibers by EDS (weight percentage) ............. 102
Table 4-6: Long-term retention values ........................................................................... 105
Table B-1: Two-way ANOVA summary table showing the interaction between the effects
of environmental conditioning and exposure time on the residual capacity ................... 124

Chapter 1
Introduction
Reinforced concrete (RC) structures are usually reinforced with steel bars, yet it is
widely recognized that structures exposed to harsh environments (e.g., marine and offshore
structures), as well as deicing salts, have a high risk of deterioration due to the corrosion
of the steel reinforcement, the main reason of structural degradation [1], [2]. It is estimated
that in the U.S. alone, the annual direct cost of corrosion attributed to highway bridges (i.e.,
reinforced-concrete, prestressed concrete, and steel bridges) is $8.3 billion, plus an
economic impact of indirect costs as high as 10 times the direct costs [3]. This explains the
growing interest in structural systems that outperform current construction methods by
providing superior long-term durability and low maintenance requirements [4]. In
particular, non-conventional fiber-reinforced polymer (FRP) bars for concrete
reinforcement have proven to be a suitable alternative to traditional corrosion-prone carbon
steel [5].
1

2
1.1 FRP Bars
The increasing demand and lack of strict standardization of this type of internal
reinforcement have led to numerous FRP composite bars with different physical and
mechanical properties [6]. These properties depend primarily on several factors, such as
the type of constituents, proportion of fibers to resin matrix, method of manufacture, and
fiber orientations confined by the polymer matrix [7]. In FRP bars, since the matrix has
significantly lower strength and stiffness than the fibers, the mechanical properties in the
longitudinal direction largely depend on the fiber volume ratio, which is defined as the
percentage of fiber volume with respect to the total volume of the composite [8]. Among
the most common types of fibers used to manufacture FRP reinforcing bars are glass,
carbon, aramid, and basalt fibers [9]. During the pultrusion process fibers are usually
impregnated with thermosetting resins such as epoxies, polyesters, or vinyl esters as a
matrix [9–11]. Glass FRP (GFRP) coupled with a vinyl ester resin is the most commonly
used material system for the manufacturing of pultruded FRP bars [6], as a cost-effective
choice due to its high tensile strength, lightweight, and non-conductive and corrosion-
resistance properties [8].
The polymer matrix in FRP composites usually consists of a base resin binder,
hardeners, fillers, and additives [9], [12]. While the selection of an appropriate resin is
critical for the pultrusion of quality products, the importance of additives and fillers which
are combined with the neat resin to formulate the final matrix mix is of critical importance.
Functional fillers have gained acceptance as components of thermosetting pultrusion
compounds. Not only do they alter and contribute to the performance properties of the resin
system but in some cases, they also reduce production costs [9], [10], [12]. Some of the

3
most commonly used inorganic fillers in pultruded composites are aluminum silicate,
calcium carbonate, and alumina trihydrate with typical densities between 2400 and 2700
kg/m3 (149.8 and 168.6 lb/ft3) [13]. The amount of fillers in standard FRP bars usually
varies between 15 to 20% by weight of the neat resin. This is when different pultruders use
their experience and knowledge to adjust the production process. As an example, for
commercially available M10 (No. 3) GFRP bars, a manufacturer reports an average filler
weight percentage of 3.97% for a given lot.
Determination of fiber content can be achieved by measuring the weight or volume
of the composite constituents. When the basis of calculating the constituent contents is in
terms of weights, it is expressed as “weight fraction” (𝑤𝑡%) and, when it is obtained by
volume measurements, it is referred to as “volume fraction” (𝑣𝑜𝑙%). The three main
methods to quantify the weight or volume fraction in a composite are resin burn-off
(ignition loss), chemical digestion, and micrograph analysis [9], [14], [15].
1.2 Seawater-Mixed Concrete
Conventional concrete is made with fresh water and river/quarry sand or desalted
sea-sand to limit potential detrimental chemical constituents such as chlorides that promote
iron oxidation leading to corrosion of the steel reinforcement. By replacing steel with non-
corrosive materials such as FRP bars, seawater and/or sea-sand could be used in the
production of concrete instead of conventional corrosion-prone carbon steel rebars. The
use of seawater-mixed concrete (seawater-mixed concrete and “seaconcrete” are used
interchangeably in the text) has been of particular interest to researchers [16–18]. Xiao et
al. [16] conducted a comprehensive literature review on the effects of using sea-sand and/or

4
seawater in the production of concrete. They reported that most studies show a higher
compressive strength during the early stages and a similar long-term compressive strength
when compared to conventional concrete. However, Younis et al. [17] reported
compressive strength of seaconcrete around 7-10% lower than concrete made with fresh
water after 28 days, independently of curing conditions (fresh water or seawater).
Furthermore, Khatibmasjedi et al. [18] reported a 14% higher compressive strength of
seaconcrete than conventional concrete after 24 months of exposure to seawater at 60°C
(140°F). In summary, it appears that additional research work may be needed in order to
clarify the inconsistency in strength behavior of seaconcrete as compared to conventional
concrete; however, it is expected that different mix designs and curing regimens are likely
to have different behaviors.
1.3 FRP-RC
Numerous researchers have investigated the short-term flexural behavior of RC
slabs reinforced with FRP bars [19–30]. Most of the published research on this topic has
been performed using conventional concrete, and virtually none with seaconcrete. Gao et
al. [31] conducted a study to evaluate the flexural and blast response of one-way slabs
reinforced with 6 mm diameter basalt FRP (BFRP) bars. In the study, slabs were cast with
two different concrete mix designs: sea-sand seaconcrete and conventional fresh water
concrete. In particular, the three-point bending flexural test results showed a 13%
difference between BFRP-RC slabs made with sea-sand seaconcrete and conventional
concrete subjected to the same conditions.

5
In contrast to seaconcrete FRP-RC slabs, the durability and flexural performance
of beams made with seawater and reinforced with FRP bars have been further studied.
Dong et al. [32] performed accelerated aging tests (artificial seawater at 50°C) on seawater
sea-sand concrete beams reinforced with 13-mm diameter BFRP bars. They reported
changes in the failure mode (from concrete crushing to shear failure) of BFRP-RC beams
after 9 months of accelerated conditioning, mostly attributed to the degradation of FRP-to-
concrete bond. More recently, Younis et al. [33] conducted a research study to investigate
the short-term flexural performance of GFRP-RC beams made with seawater recycled-
aggregated concrete. The GFRP-RC beams were reinforced with 12-mm diameter GFRP
bars and tested under four-point loading after two months of concrete casting. They
concluded that using seawater and recycled coarse aggregate in concrete has insignificant
effects on the flexural capacity when compared to different concrete mixtures that have
comparable compressive strength.
1.4 FRP Degradation Mechanisms
It is widely known that the durability of FRP bars can be affected by harsh
environmental factors such as high temperatures and moisture content, chemical/alkaline
attack from the surrounding medium, and ultraviolet radiation [9]. The degradation
mechanisms are mainly related to the type and quality of the constituents (e.g., fiber, sizing,
and resin matrix), the manufacturing process, the phenomenon of matrix plasticization, and
the integrity of the fiber-matrix interface [34], [35]. Since the widespread use of internal
FRP reinforcement for concrete structures began in the 1980s [10] and nearly all RC
structures have been designed to have a service life of more than 40 years [9], the vast

6
majority of the available data on real-life long-term performance is limited. Gooranorimi
and Nanni [36] conducted a study examining GFRP bars made of E-glass fiber and vinyl
ester resin that were retrieved from an overhang portion of a concrete deck of a bridge
located in Texas (U.S.) after more than a decade of service. Through micrograph analysis,
they concluded that the extracted GFRP bars preserved their microstructural integrity with
no visible damage after 15 years of field exposure. Benzecry et al. [37] validated these
results by reporting a calculated reduction in tensile stress of 2.13% of GFRP coupons
obtained from the same bridge after 17 years in service.
Typically, physical and mechanical degradation of FRP bars has been evaluated by
accelerated aging protocols, in which FRP bars are subjected to aggressive environmental
conditioning for specific periods [34], [38–42]. Discrepancies in the strength retention of
FRP bars between accelerated aging and field exposure have also been reported [34], [43],
[44]. It seems that direct exposure to a highly alkaline solution does not necessarily allow
the prediction of the actual in-service real-life weathering. Researchers have also evaluated
the degradation of FRP bars embedded in concrete rather than exposed to a solution. In this
case, the literature reveals tensile strength retention of concrete-embedded GFRP bars
between 59 and 93% [44–52]. However, only a few studies have been conducted
specifically on the long-term durability performance of FRP bars embedded in concrete
made with seawater instead of fresh water [16]. Test results showed that seaconcrete-
embedded GFRP bars preserved between 50 and 85% of their initial tensile strength after
exposure [53], [54]. These fluctuations in strength retention can be attributed mainly to the
bar diameter, type and quality of the constituents (e.g., fiber, sizing, and resin matrix), void

7
content, temperature and time of exposure, and type of surrounding medium (e.g., concrete
characteristics).
As opposed to the tensile strength reductions, either under accelerated conditioning
or embedded in concrete, GFRP bars exhibited an equal or slightly higher residual tensile
modulus of elasticity (𝐸𝑓) over time. It has been reported that there is nearly no change in
𝐸𝑓 regardless of the surrounding medium, environmental conditioning, or time of exposure
[39], [40], [42], [43], [45–47]. This is a crucial point since for FRP-RC members
permissible deflection under service loads might control the design rather than the flexural
strength requirements [8], due to relatively low 𝐸𝑓. Thus, for both compression-controlled
and tension-controlled sections, the retention of 𝐸𝑓 is of paramount importance.
1.5 Research Objectives
As expected, the constituent content, mechanical behavior, and long-term
performance of GFRP bars (intended for internal reinforcement in concrete) differ from
conventional steel reinforcement. For this reason, this dissertation comprises three
interrelated studies regarding these topics, which are presented in later chapters.
The first study introduced in Chapter 2 entitled "Microstructural Investigation and
Influence of Moisture on Tensile Properties of GFRP Bars" aims to quantify the
constituents of GFRP bars (i.e., fiber, resin matrix, and voids) through a non-conventional
method, and also to correlate voids and moisture content with tensile properties. The
constituent contents of four commercially available GFRP bars were evaluated by
implementing a micrograph analysis of representative cross-sectioned samples and

8
compared to a conventional resin matrix separation method. The micrograph analysis was
performed through digital image processing (DIP) of scanning electron microscope (SEM)
images, while the conventional method was achieved by applying a standardized separation
technique. The DIP method could be an alternative to conventional destructive approaches.
Furthermore, the correlation between void volume fraction, moisture uptake, and tensile
strength retention was evaluated by testing GFRP bars with different degrees of saturation.
The purpose of the second study featured in Chapter 3 under the title “Flexural
Performance of Seawater-Mixed GFRP-RC Slabs” was to evaluate the flexural and
durability performance of one-way GFRP-RC slabs made with seaconcrete. Forty-eight
simply supported GFRP- RC slabs made with seawater-mixed concrete were tested to study
potential performance degradation over different environmental conditions and exposure
periods. The environments consisted of typical field conditions of a subtropical region and
immersion in seawater at 60°C (140°F) as an accelerated aging regimen. Concrete
cylinders of both mix designs were cast and exposed to the same environmental
conditioning and time of exposure as the GFRP-RC slabs to evaluate the mechanical and
durability performance of seaconcrete. All slabs were tested under three-point flexural
loading and all exhibited bar rupture as the failure mode. The test results are reported in
terms of cracking load, ultimate moment capacity, and service-load deflections.
Lastly, the third study presented in Chapter 4 entitled “Durability of GFRP
Reinforcing Bars in Seawater-Mixed Concrete” intends to investigate the durability
performance of GFRP bars embedded in seaconcrete (Chapter 3) that were exposed to
different environmental conditionings. The mechanical test results of extracted GFRP bars
are reported in terms of residual capacities of tensile strength, longitudinal elastic modulus,

9
transverse shear strength, and apparent horizontal shear strength. In addition, physical
evaluations are presented in terms of glass transition temperature (Tg) as well as
microstructural integrity through SEM imaging and energy-dispersive X-ray spectroscopy
(EDS) analysis.

Chapter 2
Microstructural Investigation and Influence of Moisture on Tensile Properties of GFRP Bars
The tensile strength and elastic modulus of FRP bars are directly related to the
percentage of fibers measured by weight or volume. Recognizing the increasing number of
different commercially available FRP bars, the implementation of precise methods for
quantification of constituent fractions is of high importance to determine physico-
mechanical properties. Also, it has been stated that the presence of voids in FRP increases
moisture absorption capacity and diffusion coefficient [55] while affecting mechanical
performance. Voids can be formed during fabrication or be provoked as “cracks” due to
temperature change or high stresses. These “pockets” (voids) can hold moisture in the form
of capillary and absorbed water increasing the degree of saturation and ultimately affecting
mechanical properties. In this study, the influence of voids in GFRP bars on moisture
absorption capacity was experimentally investigated, as well as the mechanical
performance of a particular GFRP bar under different degrees of saturation.
Among the three main methods to quantify constituent content (either by volume
or weight), the resin burn-off (BO) and chemical digestion are standardized methods
10

11
(ASTM D2584 [56] and ASTM D3171 [57]) and are achieved by separating the fibers from
the matrix and calculating the fiber content as a ratio of the original composite sample by
weight. Of the two, the BO method cannot be used with fibers such as carbon or aramid as
they would incinerate when exposed to high temperatures in the furnace [9]. Also,
irrespective of the type of fiber, ASTM D2584 [56] is not ideal for assessing fiber content
in FRP bars intended for concrete reinforcement due to the fact that these bars must have
surface deformations in the form of sand coatings, fiber wraps, or molded indentations
(necessary for the development of FRP-concrete bond) that could affect the results. In
addition, there are sometimes inorganic fillers in the matrix that do not burn, prompting
researchers to apply an alternative acid washout procedure to remove remnant fillers from
the fibers [37], [58].
Of the main methods, the third is achieved by quantifying the fiber area fraction
through magnified DIP of a cross-sectional region of the composite, which can be obtained
either by optical microscopy (OM) or SEM. This method assumes that the same cross-
sectional profile extends across the length of the bar; therefore, in this study, the area
fraction and volume fraction are considered to be the same. Even though the DIP is not a
standardized method and has been used to a lesser extent, it has demonstrated to be an
accurate and powerful tool to quantify composite microstructures [15,16]. In addition to
quantifying constituent fractions, since the DIP method is a non-destructive assessment,
FRP specimens can further be used for other types of material characterization, such as
elemental composition through EDS, identification of microstructural patterns and
imperfections, distribution of constituents, and integrity of the fiber-resin interface.

12
2.1 Methodology
This research study can be divided into three parts. First, the constituent content of
FRP bars using the DIP method was evaluated and compared to a standardized method.
Micrographs of the cross-sectional area of the composite were obtained using SEM, while
the BO technique was used as a conventional method. Then, the correlation between void
content and moisture absorption capacity was evaluated. Moisture absorption of “short”
GFRP bars samples (25.4 mm [1.0 in.]) were assessed as per the standardized method
(ASTM D570). Finally, the correlation between the degree of saturation and tensile
performance of GFRP bars was studied. Tensile tests were performed on “long” GFRP bars
(914 mm [36 in.]) with different moisture content. For reasons of economy, glass fibers are
the most widely used for FRP bars as non-prestressed concrete reinforcement [6]. Thus,
only commercially available GFRP bars with the same nominal diameter were assessed.
2.1.1 GFRP Bar Samples
In this study, four different types of pultruded GFRP bars, denoted as Type-A, -B,
-C, and -D, were evaluated. The selected GFRP bars were produced by different pultruders;
therefore, all of them exhibit different constituent compositions, properties, and surface
enhancements. The surface treatment for each of the GFRP bars is as follows: Type-A bars
had a double helically-fiber-wrapped surface, Type-B bars had a four fiber-strand spiral
winding surface, Type-C bars were made with a spiral-ribbed deformed surface, and Type-
D bars had a helically grooved surface. The surface treatment and, measured diameter and
area (by immersion method, ASTM D792 [59]), for each type of the GFRP bar assessed in
this study, are shown in Table 2-1.

13
Table 2-1: Surface treatment and measured physical properties of GFRP bars
Bar
type Surface treatment
Diameter Area
mm (in.) mm2 (in.2)
A Double helically-
fiber-wrapped
9.56 (0.376) 71.80 (0.111)
B Four fiber-strand
spiral
9.16 (0.361) 65.89 (0.102)
C Spiral-ribbed
deformed
10.03 (0.395) 78.97 (0.122)
D Helically grooved
9.81 (0.386) 75.54 (0.117)
For comparison purposes, all evaluated GFRP bars had the same nominal diameter
of 9.5 mm (0.375 in.) and were not sand-coated. Type-A, -B, and -D bars were made with
ECR-glass fibers, 𝜌𝑓(𝐸𝐶𝑅) = 2600 kg/m3 (162.31 lb/ft3) [60], while Type-C bars with E-
glass fibers, 𝜌𝑓(𝐸) = 2500 kg/m3 (156.07 lb/ft3) [9], [10]. In addition, all GFRP bars were
made with vinyl ester, 𝜌𝑟 = 1220 kg/m3 (76.16 lb/ft3) [9], as the base resin in the matrix.
Since fillers represent a significant percentage of the matrix, for the purpose of this
study, 17.5% by weight of the neat resin of aluminum silicate (kaolin) fillers with a typical
density of 2580 kg/m3 (161.06 lb/ft3) was used to adjust the matrix densities. Also, due to
the pigment added to the resin during manufacturing, 8% by weight of the matrix was
added to the density of the GFRP bar Type-B. Taking these adjustments into account, the
matrix densities (𝜌𝑚) resulted in 1324 kg/m3 (82.65 lb/ft3) for GFRP bars Type-A, -C, and
-D, and 1364 kg/m3 (85.15 lb/ft3) for GFRP bar Type-B.

14
2.1.2 Specimen Preparation
2.1.2.1 Burn-off
The fiber and resin content by weight for all the different types of GFRP bars
assessed in this study were determined according to ASTM D2584 [56]. The principle of
this test is to measure the fiber/resin weight fraction by burning the organic resin matrix in
a muffle furnace at 565°C and calculating its proportion with respect to the original weight
of the composite. Since this test method only measures organic resin that burns completely
at the specified temperature, caution must be taken when interpreting the fiber and resin
fraction by weight. In this study, corrections were made to account for the remnant
inorganic fillers. For each type of GFRP bar, four 25.4-mm (1.0 in.) long samples were cut
and conditioned, as per standard, before being tested.
2.1.2.2 SEM
Sample preparation for either OM or SEM analysis is crucial [61]. In the case of
DIP analysis, samples require a highly polished surface to obtain optimal images. Prior to
imaging, GFRP bar samples must be carefully cut, ground, and polished. Three samples
12.7-mm (0.5 in.) long were cut from each type of GFRP bar using a water-cooled precision
saw (IsoMet 1000) with a diamond blade (IsoMet 15LC). To obtain a consistent highly
polished surface, a semiautomatic grinding/polishing machine (LaboForce 100) was used.
In order to facilitate this process and also to protect the edges of the GFRP bars, samples
were embedded in a cold-mounting epoxy resin “puck” (EpoFix). SEM sample preparation
steps and final product are shown in Figure 2-1.

15
Figure 2-1: SEM sample preparation. (a) GFRP bars; (b) epoxy resin mounting; (c)
vacuum chamber to remove air bubbles; (d) sectioning; (e) griding/polishing; (f) final
product of epoxy-impregnated samples.
Surface grinding and polishing was performed using the MD-System by Struers
with several levels of abrasiveness ranging from 500 grit size to 0.04 μm polishing cloth.
Different parameters, such as force, time, and rotational speed and direction of the sample
holder and the platen, along with various water-based diamond suspension, were selected
depending on the disc grit size as shown in Table 2-2. The chosen protocol provided the
best result based on multiple attempts using different configurations specifically for this
type of material. Between each execution, ultrasonic cleaner (Crest Ultrasonics) was used
to remove the remaining debris. Before imaging, the specimens were placed in an oven for

16
24-hours at a temperature of 50°C (122°F) to remove any possible moisture from the
sample that may have been absorbed during the process. The cross-sectional shapes of the
GFRP bars used in this study are shown in Figure 2-2.
Table 2-2: SEM sample grinding and polishing protocol
Surface
type
Grade Force Time Platen
speed
Specimen
speed
Relative
rotation
Lubricant/
suspension
N (min) (rpm) (rpm)
Gri
ndin
g
MD-
Piano
500 30 2 150 150 ↑↑ H2O
MD-
Piano
1200 30 3 150 150 ↑↓ H2O
20 3 150 150 ↑↑
MD-
Largo
9 µm 30 5 150 130 ↑↓ DiaPro
Largo 20 5 150 130 ↑↑
Poli
shin
g
MD-
Dac
3 µm 25 5 150 100 ↑↑ DiaPro
Dac
MD-
Nap
1 µm 25 4 150 110 ↑↑ DiaPro
Nap
MD-
Chem
0.04
µm
20 4 150 120 ↑↑ OP-U
15 5 150 120 ↑↑

17
Figure 2-2: Cross-sectional area of GFRP bars Type-A, -B, -C, and -D encased in epoxy
resin pucks.
2.1.2.3 Moisture Absorption
The moisture absorption rate for all short GFRP bars samples was evaluated
according to ASTM D570 [62] with some modification to the conditioning protocol. Since
the absorption rate of FRP composites depends on their current degree of saturation, instead
of conditioning the samples in an oven for 24 h at 50 ± 3°C (122 ±5.4°F), all samples were
dried at 60°C (140°F) until the weight did not decrease further, which the samples were
considered substantially dry. Four (4) samples 25.4-mm (1.0 in.) long were cut from each
type of GFRP bar using a water-cooled precision saw and conditioned before being

18
immersed in deionized water at 50 ± 3°C (122 ±5.4°F). Specimens were removed from
water, dried to remove surface moisture, and weighed to an accuracy of 0.001 g after 24
hours, one week, and then every two weeks of immersion until substantially saturated
(equal to less than 1% of the total weight gain in two consecutive measurements) according
to the long-term immersion protocol.
2.1.2.4 Tensile tests
To evaluate the correlation between moisture content and tensile strength retention,
twelve (12) 914-mm (36 in.) long GFRP bars Type-A were exposed to a moisture
absorption/desorption protocol followed by tensile tests at various degrees of saturation.
This protocol consisted of three phases: first, the GFRP bars were dried in the oven at 60ºC
(140°F) until substantially dry, then were conditioned in sea water at 60ºC (140°F), similar
to typical moisture absorption tests (weighing the samples before and after immersion),
until they were substantially saturated, and finally, the GFRP bars were re-dried in the oven
at 60ºC (140°F) until there was no change in weight. After completion of each phase, the
GFRP bars were retrieved and the ends were sealed with epoxy resin to prevent changes in
moisture content. The anchoring system required for testing was done by installing 300
mm (12 in.) long steel pipes filled with expansive mortar at both ends. Four (4) GFRP bars
(Type-A) were tested per each conditioning phase in accordance with ASTM D7205 [63].
The tensile tests were performed using a Baldwin screw gear mechanical testing machine
(PC-based controller) with a capacity of 890-kN (200-kip), and the load was increased at a
rate of 2 mm/min (0.078 in./min) until failure.

19
A one-way analysis of variance (ANOVA) was conducted to compare the effect of
moisture content on residual tensile properties. The statistical differences were reported in
terms of the ratio between-group variation to within-group variation (F-ratio) and the
probability that a result has occurred by chance (p-value). A level of significance 𝑝 < 0.05
(i.e., 5%) was considered statistically significant, as typically employed in statistics [64].
2.2 SEM Imaging – DIP Method
2.2.1 SEM Images Acquisition
SEM images were captured using a Zeiss EVO 60 SEM at the accelerating voltage
of 20 kV. As it was important to distinguish between the different constituents (fiber, resin
matrix, and voids), the images were obtained using the backscattered electron (BSE) signal.
Also, since GFRP bars are a non-conductive material and the samples were not sputter-
coated with a conducting metal, the variable pressure (VP) mode was used. Considering
that it is essential to obtain high-resolution SEM images, in this particular study, it was
found that a magnification level of 100× produces the largest field of view without
sacrificing image quality. For each of the three GFRP bar samples in each epoxy puck,
three images were captured at 100× and stored with a resolution of 2048 × 1536 pixels.
To be unbiased in the area where the images were taken, a procedure based on
specific locations was established. The concept of the specified locations is to analyze the
representative areas of the edge, center, and in-between of the GFRP bar. In each of the
embedded specimens, a GFRP bar was selected randomly and designated the number “1”,
the number “2” was given to the subsequent specimen located next to it clockwise and the

20
number “3” was assigned to the remaining specimen. For the image locations, the
designation goes as follows: the letter “X” for the top edge region, “Y” for halfway between
the center and the right edge, and “Z” for the center. The image notation was based on the
GFRP bar type (Type-A, -B, -C, or -D), the number of the sample (1, 2, or 3), and the
location where the image was taken (region X, Y, or Z). The location for each image
acquired, using the GFRP bar Type-A as an example, is shown in Figure 2-3.
Figure 2-3: Diagram of typical SEM image regions.

21
2.2.2 SEM Image Analysis
The BSE images obtained from SEM were analyzed using ImageJ, a public domain
open-source image processing software. The analysis consists of quantifying the
percentage of fiber, resin matrix, and void volume in each image using the threshold
function. First, the original images had to be converted into 8-bit binary images (grayscale);
this will change the interpretation of the images to integers in the range of 0 to 255. In the
black and white spectrum, this will display the fibers as white, while the matrix resin will
be displayed as grey and the voids as black area. Then, after the images were converted,
the Threshold function was used to show only specific ranges of intensity and to obtain the
corresponding percentage based on the entire analyzed area. The lower range will only
reveal the voids (darkest intensity), the mid-range will only show the matrix resin (grey
intensity), while the upper range will only display the fibers (whitest intensity). To avoid
overlaps and to quantify the entire spectrum (0-255), three unique display ranges of the
threshold spectrum were used for each of the analyzed images. Figure 2-4 shows an
example of the discussed DIP method for image A1Y, along with each corresponding
histogram. The shaded area in Figure 2-4.b, c, and d depict the range in the spectrum that
is being revealed.
In addition to the constituent content, the area of the individual glass fibers
(filaments) for all types of GFRP bars was measured. Eventually, using the area, the
diameter of the filaments was also calculated. This was performed using the Analyze
particles function built into the processing software.

22
Figure 2-4: Typical digital image processing method. (a) Original SEM image and
histogram; (b) voids, i.e., low range threshold; (c) resin matrix, i.e., mid-range threshold;
(d) glass fibers, i.e., upper range threshold.

23
2.2.3 Constituent Content – Calculation
The weight fractions of the constituents of each type of GFRP bar, using the DIP
method, were calculated as follows. For any number of constituents, in a given composite
material, the sum of the constituent weight fractions must equal 1 [15], [65]. For the GFRP
bars evaluated in this study, the components were fiber and matrix material, which leads
to the following equation,
𝜔𝑓 + 𝜔𝑚 = 1 (2.1)
where:
𝜔𝑓= 𝑤𝑓 𝑤𝑐⁄ is the fiber weight fraction
𝜔𝑚= 𝑤𝑚 𝑤𝑐⁄ is the matrix weight fraction
𝑤𝑓 is the weight of fiber material
𝑤𝑚 is the weight of matrix material
𝑤𝑐 is the total weight of the composite
This equation assumes that the weight of the voids is negligible. The same analogy can be
made for volume fraction [9]:
𝑉𝑓 + 𝑉𝑚 + 𝑉𝑣 = 1 (2.2)
where:
𝑉𝑓= 𝑣𝑓 𝑣𝑐⁄ is the fiber volume fraction

24
𝑉𝑚= 𝑣𝑚 𝑣𝑐⁄ is the matrix volume fraction
𝑉𝑣 = 𝑣𝑣 𝑣𝑐⁄ is the void volume fraction
𝑣𝑓 is the volume of fiber material
𝑣𝑚 is the volume of matrix material
𝑣𝑣 is the volume fraction of voids
𝑣𝑐 is the total volume of the composite
The relationship between weight and volume fraction, for both fiber and resin, may be
expressed as:
𝜔𝑓 =𝜌𝑓
𝜌𝑐𝑉𝑓 (2.3)
and
𝜔𝑚 =𝜌𝑚
𝜌𝑐𝑉𝑚 (2.4)
where 𝜌𝑓, 𝜌𝑚 and 𝜌𝑐 are the fiber, matrix, and composite densities, respectively. Also, the
density of a composite can be estimated through volume fractions and densities of the
constituent materials [9], [15], [65], which leads us to the following expression (“rule of
mixtures”):
𝜌𝑐 = 𝜌𝑓𝑣𝑓 + 𝜌𝑚𝑣𝑚 (2.5)
Having all the parameters, 𝜌𝑓, 𝜌𝑚, 𝜌𝑐, 𝑉𝑓, and 𝑉𝑚, Equation (2.3) and Equation (2.4) were
used to calculate the corresponding fiber and resin matrix weight fractions.
25
2.3 Results and Discussion
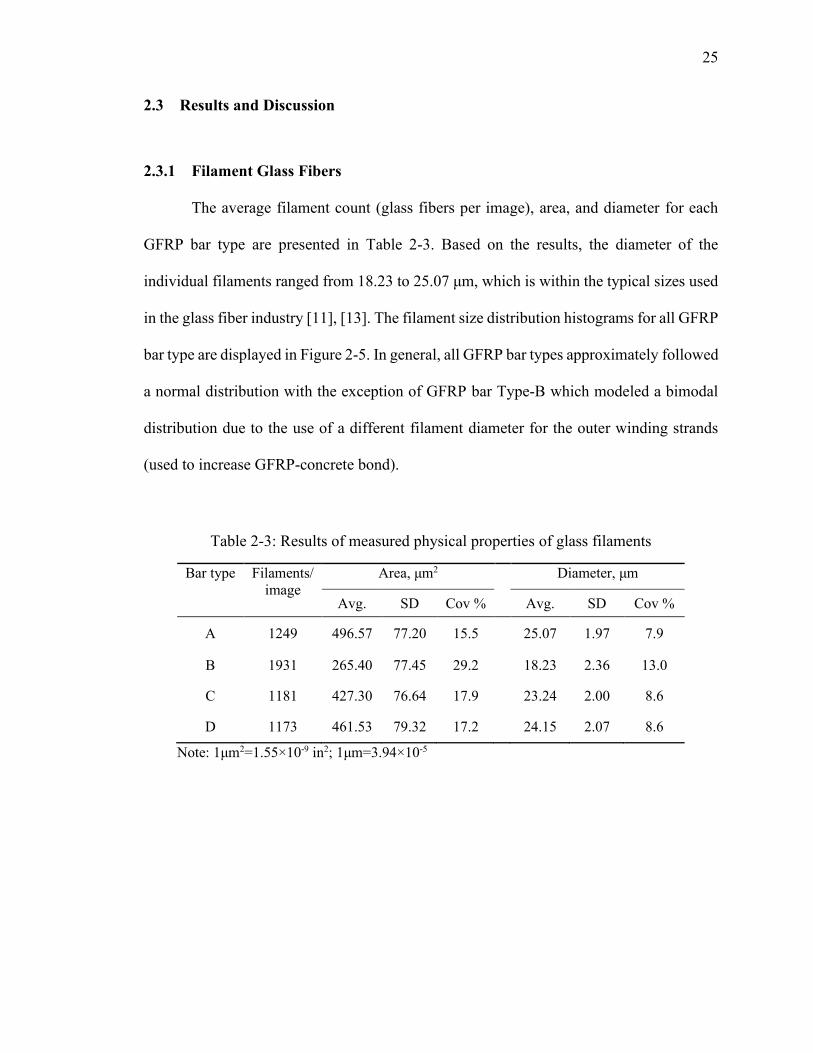
2.3.1 Filament Glass Fibers
The average filament count (glass fibers per image), area, and diameter for each
GFRP bar type are presented in Table 2-3. Based on the results, the diameter of the
individual filaments ranged from 18.23 to 25.07 μm, which is within the typical sizes used
in the glass fiber industry [11], [13]. The filament size distribution histograms for all GFRP
bar type are displayed in Figure 2-5. In general, all GFRP bar types approximately followed
a normal distribution with the exception of GFRP bar Type-B which modeled a bimodal
distribution due to the use of a different filament diameter for the outer winding strands
(used to increase GFRP-concrete bond).
Table 2-3: Results of measured physical properties of glass filaments
Bar type Filaments/
image
Area, μm2 Diameter, μm
Avg. SD Cov % Avg. SD Cov %
A 1249 496.57 77.20 15.5
25.07 1.97 7.9
B 1931 265.40 77.45 29.2
18.23 2.36 13.0
C 1181 427.30 76.64 17.9 23.24 2.00 8.6
D 1173 461.53 79.32 17.2
24.15 2.07 8.6
Note: 1μm2=1.55×10⁻⁹ in2; 1μm=3.94×10⁻⁵

26
Figure 2-5: Normalized frequency histogram of the filament diameter distribution.
2.3.2 Constituent Content
The average constituent volume percentages by region for each type of GFRP bars
acquired by the DIP method are shown in Table 2-4. Considering the four types of GFRP
bars, the mean fiber volume ranged from 55.45 to 72.64%, which is within the typical
values for continuous fiber composite materials [9], [11] and is above the standard limit
(CAN/CSA S807-10) for use in non-prestressed internal FRP reinforcement for concrete
structures [58]. The standard deviation values revealed that in regions closer to the edge,
the amount of fibers differs noticeably. For this reason, the fiber volume fraction in region
X (edge) for GFRP bar Type-A, B, and C was the smallest among the three regions, this

27
can be attributed to the outer bar resin coating, while for GFRP bar Type-D was slightly
higher indicating a more equal distribution of fibers along the edge and a smaller outer
resin layer.
Table 2-4: Measured SEM DIP constituent volume percentages
Bar
type
SEM
image
region
Fiber, 𝑉𝑓 (%) Matrix, 𝑉𝑚 (%) Voids, 𝑉𝑣 (%)
Avg. SD Avg. SD Avg. SD
A X 68.02 7.44 31.09 7.21 0.89 0.27
Y 72.63 1.17 26.88 1.21 0.49 0.09
Z 72.64 1.29 26.73 1.38 0.63 0.10
B X 60.34 5.07 39.24 5.35 0.42 0.30
Y 62.85 2.09 37.05 2.10 0.10 0.05
Z 62.88 3.35 36.20 1.95 0.92 1.42
C X 55.45 5.28 44.28 5.29 0.27 0.23
Y 61.31 0.38 38.67 0.37 0.02 0.01
Z 59.03 0.73 40.95 0.73 0.02 0.01
D X 67.60 3.94 32.28 3.95 0.12 0.01
Y 66.79 0.78 33.16 0.79 0.05 0.01
Z 66.32 3.37 33.61 3.39 0.06 0.03
The average void content by region, among the four types of GFRP bars, varied
from 0.02 and 0.92%. This broad range can be attributed to the irregular presence of voids
within the cross-section. For instance, Figure 2-6 (image B1Z) shows a considerable
amount of manufacturing defects (voids) at a specific location. This is considered a
“location-bias error” [66] and explains the high standard deviation of void content for
GFRP bar Type-B. Despite the broad range, all GFRP bars had less than 1% of void
content, which is ideal for the use of FRP bars as specified in CAN/CSA S807-10 [58].

28
Figure 2-6: High concentration of voids in the core of GFRP bar Type-B. (a) Original
SEM image; (b) location of voids highlighted in red.
Using Equation (2.3) and Equation (2.4), the average constituent volume fractions
from region X, Y, and Z for each GFRP bar type obtained from the DIP method were
converted to weight fraction. The equation to determine the composite densities, using the
corresponding average constituent volume fraction obtained from the DIP method, is given
in Equation (2.5). In the BO method, the remnant inorganic fillers will alter the weight
fraction values; therefore, to account for this, the established percentage (17.5% by weight
of the neat resin) regarding the fillers was subtracted from the weight of fibers. The average
fiber and resin matrix fraction by weight obtained from both methods, BO and DIP, as well
as the difference between these two methods, are shown in Table 2-5 and are plotted in
Figure 2-7.

29
Table 2-5: Fiber and resin weight fractions determined by BO and DIP methods
Bar type Fiber weight fraction, 𝜔𝑓 (%) Percentage
point
difference* BO DIP
Avg. SD Avg. SD
A 82.45 0.20 83.28 5.23 0.83
B 72.44 0.17 75.71 4.21 3.27
C 71.51 0.62 72.82 4.60 1.31
D 78.64 0.28 79.98 3.20 1.34
Matrix weight fraction, 𝜔𝑚 (%)
BO DIP
Avg. SD Avg. SD
A 17.55 0.20 16.72 2.54 0.83
B 27.56 0.17 24.29 2.16 3.27
C 28.49 0.62 27.18 2.38 1.31
D 21.36 0.28 20.02 1.64 1.34
Average 1.69
*Difference calculated as: |𝐵𝑂 − 𝐷𝐼𝑃|
Figure 2-7: GFRP bars constituent content, in percentage by weight, determined by BO
and DIP methods. Error bars represent 95% confidence intervals.

30
The highest difference between the fiber weight fraction obtain from BO and DIP
was 3.27 percentage points for GFRP bar Type-B, while the smallest was 0.83 percentage
points for GFRP bar Type-A. These differences can be attributed to the use of typical
constituent properties instead of the precise values used by each pultruders in the
fabrication of the GFRP bars. This issue highlights the importance of the availability of
product-specific information related to each lot supplied by the manufacturer. Also, since
the fiber and resin weight fraction values obtained by the BO method are calculated as the
ratio of remaining fibers with respect to the original weight of the composite, voids are
neglected in this method. Considering the four GFRP bars tested in this study, the average
fiber and resin weight fraction values agree within 1.69% between the two methods.
To date, only a handful of studies have been published on the evaluation of fiber
content in composites using image analysis compared to conventional methods. Viens [67]
investigated the fiber volume percentage of graphite/epoxy specimens by analyzing optical
images (threshold technique) and implementing the standard acid digestion technique. The
author concluded that the results were within a 5% agreement between the two methods.
Waterbury and Drzal [68] conducted a study on the fiber volume fraction of unidirectional
graphite composite panels evaluated by optical image analysis (area method) and the
chemical matrix digestion approach. They found that the results agree within better than
2.5% between the two methods. In another study, carried out by Cilley et al. [69],
graphite/epoxy laminates were evaluated through different methods including the acid
digestion test and various quantitative microscopy techniques. The results indicated that
the values between the acid digestion method and the areal analysis of micrographs agree
within 2.16%.

31
It should be noted that the presented studies were conducted more than 30 years
ago using optical imaging techniques that at this time would be considered obsolete. Thus,
the sharpness and resolution of images, which is of great importance in image processing,
may have influenced the outcomes. While this may be true, the ease of operation and
availability of more powerful equipment nowadays facilitates the acquisition and
processing of digital microscopy images. Although SEM is the norm for performing
microstructural characterization on FRP bars [34], optical microscopes with sufficient
capability to capture high-resolution images, such as confocal laser scanning microscope,
have been used [70].
In this study, taking into account that the analyzed micrographs had an area of
1137.8 μm × 763.9 μm (cropped data zone parameters), the average evaluated area at 100×
among all the GFRP bars (9 images per GFRP bar type) was 11% with respect to the total
cross-sectional area of the composite. It can be interpreted that the more images that are
captured and analyzed, the more accurate results will be obtained, but the purpose of this
study, for practical reasons, was to evaluate representative values with reasonable
quantities of images.
2.3.3 Moisture Absorption
Moisture uptake has been identified as one of the main causes of deterioration of
GFRP composites along with exposure to alkaline environments, extreme temperatures,
and sustained loads [34]. Although researchers have also described this phenomenon as
complex (due to the various causes that could influence this process), three main factors
that influence moisture absorption have been widely recognized: (i) diffuses into the

32
matrix, (ii) the capillary effect of the fiber/resin matrix interface, and (iii) voids/defects and
microcracks store water and increase water uptake [71].
El-Hassan et al. [54] investigated the relationship between void content and long-
term moisture absorption by comparing two different types of GFRP bars (glass/epoxy). In
the study, they quantified the void content by two physical methods in which the total
amount of voids in both GFRP bars resulted in 0.10 and 0.23%. The authors associated the
latter with higher moisture uptake. Interestingly enough, the GFRP bar that had 2.3 times
more voids than the other only absorbed approximately 20% more moisture. Kampmann
et al. [72] evaluated three types of 9.5-mm diameter GFRP bars (glass/vinyl ester) and their
correlation between moisture absorption and tensile strength retention. They concluded
that highly porous GFRP bars microstructures result in greater moisture uptake. More
recently, Emparanza [73] reported a similar trend in which GFRP bars with higher porosity
resulted in higher moisture absorption; however, it was also concluded that more
confirmatory assessment should be performed.
Figure 2-8 shows the moisture uptake for short GFRP bars used in this study due to
long-term conditioning (deionized water at 50 ± 3°C [122 ±5.4°F]). Overall, after 71 days
of exposure GFRP Type-A, -C, and -D bars showed a similar trend and were considered
substantially saturated with a weight increase of 0.24, 0.21, and 0.17%, respectively.
However, at the same time, GFRP Type-B noticeable gained more weight with an absorbed
moisture content of 0.42%, while saturation was not reached. This might be explained by
analyzing the pore structures of GFRP bars. Nonetheless, after 71 days of exposure, all the
GFRP bars remained under 0.25% weight change during the first 24 h and GFRP bar Type-
A, -C, and -D remained under 1.0% weight change at saturation corresponding to short-

33
and long-term moisture absorption thresholds as per ASTM D570 [62]. Whereas long-term
immersion for GFRP bar Type-B was inconclusive since it seems that substantial saturation
was not reached.
Figure 2-8: Moisture uptake of GFRP bars. Error bars represent standard deviation of the
mean.
Based on the void content and moisture uptake results it is evident that a correlation
exists. From the SEM-DIP technique and considering all areas (X, Y, and Z), the average
volume void fraction for GFRP bar Type-A, -B, -C, and -D were 0.67, 0.48, 0.10, and
0.08%, respectively. The moisture absorption values are aligned with those obtained with
the SEM-DIP method except for GFRP Type-B. A possible explanation for this particular
inconsistency can be explained by considering not only the total among of void content but
also the size of voids/defects (porosity) and their continuity.

34
As discussed in Section 2.3.2, the GFRP bar Type-B had a high agglomeration of
undistributed voids/defects in the core. For instance, Figure 2-9 shows clusters (pore
interconnectivity) of voids/defects dispersed throughout the entire cross-sectional area. It
seems that, in addition to the total void volume fraction, the type of voids affects the rate
of moisture absorption; in other words, a large number of micro-voids (discrete) cannot
necessarily be interpreted in a similar way as large clustered voids (continuous),
independently of the total amount, as they will have different effects.
Figure 2-9: GFRP bar Type-B with high presence of clustered voids/defects

35
2.3.4 Correlation between degree of saturation and tensile properties
The weight gain with respect to the exposure time of 914-mm (36 in.) long GFRP
bars Type-A is shown in Figure 2-10. The different substantially dry/saturated degrees
reached were identified as periods (with Roman numerals) as follows: “I” for pristine (as-
received) specimens, “II” for substantially dry specimens, “III” for substantially saturated
specimens, and “IV” for re-dried specimens.
Figure 2-10: Moisture absorption curve for 914-mm long GFRP bars Type-A.
At periods II, III, and IV the average change in weight was -0.08, 0.24, and -0.02%
respectively. It is evident that during the drying phases (II and IV) both groups of GFRP
bars reached a plateau at a different moisture content. However, this may be explained by
two possible reasons or a combination of both in which at period IV (i) the precipitation of
the salt particles affected their weight and/or (ii) due to the high temperature [60°C

36
(140°F)], the surface/ends lost moisture rapidly causing it to shrink (as it dried) and
inhibited moisture diffusion, while the inner layers remained relatively unchanged [14].
Based on the unconditioned values (100% retention), Table 2-6 reports the residual
tensile strength, modulus of elasticity, and ultimate tensile rupture over the different
periods, along with their corresponding covariance values. The degree of saturation of the
GFRP bars at the different periods was established as follows: 0% for substantially dry
specimens (period II) and 100% for substantially saturated specimens (period III), while
for periods I and IV it was calculated by linear interpolation.
At 0% degree of saturation, the tensile strength and ultimate strain increased 7 and
9%, respectively. Once the GFRP bars were substantially saturated the tensile strength and
rupture decreased 9 and 12%, respectively. After re-drying, they recovered 7 and 6% of the
tensile strength and ultimate strain, respectively, compared to substantially saturated
specimens. A similar recovery trend has been reported [71], mainly due to the reversible
plasticizing effect. The fact that they have not fully recovered to initial values indicates, in
part, that there was some type of irreversible degradation such as moisture-induced matrix
swelling promoting interface debonding [71], [74].
Conversely, the elastic modulus retention of conditioned GFRP bars ranged from
98 to 103% among the different exposure periods. Considering the covariance values, it
could be interpreted that under those conditions the degree of saturation does not have an
evident effect on the elastic modulus. Therefore, a more in-depth assessment of the
degradation mechanisms is discussed in Chapter 4.

37
Table 2-6: Tensile properties of GFRP Type-A after absorption/desorption protocol
Period Tensile strength Elastic modulus Ultimate strain
Avg. COV Retention Avg. COV Retention Avg. COV Retention
MPa
(ksi) (%) (%)
GPa
(msi) (%) (%)
(%) (%) (%)
I 822.2
(119.3)
4.7 100 55.0
(7.98)
2.0 100 1.49 5.2 100
II 881.0
(127.8)
3.2 107 53.9
(7.82)
2.1 98 1.64 4.4 109
III 744.9
(108.0)
2.2 91 56.5
(8.20)
3.6 103 1.32 1.9 88
IV 808.7
(117.3)
5.5 98 56.5
(8.20)
2.1 103 1.43 5.9 94
The normalized tensile properties (tensile strength, modulus, and ultimate tensile
strain), based on the pristine values (100%), performed at different degrees of saturation
are shown in Figure 2-11. For both the tensile strength and the tensile rupture, as the degree
of saturation increases, the retention of the strength decreases with r2 values (by linear
regression) of 0.86 and 0.77, respectively. This was supported by one-way ANOVA which
revealed that there was a statistically significant effect between the degree of saturation
and the mean residual tensile strength (F = 12.7, p < 0.001) and rupture strain (F = 14.5,
p < 0.001). In the case of the elastic modulus, the r2 = 0.44 and the difference was not
statistically significant (F = 3.21, p = 0.062) as determined by one-way ANOVA.

38
Figure 2-11: Normalized tensile properties with respect to the degree of saturation for
GFRP Type-A. Error bars represent 95% confidence intervals.

39
2.4 Concluding Remarks
In accordance with the results obtained the following observations are made.
• The DIP method was successfully performed and provided direct quantifiable
values of the volume fraction of each constituent.
• Unlike composite matrix separation methods, the DIP method has the capability to
provide additional microstructural information such as fiber size and distribution,
imperfections, and the presence of voids.
• Even though the percentages of fiber and resin weight fractions in each of the GFRP
bars turned out to be different, all were above the limit of 70% by weight commonly
specified in standards such as ASTM D7957 [75] and CSA S807-10 [58].
• Comparable results were obtained from the two methods (BO and DIP), which are
in agreement with those reported in the literature. The differences can be credited
to the use of assumed typical constituent properties and contents instead of the
actual values used by the manufacturers.
• Analysis of 11% (9 images per GFRP type at 100×) of the total cross-sectional area
of the GFRP bar using the DIP method was sufficient to obtain representative
results when compared to the BO method. However, the random nature of clustered
voids and defects can lead to an under/over-assessment of their volume fractions
(noticeable in GFRP bar Type-B).
• The weight fraction values obtained from the DIP method depend on the quantity
and density of the individual constituents; in fact, perhaps the actual volume
fraction of fibers, resin matrix, and voids obtained directly from the DIP method

40
are more relevant and reliable to assess mechanical properties than the percentages
of constituent content obtained by weight (BO method).
• The ease of ingress of moisture towards a lower-moisture concentration (inward)
was related to the amount and size of voids/defects.
• Tensile strength and ultimate tensile strain were affected by the degree of saturation
(91-107% variation), but not the longitudinal modulus of elasticity.
2.5 Future Research
The conclusions reached in this study using the DIP method emphasize the relevance
and practicality of obtaining direct quantification of fiber, resin matrix, and voids volume
as opposed to fiber and resin content by weight. Future studies may develop computerized
methods to automatically analyze microstructure integrity (e.g., identify fiber/resin
interphase damage, cracked fibers, and fiber dissolution) using the entire cross-sectional
area. The correlation between moisture absorption rate and void/defect content was also
highlighted. Although, further experimental tests should be conducted on GFRP bars with
different diameters and surface characteristics, such as sand-coated GFRP bars. In addition,
the optimal percentage of the area to be analyzed that statistically corresponds to the total
area of the GFRP bar should be studied.

Chapter 3
Flexural Performance of Seawater-Mixed GFRP-RC Slabs
It has been widely recognized that FRP reinforcement has the potential to solve the
issue of corrosion in RC structures due to its non-corrosive properties. By not having to
deal with corrosion degradation, seawater-mixed concrete (seaconcrete) can be used
together with non-corrosive reinforcement. Considerable research has been conducted on
the behavior of one-way simply supported GFRP-RC slabs, however, nearly all was limited
to short-term performance and the use of conventional concrete. This chapter examines the
flexural and durability performance of simply supported GFRP-RC slabs made with
seaconcrete that has been exposed to different conditionings over short and long periods.
3.1 Methodology
Two different seaconcrete mixtures and environmental conditions were evaluated
over several periods. The environmental exposures consisted of typical field conditions and
accelerated aging. The experimental results of the simply supported GFRP-RC slabs were
41

42
assessed and compared based on ultimate capacity, cracking load, and midspan deflection.
In addition, a two-way ANOVA was used to determine the interaction between the time of
exposure and environmental conditioning, where a level of 𝑝 < 0.05 was also considered
statistically significant.
3.1.1 Seaconcrete
The selected seaconcrete mix designs were based on the Infravation-funded
international collaborative research project named SEACON, in which an extensive and
detailed evaluation of the properties of the fresh and hardened state of concrete made with
seawater was conducted [76]. Both seaconcrete mix designs denoted as mix Type-F and
mix Type-S had a target 28-days compressive strength of 38 MPa (5,500 psi). Mix Type-F
had a fly ash cement replacement level of 20%𝜔𝑡, while mix Type-S had a ground
granulated blast furnace slag (GGBFS) replacement level of 50%𝜔𝑡. The seawater used to
mix the concrete, as well as for the accelerated aging conditioning, was obtained directly
from Biscayne Bay, FL (U.S.) with a pH value of 8.23. Further details on the chemical
composition of the seawater used in this study are provided in parallel studies [53], [77].
Table 3-1 provides details of the proportions for each mix. For each particular seaconcrete
mix design, all concrete elements were cast from a single batch using a ready-mix truck.

43
Table 3-1: Seaconcrete mix designs (adapted from Ref. [76])
Material Mix Type-F
Mix Type-S
kg/m3 (gal/yd3)
Portland Cement 332 (560) 208 (350)
Fly ash 83 (140) -
Slag - 208 (350)
Seawater 168 (283) 158 (267)
Coarse aggregate 1038 (1750) 997 (1680)
Fine aggregate 612 (1032) 691 (1165)
mL/m3 (gal/yd3)
Set retarding admixture 830 (0.2) 2179 (0.4)
Air-entraining admixture 310 (0.1) 20 (0.004)
Water reducing admixture - 817 (0.2)
w/cm
0.40 0.38
Note: w/cm= water-to-cementitious materials ratio
Concrete cylinders with a diameter of 100 mm (4 in.) and a height of 200 mm (8
in.) were cast along with each group of slabs to evaluate compressive strength development
over time following ASTM C39 [78]. In addition, after 24 months of exposure, concrete
cylinders were assessed by non-destructive testing (NDT) methods to partially evaluate the
durability performance of hardened concrete. Such tests consist of bulk resistivity, surface
resistivity, and ultrasonic pulse velocity (UPV) according to AASHTO TP 119 [79],
AASHTO T 358 [80], and ASTM C597 [81], respectively.
Furthermore, pH and carbonation depth measurements were conducted on concrete
cylinders aged for 24 months. The pH measurements will provide a quantitative estimate

44
of its alkalinity. The test method proposed by Grubb et al. [82] was used to measure the
pH of concrete due to its relative simplicity and precision [36], in which powdered concrete
is diluted with deionized water (1:2) and filtered before testing. In this study, the pH of the
concrete was measured using pH indicator strips and a pH meter, while the depth of
carbonation was estimated by spraying a proprietary “Rainbow Indicator” (by Germann
Instruments) on the freshly broken concrete surface, which changes color according to its
alkalinity, and measuring the distance from the edge towards the core of the cylinder.
3.1.2 GFRP Bar
The pultruded 9.5-mm (.375 in.) nominal diameter GFRP bars (denoted as Type-A
in Chapter 2) used in this study were fabricated from continuous ECR-glass with a fiber
content of 85% (by weight) determined according to ASTM D2584 [56] impregnated in a
vinyl ester resin matrix. The surface enhancement consisted of a double helically-fiber-
wrapped surface creating a small 45° braided surface pattern undulation. The physical and
mechanical properties of pristine GFRP bars were determined according to the established
test methods indicated in the ASTM D7957 [75]. The property, test method, experimental
value, and coefficient of variation for each test are given in Table 3-2. Interestingly, the
measured cross-sectional area was very close to the nominal value specified in ASTM
D7957 [75] for M10 (No. 3) GFRP bars (percentage error around 1%). The mechanical
properties (i.e. ultimate and guaranteed tensile strength, modulus of elasticity, and ultimate
strain) of the GFRP bars were tested as per ASTM D7205 [63] and calculated using the
measured cross-sectional area.

45
Table 3-2: Physical and mechanical characterization of the GFRP bars
Property Unit Test Method Value Cov %
Physical
properties
Effective
diameter
mm (in.) ASTM D7205 9.56
(0.376)
0.24
Cross-sectional
area
mm2
(in.2)
ASTM D792 71.81
(0.111)
0.49
Mechanical
properties
Tensile strength MPa
(ksi)
ASTM D7205 822.23
(119.25)
4.7
Guaranteed
tensile strength*
MPa
(ksi)
ASTM D7205 705.95
(102.39)
-
Tensile modulus GPa
(ksi)
ASTM D7205 55.04
(7983)
2.0
Ultimate tensile
strain
% ASTM D7205 1.49 5.2
*Guaranteed tensile strength, (𝑓𝑓𝑢*), equal to the mean tensile strength of test specimens minus three
times the standard deviation.
3.1.3 GFRP-RC Slabs
In total, forty-eight (48) simply supported GFRP-RC slabs made with seaconcrete
mix designs Type-F and Type-S were investigated. All slabs had a span of 1524 mm (60
in.) and were constructed with a cross-sectional area of 152 by 304 mm (6 in. × 12 in.) and
a length of 1828 mm (72 in.) as shown in Figure 3-1. All slabs were reinforced with a single
GFRP bar, 9.5-mm (.375 in.) in diameter, selected from the same batch. The clear concrete
cover was 19 mm (0.75 in.). The use of a single M10 (No. 3) GFRP bar was to provide a
tension-controlled failure. This choice guarantees the limit state of GFRP rupture as the
failure parameter, necessary for the evaluation of reinforcement degradation.

46
Figure 3-1: GFRP-RC slab geometry: cross-section (top) and top view (bottom).
3.1.4 Environmental Conditioning
After 28-day moist curing, half of the GFRP-RC slabs were completely submerged
in temperature-controlled seawater inside various polyurethane tanks at a constant
temperature of 60°C (140°F), as shown in Figure 3-2, while the other half were exposed to
a typical subtropical field environment. The chosen temperature of 60°C (140°F) is well
below the Tg of the GFRP bars used in this study, which is approximately 112°C (234°F).
At the same time, the samples exposed to the field environment were subjected to a
subtropical climate with an average ambient temperature of 25.7°C (78.3°F) and average
relative humidity (RH) of 71.2 % [83]. Concrete cylinders were exposed to the same
environmental conditioning as the GFRP-RC slabs, plus some cylinders were kept in the
moist room as an additional exposure conditioning.

47
Figure 3-2: Diagram layout of accelerated curing tank.
The nomenclature for the specimens was based on the type of mix design, exposure
conditioning, and time of exposure. The first letter in the nomenclature denotes the type of
mix design, i.e., letter F for the mix design made using fly ash and the letter S for the one
made with slag. The second segment denotes the exposure conditioning, “FC25” for field
conditioning at 25°C and “SW60” for specimens conditioned in seawater at 60°C (140°F).
Lastly, the third portion represents the exposure time in months, i.e. 1, 6, 12, and 24 months.
For example, “F-FC25-24” for concrete elements cast with mix design “Type-F” exposed
to field conditioning, “FC”, at a temperature of 25°C for 24 months.
3.1.5 Test Setup
The flexural behavior of the GFRP-RC slabs was determined by placing the slabs
between two supports with a clear span of 1524 mm (60 in.) and loaded at midspan using
a 240-kN (55-kip) hydraulic MTS universal test frame as shown in Figure 3-3. The applied

48
load was measured using the MTS internal force transducer. Linear variable differential
transducers (LVDTs) were used to measure midspan deflection and any settlement in both
supports. In addition, the compressive strain was also measured and recorded using two
strain gauges attached to the outer face of the concrete on the top surface of the GFRP-RC
slabs. All test data were recorded simultaneously using a multiple portable data acquisition
(DAQ) system.
Figure 3-3: Experimental setup of simply supported GFRP-RC slab.
All of the GFRP-RC slabs were tested under two control conditions throughout the
3-point bending flexural test. Load control, at a rate of .222 kN/s (50 lb/s), was used during
the first phase of the test in four dual loading-unloading cycles equivalent to 50%, 67%,
83%, and 100% of the test load magnitude, which is defined as the 85% of the ultimate
design load capacity for tension-controlled specimens, as per ACI 437-12 [84]. During
each load step, the load was held for 2 minutes. After the first loading protocol was

49
completed, the load was applied to the slabs until failure under a displacement-controlled
monotonic loading rate of 0.318 mm/s (0.0125 in/sec). Three repetitions of flexural test per
each mix design and exposure conditioning were performed after 1, 6, 12, and 24 months
of exposure.
3.2 Predicted Flexural Behavior – Calculation
3.2.1 Predicted and Design Capacity
The flexural strength capacity of an FRP-RC member can be determined based on
the strength limit states in which failure is controlled by either concrete crushing or FRP
bar rupture [8]. In a given section, when the FRP reinforcement ratio 𝜌𝑓 (= 𝐴𝑓 𝑏𝑑⁄ , where
𝐴𝑓 is the total area of FRP bars, 𝑏 is the width of the rectangular cross-section, and 𝑑 is the
effective depth of the slab section) is less than the balanced ratio (𝜌𝑓𝑏) the failure is
controlled by FRP bar rupture (tension-controlled section), otherwise, it is governed by the
concrete crushing limit state. The balanced failure strain condition occurs when the
concrete strain reaches its ultimate capacity, at the same time as the outermost FRP bar
layer reaches its strain capacity. According to the ACI 440 Committee, the balanced FRP
reinforcement ratio can be computed as follows:
𝜌𝑓𝑏 = .85𝛽1𝑓𝑐
′
𝑓𝑓𝑢
𝐸𝑓𝜀𝑐𝑢
𝐸𝑓𝜀𝑐𝑢+𝑓𝑓𝑢 (3.1)
where:
𝑓𝑐′ is the specified compressive strength of concrete, MPa (psi)

50
𝐸𝑓 is the modulus of elasticity of the reinforcement, MPa (psi)
𝑓𝑓𝑢 = 𝐶𝐸𝑓𝑓𝑢* is the design tensile strength of FRP bars, MPa (psi)
𝐶𝐸 is the environmental reduction factor
𝜀𝑐𝑢 is the ultimate strain of concrete (taken as 3000 𝜇𝜀)
𝛽1 is the strength reduction factor
The 𝐶𝐸 factor was determined based on the consensus of the ACI 440 Committee and varies
between 0.70 and 1.0 (reduction of 30% to none), depending on the fiber type and exposure
conditioning; 0.70 for concrete structures exposed to earth and weather and 1.0 for no such
exposure. The 𝛽1 is taken as 0.85 for concrete compressive strength equal or less than 28
MPa (4,000 psi); for strength exceeding 28 MPa (4000 psi), the factor 𝛽1 is reduced
continuously at a rate of 0.05 for every 7 MPa (1,000 psi) of strength above 28 MPa (4,000
psi) with a threshold not less than 0.65. The 𝐸𝑓 can be taken as the mean elastic modulus
value reported by the manufacture.
Since in this study the GFRP-RC slabs were “under-reinforced”, this section solely
reviews when failure is determined by rupture of the FRP reinforcement. In a tension-
controlled section, given that the 𝑓𝑓𝑢 is reached first, 𝜀𝑐𝑢 is less than 3000 𝜇𝜀, and, as a
result, the depth of the neutral axis 𝑐 is unknown. In this case, the ACI equivalent
rectangular stress block parameters are not applicable. Therefore, it is required to compute
the neutral axis location based on the equilibrium and strain compatibility, as well as a non-
linear stress distribution of the concrete. The corresponding stress distribution in concrete
can be approximated with an equivalent rectangular stress block using two strain- and

51
stress-dependent parameters, β and α [13]. Several stress-strain models have been proposed
to interpret the behavior of concrete [10]; being the one proposed by Todeschini et al. [85]
one of the most used. The equivalent stress block parameters for Todeschini’s model can
be calculated as follows [11], [13], [86]:
𝛽 = 2 −4[(𝜀𝑐 𝜀𝑐
′⁄ )−tan−1(𝜀𝑐 𝜀𝑐′⁄ )]
(𝜀𝑐 𝜀𝑐′⁄ ) ln[1+(𝜀𝑐 𝜀𝑐
′⁄ )2
] (3.2)
𝛼 =0.90 ln[1+(𝜀𝑐 𝜀𝑐
′⁄ )2
]
𝛽(𝜀𝑐 𝜀𝑐′⁄ )
(3.3)
𝜀𝑐′ = 1.71(𝑓𝑐
′ 𝐸𝑐⁄ ) (3.4)
where:
𝜀𝑐 is the compressive strain in concrete
𝜀𝑐′ is the concrete strain corresponding to 𝑓𝑐
′
The modulus of elasticity of concrete (𝐸𝑐) can be calculated by the simplified equation
suggested by ACI 318-19 [87] as 𝐸𝑐 = 4700√𝑓𝑐′ MPa (𝐸𝑐 = 57,000√𝑓𝑐
′ psi) for normal-
weight concrete.
Based on the stress distribution of a tension-controlled section and applying
compatibility internal force equilibrium, where the resultant of the compressive stress in
the concrete equals the tensile force in the reinforcement, the following expression can be
made:
𝐴𝑓𝑓𝑓𝑢 = 𝛽𝛼𝑓𝑐′𝑏𝑐 (3.5)
where 𝑐 is the distance from the extreme compression fiber to the neutral axis.

52
In this study, the analytical method used to determine the nominal moment capacity
was based on the iterative approach. First a depth of a neutral axis, 𝑐, (𝑐 < 𝑐𝑏) was assumed
so that the parameters 𝜀𝑐, 𝛽, and 𝛼 could be calculated. Then, using the equilibrium
expression [Equation (3.5)] a “new” 𝑐 was computed. This was iterated until convergence
between the assumed neutral axis and the computed one was achieved. Lastly, the
analytical nominal moment capacity (𝑀𝑛(𝑎𝑛)) was determined using the final values
obtained for 𝛽 and 𝑐 as follows:
𝑀𝑛(𝑎𝑛) = 𝐴𝑓𝑓𝑓𝑢 (𝑑 −𝛽𝑐
2) [N-mm (lb-in.)] (3.6)
The nominal capacities calculated using this method were defined as the analytical
solution.
Given that the analytical procedure can be computationally intensive, the ACI 440
Committee recommends the use of a simplified calculation of the nominal flexural strength.
For a tension-controlled section, the ACI 440.1R-15 [8] approach allows the use of the
equivalent rectangular stress block (irrespectively of the strain reached by the concrete)
and the use of the neutral axis depth for balance failure determined as:
𝑐𝑏 = (𝜀𝑐𝑢
𝜀𝑐𝑢+𝜀𝑓𝑢) 𝑑 (3.7)
Under these assumptions, the approximate nominal capacity provided in ACI
440.1R-15 [8] can be calculated as follow:
𝑀𝑛(𝐴𝐶𝐼) = 𝐴𝑓𝑓𝑓𝑢 (𝑑 −𝛽1𝑐𝑏
2) [N-mm (lb-in.)] (3.8)

53
Since in a tensile-controlled section 𝑐 < 𝑐𝑏, the bending moment capacity
calculated using Equation (3.8) is considered a conservative lower bound estimate. The
predicted nominal capacities calculated using Equation (3.8) were labeled as the ACI
solution (𝑀𝑛(𝐴𝐶𝐼)).
Additionally, the ACI 440 recommends estimating the cracking moment (𝑀𝑐𝑟)
capacity as follow:
𝑀𝑐𝑟 =0.62𝜆√𝑓𝑐
′𝐼𝑔
𝑦𝑡 [N-mm (lb-in.)] (3.9)
where:
𝜆 is the modification factor for lightweight concrete
𝐼𝑔 is the gross moment of inertia, mm4 (in.4)
𝑦𝑡 is the distance from the centroidal axis of the gross section to the top face, mm
(in.)
For a rectangular section 𝐼𝑔 = 𝑏ℎ3 12⁄ where ℎ is the height of the cross-section. The 𝑓𝑐′
used in Equation (3.9) were those obtained from the concrete compression tests, which
were performed at the same time as the flexural tests. Subsequently, the predicted cracking
loads (𝑃𝑐𝑟 𝑝𝑟𝑒) were back-calculated from the cracking moment capacity equation.
3.2.2 Prediction of Midspan Deflection
The instantaneous predicted deflections were calculated according to ACI 440.1R-
15 [8] using standard structural analysis techniques for a simply supported slab under

54
concentrated load at midspan (∆= 𝑃𝐿3 48𝐸𝑐𝐼⁄ , where 𝑃 is the applied load, 𝐿 is the total
span length, and 𝐼 is the moment of inertia). For an uncracked section, the moment of
inertia is equal to the gross moment of inertial (𝐼𝑔). Once the applied moment surpasses the
cracking moment, the overall flexural stiffness decreased leading to the following effective
moment of inertia as per ACI 440.1R-15 [8]:
𝐼𝑒 =𝐼𝑐𝑟
1−𝛾(𝑀𝑐𝑟𝑀𝑎
)2
[1−𝐼𝑐𝑟𝐼𝑔
] [mm4 (in.4)] (3.10)
where:
𝐼𝑒 is the effective moment of inertia, mm4 (in.4)
𝑀𝑎 is the applied moment, N-mm (lb-in.)
𝛾 is a parameter used to account for the variation in stiffness along the member
𝐼𝑐𝑟 is the transformed moment of inertia, mm4 (in.4)
The factor 𝛾 depends on the load and boundary conditions; for a simply supported span
with a concentrated load at midspan 𝛾 = 3 − 2(𝑀𝑐𝑟 𝑀𝑎⁄ ) as suggested by Bischoff and
Gross [88]. For a singly-reinforced rectangular member, 𝐼𝑐𝑟 = (𝑏𝑑3 3⁄ )𝑘3 + 𝑛𝑓𝐴𝑓𝑑2(1 −
𝑘)2 where 𝑘 = √2𝜌𝑓𝑛𝑓 + (𝜌𝑓𝑛𝑓)2
− 𝜌𝑓𝑛𝑓 is the ratio of neutral axis to reinforcement
depth and 𝑛𝑓 = 𝐸𝑓 𝐸𝑐⁄ . The effective moment of inertia (𝐼𝑒) and the conventional structural
analysis equations were used to calculate the predicted instantaneous post-crack
deflections.

55
3.3 Results and Discussion
3.3.1 Characterization of Seaconcrete
A minimum of three (3) concrete cylinders were tested for each exposure
conditioning and period to assess strength development over time. For concrete Type-F,
additional compressive strength tests were also performed at 18 months of exposure. After
28-days of moist-curing (moist room at 100% HR and temperature of 23 ± 1°C [73.4 ±
2°F]), the average compressive strength of concrete Type-F and Type-S were 41.6 MPa
(6,040 psi) and 37.3 MPa (5,414 psi), respectively. Figure 3-4 shows the compressive
strength development of the concrete cylinders that were exposed to the same time and
environmental conditioning as the GFRP-RC slabs, in addition to cylinders that were
continuously cured in the moisture room (MR23).
In the case of concrete Type-S, a decrease of 13% was observed for the 6-month
exposure period (with respect to the previous one); then a slight increase after the 12-month
period which decreased again in the last period. This concrete compressive strength
behavior is not in line with those reported in the literature for GGBFS-blended concrete
made with seawater [89–91] (which increases strength gradually). However, since the
concrete constituents were dosed at a concrete batching plant and delivered using a ready-
mix truck, caution should be taken when interpreting the results due to the greater potential
for variability as opposed to a controlled laboratory environment. Nonetheless, these
outcomes could be considered practical, as they would allow for a more realistic and
representative large-scale concrete production scenario taking into account that, even with

56
the unexpected behavior, the compressive strengths were above the target 28-day
compressive strength.
Figure 3-4: Concrete compressive strength over time of exposure. Error bars represent
standard deviation.
After 24 months of exposure, concrete cylinders made with concrete Type-F that
were exposed to field conditioning and submerged in seawater at 60°C (140°F) exhibited

57
compressive strength comparable to that of samples cured in moist-room with a difference
of 1.8% and 6.4%, respectively. Similarly, comparable results were also measured for
cylinders made with concrete Type-S with a difference of 3.8% and 2.4% for field exposure
and accelerated aging, respectively. The two-way ANOVA showed no statistically
significant interaction between the effects of environmental conditioning and exposure
time on the compressive strength, F =1.72, p = 0.133 for specimens made with concrete
Type-F and F = 0.348, p = 0.939 for specimens made with concrete Type-S. These results
are in agreement with the literature [18]. Conversely, the environmental conditioning
exposure for concrete cylinders made with mix Type-F seems to have an effect (p = 0.001),
but not for mix Type-S (p = 0.382).
For comparison purposes, four (4) cylinders per mix design and environmental
conditioning were evaluated by NDT, as well as pH and carbonation depth measurements
were taken. These results are summarized in Table 3-3. Due to different conditioning
regimens, concrete samples have different moisture content; therefore, durability tests
should only be compared between samples that have the same conditioning regimen.
Table 3-3: Durability characterization of concrete after 24 months of exposure
Specimen
designation
Bulk
resistivity
Surface
resistivity
UPV Measured
pH*
Carbonation
depth
(Ω-m) (Ω-m) (m/s) -- (mm)
F-FC25-24 5864 11588 4442 11.9 5
F-SW60-24 387 887 4763 11.8 -
S-FC25-24 1550 2911 4224 11.2 10
S-SW60-24 534 1053 4568 11.5 -
*= obtained with a pH meter; 1 Ω-m = 39.37 Ω-in.; 1 m/s = 3.28 ft/s; 1 mm = 0.0393 in.

58
For the specimens exposed to FC25, the bulk electrical resistivity and surface
resistivity of concrete Type-F were approximately four times higher than those of concrete
Type-S, while the UPV results revealed only a 5% difference between both types of
concrete. In contrast, for specimens exposed to SW60, comparable bulk and surface
resistance measurements were obtained, as well as closer UPV values (about 4%
difference).
For the pH measurements, powdered concrete samples were obtained by drilling at
19 mm (from the outer surface inwards), which represents the location of the GFRP bar as
shown in Figure 3-5. Based on the pH measurements obtained (by pH strips and a pH
meter), both techniques were in agreement. The average pH values of concrete Type-F and
Type-S were 11.85 and 11.35, respectively. Considering the logarithmic scale, concrete
Type-F was approximately 3.2 times more alkaline than concrete Type-S. The measured
carbonation depths of the specimens exposed to FC25 were 5 and 10 mm for concrete
Type-F and Type-S, respectively. For the specimens continuously immersed in seawater at
60°C, SW60, the change in alkalinity over depth was negligible, as expected for high RH
(>70%) conditioning [92].

59
Figure 3-5: Concrete pH measurements and carbonation depths.
3.3.2 Flexural Test and General Behavior
3.3.2.1 Concrete Cracking Load
In general, the crack pattern for all GFRP-RC slab groups was similar regardless of
concrete mix design, exposure time, and environmental conditioning. Typical flexural
crack patterns after 24 months of exposure are shown in Figure 3-6. The cracking pattern
of the concrete slabs initiated on the tension face at midspan and spread upwards to the
point of load application. After the first crack and as the load increased, a few other cracks

60
appeared scattered near the center. As the load progressively increased, the width of the
cracks increased and propagated from adjacent regions towards the upper loading point.
Figure 3-6: Typical flexural crack pattern of tested GFRP-RC slabs after 24 months of
exposure.
For both mix designs, the maximum flexural load was plotted against the average
measured compressive strain (𝜀𝑐𝑢) obtained from two concrete strain gauges and is shown
in Figure 3-7. These values represent the maximum strain values obtained in the outermost
compression fiber of concrete when the maximum load was applied just before failing. As
expected, higher loads lead to higher compression strain. The measured compressive strain
values, considering both mix designs, ranged between 200 to 1000 𝜇𝜀, which are well under
the assumed maximum concrete compressive strain of 3000 𝜇𝜀𝑐𝑢 suggested by ACI 318-
19 [87]. The relationships are practically linear because the materials remain linear at the

61
time of failure. This confirms the occurrence of tensile rupture of the GFRP bar prior to
concrete crushing.
Figure 3-7: GFRP-RC slab failure load versus concrete strain on the compression face.
3.3.2.2 Ultimate Load Capacity
All tested slabs exhibited a tension-controlled failure (Figure 3-8). Failure of the
GFRP-RC slabs was characterized by progressive sounds of fiber breakage, just before
sudden GFRP bar rupture accompanied by a loud sound.

62
Figure 3-8: Typical GFRP bar tensile rupture failure at midspan.
The average failure loads of the GFRP-RC slabs made with seaconcrete Type-F are
shown in Figure 3-9. Independently of the exposure time, the slabs that were exposed to
accelerated aging (SW60) showed an average ultimate capacity lower than those that were
exposed to field conditioning (FC25). After 24 months of exposure, the average percentage
difference in ultimate capacity between the F-FC25 and F-SW60 groups was 13.8%. The
two-way ANOVA revealed that the interaction effect between exposure time and
environmental conditioning was not statistically significant, F = 0.40, p = 0.752. However,
an analysis of the main effect of environmental conditioning indicated that there was a
statistically significant effect, F = 15.27, p < .002. Meaning that for GFRP-RC slabs made
with concrete mix design Type-F, accelerated exposure conditioning (seawater at 60°C
[140°F]) had a statistically significant effect on the flexural performance when compared
to field conditioning.

63
Figure 3-9: Average load capacity of GFRP-RC slabs made with concrete mix Type-F.
Error bars represent standard deviation.
Figure 3-10 shows the average failure loads of GFRP-RC slabs that were made with
seaconcrete mix Type-S. Similar to specimens made with mix Type-F, it is evident that the
environmental conditioning has an effect on the ultimate flexural capacity. The difference
in ultimate capacity between the S-FC25 and S-SW60 specimens after 24 months of
exposure was 17.5%. The two-way analysis revealed no statistically significant differences
between the interaction of exposure time and environmental conditioning, F = 1.0, p =
0.417. Yet, there was a highly statistically significant main effect of environmental
conditioning, F = 28.10, p < 0.0001.

64
Figure 3-10: Average load capacity of GFRP-RC slabs made with concrete mix Type-S.
Error bars represent standard deviation.
3.3.3 Comparison of Predicted and Experimental Capacity
The analytical and ACI predicted nominal moment capacities were calculated
according to Equation (3.6) and Equation (3.8), respectively. These flexural capacities were
computed using measured mechanical properties such as the experimental 𝑓𝑓𝑢, 𝐸𝑓, and 𝐴𝑓.
Additionally, all reduction factors including the environmental (𝐶𝐸) and strength reduction
factor (𝜙) were assigned to be equal to one for comparison purposes.
The design moment capacity (𝑀𝑑𝑒𝑠 = 𝜙𝑀𝑛(𝐴𝐶𝐼)) was calculated using Equation
(3.7) and Equation (3.8) along with the following parameters: the target 𝑓𝑐′ (38 MPa [5,500
psi]), the environmental reduction factor for GFRP bars embedded in concrete exposed to
earth and weather (𝐶𝐸 = 0.7), the strength reduction factor for tension-controlled sections
(𝜙 = 0.55), the minimum guaranteed tensile strength (𝑓𝑓𝑢 = 579 MPa [84 ksi]) and the

65
nominal area (𝐴𝑛 =71 mm2 [.11 in.2]) for a 9.5-mm (.375 in.) diameter GFRP bar. The
calculated 𝑀𝑑𝑒𝑠 resulted in a flexural strength of 2.69 kN∙m (1.99 kip-ft). It should be noted
that since slabs failure were controlled by rupture of the GFRP bar, variations in 𝑓𝑐′ on the
design moment capacity (𝑀𝑑𝑒𝑠) were minimal as shown in Table 3-4.
Table 3-4: The effect of 𝑓𝑐′ on the design moment capacity
𝑓𝑐′ 𝑀𝑑𝑒𝑠
MPa (psi) kN∙m (kip-ft)
37.92 (5,500) 2.69 (1.99)
41.37 (6,000) 2.70 (1.99)
44.82 (6,500) 2.71 (2.0)
48.26 (7,000) 2.72 (2.0)
Table 3-5 presents the flexural test results and the analytical and ACI predicted
nominal moment capacities, as well as the ratio of experimental to computed values of all
GFRP-RC slabs. The mean ratio between the experimental and analytical predicted failure
values (𝑀𝑒𝑥𝑝 𝑀𝑛(𝑎𝑛)⁄ ) for GFRP-RC slabs made with concrete Type-F was 0.97 and 0.87
for FC25 and SW60 conditioning, respectively; while for slabs made with concrete Type-
S, this value was 0.91 and 0.78 for FC25 and SW60, respectively.

66
Table 3-5: Details of experimental and predicted nominal moment capacity
Group slab
notation
Flexural test
results
Analytical
predictions
ACI 440-15
predictions
𝑀𝑒𝑥𝑝
𝑀𝑛(𝑎𝑛)
𝑀𝑒𝑥𝑝
𝑀𝑛(𝐴𝐶𝐼)
𝑀𝑒𝑥𝑝
𝑀𝑑𝑒𝑠
𝑀𝑒𝑥𝑝 𝑀𝑛(𝑎𝑛) 𝑀𝑛(𝐴𝐶𝐼)
kN∙m
(kip-ft)
Cov
%
kN∙m
(kip-ft)
kN∙m
(kip-ft)
F-FC25-1 7.28 (5.37) 3.0 7.37 (5.43) 7.14 (5.27) 0.99 1.02 2.70
F-FC25-6 7.18 (5.29) 0.3 7.37 (5.43) 7.14 (5.26) 0.97 1.01 2.66
F-FC25-12 7.26 (5.36) 4.6 7.37 (5.44) 7.16 (5.28) 0.99 1.01 2.70
F-FC25-24 6.88 (5.07) 6.3 7.37 (5.44) 7.15 (5.28) 0.93 0.96 2.55
Average 0.97 1.0 2.65
F-SW60-1 6.88 (5.08) 12.1 7.36 (5.43) 7.12 (5.25) 0.93 0.97 2.55
F-SW60-6 6.48 (4.78) 1.9 7.36 (5.43) 7.13 (5.26) 0.88 0.91 2.40
F-SW60-12 6.38 (4.70) 6.4 7.37 (5.44) 7.15 (5.28) 0.87 0.89 2.37
F-SW60-24 6.03 (4.45) 1.3 7.36 (5.43) 7.13 (5.26) 0.82 0.84 2.24
Average 0.87 0.90 2.39
S-FC25-1 6.85 (5.05) 2.5 7.37 (5.44) 7.16 (5.28) 0.93 0.96 2.54
S-FC25-6 6.83 (5.04) 2.4 7.36 (5.43) 7.13 (5.26) 0.93 0.96 2.53
S-FC25-12 6.80 (5.01) 1.5 7.36 (5.43) 7.11 (5.24) 0.92 0.96 2.52
S-FC25-24 6.45 (4.76) 5.8 7.36 (5.43) 7.12 (5.25) 0.88 0.91 2.40
Average 0.91 0.94 2.50
S-SW60-1 6.20 (4.57) 11.3 7.37 (5.44) 7.16 (5.28) 0.84 0.87 2.30
S-SW60-6 6.00 (4.43) 13.1 7.36 (5.43) 7.14 (5.26) 0.81 0.84 2.23
S-SW60-12 5.27 (3.89) 5.6 7.36 (5.43) 7.12 (5.25) 0.72 0.74 1.96
S-SW60-24 5.46 (4.03) 6.1 7.36 (5.43) 7.11 (5.25) 0.74 0.77 2.03
Average 0.78 0.80 2.13
Note: 𝑀𝑑𝑒𝑠= 2.69 kN∙m (1.99 kip-ft)
For GFRP-RC slabs made with concrete Type-F, the proportion of the experimental
to predicted ACI nominal capacity (𝑀𝑒𝑥𝑝 𝑀𝑛(𝐴𝐶𝐼)⁄ ) were 1.0 and 0.90 for FC25 and SW60,
respectively, whereas, for slabs made with concrete Type-S, the ratios were 0.94 to 0.80
for FC25 and SW60, respectively. Based on these results, the GFRP-RC slabs made with

67
concrete Type-F were in better agreement with the predicted moment capacity than the
slabs made with concrete Type-S. In general, the ACI predicted moment capacity was on
average 3% less than the analytically calculated values, as expected due to the simplified
lower bound approach.
In the same way, the experimental moment capacity (𝑀𝑒𝑥𝑝) was compared to the
ACI 4401.R-15 [8] design capacity (𝑀𝑑𝑒𝑠) as shown in Table 3-5. The ratio between the
experimental and the designed values, including both mix designs, ranged between 2.13
and 2.65. It is noted that the knock-down factors (i.e., 𝐶𝐸, 𝜙, and 𝑓𝑓𝑢*) accounting for
different uncertainties make the design conservative even when the seaconcrete samples
are subject to accelerated conditioning. Similar ratios of experimental to design capacity
have been reported for tension-controlled GFRP-RC slabs [93].
The crack load values obtained from the flexural tests (𝑃𝑐𝑟 𝑒𝑥𝑝), as well as those
calculated (𝑃𝑐𝑟 𝑝𝑟𝑒) and the comparison between the two (𝑃𝑐𝑟 𝑒𝑥𝑝 𝑃𝑐𝑟 𝑝𝑟𝑒⁄ ) are shown in
Table 3-6. On average, slabs made with concrete Type-F cracked at 8 and 3% below the
predicted ACI 440 Committee cracking loads for FC25 and SW60 conditioning,
respectively. In the case of slabs made with concrete Type-S, the first crack occurred at 37
and 22% below the predicted capacities for FC25 and SW60 exposures, respectively.
Although the cracking loads were overestimated, it was evident that 𝑃𝑐𝑟 𝑝𝑟𝑒 values were
much closer to the experimental values for slabs made with concrete Type-F than to those
made with concrete Type-S.

68
Table 3-6: First cracking load for all tested slabs
Group slab
notation
Flexural test results ACI 440-15 predictions 𝑃𝑐𝑟 𝑒𝑥𝑝
𝑃𝑐𝑟 𝑝𝑟𝑒
𝑃𝑐𝑟 𝑒𝑥𝑝 𝑃𝑐𝑟𝑒 𝑝𝑟𝑒
kN (kip) Cov % kN (kip)
F-FC25-1 10.01 (2.25) 3.60 13.02 (2.93) 0.77
F-FC25-6 15.75 (3.54) 7.20 12.91 (2.90) 1.22
F-FC25-12 11.53 (2.59) 10.80 13.75 (3.09) 0.84
F-FC25-24 11.47 (2.58) 11.40 13.41 (3.01) 0.85
Average 0.92
F-SW60-1 9.88 (2.22) 11.60 12.50 (2.81) 0.79
F-SW60-6 11.54 (2.59) 11.20 12.62 (2.84) 0.91
F-SW60-12 13.19 (2.97) 9.60 13.35 (3.00) 0.99
F-SW60-24 15.31 (3.44) 14.00 12.84 (2.89) 1.19
Average 0.97
S-FC25-1 8.94 (2.01) 0.70 13.65 (3.07) 0.66
S-FC25-6 9.30 (2.09) 13.50 12.64 (2.84) 0.74
S-FC25-12 6.32 (1.42) 0.20 12.11 (2.72) 0.52
S-FC25-24 7.68 (1.73) 13.40 12.25 (2.75) 0.63
Average 0.63
S-SW60-1 11.88 (2.67) 15.90 13.49 (3.03) 0.88
S-SW60-6 10.22 (2.30) 2.45 12.84 (2.89) 0.80
S-SW60-12 9.12 (2.05) 10.80 12.40 (2.79) 0.74
S-SW60-24 8.37 (1.88) 6.50 12.16 (2.73) 0.69
Average 0.78
3.3.4 Load-deflection Behavior
Figure 3-11 shows the experimental load-deflection response at midspan obtained
from the 3-point bending flexural tests for seaconcrete GFRP-RC slabs made with concrete
Type-F and Type-S. Since the slabs within each group exhibited similar behavior, a
representative load-deflection curve per time of exposure is shown; also for the legibility
of the graphs, the unload-reload steps were omitted.

69
Figure 3-11: Experimental load-deflection curve of representative GFRP-RC slabs. Note: 𝑃𝑛 𝑎:
nominal strength with 𝜙 and 𝐶𝑒= 1; 𝑃𝑛 𝑏: nominal strength with 𝜙 = 1 and 𝐶𝑒= 0.7; 𝑃𝑛
𝑐: nominal
strength with 𝐶𝑒= 1 and 𝜙 = 0.55.
Prior to ultimate failure, the load-deflection response can be divided into two parts:
pre- and post-cracking performance. Throughout the first part, the slabs exhibited a linear
load-deflection behavior up to the first crack load where the applied load exceeded the
cracking moment capacity. The second part was characterized by a prominent reduction in
bending stiffness and, as the load continuously increased, further cracks developed leading
to sudden reductions in the applied load and a less steep load-deflection behavior. Finally,
the slabs failed abruptly without warning by yielding as anticipated. Overall, this load-

70
deflection response is expected since FRP-RC elements have a relatively small post-
cracking stiffness due to a relatively low modulus of elasticity compared to steel-reinforced
concrete elements with the same reinforced ratio [8].
For comparison purposes, the ACI predicted post-crack load-deflection curve
(based on the design parameters) was also plotted in Figure 3-11. Since for most slabs the
experimental crack onset load differs greatly from the predicted values, the starting point
of the predicted post-crack response was made to coincide with the average experimental
load where the load-deflection curve started to re-ascend after the first abrupt load drop
(due to the first crack). The predicted load-deflection calculation is described in the
following section.
Additionally, the nominal (including/excluding 𝐶𝐸 and 𝜙), design, and service load
thresholds were also displayed in Figure 3-11, as horizontal dashed lines. The service
moment capacity was calculated by considering the ultimate load to 1.2 times the dead load
(𝐷𝐿) plus 1.6 times the live load (𝐿𝐿) and assuming 𝐿𝐿 = 2𝐷𝐿. This resulted in a service
level moment of approximately 70% of 𝑀𝑑𝑒𝑠 and 38.5% of 𝑀𝑛(𝐴𝐶𝐼). Then, the service load
(𝑃𝑠𝑒𝑟𝑣) and the ultimate design flexural capacity (𝑃𝑑𝑒𝑠), due to a point load at midspan,
were back-calculated and found to be 4.18 kN (0.94 kip) and 6.30 kN (1.42 kip),
respectively.
3.3.5 Comparison of Experimental and Predicted Deflection
Table 3-7 shows the experimental (∆𝑒𝑥𝑝) and the ACI predicted post-crack
deflection (∆𝑝𝑟𝑒) along with the comparison between them at the different service-load

71
thresholds. Since all of the slabs cracked above the calculated 𝑃𝑠𝑒𝑟𝑣 and the deflection of
uncracked sections was not of interest, the serviceability-limit values were set at 53% (𝑃𝑛𝑐)
and 67% (𝑃𝑛𝑏) of the nominal strength with 𝜙 and 𝐶𝑒= 1 (𝑃𝑛
𝑎). These service-load values as
well as the ACI predicted load-deflection curve are shown in Figure 3-11. On average, the
experimental to predicted deflections (∆𝑒𝑥𝑝 ∆𝑝𝑟𝑒⁄ ) for FC25 elements at 𝑃𝑛𝑐 were between
0.94 and 1.12, while at 𝑃𝑛𝑏 were between 0.87 and 0.96. For SW60 samples the average
∆𝑒𝑥𝑝 ∆𝑝𝑟𝑒⁄ ratio at 𝑃𝑛𝑐 ranged between 1.30 and 1.43, whereas at 𝑃𝑛
𝑏 ranged between 0.98
to 1.29.
Table 3-7: Comparison of measured and predicted deflections
Group slab
notation
Deflection at 𝑃𝑛𝑐 Deflection at 𝑃𝑛
𝑏
∆exp ∆pre Δ𝑒𝑥𝑝
Δ 𝑝𝑟𝑒
∆exp ∆pre Δ𝑒𝑥𝑝
Δ 𝑝𝑟𝑒
mm (in.) mm (in.) mm (in.) mm (in.)
F-FC25-1 2.00 (0.08)
2.54 (0.10)
0.79 6.79 (0.27)
6.35 (0.25)
1.07
F-FC25-6 3.81 (0.15) 1.50 5.46 (0.22) 0.86
F-FC25-12 2.48 (0.10) 0.98 4.57 (0.18) 0.72
F-FC25-24 3.13 (0.12) 1.23 5.21 (0.21) 0.82
Average 1.12 0.87
F-SW60-1 2.29 (0.09)
2.08 (0.08)
1.10 6.18 (0.24)
5.72 (0.23)
1.08
F-SW60-6 2.97 (0.12) 1.43 5.43 (0.21) 0.95
F-SW60-12 2.73 (0.11) 1.31 4.95 (0.20) 0.87
F-SW60-24 2.85 (0.11) 1.37 5.93 (0.23) 1.04
Average 1.30 0.98
S-FC25-1 5.99 (0.24)
5.66 (0.22)
1.06 9.80 (0.39)
10.41 (0.41)
0.94
S-FC25-6 3.86 0.15) 0.68 8.23 (0.32) 0.79
S-FC25-12 7.39 (0.29) 1.30 10.77 (0.42) 1.03
S-FC25-24 4.08 (0.16) 0.72 11.31 (0.45) 1.09
Average 0.94 0.96
S-SW60-1 3.71 (0.15)
3.56 (0.14)
1.04 8.02 (0.32)
7.75 (0.31)
1.03
S-SW60-6 3.43 (0.14) 0.96 7.59 (0.30) 0.98
S-SW60-12 5.25 (0.21) 1.48 11.15 (0.44) 1.44
S-SW60-24 7.99 (0.31) 2.25 13.22 (0.52) 1.71
Average 1.43 1.29
Note: 𝑃𝑛𝑐 = 9.52 kN (2.14 kip); 𝑃𝑛
𝑏 = 12.10 kN (2.71 kip).

72
Overall, the measured midspan deflections at 𝑃𝑛𝑐 and 𝑃𝑛
𝑏 are in acceptable
agreement with results obtained by the ACI 440.1-R-15 [8] guide, considering that the
experimental-to-predicted ratio values are significantly sensitive to slight variations
because of the relatively small measurements. Nonetheless, the largest deviations were
noticed for accelerated-aged specimens.
3.4 Concluding Remarks
Based on the results obtained, the main findings can be summarized as follows:
• Seaconcrete cylinders conditioned in accelerated aging and field exposure
exhibited comparable compressive strength after 24 months of exposure with a
maximum difference of 1.8 and 6.4% for mix Type-F and 3.8 and 2.4% for mix
Type-S with respect to moist-room conditioning.
• After 24 months of exposure, the ultimate load capacity of the GFRP-RC slabs
exposed to SW60 was 13.8 and 17.5% lower than those conditioned in FC25 for
concrete Type-F and Type-S, respectively. However, the accelerated aging
parameters used are not yet correlated to real-life applications, thus results must be
calibrated with existing aged GFRP structures.
• The analytical approach without any strength reduction factor (i.e., using pristine
bar properties) reasonably predicted the experimental failure moment capacity in
most tested GFRP-RC slabs. Specifically, for those exposed to FC25 with an
average 𝑀𝑒𝑥𝑝 𝑀𝑛(𝑎𝑛)⁄ of 0.97 (Type-F) and 0.91 (Type-S), while for those

73
subjected to SW60 it was 0.87 (Type-F) and 0.78 (Type-S), as expected since
ultimate capacity decreased.
• On average, the simplified conservative equations provided in ACI 440.1R-15 [8]
predicted a 3% lower failure moment capacity than analytically computed. The
average 𝑀𝑒𝑥𝑝 𝑀𝑛(𝑎𝑛)⁄ for FC25 resulted in 1.0 (Type-F) and 0.94 (Type-S), while
for those exposed to SW60 it was 0.90 (Type-F) and 0.80 (Type-S).
• The recorded ultimate moment capacity for all GFRP-RC slabs was on average 2.13
to 2.65 times higher than the ACI 440.1R-15 [8] predicted design load capacity.
This is obviously attributed to the application of various knock-down factors (i.e.,
𝐶𝐸, 𝜙, 𝑓𝑓𝑢*) that make the design conservative even for elements subjected to
accelerated conditioning.
• In general, all simply supported one-way GFRP-RC slabs tested under the 3-point
bending behaved similarly and exhibited a bi-linear trend, with a pre- and post-
cracking response, regardless of the environmental conditioning or time of
exposure.
• Overall, the ACI 440.1R-15 [8] equations reasonably predicted experimentally
measured deflections based on an approximate similar onset cracking response.
However, some deviations were observed, mainly for specimens exposed to SW60.
3.5 Future Research
The findings of this study can be used to evaluate the long-term flexural performance
of seaconcrete GFRP-RC slabs and the contribution of reduction factors to the design
capacity. The author acknowledges that the results presented in this study provided insight

74
into the mechanical performance of solely the specified types of concrete and GFRP
reinforcing bar. Thus, further evaluations must be conducted using different seaconcrete
mix designs (including mixes made under controlled laboratory conditions) and FRP
reinforcements (types, ratios, configurations, and fatigue behavior), as well as correlate
them with existing FRP-RC structures.

Chapter 4
Durability of GFRP Reinforcing Bars in Seawater-Mixed Concrete
Numerous efforts have been made to assesses and predict the long-term durability
performance of FRP reinforcing bars based, primarily, on simulated laboratory testing [9].
Table 4-1 shows a summary of the physical, residual properties, and conditioning protocol
of GFRP bars used in other relevant research studies. For comparison purposes, these
studies were selected because they share some similarities with the study presented here,
either in terms of the type of constituents (e.g., type of fiber and/or resin), bar diameter,
surrounding medium, temperature, or time of exposure. The bars in these other research
projects are commercially available GFRP bars typically compliant with standards such as
ASTM D7957 [75].
75

Tabl
e 4-
1: S
umm
ary
of p
hysi
cal p
rope
rties
, stre
ngth
rete
ntio
n, a
nd c
ondi
tioni
ng re
gim
es o
f G
FRP
bars
repo
rted
in p
revi
ous s
tudi
es
Ref
eren
ce
Gla
ss
type
/resin
m
atrix
Dia
met
er
Moi
sture
ab
sorp
tion
Fi
ber c
onte
nt
St
reng
th re
tent
ion
C
ondi
tioni
ng
(m
m)
(%)
(%
)
(%)
(s
urro
undi
ng
med
ium
/solu
tion-
C°-
dura
tion* )
pH
solu
tion
24
h
sat.
TNS
TEM
ε
TSS
HSS
[38]
E/
VE
9.53
-
-
>70
-
38
- -
- - -
A
LK-6
0-4
13.6
59
-
- -
ALK
-60-
4 12
.7
[39]
, [41
] E/
Epox
y 6.
3 -
-
- 66
.7
80
.1
- -
- 42
.1
A
LK-5
5-2
13.4
89
.6
132
- -
80.4
A
LK-5
5-2
12.7
[4
0]
E/V
E 12
.0
- -
83
-
75
.9
99.1
76
.6
- -
A
LK-5
0-18
12
.5-1
3 75
.5
97.4
77
.5
- -
TW-5
0-18
-
87.2
97
.4
91.1
-
- SW
-50-
18
- [4
2]
E/Ep
oxy
9.2
- -
82
.5
71.2
82.6
3 10
3 82
.31
- -
A
SW-6
0-3
8.1
67.8
96
73
.08
- -
ALK
-60-
3 13
.4
[43]
E/
VE
9.5
- -
-
75
96
95
.2
106
- -
TW
-72-
2 †
7 88
92
.7
101
- -
ALK
-64-
2 †
12.8
[4
4]
E/V
E 9.
53
- -
-
-
52
- -
- -
A
LK-6
0-2
13.6
-
- -
- 79
-94
ALK
-60-
1.5
12.
7-13
.6
61
- -
- -
CO
N/A
LK-6
0-3
12.7
-
- -
- 88
-95
CO
N/A
LK-6
0-2
12.7
-13
.6
[45]
EC
R/V
E 8.
0 -
-
88
-
90
99
- -
-
CO
N/T
W-2
0-9
- 59
99
-
- -
CO
N/T
W-6
0-9
- [4
6]
E/V
E 12
-
-
83
-
76
91
84
- -
C
ON
/TW
-50-
18
- 84
94
90
-
- C
ON
/SW
-50-
18
- 78
91
85
-
- C
ON
/ALK
-50-
18
12.5
-13
[47]
E/V
E 12
.7
- 0.
38
81
.5
60.3
84.4
~9
7.7
- -
-
CO
N/T
W-5
0-8
12.1
5‡ [4
8]
E/V
E 12
.7
- 0.
38
81
.5
60.3
89.1
~1
11.8
-
- -
C
ON
/ASW
-50-
12
- [4
9]
E/V
E 9.
5 -
-
- 70
61.6
-
- -
-
CO
N/T
W-6
0-4
- 60
.7
- -
- -
CO
N/A
SW-6
0-4
- [5
1]
ECR/
VE
9.53
0.
15
0.19
80.9
-
-
- -
- 87
CO
N/S
W-6
0-4
12.8
‡ -
- -
- 73
C
ON
/ALK
-60-
4 12
.7
[52]
-/V
E 10
-
-
72
-
88.6
98
.6
- -
-
CO
N/T
W-2
3-18
† -
79.7
96
.7
- -
- C
ON
/ALK
-60-
18 †
13.5
[5
3]
ECR/
VE
15.8
0.
23
0.95
76.2
-
79
88
-
75
74
SW
CO
N/S
W-6
0-24
-
[54]
-/E
poxy
8
- -
78
.3
-
85
- -
- -
SW
CO
N/T
W-6
0-15
-
-/Epo
xy
9 -
-
75.5
-
50
-
- -
-
SWC
ON
/TW
-60-
15
- N
ote:
sat.=
at sa
tura
tion;
* =mon
ths;
E= E
-gla
ss; V
E= v
inyl
este
r; TN
S= te
nsile
stre
ngth
; TEM
= te
nsile
ela
stic
mod
ulus
; ε=t
ensil
e str
ain;
TSS
= tra
nsve
rse
shea
r stre
ngth
; H
SS=h
oriz
onta
l she
ar st
reng
th; A
LK=a
lkal
ine;
TW
=tap
wat
er; S
W=s
eaw
ater
; ASW
=arti
ficia
l sea
wat
er; C
ON
=con
cret
e; S
WC
ON
=sea
wat
er-m
ixed
con
cret
e; † =s
usta
ined
load
19-
29%
; ‡ =pH
of c
oncr
ete.
76

77
Most of the studies have been carried out using accelerated aging techniques in
which bare FRP bars are immersed in detrimental solutions at elevated temperatures to
evaluate their physical and mechanical integrity over time [34], [38–42]. This approach has
been suggested to be more severe than in-service real-life weathering [34], [42–44]. For
instance, in a durability study conducted by Chen et al. [44] bare and concrete-embedded
GFRP bars (E-glass/vinyl ester) exposed to accelerated aging environments were
evaluated. In the study, after 2 months of exposure to simulated pore solution at 60°C
(140°F), the tensile strength retention of the bare GFRP bars was 52%, while for the GFRP
bars that were embedded in concrete the strength retention was 61% after 3 months of
exposure. They concluded that the simulated environments were more adverse for bare
GFRP bars than for bars embedded in concrete and the test results should be considered as
conservative.
Instead of exposing bare bars to aggressive solutions, researchers have also
evaluated the behavior of FRP bars embedded in concrete, providing a more realistic
behavior of the actual degradation they might experience as internal reinforcement. Fergani
et al. [45] investigated the durability and degradation of GFRP bars (ECR-glass/vinyl ester)
exposed to different conditioning parameters for up to 9 months. Specifically, 8-mm
nominal diameter unstressed GFRP bars embedded in concrete and conditioned in tap
water at 60°C (140°F) showed tensile strength retention in the range between 80 to 59%.
Almusallam et al. [46] investigated the effect of different environmental conditionings
exclusively on tensile properties of 12-mm diameter GFRP bars (E-glass/vinyl ester) that
were embedded in concrete for 6, 12, and 18 months. The residual tensile strength results
revealed that specimens conditioned in tap water at 50°C (122°F) showed more degradation

78
than those exposed to seawater at the same temperature. These retentions ranged from 83
to 76% for tap water conditioning, while those exposed to seawater ranged between 86 and
84%.
In another study, Robert et al. [47] conducted accelerated tests to evaluate the
durability performance of mortar-wrapped GFRP bars (E-glass/vinyl ester). After 8 months
of exposure to tap water at 50°C (122°F), they reported tensile strength retention of the 12-
mm diameter GFPR bars embedded in moist concrete of 84%. Furthermore, in a different
durability study, Robert et al. [48] evaluated the effect of saline solution (3% NaCl) at
different temperatures on the same type of mortar-wrapped GFRP bars. The tensile strength
retention after 12 months of exposure to the saline solution at 50°C (122°F) was 89% of
the initial strength. Finally, in a recent short-term durability study, Jia et al. [49]
investigated tensile strength retention of 9.5-mm diameter GFRP bars (E-glass/vinyl ester)
embedded in concrete that were exposed to different solutions and ambient humidity. The
results showed that after 4 months of conditioning at 60°C (140°F), the specimens
subjected to tap water and saline solution experienced strength retention of 61.6% and
60.7%, respectively.
Only a few studies have been undertaken to evaluate the long-term durability
performance of FRP bars embedded in concrete made with seawater (seaconcrete) instead
of fresh water [16]. Hence, El-Hassan et al. [54] examined the strength retention of two
types of GFRP bars (8 mm and 9 mm in diameter), made of continuous glass fiber
impregnated in epoxy resin, that were embedded in seawater-contaminated concrete. Based
on the test results, extracted GFRP bars retain between 85 and 50% of their tensile strength
after 15 months of exposure to tap water at 50°C (122°F). More recently, Khatibmasjedi et

79
al. [53] conducted a study to examine the effect of seawater-mixed concrete on the long-
term properties of GFRP bars. The study consisted of casting seaconcrete elements
reinforced with 15.8-mm diameter GFRP bars made of ECR-glass/vinyl ester resin and
exposing them to accelerated aging conditioning. They reported that after 24 months of
exposure to seawater at 60°C (140°F), the extracted GFRP bars retained 79%, 88%, 75%,
and 74% of their initial tensile strength, tensile modulus, transverse shear strength, and
horizontal shear strength, respectively.
4.1 Methodology
In this study, residual physico-mechanical properties of unstressed GFRP bars
embedded in two different seaconcrete mix designs up to 24 months of exposure were
evaluated. The residual strength capacities were evaluated using bar segments retrieved
from the seawater-mixed GFRP-RC slabs (Chapter 3). Table 4-2 summarizes the
unconditioned physical and mechanical properties of GFRP Type-A used as a benchmark.
As discussed in Chapter 3, different environmental conditionings were chosen to reproduce
field conditions and highly aggressive environmental exposure (laboratory accelerated
aging). Accordingly, this evaluation provides insight on the long-term durability
performance of GFRP bars embedded in seaconcrete, which in turn may allow for a more
realistic approach to assess degradation mechanisms and implement design guidelines.

80
Table 4-2: Summary of GFRP bar properties
Property Unit Test Method Value Cov
%
Physical
properties
Effective diameter mm
(in.)
ASTM D7205 9.56
(0.376)
0.2
Cross-sectional area mm2
(in.2)
ASTM D792 71.81
(0.111)
0.5
Density kg/m3
(lb/ft3)
ASTM D792 2179.6
(136.07)
0.2
Fiber content % by
weight
ASTM D2584 85.06 0.2
% by
volume
SEM 71.09 6.3
Glass transition
temperature (DMA)
°C
(°F)
ASTM E1640 112.8
(235.0)
1.5
Moisture absorption at
24 h
% ASTM D570 0.055 14.2
Moisture absorption at
saturation
% ASTM D570 0.127 14.8
Mechanical
properties
Tensile strength MPa
(ksi)
ASTM D7205 822.23
(119.25)
4.7
Tensile modulus GPa
(ksi)
ASTM D7205 55.04
(7983)
2.0
Ultimate tensile strain % ASTM D7205 1.49 5.2
Transverse shear
strength
MPa
(ksi)
ASTM D7617 192.81
(27.96)
3.3
Horizontal shear
strength
MPa
(ksi)
ASTM D4475 44.85
(6.5)
5.4
4.1.1 Testing Plan
To evaluate the long-term performance of GFRP bars embedded in seaconcrete,
physical and mechanical properties of unconditioned pristine GFRP bars were used as the
control threshold reference. The seawater-mixed GFRP-RC slabs (from where the GFRP
bars were extracted) were conditioned for 1, 6, 12, and 24 months under the two
environmental conditions (FC25 and SW60). The simply supported slabs had a span
between supports of 1.525 m and were tested under three-point bending load tests until

81
failure (Chapter 3). Considering that the GFRP-RC slabs had failed because of
reinforcement rupture at midspan, the GFRP bar segments [610 mm (24 in.)] used to
evaluate residual properties were carefully extracted from regions closer to the ends of the
slabs, as shown in Figure 4-1. After extraction, no visual damages were observed on the
surface of the GFRP bars [Figure 4-1 (a) and (b)]. The mechanical properties evaluated in
this study were tensile strength, longitudinal elastic modulus, transverse shear strength, and
apparent horizontal shear strength, while the physical properties were Tg and
microstructural integrity through SEM images and EDS analysis. The residual mechanical
properties plotted against exposure time are provided in Appendix A.
Figure 4-1: Detail of surface condition and location of assessed GFRP bars: (a) pristine GFRP
bar, (b) extracted GFRP bar, (c) extraction activity (bottom view), (d) side view of GFRP-RC slab
and evaluated portion [610 mm (24 in.)].

82
4.1.1.1 Tensile Tests
The longitudinal tensile strength and elongation properties were determined
according to ASTM D7205 [63] with necessary modifications. Since GFRP-RC slabs were
1828 mm (72 in.) long and failed at midspan, due to GFRP bar rupture, the tensile test
specimens were 914 mm (36 in.) long instead of the standard 980 mm (38.5 in.) as the
minimum length for a 9.5-mm (0.375 in.) diameter FRP bar. Since the installation of 300
mm (12 in.) long steel pipes filled with expansive mortar at both ends (as an anchorage
system) is required, the segments near the location where the GFRP bar ruptured were not
evaluated. Additionally, the test specimens were instrumented with a 100-mm (4 in.) long
extensometer in the middle of the free length between the anchors to capture and record
the tensile strain. Subsequently, the tensile test loading procedure of the extracted GFRP
bars was conducted in accordance with ASTM D7205 [63]. For each period (1, 6,12, and
24 months) three specimens per mix design and environmental conditions were tested. The
tensile tests were performed using an 890-kN (200-kip) Baldwin testing machine (PC-
based controller) and the load was increased at a rate of 2 mm/min (0.078 in./min) until
failure.
4.1.1.2 Transverse Shear Tests
The transverse shear strength tests were conducted in accordance with ASTM
D7617 [94]. The principle of this test is to determine the maximum shear strength via a
double shear fixture by applying a monotonic load through an upper blade until failure.
Given that the GFRP bar is cut perpendicular to its longitudinal direction, the property
measured in this test is directly related to the integrity of the fibers. A minimum of four (4)

83
225-mm (9 in.) long samples per mix and environmental condition were tested for each
period. The tests were performed using a 133-kN (30-kip) capacity Instron universal test
frame and the load was increased in a displacement-control mode at a rate of 1.3 mm/min
(0.05 in./min) until failure.
4.1.1.3 Horizontal Shear Tests
The apparent horizontal shear strength test, even though its results cannot be used
for design purposes, can be utilized for comparative purposes of interlaminar-shear
strength between the reference value (as-received) and different environmental exposure
conditions. As opposed to the transverse shear strength test, this test is more related to the
resin properties and controlled mostly by the fiber/resin interface integrity. The tests were
performed according to ASTM D4475 [95]. A span of five times the bar diameter (47.8
mm [1.875 in.]) was used to achieve a shear mode of failure. According to the standard,
GFRP bars samples shall be one diameter greater than the test span, as a result, test samples
were 58 mm (2.25 in.) long. Similar to the transverse shear test, for each exposure duration,
a minimum of four (4) samples per mix and conditioning were tested. In the same way,
tests were carried out in a 133-kN (30-kip) capacity Instron test frame using a
displacement-control mode at a rate of 1.3 mm/min (0.05 in./min).
4.1.1.4 Glass Transition Temperature
The Tg of GFRP bars were assessed by a dynamic mechanical analysis (DMA) in
accordance with ASTM E1640 [96]. This test measures the viscoelastic properties, using

84
dynamic oscillatory assessments, as a function of temperature and frequency. For the 12-
and 24-month periods, three Tg specimens were tested for each mix design and
environmental exposure. The specimens of 1 mm × 5 mm × 50 mm (0.04 in. × 0.20 in. ×
2.0 in.) were cut from the core of each GFRP bar using a water-cooled precision saw
(IsoMet 1000) with a diamond blade (IsoMet 15LC). The DMA tests were conducted using
a TA Instruments Dynamic Mechanical Analyzer Q800 with a three-point bending test
setup. The testing parameters consisted of a temperature ranging from 30 to 200°C (86 to
392°F) at a heating rate of 1°C/min (34°F/min) and a frequency of 1 Hz.
4.1.1.5 Microstructural Analysis
SEM observations and EDS analysis were used to evaluate the microstructure
integrity of GFRP bars after environmental exposure when compared to unconditioned
specimens. Samples 12.7-mm (0.5 in.) long were cut from the extracted GFRP bar
segments after being exposed for 24 months. Sample preparation for SEM/EDS analysis
also requires a polished surface for ideal imaging. Prior to imaging, GFRP bar samples
were ground and polished, using a semiautomatic grinding/polishing machine (LaboForce
100) along with several levels of abrasiveness (500 grit size to 0.04 μm polishing cloth)
and various water-based diamond suspension as discussed in Chapter 2.
SEM images were captured using a Zeiss EVO 60 SEM at the accelerating voltage
of 20 kV. Similar to the SEM specimen preparation protocol described in Chapter 2, the
variable pressure (VP) mode along with the backscattered electron (BSE) signal were used.
Images were taken mainly close to the edge of the bar since fibers are more likely to be
most affected by the surrounding medium. Lastly, specimens used in SEM observations

85
were also utilized in the EDS analysis, where the main objective was to detect any change
in the fiber’s chemical composition. However, the EDS analysis also helped to identify the
main elemental compositions, thus corroborating the type of glass fibers used to
manufacture the GFRP bars.
4.2 Results and Discussion
The average measured residual mechanical properties (i.e., tensile strength, tensile
modulus of elasticity [Young’s modulus], transverse shear strength, and apparent
horizontal shear strength) of all extracted GFRP bars after environmental conditioning are
summarized in Table 4-3. Overall, for each group of specimens, test results show a small
discrepancy relative to the number of tested samples. The computed percent coefficient of
variation for all experimental residual properties ranged between 1 and 6.7%. In addition,
statistically significant differences between exposure time and environmental conditioning
for residual strength were determined by two-way ANOVA, in which a p-value less than
0.05 was also considered statistically significant. A summary of the two-way ANOVA
results is presented in Appendix B. Typical failure modes observed in the tested concrete-
embedded GFRP bars are shown in Figure 4-2.
As shown in Figure 4-3, a good correlation (r2 = 0.87 and 0.95) was found between
the ultimate capacity of the GFRP-RC slabs (Chapter 3) and the residual strength capacity
of the extracted GFRP bars corresponding to each group of slabs.

86
Table 4-3: Experimental residual mechanical properties of extracted GFRP bars
Exposure
period
Specimen
designation
Tensile
strength
Tensile
modulus
Transverse
shear
Horizontal
shear
MPa
(ksi)
Cov
%
GPa
(msi)
Cov
%
MPa
(ksi)
Cov
%
MPa
(ksi)
Cov
%
1 month F-FC25 821.1
(119.1)
6.6 58.3
(8.4)
1.2 180.1
(26.1)
5.8 44.0
(6.4)
3.3
F-SW60 764.4
(110.9)
1.2 56.4
(8.2)
1.9 188.7
(27.4)
4.5 43.9
(6.4)
6.7
S-FC25 702.6
(101.9)
3.9 54.8
(7.9)
1.3 187.0
(27.1)
2.1 47.7
(6.9)
5.6
S-SW60 653.1
(94.7)
5.7 54.4
(7.9)
5.5 184.5
(26.8)
4.8 45.2
(6.6)
5.4
6 months F-FC25 795.0
(115.3)
1.3 54.0
(7.8)
2.5 182.9
(26.5)
2.0 45.2
(6.6)
1.0
F-SW60 679.1
(98.5)
3.0 54.1
(7.8)
5.9 187.5
(27.2)
3.7 43.2
(6.3)
5.6
S-FC25 730.7
(106.0)
3.4 54.4
(7.9)
4.0 191.8
(27.8)
4.5 46.3
(6.7)
5.8
S-SW60 619.8
(89.9)
2.1 54.5
(7.9)
3.4 183.0
(26.5)
3.1 46.7
(6.7)
3.3
12 months F-FC25 826.6
(119.9)
3.4 53.2
(7.7)
2.8 189.7
(27.5)
6.1 43.6
(6.3)
5.1
F-SW60 615.7
(89.3)
6.6 52.8
(7.7)
3.1 186.3
(27.0)
5.6 43.4
(6.3)
2.6
S-FC25 729.1
(105.7)
2.5 56.1
(8.1)
1.7 187.2
(27.1)
4.8 45.5
(6.6)
2.1
S-SW60 539.5
(78.3)
4.0 51.3
(7.4)
6.1 186.9
(27.1)
1.1 44.5
(6.5)
1.2
24 months F-FC25 810.7
(117.6)
4.4 55.0
(8.0)
3.8 189.7
(27.5)
5.5 44.3
(6.4)
2.9
F-SW60 606.9
(88.0)
2.3 52.3
(7.6)
1.2 176.6
(25.6)
4.6 42.5
(6.2)
4.2
S-FC25 670.2
(97.2)
6.6 54.0
(7.8)
6.1 189.7
(27.5)
6.4 45.2
(6.6)
5.5
S-SW60 568.0
(82.4)
5.1 55.8
(8.1)
5.9 177.8
(25.8)
5.2 43.9
(6.4)
2.2

87
Figure 4-2: Typical failure mode of extracted GFRP bars specimens after (a) tensile, (b)
transverse shear, and (c) horizontal shear tests.
Figure 4-3: Correlation between the ultimate capacity of GFRP-RC slabs and tensile
strength retention of extracted GFRP bars.

88
4.2.1 Tensile Strength Retention
The tensile test of GFRP bars embedded in seaconcrete showed a linear elastic
behavior up to failure regardless of the environmental conditions or exposure period.
Failures were usually accompanied by delamination and rupture of individual fibers just
before sudden catastrophic failure. Figure 4-4 shows the tensile strength retention as a
function of environmental exposure and duration of immersion of embedded GFRP bars
when compared to unconditioned reference (REF) values. For both mix designs, there was
a statistically significant interaction between the effects of environmental conditioning and
exposure time on the residual tensile strength retention, F = 10.628, p < 0.001 for mix
Type-F and F = 8.622, p < 0.001 for mix Type-S.
The residual tensile strengths for F-FC25 specimens were 99.9, 96.7, 100.5, and
98.6% after 1, 6, 12, and, 24 months of exposure, respectively. These results indicate that
after 24 months of exposure no evident losses of tensile strength were identified. It is worth
noting that standard deviation error bars largely overlap, which can be interpreted that the
difference is probably not statistically significant.
For the specimens in seawater at 60°C (140°F), F-SW60, the residual tensile
strength gradually decreased over time with most of the reduction occurring during the first
12 months and almost no further strength reduction in the last period. After 1, 6, 12, and
24 months of exposure, the recorded strength retentions were 93.0, 82.6, 74.9, and 73.8%,
respectively. These values are considerably lower than the specimens exposed to typical
field conditions (F-FC25). This suggests, to some extent, that immersing the concrete
specimens in seawater and increasing the temperature to 60°C (140°F) has a considerable
effect on the tensile strength.

89
As shown in Figure 4-4, for the S-FC25 specimens, just after 1 month an evident
decrease in the residual tensile strength of 85.4% was recorded. For the 6, 12, and 24
months of exposure, the strength retentions were 88.9, 88.7, and 81.5%, respectively.
Although the 1-month period value seems to be lower than that of the subsequent period
(about 3.5%), when considering its variability (error bars), the trend appears to be
reasonable. However, these values are notably lower than the F-FC25 specimens (made
with mix Type-F), which were exposed to the same environmental conditioning during the
same time. This difference in strength retention suggests that the characteristics of the
surrounding concrete will have a particular effect on the degradation mechanisms of GFRP
bars. Preliminary quality tests on hardened concrete (Table 3-3) indicate that concrete
Type-F exhibited better durability performance than concrete Type-S; however,
comparable pH measurements were obtained at 19 mm depth.
For the S-SW60 specimens, which were the other group of concrete-embedded
GFRP bars that were exposed to seawater at 60°C (140°F), a significant reduction in the
tensile strength of 79.4% (reduction by 20.6%) was recorded after the first month of
exposure. Subsequently, the strength retention decreased to 75.4, 65.6, and 69.1% after 6,
12, and 24 months of exposure, respectively. The modest increase noted in the strength
(about 3.5%) after the 12-month period should be taken with caution due to the closeness
of mean values and variability.

90
Figure 4-4: Tensile strength retention of extracted GFRP bars aged in seaconcrete. Error
bars represent standard deviation.
The tensile strength reduction to a large extent may be due to a combination of
various degradation mechanisms. Based on the technical literature related to FRP
composites, two of the most common degradation processes are fiber integrity and
degradation of fiber/resin interface [1], [44], [45], [54]. The former is related to the
resistance (at the fiber level) of the fiber itself against alkaline/chemical attack (preventing
fiber dissolution), while the latter is more associated with the resin matrix softening and/or
debonding at the interface. Both mechanisms affect the way the load is transferred between
the fibers and the resin matrix causing a loss in the ultimate strength. These durability
issues are related to each other and are known to be caused by hydrolysis reaction (causing
mass dissolution) and moisture absorption (diffusion through the resin matrix) [1], [34],
[44], [45], [54].

91
Another possible reason could be that at high longitudinal tensile load, the
difference in stiffness of the constituents (fiber and resin matrix) and the presence of
moisture will generate dissimilar internal strains that will induce local stress concentrations
at the fiber/resin interface. Ultimately, these stresses will affect mechanical interlocking
which will trigger cracking and debonding between the fiber and the resin matrix causing
premature failure. This was covered to some extent in Chapter 2 where the correlation
between the effect of saturation degree on the tensile strength was discussed. Huang and
Aboutaha [97], in a systematic review, discussed the effect of moisture (in the form of RH)
on the degradation of embedded GFRP bars. They indicated that at 70% of ambient RH the
content of capillary and absorbed water in concrete is about 21%. Therefore, regardless of
whether the specimens are immersed in water or not, GFRP bars embedded in concrete can
absorb moisture and water contained in the capillary pores, which seep into the resin matrix
thus affecting the fiber/resin interface [48], [51].
4.2.2 Tensile Modulus of Elasticity Retention
Figure 4-5 shows the retention of Young’s modulus of extracted GFRP bars after
1, 6, 12, and 24 months of exposure. Evidently, from the calculated results, no obvious
trend with respect to losses in elastic modulus and exposure time was identified. Similar
results have been reported in the literature by different researchers [39], [40], [42], [43],
[45–47], [52]. Furthermore, there were no statistically significant differences detected
between the effects of environmental conditioning and exposure time on the residual tensile
modulus of elasticity, F = 1.720, p = 0.183 for specimens made with mix Type-F and F =
1.831, p = 1.62 for specimens made with mix Type-S.

92
Figure 4-5: Tensile modulus retention of extracted GFRP bars aged in seaconcrete. Error
bars represent standard deviation.
When an analysis of the main effect of exposure time was performed, it was found
that, in the case of specimens made with mix Type-F, there was a statistically significant
effect F = 5.32, p < 0.004. Meaning that the duration of exposure was the parameter that
most affected the residual Young’s modulus rather than the conditioning environment.
However, for specimens made with mix Type-S, neither exposure conditioning nor
duration seems to have a major effect on the tensile modulus.
The outcomes of this research clearly reinforce the existing body of literature with
respect to the degradation of strength as compared to the degradation of modulus [39], [40],
[42], [43], [45–47]. In fact, in contrast to the strength reduction exhibited in the tensile
tests, since the modulus of elasticity is obtained at a relatively low strain range (.001-.003)
as per ASTM D7205 [63], an evident deterioration affecting load transfer between the fiber

93
and the resin matrix may not be detected at this level of strain. Also, it has been suggested
by some researchers that this phenomenon can also be explained by the analytical
interpretation of the composite longitudinal modulus of elasticity equation [39],
𝐸𝑐 = 𝐸𝑓𝑉𝑓 + 𝐸𝑚𝑉𝑚 (4.1)
which is based on the “rule of mixtures”, where 𝐸 represent the modulus of elasticity, 𝑉
the volume fraction, and the subscripts 𝑓 and 𝑚 represent fiber and matrix, respectively
[9], [15], [65]. This equation expresses that the longitudinal Young’s modulus depends on
the elastic modulus and volume fraction of its constituent. The typical tensile modulus of
the fiber used in this study is in the range of 80-81 GPa [98], where the resin matrix is
around 4 GPa [9], [12]. Considering the vast difference in magnitudes of these properties
(twentyfold difference), as well as the high fiber content (71.09% by volume), the tensile
modulus will mainly depend on the modulus of the fibers. Therefore, the strength reduction
of elastic modulus would not be appreciated under the circumstances presented.
4.2.3 Transverse Shear Strength Retention
The residual transverse shear strength of extracted GFRP bars is shown in Figure
4-6. The failure mode for all tested specimens was identical, which is characterized by
generating a cut perpendicular to the longitudinal axis of the GFRP bar of the same width
as the upper shear plate, regardless of the environmental conditioning or the time exposed
to it. The experimental results indicated no substantial strength reduction of transverse
shear strength among all tested specimens. This was validated by ANOVA, which revealed
no statistically significant differences between the effects of environmental conditioning

94
and exposure time on the transverse shear residual strength, F = 1.194, p = 0.339 for
specimens made with mix Type-F and F = 0.960, p = 0.443 for specimens made with mix
Type-S.
Figure 4-6: Transverse shear strength retention of extracted GFRP bars aged in
seaconcrete. Error bars represent standard deviation.
The residual transverse shear strength of specimens made with mix Type-F were
93.4, 94.8, 98.4, and 98.4% for specimens exposed to typical field conditioning (F-FC25)
and 97.9, 97.3, 96.6, and 91.6% for specimens immerse in seawater at 60°C (140°F)
(FSW60) after 1, 6, 12, and 24 months of exposure, respectively. For specimens made with
mix Type-S, at the end of 1, 6, 12, and 24 months of exposure, the residual transverse shear
strengths were 97.0, 99.4, 97.1, and 98.4% for S-FC25 specimens and 95.7, 94.9, 96.9, and
92.2% for S-SW60 specimens. Therefore, between both mix designs, the maximum relative

95
loss in transverse shear strength capacity after 24 months of exposure was 8%. A possible
explanation for this behavior, which is the insensitivity of transverse shear to
environmental conditioning, could be in the fact that fibers were not degraded by the
accelerated conditioning.
4.2.4 Horizontal Shear Strength Retention
The calculated apparent horizontal shear strength retention of all the tested
specimens is shown in Figure 4-7. All GFRP bars revealed the same failure mode
characterized by a mid-depth interlaminar shear crack that developed along the length of
the bar. Similar to the transverse shear strength test results, no obvious degradation trend
was identified. In addition, ANOVA analysis revealed no significant statistical difference
between the effects of environmental conditioning and exposure time on the apparent
horizontal shear residual strength, F = 0.293, p = 0.880 for specimens made with mix Type-
F and F = 0.462, p = 0.763 for specimens made with mix Type-S. By running statistical
analyses (ANOVA), there appears to be no significant difference; however, it seems that
conditioning has some effect because the value tends to increase when there is no
conditioning and tends to decrease when there is conditioning, even though the percentage
differences are very small.

96
Figure 4-7: Horizontal shear strength retention of extracted GFRP bars aged in
seaconcrete. Error bars represent standard deviation.
The major decrease in horizontal shear strength can be attributed to the specimens
conditioned in seawater at 60°C with a maximum strength reduction of 5% and 2% after
24 months of exposure for mix Type-F and mix Type-S, respectively. These results can be
compared with those reported by Gooranorimi and Nanni [36] who did not measure a
decrease but an increase of 4% in the horizontal shear strength on 15.9-mm diameter GFRP
bars (E-glass/vinyl ester) extracted after 15 years of service. However, it should be noted
that this was the product of a single test. In contrast, Manalo et al. [51] reported a horizontal
shear strength reduction of 13% for 9.5-mm diameter GFRP bars (ECR-glass/vinyl ester)
extracted from concrete immersed in saline solution after 112 days. Chen et al. examined
the horizontal shear strength retention of 9.53-mm diameter GFRP bars (E-glass/vinyl
ester) embedded in normal and high-performance concrete (HPC) and exposed to simulated

97
HPC pore solution at 60°C (140°F). They reported a 5 and 12% reduction in horizontal
shear strength after 60 days of exposure. In fact, an even greater reduction was reported by
Khatibmasjedi et al. [53] in which extracted GFRP bars decreased 26% from their original
horizontal shear strength after 24 months of exposure to seawater at 60°C (140°F).
It is not well established in the literature whether the horizontal shear strength
retention changes as a function of the environmental conditioning; in fact, in some cases,
it decreases and in others it may even be increasing. There is no evidence that points to a
specific reason and it is believed it could be several causes including different constituent
properties, surrounding medium (e.g., concrete characteristics and temperature), and
manufacturing process techniques and the presence of voids/defects that are believed to
ultimately increase moisture uptake, thus degrading the fiber/resin matrix interface [44],
[51].
4.2.5 Glass Transition Temperature Assessment
The average Tg values of extracted GFRP bars after 12 and 24 months of exposure
for both mix designs are summarized in Table 4-4. Additionally, the ratio between the
conditioned specimens, Tg (12m) and Tg (24m), and reference values, Tg (ref), is also provided.
These Tg values were determined by the onset of the storage modulus (E’) drop. It is clear
that no considerable changes in the Tg values occurred between the different conditioning
environments or time of exposure. The ratio between conditioned and reference values
ranged from 0.97 to 0.99. These results suggest that no significant detrimental effect on
thermal properties, due to the different degrees of saturation and concrete temperatures,
was identified by DMA.

98
Table 4-4: Results of dynamic mechanical analysis (DMA)
Specimen
designation
Exposure period
12 months 24 months
Temperature,
°C (°F)
Cov
%
𝑇𝑔(12𝑚)
𝑇𝑔(𝑟𝑒𝑓)
Temperature,
°C (°F)
Cov
%
𝑇𝑔(24𝑚)
𝑇𝑔(𝑟𝑒𝑓)
F-FC25 110.7 ± 2.2
(231.3 ± 3.9)
2.0 0.98 109.6 ± 1.6
(229.9 ± 2.9)
1.5 0.97
F-SW60 109.2 ± 1.2
(228.6 ± 2.1)
1.1 0.97 112.2 ± 1.9
(234.0 ± 3.9)
1.9 0.99
S-FC25 112.1 ± 3.6
(233.8 ± 6.5)
3.2 0.99 111.8 ± .1
(233.2 ± .22)
0.1 0.99
S-SW60 112.0 ± 6.3
(233.6 ± 11.3)
5.6 0.99 112.0 ± 8.4
(233.6 ± 15.1)
7.5 0.99
Note: 𝑇𝑔(𝑟𝑒𝑓) for unconditioned (as-received) value; 𝑇𝑔(12𝑚) and 𝑇𝑔(24𝑚) for values after 12
and 24 months of exposure, respectively.
Even though, the moisture/humidity absorbed through the resin matrix during the
aging process can decrease the Tg value [9], [12], at least two possible reasons for the
similarity between reference and conditioned specimens exist. First, the specimens were
obtained from the center of the bar which is less prone to be affected by moisture. Second,
the very small dimensions of the specimens promote the desorption of moisture during the
conditioning period [40h at 23°C (73°F)/50% RH] suggesting a reverse plasticizing effect.
Furthermore, the post-curing effect of the resin matrix was also not observed, due to the
fact that the temperature to which the GFRP bars were exposed was much lower than the
Tg temperature (112.8°C [235°F]).

99
4.2.6 Microstructural Evaluation
4.2.6.1 SEM Images
Typical digital microscopy and SEM cross-sectional micrographs of reference and
exposed specimens are shown in Figure 4-8 and Figure 4-9, respectively. The SEM images
were taken near the edges of the GFRP bars. The main physical damages sought included
fiber and/or matrix resin cracking, fiber/matrix debonding, and fiber deterioration. SEM
images revealed that there were no significant differences between unconditioned
(reference) and conditioned specimens after the 24-month period (beyond cracks induced
during specimen preparation). Furthermore, the SEM images, irrespective of the concrete
mix designs, did not show much difference. Hence, no obvious constituent degradation of
any type was identified.
(a) (b) (c)
Figure 4-8: Typical cross-sectional area of GFRP bars. (a) pristine GFRP bar; F-SW60-24GFRP bar; S-SW60-24 GFRP bar.

100
Reference (100×) Reference (300×)
F-FC25-24 F-SW60-24
S-FC25-24 S-SW60-24
Figure 4-9: Typical SEM images of unconditioned (reference) and conditioned GFRP
bars cross-sections after 24 months of exposure.
4.2.6.2 EDS Results
The typical EDS quantitative analysis (i.e., element identification) performed on
the glass fibers and the resin matrix of pristine GFRP bars are shown in Figure 4-10. Results
from the fiber’s elemental composition revealed the main presence of silicon (Si), calcium

101
(Ca), aluminum (Al), and oxygen (O) which is standard in commercial glass fibers. Also,
traces of potassium (K), magnesium (Mg), titanium (Ti), and iron (Fe) were detected,
which in turn is an indication of the type of glass, in particular, the presence of Ti as
expected in ECR-glass fibers [98]. Similarly, EDS was conducted on the resin matrix
whose results indicated the characteristic peak of carbon (C) (as it should for a vinyl ester
resin), in addition to minor concentrations of Si, O, Ca, and Al and traces of Mg. These
small concentrations can be attributed to the use of additives and/or fillers such as
aluminum silicate, calcium carbonate, and alumina trihydrate (which also acts as a flame-
retardant) [12], [13].
(a) (b) (c)
Figure 4-10: Typical EDS spectrum of pristine GFRP bars: (a) fiberglass, (b) SEM/EDS
image, (c) resin matrix.
EDS quantitative analyses were performed on unconditioned and conditioned
samples (24-month period) to detect potential chemical composition changes in the glass
fibers, as shown in Table 4-5. The quantitative results revealed irrelevant differences
among the main elements between the pristine and extracted GFRP bars. Among the traced

102
elements, perhaps the most noticeable discrepancy was found in Fe concentrations, but
those values are within the margin of error for spectral resolution of EDS analysis. As a
result, no apparent chemical degradation was detected in the fibers through this type of
elemental microanalysis.
Table 4-5: Chemical composition of glass fibers by EDS (weight percentage)
Specimen
designation Si Ca Al O Mg K Ti Fe
Reference 32.52 20.80 7.16 36.86 1.68 0.46 0.32 0.22
F-FC25-24 32.57 21.85 7.23 35.82 1.56 0.57 0.20 0.20
F-SW60-24 32.50 21.41 7.26 36.02 1.62 0.62 0.32 0.25
S-FC25-24 32.61 21.78 7.02 36.13 1.54 0.44 0.29 0.19
S-SW60-24 32.38 21.55 6.94 36.58 1.59 0.52 0.28 0.16
4.2.7 Prediction of Long-term Behavior
4.2.7.1 Degradation Rate
Hamilton et al. [1] stated that even though internal FRP reinforcement has proven
to be a suitable alternative to corrosion-prone materials, the fundamental challenge lies in
the limited long-term durability data to support wider acceptance, especially in severe
environmental conditions. Moreover, the American Concrete Institute in its 440.1R-15
guide acknowledged the susceptibility of FRP bars to different environmental exposures
[8]. For that reason, in this study, efforts were made to predict the long-term durability
performance of the GFRP bars embedded in seaconcrete. Among the four evaluated

103
mechanical properties (tensile strength, elastic modulus, and transverse and horizontal
shear strength), the tensile strength results were the only ones that showed statistically
significant differences. Hence, only the tensile strength retention values were considered
to predict the long-term behavior of the GFRP bars.
Numerous researchers have evaluated different degradation models to predict the
long-term mechanical properties of FRP bars. Among the most commonly used
degradation rate expressions are the single and double logarithmic model, the exponential
model, and the moisture diffusion model [39], [99], [100]. While the two logarithmic
models mentioned are not associated with any specific degradation mechanism, the
exponential model is assumed to model debonding at the fiber/resin interface [39] and the
most frequently used moisture diffusion model is based on the one-dimensional Fickian
model [101]. In this study, the exponential model was chosen to predict long-term strength
retention due to the fact that, based on previous durability studies, it is the model that best
fits the experimental data [39], [42], [100].
The following exponential degradation model was fitted to the experimental data
to assess its suitability based on the coefficient of determination (𝑅2),
𝑌 = (100 − 𝑌∞) exp(𝑡 𝜏⁄ ) + 𝑌∞ (4.2)
where 𝑌∞ is the retention at time infinity, 𝑡 represents the exposure time, and 𝜏 is the
exponential constant. The tensile strength retention values (Figure 4-4) were used in
Equation (4.2) to obtain the exponential constant, 𝜏, by regression analysis. A 𝑅2 value of
0.80 is considered the minimum value for acceptability [47]; lower values indicate a lack
of correlation between the experimental data points and the mathematical expression. As

104
shown in Figure 4-11, the exponential model showed an appropriate fit with 𝑅2 values
above 0.80 except for F-FC25, as expected since no degradation was observed in this
particular environmental conditioning.
Figure 4-11: Exponential degradation model fitted to the tensile strength retention values.
Based on the exponential model, a rapid degradation occurs at the beginning of the
service life of the GFRP bar, which will eventually converge to the long-term retention,
𝑌∞, as shown in Equation (4.2). The long-term retention values and the time to reach that

105
convergence for both types of concrete mix designs and environmental exposure are
summarized in Table 4-6. As previously mentioned, it is evident that the surrounding
medium (in this case the concrete) has an effect on strength retention (easily noticeable in
FC25 conditioning).
Table 4-6: Long-term retention values
Mix design Environmental Exposure
FC25 SW60
𝑌∞ 𝑡 (years) 𝑌∞ 𝑡 (years)
Type-F 98.7 1.01 73.5 4.71
Type-S
86.0 0.56
70.0 0.52
Range 86.0-98.7 0.56-1.01 70.0-73.5 0.52-4.71
Average 92.4 0.80 71.8 2.6
4.2.7.2 Service Life Prediction
The service life predictions, specific for the environmental conditioning used in this
study and applying the exponential degradation model, are shown in Figure 4-12. Based
on this model, specimens embedded in seaconcrete and subjected to typical field exposure
of a subtropical region (FC25) would retain a tensile strength of more than 86% over the
service life of the structure. Comparatively, if concrete specimens are immersed in
seawater at 60°C (140°F), strength retention of 70% or above was predicted. Overall,
convergence times were reached within the first 5 years of projected trends. This is
somewhat expected since, for all tested GFRP bars, the reduction in tensile strength
between the last exposure periods did not decrease any further, thus this is reflected in the
early convergence to the long-term strength retention (𝑌∞).

106
Figure 4-12: Service life predictions (based on the exponential degradation model).
Given the reason that long-term exposure of GFRP bars to different types of
environmental conditions can affect tensile strength, the ACI 440 Committee established
a design philosophy where the guaranteed tensile strength, 𝑓𝑓𝑢*, is altered by the
environmental reduction factor, 𝐶𝐸 (discussed in Chapter 3, section 3.2.1). Based on the
results obtained from the long-term predictions, the minimum strength retention for
specimens not exposed to weathering conditioning (FC25) was 86%, thus the currently
accepted 𝐶𝐸 seems to be conservative. While for specimens exposed to seawater at 60°C
(SW60) the minimum strength retention was 70%. However, it should be noted that
consistent and continuous temperatures of 60°C (140°F) are highly unlikely since the
highest recorded punctual sea surface registered temperatures worldwide are around 35°C
(95°F) [102]. At the same time, further validation of these outcomes and calibration of the
degradation model should be compared to data obtained from existing structures that have
been in service for a prolonged period of time.

107
4.3 Concluding Remark
• The type of surrounding concrete, as well as immersing the specimens in seawater
and increasing the temperature to 60°C (140°F) had an effect on the tensile strength
retention.
• Tensile strength results showed statistically significant differences. This may be
due to the presence of moisture that at high loads induces local stress
concentrations at the fiber/resin interface, which in turn prompts cracks and
debonding between the fiber and the resin matrix leading to premature failure.
• In contrast to the loss in tensile strength, the elastic modulus was not affected. This
is mainly because the modulus of elasticity is largely governed by the glass fiber
and its degradation may not be sufficiently significant to be quantified.
• Even after 24 months of exposure, the transverse and shear strength results showed
minimal strength reductions. For example, the transverse shear strength results
decreased by 2-8%, while the horizontal shear strength reduced by 1-5% of the
original strength.
• No considerable microstructural changes were detected through SEM images and
quantitative EDS analysis within the cross-sectional area of conditioned GFRP
bars after 24 months of exposure.
• To better understand the moisture-associated degradation mechanisms, since
moisture can wick through the interface and accumulate in the voids,
microstructural analyses should be performed not only near the edges of the bar
but also in the vicinity of the voids.

108
• The exponential degradation model showed good agreement with the experimental
data obtained from the tensile tests (𝑅2 values above 0.80) with the exception of
specimens that exhibited no significant strength reductions.
• Based on long-term predictions and under typical field conditioning at
25°C/71%RH, tensile strength retention varied between 86.0 and 98.7% (avg.
92%). Under more aggressive conditioning (seawater at 60°C), retention was
predicted to range from 70.0 to 73.5%. (avg. 72%).
4.4 Future Research
According to the findings of this study, the long-term performance of GFRP bars
embedded in seaconcrete can be used to better evaluate strength retention and design
reduction factors. However, due to the vast variety of GFRP bars available on the market
and given that the results obtained represent solely the GFRP bar used in this study, it is
necessary to perform additional tests on different FRP bars. Also, future studies can
validate long-term degradation models with existing GFRP-RC structures as they age.

Chapter 5
Conclusions
The safe utilization of GFRP reinforcing bars in combination with seawater-mixed concrete
seems to be a viable alternative to conventional corrosion-prone materials exposed to harsh
environments. Based on the experimental results obtained from each study, the main
findings can be summarized as follows.
Microstructural Investigation and Influence of Moisture on Tensile Properties of
GFRP Bars
Four different types of commercially available pultruded GFRP bars with a nominal
diameter of 9.5 mm (0.375 in.) were evaluated. Burn-off and digital image processing
methods were used to quantify the fiber and resin matrix weight fractions for all the GFRP
bars assessed in this study. For the BO method, specimens 25.4-mm long (1.0 in.) were
tested, according to the standard (ASTM D2584 [56]). SEM images were taken at 100×
magnification and the fiber and resin volume fractions were evaluated using the DIP
thresholding technique. Then, the fiber and resin matrix weight fractions were calculated
109

110
using established relationships. Finally, the correlation between void fraction and moisture
absorption was considered. The following conclusions can be drawn from this study:
• The DIP method provided direct quantifiable values of the volume fraction (e.g.,
fiber, resin matrix, and voids). Contrasting conventional resin matrix separation
methods, the DIP method has the capability to provide additional microstructural
information such as filament size and distribution, as well as the presence and type
of voids/defects.
• Comparable results were obtained from the two methods (DIP and BO); the
differences can be attributed to the use of assumed typical constituent properties
and contents instead of the actual values used by the manufacturers.
• Analysis of 11% of the total cross-sectional area of the GFRP bar using the DIP
method provided comparable results compared to the BO method. However, the
random nature of clustered voids and defects can lead to an under/over-assessment
of their volume fractions.
• The quantified volume fractions obtained directly from the DIP method seems to
be more informative and reliable for evaluating microstructural properties than the
weight fractions obtained by the BO method.
• Moisture uptake was positively correlated with the amount and size of
voids/defects.
• Tensile strength and ultimate tensile strain capacity were affected by the degree of
saturation (91-107% variation), but not the longitudinal modulus of elasticity.

111
Flexural Performance of Seawater-mixed GFRP-RC Slabs
A total of forty-eight (48) GFRP-RC slabs with dimensions of 1828 mm (72 in.)
long, 304 mm (12 in.) wide, and 152 mm (6 in.) depth reinforced with a 9.5-mm (.375 in.)
diameter GFRP bar were fabricated using two different seaconcrete mix designs. All
GFRP-RC slabs were exposed to accelerated aging and field conditioning over 24 months.
Three-point bending tests over a clear span of 1524 mm (60 in.) were conducted on all
GFRP-RC slabs after a specified exposure period (1, 6, 12, or 24 months). The strength
capacities were calculated using an analytical and simplified (ACI 4401.R-15 [8])
approach. Test results were compared to the predicted values in terms of flexural
performance (first crack, ultimate and design capacity, and deflection). Based on the
results, the main finding can be summarized as follows:
• Seawater-mixed concrete cylinders, independently of the environmental
conditioning, exhibited comparable compressive strength to samples conditioned
in moist-room after 24 months of exposure with a maximum difference of 1.8 and
6.4% for concrete Type-F and 3.8 and 2.4% for concrete Type-S.
• The ultimate load capacity of the GFRP-RC slabs exposed to seawater at 60°C
(140°F) was 13.8 and 17.5% lower than those conditioned in the field environment
for concrete Type-F and Type-S, respectively. However, the accelerated aging
protocols are not yet correlated to real-life applications, thus results must be
calibrated with existing aged GFRP structures.
• The analytical approach (without any strength reduction factor) reasonably
predicted the experimental failure moment capacity in most tested GFRP-RC slabs.
The experimental to analytical moment capacity ratio resulted in 0.97 (Type-F) and

112
0.91 (Type-S) for field conditioning and 0.87 (Type-F) and 0.78 (Type-S) for those
exposed to accelerated aging.
• The ACI 440.1R-15 [8] simplified conservative equations predicted a 3% lower
failure moment capacity than analytically computed. The ratio between
experimental and ACI nominal moment capacities resulted in 1.0 (Type-F) and 0.94
(Type-S) for field conditioning, while for those exposed to accelerated aging it was
0.90 (Type-F) and 0.80 (Type-S).
• The experimental ultimate moment capacity for all GFRP-RC slabs was on average
2.13 to 2.65 times higher than the ACI 440.1R-15 [8] predicted design load
capacity. This is clearly accredited to the implementation of several knock-down
factors (i.e., 𝐶𝐸, 𝜙, 𝑓𝑓𝑢*) that make the design conservative even for elements
subjected to accelerated aging protocol.
• Overall, simply supported one-way GFRP-RC slabs tested under the 3-point
bending exhibited a bi-linear trend with a pre- and post-cracking response
independent of environmental conditioning or time of exposure.
• In general, the ACI 440.1R-15 [8] equations reasonably predicted the deflections
measured experimentally based on an approximate similarly initiated cracking
response. However, the most notable discrepancies were observed mainly in
specimens conditioned in seawater at 60°C (140°F).

113
Durability of GFRP Reinforcing Bars in Seawater-Mixed Concrete
This research study evaluated the durability of unstressed GFRP bars that were
embedded in seaconcrete and exposed to a typical subtropical field environment [25°C
(78°F)/71.2% RH] and accelerated aging [seawater at 60°C (140°F)]. The comparison
between unconditioned and conditioned physico-mechanical properties was an indicator of
degradation. The mechanical test results included tensile strength, longitudinal elastic
modulus, transverse shear strength, and apparent horizontal shear strength, while the
physical evaluation comprised of Tg test results and microstructural analysis through SEM
images and EDS. In addition, the exponential prediction model was fitted to evaluate the
degradation rate of GFRP bars under different environmental conditions. In accordance
with the results obtained, the following observations are made:
• The type of surrounding concrete as well as the immersion of the concrete
specimens in seawater at 60°C (140°F) influenced the tensile strength retention.
• Tensile strength reduction, in part, might be due to the degree of saturation that
promotes (i) irreversible degradation, such as moisture-induced swelling of the
resin matrix that promotes delamination of the interface, and (ii) at high loads,
local stress concentrations are formed at the fiber/resin interface, which causes
further cracking and leads to premature failure.
• The tensile modulus of elastic was not affected irrespective of environmental
conditioning or time of exposure. This is mainly because the elastic modulus is
largely governed by the glass fiber and its degradation may not be significant
enough to be quantified.

114
• Transverse and shear strength results showed minimal strength reductions. For
instance, after 24 months of exposure, the transverse shear strength decreased by
2-8%, while the horizontal shear strength reduced by 1-5% of its original strength.
• No considerable microstructural changes were detected through SEM images and
quantitative EDS analysis within the cross-sectional area of conditioned GFRP
bars after 24 months of exposure.
• To better understand the moisture-associated degradation mechanisms, it would
also be necessary to perform a microstructural analysis in the vicinity of the
voids/defects.
• The exponential degradation model showed good agreement with the experimental
data obtained from the tensile tests (𝑅2 values above 0.80), except for specimens
that exhibited no significant strength reductions.
• Based on long-term predictions, under typical environmental conditioning of a
subtropical region [25°C (78°F)/71% RH], the average tensile strength retention
was 92%. Under more aggressive conditioning, an average strength retention of
72% was predicted.

Chapter 6
Bibliography
[1] H. R. Hamilton, B. Benmokrane, C. W. Dolan, and M. M. Sprinkel, “Polymer Materials to Enhance Performance of Concrete in Civil Infrastructure,” Polym. Rev., vol.49, no. 1, Feb. 2009.
[2] A. Bentur, N. Berke, and D. Sidney, Steel Corrosion in Concrete: Fundamentals and Civil Engineering Practice. CRC Press, London, 1997.
[3] G. H. Koch, M. P. H. Brongers, N. G. Thompson, Y. P. Virmani, and J. H. Payer, “Corrosion Cost and Preventive Strategies in the United States,” FHWA-RD-01-156, Federal Highway Administration, 2002.
[4] N. Uddin, Developments in Fiber-Reinforced Polymer (FRP) Composites for Civil Engineering, 1st ed. Woodhead Publishing Limited, Cambridge, UK, 2013.
[5] B. Benmokrane, H. Mohamed, and E. Ahmed, “Recent Developments of FRP Bars as Internal Reinforcement in Concrete Structures & Field Applications,” 4th International Conference on Sustainable Construction Materials and Technologies, 2016.
[6] A. R. Emparanza, R. Kampmann, and F. De Caso y Basalo, “State-of-the-Practice of Global Manufacturing of FRP Rebar and Specifications,” American Concrete Institute, ACI Special Publication, 2017.
[7] V. M. Karbhari and L. S. Lee, “Service Life Estimation and Extension of Civil Engineering Structures,” Series in Civil and Structural Engineering, Woodhead Publishing Limited, Cambridge, UK, 2011.
[8] American Concrete Institute (ACI) Committee 440, “Guide for the Design and Construction of Structural Concrete Reinforced with Fiber-Reinforced Polymer (FRP) Bars,” 2015.
[9] M. Zoghi, The International Handbook of FRP Composites in Civil Engineering. CRC Press, Boca Raton, Florida, 2013.
[10] A. Nanni, A. De Luca, and H. Jawaheri Zadeh, Reinforced Concrete with FRP Bars: Mechanics and Design. CRC Press/Taylor & Francis Group, Boca Raton, Florida, 2014.
115

116
[11] P. Balaguru, A. Nanni, and J. Giancaspro, FRP Composites for Reinforced and
Prestressed Concrete Structures. CRC Press/Taylor & Francis Group, New York &
London, 2009.
[12] J. Bai, Advanced Fibre-Reinforced Polymer (FRP) Composites for Structural
Applications. Woodhead Publishing Limited, Sawston, Cambridge, 2013.
[13] L. C. Bank, Composites for Construction: Structural Design with FRP Materials.
John Wiley & Sons, Inc., Hoboken, NJ, USA, 2006.
[14] L. A. Carlsson, D. F. Adams, and R. B. Pipes, Experimental Characterization of
Advanced Composite Materials, 4th ed. CRC Press, Boca Raton, 2014.
[15] R. F. Gibson, Principles of Composite Material Mechanics, 3rd ed. CRC Press,
Boca Raton, 2011.
[16] J. Xiao, C. Qiang, A. Nanni, and K. Zhang, “Use of Sea-Sand and Seawater in
Concrete Construction: Current Status and Future Opportunities,” Constr. Build.
Mater., vol.155, Nov. 2017.
[17] A. Younis, U. Ebead, P. Suraneni, and A. Nanni, “Fresh and Hardened Properties
of Seawater-Mixed Concrete,” Constr. Build. Mater., vol.190, Nov. 2018.
[18] M. Khatibmasjedi, S. Ramanathan, P. Suraneni, and A. Nanni, “Compressive
Strength Development of Seawater-Mixed Concrete Subject to Different Curing
Regimes,” ACI Mater. J., vol.117, no. 5, 2020.
[19] E. El-Salakawy and B. Benmokrane, “Serviceability of Concrete Bridge Deck
Slabs Reinforced with Fiber-Reinforced Polymer Composite Bars,” ACI Struct. J.,
vol.101, no. 5, 2004.
[20] A. H. Ali, M. Z. Afifi, B. Abdulsalam, H. Haggag, A. El Hashimy, T. El-Sayed,
and H. M. Mohamed, “Performance Evaluation of One-Way Concrete Slabs
Reinforced with New Developed GFRP Bars,” Mater. Sci. Appl., vol.06, no. 05,
2015.
[21] I. F. Kara, M. A. Köroğlu, and A. F. Ashour, “Tests of Continuous Concrete Slabs
Reinforced with Basalt Fiber-Reinforced Plastic Bars,” ACI Struct. J., vol.114, no.
5, Sep. 2017.
[22] M. E. M. Mahroug, A. F. Ashour, and D. Lam, “Tests of Continuous Concrete
Slabs Reinforced with Carbon Fibre Reinforced Polymer Bars,” Compos. Part B
Eng., vol.66, Nov. 2014.
[23] E. M. Lotfy, S. M. Elzeiny, and A. M. Rashad, “Flexural Capacity of One-Way
GFRP Concrete Slabs,” Proc. Inst. Civ. Eng. - Constr. Mater., vol.164, no. 3, Jun.
2011.
[24] C. R. Michaluk, S. H. Rizkalla, G. Tadros, and B. Benmokrane, “Flexural
Behavior of One-Way Concrete Slabs Reinforced by Fiber Reinforced Plastic
Reinforcements,” ACI Struct. J., vol.95, no. 3, 1998.

117
[25] K. Attia, A. El Refai, and W. Alnahhal, “Flexural Behavior of Basalt Fiber–
Reinforced Concrete Slab Strips with BFRP Bars: Experimental Testing and
Numerical Simulation,” J. Compos. Constr., vol.24, no. 2, Apr. 2020.
[26] G. Bowen, P. Zheng, C. D. Moen, and S. R. Sharp, “Flexural Behavior at Service
and Ultimate Limit State of One-Way Concrete Slabs Reinforced with Corrosion-
Resistant Reinforcing Bars,” Transp. Res. Rec. J. Transp. Res. Board, vol.2331,
no. 1, Jan. 2013.
[27] A. Nanni, “Flexural Behavior and Design of RC Members Using FRP
Reinforcement,” J. Struct. Eng., vol.119, no. 11, Nov. 1993.
[28] L. Ombres, T. Alkhrdaji, and A. Nanni, “Flexural analysis of One-Way Concrete
Slabs Reinforced with GFRP Rebars,” International Meeting on Composite
Materials, PLAST 2000, Proceedings, Advancing with Composites 2000, May
2000.
[29] R. Al-Sunna, K. Pilakoutas, I. Hajirasouliha, and M. Guadagnini, “Deflection
Behaviour of FRP Reinforced Concrete Beams and Slabs: An Experimental
Investigation,” Compos. Part B Eng., vol.43, no. 5, Jul. 2012.
[30] K. Chang and D. Seo, “Behavior of One-Way Concrete Slabs Reinforced with
GFRP Bars,” J. Asian Archit. Build. Eng., vol.11, no. 2, 2012.
[31] Y. Gao, Y. Zhou, J. Zhou, X. Kong, B. Zhang, S. Liu, J. Feng, N. Zhu, H. Fan, and
F. Jin, “Blast Responses of One-Way Sea-sand Seawater Concrete Slabs
Reinforced with BFRP Bars,” Constr. Build. Mater., vol.232, Jan. 2020.
[32] Z. Dong, G. Wu, X.-L. Zhao, H. Zhu, and J.-L. Lian, “Durability Test on the
Flexural Performance of Seawater Sea-Sand Concrete Beams Completely
Reinforced with FRP Bars,” Constr. Build. Mater., vol.192, Dec. 2018.
[33] A. Younis, U. Ebead, P. Suraneni, and A. Nanni, “Short-Term Flexural
Performance of Seawater-Mixed Recycled-Aggregate GFRP-Reinforced Concrete
Beams,” Compos. Struct., vol.236, no. September 2019, Mar. 2020.
[34] H. El-Hassan and T. El Maaddawy, “Microstructure Characteristics of GFRP
Reinforcing Bars in Harsh Environment,” Adv. Mater. Sci. Eng., vol.2019, Apr.
2019.
[35] F. Ceroni, E. Cosenza, M. Gaetano, and M. Pecce, “Durability Issues of FRP
Rebars in Reinforced Concrete Members,” Cem. Concr. Compos., vol.28, no. 10,
Nov. 2006.
[36] O. Gooranorimi and A. Nanni, “GFRP Reinforcement in Concrete after 15 Years
of Service,” J. Compos. Constr., vol.21, no. 5, Oct. 2017.
[37] V. Benzecry, J. Brown, A. Al-Khafaji, R. Haluza, R. Koch, M. Nagarajan, C. E.
Bakis, J. J. Myers, and A. Nanni, “Durability of GFRP Bars Extracted from
Bridges with 15 to 20 Years of Service Life,” Strategic Development Council
(SDC) of the American Concrete Institute (ACI), 2019.

118
[38] Y. Chen, J. F. Davalos, and I. Ray, “Durability Prediction for GFRP Reinforcing
Bars Using Short-Term Data of Accelerated Aging Tests,” J. Compos. Constr.,
vol.10, no. 4, Aug. 2007.
[39] Z. Wang, X.-L. Zhao, G. Xian, G. Wu, R. K. Singh Raman, S. Al-Saadi, and A.
Haque, “Long-Term Durability of Basalt- and Glass-Fibre Reinforced Polymer
(BFRP/GFRP) Bars in Seawater and Sea Sand Concrete Environment,” Constr.
Build. Mater., vol.139, May 2017.
[40] Y. A. Al-Salloum, S. El-Gamal, T. H. Almusallam, S. H. Alsayed, and M. Aqel,
“Effect of Harsh Environmental Conditions on the Tensile Properties of GFRP
Bars,” Compos. Part B Eng., vol.45, no. 1, Feb. 2013.
[41] Z. Wang, X.-L. Zhao, G. Xian, G. Wu, R. K. Singh Raman, and S. Al-Saadi,
“Durability Study on Interlaminar Shear Behaviour of Basalt-, Glass- and Carbon-
Fibre Reinforced Polymer (B/G/CFRP) Bars in Seawater Sea Sand Concrete
Environment,” Constr. Build. Mater., vol.156, Dec. 2017.
[42] J. Tu, H. Xie, and K. Gao, “Prediction of the Long-Term Performance and
Durability of GFRP Bars under the Combined Effect of a Sustained Load and
Severe Environments,” Materials (Basel)., vol.13, no. 10, May 2020.
[43] A. S. Debaiky, G. Nkurunziza, B. Benmokrane, and P. Cousin, “Residual Tensile
Properties of GFRP Reinforcing Bars after Loading in Severe Environments,” J.
Compos. Constr., vol.10, no. 5, Oct. 2006.
[44] Y. Chen, J. F. Davalos, I. Ray, and H.-Y. Kim, “Accelerated Aging Tests for
Evaluations of Durability Performance of FRP Reinforcing Bars for Concrete
Structures,” Compos. Struct., vol.78, no. 1, Mar. 2007.
[45] H. Fergani, M. Di Benedetti, C. Miàs Oller, C. Lynsdale, and M. Guadagnini,
“Durability and Degradation Mechanisms of GFRP Reinforcement Subjected to
Severe Environments and Sustained Stress,” Constr. Build. Mater., vol.170, May
2018.
[46] T. H. Almusallam, Y. A. Al-Salloum, S. H. Alsayed, S. El-Gamal, and M. Aqel,
“Tensile Properties Degradation of Glass Fiber-Reinforced Polymer Bars
Embedded in Concrete Under Severe Laboratory and Field Environmental
Conditions,” J. Compos. Mater., vol.47, no. 4, Feb. 2013.
[47] M. Robert, P. Cousin, and B. Benmokrane, “Durability of GFRP Reinforcing Bars
Embedded in Moist Concrete,” J. Compos. Constr., vol.13, no. 2, Apr. 2009.
[48] M. Robert and B. Benmokrane, “Combined Effects of Saline Solution and Moist
Concrete on Long-Term Durability of GFRP Reinforcing Bars,” Constr. Build.
Mater., vol.38, 2013.
[49] D. Jia, Q. Guo, J. Mao, J. Lv, and Z. Yang, “Durability of Glass Fibre-Reinforced
Polymer (GFRP) Bars Embedded in Concrete Under Various Environments. I:
Experiments and Analysis,” Compos. Struct., vol.234, no. February 2019, Feb.
2020.

119
[50] D. Trejo, P. Gardoni, and J. J. Kim, “Long-Term Performance of Glass Fiber-
Reinforced Polymer Reinforcement Embedded in Concrete,” ACI Mater. J.,
vol.108, no. 6, 2011.
[51] A. Manalo, G. Maranan, B. Benmokrane, P. Cousin, O. Alajarmeh, W. Ferdous, R.
Liang, and G. Hota, “Comparative Durability of GFRP Composite Reinforcing
Bars in Concrete and in Simulated Concrete Environments,” Cem. Concr.
Compos., vol.109, no. July 2019, May 2020.
[52] X. J. He, L. Dai, and W. R. Yang, “Durability and Degradation Mechanism of
GFRP Bars Embedded in Concrete Beams with Cracks,” Plast. Rubber Compos.,
vol.46, no. 1, Jan. 2017.
[53] M. Khatibmasjedi, S. Ramanathan, P. Suraneni, and A. Nanni, “Durability of
Commercially Available GFRP Reinforcement in Seawater-Mixed Concrete under
Accelerated Aging Conditions,” J. Compos. Constr., vol.24, no. 4, Aug. 2020.
[54] H. El-Hassan, T. El-Maaddawy, A. Al-Sallamin, and A. Al-Saidy, “Performance
Evaluation and Microstructural Characterization of GFRP Bars in Seawater-
Contaminated Concrete,” Constr. Build. Mater., vol.147, 2017.
[55] H. V. S. GangaRao, N. Taly, and P. V. Vijay, Reinforced Concrete Design with
FRP Composites. CRC Press/Taylor & Francis Group, Boca Raton, 2006.
[56] ASTM D2584, Standard Test Method for Ignition Loss of Cured Reinforced
Resin. ASTM International, West Conshohocken (PA), 2018.
[57] ASTM D3171, Standard Test Methods for Constituent Content of Composite
Materials. ASTM International, West Conshohocken (PA), 2015.
[58] CAN/CSA S807-10, Specification for Fibre-Reinforced Polymers. Canadian
Standards Association, Ontario, Canada, 2010.
[59] ASTM D792, Standard Test Methods for Density and Specific Gravity (Relative
Density) of Plastics by Displacement. ASTM International, West Conshohocken
(PA), 2013.
[60] J. W. Hearle, High-Performance Fibres - 6.2 Glass for Fibres. Woodhead
Publishing Limited/CRC Press, Boca Raton, Florida, 2001.
[61] S. M. Mukhopadhyay, “Sample Preparation for Microscopic and Spectroscopic
Characterization of Solid Surfaces and Films,” Sample Preparation Techniques in
Analytical Chemistry, John Wiley & Sons, Inc., Hoboken, NJ, USA, 29-Oct-2003.
[62] ASTM D570, Standard Test Method for Water Absorption of Plastics. West
Conshohocken (PA), 2018.
[63] ASTM D7205, Standard Test Method for Tensile Properties of Fiber Reinforced
Polymer Matrix Composite Bars. ASTM International, West Conshohocken (PA),
2016.

120
[64] J. Turner and J. Thayer, Introduction to Analysis of Variance: Design, Analysis &
Interpretation. SAGE Publications, Inc., Thousand Oaks, CA, 2001.
[65] A. K. Kaw, Mechanics of Composite Materials, 2nd ed. CRC Press, Boca Raton,
2005.
[66] M. Mehdikhani, L. Gorbatikh, I. Verpoest, and S. V. Lomov, “Voids in Fiber-
Reinforced Polymer Composites: A Review on their Formation, Characteristics,
and Effects on Mechanical Performance,” J. Compos. Mater., vol.53, no. 12, May
2019.
[67] M. J. Viens, “Determination of Fiber Volume Using in Graphite / Epoxy Materials
Computer Image Analysis,” National Aeronautics and Space Administration
(NASA), vol.TM-100770, 1990.
[68] M. C. Waterbury and L. T. Drzal, “Determination of Fiber Volume Fractions by
Optical Numeric Volume Fraction Analysis,” J. Reinf. Plast. Compos., vol.8, no.
6, Nov. 1989.
[69] E. Cilley, D. Roylance, and N. Schneider, “Methods of Fiber and Void
Measurement in Graphite/Epoxy Composites,” Compos. Mater. Test. Des. (Third
Conf., 2009.
[70] L. Conklin, “Tutorial for Collecting and Processing Images of Composite
Structures to Determine the Fiber Volume Fraction,” National Institute of
Aerospace, NASA, no. CR-2017-219365, Hampton, Virginia, 2017.
[71] L. Bian, J. Xiao, J. Zeng, and S. Xing, “Effects of Seawater Immersion on Water
Absorption and Mechanical Properties of GFRP Composites,” J. Compos. Mater.,
vol.46, no. 25, Dec. 2012.
[72] R. Kampmann, A. R. Emparanza, S. Telikapalli, J. Suhrheinrich, and F. De Caso,
“The Correlation between Moisture Absorption and Mechanical Strength
Properties of GFRP Rebars,” 2nd International Workshop on GFRP Bars for
Concrete Structures, Orlando, FL, 2019.
[73] A. R. Emparanza, “GFRP Reinforcement in Concrete: Durability Assessment and
Evaluation of the Bond Behavior,” Ph.D. dissertation, Dept. Civil, Arch., & Env.
Eng. Univ. of Miami, Coral Gables, 2020.
[74] L. V. J. Lassila, T. Nohrström, and P. K. Vallittu, “The Influence of Short-Term
Water Storage on the Flexural Properties of Unidirectional Glass Fiber-Reinforced
Composites,” Biomaterials, vol.23, no. 10, May 2002.
[75] ASTM D7957, Standard Specification for Solid Round Glass Fiber Reinforced
Polymer Bars for Concrete Reinforcement. West Conshohocken (PA), 2017.
[76] SEACON, “Sustainable Concrete Using Seawater, Salt-Contaminated Aggregates,
and Non-Corrosive Reinforcement,” Deliverable D2.4, 2015.

121
[77] L. Montanari, P. Suraneni, M. Tsui-Chang, M. Khatibmasjedi, U. Ebead, J. Weiss,
and A. Nanni, “Hydration, Pore Solution, and Porosity of Cementitious Pastes
Made with Seawater,” J. Mater. Civ. Eng., vol.31, no. 8, Aug. 2019.
[78] ASTM C39, Standard Test Method for Compressive Strength of Cylindrical
Concrete Specimens. ASTM International, West Conshohocken (PA), 2017.
[79] AASHTO TP 119, Standard Method of Test for Electrical Resistivity of a
Concrete Cylinder Tested in a Uniaxial Resistance Test. AASHTO, Washington,
D.C, 2015.
[80] AASHTO T 358, Standard Method of Test for Surface Resistivity Indication of
Concrete’s Ability to Resist Chloride Ion Penetration. AASHTO, Washington,
D.C, 2015.
[81] ASTM C 597, Standard Test Method for Pulse Velocity Through Concrete, no. 02.
ASTM International, West Conshohocken (PA), 2016.
[82] J. A. Grubb, H. S. Limaye, and A. M. Kakade, “Testing pH of Concrete,” Concr.
Int., vol.29, no. 04, 2007.
[83] National Oceanic and Atmospheric Administration (NOAA), “Monthly Weather
Summary (CLM),” w2.weather.gov. .
[84] American Concrete Institute (ACI) Committee 437, Code Requirements for Load
Testing of Existing Concrete Structures And Commentary. Farmington Hills, MI,
2012.
[85] C. E. Todeschini, A. C. Bianchini, and C. E. Kesler, “Behavior of Concrete
Columns Reinforced with High Strength Steels,” ACI J. Proc., vol.61, no. 6, 1964.
[86] W. Xue, F. Peng, and Q. Zheng, “Design Equations for Flexural Capacity of
Concrete Beams Reinforced with Glass Fiber–Reinforced Polymer Bars,” J.
Compos. Constr., vol.20, no. 3, Jun. 2016.
[87] American Concrete Institute (ACI) Committee 318, Building Code Requirements
for Structural Concrete and Commentary. American Concrete Institute, 2019.
[88] P. H. Bischoff and S. P. Gross, “Equivalent Moment of Inertia Based on
Integration of Curvature,” J. Compos. Constr., vol.15, no. 3, Jun. 2011.
[89] A. Younis, U. Ebead, P. Suraneni, and A. Nanni, “Performance of Seawater-Mixed
Recycled-Aggregate Concrete,” J. Mater. Civ. Eng., vol.32, no. 1, Jan. 2020.
[90] T. U. Mohammed, H. Hamada, and T. Yamaji, “Long-Term Durability of Concrete
Made with Slag Cements under Marine Environment,” ACI Mater. J., vol.116, no.
5, Sep. 2019.
[91] D. Vafaei, R. Hassanli, X. Ma, J. Duan, and Y. Zhuge, “Sorptivity and Mechanical
Properties of Fiber-Reinforced Concrete Made with Seawater and Dredged Sea-
Sand,” Constr. Build. Mater., Nov. 2020.

122
[92] Y. Chen, P. Liu, and Z. Yu, “Effects of Environmental Factors on Concrete
Carbonation Depth and Compressive Strength,” Materials (Basel)., vol.11, no. 11,
Nov. 2018.
[93] G. Claure, “Non-Traditional Shape GFRP Rebars for Concrete Reinforcement,”
Ph.D. dissertation, Dept. Civil, Arch., & Env. Eng. Univ. of Miami, Coral Gables,
2015.
[94] ASTM D7617, “Transverse Shear Strength of Fiber-Reinforced Polymer Matrix
Composite Bars,” no. Reapproved 2017, ASTM International, West Conshohocken
(PA), 2011.
[95] ASTM D4475, Standard Test Method for Apparent Horizontal Shear Strength of
Pultruded Reinforced Plastic Rods By the Short-Beam Method, no. Reapproved
2016. ASTM International, West Conshohocken (PA), 2016.
[96] ASTM E1640, Standard Test Method for Assignment of the Glass Transition
Temperature By Dynamic Mechanical Analysis. West Conshohocken (PA), 2013.
[97] J. Huang and R. Aboutaha, “Environmental Reduction Factors for GFRP Bars
Used as Concrete Reinforcement: New Scientific Approach,” J. Compos. Constr.,
vol.14, no. 5, Oct. 2010.
[98] F. T. Wallenberger, J. C. Watson, and H. Li, ASM Handbook: Composites, vol.21.
ASM International, 2001.
[99] R. Kampmann, F. De Caso y Basalo, M. Roddenberry, and A. R. Emparanza,
“Performance Evaluation of Glass Fiber Reinforced Polymer (GFRP) Reinforcing
Bars Embedded in Concrete Under Aggressive Environments,” Final report,
Florida Department of Transportation, Research Center, Tallahassee, FL, 2018.
[100] J. F. Davalos, Y. Chen, and I. Ray, “Long-Term Durability Prediction Models for
GFRP Bars in Concrete Environment,” J. Compos. Mater., vol.46, no. 16, Aug.
2012.
[101] J. Wang, H. GangaRao, R. Liang, and W. Liu, “Durability and Prediction Models
of Fiber-Reinforced Polymer Composites Under Various Environmental
Conditions: A Critical Review,” J. Reinf. Plast. Compos., vol.35, no. 3, Feb. 2016.
[102] “Ocean: Sea Surface Temperature (1 Month - AVHRR, 1981-2006),” NASA Earth
Observations, https://neo.sci.gsfc.nasa.gov.

Chapter 7
Appendix A
Figure A-1: Normalized residual capacity of extracted GFRP bars. Note: TNS = tensile strength; EM = tensile elastic modulus; TSS = transverse shear strength; HSS = horizontal shear strength.
Error bars represent standard deviation.
123

Chapter 8
Appendix B
Table B-1: Two-way ANOVA summary table showing the interaction between the effects of environmental conditioning and exposure time on the residual capacity
Property Mix DF Sum of squares Mean squares F p
TNS F 4 53957.18 13489.29 10.63 0.0002
S 4 33671.30 8417.82 8.62 0.0004
EM F 4 23.61 5.90 1.72 0.183
S 4 35.28 8.82 1.83 0.162
TSS F 4 371.00 92.75 1.19 0.339
S 4 234.48 58.62 0.96 0.443
HSS F 4 4.99 1.25 0.29 0.880
S 4 7.55 1.89 0.46 0.763
Note: DF = degrees of freedom; TNS = tensile strength; EM = tensile elastic modulus; TSS = transverse shear strength; HSS = horizontal shear strength. The values highlighted in bold represent statistically significant differences (p < 0.05).
124