impact behaviour of hybrid gfrp-concrete beam ... - UNSWorks
237
IMPACT BEHAVIOUR OF HYBRID GFRP-CONCRETE BEAM UNDER LOW-VELOCITY IMPACT LOADING By Zongjun Li A thesis submitted in fulfilment of the requirements for the degree of Doctor of Philosophy School of Engineering and Information Technology The University of New South Wales, Canberra September 2017
-
Upload
khangminh22 -
Category
Documents
-
view
0 -
download
0
Transcript of impact behaviour of hybrid gfrp-concrete beam ... - UNSWorks

IMPACT BEHAVIOUR OF HYBRID GFRP-CONCRETE BEAM
UNDER LOW-VELOCITY IMPACT LOADING
By
Zongjun Li
A thesis submitted in fulfilment of the requirements for the degree of Doctor of Philosophy
School of Engineering and Information Technology
The University of New South Wales, Canberra
September 2017

PLEASE TYPE THE UNIVERSITY OF NEW SOUTH WALES
Thesis/Dissertation Sheet Surname or Family name: Li
First name: Zongjun
Other name/s:
Abbreviation for degree as given in the University calendar: PhD
School: SEIT
Faculty: UNSW Canberra
Title: Impact behaviour of hybrid GFRP-concrete beam under low-velocity impact loading
Abstract 350 words maximum: (PLEASE TYPE)
The combination of two or more materials into a hybrid structural system is becoming increasingly important in the construction industry. The present study focusses on the design of a hybrid beam consisting of a rectangular hollow pultruded glass fiber reinforced polymer (GFRP) composite filled with concrete. The static flexural performance of the hybrid beam showed it has potential to be used as a structural element. However, the dynamic performance of the hybrid beam has yet to be assessed. If it is to be used as a railway sleeper or bridge girder, it could be subjected to low-velocity impact loading. The aim of this study therefore is to investigate the impact behaviour of the hybrid GFRP-concrete beam under low-velocity impact.
This research comprised multiple experimental and numerical studies on the impact response of the hybrid GFRP-concrete beam subjected to low-velocity impact loading. The impact behaviour study of pultruded GFRP composites indicated that the impact energy level was the main factors that affected the response of the composite. The energy was absorbed mainly through the elastic-plastic deformation and failure mechanisms, such as matrix cracking and delamination. A numerical model was developed to analyse the development and propagation of the stress. The numerical investigation of the hybrid beam to static loading was conducted to validate the material models of the structural elements. The numerical results were highly consistent with the experimental data. Finally, the impact behaviour of the hybrid GFRP-concrete beam to the low-velocity impacts was analysed using experimentation and numerical simulations. The results indicated that the impact response could be divided into two stages, inertial resistance stage and dynamic bending resistance stage. In the former stage, the impact load was resisted completely by the inertial force. The majority of the impact energy was absorbed in the second stage. Multiple failure modes were presented in this stage, such as the punching failure and the global flexural cracks of the concrete, and the shear cracking on the pultruded composites. Declaration relating to disposition of project thesis/dissertation I hereby grant to the University of New South Wales or its agents the right to archive and to make available my thesis or dissertation in whole or in part in the University libraries in all forms of media, now or here after known, subject to the provisions of the Copyright Act 1968. I retain all property rights, such as patent rights. I also retain the right to use in future works (such as articles or books) all or part of this thesis or dissertation. I also authorise University Microfilms to use the 350 word abstract of my thesis in Dissertation Abstracts International (this is applicable to doctoral theses only). ……………………………………………………… Signature
…………………………………………… Witness Signature
……….…………………….......... Date
The University recognises that there may be exceptional circumstances requiring restrictions on copying or conditions on use. Requests for restriction for a period of up to 2 years must be made in writing. Requests for a longer period of restriction may be considered in exceptional circumstances and require the approval of the Dean of Graduate Research. FOR OFFICE USE ONLY
Date of completion of requirements for Award:

COPYRIGHT STATEMENT
‘I hereby grant the University of New South Wales or its agents the right to archive and
to make available my thesis or dissertation in whole or part in the University libraries in
all forms of media, now or here after known, subject to the provisions of the Copyright
Act 1968. I retain all proprietary rights, such as patent rights. I also retain the right to use
in future works (such as articles or books) all or part of this thesis or dissertation.
I also authorise University Microfilms to use the 350 word abstract of my thesis in
Dissertation Abstract International (this is applicable to doctoral theses only).
I have either used no substantial portions of copyright material in my thesis or I have
obtained permission to use copyright material; where permission has not been granted I
have applied/will apply for a partial restriction of the digital copy of my thesis or
dissertation.’
Signed: ................................................................................................
Dated: ................................................................................................
AUTHENTICITY STATEMENT
‘I certify that the Library deposit digital copy is a direct equivalent of the final officially
approved version of my thesis. No emendation of content has occurred and if there are
any minor variations in formatting, they are the result of the conversion to digital format.’
Signed: ................................................................................................
Dated: ................................................................................................

CERTIFICATE OF ORIGINALITY
‘I hereby declare that this submission is my own work and to the best of my knowledge
it contains no material previously published or written by another person, or substantial
portions of material which have been accepted for the award of any other degree or
diploma at UNSW or any other educational institution, except where due
acknowledgment is made in the thesis. Any contribution made to the research by others,
with whom I have worked at UNSW or elsewhere, is explicitly acknowledged in the
thesis. I also declare that the intellectual content of this thesis is the product of my own
work, except to the extent that assistance from others in the project’s design and
conception or in style, presentation and linguistic expression is acknowledged.’
Signed: ................................................................................................
Dated: ................................................................................................

Abstract
iv
Abstract
The combination of two or more materials into a hybrid structural system is
becoming increasingly important in the construction industry. The optimal combination
of the individual materials can result in a system that offers exceptional mechanical and
structural performance. The present study focusses on the design of hybrid beam
consisting of a rectangular hollow pultruded glass fiber reinforced polymer (GFRP)
composites filled with concrete. The hollow pultruded GFRP composites box can protect
the concrete block inside from suffering chemical attacks, while the concrete can provide
the system with bulk size, strength and structural stability.
The results of static bending tests revealed that this hybrid beam has the potential
to be used as structural element. However, the dynamic performance of the hybrid beam
has yet to be assessed. If it is to be used as railway sleeper or bridge girder, it could be
subjected to low-velocity impact or cyclic low-velocity impact loading. The aim of this
study therefore is to investigate the impact behaviour of the hybrid GFRP-concrete beam
under low-velocity impact loading.
In this thesis, an investigation on the impact behaviour of pultruded composites
samples subjected to low-velocity impacts with energies ranging from 17 to 67 J was
conducted. The results showed that the impactor mass had very little effect on the impact
response and the impact energy levels were the main factors that affected the impact
behaviour of the pultruded GFRP composites. The impact response exhibited similar
trends for different impact energy levels and the energy was absorbed mainly through the
elastic-plastic deformation and failure mechanisms, such as matrix cracking and
delamination. The extent of damage increased monotonically with respect to the impact

Abstract
v
energy levels. A non-linear finite element model was developed to analyse the
development and propagation of stress through the effective layers of the composites. The
numerical predictions were found to corroborate the experimental results in terms of load-
time and central deflection-time curves. The numerical results revealed the damage
sequences of the composites under low-velocity impacts and, the stress wave propagated
from an oblong shape into a peanut shape through the top to the bottom surface.
A finite element methodology was developed using the validated composite model
and a concrete model to simulate the static flexural behaviour of the hybrid GFRP-
concrete beam. The numerical predictions were highly consistent with the experimental
results in terms of static performance and load-displacement curve. Multiple failure
mechanisms, such as the fiber tensile failure of the composites, shear cracking of the
concrete and the debonding failure between these materials, were revealed in the
numerical simulation.
The main contribution of this research is the investigation of hybrid GFRP-concrete
beam subjected to low-velocity impact loadings. A series of drop weight tests were
performed to analyse the impact behaviour on both strong and weak axes of the hybrid
GFRP-concrete beams for different impact energy levels. The experimental results
showed that the impact response of the hybrid beam to the low-velocity impacts can be
divided into two stages: namely, inertial resistance and dynamic bending resistance. The
impact characteristics in both stages exhibited similar variation tendencies for the
penetration events. The majority of the energy was absorbed through elastic-plastic
deformation and the failure mechanisms of the hybrid beam in the second stage. A finite
element analysis was performed aiming at validating the numerical results and providing
the details of the failure mechanisms, such as the cracking pattern of the concrete. The

Abstract
vi
numerical results were found to offer high consistency with the experimental data in terms
of load-time and displacement-time curves. Multiple failure mechanisms were revealed
in the numerical simulations: in the inertial stage, the impact load was resisted completely
by the inertial force and no damage was detected during this stage. In the dynamic
bending resistance stage, minor cracks were formed on the bottom side at the first place,
followed by the shear plug in the local impact zone. As the loading process continued,
the impact energies were absorbed through the presence of the global flexural cracks.
Finally, the hybrid beam failed with the presence of the shear cracks (splitting) on the
corners of the pultruded composites. The predicted failure modes showed a good
agreement with the experimental results.

vii
Acknowledgements
First and foremost, I would like to express my very great appreciation to my
supervisors Dr Amar Khennane and Prof Paul Jonathan Hazell, for giving me the
opportunity to work on this project and their continuous support and encouragement
throughout my candidature. Their immense knowledge and insightful guidance helped
me throughout the periods of research and writing this dissertation. They trained me to be
an independent researcher and taught me the very important traits a researcher should
possess. Their valuable and constructive suggestions, untiring supports, precious
discussions and constant encouragements at the various stages throughout the research
work are highly appreciated. Without their support and guidance, this work would not
have been possible.
I am very grateful to A/Prof Alex Remennikov for his guidance on conducting the
dynamic tests in the Laboratory of University of Wollongong. Without his kind supports
and insightful suggestions, this thesis would not be accomplished smoothly.
Sincere gratitude also goes to Dr Juan Pablo Escobedo-Diaz, Dr Andrew David
Brown and Dr Hongxu Wang for helping me in conducting the drop tower tests and their
constructive suggestions.
I grateful acknowledge all the laboratory and workshop staffs from the School of
Engineering and Information Technology at UNSW Canberra and the staffs from the
School of Civil, Mining and Environmental Engineering at UOW for the help in my
experimental programs.

viii
My very special thanks are extended to Mr Jim Baxter and Mr David Sharp from
UNSW Canberra and Mr Alan Grant and Mr Cameron Neilson from UOW for their help
in tackling the experimental challenges.
I would like to thank my colleagues and officemates Biruk Hailu Tekle, Shameem
Ahmed, Yifei Cui, Vishal Naidu, Zhengliang Liu, Rakib Imtiaz Zaman, Ashraful Ismal,
Abdul Kader, Shayani Mendis and Mohammad Anwar-Us-Saadat for their support,
encouragement and friendship.
I am indebted to all my friends in Australia and China for their continuous supports
and friendship throughout my research.
I would like to take this opportunity to express my gratitude to the University of
New South Wales for the emotional and financial support.
Finally, special thanks are due to my parents and all my families for their endless
patience and love, encouragement and untiring support.

ix
Publications related to this thesis
Journal articles
1. LI, Z., KHENNANE, A. & HAZELL, P. J. 2016. Numerical investigation of a
hybrid FRP-geopolymer concrete beam. Applied Mechanics and Materials, 846,
452-457.
2. LI, Z., KHENNANE, A., HAZELL, P. J. & BROWN, A. D. 2017. Impact
behaviour of pultruded GFRP composites under low-velocity impact loading.
Composite Structures, 168, 360-371.
3. LI, Z., KHENNANE, A., HAZELL, P. J. & REMENNIKOV, A. M. 2018.
Performance of a hybrid GFRP-concrete beam subject to low-velocity impacts.
(submitted to Composite Structures).
Conference papers
1. LI, Z., KHENNANE, A., HAZELL, P. J. & REMENNIKOV, A. M. 2017.
Numerical modeling of a hybrid GFRP-concrete beam subjected to low-velocity
impact loading. The 8th International Conference on Computational Methods.
Guilin, Guangxi, China: July 25-29th.

Table of Contents
x
Table of Contents
Abstract ............................................................................................................................ iv
Acknowledgements ......................................................................................................... vii
Publications related to this thesis ..................................................................................... ix
Table of Contents .............................................................................................................. x
List of Figures ................................................................................................................. xv
List of Tables.................................................................................................................. xxi
Abbreviation .................................................................................................................. xxii
List of Symbols ............................................................................................................ xxiii
Chapter 1 Introduction ...................................................................................................... 1
1.1 Background ............................................................................................................. 1
1.2 Objective of research............................................................................................... 5
1.3 Organisation of thesis .............................................................................................. 6
Chapter 2 Review of Types of Railway Sleepers and Bridge Girders .............................. 6
2.1 Introduction ............................................................................................................. 6
2.2 Types of railway sleepers ........................................................................................ 6
2.2.1 Timber sleepers ................................................................................................ 7
2.2.2 Concrete sleepers ............................................................................................. 8
2.2.3 Steel sleepers .................................................................................................... 9
2.3 Types of bridge girders ......................................................................................... 10
2.3.1 Plate girders .................................................................................................... 10
2.3.2 Box girders ..................................................................................................... 10
2.4 Issues of the materials used in railway sleepers and bridge girders ...................... 11

Table of Contents
xi
2.4.1 Timber ............................................................................................................ 11
2.4.2 Concrete ......................................................................................................... 13
2.4.3 Steel ................................................................................................................ 16
2.5 Review of pultruded GFRP composite materials .................................................. 17
2.5.1 Constituents of pultruded GFRP composites ................................................. 17
2.5.2 Fabrication of pultruded GFRP composites ................................................... 18
2.5.3 Characteristics of pultruded GFRP composites ............................................. 19
2.6 The combination of pultruded GFRP composites and concrete............................ 20
2.7 Summary ............................................................................................................... 21
Chapter 3 Review of Impact Behaviour of Concrete and FRP Composites ................... 23
3.1 Introduction ........................................................................................................... 23
3.2 Review of concrete structures subjected to low-velocity impacts ........................ 24
3.2.1 Testing methods ............................................................................................. 24
3.2.2 Failure mechanisms of concrete structures subject to impact loading ........... 28
3.2.3 Strain rate effects of concrete ......................................................................... 34
3.3 Review of FRP composites subjected to low-velocity impacts ............................ 36
3.3.1 Testing methods ............................................................................................. 36
3.3.2 Review of impact behaviour of different types of FRP composites .............. 37
3.3.3 Failure modes of FRP composites to low-velocity impacts ........................... 42
3.3.4 Strain rate effects of FRP composites to low-velocity impacts ..................... 48
3.4 Summary ............................................................................................................... 50
Chapter 4 Experimental Study of Pultruded GFRP Composites to Low-Velocity Impacts
......................................................................................................................................... 51
4.1 Introduction ........................................................................................................... 51
4.2 Material description .............................................................................................. 52
4.3 Test setup and procedures ..................................................................................... 55
4.4 Experimental results and discussion ..................................................................... 58

Table of Contents
xii
4.4.1 Load-time response ........................................................................................ 58
4.4.2 Central deflection-time response.................................................................... 60
4.4.3 Load-displacement response .......................................................................... 62
4.4.4 Impact performance ....................................................................................... 64
4.4.5 Damage evaluation ......................................................................................... 66
4.5 Impactor mass effect ............................................................................................. 68
4.5.1 Load-time response ........................................................................................ 69
4.5.2 Central deflection-time response.................................................................... 70
4.5.3 Load-displacement response .......................................................................... 70
4.5.4 Impact performance ....................................................................................... 71
4.6 Summary ............................................................................................................... 72
Chapter 5 Numerical Study of Pultruded GFRP Composites to Low-Velocity Impacts 74
5.1 Introduction ........................................................................................................... 74
5.2 Finite element model ............................................................................................. 75
5.3 Progressive damage model .................................................................................... 76
5.4 Numerical results .................................................................................................. 86
5.5 Summary ............................................................................................................... 94
Chapter 6 Numerical Study of the Hybrid GFRP-Concrete Beam to Static Loading ..... 96
6.1 Introduction ........................................................................................................... 96
6.2 Description of the experimental program ............................................................. 97
6.3 Finite element model ............................................................................................. 97
6.4 Material models ..................................................................................................... 98
6.4.1 Progressive damage model ............................................................................. 99
6.4.2 Concrete damaged plasticity model ............................................................... 99
6.5 Mesh sensitivity .................................................................................................. 114
6.6 Numerical results ................................................................................................ 116
6.6.1 Fully bonded model ..................................................................................... 116

Table of Contents
xiii
6.6.2 Debonding model ......................................................................................... 117
6.7 Summary ............................................................................................................. 122
Chapter 7 Hybrid GFRP-Concrete Beam Subject to Low-Velocity Impacts:
Experimental Study ....................................................................................................... 124
7.1 Introduction ......................................................................................................... 124
7.2 Specimen preparation .......................................................................................... 125
7.2.1 Description of the hybrid beam .................................................................... 125
7.2.2 Concrete mix composition ........................................................................... 126
7.2.3 Slump test ..................................................................................................... 126
7.2.4 Casting of the hybrid beams ......................................................................... 127
7.2.5 Curing of the hybrid beams .......................................................................... 128
7.2.6 Cylinder tests ................................................................................................ 128
7.3 Test procedures and setup ................................................................................... 131
7.3.1 Test procedures ............................................................................................ 131
7.3.2 Test instrumentation ..................................................................................... 133
7.3.3 Test setup ..................................................................................................... 134
7.4 Experimental results and discussion of the weak axis tests ................................ 136
7.4.1 Failure modes ............................................................................................... 136
7.4.2 Load-time response ...................................................................................... 138
7.4.3 Midspan displacement-time response .......................................................... 140
7.4.4 Impact performance ..................................................................................... 141
7.5 Strong axis tests .................................................................................................. 142
7.5.1 Failure modes ............................................................................................... 142
7.5.2 Load-time response ...................................................................................... 144
7.5.3 Midspan displacement-time response .......................................................... 145
7.5.4 Impact performance ..................................................................................... 146
7.6 Summary ............................................................................................................. 147

Table of Contents
xiv
Chapter 8 Hybrid GFRP-Concrete Beam Subject to Low-Velocity Impacts: Numerical
Study ............................................................................................................................. 149
8.1 Introduction ......................................................................................................... 149
8.2 Finite element model ........................................................................................... 150
8.2.1 Description of the numerical models ........................................................... 150
8.2.2 Material models ............................................................................................ 151
8.3 Numerical results for the strong axis tests .......................................................... 153
8.3.1 Load-time response ...................................................................................... 153
8.3.2 Midspan displacement-time response .......................................................... 155
8.3.3 Failure modes ............................................................................................... 156
8.4 Numerical results for the weak axis tests ............................................................ 161
8.4.1 Load-time response ...................................................................................... 161
8.4.2 Midspan displacement-time response .......................................................... 163
8.4.3 Failure modes ............................................................................................... 163
8.5 Damage sequence analysis .................................................................................. 167
8.6 Comparison studies ............................................................................................. 170
8.6.1 Numerical results of original size beam ....................................................... 171
8.6.2 Numerical results of life-size rail sleepers ................................................... 175
8.7 Summary ............................................................................................................. 178
Chapter 9 Conclusion and Recommendations for Future Work ................................... 180
9.1 Concluding remarks ............................................................................................ 180
9.2 Recommendations for future work ..................................................................... 183
References ..................................................................................................................... 186

List of Figures
xv
List of Figures
Figure 1.1 Different types of hybrid beams (a:
http://www.archiproducts.com/en/products/manni-sipre/mixed-steel-concrete-beam-
and-column-composite-beams_90969; b: Winter et al. (2012); c:Correia et al. (2009)) .. 2
Figure 2.1 Timber sleepers (http://www.railroad-fasteners.com/railway-sleepers.html) . 7
Figure 2.2 Concrete sleepers (http://www.dayaengineering.com/concrete-sleepers-
mono-blocks-2838238.html) ............................................................................................. 8
Figure 2.3 Steel sleepers (a: https://www.coldforge.com.au; b: http://www.peiner-
traeger.de/en/products/product-range.html) ...................................................................... 9
Figure 2.4 Biological failure of timber (By Lamiot - Own work, CC BY-SA 3.0,
https://commons.wikimedia.org/w/index.php?curid=22029957) ................................... 12
Figure 2.5 End splitting of timber sleeper (Ferdous and Manalo, 2014) ........................ 12
Figure 2.6 Effect of sulfate attack (Béton, 1992) ............................................................ 13
Figure 2.7 Effect of alkali silica reactions (Béton, 1992) ............................................... 15
Figure 2.8 Pultrusion process (http://fibrolux.com/main/knowledge/pultrusion/) .......... 19
Figure 3.1 Impact test setup of Wang et al. (1996) ......................................................... 25
Figure 3.2 Impact test setup by Kishi et al. (2002) ......................................................... 26
Figure 3.3 Impact test setup by Fujikake et al. (2009) .................................................... 26
Figure 3.4 Experimental setup by Tachibana et al. (2010) ............................................. 27
Figure 3.5 Experimental setup of Bhatti and Kishi (2010) ............................................. 27
Figure 3.6 Failure modes of Kishi et al. (2002) .............................................................. 29
Figure 3.7 Failure modes of Fujikake et al. (2009) ......................................................... 30
Figure 3.8 Failure modes of Bhatti et al. (2009) ............................................................. 31

List of Figures
xvi
Figure 3.9 Failure modes of Kishi and Bhatti (2010) ..................................................... 32
Figure 3.10 Contact-impact problem of a concrete beam ............................................... 34
Figure 3.11 Impact device (ASTM-D7136, 2012) .......................................................... 37
Figure 3.12 Transverse view of a damage induced 0/90/0 composite plate (Richardson
and Wisheart, 1996) ........................................................................................................ 44
Figure 3.13 Schematic diagram of a matrix crack due to the stress distribution
(Richardson and Wisheart, 1996) .................................................................................... 44
Figure 3.14 Delamination area of a [0/90]s composite plate ........................................... 46
Figure 4.1 Specimen preparation for microscopic examination (a: cylindrical moulds; b:
Struers Tegramin-25 grinding and polishing machine) .................................................. 52
Figure 4.2 ZEISS Axio Imager M2m optical microscope .............................................. 53
Figure 4.3 Microscopic views of pultruded GFRP composites ...................................... 54
Figure 4.4 Test setup ....................................................................................................... 57
Figure 4.5 Impact support fixture.................................................................................... 58
Figure 4.6 Impact force-time curves of four impact energy levels ................................. 60
Figure 4.7 Central deflection-time of four impact energy levels .................................... 61
Figure 4.8 Snapshots of specimen LD3 during the impact test....................................... 62
Figure 4.9 Force-displacement curves of four energy levels .......................................... 64
Figure 4.10 Relationship of maximum load/impact energy and maximum
deflection/impact energy ................................................................................................. 65
Figure 4.11 Comparison of top surfaces for four energy levels ...................................... 67
Figure 4.12 Comparison of bottom surfaces for four energy levels ............................... 67
Figure 4.13 Relationship of damage area in back surface/impact energy....................... 68
Figure 4.14 Load-time curves of three ascending impactor mass ................................... 69
Figure 4.15 Central deflection-time curves of three ascending impactor mass .............. 70

List of Figures
xvii
Figure 4.16 Load-displacement curves of three ascending impactor mass ..................... 71
Figure 5.1 Assembled FEM with boundary conditions .................................................. 76
Figure 5.2 Typical relationship between equivalent stress and displacement ................ 81
Figure 5.3 Schematic diagram of experimental test and numerical simulation in progress
......................................................................................................................................... 86
Figure 5.4 Comparison between numerical and experimental results for force-time at all
impact energies................................................................................................................ 87
Figure 5.5 Comparison of numerical and experimental results for central deflection
versus time curves at all impact energies ........................................................................ 89
Figure 5.6 Comparison of maximum load and central deflection between numerical and
experiment results ........................................................................................................... 89
Figure 5.7 Schematic diagrams of von Mises stress propagation in top layer ................ 91
Figure 5.8 Schematic diagrams of von Mises stress propagation in bottom layer .......... 91
Figure 5.9 Schematic diagrams of Minimum in-plane principal stress propagation in top
layer ................................................................................................................................. 92
Figure 5.10 Schematic diagrams of Maximum in-plane principal stress propagation in
bottom layer .................................................................................................................... 92
Figure 5.11 Schematic diagrams of Tresca stress propagation in top layer .................... 93
Figure 5.12 Schematic diagrams of Tresca stress propagation in bottom layer.............. 93
Figure 5.13 The comparison of experimental and numerical results .............................. 94
Figure 6.1 Schematic diagram of the experimental setup (Ferdous et al., 2013) ............ 97
Figure 6.2 Assembled FEM for the hybrid GFRP-concrete beams ................................ 98
Figure 6.3 Yield surface in plane stress (ABAQUS, 2014) .......................................... 102
Figure 6.4 A typical stress-strain relationship for compressive and tensile behaviour in
CDPM (ABAQUS, 2014) ............................................................................................. 107

List of Figures
xviii
Figure 6.5 Compressive stress-strain curve .................................................................. 111
Figure 6.6 Tensile stress-displacement curve ............................................................... 113
Figure 6.7 Numerical models with different mesh sizes ............................................... 114
Figure 6.8 Computational time (Intel Core i7-3770 @ 3.40GHz) ................................ 115
Figure 6.9 Mesh sensitivity – Failure load .................................................................... 115
Figure 6.10 Comparison between numerical and experimental results for load-
displacement curves (Fully bonded model) .................................................................. 116
Figure 6.11 Typical relationship between traction and separation (ABAQUS, 2014) . 117
Figure 6.12 Comparison between numerical and experimental results for load-
displacement curves (Debonding model) ...................................................................... 120
Figure 6.13 Hashin’s fiber tensile damage view on the bottom side ............................ 121
Figure 6.14 Debonding failure occurring at the bottom side of the interface ............... 121
Figure 6.15 Concrete cracks development .................................................................... 122
Figure 7.1 The cross-sectional dimension of hybrid beam and the microscope view of
the composites ............................................................................................................... 125
Figure 7.2 Concrete slump test ..................................................................................... 127
Figure 7.3 Casting of the hybrid beams ........................................................................ 127
Figure 7.4 Curing of the hybrid beams ......................................................................... 128
Figure 7.5 Cylinders in grinding machine .................................................................... 129
Figure 7.6 Cylinder tests (a: compressive test; b: elastic modulus test; c: indirect tensile
test) ................................................................................................................................ 130
Figure 7.7 High capacity drop-weight impact machine in University of Wollongong . 132
Figure 7.8 High-speed camera ...................................................................................... 133
Figure 7.9 Dynamic loading cell (http://www.interfaceforce.com) .............................. 134
Figure 7.10 Schematic diagram of the experimental setup ........................................... 135

List of Figures
xix
Figure 7.11 Support conditions of the impact tests ....................................................... 135
Figure 7.12 Failure modes at the time of ultimate failure ............................................. 136
Figure 7.13 End slipping of the concrete ...................................................................... 137
Figure 7.14 Shear cracks formed on the contacting surfaces of the profiles ................ 137
Figure 7.15 Loading history for 300 mm dropping height ........................................... 139
Figure 7.16 Loading history for 450 mm dropping height ........................................... 139
Figure 7.17 Loading history for 600 mm dropping height ........................................... 140
Figure 7.18 Midspan displacement curves of three ascending impact energy levels ... 141
Figure 7.19 Failure modes at the time of ultimate failure ............................................. 143
Figure 7.20 Loading histories for the strong axis tests ................................................. 145
Figure 7.21 Midspan displacement curves for strong axis ............................................ 146
Figure 8.1 Assembled FEM with boundary conditions for strong axis tests ................ 151
Figure 8.2 Assembled FEM with boundary conditions for weak axis tests .................. 151
Figure 8.3 Compressive stress-strain relationship curve............................................... 152
Figure 8.4 Tensile stress-strain relationship curve ........................................................ 152
Figure 8.5 Comparison of loading histories for strong axis testing groups .................. 154
Figure 8.6 Comparison of midspan displacement-time curves for strong axis ............. 155
Figure 8.7 Minor flexural cracks formed in the concrete at 1 ms ................................. 156
Figure 8.8 Flexural cracks formed in the concrete at 2 ms ........................................... 157
Figure 8.9 Global flexural cracks formed across the beam ........................................... 157
Figure 8.10 Initial flexural cracks of the concrete at the bottom of the beam .............. 158
Figure 8.11 Local shear plug formed downwards to the bottom surface ...................... 158
Figure 8.12 Global flexural response of the hybrid beam ............................................. 159
Figure 8.13 Vertical flexural cracks formed at supports ............................................... 159
Figure 8.14 Shear cracks formed at the ultimate failure ............................................... 160

List of Figures
xx
Figure 8.15 Schematic diagram of experimental and numerical observations after test
....................................................................................................................................... 160
Figure 8.16 Comparison of loading histories for weak axis tests ................................. 162
Figure 8.17 Comparison of experimental and numerical results for displacement-time
curves ............................................................................................................................ 163
Figure 8.18 Minor cracks formed in the concrete at the centre of the beam................. 164
Figure 8.19 Local shear plug formed in the early dynamic resistance stage ................ 164
Figure 8.20 Global flexural cracks for the weak axis tests ........................................... 165
Figure 8.21 Vertical flexural cracks formed at supports ............................................... 165
Figure 8.22 Shear cracks formed at the ultimate failure for weak axis tests ................ 166
Figure 8.23 A representation of numerical model after the impact loading ................. 166
Figure 8.24 Damage sequence analysis ........................................................................ 169
Figure 8.25 Test setup of Kaewunruen and Remennikov (2009b) ............................... 170
Figure 8.26 Numerical setup of the impact events ........................................................ 171
Figure 8.27 load-time response due to 100 mm drop height......................................... 172
Figure 8.28 Load-time response due to 500 mm drop height ....................................... 172
Figure 8.29 Failure modes due to 100 mm drop height ................................................ 173
Figure 8.30 Failure modes due to 500 mm drop height ................................................ 174
Figure 8.31 Numerical setup of the parametric study ................................................... 175
Figure 8.32 Load-time response of 100 mm drop height for the life-size beam ........... 176
Figure 8.33 Load-time response of 500 mm drop height for the life-size beam ........... 176
Figure 8.34 Failure modes of large size beam due to 100 mm drop height .................. 177
Figure 8.35 Failure modes of large size beam due to 500 mm drop height .................. 178

List of Tables
xxi
List of Tables
Table 4.1 Mechanical properties of the pultruded GFRP composites (Li et al., 2017a) . 54
Table 4.2 Details of test specimens ................................................................................. 55
Table 4.3 Testing results summary ................................................................................. 65
Table 4.4 Testing results summary ................................................................................. 72
Table 5.1 Damage stabilization parameters for pultruded GFRP composites ................ 85
Table 5.2 Material properties of pultruded GFRP composites ....................................... 85
Table 5.3 Damage initiation parameters of pultruded GFRP composites ....................... 85
Table 5.4 Damage evolution parameters for pultruded GFRP composites ..................... 86
Table 6.1 Properties of high performance concrete (Ferdous, 2012) ............................ 108
Table 6.2 Comparison results for different meshes ...................................................... 114
Table 7.1 Mix ingredients for concrete ......................................................................... 126
Table 7.2 Measurement of cylinders after grinding: ..................................................... 129
Table 7.3 Testing results of cylinders: .......................................................................... 131
Table 7.4 Testing results summary ............................................................................... 142
Table 7.5 Testing results summary ............................................................................... 147
Table 8.1 Impact performance of the hybrid beam and prestressed concrete sleepers
(Kaewunruen and Remennikov, 2009b) ....................................................................... 174
Table 8.2 Impact performance of the large size hybrid beam and prestressed concrete
sleepers (Kaewunruen and Remennikov, 2009b).......................................................... 178

Abbreviation
xxii
Abbreviation
AFRP Aramid Fibers Reinforced Polymers
ASTM American Society for Testing and Materials
C3D8R Linear eight-node three-dimensional solid elements with reduced
integration
CDPM Concrete Damaged Plasticity Model
CFRP Carbon Fibers Reinforced Polymers
FEA Finite Element Analysis
FEM Finite Element Model
FRP Fiber Reinforced Polymers
GFRP Glass Fibers Reinforced Polymers
GP General Purpose
OPC Ordinary Portland cement Concrete
R3D4 Four-node three-dimensional discrete rigid elements
RC Reinforced Concrete
SC8R Eight-node quadrilateral in-plane general-purpose continuum shell
elements
List of Symbols
xxiii
List of Symbols
| | absolute value
⟨ ⟩ Macaulay bracket operator
𝑏𝑏 width of concrete
𝑏𝑏𝑓𝑓 width of GFRP composites
𝐶𝐶𝑑𝑑 damaged elasticity matrix
𝐶𝐶𝐸𝐸 specified ratio of impact energy to specimen thickness
C1 a constant value of 3
C2 a constant value of 6.93
𝑑𝑑 calculated damage variable
𝑑𝑑𝑐𝑐 scalar damage variable in compression
𝑑𝑑𝑓𝑓 internal fiber damage variable
𝑑𝑑𝑓𝑓𝑐𝑐 damage variable in fiber compression failure
𝑑𝑑𝑓𝑓𝑡𝑡 damage variable in fiber tension failure
𝑑𝑑𝑖𝑖 diameter of impactor
𝑑𝑑𝑚𝑚 internal matrix damage variable
dmax maximum aggregate size in mm
𝑑𝑑𝑚𝑚𝑐𝑐 damage variable in matrix compression failure
𝑑𝑑𝑚𝑚𝑡𝑡 damage variable in matrix tension failure
𝑑𝑑𝑠𝑠 internal shear damage variable
𝑑𝑑𝑡𝑡 scalar damage variable in tension
𝑑𝑑𝑣𝑣 regularised damage variable

List of Symbols
xxiv
𝑑𝑑�̇�𝑣 true value of the damage variable in the viscous system
𝑑𝑑′ degradation variables
dγvp volumetric shear strain rate
dεvp volumetric strain rate
𝐷𝐷 central deflection
𝐷𝐷𝑒𝑒 damaged elastic stiffness
𝐷𝐷𝑜𝑜𝑒𝑒 undamaged elastic stiffness
𝐸𝐸 potential energy of impactor prior to drop
𝐸𝐸𝑎𝑎𝑎𝑎𝑠𝑠𝑜𝑜𝑎𝑎𝑎𝑎𝑒𝑒𝑑𝑑 absorbed energy
𝐸𝐸𝑐𝑐 Young’s modulus
𝐸𝐸𝐷𝐷 absorbed energy at the point of delamination failure
𝐸𝐸𝑓𝑓 flexural modulus
𝐸𝐸𝑓𝑓′ absorbed energy at the point of fiber failure
𝐸𝐸𝑖𝑖 initial modulus of elasticity
𝐸𝐸𝑖𝑖𝑡𝑡 initial tangent modulus
𝐸𝐸𝑘𝑘𝑖𝑖𝑘𝑘𝑒𝑒𝑡𝑡𝑖𝑖𝑐𝑐 kinetic energy
𝐸𝐸𝑝𝑝 absorbed energy at the point of penetration failure
𝐸𝐸𝑡𝑡𝑜𝑜𝑡𝑡𝑎𝑎𝑡𝑡 initial energy
𝐸𝐸1 Young’s modulus in longitudinal direction
𝐸𝐸2 Young’s modulus in transverse direction
𝑓𝑓𝑐𝑐 compressive stress
𝑓𝑓𝑐𝑐𝑡𝑡𝑚𝑚 the average concrete tensile strength
𝑓𝑓𝑐𝑐′ maximum compressive strength
ft tensile stress

List of Symbols
xxv
𝑓𝑓𝑡𝑡′ maximum tensile strength
𝐹𝐹 damage initiation factor
𝐹𝐹′ yield surface
𝐹𝐹(𝐷𝐷) the force curve (function of deformation)
𝐹𝐹(𝑡𝑡) force acquired by the data acquisition system
𝑔𝑔 gravitational acceleration constant
𝐺𝐺 shear modulus
𝐺𝐺′ plastic potential flow
𝐺𝐺𝐶𝐶 fracture energy
Gf tensile fracture energy
ℎ nominal thickness of the specimen
𝐼𝐼 identity matrix
𝑘𝑘 fitting constant
𝑘𝑘𝑘𝑘𝑘𝑘 stiffness in normal direction
𝑘𝑘𝑠𝑠𝑠𝑠 stiffness in shear direction
𝑘𝑘𝑡𝑡𝑡𝑡 stiffness in through-thickness direction
𝑘𝑘1′ material factor for high strength concrete
𝑘𝑘2′ fitting factor for high strength concrete
𝐾𝐾 bond stiffness matrix
𝐾𝐾𝑐𝑐 the ratio of tensile to compressive meridian stress
𝐿𝐿 unsupported length
𝐿𝐿𝐶𝐶 characteristic length
𝑀𝑀 damage operator
𝑀𝑀𝑎𝑎 maximum value between 0.33 and the ratio of bf/b

List of Symbols
xxvi
𝑀𝑀′ total weight
𝑛𝑛 curve fitting factor
�̅�𝑝 effective hydrostatic pressure
𝑞𝑞𝐶𝐶𝐶𝐶 second stress invariant on the compressive meridian
𝑞𝑞𝑇𝑇𝐶𝐶 second stress invariant on the tensile meridian
𝑞𝑞� effective Mises equivalent stress
𝑟𝑟 weight factor
𝑠𝑠𝑚𝑚 slip under the maximum shear stress
𝑆𝑆𝐿𝐿 shear strength in longitudinal direction
𝑆𝑆𝑇𝑇 shear strength in transverse direction
𝑆𝑆̅ effective stress deviator
𝑡𝑡 time
𝑡𝑡′ specimen thickness
𝑡𝑡𝑘𝑘 nominal traction in the normal direction
𝑡𝑡𝑠𝑠 nominal in-plane shear stress
𝑡𝑡𝑡𝑡 nominal out-plane shear stress
𝑇𝑇 traction stress
𝑤𝑤 width
𝑋𝑋𝐶𝐶 compressive strength in longitudinal direction
𝑋𝑋𝑇𝑇 tensile strength in longitudinal direction
𝑌𝑌𝐶𝐶 compressive strength in transverse direction
𝑌𝑌𝑇𝑇 tensile strength in transverse direction
𝛼𝛼 coefficient that presents the ratio of the shear stress to tension
𝛼𝛼′ dimensionless constant

List of Symbols
xxvii
𝛽𝛽 material parameter that depends on the shape of the stress-strain
diagram
𝛽𝛽′ dimension coefficient
𝛾𝛾 dimensionless material constant
𝛾𝛾𝑓𝑓 fracture energy
𝛿𝛿 displacement of the contacting surfaces
𝛿𝛿𝑒𝑒𝑒𝑒 current state equivalent displacement
𝛿𝛿𝑒𝑒𝑒𝑒𝑓𝑓 equivalent displacement at which the composite material is fully
damaged
𝛿𝛿𝑒𝑒𝑒𝑒𝑓𝑓𝑐𝑐 current equivalent displacement in the post fiber compression
failure
𝛿𝛿𝑒𝑒𝑒𝑒𝑓𝑓𝑡𝑡 current equivalent displacement in the post fiber tension failure
𝛿𝛿𝑒𝑒𝑒𝑒𝑚𝑚𝑐𝑐 current equivalent displacement in the post matrix compression
failure
𝛿𝛿𝑒𝑒𝑒𝑒𝑚𝑚𝑡𝑡 current equivalent displacement in the post matrix tension failure
𝛿𝛿𝑒𝑒𝑒𝑒0 initial equivalent displacement at the point of damage initiated
𝛿𝛿𝑘𝑘 displacement in normal direction
𝛿𝛿𝑠𝑠 displacement in shear direction
𝛿𝛿𝑡𝑡 displacement in through-thickness direction
𝜀𝜀 current strain
𝜀𝜀𝑐𝑐 strain in compression
𝜀𝜀𝑐𝑐′ strain when the compressive strength reaches the maximum value
𝜀𝜀�̃�𝑐𝑝𝑝 equivalent plastic strain in compression
𝜀𝜀�̃�𝑚𝑎𝑎𝑚𝑚𝑝𝑝 maximum eigenvalue of the plastic strain

List of Symbols
xxviii
𝜀𝜀�̃�𝑚𝑖𝑖𝑘𝑘𝑝𝑝 minimum eigenvalue of the plastic strain
𝜀𝜀�̃�𝑡𝑝𝑝 equivalent plastic strain in tension
𝜀𝜀11 principal strain in longitudinal direction
𝜀𝜀12 principal shear strain
𝜀𝜀22 principal strain in transverse direction
𝜀𝜀𝑒𝑒 elastic strain
𝜀𝜀𝑖𝑖𝑘𝑘 inelastic strain
𝜀𝜀𝑝𝑝 plastic strain
𝜀𝜀̇𝑝𝑝 plastic strain increment
𝜀𝜀𝑡𝑡 total strain
𝜂𝜂 viscosity coefficient controlling the rate of relaxation time
�̇�𝜆 proportionality coefficient
𝑣𝑣12 Poisson’s ratio in longitudinal direction
𝑣𝑣21 Poisson’s ratio in transverse direction
𝜋𝜋 mathematical constant
𝜎𝜎 true normal or shear stress
𝜎𝜎� effective stress in the damaged material model
𝜎𝜎�� effective stress tensor
𝜎𝜎′ stress in the concrete elements
𝜎𝜎𝑎𝑎0 initial equibiaxial compressive yield stress
𝜎𝜎𝑐𝑐 current compressive stress
𝜎𝜎𝑐𝑐0 initial uniaxial compressive yield stress
𝜎𝜎�𝑐𝑐 effective uniaxial stress in compression
𝜎𝜎�𝑐𝑐(𝜀𝜀�̃�𝑐𝑝𝑝) effective compressive cohesion

List of Symbols
xxix
𝜎𝜎𝑒𝑒𝑒𝑒𝑓𝑓𝑐𝑐 current equivalent stress in the post fiber compression failure
𝜎𝜎𝑒𝑒𝑒𝑒𝑓𝑓𝑡𝑡 current equivalent stress in the post fiber tension failure
𝜎𝜎𝑒𝑒𝑒𝑒𝑚𝑚𝑐𝑐 current equivalent stress in the post matrix compression failure
𝜎𝜎𝑒𝑒𝑒𝑒𝑚𝑚𝑡𝑡 current equivalent stress in the post matrix tension failure
𝜎𝜎𝑓𝑓 flexural strength
𝜎𝜎��𝑖𝑖 principal stress
𝜎𝜎��𝑚𝑚𝑎𝑎𝑚𝑚 maximum effective principal stress
𝜎𝜎𝑡𝑡 current tensile stress
𝜎𝜎�𝑡𝑡 effective uniaxial stress in tension
σt0 uniaxial tensile stress at failure
𝜎𝜎�𝑡𝑡(𝜀𝜀�̃�𝑡𝑝𝑝) effective tensile cohesion
𝜎𝜎11� effective normal stress in longitudinal direction
𝜎𝜎22� effective normal stress in transverse direction
𝜏𝜏 interlaminar shear strength (ILSS)
𝜏𝜏′ shear stress
𝜏𝜏𝑚𝑚 maximum shear stress
𝜏𝜏12 tangential strain
𝜏𝜏12� effective shear stress
Ψ dilation angle
ω crack opening displacement
ωc crack opening displacement at the complete release of stress
ϵ eccentricity parameter

Chapter 1
Introduction
1.1 Background
The combination of two or more materials into a hybrid structural system is
becoming increasingly important in the construction industry. The optimal combination
of these materials can utilise the demand characteristics of each one of them in the place
where they perform best. This results in an optimised structural system that performs to
the best of its abilities and achieves the criteria it was designed for.
The most commonly used materials are timber, steel, fiber reinforced polymers
(FRP), and concrete. Figure 1.1 shows some examples of hybrid structures. These hybrid
structures typically consist of a combination of the mentioned common materials chosen
for their inherent qualities such as strength, durability, cost, aesthetic, and so on. They are
chosen to provide simple, buildable and competitive high-quality structures that offer
consistent performance. It is not surprising, therefore, that hybrid structures constitute the
current trend in construction. Indeed, combining materials is essential to achieve
performance targets such as durability, sustainability, a lower carbon footprint, seismic
resistance, and architectural appeal, just to cite a few; in other words, to achieve a
performance based design, which is the current approach in modern design and
construction.

Chapter 1 - Introduction
2
Figure 1.1 Different types of hybrid beams (a:
http://www.archiproducts.com/en/products/manni-sipre/mixed-steel-concrete-beam-
and-column-composite-beams_90969; b: Winter et al. (2012); c:Correia et al. (2009))
Depending on the prescribed performance targets, different hybrid structural
systems have been proposed in the literature. Seismic resistance, sustainability, rapid
construction, and a low carbon footprint can be achieved by combining timber with other
materials. It is the approach favoured in Japan and New Zealand (Sakamoto et al., 2001,
Buchanan et al., 2008). Timber is not only very light but also serves as a carbon sink,
while steel, for example, ensures dissipation of energy through ductility, which can be
found commonly in hybrid steel-concrete structures or hybrid steel-FRP composite
structures (Tavakkolizadeh and Saadatmanesh, 2003, Nie et al., 2004, Teng et al., 2007,
Zhao and Zhang, 2007, Teng et al., 2012, Feng et al., 2015, Satasivam and Bai, 2016).
However, the real drives behind the development of hybrid structures are by far the
technical progress achieved in composites materials and the deteriorating world
infrastructure. Composites materials offer many advantages such as low weight, excellent
durability, impact resistance, high strength to weight ratio, and design flexibility. The
latter makes them particularly suitable to be combined with each other (Harris et al., 1998,

Chapter 1 - Introduction
3
Hejll et al., 2005, Hai et al., 2010) or with other materials when designing hybrid
structures for durability (Van Erp et al., 2002, Keller et al., 2007, Correia et al., 2007b,
Sá et al., 2016).
The present study focusses on the design of hybrid beam consisting of a rectangular
hollow pultruded glass fiber reinforced polymer (GFRP) composites filled with concrete.
The aim is to study its suitability as a railway sleeper or as bridge girder by studying its
dynamic behaviour under low-velocity impact. The combination of concrete and
pultruded GFRP composites in a hybrid beam can utilise the desired properties of each
material in a more efficient way. The pultruded GFRP composites with larger strength
(tensile in particular) are placed further to the neutral axis and the GFRP composites in
compression is restrained by the concrete core (therefore preventing lateral buckling).
Moreover, the hollow pultruded GFRP composites box protects the concrete block inside
from suffering chemical attacks, while the concrete provides the system with bulk size,
strength and structural stability. Concrete has been shown to offer excellent mechanical
performance when combined with FRP in a hybrid beam (Deskovic et al., 1995, Canning
et al., 1999, Hulatt et al., 2003, Khennane, 2009, Chakrabortty et al., 2011, Ferdous et al.,
2015). In addition, pultruded GFRP profiles offer a distinct advantage in that they are
economically affordable for construction applications (Zureick and Scott, 1997, Li et al.,
2017a). As a result, they are being used in many infrastructure applications (Bank and
Gentry, 2001, Williams et al., 2003, Neely et al., 2004, Lee et al., 2007, Liu et al., 2008,
Chakrabortty et al., 2011, Ferdous et al., 2015).
Ferdous (2012) performed a series of four-point bending static tests to investigate
the static flexural behaviour of the hybrid pultruded GFRP composites-concrete beam.
The results revealed that this hybrid beam has the potential to be used as railway sleeper

Chapter 1 - Introduction
4
(Ferdous et al., 2015) or girder in short span bridges. However, the dynamic performance
of the hybrid beam has yet to be assessed. The current standard of design of railway
sleepers only focus on the results from the static and quasi-static tests, no design codes
based on the impact scenarios were specified (Standards, 2003a). As summarized by
Murray and Cai (1998), the major cause of the damage to the railway sleepers is the
infrequent but high magnitude impact loads. When the proposed hybrid beam is used as
railway sleeper, it could be subjected to low-velocity impact or cyclic low-velocity impact
loading caused by the imperfections of wheel and rail or the wheel-track interactions
(Kumaran et al., 2003, Kaewunruen and Remennikov, 2009a). The magnitude of these
impact loads could be over 400 kN per railseat with the duration last from 1 to 10 ms
(Kaewunruen and Remennikov, 2009b). On the other hand, if this hybrid beam is to be
used as bridge girder, it could be subjected to accidental low-velocity impact loads caused
by traffic accidents or flood-induced impacts (Kim et al., 2008, Prasad and Banerjee,
2013). Most design codes and standards for the bridge girder use different values (impact
factor) to transfer the impact loads as additional static loads. For example, AASHTO (the
American Association of State Highway and Transportation Officials) specify the value
of impact factor as a function of the span length (Aashto, 1998), in NAASRA (National
Association of Australian State Road Authorities) and Canadian Highway bridge design
codes (Specification.NAASRA, 1976, Canadian.Standards.Association, 2006), the
impact factor values are expressed as the function of the flexural frequency of the bridge.
The design codes with considering the accidental impact loads have not been established
yet in any of above standards. So far, very limited research has been done to investigate
the impact response of the hybrid GFRP-concrete beam as a railway sleeper or bridge
girder. The knowledge of the failure mechanisms and failure modes of the hybrid GFRP-
concrete beam and the interaction between the pultruded GFRP composites and the

Chapter 1 - Introduction
5
concrete under impact loading is limited. Hence, the aim of this research is to investigate
the impact performance of the hybrid GFRP-concrete beam, to detect the failure modes
and understand the failure mechanisms of the hybrid beam subjected to low-velocity
impacts.
1.2 Objective of research
The aim of this research is to investigate the impact behaviour of a hybrid pultruded
GFRP composites-concrete beam subjected to low-velocity impact loading. To achieve
this research goal, multiple experimental and numerical investigations were conducted.
The scope of this research is listed as follows:
• To investigate the impact behaviour of pultruded GFRP composites subjected to
low-velocity impact loading by using the drop tower testing machine;
• To investigate the effects of impact energy levels and impactor weights to the
dynamic performance of pultruded GFRP composites;
• To develop a numerical model using finite element to analyse the propagation of
a stress wave;
• Conduct experimental investigations to study the impact behaviour of hybrid
GFRP-concrete beam subjected to low-velocity impacts by using the high
capacity drop weight machine; and
• To simulate the behaviour of the hybrid beam during impact and understand the
details of the recorded failure mechanisms.

Chapter 1 - Introduction
6
1.3 Organisation of thesis
The content of this thesis is presented in nine chapters. The present chapter provides
an introduction stating the significance and layout of this research.
Chapter 2 reviews the existing materials used for railway sleepers and bridge
girders and their specific shortcomings. The mechanical properties of the pultruded GFRP
composites are also discussed.
Chapter 3 is devoted to the review of the failure mechanisms of concrete and FRP
composites subjected to low-velocity impacts. A critical review of the literature is
presented in order to identify the gaps in knowledge.
In Chapter 4, an experimental investigation into the impact behaviour of pultruded
GFRP composites subjected to low-velocity impact loading is presented. The effects of
impact energy levels and impactor weights are investigated. The results of impact
characteristics, impact performance and damage evaluation are discussed in detail.
Chapter 5 presents a numerical simulation of the behaviour of pultruded GFRP
composites subjected to low-velocity impacts. The obtained results are compared with
the experimental ones reported in Chapter 4. The mechanisms of the progressive damage
model are described in detail.
In Chapter 6, the validated FRP model from Chapter 5 is used with a suitable
concrete model to conduct a numerical investigation of the static behaviour of a hybrid
GFRP-concrete beam. The input parameters of the FRP model, such as damage initiation,
evolution parameters, and the fracture properties of the GFRP composites, obtained from
the preceding chapter are used to describe the pultruded composites. The mechanisms and
input parameters of the concrete model are described in detail. The numerical results are

Chapter 1 - Introduction
7
compared with experimental data, and the verified model is used to present a reference
setup parameters for the experimental program of impact tests on hybrid beams.
Chapter 7 is devoted to the experimental investigation of the impact behaviour of
hybrid GFRP-concrete beam subjected to low-velocity impact loading. The impact
characteristics and performance are compared for different impact energy levels, and the
Experimentation alone does not reveal the failure modes of the concrete hidden
inside the pultruded profile. Details such as the cracking pattern of the concrete and the
damage sequences of the hybrid beam can only be understood through numerical analysis.
For this purpose, numerical models of hybrid GFRP-concrete beams subjected to low-
velocity impact loading are developed in Chapter 8. The numerical results are compared
with the experimental ones. The verified model is used to understand the details of the
failure mechanisms during the impact events.
Finally, Chapter 9 presents the concluding remarks of this research together with
some recommendations for future work.

Chapter 2
Review of Types of Railway Sleepers and
Bridge Girders
2.1 Introduction
In this chapter, different types of materials used in the manufacture of railway
sleepers and bridge girders and their respective shortcomings are discussed. Also included
is the review of pultruded GFRP composite materials and the advantages of the proposed
hybrid GFRP-concrete beam. This review will help in identifying the issues with the
existing materials and expanding on the advantages of the combination of pultruded
GFRP composites and concrete.
2.2 Types of railway sleepers
Railway sleepers are one major component amongst a railway track system. They
are transverse beams laid in ballast to provide supports for the rails. The key functions of
sleepers are to uniformly transfer loads to the ballast bed, to keep the rails in position and
hold the rails at the correct gauge (Kaewunruen and Remennikov, 2008).
So far, more than 2.5 billion railway sleepers have been installed in the world
(Manalo et al., 2010). Among the large number of railway sleepers, the majority are made
from timber, followed by concrete and steel. The specific characteristics of each type of
railway sleepers are discussed in the following sections.

Chapter 2 - Review of Types of Railway Sleepers and Bridge Girders
7
2.2.1 Timber sleepers
Timber sleepers have been used for centuries in the railway industry. Even today,
the majority of railway sleepers are made from timber. Timber sleepers are normally
made from hardwood, such as oak wood and jarrah wood. For some less heavy traffic
routes, treated softwood, like pinewood and Douglas fir wood, have been applied for
sleepers (Hay, 1982). The main advantages of timber sleepers are their affordability,
workability and adaptability. Timber sleepers are relatively cheaper to produce than other
types of sleepers (Mitchell et al., 1987). Timber is available in most parts of the world
and the manufacture technology and labour costs are comparatively low. Moreover,
timber is lighter than other types of materials used for sleepers. It is easy to handle and
install in the railway system. In addition, timber sleepers can be applied in most of railway
environments (Manalo et al., 2010).
Figure 2.1 Timber sleepers (http://www.railroad-fasteners.com/railway-sleepers.html)

Chapter 2 - Review of Types of Railway Sleepers and Bridge Girders
8
2.2.2 Concrete sleepers
Currently, concrete sleepers are commonly used in modern high-speed railway
track lines. In general, the production process of concrete sleepers is similar to that of
reinforced concrete beams. The sleepers are composed of concrete blocks with steel
reinforcements installed internally (Kaewunruen, 2007). Compared to timber sleepers,
concrete sleepers are more durable and stable, and require less maintenance (Manalo et
al., 2010). Unlike timber, concrete is not sensitive to the change of environment. Concrete
sleepers are immune to insect infestation and have a much better fire resistance to keep
themselves withstand fire hazards than timber sleepers. Furthermore, concrete sleepers
are much heavier than timber sleepers; their great weight can maintain themselves in the
correct position and improve the stability of the track system during the service (Manalo
et al., 2010).
Figure 2.2 Concrete sleepers (http://www.dayaengineering.com/concrete-sleepers-
mono-blocks-2838238.html)

Chapter 2 - Review of Types of Railway Sleepers and Bridge Girders
9
2.2.3 Steel sleepers
Steel sleepers have been applied increasingly in low-speed railway lines. Currently,
over 13% of railway sleepers are made from steel in Australia (Manalo et al., 2010). There
are two types of steel sleepers in railway systems, as shown in Figure 2.3. Traditional
steel sleepers are trough-shaped pressed steel plates with spade-shaped ends on both
sides. Y shape steel sleepers include two adjacent steel sleepers, with I-shaped beam in
section, form into “Y” shape arrangement instead of parallel arrangement. The major
advantage of steel sleepers is their adaptability. Compared to other types of sleepers like
concrete sleepers, steel sleepers are lighter and easier to handle and install. In addition,
steel sleepers require much less ballast to support than concrete and timber sleepers do.
Figure 2.3 Steel sleepers (a: https://www.coldforge.com.au; b: http://www.peiner-
traeger.de/en/products/product-range.html)

Chapter 2 - Review of Types of Railway Sleepers and Bridge Girders
10
2.3 Types of bridge girders
Girders are the main supports for the deck in a bridge. Generally, they are parallel-
aligned beams laid under the bridge deck. The major function of bridge girders is to
transfer the load from the deck to the bridge foundation. There are two common types of
girders used in bridge design, plate girders and box girders. The specific characteristics
of each type are discussed in the following sections.
2.3.1 Plate girders
In general, plate girders are I-shaped beams in cross-section. Two common types
of plate girders can be found in modern bridge design, concrete plate girders and steel
plate girders. Concrete plate girders are made of high strength concrete with steel or other
reinforcements, while for the steel plate girders, they are fabricated from structural steel
and welded together to form into the required shape (Hirol, 2008). The sections of plate
girders are not limited to a standard stipulation. The depth and dimensions of the sectional
design can be changed in respect to the changes of the applications. As a result, the plate
girders can be applied for both short and long spans. However, the I-shaped steel beams
are not able to provide sufficient torsion stiffness for some particular cases. To the address
of limited torsional stiffness, two common design preferences are used in modern bridge
design. One is the use of bracing systems and/or stringer beams, and the other is using
box girders structures.
2.3.2 Box girders
Box girders are rectangular (or trapezoidal) hollow box beams. They are normally
constructed of prestressed concrete, structural steel or the combination of reinforced
concrete and structural steel (Sennah and Kennedy, 2002). For concrete box girders, the
girders are normally cast in situ or precast in segments and are emplaced into a complete

Chapter 2 - Review of Types of Railway Sleepers and Bridge Girders
11
set of structure. For steel box girders, the girders are usually fabricated off-site and are
assembled during the construction of the bridge. Compared to plate girders, box girders
can provide an excellent torsion performance. However, they are more difficult to
transport and erect due to their large dimensions.
2.4 Issues of the materials used in railway sleepers and
bridge girders
Despite the advantages mentioned in previous sections, some issues associated with
the materials could have detrimental effects on the performance and durability of the
structures.
2.4.1 Timber
The major problem in using timber for structural elements is that they are
susceptible to creep, biological and mechanical degradation, which can eventually lead to
the failure of the structure (Qiao et al., 1998).
Fungal decay and insect infestation are the two most common manifestations of
biological degradation in timber, as shown in Figure 2.4. To prevent biological attacks,
the majority of timber sleepers are soaked in chemical preservatives such as creosote
(Pruszinski, 1999). However, there is a growing concern about the use of chemical
preservatives in timber. As timber sleepers are gradually replaced, the discarded sleepers
constitute a threat to the environment and health, which should be treated as hazardous
waste (Thierfelder and Sandstrom, 2008).

Chapter 2 - Review of Types of Railway Sleepers and Bridge Girders
12
Figure 2.4 Biological failure of timber (By Lamiot - Own work, CC BY-SA 3.0,
https://commons.wikimedia.org/w/index.php?curid=22029957)
End splitting is a major failure mode of mechanical degradation in timber, as shown
in Figure 2.5. The majority of end splitting failure of timber sleepers are caused by the
transverse shear loadings on the timber beams (Hibbeler, 2004).
Figure 2.5 End splitting of timber sleeper (Ferdous and Manalo, 2014)

Chapter 2 - Review of Types of Railway Sleepers and Bridge Girders
13
2.4.2 Concrete
The durability of concrete, when exposed directly to the environment, is a major
concern in civil engineering applications. The deterioration of concrete, such as potholes,
cracking and spalling, may occur within 10 years or sooner if the concrete structures were
not properly designed and/or constructed (Foster et al., 2000). The two major causes of
deterioration of concrete are sulfate attack and alkali silica reactions (Fenwick and
Rotolone, 2003).
2.4.2.1 Sulfate attack
Concrete can deteriorate as the result of sulfate attack when it is exposed to the
sulfate sources from the environment. Sulfate attack is a destructive process in which the
expansive reaction products are formed inside the concrete. The expansive reaction
products can lead to cracks in the concrete, as shown in Figure 2.6 (Béton, 1992).
Figure 2.6 Effect of sulfate attack (Béton, 1992)

Chapter 2 - Review of Types of Railway Sleepers and Bridge Girders
14
In general, sulfate attack can be categorised into two major sulfate reactions. The
first reaction is that the external sulfate ions (SH) penetrate the concrete and react with
the tricalcium aluminate (C3A) and its hydration products to form ettringite (C6AS3H32)
(Tian and Cohen, 2000). The sum of this reaction can be represented by:
𝑆𝑆𝑆𝑆 + 𝐶𝐶3𝐴𝐴 + 𝐶𝐶𝐶𝐶𝑆𝑆𝑂𝑂4 ∙ 2𝑆𝑆2𝑂𝑂 → 𝐶𝐶6𝐴𝐴𝑆𝑆3𝑆𝑆32
The second reaction is that the external sulfate ions penetrate the concrete and react
with the calcium hydroxide (CH) to form gypsum (CSH2). The formed gypsum reacts
with the tricalcium aluminate to form ettringite (Tian and Cohen, 2000). The mechanism
of the second reaction can be represented by:
𝑆𝑆𝑆𝑆 + 𝐶𝐶𝑆𝑆 → 𝐶𝐶𝑆𝑆𝑆𝑆2
𝐶𝐶3𝐴𝐴 + 3𝐶𝐶𝑆𝑆𝑆𝑆2 + 26𝑆𝑆 → 𝐶𝐶6𝐴𝐴𝑆𝑆3𝑆𝑆32
2.4.2.2 Alkali silica reactions
In contrast to sulfate attack, where the chemical reactions are acting on the
substance in the cement, alkali silica reactions occur only in the aggregates (Béton, 1992).
Alkali silica reactions are the swelling reactions occurring between the alkali solution or
paste and the reactive silica components in aggregates (Ichikawa and Miura, 2007). Alkali
silica reactions can cause spalling, and eventually lead to the failure of the concrete
structures. Figure 2.7 shows the effect of alkali silica reactions in concrete.

Chapter 2 - Review of Types of Railway Sleepers and Bridge Girders
15
Figure 2.7 Effect of alkali silica reactions (Béton, 1992)
The mechanism of alkali silica reactions can be explained as follows: the alkalis
(NaOH or KOH) from the environment or within the pore system diffuse into the concrete
and react with the silica acid (H4SiO4) from the aggregates to form disodium dihydrogen
silicate hydrates (Na2H2SiO4) or dipotassium dihydrogen silicate hydrates (K2H2SiO4).
The formed products then react with calcium hydroxide (Ca(OH)2) to form the hydrated
calcium silicates (CaH2SiO4.2H2O) (Béton, 1992). During the reactions, the colloidal
sodium silicate can get swelling when absorbing the water from the environment, which
results in the cracking in the concrete. The sum of alkali silica reactions can be expressed
in the following chemical equations:
2𝑁𝑁𝐶𝐶(𝑂𝑂𝑆𝑆) + 𝑆𝑆4𝑆𝑆𝑆𝑆𝑂𝑂4 → 𝑁𝑁𝐶𝐶2𝑆𝑆2𝑆𝑆𝑆𝑆𝑂𝑂4 ∙ 2𝑆𝑆2𝑂𝑂
𝑁𝑁𝐶𝐶2𝑆𝑆2𝑆𝑆𝑆𝑆𝑂𝑂4 ∙ 2𝑆𝑆2𝑂𝑂 + 𝐶𝐶𝐶𝐶(𝑂𝑂𝑆𝑆)2 → 𝐶𝐶𝐶𝐶𝑆𝑆2𝑆𝑆𝑆𝑆𝑂𝑂4 ∙ 2𝑆𝑆2𝑂𝑂 + 2𝑁𝑁𝐶𝐶𝑂𝑂𝑆𝑆

Chapter 2 - Review of Types of Railway Sleepers and Bridge Girders
16
Based on the results of the reactions, the presence of alkali hydroxides can be
considered as the catalyst. Thus, the mechanism of this reaction can be simplified as
follows:
𝐶𝐶𝐶𝐶(𝑂𝑂𝑆𝑆)2 + 𝑆𝑆4𝑆𝑆𝑆𝑆𝑂𝑂4 → 𝐶𝐶𝐶𝐶𝑆𝑆2𝑆𝑆𝑆𝑆𝑂𝑂4 ∙ 2𝑆𝑆2𝑂𝑂
2.4.3 Steel
The major concern in using steel for railway sleepers or bridge girders is that they
are susceptible to corrosion. The corrosion of steel is a destructive process in which the
expansive products are formed in the steel structures (Schweitzer, 2009). The corrosion
of steel cannot only lead to the financial cost of repairment or replacement, but also pose
a threat to the safety of the structure.
The mechanism of the corrosion of steel can be explained as follows: when the steel
is in contact with the moisture and oxygen from the environment, the iron (Fe) from the
steel decomposes into ferrous ions (Fe++) and electrons (e-). Simultaneously, the released
electrons react with water (H2O) and oxygen (O2) to form hydroxyl ions (OH-). The
produced ferrous ions further react with the hydroxyl ions to form ferrous hydroxide
(Fe(OH)2). Parts of the produced ferrous hydroxide react with water and oxygen to form
hydrated ferric oxide (Fe2O3.nH2O). The sum of these reactions can be simplified as:
𝐹𝐹𝐹𝐹 + 𝑂𝑂2 + 𝑆𝑆2𝑂𝑂 → 𝐹𝐹𝐹𝐹2𝑂𝑂3 ∙ 𝑛𝑛𝑆𝑆2𝑂𝑂
Besides the fear of corrosion, another limitation of steel being used as sleeper
material is the electric insulation problem, which may pose a potential safety issue during
the service or maintenance.

Chapter 2 - Review of Types of Railway Sleepers and Bridge Girders
17
2.5 Review of pultruded GFRP composite materials
Over the past decades, fiber reinforced polymer (FRP) composite materials have
been developed and proposed as railway sleepers (Qiao et al., 1998, Miura et al., 1998,
Ferdous et al., 2015) and bridge girders (Stallings et al., 2000, Aidoo et al., 2004, Wang
et al., 2007, Ahmed et al., 2009). Compared to traditional materials like steel and
reinforced concrete, FRP materials are not only immune to corrosion, but they also offer
a low weight-to-strength ratio (Li et al., 2017a). The high initial costs however limits the
use of FRP materials in the construction industry. To address this issue, large volume
automated processes such as pultrusion and filament winding have been developed.
Besides the mentioned advantages of FRP materials, pultruded glass fiber reinforced
polymer (GFRP) composites manufactured through the pultrusion process offer another
advantage in that they are economically affordable for construction applications (Li et al.,
2017a). As a result, the pultruded GFRP composites are considered as an ideal material
to be used in infrastructure. The constituents, fabrication process and the material
characteristics of pultruded GFRP composites are discussed in the following sections.
2.5.1 Constituents of pultruded GFRP composites
The major constituents of pultruded GFRP composites are glass fibers and matrix.
Glass fibers are small diameter fibers made by the extrusion of silica-based glass. The
most common types of glass fibers are E-glass and S-glass. These fibers typically offer
high strength and modulus in terms of mechanical properties. However, when used on
their own, they are unable to provide effective compressive or shear capacities (Hollaway,
1980). The most commonly used resins are thermosetting and thermoplastic resins. The
resin systems can provide excellent thermoresistance and chemical resistance but have a
low strength and modulus in terms of mechanical properties. However, when reinforced

Chapter 2 - Review of Types of Railway Sleepers and Bridge Girders
18
by fibers in a hybrid composite system, they have shown to offer exceptional performance
as a combination (Holmes and Just, 1983).
In a FRP composite structure, fibers are the main load-carrying constituent, which
provide the majority of the strength and stiffness for the composites (Richardson and
Wisheart, 1996). The matrix, on the other hand, provides the protection for the fibers from
damaging themselves and environmental attacks, and aligns the fibers in the desired
direction. It also plays the role of a transmitting vector by transferring the load to the
fibers (Hollaway, 2001).
2.5.2 Fabrication of pultruded GFRP composites
The manufacture of pultruded GFRP composites can be divided into multiple
stages. First, glass fibers and a continuous filament mat are pulled from separate racks
and sent into the resin bath. Second, the combination of glass fibers, mat and resin is
pulled into a preforming system to form the combination into the desired shape. Third, a
surface veil is added to provide a smooth surface and erosion resistance. Then, the
combination is pulled through a heated curing die (which process is also called
polymerization). Next, an extrusion-forming machine (also called pulling system) is
employed to form the products into a permanent shape. Lastly, a cut-off saw is used to
cut the products into the desired length at the end of the pultrusion process (Meyer, 1985,
Campbell, 2003). Figure 2.8 shows the schematic diagram of a typical pultrusion process.

Chapter 2 - Review of Types of Railway Sleepers and Bridge Girders
19
Figure 2.8 Pultrusion process (http://fibrolux.com/main/knowledge/pultrusion/)
2.5.3 Characteristics of pultruded GFRP composites
A complete pultruded GFRP composites product (also called pultruded GFRP
profile) contains two types of effective layers, roving and mat layer. The majority of glass
fibers are laid in the longitudinal direction in the roving layers, which results in a high
tensile strength and stiffness in the longitudinal direction. On the other hand, the
continuous filament mat is applied in the mat layers, which improves the transverse
properties of the pultruded GFRP composite. The detailed advantages and disadvantages

Chapter 2 - Review of Types of Railway Sleepers and Bridge Girders
20
of pultruded GFRP composites are listed as follows (Meyer, 1985, Campbell, 2003,
Correia et al., 2007a, Witcher, 2009, Gonilha et al., 2013, Li et al., 2017a):
Advantages:
a. High strength-to-weight ratio;
b. Economically affordable for construction applications;
c. Excellent erosion resistance;
d. Excellent corrosion resistance;
e. Stable electric insulation;
f. High impact resistance;
g. Spark-free material; and
h. Ease of installation.
Disadvantages:
a. Constant cross-section shape;
b. High initial cost;
c. High deformability;
d. Brittle failure; and
e. Combustibility and poor fire resistance.
2.6 The combination of pultruded GFRP composites
and concrete
When used as structural elements on their own, pultruded GFRP composites suffer
from the high deformability, the brittle failure and the susceptibility to instability (Correia
et al., 2007a, Gonilha et al., 2013, Li et al., 2017b). The limitations of the single material
have inspired researchers to look for a more efficient system, such as the combination of

Chapter 2 - Review of Types of Railway Sleepers and Bridge Girders
21
two or more materials into a hybrid system. The combination of pultruded GFRP
composites and concrete seems to be an ideal combination particularly for applications
as railway sleepers and/or bridge girders. Concrete is considered as the most successful
material due to its affordability and excellent compressive performance. Secondly,
pultruded GFRP composites are immune to corrosion and chemical attacks, and they are
capable of providing satisfactory tensile strength for the hybrid system. Moreover, closed
pultruded profiles can protect the concrete from the erosion by the water and sulfate
solutions from the environment, which are the necessary components for the sulfate attack
and alkali silica reactions of the concrete. Lastly, concrete is a high stiffness, ductile and
heavy material, the concrete block cast inside the pultruded profile can overcome its high
deformability, brittle failure and instability problems. As a result, the combination of
pultruded profiles and concrete in a hybrid system can utilise the desired physical and
mechanical properties of each material in a more efficient way.
2.7 Summary
In this chapter, the descriptions of different types of materials used for railway
sleepers and bridge girders have been reviewed. It was found that when the traditional
materials (timber, concrete and steel) are used as structural elements, the durability and
performance of the structure could be affected by the weaknesses of these materials, such
as biological degradation, chemical attacks and corrosion. Alternative materials, such as
pultruded GFRP composites, could be an option to overcome the limitations of these
traditional materials. However, the use of pultruded composite materials brings new
issues, such as the high deformability, brittle failure, and instability. The alternative is to

Chapter 2 - Review of Types of Railway Sleepers and Bridge Girders
22
combine these materials in a hybrid system as to overcome the deficiencies of each one
of them.
In this research, a hybrid beam made of a rectangular hollow pultruded GFRP
composites filled with concrete was chosen. The presence of the pultruded profile can
protect the concrete from chemical attacks and improve the tensile performance of the
structure. On the other hand, the concrete block can overcome the issue of instability and
high deformability and improve the compressive performance of the structure. The
combination of these two materials utilises the desired properties of each material in the
place where they perform the best.

Chapter 3
Review of Impact Behaviour of Concrete
and FRP Composites
3.1 Introduction
Ferdous et al. (2015) developed a hybrid system for use as a railway sleeper. The
results from the static flexural behaviour tests revealed that the hybrid sleeper possesses
all the necessary attributes of strength and stiffness. However, the dynamic behaviour was
not studied. Indeed, when used as a railway sleeper or bridge girder, the hybrid beam can
be subjected to low-velocity impacts during its service life. Therefore, it is of vital
importance to investigate the impact behaviour of the hybrid GFRP-concrete structure.
So far, to the author’s knowledge there has never been a study on the impact
behaviour of hybrid pultruded GFRP composites-concrete beams. The failure modes of
the hybrid structure and/or the interaction between the two materials during impact events
are yet to be studied. However, that being said, there are many studies on the impact
behaviours of concrete and FRP composites carried out separately. In this chapter, the
impact behaviour of concrete and FRP composites are reviewed. Details such as failure
mechanisms (failure modes), testing methods and strain rate effects are discussed in the
following sections. This review will help in understanding the failure modes and damage
sequences of hybrid GFRP-concrete beam subjected to impacts.

Chapter 3 – Review of Impact Behaviour of Concrete and FRP Composites
24
3.2 Review of concrete structures subjected to low-
velocity impacts
When subjected to impact loadings, concrete structures may respond in different
ways depending on the impact loading conditions, such as loading rates, the effects of
geometry and weight of the impactor. To understand the behaviour of concrete structures
subjected to low-velocity impacts, the testing methods, failure mechanisms and strain rate
effects are reviewed in the following sections.
3.2.1 Testing methods
The testing method should correspond to the potential loading scenario that may
occur during service. The two common testing methods for concrete structures subjected
to impact loadings are the Charpy pendulum test and the drop weight test. The former one
is less likely to be chosen for testing concrete structures. Due to the specific requirements
of the Charpy pendulum test setup, the dimensions of the tested specimens are normally
limited to the short-span beams, which is unable to meet the loading conditions of beam
structures in service (Pham and Hao, 2016b). In addition, the testing results from the
Charpy pendulum tests normally contain high frequency oscillations caused by the natural
vibration frequencies of the impactors (Cantwell and Morton, 1991). Thus, drop weight
testing is more commonly used in the testing of concrete structures.
Wang et al. (1996) performed impact tests on nine short concrete beams reinforced
with different fiber composition. As shown in Figure 3.1, the tests were conducted on an
instrumented drop weight machine with a fixed dropping weight (60.3 kg) and dropping
height (150 mm) to determine the energy absorption capacities of the beams.

Chapter 3 – Review of Impact Behaviour of Concrete and FRP Composites
25
Figure 3.1 Impact test setup of Wang et al. (1996)
Kishi et al. (2002) conducted a study to investigate the impact performance of shear-
failure-type reinforced concrete (RC) beams. A total number of 27 simply supported
beams was tested by using a 300 kg impactor for different impact energy levels, as shown
in Figure 3.2.

Chapter 3 – Review of Impact Behaviour of Concrete and FRP Composites
26
Figure 3.2 Impact test setup by Kishi et al. (2002)
Fujikake et al. (2009) performed a series of concrete beam tests to investigate the
effect of the amount and arrangement of reinforcement. Three different types of beams
were tested using a 400 kg drop hammer striking in the mid-span of the beams. Figure
3.3 shows the details of the testing setup.
Figure 3.3 Impact test setup by Fujikake et al. (2009)

Chapter 3 – Review of Impact Behaviour of Concrete and FRP Composites
27
Tachibana et al. (2010) conducted a study of the impact performance of RC beams
subjected to low-velocity impacts. Twenty-one simply supported concrete beams were
tested by the use of a curved contacting surface impactor for different dropping weights
and energy levels, as shown in Figure 3.4.
Figure 3.4 Experimental setup by Tachibana et al. (2010)
Bhatti and Kishi (2010) performed both experimental and numerical studies to
investigate a RC girder subjected to impacts. Four concrete girders were tested by using
a 5000 kg impactor for different dropping heights. Figure 3.5 shows the details of the
experimental setup.
Figure 3.5 Experimental setup of Bhatti and Kishi (2010)

Chapter 3 – Review of Impact Behaviour of Concrete and FRP Composites
28
The above researches recommend that the impact behaviour study of a concrete
structure should be conducted by dropping a large mass weight onto the mid-span of
specimens (the most critical situation).
3.2.2 Failure mechanisms of concrete structures subject to
impact loading
The failure mechanisms of concrete structures may be presented diversely due to
the different loading scenarios. The dynamic loading factors, such as dropping weight,
dropping height, geometry of the impactor and supporting conditions, could lead to
multifarious failure modes. By identifying the different types of failure modes, the cause
of the failure and the damage criteria of the concrete structures could be understood and
established. Therefore, it is essential to identify the failure mechanisms of the structure.
Mindess and Bentur (1985) reported experimental tests of three types of concrete
structures including plain concrete, fiber reinforced concrete and plain concrete with
conventional reinforcement. All the beams were tested by the use of 345 kg hammer with
the impact velocity of 3 m/s. The entire loading process of each test was recorded by a
500 frames per second high speed camera. During the observations of the experiments, it
was found that the plain concrete beam failed with a vertical flexural crack propagated
from the bottom to the top surface at the mid span. Similar observations were achieved
for fiber reinforced concrete but with diagonal cracks presenting on the bottom side of
the beam. While for conventional reinforced concrete, besides the flexural cracks
occurred in the mid span, another two failure modes were detected. The first one was the
surface crushing occurred on the contact zone of the beam. The second one was the local
punching shear failure with the presence of multiple shear cracks.

Chapter 3 – Review of Impact Behaviour of Concrete and FRP Composites
29
Kishi et al. (2002) tested twenty-seven RC beams, which had a cross section of 250
× 150 mm, with different initial impact velocities. From the observations, with the
increase of impact velocity, the dominant failure mode of the concrete beam changed
from the flexural-failure to the shear-failure. As the stress wave was transferred away
from the impact area towards the ends (support locations), the entire beam started to
respond to the impact in flexure. The ductile flexural response was first observed with the
initiation of vertical flexural cracks at the mid span. As the beam continued to deform,
diagonal cracks developed and propagated at an angle of approximately 45 degrees
upward.
Figure 3.6 Failure modes of Kishi et al. (2002)
Tang and Saadatmanesh (2005) performed a series of tests on the investigation of
impact behaviour of FRP strengthened concrete beams. A total number of 27 beams with
the cross section of 203 × 95 mm was tested. The test results showed the flexural cracks
initiated on the bottom side of the beams and propagated towards the top surface. With
the increase of impact duration, diagonal shear cracks occurred and propagated upward
to the top surface, which is the main failure mode causing the ultimate failure of the
beams.

Chapter 3 – Review of Impact Behaviour of Concrete and FRP Composites
30
Fujikake et al. (2006) conducted experimental tests on the impact response of
reactive powder concrete beams subjected to different impact energy levels. The
observations showed that the tested beams failed with the presences of multiple flexural
cracks initiated at the mid span of the beams. Similar to the failure modes of Mindess and
Bentur (1985), vertical flexural cracks were obtained at the centre of the beams, followed
by the diagonal cracks in the impact area which formed into a local shear plug failure.
Fujikake et al. (2009) performed a series of tests to investigate the impact
performance of RC beams subjected to low-velocity impact loadings. The effect of
dropping height and reinforcement arrangement was evaluated in this study. Three types
of RC beams with different amount of reinforcement were tested for various dropping
heights. The failure modes obtained from the tests showed the vertical flexural cracks
along with multiple diagonal shear cracks were observed across all the impact events. The
local surface crushing and shear plug developed progressively with respect to the
ascending impact energy levels.
Figure 3.7 Failure modes of Fujikake et al. (2009)

Chapter 3 – Review of Impact Behaviour of Concrete and FRP Composites
31
Bhatti et al. (2009) conducted both experimental and numerical investigations on
the impact response study of RC beams subjected to free falling loads. All the beams (400
× 200 mm in cross section) were tested by using a 400 kg cylindrical impactor. The results
showed the shear cracks were the main failure modes for this beam. Two types of shear
cracks, local shear plug and global diagonal shear cracks, were detected during the
experimental observations. The failure modes were governed mainly by shear cracks due
to the short-span length of the tested beams.
Figure 3.8 Failure modes of Bhatti et al. (2009)
The shear dominance failure modes were also confirmed by Saatci and Vecchio
(2009). Besides the occurrence of the shear cracks, they reported that in the early stage of
loading, no reaction force from the supports was obtained when the impact load reached
the maximum values, a phenomenon that was also reported by other researchers
(Cotsovos et al., 2008, Cotsovos, 2010, Pham and Hao, 2016a). This phenomenon could
be explained in that: in the early stage of impact events, the stress wave did not propagate

Chapter 3 – Review of Impact Behaviour of Concrete and FRP Composites
32
through the beam, the impact load was completely resisted by the inertial forces (Pham
and Hao, 2016b), which stage can also be called inertial resistance stage.
Kishi and Bhatti (2010) performed a study on the behaviour of RC girder subjected
to low-velocity impact loadings. The beam was tested by the use of a 2000 kg spherical
impactor at the mid span of the girder. Multiple failure modes were observed in the impact
event: local surface crushing occurred at the contact zone, followed by the local shear
plug as well as the flexural shear cracks initiated between the mid span and the supports.
Another interesting failure mode is that the flexural cracks were formed vertically when
they were near the supports. This failure mode was also observed by Saatci and Vecchio
(2009) for the impact performance analysis of RC beams subjected to impact loadings.
Figure 3.9 Failure modes of Kishi and Bhatti (2010)
Adhikary et al. (2013) tested twenty-four RC beams on short span supports. Three
types of RC beams were evaluated for different loading rates. The results indicated that
the shear cracks were the main failure mode for this beam. The local surface crushing of
the concrete was shown only in dynamic loading events and, the local shear plug
propagated from the supports to the impact location due to the short span of the beams.
The described failure modes of concrete structures subjected to low-velocity impact
loadings from the above studies can be summarised as follows (Figure 3.10):

Chapter 3 – Review of Impact Behaviour of Concrete and FRP Composites
33
a. Shear dominance failure is the most common failure mode in concrete
structures, which includes two major forms of crack patterns, local shear
plug and diagonal shear cracks;
b. Vertical flexural cracks at the centre of the concrete beams are normally
considered as the first failure mode when subjected to impacts, followed by
the diagonal shear cracks;
c. The local surface crushing of concrete is caused by the local shear loading
due to the high shear-stress rate in the impact area;
d. Local shear plug is normally formed in a relatively higher speed impact
event, where the punching failure occurred before the entire beam has time
to respond in bending;
e. The global flexural response occurs in three areas of the concrete beam, mid
span area, support area and the area between the centre and support location.
The flexural cracks at the mid span and near the support locations are
normally vertical, and the flexural cracks between these two areas are
typically formed with an angle of approximately 45 degrees upwards to the
top surface; and
f. In some particular cases, the maximum impact load occurred in the very
early stage of the impact events. The stress wave did not propagate through
the entire beam and, the impact load during this stage was completely
resisted by the inertial forces, which stage is also called inertial resistance
stage.

Chapter 3 – Review of Impact Behaviour of Concrete and FRP Composites
34
Figure 3.10 Contact-impact problem of a concrete beam
3.2.3 Strain rate effects of concrete
The effect of strain rate on the impact behaviour of concrete is questionable. On
one hand, it was claimed the strain rate effect of concrete has a significant influence on
its behaviour, and the constitutive model of concrete is a rate dependent model in which
the strain rate effect should be considered in the model (Cusatis, 2011, Ozbolt and
Sharma, 2011, Adhikary et al., 2012, Adhikary et al., 2013). On the other hand, it was
also found that the strain rate effect of concrete was not considered for analysing the
impact behaviour of concrete subjected to lower loading rates (Mindess and Bentur, 1985,
Mindess et al., 1986, Kishi et al., 2002, Fujikake et al., 2006, Bhatti et al., 2009, Jiang et
al., 2012). Similar to these findings, Bhatti et al. (2011) reported that the effects of strain
rate of concrete and rebar should not be considered for analysing the impact response of
concrete structures subjected to the low-velocity impacts. Unfortunately, this study did
not reveal the reason for this.
Besides the above opinions, many other different opinions on the strain rate effect
of concrete can be found as well. Suaris and Shah (1982) conducted a series of dynamic
tests to investigate the strain rate effects on fibre reinforced concrete. It was found that

Chapter 3 – Review of Impact Behaviour of Concrete and FRP Composites
35
the energy absorption capacity increases with respect to the increase in strain rate.
However, the bond properties between the FRP reinforcements and the concrete section
were not affected by the strain rate.
Naaman and Gopalaratnam (1983) performed experimental studies on the impact
behaviour of steel fiber reinforced concrete. The results showed that the strain rate could
have a significant influence on the impact properties only when it reaches a certain value.
This phenomenon was also confirmed by other researchers (Ross et al., 1995, Malvar and
Ross, 1998).
Fu et al. (1991) proposed a review on the effects of loading rate on RC. In this
review, they stated that the impact performance of concrete could be affected with respect
to the differences in strain rate. However, they also claimed that the high strength concrete
is less likely to be affected by strain rate.
In addition, Fujikake et al. (2009) stated that the strain rate effects on concrete
structures should be considered based on the support conditions as well. This theory was
also confirmed by Kishi and Bhatti (2010).
Even though the strain rate effects on concrete structures are questionable,
researchers should consider the influence of strain rate based on the loading and
supporting conditions. If the strain data is difficult or impossible to be collected during
the impact events, the simply supported conditions with horizontal sliding allowed as well
as the relatively lower loading rates are recommended to minimise the strain rate effect
of the concrete structures.

Chapter 3 – Review of Impact Behaviour of Concrete and FRP Composites
36
3.3 Review of FRP composites subjected to low-
velocity impacts
Damage resistance properties of FRP composite materials is a key criterion for
engineers to evaluate the structure and select suitable FRP products for the targeted
applications. Different impact factors, such as testing methods, failure mechanisms to the
damage and failure criterion are required to assess the damage resistance properties. To
develop an understanding of impact behaviour of FRP composites subjected to impact
loadings, the testing method, failure modes, strain rate effects and the review of different
types of FRP composites subjected to impacts are discussed in the following sections.
3.3.1 Testing methods
There are two common testing methods for assessing FRP composites subjected to
low-velocity impacts, Charpy impact testing and drop weight impact testing. The former
one is aimed at evaluating the energy absorption capacity of FRP composites during
fracture. However, the results usually contain a number of high frequency oscillations
caused by the natural vibration frequencies of the impactor (Cantwell and Morton, 1991).
Drop weight impact tests are set to test the impact performance on FRP composite plates,
which is more closely to the potential events in the field. Thus, drop weight impact tests
are more commonly used to assess the impact behaviour of FRP composites.
In a typical drop weight test, an impactor is raised to a certain dropping height, and
then released to strike the targeted specimen. A standard test method (ASTM-D7136,
2012) of a drop weight impact test for composite materials is recommended in many
researches (Ardakani et al., 2008, Perez et al., 2011, Sebaey et al., 2013, Saharudin et al.,

Chapter 3 – Review of Impact Behaviour of Concrete and FRP Composites
37
2013, Alomari et al., 2013, Koricho et al., 2015, Li et al., 2017a). Figure 3.11 shows an
example of impact device with double column impactor guide mechanism.
Figure 3.11 Impact device (ASTM-D7136, 2012)
3.3.2 Review of impact behaviour of different types of FRP
composites
3.3.2.1 Carbon fiber reinforced polymer (CFRP)
The impact response of CFRP subjected to low-velocity impacts was first
investigated by Cantwell and Morton (1989a). A series of low and high velocity impact
tests were performed on CFRP laminated plates to identify the differences of damage
development and damage initiation under differing loading conditions. The results
showed the impact response and energy absorbing capacity were mainly governed by the

Chapter 3 – Review of Impact Behaviour of Concrete and FRP Composites
38
geometry of the structure when subjected to low velocity impacts. On the other hand, the
geometrical parameters such as width and length had very little effect on the impact
response under high-velocity impacts.
Robinson and Davies (1992) performed a small number of tests to evaluate the
effects of impactor mass and specimen diameter on two types of laminated composites.
Both of the tests’ results showed that the impact response of laminated composites was
independently governed by the impact energy level. The impactor mass and geometry had
very little effect on the impact response. They also concluded that the low-velocity impact
of the tested specimens is a quasi-static process.
Davies and Zhang (1995) developed a simple linear FEM to predict the coupon test
results on the CFRP laminated composite plates. The numerical results were found to
corroborate the experimental ones in terms of force-time and displacement-time histories.
However, a non-linear behaviour was required to be implemented into the FEM due to
the gross deformations and in-plane material degradation.
The impact response of CFRP composites with pre-load subjected to low-velocity
impacts were investigated by Whittingham et al. (2004) and Heimbs et al. (2009). The
results showed the tensile preload had not affected the impact response of the CFRP
composites, whilst the compressive preload had affected the impact behaviour mainly in
terms of deflection response.
Ghelli and Minak (2011) performed a series low velocity impact tests on thin CFRP
laminates. The results showed the impact response from the coupons tests were governed
mainly by the geometry and thickness of the specimens, whilst the stacking sequences
had no effects on either the impact response nor the residual strength of CFRP laminates.

Chapter 3 – Review of Impact Behaviour of Concrete and FRP Composites
39
3.3.2.2 Complex structures of FRP composites
Gustin et al. (2005) conducted a series of low velocity tests on carbon fiber and
Kevlar combination sandwich composites. By replacing the impact-side face sheet of
carbon fiber with Kevlar or hybrid combination, the impact properties such as energy
absorbed capacity and maximum impact force were improved. Whilst, the reduction of
the compressive strength and stiffness of the hybrid combination was also found.
An experimental study of aluminium/nomex honeycomb sandwich panels with 8
ply CFRP skins subjected to low velocity impacts was performed by Zhou and Hill
(2009). This investigation revealed that the majority of the impact energies was absorbed
through core crushing and skin delamination. The damage mechanisms and the energy
absorption capacity did not variate distinctly with the difference of core materials.
Petrone et al. (2013b) presented a dynamic behaviour investigation on the sandwich
panels made from eco-friendly honeycomb cores. The results showed that the presence
of fiber-reinforced cores lead to a great improvement on the mechanical properties. Later,
Petrone et al. (2013a) conducted a comparison study between continuous fibers reinforced
PE honeycombs and short-random fibers reinforced PE honeycombs subjected to low
velocity impacts. The structure with continuous fibers reinforced composites presented a
better impact response in terms of energy absorption capacity and maximum impact
loads.
3.3.2.3 Pultruded GFRP composites
Most of above studies have presented the understanding of natural fiber or carbon
fiber reinforced structures subjected to low-velocity impacts. There are few studies on the
dynamic behaviour of pultruded GFRP composites currently available in the literature.

Chapter 3 – Review of Impact Behaviour of Concrete and FRP Composites
40
Tabiei et al. (1996) performed a series of impact velocity effect tests on the mid-
span of pultruded composite box-beams. The impact characteristics in terms of load-
displacement curves of two matrix material systems, polyester and vinylester, were
determined for the different impact velocities ranging from 2.2 to 7.7 m/s. This study
investigated the failure performance of the pultruded box-beams but the investigation of
damage sequence and failure modes were not studied.
Having recognised the lack of understanding of damage in pultruded composites,
Chotard and Benzeggagh (1998) performed a dynamic behaviour study of pultruded
GFRP beams in “U” shapes with the impact velocities ranging from 1.8 to 6.0 m/s. The
impact characteristics in terms of micro strain-time and load-time curves were obtained
for a series of impact energies. Damage identification was also conducted to analyse the
sequence of damage mechanisms and development. However, a loss of contact between
projectile and target occurred during the impact events due to the “U” shape geometry of
the pultruded beams, the primary results of the impact performance were actually from
the second strike by the impactor.
Later, Chotard et al. (2000) conducted a comparison study between box beams and
“U” sections. In this study, the flexural rigidity of pultruded box beams was found to be
nearly three times higher than the “U” sections due to the confinement effect of structural
geometry. Moreover, the first contact force was not shown in the pultruded box beams in
terms of load-time curves. The results obtained from the box beam tests were presented
differently from which in “U” sections for the impact characteristics due to the influence
of different structural geometry.
Bank and Gentry (2001) performed both experimental and numerical investigations
on the impact behaviour of guardrail prototypes made by multiple rectangular cells of

Chapter 3 – Review of Impact Behaviour of Concrete and FRP Composites
41
pultruded composites with the impact velocities ranging from 2.8 to 9.7 m/s. The impact
characteristics in terms of acceleration-time, velocity-time and displacement-time curves
were compared between experimental and numerical results. Unlike the previous studies,
in which the failure initiated at the corners of the beams, in this investigation the pultruded
beam failed from the tearing and splitting of the pultruded composites because of the
combination of multiple rectangular cells geometry.
Sutherland et al. (2017) performed an experimental investigation on the impact
response of bridge deck panels made of multicellular pultruded GFRP composites with
different impact energies. The test results were compared to those obtained with quasi-
static tests in terms of maximum force, displacement and absorbed energy. They found
that the “base line 3C” geometry is able to present the most complete and accurate
response when compared to the other two geometries mentioned in the paper. The failure
modes including local cruciform cracks, longitudinal split and transverse cracks were
captured from the tests. Different failure modes were shown in the tests due to the effect
of structural geometry.
Because of structural geometry, all the described pultruded composites structures
subjected to low-velocity impacts followed different failure patterns and locations, such
as shear cracks forming on the corners, buckling on the sides, tearing and splitting of the
material. None of the above studies investigated the impact energy absorbed completely
from the elastic-plastic behaviour of the material. When the pultruded composites are to
be used in hybrid systems, with concrete, the impact energy will most likely be absorbed
from the elastic-plastic behaviour of the material rather than the failure of the structure.
To reduce the influence of structural geometry and evaluate the impact behaviour of

Chapter 3 – Review of Impact Behaviour of Concrete and FRP Composites
42
pultruded composites, a shape of rectangular panel is recommended by the standard
ASTM-D7136 (2012).
Zhang and Richardson (2007) conducted a non-destructive impact study of
pultruded GRP composites in slim rectangular shapes. A series of tests conducted at very
low impact energies ranging from 6 to 19 J resulted in minimal visible damage. The
impact characteristics in terms of force-time and force-displacement curves were obtained
and compared. In this study, there was no indication of damage on the top surface and
barely visible cracks were presented on the bottom surface. Damage identification was
evaluated through the deformation mechanisms of the materials, which could be caused
by fiber pull-out, fiber breakage, and delamination or debonding between fiber and
matrix. The failure mechanisms and damage sequence of pultruded composites cannot be
fully understood with inconspicuous indication of damage in such low energy tests.
Different failure modes of composite materials would appear in low-velocity
impact induced non-penetration cases, including matrix cracking, delamination and fiber
failure. Each mode of failure requires some certain amount of impact energy. To analyse
the impact behaviour and failure modes of pultruded composites, higher impact energies
are required to be introduced. In next section, the major failure modes of FRP composites
to low-velocity impacts are introduced in detail to explain the causes of the failure modes.
3.3.3 Failure modes of FRP composites to low-velocity
impacts
By identifying the mode of failure from the impact events, the true cause and the
required energy levels to the failure can be identified, which would help in understanding

Chapter 3 – Review of Impact Behaviour of Concrete and FRP Composites
43
the failure initiation and damage propagation of FRP composites when subjected to
impact loading and, consequently, the assessment of damaged FRP composites.
Richardson and Wisheart (1996) summarized four major failure modes of
composite materials that would appear in low-velocity impact cases, including matrix
cracking, delamination, fiber breakage and penetration.
3.3.3.1 Matrix cracking
Matrix cracking is considered as the first type of the failure mode in low-velocity
impacts. This failure mode usually occurs when FRP composites are subjected to impact
energies ranging from 1 to 5 J depending on the thickness of the FRP plates (Richardson
and Wisheart, 1996). Joshi and Sun (1985) presented a typical failure pattern for a 0/90/0
composite shown in Figure 3.12. The matrix cracks in the top layer initiated along the
edges of the impactor. The matrix cracking direction are longitudinal, following the fiber
direction in the top layer (Li et al., 2017a). From the transverse view, we can see that
these cracks are inclined at approximately 45 degrees to the layer stacking direction.
These cracks occur due to the property mismatching between the fibers and matrix. The
transverse shear stress caused by the impact propagates through the material, and the low
stiffness matrix is not able to carry the high shear stress, which results in the matrix
cracking initiated (Richardson and Wisheart, 1996).

Chapter 3 – Review of Impact Behaviour of Concrete and FRP Composites
44
Figure 3.12 Transverse view of a damage induced 0/90/0 composite plate (Richardson
and Wisheart, 1996)
Choi et al. (1991) performed an investigation to analyse the failure mechanisms of
the matrix cracking in detail, which concluded that the matrix cracking in the top layer is
a result of interaction of stress distribution in different directions, as shown in Figure 3.13.
They also stated that the initiation of matrix cracking requires certain amount of energy
and the through-thickness stress (𝜎𝜎33) was very small compared to other stresses (𝜎𝜎22 and
𝜎𝜎23).
Figure 3.13 Schematic diagram of a matrix crack due to the stress distribution
(Richardson and Wisheart, 1996)

Chapter 3 – Review of Impact Behaviour of Concrete and FRP Composites
45
3.3.3.2 Delamination
As shown in Figure 3.9, delamination failure is referred to as the crack between
layers of different fibers orientation, which is similar to that of debonding failure in
concrete strengthened structures. Delamination only occurs when the absorbed energy
reaches a threshold point (Richardson and Wisheart, 1996). Dorey (1988) proposed a
simplified equation for estimating the required energy for delamination failure:
𝐸𝐸𝐷𝐷 = 2𝜏𝜏2𝑤𝑤𝐿𝐿3
9𝐸𝐸𝑓𝑓𝑡𝑡′ (3.1)
where
𝐸𝐸𝐷𝐷 = absorbed energy at the point of delamination failure;
𝜏𝜏 = interlaminar shear strength (ILSS);
𝑤𝑤 = width;
𝐿𝐿 = unsupported length;
𝐸𝐸𝑓𝑓 = flexural modulus; and
𝑡𝑡′ = specimen thickness.
Liu (1988) claimed that the delamination failure was a result of the stiffness
mismatching between two adjacent layers. Once the impact load is initiated, the FRP
composite plate starts to respond to the load in bending. The FRP plate/coupon tends
to bend concave along the major fiber direction (longitudinal direction), whilst the bend
is convex in the transverse direction. The difference of the bending directions results
in the occurrence of the delamination failure.

Chapter 3 – Review of Impact Behaviour of Concrete and FRP Composites
46
Liu (1988) also reported that the delamination areas were usually formed into an
oblong shape along the major fibers direction for unidirectional layer, and for 0/90
laminates, the shape of delamination became that of a peanut shape. These observations
have been reported widely by many other researchers as well (Chang et al., 1990, Guild
et al., 1993, Wu and Shyu, 1993, Li et al., 2017a). Figure 3.14 shows a typical example
of peanut shaped delamination area of a [0/90]s composite plate.
Figure 3.14 Delamination area of a [0/90]s composite plate
3.3.3.3 Fiber breakage
The failure of fibers in FRP composites usually occurs much later than matrix
cracking and delamination failure. It is also referred as a precursor to the penetration
failure mode (Richardson and Wisheart, 1996). Similar to the previous mentioned failure
modes, fiber breakage also requires certain amount of energy to be absorbed. Dorey
(1988) provided a simple expression for estimating the required energy for fiber failure:

Chapter 3 – Review of Impact Behaviour of Concrete and FRP Composites
47
𝐸𝐸𝑓𝑓′ = 𝜎𝜎2𝑤𝑤𝑡𝑡′𝐿𝐿18𝐸𝐸𝑓𝑓
(3.2)
where
𝐸𝐸𝑓𝑓′ = absorbed energy at the point of fiber failure;
𝜎𝜎 = flexural strength;
w = width;
𝑡𝑡′ = specimen thickness;
L = unsupported length; and
𝐸𝐸𝑓𝑓 = flexural modulus.
Fiber breakage can be found in both top (contacting) and bottom layers. The failure
of fibers on the top layer is mainly caused by the local high shear stresses, which is a
result of impactor indentation effect (Richardson and Wisheart, 1996, Li et al., 2017a).
The failure of fibers on the bottom layer usually occurs at the back surface of impact area.
This type of failure is a result of high tensile stress due to the specimen bending during
the impact event (Li et al., 2017a).
3.3.3.4 Penetration
There are two types of penetration failure for FRP composites subjected to impact
loading. The first type is normally referred to as perforation, which occurs when the
impactor completely passes through the specimen. This type of failure mainly occurs in
the ballistic or high-speed impact tests. In low-velocity impact tests, penetration occurs
when the fibers failure reaches a critical extent, the specimen is unable to carry any impact

Chapter 3 – Review of Impact Behaviour of Concrete and FRP Composites
48
load and break into pieces before the impactor passing through it. A simplified equation
was given by Dorey (1988) for calculating the required energy for the penetration failure:
𝐸𝐸𝑝𝑝 = 𝜋𝜋𝛾𝛾𝑑𝑑𝑡𝑡′ (3.3)
where
𝐸𝐸𝑝𝑝 = absorbed energy at the point of penetration failure;
𝜋𝜋 = mathematical constant;
𝛾𝛾 = fracture energy;
𝑑𝑑 = diameter of impactor; and
𝑡𝑡′ = specimen thickness.
However, Cantwell and Morton (1989b) stated that the energy required for the
penetration failure mostly depends on the geometry and thickness of the specimen rather
than the fracture energy. In their work, the majority of the energy was absorbed through
the shear-out form of the material response. The penetration failure is an extension of the
fiber failure, which is unlikely to occur in the low-energy modes.
3.3.4 Strain rate effects of FRP composites to low-velocity
impacts
Typically, strain rate effects on carbon fibers reinforced polymers (CFRP) are not
considered in engineering design because the strength and modulus of CFRP are not
affected by the change in loading rates (Daniel et al., 1981, Caprino, 1984, Sjoblom et al.,
1988, Richardson and Wisheart, 1996, Gilat et al., 2002). On the other hand, aramid fibers
reinforced polymers (AFRP) are usually considered as a strain rate dependent material.

Chapter 3 – Review of Impact Behaviour of Concrete and FRP Composites
49
The modulus and stiffness of AFRP increases with respect to the increase of strain rates
(Rodriguez et al., 1996, Benloulo et al., 1997).
However, the strain rate effects of glass fibers reinforced polymers (GFRP) to low-
velocity impacts are questionable. On one hand, it was reported that the strength and
stiffness of GFRP composites increase with the increasing strain rate in the tensile split
Hopkinson bar tests (Caprino, 1984, Barre et al., 1996, Shokrieh and Omidi, 2009, Naik
et al., 2010). On the other hand, Caprino et al. (1984) claimed that the strain rate effects
do not affect the material properties of GFRP when subjected to low-velocity impacts in
the drop weight tests. Interestingly, Hayes and Adams (1982) performed pendulum
apparatus tests on an unidirectional composite material. They reported that the modulus
of GFRP increases with respect to the increase of strain rate, but the strength of the
specimens decreases with the increased strain rate.
Robinson and Davies (1992) stated that the impact properties of GFRP materials,
especially the through-thickness properties, were not affected by the change in strain rate
when subjected to low-velocity impacts. This opinion was also supported by the findings
of Richardson and Wisheart (1996) and Li et al. (2017a).
To conclude, in low-velocity impact cases, the impact loads are mainly resisted
based on the material stiffness and strength in longitudinal and transverse directions. The
through-thickness properties can be ignored for laminated GFRP composites. However,
in a dynamic loading scenario, the in-plane (both longitudinal and transverse direction)
material strength and stiffness increase with respect to the loading rate. Hence, the in-
plane properties of GFRP laminates should be considered as rate dependent.

Chapter 3 – Review of Impact Behaviour of Concrete and FRP Composites
50
3.4 Summary
In this chapter, a review of the impact behaviour of concrete structures and FRP
composite subjected to low-velocity impacts is presented. The review of the testing
methods and strain rate effects on concrete structures provides a recommendation for the
experimental setup of the hybrid beam proposed in this thesis. The failure mechanisms of
concrete/reinforced concrete structures are also summarised as is the impact behaviour of
FRP composites subjected to low-velocity impacts. For FRP composites, four types of
failure modes, including matrix cracking, delamination, fiber breakage and penetration,
and their failure mechanisms were identified.
A critical review of pultruded GFRP composites subjected to low-velocity impacts
is also presented in this chapter. Very limited studies were focussed on the impact
response of pultruded composites. To fully identify and understand the failure modes and
their corresponding mechanisms, higher impact energies need to be introduced. The
review of the impact response of FRP composites and concrete provides a reference base
and scope for the study of pultruded GFRP composites and hybrid beam.

Chapter 4
Experimental Study of Pultruded GFRP
Composites to Low-Velocity Impacts1
4.1 Introduction
As mentioned in Chapter 3, very limited studies focus on tests involving the higher
range of impact energy on pultruded composites. Therefore, the aim of this chapter is to
develop an understanding of the impact response of pultruded GFRP composites
subjected to low-velocity impacts with higher impact energies ranging from 17 to 67 J.
In this investigation, an instrumented drop tower impact test machine (INSTRON
CEAST 9350) is used to introduce the impact tests on the pultruded composites. All the
specimens are placed and supported based on the requirement of the standard ASTM-
D7136 (2012). The results of impact characteristics and performance are compared for
different impact energy levels. The damage evaluation is also introduced to compare the
failure modes of pultruded composites subjected to different energy levels. Moreover, the
impactor mass effects are evaluated with using three ascending weights of impactor.
Finally, the chapter provides a summary of the main findings from the drop tower tests.
1 Results discussed in this chapter form part of the following publication:
LI, Z., KHENNANE, A., HAZELL, P. J. & BROWN, A. D. 2017. Impact behaviour of pultruded GFRP composites under low-velocity impact loading. Composite Structures, 168, 360-371.
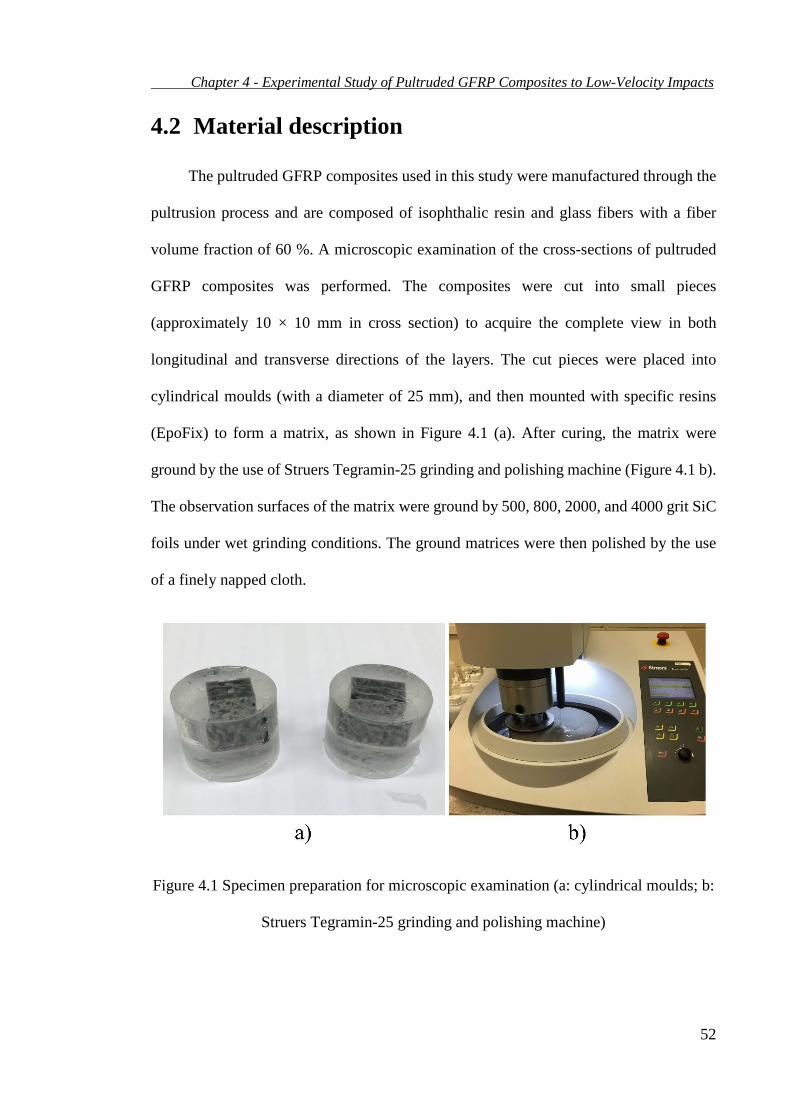
Chapter 4 - Experimental Study of Pultruded GFRP Composites to Low-Velocity Impacts
52
4.2 Material description
The pultruded GFRP composites used in this study were manufactured through the
pultrusion process and are composed of isophthalic resin and glass fibers with a fiber
volume fraction of 60 %. A microscopic examination of the cross-sections of pultruded
GFRP composites was performed. The composites were cut into small pieces
(approximately 10 × 10 mm in cross section) to acquire the complete view in both
longitudinal and transverse directions of the layers. The cut pieces were placed into
cylindrical moulds (with a diameter of 25 mm), and then mounted with specific resins
(EpoFix) to form a matrix, as shown in Figure 4.1 (a). After curing, the matrix were
ground by the use of Struers Tegramin-25 grinding and polishing machine (Figure 4.1 b).
The observation surfaces of the matrix were ground by 500, 800, 2000, and 4000 grit SiC
foils under wet grinding conditions. The ground matrices were then polished by the use
of a finely napped cloth.
Figure 4.1 Specimen preparation for microscopic examination (a: cylindrical moulds; b:
Struers Tegramin-25 grinding and polishing machine)

Chapter 4 - Experimental Study of Pultruded GFRP Composites to Low-Velocity Impacts
53
Figure 4.2 ZEISS Axio Imager M2m optical microscope
The microstructures of the pultruded GFRP composites were examined using a
ZEISS Axio Imager M2m optical microscopic system (Figure 4.2). From the
examinations, the pultruded GFRP composites consisted of three layers of roving, each
layer approximately 3 mm thick, and separated by two layers of glass fiber mat, each
approximately 0.5 mm thick. In addition, there was a very thin surface veil
(approximately between 0.1 mm and 0.2 mm thick) placed on both the top and bottom
roving surfaces to provide a smooth surface. The majority of glass fibers were laid along
the longitudinal direction in the roving layers. The distribution of layers is shown in
Figure 4.3.

Chapter 4 - Experimental Study of Pultruded GFRP Composites to Low-Velocity Impacts
54
Figure 4.3 Microscopic views of pultruded GFRP composites
The mechanical properties and physical properties are achieved from manufacturer
and coupons tests investigated by Chakrabortty et al. (2011) as shown in Table 4.1. All
of the specimens were cut into a rectangular shape with dimensions of 150 × 100 × 10
mm based on the requirement of test standard ASTM-D7136 (2012). Details of test
specimens are listed in Table 4.2.
Table 4.1 Mechanical properties of the pultruded GFRP composites (Li et al., 2017a)
Mechanical and physical properties Magnitudes Density (g/cm3) 1.790 Fiber volume fraction* 60% Major Poisson’s ratio* 0.21 Longitudinal modulus (GPa) 28.87 Transverse modulus (GPa) 3.510 Shear modulus (GPa) 2.980 Longitudinal tensile strength (MPa) 301.198 Transverse tensile strength (MPa) 29.78 Longitudinal compressive strength (MPa) 310.785 Transverse compressive strength (MPa) 31.97
*Obtained from the manufacturer’s sheet

Chapter 4 - Experimental Study of Pultruded GFRP Composites to Low-Velocity Impacts
55
Table 4.2 Details of test specimens
Energy (J) Impactor mass (kg) Test sample Thickness (mm) Mean
(mm)
16.75 5.48 test_1 SR2 9.34 9.35 9.42 9.37
test_2 SL2 9.46 9.7 9.66 9.61
test_3 LD6 9.04 8.9 9.15 9.03
33.5 5.48 test_4 LU1 9.81 9.72 9.75 9.76
test_5 SR3 9.11 9.33 9.35 9.26
test_6 LU6 9.83 9.67 9.74 9.75
50.25 5.48 test_7 SL3 9.43 9.69 9.55 9.56
test_8 LD2 9.04 8.86 9.03 8.98
test_9 LU5 9.64 9.81 9.72 9.72
67 5.48 test_10 LD3 9.07 8.94 9.05 9.02
test_11 LD1 8.86 9.09 9.01 8.99
test_12 SR1 9.17 9.33 9.37 9.29
67 10.48 test_13 LU3 9.83 9.67 9.8 9.77
test_14 LU2 9.77 9.66 9.78 9.74
test_15 SL5 9.45 9.66 9.59 9.57
67 15.48 test_16 LD5 9.07 8.89 9.08 9.01
test_17 LD4 9.07 8.88 9.06 9.00
test_18 SR5 9.35 9.13 9.31 9.26
4.3 Test setup and procedures
An INSTRON CEAST 9350 drop weight tower was used to conduct the impact
tests presented in this study, which meet the requirements of ASTM-D7136 (2012). The
general features of the machine and data acquisition system are shown in Figure 4.4. The
drop tower is equipped with a free-falling carriage system that includes an impactor and
a load cell. The system operates on the principle of energy conservation, balancing
potential and kinetic energy by varying the drop height of the carriage and the option of

Chapter 4 - Experimental Study of Pultruded GFRP Composites to Low-Velocity Impacts
56
adding additional mass to the system. The system can simulate drop heights upwards of
30 m by accelerating the carriage via springs at the top of the system. The rectangular test
specimens were subjected to a concentrated impact by using a 20 mm diameter
hemispherical striker with 5.5 kg of total weight from various heights. The striker weight
alone is 1.2 kg, while the rest of the carriage system weighs an additional 4.3 kg.
According to the recommendation of ASTM-D7136 (2012), the impact energy required
for evaluating the damage resistance of composite materials is governed by the following
equation:
𝐸𝐸 = 𝐶𝐶𝐸𝐸ℎ (4.1)
where
𝐸𝐸 = the potential energy of impactor prior to drop;
𝐶𝐶𝐸𝐸 = the specified ratio of impact energy to specimen thickness, 6.7 J/mm; and
ℎ = the nominal thickness of the specimen.
Utilizing Eq. 4.1, the impact energy of 67.00 J was calculated for the pultruded
GFRP composite testing. Three additional levels of energy (16.75, 33.50 and 50.25 J)
were also applied in this study to provide additional insight into the mechanical response
of the pultruded GFRP composites. The impact velocities and drop heights of the four
chosen energy levels were 2.47, 3.49, 4.27 and 4.94 m/s, and 311, 621, 932 and 1242 mm,
respectively. The minimum drop height requirement of 300 mm is satisfied for all testing
conditions, as per ASTM-D7136 (2012). Three specimens were tested for each energy
level to determine repeatability. During the test, the specimen was placed centred relative
to the cut-out (125 × 75 mm) on the impact support fixture. To prevent the rebounding of
the specimen during the impact event, four clamps with rubber tips in the end were used

Chapter 4 - Experimental Study of Pultruded GFRP Composites to Low-Velocity Impacts
57
to secure the specimen in place. An anti-rebound system that catches the impactor was
also implemented to prevent the striker from reloading the specimen. A high speed
camera (Phantom v12) with the sample rate of 11000 frames per second was used for
recording the impact events. To increase the light intensity, a HIVE plasma lamp was
used as a low temperature lighting source. The support conditions are shown in Figure
4.5.
Figure 4.4 Test setup

Chapter 4 - Experimental Study of Pultruded GFRP Composites to Low-Velocity Impacts
58
Figure 4.5 Impact support fixture
4.4 Experimental results and discussion
A total number of 12 specimens (test 1 to test 12) were tested at four different
energy levels for investigating the impact behaviour of pultruded GFRP composites. The
impact performance and characteristics are reported in terms of load-time, central
deflection-time and load-displacement. These material response histories are presented in
sections 4.4.1, 4.4.2, and 4.4.3, respectively, and are discussed in detail in section 4.4.4
and 4.4.5.
4.4.1 Load-time response
The loading histories for all impact energy levels recorded in-situ by the load cell
are presented in Figure 4.6. As shown, the impact force-time curves of four impact energy
levels exhibit similar trends, which can be divided into four stages. Just after contact is
initiated between the impactor and the top surface of specimen, the first stage is
represented by a linear increase in load. No damage occurs in the first stage and the
dynamic response of the specimens is purely elastic. The average values of load at the

Chapter 4 - Experimental Study of Pultruded GFRP Composites to Low-Velocity Impacts
59
end of this stage for four ascending energy levels are 1.95, 2.47, 2.76 and 3.20 kN
respectively. The magnitude of the load at the end of the first stage is up to approximately
20% of the maximum load for the entire event. The second stage begins with the onset of
inelastic behaviour at approximately 0.2 ms. There are another two linear increases in
load at this stage, indicating that the stress propagates to the second and third roving layers
showing a response to the impact load in sequence. The total number of linear increases
in the first two stages matches the number of roving layers, where the majority of fibers
are laid. The third stage lasts from the end of second stage to the maximum load of impact
(approximately 2 ms). The through-thickness stress waves do not play a significant role
in the stress distribution in these low-velocity impact events (ranging from 2.5 to 5.0 m/s).
The majority of impact loads are resisted through the bending of the pultruded GFRP
composites. Since all the custom-made specimens have the same bending stiffness, and
hence the same natural frequency, the maximum impact force of different impact energy
levels events occurs at nearly the same time. The average values of maximum load for
four ascending energy levels are 9.52, 11.74, 13.48 and 15.15 kN respectively. During
the third stage, the impact force remains increasing with the presence of significant
oscillations in the data from the activation of two different damage mechanisms: shear
damage occurring at the onset of inelastic deformation followed by the delamination
between the mat and roving layers with increasing load. In the fourth, and final, stage the
loading curves decrease down to zero at varying slopes with respect to impact energy.
During this period, the impactor starts to rebound and leave the target, however, the
specimens are still ringing, which is confirmed by the video recorded from the Phantom
high-speed camera.

Chapter 4 - Experimental Study of Pultruded GFRP Composites to Low-Velocity Impacts
60
Figure 4.6 Impact force-time curves of four impact energy levels
4.4.2 Central deflection-time response
The central deflection of the specimen can be calculated from a double integration
of force-time curve:
𝐷𝐷 = ∬𝐹𝐹(𝑡𝑡)−𝐶𝐶𝑀𝑀𝐶𝐶
𝑑𝑑2𝑡𝑡 (4.2)
where
𝐷𝐷 = the central deflection;
𝐹𝐹(𝑡𝑡) = the force acquired by the data acquisition system;
𝑀𝑀 = the total weight (5.5 kg);
𝑔𝑔 = the gravitational acceleration constant (9.81 m/s2); and
𝑡𝑡 = time.

Chapter 4 - Experimental Study of Pultruded GFRP Composites to Low-Velocity Impacts
61
The central deflection-time curves of four impact energy levels are shown in Figure
4.7, which are verified by the video recorded from the Phantom high-speed camera with
an average difference of 3.5 % at the maximum calculated deflection. The snapshots from
the video at t = 0 and t = maximum deflection time for specimen LD3 are shown in Figure
4.8. Similar trends are observed for the deflection-time plots across all impact energies
tested; the maximum deflection increases with increasing energy and the time at which
the maximum deflection occurs also increases with increasing energy.
Figure 4.7 Central deflection-time of four impact energy levels

Chapter 4 - Experimental Study of Pultruded GFRP Composites to Low-Velocity Impacts
62
Figure 4.8 Snapshots of specimen LD3 during the impact test
4.4.3 Load-displacement response
The absorbed energy during the impact loading is another primary parameter for
analysing the dynamic response of pultruded GFRP composites. The value of absorbed
energy for each specimen can be calculated through an integration of the force-
displacement curve:
𝐸𝐸𝑎𝑎𝑎𝑎𝑠𝑠𝑜𝑜𝑎𝑎𝑎𝑎𝑒𝑒𝑑𝑑 = ∫𝐹𝐹(𝐷𝐷)𝑑𝑑𝐷𝐷 (4.3)
where
𝐸𝐸𝑎𝑎𝑎𝑎𝑠𝑠𝑜𝑜𝑎𝑎𝑎𝑎𝑒𝑒𝑑𝑑 = the absorbed energy;
𝐹𝐹(𝐷𝐷) = the force curve (function of deformation); and
𝐷𝐷 = the central deflection.
The force-displacement curves of the four ascending energy levels tested are
illustrated in Figure 4.9. Similar to the force-time curves, the force-displacement curves
can be divided into four stages. The first stage is identical to what is shown in force-time
curves, exhibiting a linear increase of force up to approximately 20% of maximum load

Chapter 4 - Experimental Study of Pultruded GFRP Composites to Low-Velocity Impacts
63
that is indicative of recoverable elastic deformation. The second stage begins with the
onset of inelastic deformation to the first large extent drop. Matrix cracks begin to occur
through the top roving layer to the bottom one in sequence. No fiber damage is expected
in this stage and the majority of impact energies are absorbed through the elastic
behaviour of pultruded composites. The third stage starts from the onset of plastic
deformation. Matrix cracks and delamination begin to grow distinctly as the curve starts
to grow with a series of fluctuations up to the maximum value of displacement. In this
stage, the deformation is plastic, or permanent, and will not be recovered upon unloading.
Finally, the last stage sees the impactor leaving the target and the load decreases to a
measurable degree of unrecoverable deformation. During the higher energy impacts, the
stress starts to grow and satisfy multiple damage criterions, such as matrix cracking,
delamination and fiber breakage. The pultruded composites experience multiple modes
of failure and absorb more energy with increasing energy. The post-failure stiffness of
the pultruded composite decreases with the increased impact energy and hence damage.
As a result, the unloading slope varies with respect to impact energy. The area described
under the force-displacement curve provides the energy absorbed by the pultruded GFRP
composites, which can be verified through the following equation:
𝐸𝐸𝑡𝑡𝑜𝑜𝑡𝑡𝑎𝑎𝑡𝑡 = 𝐸𝐸𝑎𝑎𝑎𝑎𝑠𝑠𝑜𝑜𝑎𝑎𝑎𝑎𝑒𝑒𝑑𝑑 + 𝐸𝐸𝑘𝑘𝑖𝑖𝑘𝑘𝑒𝑒𝑡𝑡𝑖𝑖𝑐𝑐 (4.4)
where
𝐸𝐸𝑡𝑡𝑜𝑜𝑡𝑡𝑎𝑎𝑡𝑡 = the initial energy;
𝐸𝐸𝑎𝑎𝑎𝑎𝑠𝑠𝑜𝑜𝑎𝑎𝑎𝑎𝑒𝑒𝑑𝑑 = the absorbed energy; and
𝐸𝐸𝑘𝑘𝑖𝑖𝑘𝑘𝑒𝑒𝑡𝑡𝑖𝑖𝑐𝑐 = the kinetic energy when the impactor starts to rebound.

Chapter 4 - Experimental Study of Pultruded GFRP Composites to Low-Velocity Impacts
64
Figure 4.9 Force-displacement curves of four energy levels
4.4.4 Impact performance
Test results including initial energy, dropping height, maximum load, impact
velocity and absorbed energy are summarised in Table 4.3. The results indicate that
similar percentage (approximately 67%) of the energy is absorbed through all impact
events, with a slight increase of percent energy absorption with increasing impact energy.
The relationships between the average maximum load (Fmax) and impact energy, average
maximum deflection (Dmax) and impact energy are shown in Figure 4.10. The average
value of the maximum load increases at a near-linear (R2=0.993) trend with the increasing
impact energy. Similar to the maximum load, the maximum deflection increases at a near-
linear (R2=0.997) trend with the increasing impact energy.

Chapter 4 - Experimental Study of Pultruded GFRP Composites to Low-Velocity Impacts
65
Figure 4.10 Relationship of maximum load/impact energy and maximum
deflection/impact energy
Table 4.3 Testing results summary
Specimen ID
Test No. Initial Energy measured (J)
Dropping Height (mm)
Maximum Load (kN)
Maximum Deflection
(mm)
Impact Velocity
(m/s)
Absorbed Energy
(J)
SR2 16.75J #1 17.269 311 8.86 3.326 2.51 11.116 SL2 16.75J #2 17.269 311 10.35 3.187 2.51 10.854 LD6 16.75J #3 17.406 311 9.36 3.347 2.52 11.336 LU1 33.50J #1 33.769 621 12.27 4.890 3.51 23.187 SR3 33.50J #2 33.962 621 11.25 5.191 3.52 22.821 LU6 33.50J #3 33.962 621 11.70 4.851 3.52 23.352 SL3 50.25J #1 50.446 932 13.61 6.406 4.29 34.206 LD2 50.25J #2 50.446 932 13.39 6.475 4.29 34.133 LU5 50.25J #3 50.446 932 13.45 6.276 4.29 35.679 LD3 67.00J #1 70.179 1242 15.77 8.033 5.06 48.923 LD1 67.00J #2 70.179 1242 15.49 8.073 5.06 47.843 SR1 67.00J #3 70.179 1242 14.20 8.337 5.06 50.788

Chapter 4 - Experimental Study of Pultruded GFRP Composites to Low-Velocity Impacts
66
4.4.5 Damage evaluation
The front and back surfaces of pultruded GFRP composites for all impact energy
levels are shown in Figure 4.11 and Figure 4.12 respectively. The results are obtained
from the observation and ultrasonic measurement detections, and the magnitude of the
damage are produced from the Image J measurement analysis. On the front surfaces,
besides the indentation caused by the impactor, all the failure modes are presented with a
similar cracking pattern. The matrix cracking directions for all the different impact energy
events are longitudinal, following the fiber direction in the top layer (roving layer). The
growth and the magnitude of damage are increasing significantly with the increased
impact energy: only one crack of length 40 mm is observed in a typical 16.75 J impact
energy test. In Figure 4.11, it is observed that two cracks of length 30 and 44 mm, and 78
and 81mm are shown for 33.50 J and 50.25 J test respectively. Lastly, three longitudinal
cracks of length 99, 84 and 96 mm are shown in 67.00 J test shown in Figure 4.11. As the
impact energy increases, another cracking pattern (from 30o to 45o) is shown close to the
indentation, which is caused by the shear loading due to the high shear-stress rate in this
area. This shear cracking is highly visible in the 67.00 J specimen shown in Figure 4.11.
On the back surfaces, there is a monotonic increase of damage area with increasing impact
energy and the propagation of damage follows along the longitudinal direction on the
bottom (roving) layer. The total damage areas for each energy level are 1104, 1908, 2911
and 3819 mm2 respectively, which value increases at a near-linear (R2=0.998) trend with
the increasing impact energy, shown in Figure 4.13. One crack was discovered on the
centre of back surface for higher impact energy events, which is a result of the high tensile
stress due to the specimen bending during the impact. For both front and back surfaces
damage evaluation, the damage areas are increasing monotonically with the increased

Chapter 4 - Experimental Study of Pultruded GFRP Composites to Low-Velocity Impacts
67
impact energy, indicating a similar pattern of energy absorption formed, which is
confirmed by the force-displacement curves and energy absorption results.
Figure 4.11 Comparison of top surfaces for four energy levels
Figure 4.12 Comparison of bottom surfaces for four energy levels

Chapter 4 - Experimental Study of Pultruded GFRP Composites to Low-Velocity Impacts
68
Figure 4.13 Relationship of damage area in back surface/impact energy
4.5 Impactor mass effect
The effect of the impactor mass upon the damage initiation and development of
pultruded GFRP composites to low-velocity impacts has not been revealed yet. For this
purpose, this section examines the effect of varying the mass of the impactor with a fixed
radius on the impact response of pultruded GFRP composites.
A total number of nine specimens (test 10 to test 18) were tested for three ascending
weights of impactor mass and a fixed impact energy. Three specimens were tested for
each impactor mass to determine the repeatability. The impact velocities for the
corresponding impactor mass were 5.06, 3.59 and 2.97 m/s respectively. The impact
characteristics results in terms of load-time, central deflection-time and load-

Chapter 4 - Experimental Study of Pultruded GFRP Composites to Low-Velocity Impacts
69
displacement curves are illustrated in sections 4.5.1, 4.5.2 and 4.5.3, respectively, and are
discussed in detail in section 4.5.4.
4.5.1 Load-time response
The loading histories for three ascending impactor mass are presented in Figure
4.14. As shown, the loading curves exhibit similar trends. However, the contact duration
increases with respect to the increase of impactor mass. This is the result of reduction for
the initial impact velocity. The maximum impact load decreases slightly with respect to
the increase of impactor mass. As mentioned in section 3.3.3, the in-plane properties of
the pultruded GFRP composites can be considered as rate dependent. Therefore, the
decrease of the maximum impact load might be caused by the decrease of the impact
velocity rather than the mass effect of the impactor.
Figure 4.14 Load-time curves of three ascending impactor mass

Chapter 4 - Experimental Study of Pultruded GFRP Composites to Low-Velocity Impacts
70
4.5.2 Central deflection-time response
The central deflection-time curves of three different impactor mass are shown
inconsistently in Figure 4.15. The duration of deflection curves increases with respect to
the reduction of impact velocities. The pattern of variation tendency for three ascending
impactor mass is not clear. The maximum deflections for the highest impact velocity are
larger than the other two groups, however, the value of maximum deflections of 15.5 kg
group is greater than that of 10.5 kg group but smaller than 5.5 kg group.
Figure 4.15 Central deflection-time curves of three ascending impactor mass
4.5.3 Load-displacement response
The absorbed energy for the impact event can be evaluated through the load-
displacement curve. The load-displacement curves of three different impactor mass are
shown in Figure 4.16. As shown, the absorbed energy for every test remains the same
regardless of the difference of the impactor mass. Similar percentage of energy
(approximately 70%) is absorbed across all the impact events.

Chapter 4 - Experimental Study of Pultruded GFRP Composites to Low-Velocity Impacts
71
Figure 4.16 Load-displacement curves of three ascending impactor mass
4.5.4 Impact performance
Testing results including initial energy, percentage of energy absorption, maximum
load, maximum deflection, impact velocity and absorbed energy are summarized in Table
4.4. As shown, the average maximum load decreases with respect to the reduction of
impact velocity. However, the variation of maximum deflection is not clear, and the
energy absorption capacity does not vary with the increase of impactor mass. Therefore,
the impactor mass has very little effect on the impact response for the pultruded GFRP
composites subjected to low-velocity impacts.

Chapter 4 - Experimental Study of Pultruded GFRP Composites to Low-Velocity Impacts
72
Table 4.4 Testing results summary
Specimen ID
Test No.
Initial Energy
measured (J)
Percentage of Energy absorption
(%)
Maximum Load (kN)
Maximum Deflection
(mm)
Impact Velocity
(m/s)
Absorbed Energy (J)
LD3 5.5 kg #1 70.179 69.71 15.77 8.033 5.06 48.923 LD1 5.5 kg #2 70.179 68.82 15.49 8.073 5.06 47.843 SR1 5.5 kg #3 70.179 72.37 14.20 8.317 5.06 50.788 LU3 10.5 kg #1 67.171 69.30 13.69 7.546 3.58 46.550 LU2 10.5 kg #2 67.547 72.34 14.15 7.565 3.59 48.863 SL5 10.5 kg #3 67.547 67.61 14.31 7.627 3.59 45.669 LD5 15.5 kg #1 68.283 69.74 13.48 8.051 2.97 47.621 LD4 15.5 kg #2 68.283 68.29 13.91 7.942 2.97 46.630 SR5 15.5 kg #3 68.283 71.82 12.96 8.037 2.97 49.041
4.6 Summary
In this chapter, 18 specimens were tested using an instrumented drop tower testing
machine for different impact energy levels and impactor mass. The impact characteristics
in terms of load-time curves, central deflection-time curves and load-displacement curves
were presented to demonstrate the damage initiation and propagation of pultruded GFRP
composites subjected to low-velocity impacts. The impact performance in terms of
maximum load and deflection were compared for different impact factor studies. The
findings of this chapter can be summarised as follows:
1. The impact characteristics (load-time, displacement-time and load-displacement
curves) of pultruded GFRP composites subjected to different impact energies
exhibit similar variation tendencies;
2. The pultruded GFRP composites behave in a purely elastic fashion until
approximately 20% of the maximum impact load for all impact events, and the

Chapter 4 - Experimental Study of Pultruded GFRP Composites to Low-Velocity Impacts
73
number of linear increases of load in elastic regime matches the number of
roving layers;
3. The maximum impact force and central deflection increases at a near-linear trend
with respect to the impact energy. Similar percentage of energy is absorbed for
different loading cases. There is a slight increase of percentage of energy
absorption with the increase of impact energy, whilst such percentage remains
the same for different impactor mass;
4. The extent of damage on both front and back surfaces is monotonically increasing
with the increased impact energy. Multiple failure modes including matrix
cracking and delamination occur when pultruded GFRP composites are
subjected to higher level of impact energy; and
5. The impactor mass has very little effect on the impact response for the pultruded
GFRP composites subjected to low-velocity impacts. Impact energy is the main
factor that have a significant effect to the pultruded GFRP composites.

Chapter 5
Numerical Study of Pultruded GFRP
Composites to Low-Velocity Impacts2
5.1 Introduction
The experimental investigations of the impact behaviour of pultruded GFRP
coupons subjected to low-velocity impacts were conducted in Chapter 4. Results, such as
the impact characteristics (load-time curves, displacement-time curves) and impact
performance (maximum impact load, energy absorption capacity) were obtained from the
experimental study. However, experimentation alone does not reveal the development
and propagation of the stress, which can be better understood through numerical
simulation. For this purpose, a non-linear finite element model (FEM) is developed using
a progressive damage model to simulate the impact behaviour of pultruded composites.
The numerical results will be compared with the experimental data for verification, and
the validated numerical model will be employed in the numerical investigations of hybrid
GFRP-concrete beams subjected to impact loadings.
2 Results discussed in this chapter form part of the following publication:
LI, Z., KHENNANE, A., HAZELL, P. J. & BROWN, A. D. 2017. Impact behaviour of pultruded GFRP composites under low-velocity impact loading. Composite Structures, 168, 360-371.

Chapter 5 - Numerical Study of Pultruded GFRP Composites to Low-Velocity Impacts
75
5.2 Finite element model
A non-linear FEM was developed using a progressive damage model to simulate
the impact behaviour of pultruded GFRP coupons in the commercial software
ABAQUS/Explicit. As mentioned in section 3.3.3, the through-thickness stress wave
plays no significant part in the stress distribution in a low-velocity impact event; hence,
the pultruded GFRP composites were modelled without considering the through-
thickness properties (Robinson and Davies, 1992, Richardson and Wisheart, 1996, Li et
al., 2017a). Therefore, a continuum shell element is chosen for the pultruded GFRP
composites instead of a three dimensional continuum solid element.
The impactor was modelled with discrete rigid elements (R3D4) and all the
effective layers of the pultruded GFRP composites were modelled using eight-node
quadrilateral in-plane general-purpose continuum shell elements (SC8R). The mesh
density was chosen as 2 × 2 mm on the basis of mesh sensitivity analysis in terms of
computational time and convergence. To reduce the computational time, the dimensions
corresponding to the size of the unsupported region of the specimens in the experimental
set-up were modelled (125 × 75 mm). The computational time of a single simulation for
the reduced model was approximately 1.5 hours (Intel Core i7-3770 CPU @ 3.4 GHz). A
mass of 5.5 kg was assigned to the impactor, matching the experimental test conditions.
Different initial impact velocities were imposed to the impactor to simulate different
impact energy levels events. Boundary conditions were accordingly assigned with the
reduced size of specimen, which are reported in Figure 5.1. The interaction between the
specimen and impactor was simulated by surface to surface contact pairs and the
mechanical constraint formulation was enforced using the kinematic contact algorithm.

Chapter 5 - Numerical Study of Pultruded GFRP Composites to Low-Velocity Impacts
76
Figure 5.1 Assembled FEM with boundary conditions
5.3 Progressive damage model
The damage model for fiber-reinforced composites, which is associated with plane
stress formulation, has been used to predict the onset of failure and post-failure
development of pultruded GFRP composites in ABAQUS/Explicit. This progressive
damage model is based on the work of Camanho and Davila (2002), which is aimed to
describe the linear elastic behaviour of the undamaged composite materials using the
combination of damage initiation criteria. The damage initiation criteria of the composite
material are evaluated by using Hashin’s criteria (Hashin and Rotem, 1973, Hashin,
1980), which is used to predict the onset of degradation of pultruded GFRP composites
in this study. Once the damage initiation criteria are satisfied, the degradation of the
material stiffness coefficients would be presented. This behaviour can be modelled by

Chapter 5 - Numerical Study of Pultruded GFRP Composites to Low-Velocity Impacts
77
damage evolution and the corresponding variables based on a damage evolution law
(Matzenmiller et al., 1995, Camanho and Davila, 2002, Lapczyk and Hurtado, 2007).
Details of the mechanisms of this progressive damage model and its implementation can
be found in ABAQUS documentation (ABAQUS, 2014). In order to explain the input
parameters implemented in this study, a brief description of the mechanisms of this model
is presented as follows (ABAQUS, 2014):
The damage initiation criteria of fiber and matrix failure are given in the following
equations:
Fiber tension failure (𝜎𝜎11� ≥ 0):
𝐹𝐹𝑓𝑓𝑡𝑡 = �𝜎𝜎11�𝑋𝑋𝑇𝑇�2
+ 𝛼𝛼 �𝜏𝜏12�𝑆𝑆𝐿𝐿�2 (5.1)
Fiber compression failure (𝜎𝜎11� < 0):
𝐹𝐹𝑓𝑓𝑐𝑐 = �𝜎𝜎11�𝑋𝑋𝐶𝐶�2 (5.2)
Matrix tension failure (𝜎𝜎22� ≥ 0):
𝐹𝐹𝑚𝑚𝑡𝑡 = �𝜎𝜎22�𝑌𝑌𝑇𝑇�2
+ 𝛼𝛼 �𝜏𝜏12�𝑆𝑆𝐿𝐿�2 (5.3)
Matrix compression failure (𝜎𝜎22� < 0):
𝐹𝐹𝑚𝑚𝑐𝑐 = �𝜎𝜎22�2𝑆𝑆𝑇𝑇
�2
+ �� 𝑌𝑌𝐶𝐶
2𝑆𝑆𝑇𝑇�2− 1� 𝜎𝜎22�
𝑌𝑌𝐶𝐶+ �𝜏𝜏12�
𝑆𝑆𝐿𝐿�2 (5.4)
where
𝐹𝐹 = the damage initiation factor (when the respective value of 𝐹𝐹 equals one, the
representative tensile/compressive damage in fiber or matrix begins to be
initiated);

Chapter 5 - Numerical Study of Pultruded GFRP Composites to Low-Velocity Impacts
78
𝜎𝜎11� = the effective normal stress in longitudinal direction;
𝜎𝜎22� = the effective normal stress in transverse direction;
𝜏𝜏12� = the effective shear stress;
𝛼𝛼 = the coefficient that presents the ratio of the shear stress to tension;
𝑋𝑋𝑇𝑇 = the tensile strength in longitudinal direction;
𝑆𝑆𝐿𝐿 = the shear strength in longitudinal direction;
𝑋𝑋𝐶𝐶 = the compressive strength in longitudinal direction;
𝑌𝑌𝑇𝑇 = the tensile strength in transverse direction;
𝑆𝑆𝑇𝑇 = the shear strength in transverse direction; and
𝑌𝑌𝐶𝐶 = the compressive strength in transverse direction.
The effective stress 𝜎𝜎� (𝜎𝜎11� , 𝜎𝜎22� and 𝜏𝜏12� ) can be calculated from the following
equation:
𝜎𝜎� = 𝑀𝑀𝜎𝜎 (5.5)
where
𝑀𝑀 = the damage operator; and
𝜎𝜎 = the true normal or shear stress.
From Eq. 5.5, the effective stress 𝜎𝜎� in the damage criterion (Eq. 5.1 – 5.4) is
converted from the true stress by using the damage operator 𝑀𝑀. The operator 𝑀𝑀 is a tensor
that is modified with the changes of damage variables. The relationship between the
damage variables and the damage operator is formulised in Eq. 5.6.

Chapter 5 - Numerical Study of Pultruded GFRP Composites to Low-Velocity Impacts
79
𝑀𝑀 =
⎣⎢⎢⎢⎡
1�1−𝑑𝑑𝑓𝑓�
0 0
0 1(1−𝑑𝑑𝑚𝑚) 0
0 0 1(1−𝑑𝑑𝑠𝑠)⎦
⎥⎥⎥⎤
(5.6)
where
𝑑𝑑𝑓𝑓 = the internal fiber damage variable;
𝑑𝑑𝑚𝑚 = the internal matrix damage variable; and
𝑑𝑑𝑠𝑠 = the internal shear damage variable.
The damage variables 𝑑𝑑 present the current state of the damage, when 𝑑𝑑 is equal to
zero, no damage has been initiated. Conversely, when 𝑑𝑑 reaches one, the fiber or matrix
is fully damaged and no further load can be carried. The current state of fiber or matrix
damage variables corresponds to the respective effective values, and the shear damage
variable is the result of a complex combination of the fiber and matrix damage variables,
as shown in the following equations:
𝑑𝑑𝑓𝑓 = �𝑑𝑑𝑓𝑓𝑡𝑡 𝑆𝑆𝑓𝑓 𝜎𝜎11� ≥ 0𝑑𝑑𝑓𝑓𝑐𝑐 𝑆𝑆𝑓𝑓 𝜎𝜎11� < 0
(5.7)
𝑑𝑑𝑚𝑚 = �𝑑𝑑𝑚𝑚𝑡𝑡 𝑆𝑆𝑓𝑓 𝜎𝜎22� ≥ 0𝑑𝑑𝑚𝑚𝑐𝑐 𝑆𝑆𝑓𝑓 𝜎𝜎22� < 0 (5.8)
𝑑𝑑𝑠𝑠 = 1 − �1 − 𝑑𝑑𝑓𝑓𝑡𝑡��1 − 𝑑𝑑𝑓𝑓𝑐𝑐�(1 − 𝑑𝑑𝑚𝑚𝑡𝑡 )(1− 𝑑𝑑𝑚𝑚𝑐𝑐 ) (5.9)
where
𝑑𝑑𝑓𝑓𝑡𝑡 = the damage variable in fiber tension failure;
𝑑𝑑𝑓𝑓𝑐𝑐 = the damage variable in fiber compression failure;
𝑑𝑑𝑚𝑚𝑡𝑡 = the damage variable in matrix tension failure; and

Chapter 5 - Numerical Study of Pultruded GFRP Composites to Low-Velocity Impacts
80
𝑑𝑑𝑚𝑚𝑐𝑐 = the damage variable in matrix compression failure.
After the initiation of the damage, the material response is calculated through the
use of a modified stiffness matrix tensor 𝐶𝐶𝑑𝑑 in ABAQUS/Explicit, expressed by Eq. 5.10.
𝜎𝜎 = 𝐶𝐶𝑑𝑑𝜀𝜀 (5.10)
where
𝐶𝐶𝑑𝑑 = the damaged elasticity matrix; and
𝜀𝜀 = the current strain.
In ABAQUS, the damaged elasticity matrix can be expressed by:
𝐶𝐶𝑑𝑑 = 1𝐷𝐷�
�1 − 𝑑𝑑𝑓𝑓�𝐸𝐸1 �1 − 𝑑𝑑𝑓𝑓�(1− 𝑑𝑑𝑚𝑚)𝑣𝑣21𝐸𝐸1 0�1 − 𝑑𝑑𝑓𝑓�(1 − 𝑑𝑑𝑚𝑚)𝑣𝑣12𝐸𝐸2 (1 − 𝑑𝑑𝑚𝑚)𝐸𝐸2 0
0 0 (1 − 𝑑𝑑𝑠𝑠)𝐺𝐺𝐷𝐷� (5.11)
𝐷𝐷 = 1 − �1 − 𝑑𝑑𝑓𝑓�(1 − 𝑑𝑑𝑚𝑚)𝑣𝑣12𝑣𝑣21 (5.12)
where
𝐸𝐸1 = the Young’s modulus in longitudinal direction;
𝐸𝐸2 = the Young’s modulus in transverse direction;
𝑣𝑣12 = the Poisson’s ratio in longitudinal direction;
𝑣𝑣21 = the Poisson’s ratio in transverse direction; and
𝐺𝐺 = the shear modulus.
From the above equations, the damaged stiffness matrix depends on the modified
values of the damage variables. The stiffness decreases as the damage variables increase.

Chapter 5 - Numerical Study of Pultruded GFRP Composites to Low-Velocity Impacts
81
Therefore, the calculation of the damage variables is essential to analyse the residual
stiffness of the composite material.
The post-failure damage variables for different failure modes can be expressed as a
function of the corresponding equivalent displacement, as shown in Eq. 5.13:
𝑑𝑑 =𝛿𝛿𝑒𝑒𝑒𝑒𝑓𝑓 �𝛿𝛿𝑒𝑒𝑒𝑒−𝛿𝛿𝑒𝑒𝑒𝑒0 �
𝛿𝛿𝑒𝑒𝑒𝑒𝑓𝑓 �𝛿𝛿𝑒𝑒𝑒𝑒
𝑓𝑓 −𝛿𝛿𝑒𝑒𝑒𝑒0 � (5.13)
where
𝛿𝛿𝑒𝑒𝑒𝑒𝑓𝑓 = the equivalent displacement at which the composite material is fully
damaged;
𝛿𝛿𝑒𝑒𝑒𝑒 = the current state equivalent displacement; and
𝛿𝛿𝑒𝑒𝑒𝑒0 = the initial equivalent displacement at the point of damage initiated.
The equivalent displacement for each mode can be presented as a function of the
equivalent stress in a damage evolution law. The relationship between the equivalent
stress and displacement is shown in Figure 5.2.
Figure 5.2 Typical relationship between equivalent stress and displacement

Chapter 5 - Numerical Study of Pultruded GFRP Composites to Low-Velocity Impacts
82
As shown in Figure 5.2, the area of the triangle OAC stands for the energy
dissipated due to the failure in each mode. Point A represents the point at which the
damage initiated and point C represents the point at which the composite material
completely failed. Before reaching point A, no damage is expected for the material.
Beyond point A, the evolution law will calculate the drop in the equivalent stress as the
equivalent displacement increases. The calculations of equivalent displacement 𝛿𝛿𝑒𝑒𝑒𝑒 and
equivalent stress 𝜎𝜎𝑒𝑒𝑒𝑒 are shown in the following equations:
Fiber Tension (𝜎𝜎11� ≥ 0):
𝛿𝛿𝑒𝑒𝑒𝑒𝑓𝑓𝑡𝑡 = 𝐿𝐿𝐶𝐶�⟨𝜀𝜀11⟩2 + 𝛼𝛼𝜀𝜀122 (5.14)
𝜎𝜎𝑒𝑒𝑒𝑒𝑓𝑓𝑡𝑡 = ⟨𝜎𝜎11⟩⟨𝜀𝜀11⟩+𝛼𝛼𝜏𝜏12𝜀𝜀12
𝛿𝛿𝑒𝑒𝑒𝑒𝑓𝑓𝑓𝑓 𝐿𝐿𝐶𝐶�
(5.15)
Fiber Compression (𝜎𝜎11� < 0):
𝛿𝛿𝑒𝑒𝑒𝑒𝑓𝑓𝑐𝑐 = 𝐿𝐿𝐶𝐶⟨−𝜀𝜀11⟩ (5.16)
𝜎𝜎𝑒𝑒𝑒𝑒𝑓𝑓𝑐𝑐 = ⟨−𝜎𝜎11⟩⟨−𝜀𝜀11⟩
𝛿𝛿𝑒𝑒𝑒𝑒𝑓𝑓𝑓𝑓 𝐿𝐿𝐶𝐶�
(5.17)
Matrix Tension (𝜎𝜎22� ≥ 0):
𝛿𝛿𝑒𝑒𝑒𝑒𝑚𝑚𝑡𝑡 = 𝐿𝐿𝐶𝐶�⟨𝜀𝜀22⟩2 + 𝜀𝜀122 (5.18)
𝜎𝜎𝑒𝑒𝑒𝑒𝑚𝑚𝑡𝑡 = ⟨𝜎𝜎22⟩⟨𝜀𝜀22⟩+𝜏𝜏12𝜀𝜀12𝛿𝛿𝑒𝑒𝑒𝑒𝑚𝑚𝑓𝑓 𝐿𝐿𝐶𝐶⁄ (5.19)
Matrix Compression (𝜎𝜎22� < 0):
𝛿𝛿𝑒𝑒𝑒𝑒𝑚𝑚𝑐𝑐 = 𝐿𝐿𝐶𝐶�⟨−𝜀𝜀22⟩2 + 𝜀𝜀122 (5.20)
𝜎𝜎𝑒𝑒𝑒𝑒𝑚𝑚𝑐𝑐 = ⟨−𝜎𝜎11⟩⟨−𝜀𝜀11⟩+𝜏𝜏12𝜀𝜀12𝛿𝛿𝑒𝑒𝑒𝑒𝑚𝑚𝑓𝑓 𝐿𝐿𝐶𝐶⁄ (5.21)

Chapter 5 - Numerical Study of Pultruded GFRP Composites to Low-Velocity Impacts
83
where
𝛿𝛿𝑒𝑒𝑒𝑒𝑓𝑓𝑡𝑡 = the current equivalent displacement in the post fiber tension failure;
𝛿𝛿𝑒𝑒𝑒𝑒𝑓𝑓𝑐𝑐 = the current equivalent displacement in the post fiber compression failure;
𝛿𝛿𝑒𝑒𝑒𝑒𝑚𝑚𝑡𝑡 = the current equivalent displacement in the post matrix tension failure;
𝛿𝛿𝑒𝑒𝑒𝑒𝑚𝑚𝑐𝑐 = the current equivalent displacement in the post matrix compression failure;
𝜎𝜎𝑒𝑒𝑒𝑒𝑓𝑓𝑡𝑡 = the current equivalent stress in the post fiber tension failure;
𝜎𝜎𝑒𝑒𝑒𝑒𝑓𝑓𝑐𝑐 = the current equivalent stress in the post fiber compression failure;
𝜎𝜎𝑒𝑒𝑒𝑒𝑚𝑚𝑡𝑡 = the current equivalent stress in the post matrix tension failure;
𝜎𝜎𝑒𝑒𝑒𝑒𝑚𝑚𝑐𝑐 = the current equivalent stress in the post matrix compression failure;
𝜀𝜀11 = the principal strain in longitudinal direction;
𝜀𝜀22 = the principal strain in transverse direction;
𝜀𝜀12 = the principal shear strain;
𝜏𝜏12 = the tangential strain;
𝐿𝐿𝐶𝐶 = the characteristic length; and
⟨ ⟩ = the Macaulay bracket operator (when 𝑥𝑥 ∈ 𝑅𝑅 as ⟨𝑥𝑥⟩ = (𝑥𝑥 + |𝑥𝑥|) 2⁄ ).
In either way, loading or unloading, the equivalent stress will drop down to zero.
The values of the equivalent displacement at this point are controlled by the fracture
energy 𝐺𝐺𝐶𝐶 (the input parameters 𝐺𝐺𝑓𝑓𝑡𝑡𝐶𝐶 , 𝐺𝐺𝑓𝑓𝑐𝑐𝐶𝐶 , 𝐺𝐺𝑚𝑚𝑡𝑡𝐶𝐶 , 𝐺𝐺𝑚𝑚𝑐𝑐𝐶𝐶 represent the energies dissipated
during the damage in the failure of fiber tension, fiber compression, matrix tension and

Chapter 5 - Numerical Study of Pultruded GFRP Composites to Low-Velocity Impacts
84
matrix compression respectively). Beyond point A in Figure 5.2, when the model is
unloaded before the occurrence of complete failure, the equivalent stress will drop back
linearly from point B. The modified fracture energy is then presented by the area of the
triangle OBC. When the damage variables continuously develops to the value of one
(point C), the composite material is completely damaged and no more load can be carried.
In ABAQUS/Explicit, the behaviour of rate-dependent material can be modelled by
introducing the viscous regularisation coefficients. The viscous regularisation of a
composite material can be defined as follows:
𝑑𝑑�̇�𝑣 = 1𝜂𝜂
(𝑑𝑑 − 𝑑𝑑𝑣𝑣) (5.22)
where
𝑑𝑑�̇�𝑣 = the true value of the damage variable in the viscous system;
𝜂𝜂 = the viscosity coefficient controlling the rate of relaxation time;
𝑑𝑑 = the calculated damage variable; and
𝑑𝑑𝑣𝑣 = the regularised damage variable used in the damaged stiffness matrix 𝐶𝐶𝑑𝑑.
Four input parameters (𝜂𝜂𝑓𝑓𝑡𝑡, 𝜂𝜂𝑓𝑓𝑐𝑐, 𝜂𝜂𝑚𝑚𝑡𝑡, 𝜂𝜂𝑚𝑚𝑐𝑐) represent the viscosity coefficients used
for fiber failure in tension, compression, and matrix in tension and compression
respectively. The rate of increase of damage can be decelerated by introducing the
viscosity coefficients, which will result in an increase of the dissipated energy as well as
the rates of deformation. This behaviour can be treated as the method of modelling rate-
dependent materials. In ABAQUS/Explicit, a small value of the viscosity input parameter
is recommended. Since the method for calculating the viscosity coefficients has not been
established, extensive trials have been done to determine the reliable input for the
viscosity regularisation model, as shown in Table 5.1.

Chapter 5 - Numerical Study of Pultruded GFRP Composites to Low-Velocity Impacts
85
Table 5.1 Damage stabilization parameters for pultruded GFRP composites
ƞft ƞfc ƞmt ƞmc 0.0001 0.0001 0.00015 0.00015
Moreover, there is no established method for calculating the fracture energy of
pultruded GFRP composites in the literature as well; however, there are some reference
data and studies available in the literature for glass fiber-reinforced laminates (Pinho et
al., 2006, Lapczyk and Hurtado, 2007, Canal et al., 2012, Barbero et al., 2013, Philippidis
and Antoniou, 2013). Therefore, extensive numerical trials with different parameters have
been developed to determine the reliable input parameters for this model. The ratio
between the input parameters of the fracture energy and the material mechanical
properties used in this simulation match with what is reported in the literature. From the
numerical results of different input values for the fracture energy, the value of matrix
tensile fracture energy played a significant role, which indicates matrix cracking is a
primary failure mode in this numerical investigation. This corroborates the experimental
results reported in the preceding chapter, in which the major failure mode is matrix
cracking. The material properties (obtained from coupon tests) and input parameters are
shown in Table 5.2 – 5.4.
Table 5.2 Material properties of pultruded GFRP composites
E1[MPa] E2[MPa] G12[MPa] Nu12 εft = εfc εtt = εtc = εs 28870 3505 2980 0.21 0.011 0.013
Table 5.3 Damage initiation parameters of pultruded GFRP composites
XT[MPa] XC[MPa] YT[MPa] YC[MPa] SL[MPa] 301.198 310.785 29.78 31.97 33.0

Chapter 5 - Numerical Study of Pultruded GFRP Composites to Low-Velocity Impacts
86
Table 5.4 Damage evolution parameters for pultruded GFRP composites
Gft,c [N/mm] Gfc,c [N/mm] Gmt,c [N/mm] Gmc,c [N/mm] 55.0 95.0 11.5 11.5
5.4 Numerical results
A representation of the FEM is shown in Figure 5.3. The predicted results were
compared with the experimental ones. A comparison of load histories for all the impact
energy levels is shown in Fig. 5.4. A reasonably good agreement is achieved between the
experimental results and the numerical ones.
Figure 5.3 Schematic diagram of experimental test and numerical simulation in progress

Chapter 5 - Numerical Study of Pultruded GFRP Composites to Low-Velocity Impacts
87
Figure 5.4 Comparison between numerical and experimental results for force-time at all
impact energies
In the early loading stage, three linear increases of load in the elastic regime were
well simulated in all the numerical models. After that, an inelastic behaviour was shown
till up to the maximum load. The peak force predicted by the FEMs were 8.25, 11.54,
13.74 and 15.69 kN, respectively for four energy levels, which was slightly
underestimated for lower impact energy events, as shown in Figure 5.6. In the unloading
stage, the tendency of impact force was slightly overestimated for lower energy levels
when compared to the experimental results. It was assumed that some internal damage,
such as delamination between mat and roving layers, reduced the bending stiffness of the
pultruded GFRP composites during the higher energy impact tests. The comparison of

Chapter 5 - Numerical Study of Pultruded GFRP Composites to Low-Velocity Impacts
88
central deflection histories for all the impact energy levels are shown in Figure 5.5. A
reasonable agreement is achieved compared with the experimental data. In the loading
stage, the slope of the curve presented a good match with the experimental results. As
shown in Figure 5.6, the maximum central deflections predicted by FEMs were 3.391,
4.945, 5.996 and 7.037 mm respectively for four energy levels. The deflection was
slightly overestimated for lower impact energy event. However, the central deflection
were underestimated for higher energy tests. The composite material was simulated stiffer
during higher impact energy events when compared to the experimental tests. In the
unloading stage, the predicted rebound behaviour was faster than that in the experimental
tests, and the unrecoverable deformation (end of deflection-time curves) were predicted
smaller than the experimental results. This indicated that the post-failure strength of
pultruded GFRP composites were modelled stiffer after the impact events, and more
impact energies were absorbed in the experiments. This matches the impact behaviour
shown in the force-time curves; the internal damage during the experimental tests reduced
the stiffness of the material. The comparison of impact performance in terms of maximum
load and central deflection between numerical and experimental results is shown in Figure
5.6. Similar to the findings in the experimental results, the maximum impact load and the
maximum central deflection increase near linearly with respect to the impact energy. The
impact performance presents a fairly good agreement between the experimental results
and the numerical ones in terms of maximum impact load and deflection.

Chapter 5 - Numerical Study of Pultruded GFRP Composites to Low-Velocity Impacts
89
Figure 5.5 Comparison of numerical and experimental results for central deflection
versus time curves at all impact energies
Figure 5.6 Comparison of maximum load and central deflection between numerical and
experiment results

Chapter 5 - Numerical Study of Pultruded GFRP Composites to Low-Velocity Impacts
90
The development and propagation of stress was evaluated through the visualization
of the numerical results. During the numerical analysis, the transverse stress in the top
layer increased quickly and matched the initiation criteria of the progressive damage
model, which indicated the matrix cracking first occurred during the simulation. With the
increase in contact duration, the stress propagated from oblong shape into peanut shape
through the top layer to the bottom layer, which matched the damage area shape shown
on the back surface from the experiment. The schematic diagrams of the von Mises stress,
the minimum in-plane principal stress, and the Tresca stress propagations are shown in
Figure 5.7 – Figure 5.12 respectively. The four subfigures in each figure correspond to
the numerical results for the four different impact energy levels. Since the vertical
displacement in the top layer of the experimental results were not available, these figures
are introduced only to present how the stress were developed and propagated, no colour
scales were required. A representation of the comparison between the experimental
results and numerical ones is shown in Figure 5.13. The numerical results were found to
corroborate the experimental ones in terms of cracking patterns and damage areas with
respect to the impact energy levels.

Chapter 5 - Numerical Study of Pultruded GFRP Composites to Low-Velocity Impacts
91
Figure 5.7 Schematic diagrams of von Mises stress propagation in top layer
Figure 5.8 Schematic diagrams of von Mises stress propagation in bottom layer

Chapter 5 - Numerical Study of Pultruded GFRP Composites to Low-Velocity Impacts
92
Figure 5.9 Schematic diagrams of Minimum in-plane principal stress propagation in top
layer
Figure 5.10 Schematic diagrams of Maximum in-plane principal stress propagation in
bottom layer

Chapter 5 - Numerical Study of Pultruded GFRP Composites to Low-Velocity Impacts
93
Figure 5.11 Schematic diagrams of Tresca stress propagation in top layer
Figure 5.12 Schematic diagrams of Tresca stress propagation in bottom layer

Chapter 5 - Numerical Study of Pultruded GFRP Composites to Low-Velocity Impacts
94
Figure 5.13 The comparison of experimental and numerical results
5.5 Summary
In this chapter, a numerical study of impact response of pultruded GFRP composites
subjected to low-velocity impact loadings was conducted. A non-linear FEM was
developed using the progressive damage model to simulate such behaviour. The
numerical predictions were found to corroborate the experimental results in terms of load-
time and central deflection-time curves. The numerical simulation indicates that the

Chapter 5 - Numerical Study of Pultruded GFRP Composites to Low-Velocity Impacts
95
tensile stress in the transverse direction of the top layer exceeds the limitation after the
elastic stage and satisfies the damage initiation criteria of the progressive damage model.
In the unloading stage, the miss-match of the load-time and displacement-time curves
between the experimental and the numerical results show the internal damage in the
experimental tests reduced the bending stiffness of the pultruded GFRP composites. The
validated numerical model from this chapter will be employed in the numerical
investigations of hybrid GFRP-concrete beams.

Chapter 6
Numerical Study of the Hybrid GFRP-
Concrete Beam to Static Loading3
6.1 Introduction
In Chapter 5, numerical investigations of pultruded GFRP coupons subjected to
low-velocity impacts were performed. A good agreement was achieved between the
numerical results and the experimental ones. The progressive damage model proved to be
reliable for simulating the behaviour of pultruded GFRP composites. In this chapter, the
validated GFRP material model and the concrete damaged plasticity model (CDPM) are
employed for the different materials used in the hybrid members. The hybrid GFRP-
concrete beam, which consists of high strength ordinary Portland cement concrete (OPC)
filled into the rectangular hollow pultruded profiles, is investigated numerically using the
commercial software ABAQUS/Standard. A non-linear numerical model is developed to
predict the flexural behaviour of the hybrid structure under four-point static loadings. The
effect of mesh dimensions and the use of a debonding model are also reported in this
chapter. The numerical results are compared with the published experimental data from
the literature. The main purpose of this numerical investigation is to validate the
numerical model of hybrid GFRP-concrete system with experimental results and to
3 Results discussed in this chapter form part of the following publication:
LI, Z., KHENNANE, A. & HAZELL, P. J. 2016. Numerical investigation of a hybrid FRP-geopolymer concrete beam. Applied Mechanics and Materials, 846, 452-457.

Chapter 6 - Numerical Study of the Hybrid GFRP-Concrete Beam to Static Loading
97
present the reference setup parameters for the experimental program of the hybrid beams
subjected to impact loadings.
6.2 Description of the experimental program
To validate the numerical model of the hybrid GFRP-concrete beam, an
experimental test case of this hybrid system has been reported here (Ferdous et al., 2013).
Three hybrid beams were cast with base-plates on both ends. The hybrid beams were
tested along the weak axis under a four-point bending test to evaluate its flexural
behaviour. The total length of each beam was 2000 mm and the span length was 1440mm.
The schematic diagram of the experimental setup is shown in Figure 6.1.
Figure 6.1 Schematic diagram of the experimental setup (Ferdous et al., 2013)
6.3 Finite element model
A non-linear FEM was developed using the commercial software
ABAQUS/Standard to simulate the flexural behaviour of the hybrid GFRP-concrete
beam. Linear eight-node three-dimensional solid elements with reduced integration

Chapter 6 - Numerical Study of the Hybrid GFRP-Concrete Beam to Static Loading
98
(C3D8R) were used to model the concrete volume, while the pultruded GFRP profiles
were modelled by using eight-node quadrilateral in-plane general-purpose continuum
shell elements (SC8R). The pultruded GFRP composites and the concrete inside were
fully bonded through all the contact surfaces to ensure the kinetic continuity during the
loading period. Due to the symmetry of loading and geometry, only half of the beam was
modelled. Displacement control was used for the arrangements of the test, as per the
experimental setup. The assembled FEM boundary conditions is shown in Figure 6.2.
Figure 6.2 Assembled FEM for the hybrid GFRP-concrete beams
6.4 Material models
Two material models of concrete and FRP composites were used in this analysis.
The concrete section of the hybrid beam was modelled using the CDPM and, the
pultruded GFRP composites were modelled using the progressive damage model (Hashin
damage model).

Chapter 6 - Numerical Study of the Hybrid GFRP-Concrete Beam to Static Loading
99
6.4.1 Progressive damage model
The progressive damage model used for the pultruded GFRP composites in Chapter
5 was employed in this analysis. Details of the failure mechanisms and the input
parameters can be found in the preceding chapter.
6.4.2 Concrete damaged plasticity model
There are three different material models integrated in ABAQUS for modelling the
non-linear behaviour of concrete, smeared crack concrete model, brittle crack concrete
model and CDPM. The latter approach was chosen, which is aimed at providing a general
capability for modelling concrete by using the concepts of isotropic damaged elasticity in
combination with isotropic tensile and compressive plasticity to represent the inelastic
behaviour of concrete.
6.4.2.1 Mechanisms of CDPM
The detailed description of the CDPM and its implementation are available in the
ABAQUS Documentation (ABAQUS, 2014). To explain the input parameters used in
this model, a brief description of the CDPM is presented (ABAQUS, 2014) next.
The total strain at a Gauss point within an element can be either elastic or elasto-
plastic. Hence, the differential of the deformations consists of two parts, elastic and plastic
strain, which can be expressed as:
𝜀𝜀 = 𝜀𝜀𝑒𝑒 + 𝜀𝜀𝑝𝑝 (6.1)
where
𝜀𝜀 = the total strain;
𝜀𝜀𝑒𝑒 = the elastic strain; and

Chapter 6 - Numerical Study of the Hybrid GFRP-Concrete Beam to Static Loading
100
𝜀𝜀𝑝𝑝 = the plastic strain.
The stress in each element of the concrete block is governed by a function of the
variables of strain:
𝜎𝜎′ = (1 − 𝑑𝑑)𝐷𝐷𝑜𝑜𝑒𝑒 ∶ (𝜀𝜀 − 𝜀𝜀𝑝𝑝) = 𝐷𝐷𝑒𝑒 ∶ (𝜀𝜀 − 𝜀𝜀𝑝𝑝) (6.2)
where
𝜎𝜎′ = the stress in the concrete elements;
𝑑𝑑 = the degradation variables;
𝐷𝐷𝑜𝑜𝑒𝑒 = the undamaged elastic stiffness; and
𝐷𝐷𝑒𝑒 = the damaged elastic stiffness.
From the Eq. 6.2, the stiffness of the element decreases with the increase of the
damage variable. When the value of the damage variable raises up to one, the stiffness of
the element decreases down to zero and no further load can be carried by the Gauss point.
The effective stress in a damaged model can be expressed as:
𝜎𝜎� = 𝐷𝐷𝑒𝑒 ∶ (𝜀𝜀 − 𝜀𝜀𝑝𝑝) (6.3)
𝜎𝜎′ = (1 − 𝑑𝑑)𝜎𝜎� (6.4)
where
𝜎𝜎� = the effective stress in the damaged material model.
From the Eq. 6.3 and 6.4, the effective stress is governed by the strain and the
damaged variable. When the damage begins to be initiated (1 > 𝑑𝑑 > 0), the material
response is presented in a plastic behaviour. During this period, the damage states under

Chapter 6 - Numerical Study of the Hybrid GFRP-Concrete Beam to Static Loading
101
compression and tension are represented by the hardening variables, 𝜀𝜀�̃�𝑐𝑝𝑝 and 𝜀𝜀�̃�𝑡
𝑝𝑝
respectively, which can be determined by:
𝜀𝜀�̃�𝑐𝑝𝑝 = −𝜀𝜀�̃�𝑚𝑖𝑖𝑘𝑘
𝑝𝑝 ∙ �1 − 𝑟𝑟(𝜎𝜎��)� (6.5)
𝜀𝜀�̃�𝑡𝑝𝑝 = −𝜀𝜀�̃�𝑚𝑎𝑎𝑚𝑚
𝑝𝑝 ∙ 𝑟𝑟(𝜎𝜎��) (6.6)
where
𝜀𝜀�̃�𝑐𝑝𝑝 = the equivalent plastic strain in compression;
𝜀𝜀�̃�𝑡𝑝𝑝 = the equivalent plastic strain in tension;
𝜀𝜀�̃�𝑚𝑖𝑖𝑘𝑘𝑝𝑝 = the minimum eigenvalue of the plastic strain;
𝜀𝜀�̃�𝑚𝑎𝑎𝑚𝑚𝑝𝑝 = the maximum eigenvalue of the plastic strain;
𝜎𝜎�� = the effective stress tensor; and
𝑟𝑟 = the weight factor.
The effects of the weight factor into stress can be calculated from:
𝑟𝑟(𝜎𝜎��) = ∑ ⟨𝜎𝜎��𝑖𝑖⟩3𝑖𝑖=1 ∑ |𝜎𝜎��𝑖𝑖|3
𝑖𝑖=1⁄ (6.7)
where
𝜎𝜎��𝑖𝑖 = the principal stress;
⟨ ⟩ = the Macaulay bracket operator (when 𝑥𝑥 ∈ 𝑅𝑅 as ⟨𝑥𝑥⟩ = (𝑥𝑥 + |𝑥𝑥|) 2⁄ ); and
| | = the absolute value.
The hardening variables, 𝜀𝜀�̃�𝑐𝑝𝑝 and 𝜀𝜀�̃�𝑡
𝑝𝑝, from Eq. 6.5 and 6.6 can be determined as a
tabular function of the equivalent stress in the specified compression hardening and

Chapter 6 - Numerical Study of the Hybrid GFRP-Concrete Beam to Static Loading
102
tension softening behaviour of concrete in CDPM. The weight factor 𝑟𝑟, ranging from 0
to 1, is incorporated with the effective stress tensor to represent the ratio of the principal
stress.
In ABAQUS, the yield function (Lubliner et al., 1989, Lee and Fenves, 1998) is
employed to introduce the damage evolution of strength in the compressive and/or tensile
failure of the concrete. The yield function is defined as an effective surface which
represents the states of the damaged model in terms of the effective stress, as shown in
Figure 6.3.
Figure 6.3 Yield surface in plane stress (ABAQUS, 2014)
To determine the evolution of the yield surface by the use of the effective stresses
and hardening variables, the yield function can be formulated as:

Chapter 6 - Numerical Study of the Hybrid GFRP-Concrete Beam to Static Loading
103
𝐹𝐹(𝜎𝜎�, 𝜀𝜀̃𝑝𝑝) = 11−𝛼𝛼
(𝑞𝑞� − 3𝛼𝛼�̅�𝑝 + 𝛽𝛽(𝜀𝜀̃𝑝𝑝)⟨𝜎𝜎��𝑚𝑚𝑎𝑎𝑚𝑚⟩ − 𝛾𝛾⟨𝜎𝜎��𝑚𝑚𝑎𝑎𝑚𝑚⟩) − 𝜎𝜎�(𝜀𝜀̃𝑝𝑝) ≤ 0 (6.8)
where
𝐹𝐹 = the yield surface;
𝛼𝛼 = the dimensionless constant;
𝛽𝛽 = the dimension coefficient;
𝛾𝛾 = the dimensionless material constant;
�̅�𝑝 = the effective hydrostatic pressure;
𝑞𝑞� = the effective Mises equivalent stress; and
𝜎𝜎��𝑚𝑚𝑎𝑎𝑚𝑚 = the maximum effective principal stress.
The values of 𝛼𝛼, 𝛽𝛽, 𝛾𝛾, �̅�𝑝, 𝑞𝑞� can be obtained from:
𝛼𝛼 =�𝜎𝜎𝑏𝑏0 𝜎𝜎𝑓𝑓0� �−1
2�𝜎𝜎𝑏𝑏0 𝜎𝜎𝑓𝑓0� �−1, 0 ≤ 𝛼𝛼 ≤ 0.5 (6.9)
where
𝜎𝜎𝑎𝑎0 = the initial equibiaxial compressive yield stress; and
𝜎𝜎𝑐𝑐0 = the initial uniaxial compressive yield stress.
The ratio of the initial equibiaixal compressive yield stress to the initial uniaxial
compressive yield stress can be implemented as a constant value in the CDPM.
𝛽𝛽 = (1 − 𝛼𝛼) 𝜎𝜎�𝑓𝑓(𝜀𝜀�𝑓𝑓𝑝𝑝)
𝜎𝜎�𝑓𝑓(𝜀𝜀�𝑓𝑓𝑝𝑝)− (1 + 𝛼𝛼) (6.10)
where

Chapter 6 - Numerical Study of the Hybrid GFRP-Concrete Beam to Static Loading
104
𝜎𝜎�𝑐𝑐(𝜀𝜀�̃�𝑐𝑝𝑝) = the effective compressive cohesion; and
𝜎𝜎�𝑡𝑡(𝜀𝜀�̃�𝑡𝑝𝑝) = the effective tensile cohesion.
𝛾𝛾 = 3(1−𝐾𝐾𝑓𝑓)2𝐾𝐾𝑓𝑓−1
(6.11)
𝐾𝐾𝑐𝑐 = 𝑞𝑞𝑇𝑇𝐶𝐶/𝑞𝑞𝐶𝐶𝐶𝐶 (6.12)
where
𝑞𝑞𝑇𝑇𝐶𝐶 = the second stress invariant on the tensile meridian;
𝑞𝑞𝐶𝐶𝐶𝐶 = the second stress invariant on the compressive meridian; and
𝐾𝐾𝑐𝑐 = the ratio of 𝑞𝑞𝑇𝑇𝐶𝐶 to 𝑞𝑞𝐶𝐶𝐶𝐶 at initial yield for any given value of the pressure
invariant 𝑝𝑝 when 𝜎𝜎�𝑚𝑚𝑎𝑎𝑚𝑚 < 0; 0.5 < 𝐾𝐾𝑐𝑐 ≤ 1.0.
The 𝐾𝐾𝑐𝑐 can be determined as a constant value in CDPM, which is recommended to
be 2/3.
�̅�𝑝 = −13∙ 𝑡𝑡𝑟𝑟𝐶𝐶𝑡𝑡𝐹𝐹(𝜎𝜎�) (6.13)
𝑞𝑞� = �32𝑆𝑆̅ ∶ 𝑆𝑆̅ (6.14)
𝑆𝑆̅ = 𝜎𝜎� + �̅�𝑝𝐼𝐼 (6.15)
where
𝑆𝑆̅ = the effective stress deviator; and
𝐼𝐼 = the identity matrix.
In the CDPM, the growth of the cracks and the concrete crushing are governed by
the variation of the plastic strain. When it is transformed into the corresponding

Chapter 6 - Numerical Study of the Hybrid GFRP-Concrete Beam to Static Loading
105
equivalent strain, the evolution of the yield surface would be controlled by the generated
equivalent strain. Hence, the failure of the concrete elements relies on the transforming
rate of the plastic strain. The amount of the plastic strain during this stage can be
determined by the non-associated plastic flow rule, which is expressed as:
𝜀𝜀̇𝑝𝑝 = �̇�𝜆 𝜕𝜕𝐺𝐺′
𝜕𝜕𝜎𝜎� (6.16)
where
𝜀𝜀̇𝑝𝑝 = the plastic strain increment;
�̇�𝜆 = the proportionality coefficient; and
𝐺𝐺′ = the plastic potential flow.
The potential flow can be defined by the Drucker-Prager hyperbolic plastic
potential function:
G′ = �(ϵσt0 tanψ)2 + 𝑞𝑞�2 − p� tanψ (6.17)
where
ϵ = the eccentricity parameter;
σt0 = the uniaxial tensile stress at failure; and
Ψ = the dilation angle.
The eccentricity ϵ can be implemented as a constant parameter in CDPM, which is
recommend to equal to 0.1. The dilation angle Ψ is defined in the p-q plane, which can
be expressed as:
ψ = dεvp
dγvp (6.18)

Chapter 6 - Numerical Study of the Hybrid GFRP-Concrete Beam to Static Loading
106
where
dεvp = the volumetric strain rate; and
dγvp = the volumetric shear strain rate.
The typical uniaxial compressive and tensile behaviour (stress-strain relationship)
of the concrete defined in the CDPM is shown in Figure 6.4. When the response of
concrete element behaves in the strain-softening zone due to compression and/or tension,
the internal damage has been initiated. The stiffness of the concrete decreases non-linearly
in the plastic zone. The degraded material response of concrete element is then expressed
as function of damage variables. The stress-strain relationships in this stage can be
formulised as:
For compression:
𝜎𝜎𝑐𝑐 = (1 − 𝑑𝑑𝑐𝑐)𝐸𝐸𝑖𝑖�𝜀𝜀 − 𝜀𝜀�̃�𝑐𝑝𝑝� (6.19)
For tension:
𝜎𝜎𝑡𝑡 = (1 − 𝑑𝑑𝑡𝑡)𝐸𝐸𝑖𝑖�𝜀𝜀 − 𝜀𝜀�̃�𝑡𝑝𝑝� (6.20)
where
𝜎𝜎𝑐𝑐 = the current compressive stress;
𝜎𝜎𝑡𝑡 = the current tensile stress;
𝑑𝑑𝑐𝑐 = the scalar damage variable in compression;
𝑑𝑑𝑡𝑡 = the scalar damage variable in tension;
𝐸𝐸𝑖𝑖 = the initial modulus of elasticity;

Chapter 6 - Numerical Study of the Hybrid GFRP-Concrete Beam to Static Loading
107
𝜀𝜀�̃�𝑐𝑝𝑝 = the plastic strain in compression; and
𝜀𝜀�̃�𝑡𝑝𝑝 = the plastic strain in tension.
Figure 6.4 A typical stress-strain relationship for compressive and tensile behaviour in
CDPM (ABAQUS, 2014)
After the plastic behaviour is presented, the cracks are initiated and propagate
through the elements. As a result, the effective load-carrying area is reduced, which
thereby leads to an increase of the corresponding effective stress. The effective stress in
compression 𝜎𝜎�𝑐𝑐 and tension is presented in Eq. 6.21 and 6.22 respectively.
𝜎𝜎�𝑐𝑐 = 𝜎𝜎𝑓𝑓1−𝑑𝑑𝑓𝑓
= 𝐸𝐸𝑖𝑖(𝜀𝜀 − 𝜀𝜀�̃�𝑐𝑝𝑝) (6.21)
𝜎𝜎�𝑡𝑡 = 𝜎𝜎𝑓𝑓1−𝑑𝑑𝑓𝑓
= 𝐸𝐸𝑖𝑖(𝜀𝜀 − 𝜀𝜀�̃�𝑡𝑝𝑝) (6.22)
where

Chapter 6 - Numerical Study of the Hybrid GFRP-Concrete Beam to Static Loading
108
𝜎𝜎�𝑐𝑐 = the effective uniaxial stress in compression; and
𝜎𝜎�𝑡𝑡 = the effective uniaxial stress in tension.
6.4.2.2 Input parameters study of CDPM
The material properties for the concrete (OPC) used in this study are shown in Table
6.1.
Table 6.1 Properties of high performance concrete (Ferdous, 2012)
Type of concrete
Modulus of elasticity,
[MPa]
Poisson’s ratio
Maximum compressive
strength, [MPa]
Maximum tensile
strength, [MPa]
OPC 30000 0.18* 57 3.4 *Assumed
Compression:
In the CDPM, the compressive behaviour of concrete is simulated by the use of an
elastic-plastic hardening model. In a typical uniaxial compressive loading case, the
concrete behaves elastically up to 30 – 50 % of its maximum compressive strength
(Beletich and Uno, 2003). In this study, the linear elastic behaviour is taken up to 45 %,
which is equivalent to 25.65 MPa. Beyond this, the material response is presented by the
use of the inputted tabular functions of stress and inelastic strain.
To describe the compressive behaviour of concrete, two different stress-strain
relationship models have been used to represent the stress-strain relationship of the
compression-hardening and strain-softening zone respectively. The expression for stress-
strain relationship of Popovics (1973), modified by Thorenfeldt et al. (1987) is chosen to
describe the compressive hardening behaviour, which is given by the following equation:

Chapter 6 - Numerical Study of the Hybrid GFRP-Concrete Beam to Static Loading
109
𝑓𝑓𝑓𝑓𝑓𝑓𝑓𝑓′
= 𝜀𝜀𝑓𝑓𝜀𝜀𝑓𝑓′∙ 𝑘𝑘
𝑘𝑘−1+�𝜀𝜀𝑓𝑓𝜀𝜀𝑓𝑓′ �
𝑛𝑛𝑛𝑛 (6.23)
where
𝑓𝑓𝑐𝑐 = the compressive stress;
𝑓𝑓𝑐𝑐′ = the maximum compressive strength;
𝜀𝜀𝑐𝑐 = the strain in compression;
𝜀𝜀𝑐𝑐′ = the strain when the compressive strength reaches the maximum value;
𝑛𝑛 = the curve fitting factor; and
𝑘𝑘 = the fitting constant (𝑘𝑘 = 1, when 𝜀𝜀𝑐𝑐 𝜀𝜀𝑐𝑐′⁄ ≤ 1).
Collins and Mitchell (1991) recommended, for OPC, the factor n to be estimated
as:
𝑛𝑛 = 0.8 + 𝑓𝑓𝑓𝑓′
17 𝑆𝑆𝑛𝑛 𝑀𝑀𝑃𝑃𝐶𝐶 𝑢𝑢𝑛𝑛𝑆𝑆𝑡𝑡 (6.24)
Collins et al. (1993) also suggested the value of 𝜀𝜀𝑐𝑐′ to be calculated through the
following expression:
𝜀𝜀𝑐𝑐′ = 𝑓𝑓𝑓𝑓′
𝐸𝐸𝑓𝑓∙ 𝑘𝑘𝑘𝑘−1
(6.25)
where
𝐸𝐸𝑐𝑐 = the Young’s modulus.
The expression for the stress-strain relationship from Carreira and Chu (1985),
modified by Wee et al. (1996) is chosen to describe the behaviour in strain softening zone
of concrete, which is given by the following equation:

Chapter 6 - Numerical Study of the Hybrid GFRP-Concrete Beam to Static Loading
110
𝑓𝑓𝑐𝑐 = 𝑓𝑓𝑐𝑐′
⎩⎨
⎧ 𝑘𝑘1′ 𝛽𝛽�𝜀𝜀𝑓𝑓𝜀𝜀𝑓𝑓′�
𝑘𝑘1′ 𝛽𝛽−1+�𝜀𝜀𝑓𝑓𝜀𝜀𝑓𝑓′ �
𝑛𝑛2′ 𝛽𝛽
⎭⎬
⎫ (6.26)
where
𝑘𝑘1′ = the material factor for high strength concrete;
𝑘𝑘2′ = the fitting factor for high strength concrete; and
𝛽𝛽 = the material parameter that depends on the shape of the stress-strain diagram.
When the maximum compressive strength of the concrete is less than 50 MPa, the
factors 𝑘𝑘1′ and 𝑘𝑘2′ are taken as unity (𝑘𝑘1′ = 𝑘𝑘2′ = 1). If the maximum compressive strength
is larger than 50 MPa, the factors 𝑘𝑘1′ and 𝑘𝑘2′ can be calculated by:
𝑘𝑘1′ = �50𝑓𝑓𝑓𝑓′�3 (6.27)
𝑘𝑘2′ = �50𝑓𝑓𝑓𝑓′�1.3
(6.28)
For the material parameter 𝛽𝛽, it is recommended to be calculated as:
𝛽𝛽 = 1
1−� 𝑓𝑓𝑓𝑓′
𝜀𝜀𝑓𝑓′ 𝐸𝐸𝑖𝑖𝑓𝑓� (6.29)
where
𝐸𝐸𝑖𝑖𝑡𝑡 = the initial tangent modulus.
The initial tangent modulus can be estimated by:
𝐸𝐸𝑖𝑖𝑡𝑡 = 10200(𝑓𝑓𝑐𝑐′)1 3⁄ (6.30)
The compressive stress-strain curve of the OPC is presented in Figure 6.5.

Chapter 6 - Numerical Study of the Hybrid GFRP-Concrete Beam to Static Loading
111
Figure 6.5 Compressive stress-strain curve
It is worth noting that the input compressive hardening data are presented in terms
of inelastic strain values instead of the plastic strain values for the implementation of the
compressive behaviour of concrete. The inelastic strain values can be calculated from:
𝜀𝜀𝑖𝑖𝑘𝑘 = 𝜀𝜀 − 𝜎𝜎𝑓𝑓𝐸𝐸𝑖𝑖
(6.31)
where
𝜀𝜀𝑖𝑖𝑘𝑘 = the inelastic strain.
The corresponding implemented compression damage variables can be obtained by:
𝜎𝜎𝑐𝑐 = (1 − 𝑑𝑑𝑐𝑐)𝐸𝐸𝑖𝑖(𝜀𝜀 − 𝜀𝜀𝑝𝑝) (6.32)
Tension:
Since no reinforcement is embedded inside of the concrete block, the tensile-
softening behaviour is recommended to be defined on the crack-opening law and fracture

Chapter 6 - Numerical Study of the Hybrid GFRP-Concrete Beam to Static Loading
112
energy cracking criterion in ABAQUS (ABAQUS, 2014). The mechanisms of this
method are briefly described as follows: once the tensile stress exceeds the damage
criterion, cracks are assumed to be formed perpendicular to the stress direction. After the
formation of the cracks, the effective area of the elements decreases, which results in an
increase of the tensile stress. With further loading, the damaged elements will be removed
and the cracking length will increase accordingly, which behaviour can be determined by
the opening at the cracks.
To simulate this tensile behaviour, the Hordijk (1991) tensile model is chosen, in
which the tensile behaviour of concrete is characterised by a stress-displacement
response. In this model, the concrete response is assumed to be linearly elastic before the
damage is introduced and a fracture energy value is employed to control the area in the
tension softening zone. The post-cracking behaviour is expressed by:
ft = 𝑓𝑓𝑡𝑡′ ��1 + (C1ωωc
)3� exp �−C2ωωc� − ω
ωc(1 + C13)exp (−C2)� (6.33)
where
ft = the tensile stress;
𝑓𝑓𝑡𝑡′ = the maximum tensile strength;
ω = the crack opening displacement;
ωc = the crack opening displacement at the complete release of stress;
C1 = a constant value of 3; and
C2 = a constant value of 6.93.
The value of ωc can be expressed as a function of the tensile fracture energy:

Chapter 6 - Numerical Study of the Hybrid GFRP-Concrete Beam to Static Loading
113
ωc = 5.14 Gf𝑓𝑓𝑓𝑓′
(6.34)
where
Gf = the tensile fracture energy.
According to Ueda (2004), the maximum tensile strength for OPC and the tensile
fracture energy can be calculated from:
𝑓𝑓𝑡𝑡′ = 0.23(𝑓𝑓𝑐𝑐′)2 3⁄ (6.35)
Gf = 10(dmax)1/3(𝑓𝑓𝑐𝑐′)1/3 (6.36)
where
dmax = the maximum aggregate size in mm (14 mm in this study).
The tensile stress-crack opening displacement curve of the OPC is shown in Figure
6.6.
Figure 6.6 Tensile stress-displacement curve

Chapter 6 - Numerical Study of the Hybrid GFRP-Concrete Beam to Static Loading
114
6.5 Mesh sensitivity
Mesh sensitivity is an important factor in finite element analysis. A proper FE mesh
will provide an accurate result with minimum computational time. To determine the
optimum mesh, three models with different mesh sizes were investigated, as shown in
Figure 6.7. The comparative results are summarised in Table 6.2.
Figure 6.7 Numerical models with different mesh sizes
Table 6.2 Comparison results for different meshes
Total elements Mesh size [mm] Failure load [kN] Diff [%] Mesh 1 159400 5 × 5 124.56 7.41 Mesh 2 20900 10 × 10 124.97 7.71 Mesh 3 4500 20 × 20 128.62 10.33
Considering the computational time (Figure 6.8) and the results for the failure load
(Figure 6.9), Mesh 2 produced a better compromise than Meshes 1 and 3, therefore Mesh
2 was selected for this analysis.

Chapter 6 - Numerical Study of the Hybrid GFRP-Concrete Beam to Static Loading
115
Figure 6.8 Computational time (Intel Core i7-3770 @ 3.40GHz)
Figure 6.9 Mesh sensitivity – Failure load

Chapter 6 - Numerical Study of the Hybrid GFRP-Concrete Beam to Static Loading
116
6.6 Numerical results
6.6.1 Fully bonded model
In the fully bonded model, kinematic continuity is assumed between the concrete
and the GFRP composites. As a result, the two different materials experience the same
deformation and no debonding failure is allowed. A comparison of the load-displacement
curves between the numerical and the experimental results is shown in Figure 6.10. The
slope of the curve from the numerical analysis matched with experimental data. The
ultimate failure load from the numerical analysis is 140 kN, while the ultimate failures
from the experimental tests take place at 120, 111 and 115 kN. The relative difference is
more than 20 % for this model.
Figure 6.10 Comparison between numerical and experimental results for load-
displacement curves (Fully bonded model)

Chapter 6 - Numerical Study of the Hybrid GFRP-Concrete Beam to Static Loading
117
6.6.2 Debonding model
The bond behaviour between the concrete and the pultruded profile is modelled by
using the surface-based cohesive behaviour because the interface thickness is negligibly
small. This model assumes the bonding behave as a linear elastic traction-separation law
before damage and, the failure of the cohesive bond is characterized by the progressive
degradation of the cohesive stiffness, which is driven by damage progress. A typical
relationship between traction and separation is shown in Figure 6.11.
Figure 6.11 Typical relationship between traction and separation (ABAQUS, 2014)
The elastic behaviour is formulated in terms of an elastic constitutive model, which
presents the relations of the normal and shear separations across the interface. The
traction-separation model is expressed based on an uncoupled stiffness matrix:
𝑇𝑇 = �𝑡𝑡𝑘𝑘𝑡𝑡𝑠𝑠𝑡𝑡𝑡𝑡� = �
𝑘𝑘𝑘𝑘𝑘𝑘 0 00 𝑘𝑘𝑠𝑠𝑠𝑠 00 0 𝑘𝑘𝑡𝑡𝑡𝑡
� �𝛿𝛿𝑘𝑘𝛿𝛿𝑠𝑠𝛿𝛿𝑡𝑡� = 𝐾𝐾𝛿𝛿 (6.37)
where
𝑇𝑇 = the traction stress;

Chapter 6 - Numerical Study of the Hybrid GFRP-Concrete Beam to Static Loading
118
𝐾𝐾 = the bond stiffness matrix;
𝛿𝛿 = the displacement of the contacting surfaces;
𝑡𝑡𝑘𝑘 = the nominal traction in the normal direction;
𝑡𝑡𝑠𝑠 = the nominal in-plane shear stress;
𝑡𝑡𝑡𝑡 = the nominal out-plane shear stress;
𝛿𝛿𝑘𝑘 = the displacement in normal direction;
𝛿𝛿𝑠𝑠 = the displacement in shear direction;
𝛿𝛿𝑡𝑡 = the displacement in through-thickness direction;
𝑘𝑘𝑘𝑘𝑘𝑘 = the stiffness in normal direction;
𝑘𝑘𝑠𝑠𝑠𝑠 = the stiffness in shear direction; and
𝑘𝑘𝑡𝑡𝑡𝑡 = the stiffness in through-thickness direction.
According to Henriques et al. (2013), 𝑘𝑘𝑘𝑘𝑘𝑘, 𝑘𝑘𝑠𝑠𝑠𝑠 and 𝑘𝑘𝑡𝑡𝑡𝑡 can be calculated as follows:
𝑘𝑘𝑠𝑠𝑠𝑠 = 𝑘𝑘𝑡𝑡𝑡𝑡 = 𝜏𝜏𝑚𝑚 𝑠𝑠𝑚𝑚⁄ (6.38)
𝑘𝑘𝑘𝑘𝑘𝑘 = 100𝑘𝑘𝑠𝑠𝑠𝑠 = 100𝑘𝑘𝑡𝑡𝑡𝑡 (6.39)
where
𝜏𝜏𝑚𝑚 = the maximum shear stress; and
𝑠𝑠𝑚𝑚 = the slip under the maximum shear stress.
The quadratic traction model is chosen for modelling the traction-separation
behaviour. The maximum stress required for the damage initiation can be calculated
through the equation developed by the National-Research-Council (2004):
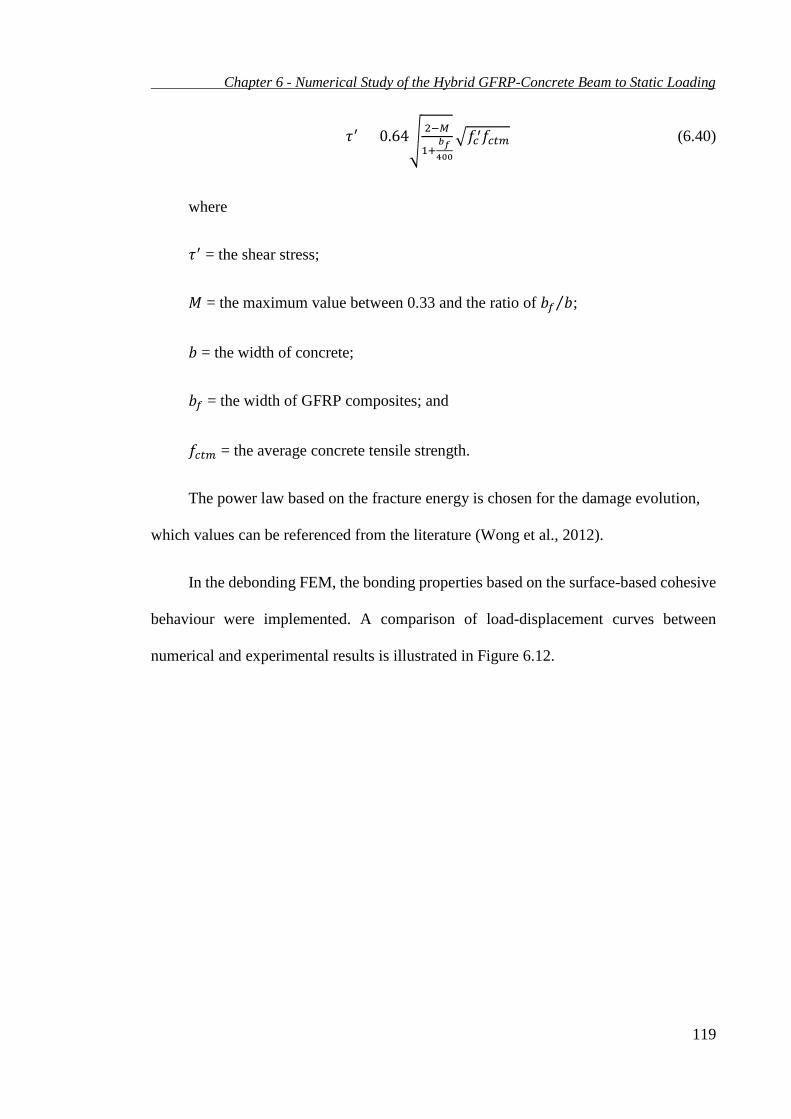
Chapter 6 - Numerical Study of the Hybrid GFRP-Concrete Beam to Static Loading
119
𝜏𝜏′ = 0.64�2−𝐶𝐶
1+𝑏𝑏𝑓𝑓400
�𝑓𝑓𝑐𝑐′𝑓𝑓𝑐𝑐𝑡𝑡𝑚𝑚 (6.40)
where
𝜏𝜏′ = the shear stress;
𝑀𝑀 = the maximum value between 0.33 and the ratio of 𝑏𝑏𝑓𝑓 𝑏𝑏⁄ ;
𝑏𝑏 = the width of concrete;
𝑏𝑏𝑓𝑓 = the width of GFRP composites; and
𝑓𝑓𝑐𝑐𝑡𝑡𝑚𝑚 = the average concrete tensile strength.
The power law based on the fracture energy is chosen for the damage evolution,
which values can be referenced from the literature (Wong et al., 2012).
In the debonding FEM, the bonding properties based on the surface-based cohesive
behaviour were implemented. A comparison of load-displacement curves between
numerical and experimental results is illustrated in Figure 6.12.

Chapter 6 - Numerical Study of the Hybrid GFRP-Concrete Beam to Static Loading
120
Figure 6.12 Comparison between numerical and experimental results for load-
displacement curves (Debonding model)
As shown in Figure 6.12, the ultimate failure load from the debonding model is
125kN, and the ultimate failures from the experimental tests are 120, 111, 115 kN. The
relative difference is 8 % between the numerical and experimental results. The failure of
the beam was initiated in the pultruded profile in the early loading stage, which is shown
in Figure 6.13. When the load increased to a certain level (approximately 40 kN), the
damage in the pultruded profile initiated in the bottom side according to Hashin’s fiber
tensile damage initiation criterion (red colour). The flexural behaviour predicted by the
debonding model is similar to the experimental one. The hybrid beam behaved in a purely
elastic fashion until approximately 10 % of the total load, and then the response became
non-linear until failure.

Chapter 6 - Numerical Study of the Hybrid GFRP-Concrete Beam to Static Loading
121
Figure 6.13 Hashin’s fiber tensile damage view on the bottom side
The result of the bonding model is shown in Figure 6.14, the ultimate failure of the
beam occurred because of debonding at the interface between the concrete and the
pultruded profile on the bottom side. This behaviour is reasonably simulated, and is in
accordance with the experimental observations. The equivalent plastic strain is shown in
Figure 6.15, the cracking patterns in the concrete were governed by the shear failure, the
cracks were following a diagonal direction from the bottom to the top surface, which
indicate that the concrete inside suffered a significant amount of shear stresses.
Figure 6.14 Debonding failure occurring at the bottom side of the interface

Chapter 6 - Numerical Study of the Hybrid GFRP-Concrete Beam to Static Loading
122
Figure 6.15 Concrete cracks development
6.7 Summary
In this chapter, the static flexural behaviour of the hybrid GFRP-concrete beam was
investigated numerically in the commercial software ABAQUS. A non-linear FEM was
developed using the progressive damage model and CDPM to simulate the static
performance of the hybrid beam. Mesh sensitivity analysis was performed to provide a
suitable mesh density for subsequent analysis. The numerical results of the fully bonded
method and the debonding model were compared with the experimental results. It was
found that the debonding model is more accurate, and debonding failure at the interface
between the concrete and the pultruded profile is the main reason for failure in the static
analysis, which is consistent with the experimental results. The bond properties between
the concrete and the pultruded GFRP composites should be considered and assigned in
the numerical analysis. The validated material models, progressive damage model and

Chapter 6 - Numerical Study of the Hybrid GFRP-Concrete Beam to Static Loading
123
the CDPM will be employed in the analysis of the hybrid system subjected to impact
loadings.

Chapter 7
Hybrid GFRP-Concrete Beam Subject to
Low-Velocity Impacts: Experimental
Study4
7.1 Introduction
The static flexural performance of the hybrid GFRP-concrete beam has shown that
it has potential to be used as a structural element. However, its dynamic performance
under low-velocity impacts has yet to be assessed. If the hybrid beam is to be used as a
bridge girder or a railway sleeper, it can be subjected to low-velocity impacts during its
service life. Therefore, the aim of this chapter is to investigate the dynamic performance
of the hybrid GFRP-concrete beam subjected to low-velocity impacts.
To achieve this, a high capacity drop-weight machine is used to introduce the
impact loading on two axes of the hybrid beam. The specimens are placed on the rollers
supports, and then subjected to a concentrated impact. The results of the impact
characteristics and performance are compared for different impact energy levels. The
failure modes of the hybrid beam subjected to impacts are identified from the
4 Results discussed in this chapter form part of the following publication:
LI, Z., KHENNANE, A., HAZELL, P. J. & REMENNIKOV, A. M. 2017. Numerical modeling of a hybrid GFRP-concrete beam subjected to low-velocity impact loading. The 8th International Conference on Computational Methods. Guilin, Guangxi, China: July 25-29th.

Chapter 7 - Hybrid GFRP-Concrete Beam Subject to Low-Velocity Impacts:Experimental Study
125
experimental observations. The main findings from the drop weight tests are summarised
in the last section.
7.2 Specimen preparation
Nine hybrid GFRP-concrete beams were prepared. Each beam consisted of 2 m
long hollow rectangular section pultruded GFRP profile and high performance concrete.
A total number of 18 cylinders from the same mix were cast at the same time to capture
the values of the compressive strength, elastic modulus and indirect tensile strength of the
concrete on the testing date.
7.2.1 Description of the hybrid beam
Figure 7.1 shows a picture of the cross section of the beam and a microscope view
of the pultruded profile. As detailed in Chapter 4, the pultruded GFRP composites were
fabricated through the pultrusion process. The profile is composed of an isophthalic resin
and glass fibers with a fiber volume fraction of 60 %.
Figure 7.1 The cross-sectional dimension of hybrid beam and the microscope view of
the composites

Chapter 7 - Hybrid GFRP-Concrete Beam Subject to Low-Velocity Impacts:Experimental Study
126
7.2.2 Concrete mix composition
The cement used in this mix was a type GP Portland cement. The coarse aggregates
were categorised by the sizes of the crushed stone, and the fine aggregates were river
sand. All the aggregates, including the coarse and the fine aggregates, were in saturated
surface dry condition. The design method of the mix can be found in Ferdous (2012) and
the ingredients of the concrete mix are shown in Table 7.1.
Table 7.1 Mix ingredients for concrete
Material Mass per m3
(kg/m3) Mass per Mix (kg)
Coarse aggregate,
(SSD)
14 mm 262 26.232
10 mm 524 52.464
7 mm 352 35.243
Fine aggregate, (SSD) 614 61.475
Cement 399 39.949
Super-plasticiser (OPC) 3 0.300366
Water 187 18.723
Total 2341 234.386
7.2.3 Slump test
The conventional slump test was used to assess the workability of the high strength
concrete used. A slump value of 50 mm (with an error of 5 mm) was recorded for all the
concrete batches (Figure 7.2).

Chapter 7 - Hybrid GFRP-Concrete Beam Subject to Low-Velocity Impacts:Experimental Study
127
Figure 7.2 Concrete slump test
7.2.4 Casting of the hybrid beams
To facilitate the pouring of the concrete, all the pultruded hollow profiles were
placed with an angle of approximately 45 degrees to the ground floor, as shown in Figure
7.3. Steel base-plates were bonded to both ends of the beams to provide a support at the
bottom during the casting.
Figure 7.3 Casting of the hybrid beams

Chapter 7 - Hybrid GFRP-Concrete Beam Subject to Low-Velocity Impacts:Experimental Study
128
7.2.5 Curing of the hybrid beams
Since the moisture of in-filled concrete can be encapsulated within the pultruded
profiles, all the beams were placed under room temperature condition with steel plates
and plastic bags sealed on both ends of the beams (Figure 7.4). The corresponding
cylinders were also stored under sealed conditions in the same room.
Figure 7.4 Curing of the hybrid beams
7.2.6 Cylinder tests
The cylinders were tested on the same day as the beam tests. Before testing, both
sides of the cylinders were ground by a grinding machine to provide smooth surfaces to
avoid the stress concentrations during loading (Figure 7.5).
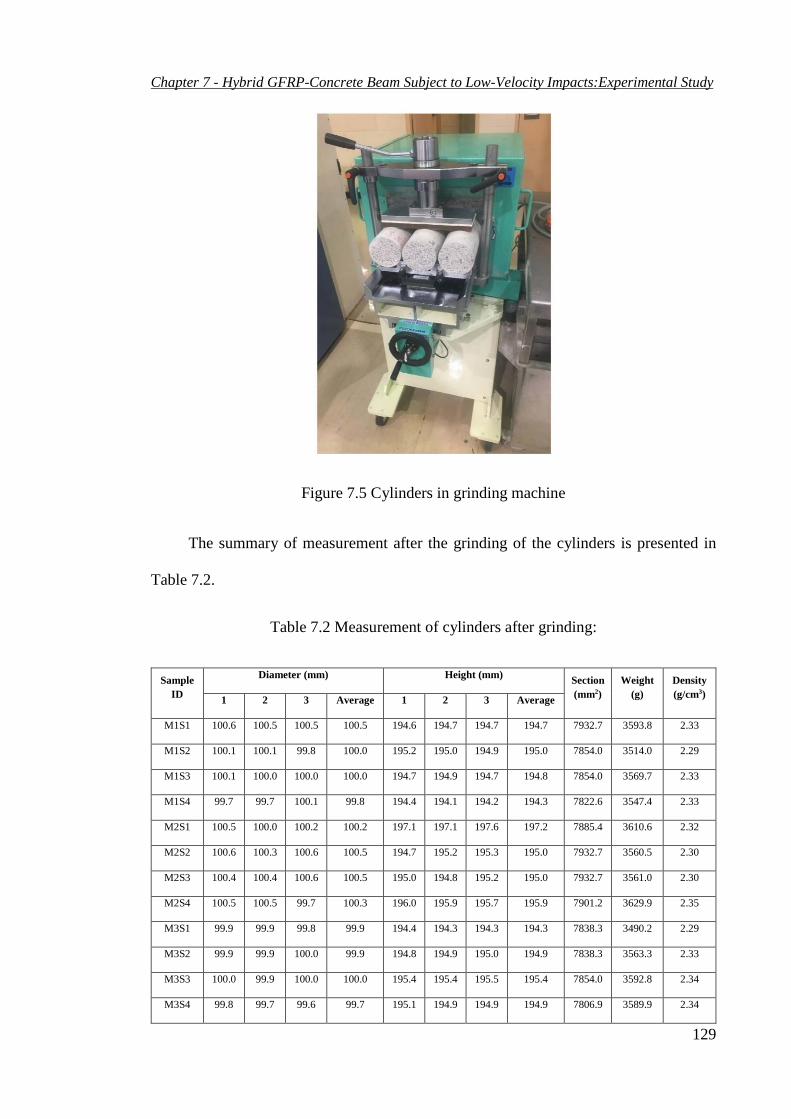
Chapter 7 - Hybrid GFRP-Concrete Beam Subject to Low-Velocity Impacts:Experimental Study
129
Figure 7.5 Cylinders in grinding machine
The summary of measurement after the grinding of the cylinders is presented in
Table 7.2.
Table 7.2 Measurement of cylinders after grinding:
Sample ID
Diameter (mm) Height (mm) Section (mm2)
Weight (g)
Density (g/cm3) 1 2 3 Average 1 2 3 Average
M1S1 100.6 100.5 100.5 100.5 194.6 194.7 194.7 194.7 7932.7 3593.8 2.33
M1S2 100.1 100.1 99.8 100.0 195.2 195.0 194.9 195.0 7854.0 3514.0 2.29
M1S3 100.1 100.0 100.0 100.0 194.7 194.9 194.7 194.8 7854.0 3569.7 2.33
M1S4 99.7 99.7 100.1 99.8 194.4 194.1 194.2 194.3 7822.6 3547.4 2.33
M2S1 100.5 100.0 100.2 100.2 197.1 197.1 197.6 197.2 7885.4 3610.6 2.32
M2S2 100.6 100.3 100.6 100.5 194.7 195.2 195.3 195.0 7932.7 3560.5 2.30
M2S3 100.4 100.4 100.6 100.5 195.0 194.8 195.2 195.0 7932.7 3561.0 2.30
M2S4 100.5 100.5 99.7 100.3 196.0 195.9 195.7 195.9 7901.2 3629.9 2.35
M3S1 99.9 99.9 99.8 99.9 194.4 194.3 194.3 194.3 7838.3 3490.2 2.29
M3S2 99.9 99.9 100.0 99.9 194.8 194.9 195.0 194.9 7838.3 3563.3 2.33
M3S3 100.0 99.9 100.0 100.0 195.4 195.4 195.5 195.4 7854.0 3592.8 2.34
M3S4 99.8 99.7 99.6 99.7 195.1 194.9 194.9 194.9 7806.9 3589.9 2.34

Chapter 7 - Hybrid GFRP-Concrete Beam Subject to Low-Velocity Impacts:Experimental Study
130
Figure 7.6 shows the equipment used for the compressive strength, elastic modulus
and indirect tensile tests. The compressive strength tests were conducted in accordance
with the standard ASTM-C39 (2012). In the elastic modulus tests, the cylinders were
compressed with cyclic loadings (up to 40 % of ultimate compressive strength) for four
times. The values of the elastic modulus were averaged over the last three loading and
unloading cycles for each cylinder (ASTM-C469, 2014). The indirect tensile tests were
conducted based on the requirements of the standard ASTM-C496 (2011). The testing
results are listed in Table 7.3.
Figure 7.6 Cylinder tests (a: compressive test; b: elastic modulus test; c: indirect tensile
test)

Chapter 7 - Hybrid GFRP-Concrete Beam Subject to Low-Velocity Impacts:Experimental Study
131
Table 7.3 Testing results of cylinders:
Sample ID
Compression test Elastic modulus test (N/mm2) Indirect tensile test
Maximum load (kN)
Compressive strength (MPa)
1 2 3 Average Resistance
section (mm2)
Maximum load (kN)
Indirect tensile
strength (MPa)
M1S1 554.3 69.88
M1S2 519.4 66.13
M2S1 535.6 67.92
M2S2 540.5 68.14
M3S1 552.0 70.42
M3S2 600.1 76.56
M1S3 33769.7 33357.2 33206.7 33444.5 30599.1 129.72 4.24
M1S4 33708.7 33151.7 33010.6 33290.3 30459.5 135.55 4.45
M2S3 33786.6 33340.4 33104.2 33410.4 30783.7 153.05 4.97
M2S4 34710.5 34671.9 34002.6 34461.7 30848.5 146.90 4.76
M3S3 34292.6 34234.5 34211.8 34246.3 30693.4 171.88 5.60
M3S4 34931.7 34783.7 34534.3 34749.9 30523.0 153.56 5.03
Average 550.3 69.84 33933.9 148.44 4.84
7.3 Test procedures and setup
7.3.1 Test procedures
The impact tests were conducted on a high capacity drop weight impact testing
machine at the University of Wollongong, Australia. The general features of the drop
weight machine and data acquisition system are shown in Figure 7.7. This machine is
equipped with a free-fall carriage system that includes an impactor, weight and a loading
cell. The total weight of the impactor, weight and loading cell is fixed and equal to 592
kg. The carriage system can be dropped from a maximum height of 6 m, or equivalent to
a maximum impact velocity of 10 m/s. This machine operates on the principle of energy
conservation, balancing potential and kinetic energy by varying the drop height of the

Chapter 7 - Hybrid GFRP-Concrete Beam Subject to Low-Velocity Impacts:Experimental Study
132
carriage system. For each test, the impactor was hoisted to the required drop height by
using the control system, and then released by the electronic quick release system. The
initiation of the impact load recording was triggered by using a laser sensor, and the
impact loading was recorded by a 50 kHz frequency dynamic loading cell connected to
the data acquisition system.
Figure 7.7 High capacity drop-weight impact machine in University of Wollongong

Chapter 7 - Hybrid GFRP-Concrete Beam Subject to Low-Velocity Impacts:Experimental Study
133
7.3.2 Test instrumentation
7.3.2.1 High-speed camera
A high-speed camera with the sample rate of 250 frames per second was employed
to record the impact events and to capture the failure modes as shown in Figure 7.8. In
addition, the impact velocity and the displacement can be verified with video recording.
A reference point was marked to verify the displacement recorded from the movement of
the hybrid beam, and the impact velocity was calculated from the moving frames of the
video.
Figure 7.8 High-speed camera
7.3.2.2 Dynamic loading cell
The impact loading history was measured by a dynamic loading cell, as shown in
Figure 7.9. The captured loading points are shown as much as 50000 points per second.

Chapter 7 - Hybrid GFRP-Concrete Beam Subject to Low-Velocity Impacts:Experimental Study
134
Figure 7.9 Dynamic loading cell (http://www.interfaceforce.com)
7.3.3 Test setup
In total nine hybrid GFRP-concrete beams were tested. Six tests were conducted on
the weak axis of the hybrid GFRP-concrete beams for three ascending energy levels. Two
specimens were tested for each energy level to determine repeatability. The impact
velocities and drop heights of the three chosen energy levels were 2.43, 2.97 and 3.43
m/s, and 300, 450 and 600 mm, respectively. The remaining three hybrid GFRP-concrete
beams were tested on the strong axis for three different impact energies. The impact
velocities and dropping heights of the three chosen energy levels were 2.21, 3.13 and 3.84
m/s, and 250, 500 and 750 mm, respectively.
The schematic diagram of the experimental setup is shown in Figure 7.10. The
beams are simply supported and free to slide along the horizontal directions to minimise
the effect of strain rate for concrete. Therefore, the hybrid beams were placed on roller
support fixtures. All the hybrid beams were subjected to a concentrated impact using a
118.6 mm diameter cylindrical impactor. To prevent the rebounding of the specimen
during the impact event, two frames consisting of rubber belts were used to secure the

Chapter 7 - Hybrid GFRP-Concrete Beam Subject to Low-Velocity Impacts:Experimental Study
135
specimen in place (Figure 7.11). Shock absorbers were also used to prevent the striker
from reloading the targets.
Figure 7.10 Schematic diagram of the experimental setup
Figure 7.11 Support conditions of the impact tests

Chapter 7 - Hybrid GFRP-Concrete Beam Subject to Low-Velocity Impacts:Experimental Study
136
7.4 Experimental results and discussion of the weak
axis tests
7.4.1 Failure modes
All the tested hybrid beams had been subjected to a concentrated impact until
ultimate failure occurred for three ascending impact energy levels. From the experimental
observations recorded by the high-speed camera, the hybrid beams started to respond to
the impact loading in bending up to the occurrence of ultimate failure. All the tested
specimens failed ultimately with the presence of shear cracks (splitting of the profiles) on
the corners of the pultruded profiles. The failure modes of the tested specimens at the
time of ultimate failure for three energy levels are shown in Figure 7.12. It can be seen
that the magnitude of the shear damage and the deflection at the time of the ultimate
failure increases with respect to ascending energy levels.
Figure 7.12 Failure modes at the time of ultimate failure
The debonding failure between the pultruded GFRP composites and the concrete
was observed after the impact events. As shown in Figure 7.13, end slipping of concrete

Chapter 7 - Hybrid GFRP-Concrete Beam Subject to Low-Velocity Impacts:Experimental Study
137
was found at the end of the hybrid beams. The average value of the maximum end slipping
measured for the three ascending impact energy levels was 13, 15 and 63 mm,
respectively. The length of the maximum end slip increases with the increase in the impact
energies.
Figure 7.13 End slipping of the concrete
Another failure mode was observed on the contacting surfaces of the composites as
shown in Figure 7.14. The failure modes of all the three impact energy levels were shown
with a similar cracking pattern. Multiple shear cracks were formed around the edges of
the impactor. The shear cracking directions are longitudinal, following the direction in
which the majority of fibers were laid. It can be seen that the growth and the magnitude
of damage increase with ascending energy levels.
Figure 7.14 Shear cracks formed on the contacting surfaces of the profiles

Chapter 7 - Hybrid GFRP-Concrete Beam Subject to Low-Velocity Impacts:Experimental Study
138
7.4.2 Load-time response
The loading histories for the three ascending energy levels recorded in situ by the
dynamic loading cell are represented in Figure 7.15, Figure 7.16 and Figure 7.17
respectively. As shown, the impact force-time curves of the three impact energy levels
exhibit similar trends, which can be divided into two stages: inertial resistance stage and
dynamic bending resistance stage. Just after contact is initiated between the impactor and
the top surface of the hybrid beam, the first stage is represented by an enormous and rapid
increase in load to the maximum value, and a quick dropping back to a certain degree.
During this stage, the hybrid beam reduces the velocity of the impactor at first and then
the velocity of the hybrid beam increases as the impacting process continues, which
results in a rapid and short-term peak of inertial force as can be noticed in the loading
curve. The average values of the inertial force at this stage for the three ascending energy
levels are 201.0, 249.4 and 307.3 kN respectively. The true impact resistance of the hybrid
beam is represented by the dynamic bending resistance stage. The second stage lasts from
the onset of the damage to the occurrence of the ultimate failure. In this stage, the hybrid
beam starts to respond to the impact load with the presence of multiple failure
mechanisms, including debonding failure between the concrete and the profiles, shear
cracks on the corners of the profiles and the flexural cracks of the concrete. The average
maximum experimental impact loads recorded in this stage are 84.8, 100.3 and 110.2 kN,
respectively for the three ascending energy levels. The ultimate failure of the hybrid beam
is represented by the occurrence of the shear cracks on the corners of the pultruded
composites (splitting of the composites), which is confirmed by the video recorded from
the high-speed camera.

Chapter 7 - Hybrid GFRP-Concrete Beam Subject to Low-Velocity Impacts:Experimental Study
139
Figure 7.15 Loading history for 300 mm dropping height
Figure 7.16 Loading history for 450 mm dropping height

Chapter 7 - Hybrid GFRP-Concrete Beam Subject to Low-Velocity Impacts:Experimental Study
140
Figure 7.17 Loading history for 600 mm dropping height
7.4.3 Midspan displacement-time response
The midspan deflection of the hybrid beam can be calculated from a double
integration of load-time curves:
D = ∬𝐹𝐹(𝑡𝑡)−𝐶𝐶𝑀𝑀𝐶𝐶
𝑑𝑑2𝑡𝑡 (7.1)
where
D = the midspan displacement;
𝐹𝐹(𝑡𝑡) = the load acquired by the data acquisition system;
𝑀𝑀 = the total weight (592 kg);
𝑔𝑔 = the gravitational acceleration constant (9.81m/s2); and
𝑡𝑡 = time.

Chapter 7 - Hybrid GFRP-Concrete Beam Subject to Low-Velocity Impacts:Experimental Study
141
The midspan displacement-time curves of the three impact energy levels are shown
in Figure 7.18, the symbol points are the displacement recorded from the high-speed
camera. An average difference of 5.3% at the time of ultimate failure are compared
between the video recorded from the high-speed camera and the calculated curves.
Similar trends are observed for the displacement-time plots across all the impact energies
tested: the midspan displacement increases non-linearly with the increase of contacting
time. The average values of displacement at the time of ultimate failure for three
ascending energy levels are 29.1, 36.2 and 39.5 mm respectively. The midspan
displacement at the time of ultimate failure increases with respect to the increased impact
energy.
Figure 7.18 Midspan displacement curves of three ascending impact energy levels
7.4.4 Impact performance
Testing results including dropping height, impact velocity, maximum load, midspan
deflection, total energy and absorbed energy are summarised in Table 7.4. The results

Chapter 7 - Hybrid GFRP-Concrete Beam Subject to Low-Velocity Impacts:Experimental Study
142
indicate that the average maximum load in both stages increase with respect to the
increase of impact energy. Separately, the midspan deflection at the time of ultimate
failure increases with the corresponding absorbed energy instead of the initial impact
energy. The absorbed energy is calculated through the integration of the load-
displacement history. The average values of absorbed and total energies show that the
majority of the impact energies were absorbed through the elastic-plastic behaviour and
the damage failure mechanisms of the hybrid GFRP-concrete beams. The rest are
represented in the form of residual kinetic energies.
Table 7.4 Testing results summary
Specimen ID Test No.
Dropping Height (mm)
Impact Velocity
(m/s)
Maximum Load in
stage one (kN)
Maximum Load in
stage two (kN)
Midspan deflection at time of ultimate failure (mm)
Total energy
measured (J)
Absorbed Energy at
time of ultimate
failure (J)
HBW1 300 mm #1 M1 300 2.43 204.3 79.0 28.6 1746.3 1410.3
HBW2 300 mm #2 M2 300 2.43 197.7 90.6 29.6 1713.0 1600.2
HBW3 450 mm #1 M2 450 2.97 267.3 91.7 35.2 2553.1 2126.0
HBW4 450 mm #2 M1 450 2.97 231.6 111.9 37.2 2568.2 2448.4
HBW5 600 mm #1 M3 600 3.43 316.7 126.2 44.7 3465.6 3334.3
HBW6 600 mm #2 M2 600 3.43 297.3 94.2 34.3 2860.0 2083.6
7.5 Strong axis tests
7.5.1 Failure modes
The tested hybrid beams were subjected to a concentrated impact load on the strong
axis for different impact energy levels. As can be observed on the videos recorded by the

Chapter 7 - Hybrid GFRP-Concrete Beam Subject to Low-Velocity Impacts:Experimental Study
143
high-speed camera, the hybrid beams started to respond to the impacts in bending. For
the dropping height of 250 mm, the impactor stroke the hybrid beam for a certain degree
and rebounded. For 500 mm and 750 mm dropping height, the tested beams failed with
the presences of shear cracks (splitting of the profiles) on the corners of the pultruded
composites. The failure modes of the tested specimens at the time of ultimate failure
(onset of rebounding for 250 mm case) are shown in Figure 7.19.
Figure 7.19 Failure modes at the time of ultimate failure
The debonding failure between the pultruded profiles and the concrete was
evaluated after the impact events. Identical to the findings for the weak axis tests, end
slipping of the concrete was observed at the ends of the hybrid beams for all cases. Similar
to the weak axis results, the length of the end slip increases with respect to the ascending
energies. The average value of the measured end slip was 2, 10 and 65 mm, respectively
for the three ascending energy tests.
However, the shear cracks on the contacting surfaces observed for the weak axis
tests were not presented for the strong axis tests. The reason for is that the diameter of the
impactor is larger than the width of the contacting surfaces.

Chapter 7 - Hybrid GFRP-Concrete Beam Subject to Low-Velocity Impacts:Experimental Study
144
7.5.2 Load-time response
The loading histories for the strong axis tests recorded in situ by the dynamic
loading cell are illustrated in Figure 7.20. As for the weak axis results, the loading
histories can be divided into two stages: inertial resistance stage and dynamic bending
resistance stage. The mechanisms of the impact behaviour in the first stage are similar to
that of the weak axis tests. The inertial resistant forces are 186.4, 310.0 and 398.6 kN
respectively for the three tests. In the second stage, the 250 mm testing results presented
a rebound behaviour in the dynamic bending resistance stage. The timing of the maximum
load in this stage occurs much later than that of the 500 and 750 mm dropping height
cases. Moreover, the first significant fluctuation took place between approximately 1 and
2 ms, and was not presented in Test 7 (250 mm dropping height). The maximum impact
loads recorded in this stage are 148.5, 120.9 and 150.7 kN respectively for the three
ascending levels. The differences of the impact performance (maximum impact load in
stage 2) may be the result of the different concrete mix: Test 7 and Test 9 were from the
same concrete mix, and the compressive strength for the concrete used in Test 8 was
slightly weaker than that of the concretes used in Test 7 and Test 9. For the 500 and 750
mm cases, the ultimate failure is similar to that observed in the weak axis tests. The
ultimate failure was represented by the shear cracks formed on the corners of the
pultruded composites.

Chapter 7 - Hybrid GFRP-Concrete Beam Subject to Low-Velocity Impacts:Experimental Study
145
Figure 7.20 Loading histories for the strong axis tests
7.5.3 Midspan displacement-time response
Similarly to the weak axis results, the midspan displacement of the hybrid beam
can be calculated from a double integration of the load-time curves. Figure 7.21 shows
the midspan displacement curves for the three ascending energy levels, the symbol points
are recorded from the high-speed camera. Due to the interval of the videos, limited points
can be captured for comparison. For the 250 mm dropping height, the midspan
displacement increases non-linearly to the maximum value (17.1 mm) and rebounds back
to the original level. For the 500 and 750 mm dropping heights, the midspan displacement
increases at a near-linear trend up to ultimate failure. The values of the displacement at
the time of ultimate failure for these two loading cases are 19.9 and 17.6 mm respectively.
As explained in the section 7.5.2, the difference of the maximum displacement may be a

Chapter 7 - Hybrid GFRP-Concrete Beam Subject to Low-Velocity Impacts:Experimental Study
146
result of the different concrete mixes. The stiffness of the hybrid beams in Test 7 and Test
9 are relatively higher than the one in Test 8.
Figure 7.21 Midspan displacement curves for strong axis
7.5.4 Impact performance
The results of the impact tests on the strong axis are summarised in Table 7.5.
Similar to the findings in the weak axis tests, the maximum load in the first stage (inertial
force) increases with the initial impact energy. Moreover, the midspan deflection at the
time of ultimate failure increases with the corresponding absorbed energy instead of the
initial impact energy levels. The absorbed energy is calculated through the integration of
the load-displacement curve. The values of the absorbed and total energies indicated that
for the penetration case, the majority of the impact energy was absorbed through the
elastic-plastic behaviour and the damage failure mechanisms of the hybrid beams. The

Chapter 7 - Hybrid GFRP-Concrete Beam Subject to Low-Velocity Impacts:Experimental Study
147
rest are represented in the form of residual kinetic energies. For the rebounding case, only
a small percentage of the energy was absorbed by the failure mechanisms of the hybrid
beam, the majority of the energy is represented by the rebounding kinetic energy.
Table 7.5 Testing results summary
Specimen ID Test No.
Dropping Height (mm)
Impact Velocity
(m/s)
Maximum Load in
stage one (kN)
Maximum Load in
stage two (kN)
Midspan deflection at time of ultimate failure (mm)
Total energy
measured (J)
Absorbed Energy at
time of ultimate
failure (J)
HBS1 250 mm #7 M3 250 2.21 186.4 148.5 - 1443.4 132.5
HBS2 500 mm #8 M1 500 3.13 310.0 120.9 19.9 2893.6 1747.1
HBS3 750 mm #9 M3 750 3.84 398.6 150.7 17.6 3942.5 1516.4
7.6 Summary
Nine hybrid beams were tested on both the strong and the weak axes to determine
the impact behaviour for different impact energies. The impact characteristics in terms of
load-time curves and midspan deflection-time curves were presented to demonstrate the
damage propagation in the hybrid beam subjected to low-velocity impact loading. The
impact performance in terms of maximum load and deflection and the absorbed energy
were discussed. The main findings of this chapter can be summarised as follows:
1. When subjected to a concentrated impact loading, the hybrid GFRP-concrete
beam suffers from debonding failure between the pultruded profile and the
concrete and the shear cracking failure on the contacting surfaces of the
composites during loading. The hybrid beams failed ultimately with through
shear cracks (splitting of the profiles) forming at the corners of the profiles;

Chapter 7 - Hybrid GFRP-Concrete Beam Subject to Low-Velocity Impacts:Experimental Study
148
2. The impact response of the hybrid beam to low-velocity impacts can be divided
into two stages, inertial resistance stage and dynamic bending stage. The former
one is represented in a rapid and short-term peak of inertial force. While the true
impact resistance is represented by the second stage, in which the majority of
the damage takes place; and
3. The maximum impact load increases with respect to the initial impact energy.
However, the midspan deflection increases with the corresponding absorbed
energy instead of the initial impact energy. The majority of the energy is
absorbed through the elastic-plastic behaviour and the failure mechanisms of
the hybrid beam.

Chapter 8
Hybrid GFRP-Concrete Beam Subject to
Low-Velocity Impacts: Numerical Study5
8.1 Introduction
The experimental study of impact behaviour of the hybrid GFRP-concrete beam
subjected to low-velocity impact loadings was presented in the preceding Chapter. The
impact characteristics, impact performance and failure modes were obtained for both the
strong and the weak axes. However, experimentation alone cannot reveal the failure
modes of the concrete hidden inside the pultruded profile. Details such as the cracking
pattern and damage sequences can only be understood through numerical analysis. For
this purpose, a numerical study is performed to analyse the development and propagation
of damage in the concrete. The validated numerical model is used for the analysis of the
cracking patterns in order to further explain the failure mechanisms of the hybrid beam
during the impact events.
5 Results discussed in this chapter form part of the following publication:
LI, Z., KHENNANE, A., HAZELL, P. J. & REMENNIKOV, A. M. 2017. Numerical modeling of a hybrid GFRP-concrete beam subjected to low-velocity impact loading. The 8th International Conference on Computational Methods. Guilin, Guangxi, China: July 25-29th.

Chapter 8 - Hybrid GFRP-Concrete Beam Subject to Low-Velocity Impacts: Numerical Study
150
8.2 Finite element model
8.2.1 Description of the numerical models
In both the strong and weak axes models, the impactor was modelled using discrete
rigid elements (R3D4). A mass of 592 kg was assigned to the impactor as per the
experimental conditions. For the concrete and pultruded GFRP profile, the same types of
the elements as those used in Chapter 6 were used. The orientations of the fibers in each
layer were assigned according to the corresponding coordinate systems. Because of the
dynamic nature of the experiment, ABAQUS/Explicit was used instead of
ABAQUS/Standard. The mesh density was chosen to be 20 × 20 mm on the basis of the
mesh sensitivity analysis. The computational time for a single simulation was
approximately 0.2 h (Intel Core 17-3770 CPU@ 3.4 GHz). Different initial impact
velocities were imposed to the impactor to simulate the initial impact velocities as per the
experimental setup. The interaction between the impactor and the hybrid beam was
simulated though the use of surface-to-surface contact pairs. The mechanical constraint
formulation was enforced using the kinematic contact algorithm, and the friction
coefficient was set to 0.5 based on the material properties. The interaction between the
pultruded profiles and the concrete inside was also simulated through surface-to-surface
contact pairs but with 0.3 as the friction coefficient factor. The separation of the
interaction was allowed after the contact and the constraint enforcement method was
applied between the contact surfaces. Moreover, the “Hard” contact was defined for the
pressure-overclosure behaviour. The boundary conditions of the assembled FEMs for
both strong and weak axis are illustrated in Figure 8.1 and Figure 8.2 respectively.

Chapter 8 - Hybrid GFRP-Concrete Beam Subject to Low-Velocity Impacts: Numerical Study
151
Figure 8.1 Assembled FEM with boundary conditions for strong axis tests
Figure 8.2 Assembled FEM with boundary conditions for weak axis tests
8.2.2 Material models
The Concrete Damage Plasticity model (CDPM) for concrete and the progressive
damage model for fiber reinforced polymers described in Chapter 6 were used for the
concrete block and the pultruded profile respectively. Different from the description given

Chapter 8 - Hybrid GFRP-Concrete Beam Subject to Low-Velocity Impacts: Numerical Study
152
in Chapter 6, the tensile stiffening behaviour of the concrete was defined with the post-
failure stress as a function of the cracking strain in this study because no convergence
issues were encountered in ABAQUS/Explicit. The compressive and tensile stress-strain
relationship curves, shown in Figure 8.3 and Figure 8.4 respectively, were implemented
in this study.
Figure 8.3 Compressive stress-strain relationship curve
Figure 8.4 Tensile stress-strain relationship curve

Chapter 8 - Hybrid GFRP-Concrete Beam Subject to Low-Velocity Impacts: Numerical Study
153
8.3 Numerical results for the strong axis tests
8.3.1 Load-time response
The comparison of the numerical and experimental results for the three loading
histories are shown in Figure 8.5. A good agreement was achieved between the
experimental results and the numerical predictions. In the inertial resistance stage, the
short-term peaks of the inertial forces were simulated for all the energies. Since the
impactor was modelled as a rigid part, instead of a deformable steel one, the value of the
mechanical impedance of the rigid impactor is much higher than that of the steel impactor.
This could be the reason that the predicted values in the first stage are relatively higher
than the experimental results. The maximum load from the experimental results for the
three ascending impact energy levels are 186.4, 310.0 and 398.6 kN, respectively. The
corresponding numerical predictions are 290.8, 395.7 and 473.8 kN respectively.
In the dynamic bending resistance stage, the predicted loading histories were found
to agree with the experimental results. As mentioned in Chapter 7, the concrete mix in
Test 8 was slightly different to that of Test 7 and Test 9. This might explain why the
maximum value of Test 8 in this stage is smaller than the predicted value. For all the three
testing cases, the maximum impact loads of the experimental results recorded in this stage
are 148.5, 120.9 and 150.7 kN, respectively. The corresponding numerical ones are 148.7,
161.1 and 156.1 kN respectively. The average difference of maximum load recorded in
stage 2 between the experimental results and numerical ones for the three tests is 9.5 %.

Chapter 8 - Hybrid GFRP-Concrete Beam Subject to Low-Velocity Impacts: Numerical Study
154
Figure 8.5 Comparison of loading histories for strong axis testing groups

Chapter 8 - Hybrid GFRP-Concrete Beam Subject to Low-Velocity Impacts: Numerical Study
155
8.3.2 Midspan displacement-time response
The midspan displacement-time curves are shown in Figure 8.6. Reasonable
agreements were achieved between the numerical results and the experimental ones. The
maximum midspan deflection predicted by the FEMs were 19.5, 20.7 and 18.0 mm
respectively. The corresponding experimental values were 17.1, 19.9 and 17.6 mm
respectively. The numerical predictions were slightly higher than the experimental
results. The average difference between the experimental results and the numerical
predictions is 6.1 %.
Figure 8.6 Comparison of midspan displacement-time curves for strong axis

Chapter 8 - Hybrid GFRP-Concrete Beam Subject to Low-Velocity Impacts: Numerical Study
156
8.3.3 Failure modes
8.3.3.1 Non-penetration failure modes
Multiple failure modes of the concrete inside the pultruded profile were identified
in the numerical analysis of the non-penetration impact event (250 mm dropping height).
In the inertial resistance stage, just after the contact was initiated between the impactor
and the top surface, the reduction of the impact velocity of the impactor was detected.
Simultaneously, the velocity of the contacting area in the top surface of the beam
increased. However, no reaction force and damage was formed in this stage. The impact
load during this stage was completely resisted by the inertial force.
With the increase of contact duration, the stress wave propagated to the bottom of
the beam, and the beam started to respond to the impact in bending. Figure 8.7 presents
the value of plastic strain in concrete at approximately 1 ms after the initiation of the
contact between the impactor and the hybrid beam, when two minor flexural cracks
formed on the bottom of the contacting area.
Figure 8.7 Minor flexural cracks formed in the concrete at 1 ms
As the loading process continued, two vertical flexural cracks were formed due to
the local shear plug effects mentioned in Chapter 3. Figure 8.8 presents the state of plastic

Chapter 8 - Hybrid GFRP-Concrete Beam Subject to Low-Velocity Impacts: Numerical Study
157
strain (cracks development) at approximately 2 ms. Besides these two cracks, other
flexural cracks formed in the area between the centre and the support location due to the
global bending response to the impacts (Figure 8.8). Details of the mechanisms of local
shear plug and global flexural response can be found in section 3.2.2.
Figure 8.8 Flexural cracks formed in the concrete at 2 ms
Multiple flexural cracks formed upwards to the top surface in the last stage of the
loading. The hybrid beam responded to the impact with global flexural cracks, as shown
in Figure 8.9. In the non-penetration event, the majority of the energies were absorbed
through the elastic-plastic behaviour and the global flexural cracks of the hybrid beam.
Figure 8.9 Global flexural cracks formed across the beam

Chapter 8 - Hybrid GFRP-Concrete Beam Subject to Low-Velocity Impacts: Numerical Study
158
8.3.3.2 Penetration failure modes
For the dropping heights of 500 and 750 mm events, all the beams were penetrated
by the impactor. In the inertial resistance stage, the beams behaved in the same way as
the non-penetration event. No damage was predicted in this stage. Minor flexural cracks
at the centre of the beams first initiated in both impact events, Figure 8.10 presents the
state of tensile damage criterion (cracks due to tensile stress).
Figure 8.10 Initial flexural cracks of the concrete at the bottom of the beam
Before the stress wave propagated to the entire beam, the shear plug in the concrete
was formed with an angle of approximately 45 degrees. The shear plug cracks propagated
from the edges of the impactor downwards to the bottom of the beam, as shown in Figure
8.11.
Figure 8.11 Local shear plug formed downwards to the bottom surface

Chapter 8 - Hybrid GFRP-Concrete Beam Subject to Low-Velocity Impacts: Numerical Study
159
As the loading process continued, multiple global flexural cracks formed between
the impact zone and the support locations. Unlike the global response of the
concrete/reinforced concrete structures, the global flexural cracks were formed in the top
surface of the beam and they propagated downwards to the bottom surface. The flexural
cracks near the support locations are vertical, and the cracks between the loading zone
and the support locations are formed with an angle of approximately 45 degrees parallel
to the local shear plug shape (Figure 8.12).
Figure 8.12 Global flexural response of the hybrid beam
With the increase of the contact duration, the magnitude of the damage and the
length of the flexural cracks increased. Besides the flexural cracks between the impact
zone and support locations, a vertical flexural crack was formed at the support location
(Figure 8.13).
Figure 8.13 Vertical flexural cracks formed at supports

Chapter 8 - Hybrid GFRP-Concrete Beam Subject to Low-Velocity Impacts: Numerical Study
160
As the loading continued, the magnitude of the concrete damage increased slightly
up to the ultimate failure. The hybrid beam failed ultimately with the presence of the shear
cracks formed on the corners of the pultruded composites. Figure 8.14 presents the state
of shear damage criterion (Hashin damage model). The shear cracks formed on both the
top and bottom surface of the contacting zone and propagated horizontally to the end of
the beam. A representation of the experimental and numerical observations after
unloading the beams is shown in Figure 8.15.
Figure 8.14 Shear cracks formed at the ultimate failure
Figure 8.15 Schematic diagram of experimental and numerical observations after test

Chapter 8 - Hybrid GFRP-Concrete Beam Subject to Low-Velocity Impacts: Numerical Study
161
8.4 Numerical results for the weak axis tests
8.4.1 Load-time response
The comparison between the experimental and numerical results for the weak axis
tests are shown in Figure 8.16. A reasonable agreement was achieved between the
numerical predictions and the experimental data. Similar to the strong axis tests, the short-
term peak of the inertial forces was simulated higher than that of the experimental results.
The cause of this phenomenon can be found in section 8.3.1. The average maximum load
of the experimental results in this stage are 201.0, 249.4 and 307.3 kN respectively. The
corresponding results from the numerical models are 323.7, 362.4 and 441.4 kN,
respectively.
In the dynamic bending resistance stage, the predicted loading histories were found
to corroborate the experimental data. The multiple rises and drops were well simulated in
the numerical analysis. The average maximum loads recorded from the experimental
results in this stage are 84.8, 100.3 and 110.2 kN, respectively for the three ascending
energy levels. The predicted values are 96.9, 104.9 and 105.5 kN respectively. The
average difference of the maximum load recorded in stage 2 between the experimental
results and the numerical ones is 7 %.

Chapter 8 - Hybrid GFRP-Concrete Beam Subject to Low-Velocity Impacts: Numerical Study
162
Figure 8.16 Comparison of loading histories for weak axis tests

Chapter 8 - Hybrid GFRP-Concrete Beam Subject to Low-Velocity Impacts: Numerical Study
163
8.4.2 Midspan displacement-time response
The comparison of midspan displacement histories for all the impact events are
shown in Figure 8.17. A reasonable agreement is obtained between the predicted results
and the experimental ones. The maximum deflections predicted by the FEMs were 37.2,
42.8 and 41.9 mm, respectively for the three ascending energy levels. The average
corresponding values from the experimental data were 33.1, 39.1 and 40.2 respectively.
The average difference of maximum deflection recorded between the experimental and
the numerical results is 7.9 %.
Figure 8.17 Comparison of experimental and numerical results for displacement-time
curves
8.4.3 Failure modes
For the weak axis tests, the impact response of the hybrid beam is similar to that of
the penetration events of the strong axis tests. In the inertial resistance stage, no damage

Chapter 8 - Hybrid GFRP-Concrete Beam Subject to Low-Velocity Impacts: Numerical Study
164
was detected in the numerical models. Figure 8.18 shows the state of tensile damage in
the concrete. In the early dynamic bending resistance stage, minor flexural cracks were
formed on the bottom side of the contacting zone.
Figure 8.18 Minor cracks formed in the concrete at the centre of the beam
As the loading continued, the minor cracks transformed into crushing due to the
local shear plug. In this stage of loading, the punching failure occurred before the entire
beam had time to respond in bending, which resulted in the occurrence of the local shear
plug (Figure 8.19).
Figure 8.19 Local shear plug formed in the early dynamic resistance stage
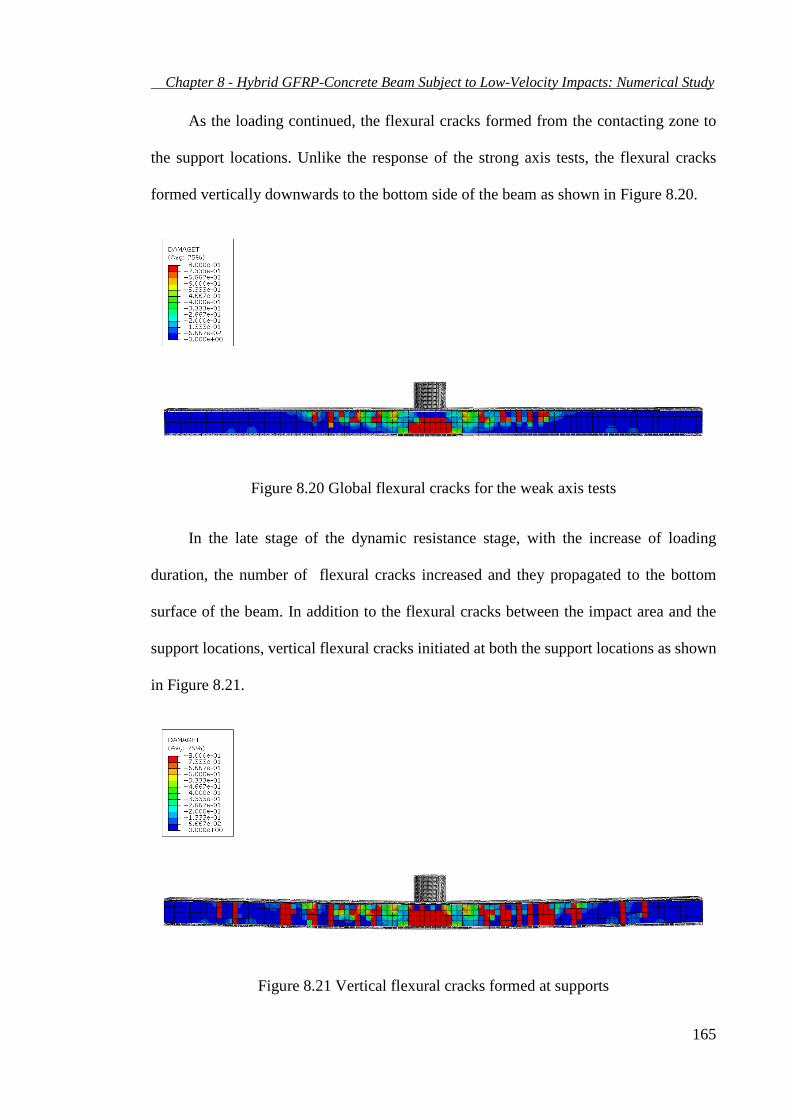
Chapter 8 - Hybrid GFRP-Concrete Beam Subject to Low-Velocity Impacts: Numerical Study
165
As the loading continued, the flexural cracks formed from the contacting zone to
the support locations. Unlike the response of the strong axis tests, the flexural cracks
formed vertically downwards to the bottom side of the beam as shown in Figure 8.20.
Figure 8.20 Global flexural cracks for the weak axis tests
In the late stage of the dynamic resistance stage, with the increase of loading
duration, the number of flexural cracks increased and they propagated to the bottom
surface of the beam. In addition to the flexural cracks between the impact area and the
support locations, vertical flexural cracks initiated at both the support locations as shown
in Figure 8.21.
Figure 8.21 Vertical flexural cracks formed at supports

Chapter 8 - Hybrid GFRP-Concrete Beam Subject to Low-Velocity Impacts: Numerical Study
166
The hybrid GFRP-concrete beam failed ultimately with the presence of the shear
cracks formed at the corners of the pultruded profiles. Figure 8.22 shows the shear
damage state in the pultruded profile (Hashin damage model). A representation of the
experimental and numerical observations after unloading the beam is shown in Figure
8.23.
Figure 8.22 Shear cracks formed at the ultimate failure for weak axis tests
Figure 8.23 A representation of numerical model after the impact loading

Chapter 8 - Hybrid GFRP-Concrete Beam Subject to Low-Velocity Impacts: Numerical Study
167
8.5 Damage sequence analysis
The numerical predictions of the response of the hybrid GFRP-concrete beam
subjected to low-velocity impacts were found to corroborate the experimental results in
terms of load-time and midspan deflection-time curves. The failure modes predicted by
the numerical models provided a detailed understanding of the failure mechanisms of the
hybrid beam, especially of the internal damage in the concrete block. A damage sequence
analysis of the impact resistance was investigated with a combination of experimental
observations and numerical simulation.
Taking the 450 mm dropping heights on the weak side event as an example, a
typical impact event can be divided into six stages as shown in Figure 8.24. The first
stage, inertial resistance stage, is represented as a rapid and short-term peak of inertial
force. No damage occurs in this stage. The second stage begins with the onset of inelastic
behaviour at approximately 0.5 ms. In this stage, the stress wave propagates from the
contacting surface to the bottom of the hybrid beam. Minor flexural cracks are formed at
the centre of the concrete part. The third stage lasts from the presence of reloading to the
multiple drops at approximately 1 ms. During this stage, the punching failure (local
crushing) occurs before the entire beam has time to respond in bending, which results in
the presence of the local shear plug. The fourth stage is represented in multiple significant
drops at approximately 3 ms. With the increase of the contact duration, the stress wave
propagates from the local zone to the entire beam and the hybrid beam starts to respond
to the impact in bending. The global flexural cracks are formed between the loading area
and the support locations. These cracks propagate from the top surface downwards to the
bottom of the beam. It is noted that for the strong axis tests, the flexural cracks are formed
with an angle of approximately 45 degrees parallel to the local shear plug. On the other

Chapter 8 - Hybrid GFRP-Concrete Beam Subject to Low-Velocity Impacts: Numerical Study
168
hand, the global flexural cracks are formed vertically for the weak axis tests. The fifth
stage lasts from the end of fourth stage to the maximum load of impact. In this stage, most
of the impact load is carried by the pultruded profile due to the failure of the concrete
inside. Vertical flexural cracks are formed at the support locations during this stage. In
the sixth and final stage, the loading curves decrease dramatically down to zero. During
this stage, the hybrid beam fails ultimately with the presence of the shear cracks formed
at the corners of the pultruded profile. The impactor penetrates the hybrid beam and no
more energy can be absorbed from the hybrid beam.

Chapter 8 - Hybrid GFRP-Concrete Beam Subject to Low-Velocity Impacts: Numerical Study
169
Figure 8.24 Damage sequence analysis

Chapter 8 - Hybrid GFRP-Concrete Beam Subject to Low-Velocity Impacts: Numerical Study
170
8.6 Comparison studies
As discussed in the above sections, the developed numerical model is validated
from the experimental results and is proven reliable of simulating the impact events for
targeted applications. In this section, the performance of the verified numerical model is
used to compare to the published results of railway sleepers from the literature.
Kaewunruen and Remennikov (2009b) conducted a series of experimental tests on
evaluating the impact capacity of the railway prestressed concrete sleepers. In their tests,
the specimens were impacted by a 5.81 kN projectile from the dropping height of 100 and
500 mm. The impact energy and experimental setup were set to simulate the impact events
of railway sleepers that may occur during the service. As shown in Figure 8.25, the setup
of the experimental program was arranged in accordance with the Australian standard for
static tests of railway sleeper (Standards, 2003c, Standards, 2003b).
Figure 8.25 Test setup of Kaewunruen and Remennikov (2009b)

Chapter 8 - Hybrid GFRP-Concrete Beam Subject to Low-Velocity Impacts: Numerical Study
171
In order to compare to the performance of prestressed concrete sleepers, in this
numerical analysis, the loading and supporting conditions are used as per Kaewunruen
and Remennikov (2009b). The schematic diagram of this investigation is shown in Figure
8.26. The additional loading and supporting fixture is modelled by the use of rigid
elements. The description of the numerical model can be found in section 8.2.1.
Figure 8.26 Numerical setup of the impact events
8.6.1 Numerical results of original size beam
The numerical results of the original size beam under 100 and 500 mm dropping
heights are presented in Figure 8.27 and Figure 8.28, respectively. Similarly to the
previous sections, in both cases, the beam experienced the inertial resistance stage and
the dynamic bending resistance stage. The first stage was represented as a rapid and short-
term peak of inertial force, no damage occurred during this stage. The dynamic bending
stage lasted from the onset of the second increase in load to the presence of ultimate
failure.

Chapter 8 - Hybrid GFRP-Concrete Beam Subject to Low-Velocity Impacts: Numerical Study
172
Figure 8.27 load-time response due to 100 mm drop height
Figure 8.28 Load-time response due to 500 mm drop height
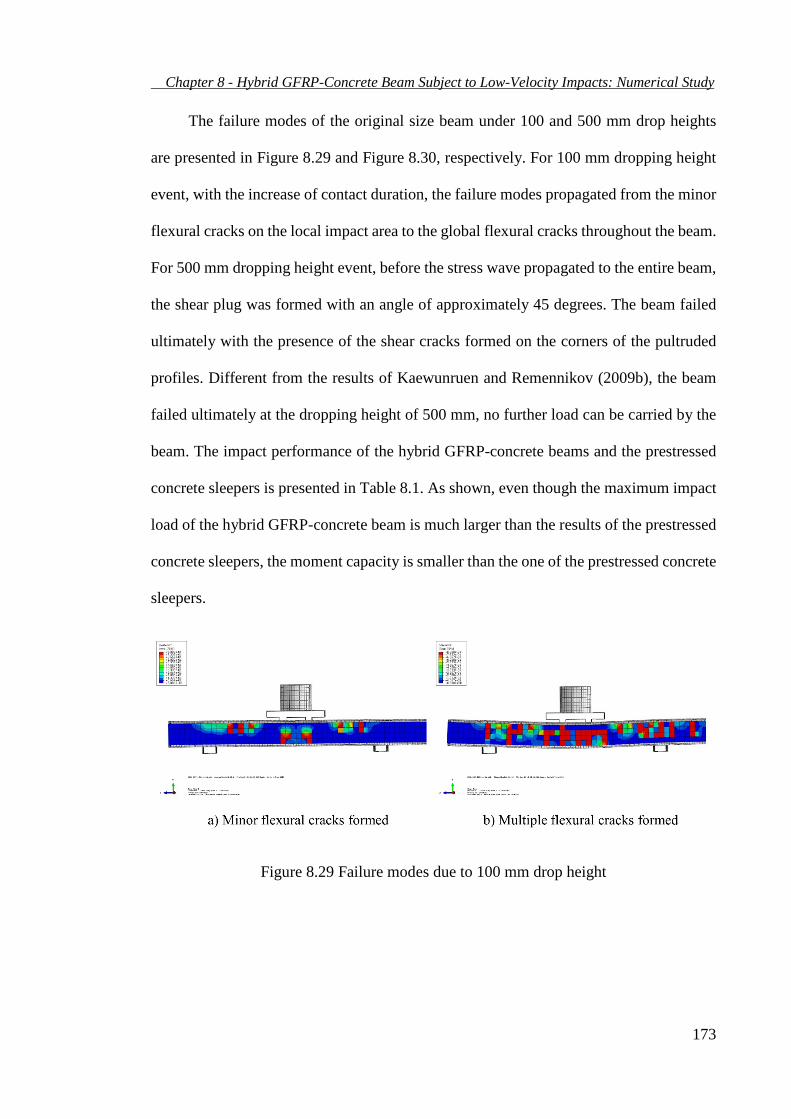
Chapter 8 - Hybrid GFRP-Concrete Beam Subject to Low-Velocity Impacts: Numerical Study
173
The failure modes of the original size beam under 100 and 500 mm drop heights
are presented in Figure 8.29 and Figure 8.30, respectively. For 100 mm dropping height
event, with the increase of contact duration, the failure modes propagated from the minor
flexural cracks on the local impact area to the global flexural cracks throughout the beam.
For 500 mm dropping height event, before the stress wave propagated to the entire beam,
the shear plug was formed with an angle of approximately 45 degrees. The beam failed
ultimately with the presence of the shear cracks formed on the corners of the pultruded
profiles. Different from the results of Kaewunruen and Remennikov (2009b), the beam
failed ultimately at the dropping height of 500 mm, no further load can be carried by the
beam. The impact performance of the hybrid GFRP-concrete beams and the prestressed
concrete sleepers is presented in Table 8.1. As shown, even though the maximum impact
load of the hybrid GFRP-concrete beam is much larger than the results of the prestressed
concrete sleepers, the moment capacity is smaller than the one of the prestressed concrete
sleepers.
Figure 8.29 Failure modes due to 100 mm drop height

Chapter 8 - Hybrid GFRP-Concrete Beam Subject to Low-Velocity Impacts: Numerical Study
174
Figure 8.30 Failure modes due to 500 mm drop height
Table 8.1 Impact performance of the hybrid beam and prestressed concrete sleepers
(Kaewunruen and Remennikov, 2009b)
Types of beams
Cross-section (mm)
Target conditions
True Max Load (kN)
True moment capacity (kN m)
Energy absorbed
(J)
Residual strength
Hybrid beams
100×190
Crack (100mm)
980 - 580 Yes
Fail (500mm) 2540 78 2660 No
concrete sleepers
(204+250)
×227
Crack (100mm)
310 42 580 Yes
Fail (500mm) 550 90 2900 Yes
To conduct the parametric study and evaluate the impact capacity of the hybrid
GFRP-concrete system, additional numerical model has been developed with the use of
same cross-sectional dimensions of railway sleepers’ design from Kaewunruen and
Remennikov (2009b). To compare to the experimental results of prestressed concrete
sleepers, the loading and supporting conditions are used as per Kaewunruen and
Remennikov (2009b). The schematic diagram of the numerical model is shown in Figure
8.31.

Chapter 8 - Hybrid GFRP-Concrete Beam Subject to Low-Velocity Impacts: Numerical Study
175
Figure 8.31 Numerical setup of the parametric study
8.6.2 Numerical results of life-size rail sleepers
The numerical results of the large size beam under 100 and 500 mm dropping
heights are presented in Figure 8.32 and Figure 8.33, respectively. Similarly to the hybrid
with the original size, the beam experienced the inertial resistance stage and the dynamic
bending resistance stage. The first stage was represented by the rapid and short-term peak
of inertial force, no damage was expected during this stage. The dynamic bending stage
lasted till the presence of ultimate failure.

Chapter 8 - Hybrid GFRP-Concrete Beam Subject to Low-Velocity Impacts: Numerical Study
176
Figure 8.32 Load-time response of 100 mm drop height for the life-size beam
Figure 8.33 Load-time response of 500 mm drop height for the life-size beam

Chapter 8 - Hybrid GFRP-Concrete Beam Subject to Low-Velocity Impacts: Numerical Study
177
The failure modes of the large size beam under 100 and 500 mm drop heights are
presented in Figure 8.34 and Figure 8.35, respectively. For 100 mm dropping height,
flexural cracks were first formed on the impact area. With the increase of the contact
duration, multiple crack patterns were shown, including the flexural cracks formed on the
local impact zone and supporting area, and the shear cracks propagated from the edge of
the impactor to the supports. For 500 mm dropping height, a shear plug was formed at the
early loading stage. As the loading process continued, two significant shear cracks as well
as the global flexural cracks were formed. Different from the results of the original size
beam, no shear cracks or damage were observed on the pultruded profiles, which indicates
that the hybrid beam remain the residual strength and further load can be carried. The
impact performance of the large size hybrid GFRP-concrete beams and the prestressed
concrete sleepers is presented in Table 8.2. The maximum impact load and the moment
capacity of the same size hybrid GFRP-concrete beam is larger than the ones of the
prestressed concrete beam, which indicates that the large size hybrid beam has the
potential to observe more impact energy.
Figure 8.34 Failure modes of large size beam due to 100 mm drop height

Chapter 8 - Hybrid GFRP-Concrete Beam Subject to Low-Velocity Impacts: Numerical Study
178
Figure 8.35 Failure modes of large size beam due to 500 mm drop height
Table 8.2 Impact performance of the large size hybrid beam and prestressed concrete
sleepers (Kaewunruen and Remennikov, 2009b)
Types of beams
Cross-section (mm)
Target conditions
True Max Load (kN)
True moment capacity (kN m)
Energy absorbed
(J)
Residual strength
Hybrid beams
(204+250)
×227
Crack (100mm)
540 - 580 Yes
Fail (500mm) 3780 151 2900 Yes
concrete sleepers
(204+250)
×227
Crack (100mm)
310 42 580 Yes
Fail (500mm) 550 90 2900 Yes
8.7 Summary
In this chapter, a nonlinear finite element analysis was conducted to simulate the
impact behaviour of the hybrid beam on both its strong and weak axes. The numerical
results were found to corroborate the experimental results in terms of load-time, midspan
deflection-time and failure modes. The numerical results provided more details of the
failure mechanisms, such as the cracking pattern of the concrete and the damage
sequences. The numerical results showed that the punching failure (local crushing) due

Chapter 8 - Hybrid GFRP-Concrete Beam Subject to Low-Velocity Impacts: Numerical Study
179
to the formation of a shear plug and the global flexural cracks are the main failure modes
of the concrete part. Minor flexural cracks occur in the first place, followed by the shear
plug in the local impact zone. As the loading process continues, the impact energies are
absorbed through the presence of the global flexural cracks. The hybrid beam fails
ultimately due to the occurrence of the shear cracks on the corners of the pultruded
composites. The majority of the impact energies are absorbed through the elastic-plastic
deformation and the failure mechanisms (commonly regarded as material “pseudo”
ductility) of the hybrid beam members. The comparison between the proposed hybrid
beam and the existing sleeper data is performed. A parametric study of the life-size rail
sleeper simulation for the proposed beam is conducted and compared to the data from the
literature. The numerical results show that the impact performance of the hybrid GFRP-
concrete beam behave much better than the existing design of railway sleeper.

Chapter 9
Conclusion and Recommendations for
Future Work
9.1 Concluding remarks
This thesis reports on a study undertaken to analyse the impact behaviour and
failure mechanisms of a hybrid GFRP-concrete beam subjected to low-velocity impact
loading. It is comprised of a literature review, an experimental program and the results of
finite element simulations. The aim is to contribute to the understanding of the impact
characteristics and failure mechanisms of this innovative structural system, which could
find targeted applications in infrastructure applications such as rail sleepers and/or bridge
girders.
Different types of materials used for railway sleepers and bridge girders have been
reviewed in Chapter 2. It was found that when the traditional materials (timber, concrete
and steel) are used as structural elements, the durability and performance of the structure
could be affected by the weaknesses of these materials, such as biological degradation,
chemical attacks and corrosion. Alternative materials, such as pultruded composites,
could be an option to overcome these limitations. However, the use of pultruded
composites brings new issues, such as the high deformability, brittle failure and
instability. The alternative is to combine these materials in a hybrid GFRP-concrete

Chapter 9 - Conclusion and Recommendations for Future Work
181
system as to overcome the deficiencies of each one of them and at the same utilise the
desired properties of each material in the place where it performs the best.
The impact behaviour of concrete and FRP composites have been reviewed to
provide a reference base and scope for the study of hybrid GFRP-concrete beam. The
review of the testing methods and strain rate effects on concrete structures provides a
recommendation for the experimental setup of the hybrid beam tests. The failure
mechanisms of concrete and FRP composites are summarised to present the potential
failure modes associated with the materials used in the hybrid structure, such as the shear
dominance failure and global flexural response on concrete, matrix cracking and
delamination on composite materials.
A critical review of the impact behaviour of pultruded GFRP composites was
presented in Chapter 3. Very limited studies focus on the impact response of pultruded
composites; there was a knowledge gap of understanding of failure mechanisms and
damage sequence of pultruded composites subjected to the higher range of impact energy.
For this purpose, a series of impact tests was carried out on pultruded coupons with impact
energies ranging from 17 to 67 J. The results showed that the impactor mass had very
little effect on the impact response of pultruded composites, the effect of impact energy
levels was the main factor which had a significant influence on the composite material.
Moreover, the pultruded composites behaved in a pure elastic fashion up to approximately
20 % of the maximum impact load. In addition, the extent of damage increased
monotonically with respect to the ascending impact energy. Multiple failure modes
occurred when subjected to higher levels of impact energy. Matrix cracking was detected
as the first failure mode of pultruded GFRP composites subjected to low-velocity impacts,
followed by the delamination and fiber breakage in non-penetration cases.

Chapter 9 - Conclusion and Recommendations for Future Work
182
A finite element model was developed using the progressive damage model, and
the concrete damaged plasticity model (CDPM) available in Abaqus to simulate the static
flexural behaviour of the hybrid GFRP-concrete beam. The main purpose of this
numerical investigation is to validate the numerical model with experimental results, and
to present the reference setup parameters for the experimental program of the hybrid
beams subjected to impact loadings. The numerical results were highly consistent with
the experimental results in terms of load-displacement curve and static performance.
Multiple failure modes were revealed when the hybrid GFRP-concrete beam was
subjected to static loading. Tensile failure of the pultruded composites was observed as
the first failure mode, followed by shear cracking on the concrete inside and the
debonding failure at the interface between the concrete and the pultruded composites.
Since the primary objective of this thesis was the analysis of the impact behaviour
and failure mechanisms of the hybrid GFRP-concrete beam subjected to low-velocity
impacts, a series of experimental tests was performed on both strong and weak axes of
the hybrid beam. The results showed that when subjected a concentrated impact loading,
the hybrid beam suffers from debonding failure between the pultruded profile and the
concrete and the shear cracking failure (matrix cracking) on the contacting surfaces of the
composites during loading. The hybrid beam failed ultimately with through shear cracks
(splitting of the profiles) forming at the corners of the composites. Furthermore, the
impact response of the hybrid beam can be divided into two stages: namely, inertial
resistance and dynamic bending resistance. The former one is represented in a rapid and
short-term peak of inertial force. While the true impact resistance is represented by the
second stage, in which the majority of the damage takes place.

Chapter 9 - Conclusion and Recommendations for Future Work
183
The experimentation alone cannot reveal the failure modes of the concrete hidden
inside the pultruded profile. Details such as the cracking pattern and damage sequences
can only be understood through numerical analysis. For this purpose, a numerical
investigation was performed to analyse the development and propagation of damage in
the concrete. The numerical results were found to corroborate the experimental data in
terms of load-time, midspan deflection-time curves and failure modes. The numerical
analysis provided more details of the failure mechanisms, such as the shear dominance
cracks and global flexural cracks of the concrete and the damage sequences of the hybrid
beam subjected to low-velocity impacts. The validated model can be applied for further
analysis of the hybrid beam under different loading/supporting conditions in the future
study.
The results obtained from this study show that the proposed hybrid GFRP-concrete
beam has the capacity to carry the impact loading with adequate stiffness and strength,
and is suitable for use as a railway sleeper. Indeed, in a real life application, the impact
loads caused by the wheel-track interactions are transferred by the railway sleepers to the
ballast bed, and only a small portion of impact energies is absorbed through the railway
sleepers, which is equivalent to a very limited magnitude of impact loading on the
sleepers. The parametric study of life-size simulation also present that the hybrid beam
outperforms the prestressed concrete sleeper in terms of impact performance.
9.2 Recommendations for future work
As this research is one of the first studies to assess the impact performance of the
pultruded GFRP composites-concrete hybrid beam, there are many issues that can be
improved. Some potential areas related to the extension of this study are listed as follows:

Chapter 9 - Conclusion and Recommendations for Future Work
184
1. The damage initiation and the post-failure behaviour of the pultruded
composites were described by the use of unidirectional damage criterion in
the progressive damage model. This damage model was not capable of
modelling accurately the stiffness reduction and describing the accurate
internal damage caused by the interactions between the roving and the mat
layers. Hence, a new damage model is warranted to be developed to provide
a more accurate description of the impact properties of the pultruded GFRP
composites;
2. This study focused on the impact behaviour of the pultruded composites and
the hybrid structures subjected to low-velocity impacts. However, the
pultruded profile or the hybrid structure could be subjected to a blast impact
if explosion occurs. Hence, research into the performance of pultruded
composites or hybrid structure subjected to high velocity impacts is warranted;
3. The impact performance of the hybrid GFRP-concrete beam was tested on a
simply supported condition. As mentioned in Chapter 2, the hybrid structure
has the potential to be used as railway sleeper. Therefore, the research of
impact performance of the hybrid beam with a ballast support condition is
warranted. Since the freedoms of the hybrid beam would be restrained in
multi-directions, the strain rate effect should be evaluated as well;
4. The failure mechanisms of the hybrid GFRP-concrete beam were assessed
under a critical loading situation. However, when used as a railway sleeper,
it can suffer from the cyclic low-velocity loading during the service.
Therefore, the dynamic fatigue behaviour of the hybrid beam is also
warranted; and

Chapter 9 - Conclusion and Recommendations for Future Work
185
5. The finite element model can be also improved by considering strain rate
effects.

References
AASHTO, L. 1998. Bridge design specifications. American Association of State
Highway and Transportation Officials, Washington, DC.
ABAQUS 2014. ABAQUS Documentation, Providence, RI, USA, Dassault Systèmes.
ADHIKARY, S. D., LI, B. & FUJIKAKE, K. 2012. Dynamic behavior of reinforced
concrete beams under varying rates of concentrated loading. International
Journal of Impact Engineering, 47, 24-38.
ADHIKARY, S. D., LI, B. & FUJIKAKE, K. 2013. Strength and behavior in shear of
reinforced concrete deep beams under dynamic loading conditions. Nuclear
Engineering and Design, 259, 14-28.
AHMED, E. A., EI-SALAKAWY, E. F. & BENMOKRANE, B. 2009. Shear
performance of RC bridge girders reinforced with carbon FRP stirrups. Journal
of Bridge Engineering, 15, 44-54.
AIDOO, J., HARRIES, K. A. & PETROU, M. F. 2004. Fatigue behavior of carbon fiber
reinforced polymer-strengthened reinforced concrete bridge girders. Journal of
Composites for Construction, 8, 501-509.
ALOMARI, A., ALDAJAH, S., HAYEK, S., MOUSTAFA, K. & HAIK, Y. 2013.
Experimental investigation of the low speed impact characteristics of
nanocomposites. Materials & Design, 47, 836-841.
ARDAKANI, M. A., KHATIBI, A. A. & GHAZAVI, S. A. A study on the
manufacturing of Glass-Fiber-Reinforced Aluminum Laminates and the effect of
interfacial adhesive bonding on the impact behavior. Proceedings of the XI
International Congress and Exposition, 2008.

References
187
ASTM-C39 2012. Standard test method for compressive strength of cylindrical concrete
specimens. ASTM C39/C39M. West Conshohocken, PA: ASTM International.
ASTM-C469 2014. Standard Test Method for Static Modulus of Elasticity and
Poisson’s Ratio of Concrete in Compression. ASTM C469/469M. West
Conshohocken, PA: ASTM International.
ASTM-C496 2011. Standard Test Method for Splitting Tensile Strength of Cylindrical
Concrete Specimens. ASTM C496/C496M. West Conshohocken, PA: ASTM
International.
ASTM-D7136 2012. Standard Test Method for Measuring the Damage Resistance of a
Fiber-Reinforced Polymer Matrix Composite to a Drop-weight Impact Event.
ASTM D7136. West Conshohocken, PA: ASTM International.
BANK, L. C. & GENTRY, T. R. 2001. Development of a pultruded composite material
highway guardrail. Composites Part a-Applied Science and Manufacturing, 32,
1329-1338.
BARBERO, E. J., COSSO, F. A., ROMAN, R. & WEADON, T. L. 2013.
Determination of material parameters for Abaqus progressive damage analysis
of E-glass epoxy laminates. Composites Part B-Engineering, 46, 211-220.
BARRE, S., CHOTARD, T. & BENZEGGAGH, M. L. 1996. Comparative study of
strain rate effects on mechanical properties of glass fibre-reinforced thermoset
matrix composites. Composites Part a-Applied Science and Manufacturing, 27,
1169-1181.
BELETICH, A. S. & UNO, P. J. 2003. Design handbook for reinforced concrete
elements. UNSW press.

References
188
BENLOULO, I. S. C., RODRIGUEZ, J., MARTINEZ, M. A. & GALVEZ, V. S. 1997.
Dynamic tensile testing of aramid and polyethylene fiber composites.
International Journal of Impact Engineering, 19, 135-146.
BÉTON, C. E.-I. D. 1992. Durable Concrete Structures: Design Guide.
BHATTI, A. Q. & KISHI, N. 2010. Impact response of RC rock-shed girder with sand
cushion under falling load. Nuclear Engineering and Design, 240, 2626-2632.
BHATTI, A. Q., KISHI, N. & MIKAMI, H. 2011. An applicability of dynamic response
analysis of shear-failure type RC beams with lightweight aggregate concrete
under falling-weight impact loading. Materials and Structures, 44, 221-231.
BHATTI, A. Q., KISHI, N., MIKAMI, H. & ANDO, T. 2009. Elasto-plastic impact
response analysis of shear-failure-type RC beams with shear rebars. Materials &
Design, 30, 502-510.
BUCHANAN, A., DEAM, B., FRAGIACOMO, M., PAMPANIN, S. & PALERMO, A.
2008. Multi-storey prestressed timber buildings in New Zealand. Structural
Engineering International, 18, 166-173.
CAMANHO, P. P. & DAVILA, C. G. 2002. Mixed-mode decohesion finite elements
for the simulation of delamination in composite materials. NASA/TM-2002-
211737. NASA.
CAMPBELL, F. C. 2003. Manufacturing processes for advanced composites, Elsevier.
CANADIAN.STANDARDS.ASSOCIATION 2006. Canadian highway bridge design
code, Canadian Standards Association.
CANAL, L. P., GONZALEZ, C., SEGURADO, J. & LLORCA, J. 2012. Intraply
fracture of fiber-reinforced composites: Microscopic mechanisms and modeling.
Composites Science and Technology, 72, 1223-1232.

References
189
CANNING, L., HOLLAWAY, L. & THORNE, A. M. 1999. Manufacture, testing and
numerical analysis of an innovative polymer composite/concrete structural unit.
Proceedings of the Institution of Civil Engineers-Structures and Buildings, 134,
231-241.
CANTWELL, W. J. & MORTON, J. 1989a. Comparison of the Low and High-Velocity
Impact Response of Cfrp. Composites, 20, 545-551.
CANTWELL, W. J. & MORTON, J. 1989b. Geometrical Effects in the Low Velocity
Impact Response of Cfrp. Composite Structures, 12, 39-59.
CANTWELL, W. J. & MORTON, J. 1991. The Impact Resistance of Composite-
Materials - a Review. Composites, 22, 347-362.
CAPRINO, G. 1984. Residual Strength Prediction of Impacted Cfrp Laminates. Journal
of Composite Materials, 18, 508-518.
CAPRINO, G., VISCONTI, I. C. & DIILIO, A. 1984. Elastic Behavior of Composite
Structures under Low Velocity Impact. Composites, 15, 231-234.
CARREIRA, D. J. & CHU, K.-H. Stress-strain relationship for plain concrete in
compression. Journal Proceedings, 1985. 797-804.
CHAKRABORTTY, A., KHENNANE, A., KAYALI, O. & MOROZOV, E. 2011.
Performance of outside filament-wound hybrid FRP-concrete beams.
Composites Part B-Engineering, 42, 907-915.
CHANG, F. K., CHOI, H. Y. & JENG, S. T. 1990. Study on Impact Damage in
Laminated Composites. Mechanics of Materials, 10, 83-95.
CHOI, H. Y., WU, H. Y. T. & CHANG, F. K. 1991. A New Approach toward
Understanding Damage Mechanisms and Mechanics of Laminated Composites
Due to Low-Velocity Impact .2. Analysis. Journal of Composite Materials, 25,
1012-1038.

References
190
CHOTARD, T. J. & BENZEGGAGH, M. L. 1998. On the mechanical behaviour of
pultruded sections submitted to low-velocity impact. Composites Science and
Technology, 58, 839-854.
CHOTARD, T. J., PASQUIET, J. & BENZEGGAGH, M. L. 2000. Impact response and
residual performance of GRP pultruded shapes under static and fatigue loading.
Composites Science and Technology, 60, 895-912.
COLLINS, M. P. & MITCHELL, D. 1991. Prestressed concrete structures, Prentice
Hall.
COLLINS, M. P., MITCHELL, D. & MACGREGOR, J. G. 1993. Structural design
considerations for high-strength concrete. Concrete international, 15, 27-34.
CORREIA, J. R., BRANCO, F. A. & FERREIRA, J. G. 2007a. Flexural behaviour of
GFRP-concrete hybrid beams with interconnection slip. Composite Structures,
77, 66-78.
CORREIA, J. R., BRANCO, F. A. & FERREIRA, J. G. 2007b. Flexural behaviour of
GFRP–concrete hybrid beams with interconnection slip. Composite Structures,
77, 66-78.
CORREIA, J. R., BRANCO, F. A. & FERREIRA, J. G. 2009. Flexural behaviour of
multi-span GFRP-concrete hybrid beams. Engineering Structures, 31, 1369-
1381.
COTSOVOS, D. M. 2010. A simplified approach for assessing the load-carrying
capacity of reinforced concrete beams under concentrated load applied at high
rates. International Journal of Impact Engineering, 37, 907-917.
COTSOVOS, D. M., STATHOPOULOS, N. D. & ZERIS, C. A. 2008. Behavior of RC
Beams Subjected to High Rates of Concentrated Loading. Journal of Structural
Engineering-Asce, 134, 1839-1851.

References
191
CUSATIS, G. 2011. Strain-rate effects on concrete behavior. International Journal of
Impact Engineering, 38, 162-170.
DANIEL, I. M., LABEDZ, R. H. & LIBER, T. 1981. New Method for Testing
Composites at Very High-Strain Rates. Experimental Mechanics, 21, 71-77.
DAVIES, G. A. O. & ZHANG, X. 1995. Impact Damage Prediction in Carbon
Composite Structures. International Journal of Impact Engineering, 16, 149-
170.
DESKOVIC, N., TRIANTAFILLOU, T. C. & MEIER, U. 1995. Innovative Design of
Frp Combined with Concrete - Short-Term Behavior. Journal of Structural
Engineering-Asce, 121, 1069-1078.
DOREY, G. 1988. Impact damage in composites – development, consequences, and
prevention. 6th International Conference on Composite Materials and 2nd
European Conference on Composite Materials. Imperial College, London.
FENG, P., CHENG, S., BAI, Y. & YE, L. P. 2015. Mechanical behavior of concrete-
filled square steel tube with FRP-confined concrete core subjected to axial
compression. Composite Structures, 123, 312-324.
FENWICK, J. M. & ROTOLONE, P. 2003. Risk management to ensure long term
performance in civil infrastructure. Australian Journal of Civil Engineering, 1,
29-34.
FERDOUS, W. 2012. Static flexural behaviour of fly ash-based geopolymer composite
beam: An alternative railway sleeper. Master of Engineering, University of New
South Wales, Canberra.
FERDOUS, W., KHENNANE, A. & KAYALI, O. 2013. Hybrid FRP-concrete railway
sleeper. 6th International Conference on Advanced Composites in Construction.
ACIC 2013, Sep 10th.

References
192
FERDOUS, W. & MANALO, A. 2014. Failures of mainline railway sleepers and
suggested remedies - Review of current practice. Engineering Failure Analysis,
44, 17-35.
FERDOUS, W., MANALO, A., KHENNANE, A. & KAYALI, O. 2015. Geopolymer
concrete-filled pultruded composite beams - Concrete mix design and
application. Cement & Concrete Composites, 58, 1-13.
FOSTER, D. C., RICHARDS, D. & BOGNER, B. R. 2000. Design and installation of
fiber-reinforced polymer composite bridge. Journal of Composites for
Construction, 4, 33-37.
FU, H. C., ERKI, M. A. & SECKIN, M. 1991. Review of Effects of Loading Rate on
Reinforced-Concrete. Journal of Structural Engineering-Asce, 117, 3660-3679.
FUJIKAKE, K., LI, B. & SOEUN, S. 2009. Impact Response of Reinforced Concrete
Beam and Its Analytical Evaluation. Journal of Structural Engineering-Asce,
135, 938-950.
FUJIKAKE, K., SENGA, T., UEDA, N., OHNO, T. & KATAGIRI, M. 2006. Study on
Impact Response of Reactive Powder Concrete Beam and Its Analytical Model.
Journal of Advanced Concrete Technology, 4, 99-108.
GHELLI, D. & MINAK, G. 2011. Low velocity impact and compression after impact
tests on thin carbon/epoxy laminates. Composites Part B-Engineering, 42, 2067-
2079.
GILAT, A., GOLDBERG, R. K. & ROBERTS, G. D. 2002. Experimental study of
strain-rate-dependent behavior of carbon/epoxy composite. Composites Science
and Technology, 62, 1469-1476.

References
193
GONILHA, J. A., CORREIA, J. R. & BRANCO, F. A. 2013. Dynamic response under
pedestrian load of a GFRP-SFRSCC hybrid footbridge prototype: Experimental
tests and numerical simulation. Composite Structures, 95, 453-463.
GUILD, F. J., HOGG, P. J. & PRICHARD, J. C. 1993. A Model for the Reduction in
Compression Strength of Continuous Fiber Composites after Impact Damage.
Composites, 24, 333-339.
GUSTIN, J., JONESON, A., MAHINFALAH, M. & STONE, J. 2005. Low velocity
impact of combination Kevlar/carbon fiber sandwich composites. Composite
Structures, 69, 396-406.
HAI, N. D., MUTSUYOSHI, H., ASAMOTO, S. & MATSUI, T. 2010. Structural
behavior of hybrid FRP composite I-beam. Construction and Building
Materials, 24, 956-969.
HARRIS, H. G., SOMBOONSONG, W. & KO, F. K. 1998. New ductile hybrid FRP
reinforcing bar for concrete structures. Journal of composites for construction, 2,
28-37.
HASHIN, Z. 1980. Failure Criteria for Unidirectional Fiber Composites. Journal of
Applied Mechanics-Transactions of the Asme, 47, 329-334.
HASHIN, Z. & ROTEM, A. 1973. Fatigue Failure Criterion for Fiber Reinforced
Materials. Journal of Composite Materials, 7, 448-464.
HAY, W. W. 1982. Railroad Engineering, John Wiley & Sons.
HAYES, S. V. & ADAMS, D. F. 1982. Rate Sensitive Tensile Impact Properties of
Fully and Partially Loaded Unidirectional Composites. Journal of Testing and
Evaluation, 10, 61-68.

References
194
HEIMBS, S., HELLER, S., MIDDENDORF, P., HAHNEL, F. & WEISSE, J. 2009.
Low velocity impact on CFRP plates with compressive preload: Test and
modelling. International Journal of Impact Engineering, 36, 1182-1193.
HEJLL, A., TÄLJSTEN, B. & MOTAVALLI, M. 2005. Large scale hybrid FRP
composite girders for use in bridge structures—theory, test and field application.
Composites Part B: Engineering, 36, 573-585.
HENRIQUES, J., DA SILVA, L. S. & VALENTE, I. B. 2013. Numerical modeling of
composite beam to reinforced concrete wall joints: Part I: Calibration of joint
components. Engineering Structures, 52, 747-761.
HIBBELER, R. C. 2004. Statics and mechanics of materials: SI edition, Singapore:
Prentice Hall.
HIROL, I. 2008. Plate-girder construction, BiblioBazaar.
HOLLAWAY, L. C. 1980. Glass fibre reinforced plastics in construction: Engineering
aspects, London, United Kindom, Taylor & Francis Ltd.
HOLLAWAY, L. C. 2001. The evolution of and the way forward for advanced polymer
composites in the civil infrastructure. Frp Composites in Civil Engineering, Vols
I and Ii, Proceedings, 27-40.
HOLMES, M. & JUST, D. J. 1983. GRP in structural engineering, Applied Science.
HORDIJK, D. A. 1991. Local approach to fatigue of concrete. PhD Thesis, Delft
University of Technology.
HULATT, J., HOLLAWAY, L. & THORNE, A. 2003. Short term testing of hybrid T
beam made of new prepreg material. Journal of Composites for Construction, 7,
135-144.
ICHIKAWA, T. & MIURA, M. 2007. Modified model of alkali-silica reaction. Cement
and Concrete Research, 37, 1291-1297.

References
195
JIANG, H., WANG, X. W. & HE, S. H. 2012. Numerical simulation of impact tests on
reinforced concrete beams. Materials & Design, 39, 111-120.
JOSHI, S. P. & SUN, C. T. 1985. Impact Induced Fracture in a Laminated Composite.
Journal of Composite Materials, 19, 51-66.
KAEWUNRUEN, S. 2007. Experimental and numerical studies for evaluating dynamic
behaviour of prestressed concrete sleepers subject to severe impact loading.
PhD thesis, University of Wollongong.
KAEWUNRUEN, S. & REMENNIKOV, A. M. 2008. Probabilistic impact fractures of
railway prestressed concrete sleepers. Structural Integrity and Failure, 41-42,
259-264.
KAEWUNRUEN, S. & REMENNIKOV, A. M. 2009a. Dynamic flexural influence on
a railway concrete sleeper in track system due to a single wheel impact.
Engineering Failure Analysis, 16, 705-712.
KAEWUNRUEN, S. & REMENNIKOV, A. M. 2009b. Impact capacity of railway
prestressed concrete sleepers. Engineering Failure Analysis, 16, 1520-1532.
KELLER, T., SCHAUMANN, E. & VALLÉE, T. 2007. Flexural behavior of a hybrid
FRP and lightweight concrete sandwich bridge deck. Composites Part A:
Applied Science and Manufacturing, 38, 879-889.
KHENNANE, A. 2009. Manufacture and testing of a hybrid beam using a pultruded
profile and high strength concrete. Australian Journal of Structural Engineering,
10, 145-155.
KIM, Y. J., GREEN, M. F. & FALLIS, G. J. 2008. Repair of bridge girder damaged by
impact loads with prestressed CFRP sheets. Journal of Bridge Engineering, 13,
15-23.

References
196
KISHI, N. & BHATTI, A. Q. 2010. An equivalent fracture energy concept for nonlinear
dynamic response analysis of prototype RC girders subjected to falling-weight
impact loading. International Journal of Impact Engineering, 37, 103-113.
KISHI, N., MIKAMI, H., MATSUOKA, K. G. & ANDO, T. 2002. Impact behavior of
shear-failure-type RC beams without shear rebar. International Journal of
Impact Engineering, 27, 955-968.
KORICHO, E. G., KHOMENKO, A., HAQ, M., DRZAL, L. T., BELINGARDI, G. &
MARTORANA, B. 2015. Effect of hybrid (micro-and nano-) fillers on impact
response of GFRP composite. Composite Structures, 134, 789-798.
KUMARAN, G., MENON, D. & NAIR, K. K. 2003. Dynamic studies of railtrack
sleepers in a track structure system. Journal of Sound and Vibration, 268, 485-
501.
LAPCZYK, I. & HURTADO, J. A. 2007. Progressive damage modeling in fiber-
reinforced materials. Composites Part A: Applied Science and Manufacturing,
38, 2333-2341.
LEE, J. H. & FENVES, G. L. 1998. Plastic-damage model for cyclic loading of
concrete structures. Journal of Engineering Mechanics-Asce, 124, 892-900.
LEE, J. H., KIM, Y. B., JUNG, J. W. & KOSMATKA, J. 2007. Experimental
characterization of a pultruded GFRP bridge deck for light-weight vehicles.
Composite Structures, 80, 141-151.
LI, Z., KHENNANE, A., HAZELL, P. J. & BROWN, A. D. 2017a. Impact behaviour of
pultruded GFRP composites under low-velocity impact loading. Composite
Structures, 168, 360-371.
LI, Z., KHENNANE, A., HAZELL, P. J. & REMENNIKOV, A. M. 2017b. Numerical
modeling of a hybrid GFRP-concrete beam subjected to low-velocity impact
References
197
loading. The 8th International Conference on Computational Methods. Guilin,
Guangxi, China: July 25-29th.
LIU, D. H. 1988. Impact-Induced Delamination - a View of Bending Stiffness
Mismatching. Journal of Composite Materials, 22, 674-692.
LIU, Z. H., COUSINS, T. E., LESKO, J. J. & SOTELINO, E. D. 2008. Design
Recommendations for a FRP Bridge Deck Supported on Steel Superstructure.
Journal of Composites for Construction, 12, 660-668.
LUBLINER, J., OLIVER, J., OLLER, S. & ONATE, E. 1989. A Plastic-Damage Model
for Concrete. International Journal of Solids and Structures, 25, 299-326.
MALVAR, J. & ROSS, A. 1998. Review of Strain Rate Effects for Concrete in
Tension. Materials Journal, 95, 735-739.
MANALO, A., ARAVINTHAN, T., KARUNASENA, W. & TICOALU, A. 2010. A
review of alternative materials for replacing existing timber sleepers. Composite
Structures, 92, 603-611.
MATZENMILLER, A., LUBLINER, J. & TAYLOR, R. 1995. A constitutive model for
anisotropic damage in fiber-composites. Mechanics of materials, 20, 125-152.
MEYER, R. W. 1985. Handbook of pultrusion technology, Springer US.
MINDESS, S., BANTHIA, N. & BENTUR, A. 1986. The response of reinforced
concrete beams with a fibre concrete matrix to impact loading. The International
Journal of Cement Composites and Lightweight Concrete, 8, 165-170.
MINDESS, S. & BENTUR, A. 1985. A Preliminary-Study of the Fracture of Concrete
Beams under Impact Loading, Using High-Speed Photography. Cement and
Concrete Research, 15, 474-484.

References
198
MITCHELL, R., BAGGOTT, M. G. & BIRKS, J. 1987. Steel sleepers - an engineering
approach to improve productivity. Conference on Railway Engineering. Perth,
Australia: National conference publication.
MIURA, S., TAKAI, H., UCHIDA, M. & FUKUDA, Y. 1998. The mechanism of
railway tracks. Japan Railway & Transport Review, 3, 38-45.
MURRAY, M. & CAI, Z. 1998. Literature review on the design of railway prestressed
concrete sleeper. RSTA Research Report. Australia.
NAAMAN, A. E. & GOPALARATNAM, V. S. 1983. Impact properties of steel fibre
reinforced concrete in bending. The International Journal of Cement Composites
and Lightweight Concrete, 5, 225-233.
NAIK, N. K., YERNAMMA, P., THORAM, N. M., GADIPATRI, R. & KAVALA, V.
R. 2010. High strain rate tensile behavior of woven fabric E-glass/epoxy
composite. Polymer Testing, 29, 14-22.
NATIONAL-RESEARCH-COUNCIL 2004. Guide for the design and construction of
externally bonded FRP systems for strengthening existing structures. CNR-
DT200.
NEELY, W. D., COUSINS, T. E. & LESK, J. J. 2004. Evaluation of in-service
performance of Tom's Creek Bridge fiber-reinforced polymer superstructure.
Journal of Performance of Constructed Facilities, 18, 147-158.
NIE, J. G., FAN, J. S. & CAI, C. S. 2004. Stiffness and deflection of steel-concrete
composite beams under negative bending. Journal of Structural Engineering-
Asce, 130, 1842-1851.
OZBOLT, J. & SHARMA, A. 2011. Numerical simulation of reinforced concrete
beams with different shear reinforcements under dynamic impact loads.
International Journal of Impact Engineering, 38, 940-950.

References
199
PEREZ, M. A., GIL, L. & OLLER, S. 2011. Non-destructive testing evaluation of low
velocity impact damage in carbon fiber-reinforced laminated composites.
Ultragarsas" Ultrasound", 66, 21-27.
PETRONE, G., RAO, S., DE ROSA, S., MACE, B. R., FRANCO, F. &
BHATTACHARYYA, D. 2013a. Behaviour of fibre-reinforced honeycomb core
under low velocity impact loading. Composite Structures, 100, 356-362.
PETRONE, G., RAO, S., DE ROSA, S., MACE, B. R., FRANCO, F. &
BHATTACHARYYA, D. 2013b. Initial experimental investigations on natural
fibre reinforced honeycomb core panels. Composites Part B-Engineering, 55,
400-406.
PHAM, T. M. & HAO, H. 2016a. Impact Behavior of FRP-Strengthened RC Beams
without Stirrups. Journal of Composites for Construction, 20.
PHAM, T. M. & HAO, H. 2016b. Review of Concrete Structures Strengthened with
FRP Against Impact Loading. Structures, 7, 59-70.
PHILIPPIDIS, T. P. & ANTONIOU, A. E. 2013. A progressive damage FEA model for
glass/epoxy shell structures. Journal of Composite Materials, 47, 623-637.
PINHO, S. T., ROBINSON, P. & IANNUCCI, L. 2006. Fracture toughness of the
tensile and compressive fibre failure modes in laminated composites.
Composites Science and Technology, 66, 2069-2079.
POPOVICS, S. 1973. A numerical approach to the complete stress-strain curve of
concrete. Cement and concrete research, 3, 583-599.
PRASAD, G. G. & BANERJEE, S. 2013. The Impact of Flood-Induced Scour on
Seismic Fragility Characteristics of Bridges. Journal of Earthquake
Engineering, 17, 803-828.

References
200
PRUSZINSKI, A. 1999. Review of the landfill disposal risks and potential for recovery
and recycling of preservative treated timber. Environment protection agency,
South Australia.
QIAO, P. Z., DAVALOS, J. F. & ZIPFEL, M. G. 1998. Modeling and optimal design of
composite-reinforced wood railroad crosstie. Composite Structures, 41, 87-96.
RICHARDSON, M. O. W. & WISHEART, M. J. 1996. Review of low-velocity impact
properties of composite materials. Composites Part a-Applied Science and
Manufacturing, 27, 1123-1131.
ROBINSON, P. & DAVIES, G. A. O. 1992. Impactor Mass and Specimen Geometry-
Effects in Low Velocity Impact of Laminated Composites. International Journal
of Impact Engineering, 12, 189-207.
RODRIGUEZ, J., CHOCRON, I. S., MARTINEZ, M. A. & SANCHEZGALVEZ, V.
1996. High strain rate properties of aramid and polyethylene woven fabric
composites. Composites Part B-Engineering, 27, 147-154.
ROSS, A., TEDESCO, J. W. & KUENNEN, S. T. 1995. Effects of Strain Rate on
Concrete Strength. Materials Journal, 92, 37-47.
SÁ, M. F., GOMES, A. M., CORREIA, J. R. & SILVESTRE, N. 2016. Flexural creep
response of pultruded GFRP deck panels: Proposal for obtaining full-section
viscoelastic moduli and creep coefficients. Composites Part B: Engineering, 98,
213-224.
SAATCI, S. & VECCHIO, F. J. 2009. Effects of Shear Mechanisms on Impact
Behavior of Reinforced Concrete Beams. Aci Structural Journal, 106, 78-86.
SAHARUDIN, M. S., AIDAH, J., KAHAR, A. Z. & AHMAD, S. The influence of
alumina filler on impact properties of short glass fiber reinforced epoxy.
Applied Mechanics and Materials, 2013. Trans Tech Publ, 88-93.

References
201
SAKAMOTO, I., OKADA, H., KAWAI, N., YAMAGUCHI, N. & ISODA, M. 2001. A
research and development project on hybrid timber building structures.
Innovative Wooden Structures and Bridges, 283-288.
SATASIVAM, S. & BAI, Y. 2016. Mechanical performance of modular FRP-steel
composite beams for building construction. Materials and Structures, 49, 4113-
4129.
SCHWEITZER, P. A. 2009. Fundamentals of corrosion: Mechanisms, causes and
preventative methods, CRC Press.
SEBAEY, T., GONZÁLEZ, E., LOPES, C., BLANCO, N. & COSTA, J. 2013. Damage
resistance and damage tolerance of dispersed CFRP laminates: The bending
stiffness effect. Composite Structures, 106, 30-32.
SENNAH, K. M. & KENNEDY, J. B. 2002. Literature review in analysis of box-girder
bridges. Journal of Bridge Engineering, 7, 134-143.
SHOKRIEH, M. M. & OMIDI, M. J. 2009. Tension behavior of unidirectional
glass/epoxy composites under different strain rates. Composite Structures, 88,
595-601.
SJOBLOM, P. O., HARTNESS, J. T. & CORDELL, T. M. 1988. On Low-Velocity
Impact Testing of Composite-Materials. Journal of Composite Materials, 22,
30-52.
SPECIFICATION.NAASRA 1976. National Association of Australian State Road
Authorities. Sydney.
STALLINGS, J. M., TEDESCO, J. W., EI-MIHILMY, M. & MECAULEY, M. 2000.
Field performance of FRP bridge repairs. Journal of Bridge Engineering, 5, 107-
113.
STANDARDS, A. 2003a. Australian standard AS 1085.(2003). Railway track material.

References
202
STANDARDS, A. 2003b. Railway track material. Part 14: Prestressed concrete
sleepers. Australia: Australian Standard (AS1085.14).
STANDARDS, A. 2003c. Railway track material. Part 19: Resilient fastening
assemblies. Australia: Australian Standard (AS1085.19).
SUARIS, W. & SHAH, S. P. 1982. Strain-Rate Effects in Fiber-Reinforced Concrete
Subjected to Impact and Impulsive Loading. Composites, 13, 153-159.
SUTHERLAND, L. S., SA, M. F., CORREIA, J. R., SOARES, C. G., GOMES, A. &
SILVESTRE, N. 2017. Impact response of pedestrian bridge multicellular
pultruded GFRP deck panels. Composite Structures, 171, 473-485.
TABIEI, A., SVANSON, A. & HARGRAVE, M. 1996. Impact behavior of pultruded
composite box-beams. Composite Structures, 36, 155-160.
TACHIBANA, S., MASUYA, H. & NAKAMURA, S. 2010. Performance based design
of reinforced concrete beams under impact. Natural Hazards and Earth System
Sciences, 10, 1069-1078.
TANG, T. & SAADATMANESH, H. 2005. Analytical and experimental studies of
fiber-reinforced polymer-strengthened concrete beams under impact loading. Aci
Structural Journal, 102, 139-149.
TAVAKKOLIZADEH, M. & SAADATMANESH, H. 2003. Strengthening of steel-
concrete composite girders using carbon fiber reinforced polymers sheets.
Journal of Structural Engineering-Asce, 129, 30-40.
TENG, J. G., YU, T. & FERNANDO, D. 2012. Strengthening of steel structures with
fiber-reinforced polymer composites. Journal of Constructional Steel Research,
78, 131-143.

References
203
TENG, J. G., YU, T., WONG, Y. L. & DONG, S. L. 2007. Hybrid FRP-concrete-steel
tubular columns: Concept and behavior. Construction and Building Materials,
21, 846-854.
THIERFELDER, T. & SANDSTROM, E. 2008. The creosote content of used railway
crossties as compared with European stipulations for hazardous waste. Science
of the Total Environment, 402, 106-112.
THORENFELDT, E., TOMASZEWICZ, A. & JENSEN, J. Mechanical properties of
high-strength concrete and application in design. Proceedings of the symposium
utilization of high strength concrete, 1987. Tapir Trondheim Norway, 149-159.
TIAN, B. & COHEN, M. D. 2000. Does gypsum formation during sulfate attack on
concrete lead to expansion? Cement and Concrete Research, 30, 117-123.
UEDA, T. 2004. Standard Specifications for Concrete Structures-2002. JSCE, Hokosha
Co., Ltd, Japan, 24-32.
VAN ERP, G., HELDT, T., CATTELL, C. & MARSH, R. A new approach to fibre
composite bridge structures. Proceedings of the 17th Australasian conference on
the mechanics of structures and materials, ACMSM17, Australia, 2002. 37-45.
WANG, N. Z., MINDESS, S. & KO, K. 1996. Fibre reinforced concrete beams under
impact loading. Cement and Concrete Research, 26, 363-376.
WANG, Y. C., LEE, M. G. & CHEN, B. C. 2007. Experimental study of FRP-
strengthened RC bridge girders subjected to fatigue loading. Composite
Structures, 81, 491-498.
WEE, T., CHIN, M. & MANSUR, M. 1996. Stress-strain relationship of high-strength
concrete in compression. Journal of Materials in Civil Engineering, 8, 70-76.

References
204
WHITTINGHAM, B., MARSHALL, I. H., MITREVSKI, T. & JONES, R. 2004. The
response of composite structures with pre-stress subject to low velocity impact
damage. Composite Structures, 66, 685-698.
WILLIAMS, B., SHEHATA, E. & RIZKALLA, S. H. 2003. Filament-wound glass
fiber reinforced polymer bridge deck modules. Journal of Composites for
Construction, 7, 266-273.
WINTER, W., TAVOUSSI, K., PIXNER, T. & PARADA, F. R. 2012. Timber-steel-
hybrid beams for multi-storey buildings. World Conference on Timber
Engineering. Auckland.
WITCHER, D. A. 2009. Why fiber reinforced polymer (FRP) structural shapes have
become a material of choice. Structure magazine.
WONG, K., GONG, X., AIVAZZADEH, S. & TAMIN, M. Numerical simulation of
mode I delamination behaviour of multidirectional composite laminates with
fibre bridging effect. 15th European Conference on Composite Materials, 2012.
WU, E. B. & SHYU, K. 1993. Response of Composite Laminates to Contact Loads and
Relationship to Low-Velocity Impact. Journal of Composite Materials, 27,
1443-1464.
ZHANG, Z. Y. & RICHARDSON, M. O. W. 2007. Low velocity impact induced
damage evaluation and its effect on the residual flexural properties of pultruded
GRP composites. Composite Structures, 81, 195-201.
ZHAO, X. L. & ZHANG, L. 2007. State-of-the-art review on FRP strengthened steel
structures. Engineering Structures, 29, 1808-1823.
ZHOU, G. & HILL, M. D. 2009. Impact Damage and Energy-absorbing Characteristics
and Residual In-plane Compressive Strength of Honeycomb Sandwich Panels.
Journal of Sandwich Structures & Materials, 11, 329-356.

References
205
ZUREICK, A. & SCOTT, D. 1997. Short-term behavior and design of fiber-reinforced
polymeric slender members under axial compression. Journal of Composites for
Construction, 1, 140-149.