Evaluation of buckling-restrained braced frame seismic performance considering reserve strength
Upload
khangminh22Category
view
4download
0
RESTRAINED SHRINKAGE BEHAVIOUR OF CONCRETE WITH RECYCLED
MATERIALS
A thesis submitted for the degree of Doctor of Philosophy
By Khaleel Hassan Younis
(BSc, MSc)
Centre for Cement and Concrete Department of Civil and Structural Engineering
The University of Sheffield
Sheffield
March 2014

i
To my wife Shelan , my sustainable and renewable source of
encouragement and love

ii
ABSTRACT The construction industry is responsible for some of the most serious sustainability and
environmental issues the world is currently facing. Recycled materials such as recycled
aggregate (RA) -generated from processed construction waste- and recycled tyre steel fibres
(RTSF) -extracted from post-consumer tyres- in new constructions can potentially conserve
natural aggregates (NA), eliminate unnecessary consumption of limited landfill areas and reduce
energy consumption. However, the variability in the characteristics of recycled materilas, and the
low density, high water absorption and porosity of RA, can lead to poor quality concrete and
shrinkage cracks, particularly under restrained conditions. This study aims to examine the use of
recycled materials such as RA and RTSF in the production of structural concrete and in
particular to contribute towards understanding the shrinkage behaviour of NA concrete (NAC)
and RA concrete (RAC) under restrained conditions.
An extensive experimental study to characterise the properties of both NA and RA and identify
the effect of various key parameters on the performance of RAC is undertaken. Approaches to
improve the properties of RA and RAC are explored. A new restraining frame for restrained
shrinkage test and a procedure to quantify the post-shrinkage mechanical properties (compressive
and flexural strength and flexural elastic modulus) of concrete are developed and assessed. The
mechanical performance of concrete mixes incorporating RA and RTSF, as well as mixes with
NA and industrial steel fibres (ISF), is examined under free and restrained conditions.
It is shown that the compressive strength of RAC can be predicted using a predictive model that
takes into account: particle density, LA value, water absorption and RA content. Surface
treatment of RA using reactive and non-reactive microfillers, as well as the utilization of RTSF,
helped improve the compressive strength of RAC by up to 30%.
For unrestrained specimens, it is shown that there is a significant difference in shrinkage strains
with depth, resulting in significant shrinkage curvatures. Under restrained conditions, stress
history, which depends on the rate of development of stiffness and shrinkage, plays a key role in
governing the failure of concrete. Shrinkage induced cracks can reduce the compressive strength,
flexural strength and flexural elastic modulus of plain concrete by up to 14%, 24% and 29%,
respectively.
The addition of RTSF and surface treatment of RA resulted in better flexural performance of
RAC compared to that of NAC without fibres and comparable to that of NAC with fibres.
It is shown that whilst ISF do not affect shrinkage strains, RTSF increase initial shrinkage strains
due to higher air content. Despite that, it is concluded that RTSF control well shrinkage induced
microcracking, enhance tensile relaxation and promote auto-healing of microcracks, leading to
an overall better flexural performance even when using RAC.

iii
ACKNOWLEDGEMENTS
I would like to express my sincere gratitude and appreciation to my main supervisor,
Professor Kypros Pilakoutas, for his precious time, continuous support, directive guidance,
valuable comments and helpful suggestions that helped greatly in completion of this work.
Thank you Kypros for keeping my hopes up throughout the difficult years.
I also would like to thank my second supervisor(s) Dr. Kyriacos Neocleous (for the first
year) and Dr Cyril Lynsdale (for the second and third year) for their support and assistance.
I acknowledge the financial support of the Iraqi’s Ministry of Higher Education and
Scientific Research (MHESR) during the period of this research.
Great thanks to all technicians in the Heavy Structures Laboratory for their continuous
assistance. Special thanks to Kieran Nash, Paul Blackburn and David Hobart for their
collaboration and continuous support.
I am also grateful to all my friends and colleagues in the Construction Innovations Group,
especially Kamaran Ismail for his assistance in FE-Analysis and Harris Angelakopoulos for
the valuable discussions and suggestions.
Finally, and in no sense the least, my deepest thanks to my wife, Shelan and children Ari,
Arya and Saya to whom I am indebted for their encouragement, understanding and patience
over the years.

iv
TABLE OF CONTENTS
ABSTRACT II
ACKNOWLEDGEMENT III
TABLE OF CONTENTS IV
LIST OF FIGURES X
LIST OF TABLES XVI
LIST OF SYMBOLS AND ABBREVAITIONS XVII
CHAPTER 1 INTRODUCTION 1
1 Introduction 2
1.1 Motivation 2
1.2 Background of Research Problem 3
1.2.1 Recycled Aggregates : Concerns and the Need for Improvement 3
1.2.2 Shrinkage 4
1.2.2.1 General 4
1.2.2.2 Restrained Shrinkage 4
1.2.2.3 Assessment of Restrained Shrinkage 4
1.2.2.4 Shrinkage Crack Control 6
1.3 Aims and Objectives 7
1.4 Thesis Presentation 8
CHAPTER 2 STRENGTH PREDICTION MODEL AND METHODS FOR IMPROVING RECYCLED AGGREAGTE 15
2.1 Introduction 16
2.2 Materials 17
2.2.1 Cementitious Materials 17
2.2.2 Aggregates 18
2.2.3 Recycled Tyres Steel Fibre (RTSF) 20
2.2.4 Superplasticizer and Air Entraining Admixture 21
2.3 Aggregate Characterization 21
2.3.1 Composition 21

v
2.3.2 Size Distribution 22
2.3.3 Density 25
2.3.4 Water Absorption 25
2.3.5 Porosity and LA 26
2.4 Mix proportioning 26
2.5 Concrete production 27
2.6 Properties of NAC and RAC 28
2.6.1 Workability, Air voids and Density 28
2.6.2 Compressive Strength Results 29
2.6.3 Effect of Particle Density on Properties of RA and RAC 30
2.6.4 Parameters affecting Strength of RAC 32
2.6.5 Strength Prediction Equations 33
2.7 Surface Treatment of RA 37
2.7.1 Methodology for Surface Treatment 37
2.7.2 Results of the Treatment Techniques 39
2.7.2.1 Uptake of RA and Workability 39
2.7.2.2 Density and Compressive Strength 39
2.7.3 Effect of ITZ on the Strength of RAC 40
2.8 Effect of RTSF on Strength of RAC 43
2.9 Conclusions 44
CHAPTER 3 ASSESSMENT OF POST-RESTRAINED SHRINKAGE MECHANICAL PROPERTIES OF CONCRETE- PILOT STUDY 50
3.1 Introduction 51
3.1.1 Research Significance 55
3.2 Proposed Restrained Shrinkage Test Rig 55
3.3 Materials and Experimental Procedure 57
3.3.1 Materials and Specimen Preparation 57
3.3.2 Tests 58
3.3.2.1 Free and Restrained Shrinkage 58

vi
3.3.2.2 Loss of Mass (loss of moisture) 59
3.3.2.3 Compressive Strength 59
3.3.2.4 Flexural tests 59
3.4 Experimental Results and Discussion 60
3.4.1 Free Shrinkage Strains 60
3.4.2 Restrained Shrinkage Strains, RF and Characterisation of Cracks 61
3.4.3 Mass Loss 64
3.4.4 Effect of strain loss on RF and cracking development 65
3.4.5 Compressive Strength 70
3.4.6 Flexural strength and Flexural Elastic Modulus 71
3.4.7 General Discussion 72
3.5 Conclusions 72
CHAPTER 4 ASSESSMENT OF POST-RESTRAINED SHRINKAGE MECHANICAL PROPERTIES OF CONCRETE- PARAMETRIC STUDY (PART I) 76
4.1 Introduction 77
4.2 Experimental Programme 78
4.2.1 Development of New Restraining Frame 78
4.2.2 Materials, Mix Proportions and Geometry and Preparation of Specimens 82
4.2.3 Shrinkage and Mass loss Measurements 83
4.3 Results and Discussion 85
4.3.1 Free Shrinkage Strains 85
4.3.1.1 Effect of gauge length 85
4.3.1.2 Effect of surface (top, sides and bottom) 86
4.3.1.3 Effect of depth (variation of shrinkage over specimen depth) 88
4.3.1.4 Shrinkage Curvature 91
4.3.1.5 Effect of w/c 92
4.3.2 Mass Loss 92
4.3.3 Mass Loss vs Free Shrinkage Strains 93
4.4 Conclusions 94

vii
CHAPTER 5 ASSESSMENT OF POST-RESTRAINED SHRINKAGE MECHANICAL PROPERTIES OF CONCRETE- PARAMETRIC STUDY (PART II) 97
5.1 Introduction 98
5.2 Test procedures and Measurements 99
5.2.1 Compressive Strength 100
5.2.2 Bending Tests (Flexural strength and Modulus of Elasticity) 101
5.3 Results and Discussion 101
5.3.1 Crack Characterization 101
5.3.2 Restrained Shrinkage 103
5.3.2.1 Un-cracked specimens 103
5.3.2.2 Cracked specimens 105
5.3.3 Failure of Concrete under Restrained Conditions 110
5.3.4 Restraint Factor RF 111
5.3.4.1 Theoretical RF 111
5.3.4.2 Results of Un-cracked specimens 113
5.3.4.3 Discussion on RF of un-cracked specimens 116
5.4 Mechanical Properties 119
5.4.1 Compressive Strength (Cubes) 120
5.4.2 Compressive Strength (prisms) 120
5.4.3 Flexural Strength 122
5.4.4 Flexural Elastic Modulus Efmax 125
5.5 Conclusions 127
CHAPTER 6 POST-RESTRAINED SHRINKAGE BEHAVIOUR OF CONCRETE MADE WIRH RECYCLED MATERIALS 131
6.1 Introduction 132
6.2 Experimental Details and Testing Procedures 135
6.2.1 Materials 135
6.2.2 Variables and Mix Proportions 137
6.2.3 Geometry and Preparation of Specimens 138

viii
6.2.4 Strain Measurements 138
6.2.5 Restraint Factor (RF) 139
6.2.6 Crack Detection 139
6.2.7 Loss of Mass (loss of moisture) 140
6.2.8 Compressive Strength 140
6.2.9 Bending Tests (Flexural Strength and Modulus of Elasticity) 140
6.3 Results and Discussion - Free Shrinkage Tests 140
6.3.1 Steel Fibre Reinforced (SFR) NAC 140
6.3.2 Plain and SFR-RAC 141
6.3.3 Effect of Surface and Depth 143
6.3.4 Shrinkage Curvature of SFR-NAC 147
6.3.5 Mass Loss 150
6.3.6 Mass Loss vs Free Shrinkage Strain 151
6.4 Results and Discussion - Restrained Shrinkage 152
6.4.1 Crack Characterization 152
6.4.2 Failure of FRC under Restrained Conditions 154
6.4.3 Shrinkage Strains 154
6.4.3.1 Plain and SFR- NAC 155
6.4.3.2 Plain and SFR-RAC 156
6.4.4 Restraint Factor RF 157
6.4.4.1 Theoretical RF 157
6.4.4.2 Apparent RF 158
6.5 Results and Discussion - Mechanical Properties 160
6.5.1 Compressive Strength 160
6.5.2 Flexural Behaviour 162
6.5.2.1 Flexural Elastic Modulus Efmax 165
6.5.2.2 Flexural strength (flLOP and flult) 167
6.5.2.3 Discussion on Flexural Properties 168

ix
6.5.2.4 Discussion on Effect of Restrained Shrinkage on Mechanical Properties 169
6.6 Conclusions 170
CHAPTER 7 SUMMARY AND CONCLUSIONS, AND RECOMMENDATIONS FOR FUTURE WORK 175
7.1 Summary and Conclusions 176
7.1.1 Characterisation of RA and Properties of RAC 176
7.1.2 Methods to Improve RAC Strength 177
7.1.3 Restrained Shrinkage Test: Pilot Study-Single Rig 177
7.1.4 Restrained Shrinkage Test: Parametric Study-Restraining Frame 178
7.1.5 Restrained Shrinkage Behaviour of Mixes with ISF, RTSF and RA. 180
7.2 Recommendations for Future Work 181
7.2.1 On Improving RAC Properties 181
7.2.1 On Restrained Shrinkage 182
Appendix A A2-A10
Appendix B B1-B21
Appendix C C1-C8
Appendix D D1-D8
Appendix E E1-E10
Appendix F F1-F16
Appendix G G1-G50

x
LIST OF FIGURES
Figure 2. 1a Recycled Aggregates from CDW. 19
Figure 2. 1b Length distribution of RTSF. 20
Figure 2. 2 Composition of RA for sizes between (5-20). 21
Figure 2. 3 Size distribution curves of coarse NA and RA. 23
Figure 2. 4 Rate of WA of different types of RA. 26
Figure 2. 5 Normalized compressive strength of RAC at different RA content. 30
Figure 2. 6 Effect of particle density of RA on its strength. 30
Figure 2. 7 Effect of particle density of RA on its WA and porosity. 31
Figure 2. 8 Effect of particle density on the normalised density of RAC. 31
Figure 2. 9 Effect of particle density of RA on normalized strength of RAC. 32
Figure 2. 10 Relation between normalized density and normalised strength of RAC. 33
Figure 2. 11 Effect of LA of RA on normalized strength of RAC. 33
Figure 2. 12 Predictive models for fcu of RAC, a- linear model eq.1, b- linear model eq.2, non-linear model eq. 3. 34
Figure 2. 13 Validity of the predictive models for fcu of RAC: a- linear model eq.1, b- linear model eq. 2, c-non-linear model eq.3 36
Figure 2. 14 Mixing steps of WMT 38
Figure 2. 15 Schematic representation of ITZs in RAC. 41
Figure 2. 16 Microscope and SEM images and EDAX of RAC. 42
Figure 2. 17 Microscope and SEM images of RAC with SF treated RA. 43
Figure 3. 1 Ring test apparatus. 53
Figure 3. 2 (a-c) Schematics of previously attempted configurations to simulate restrained shrinkage, (d-f) End gripping arrangements. 53
Figure 3. 3 Geometry of the restraining rig used by Weiss et al.14 55
Figure 3. 4 Front view of the developed rig for restrained shrinkage test. 56
Figure 3. 5 The developed rig after manufacturing. 56
Figure 3. 6 Distribution of Demec points for restrained specimen. 57

xi
Figure 3. 7 Free shrinkage strains of the side surface 60
Figure 3. 8 Free shrinkage strain of the top surface. 60
Figure 3. 9 Shrinkage strains of the restrained sample using 50 mm gauge length. 61
Figure 3. 10 Shrinkage strains of the restrained specimen using 300 mm gauge length. 61
Figure 3. 11 RF calculated from the strains measured (on the side of the specimen) using 300mm gauge length. 62
Figure 3. 12 Crack distribution at day 75 on the sides of the restrained specimen. 64
Figure 3. 13 a-Evolution of mass loss of the free sample, b- Mass loss against shrinkage strain 65
Figure 3. 14 Schematic representation the deformations of the rig caused by the restrained shrinkage of concrete. 65
Figure 3. 15 Finite element analysis a-stresses , b- strains. 66
Figure 3. 16 Shrinkage induced strains (deformations) in concrete and rig. 67
Figure 3. 17 Effect of elastic modulus of concrete (Ec) on the estimated RF (Note: 1 GPa = 145 ksi). 68
Figure 3. 18 Development of compressive strength (Note: 1 MPa = 145 psi). 68
Figure 3. 19 Variation of estimated and measured RF over time. 69
Figure 3. 20 Variation of stress/strength ratio over time. 70
Figure 3. 21 Results of compressive strength. (Note: 1 MPa = 145 psi). 70
Figure 3. 22 Mid -span deflection versus bending load (Note: 1 kN=224.8 lb). 71
Figure 3. 23 Flexural elastic modulus (Eflex) versus bending load (Note 1 GPa= 145 ksi). 72
Figure 4. 1 Front view of the developed rig for restrained shrinkage test [11]. 78
Figure 4. 2 New restraining frame (all dimensions in mm). 80
Figure 4. 3 New restraining frame after manufacturing: a and b- general view c- side view d- frame with the timber sides and the top perspex cover in place. e- details of the end f- rectangular prespex piece with curved ends used to provide space at the bottom of each prism. 81
Figure 4. 4 Restraining frame clamped to vibrating table. 83
Figure 4. 5 Location of Demec points for: a and c-free shrinkage specimens, b-restrained shrinkage specimens (all presented values are in mm). 84
Figure 4. 6 Free shrinkage strains measured on top, sides and bottom surfaces for mix NA30. 85

xii
Figure 4. 7 Free shrinkage strains measured on top, sides and bottom surfaces for mix NA40. 86
Figure 4. 8 Free shrinkage strains measured on top, sides and bottom surfaces for mix NA50. 86
Figure 4. 9 Difference in the strains between top and bottom surfaces. 87
Figure 4. 10 Difference in the strains between top and side surfaces. 87
Figure 4. 11 Shrinkage strains at upper edge, centre and lower edge of the side face of mix NA30. 88
Figure 4. 12 Shrinkage strains at upper edge, centre and lower edge of the side face of mix NA40. 89
Figure 4. 13 Shrinkage strains at upper edge, centre and lower edge of the side face of mix NA50. 89
Figure 4. 14 Variation of shrinkage strains over the depth of the concrete specimen (a) mix NA30, (b) mix NA40, (c) mix NA50. 90
Figure 4. 15 Shrinkage curvature developed on the free specimens, (a) mix NA30, (b) mix NA40, (c) mix NA50. 91
Figure 4. 16 Shrinkage strains development for all mixes. 92
Figure 4. 17 Mass loss versus time. 93
Figure 4. 18 Mass loss-shrinkage strains curves. 93
Figure 4. 19 Shrinkage strain-mass loss curves at different times of drying. 94
Figure 5. 1 Distribution of the macro and full depth cracks a- NA30, b-NA40, c-NA50. (shaded grey and diagonal lines zones are critical tension and compression zone, respectively, when prisms tested in bending). 102
Figure 5. 2 Shrinkage strains developed on the top and sides (average) of the uncracked specimens, (a-b) mix NA30, (c-d) mix NA40, (e-f) mix NA50. 104
Figure 5. 3 Average shrinkage strain on the sides at 7 days for free and restrained specimens. 105
Figure 5. 4 Development of shrinkage strains on specimen B (mix NA30). 106
Figure 5. 5 Shrinkage strains of the sides of free specimens and those of restrained specimens in the uncracked regions for mix NA30. 106
Figure 5. 6 Temperature evolution inside the concrete due to cement hydration for restrained specimens (mix NA30). 107
Figure 5. 7 Development of shrinkage strains on specimen T (mix NA40). 108

xiii
Figure 5. 8 Shrinkage strains of the sides of free specimens and those of restrained specimens in the uncracked regions for mix NA40. 108
Figure 5. 9 Development of shrinkage strains on specimen M (mix NA50). 109
Figure 5. 10 Shrinkage strains of the sides of free specimens and those of restrained specimens in the uncracked regions for mix NA50. 109
Figure 5. 11 (a) Evolution of compressive strength, (b) and predicted evolution of elastic modulus for all mixes. 111
Figure 5. 12 Deformed shape and axial stresses of the restraining frame. 112
Figure 5. 13 Estimated RF of the T, M and B specimens a- NA30, b- NA40, c- NA50. 113
Figure 5. 14 Restraint factor versus drying time on the sides and the top surface for mix NA30 a- Specimen T, b- Specimen M. 114
Figure 5. 15 Restraint factor versus drying time on the sides and the top surface for mix NA40 a- Specimen M, b- Specimen B. 115
Figure 5. 16 Restraint factor versus drying time on the sides and the top surface for mix NA50 a- Specimen T, b- Specimen B. 116
Figure 5. 17 Average theoretical RF and measured RF on the top and the sides of un-cracked restrained specimens for all mixes. 117
Figure 5. 18 Average shrinkage curvature developed on free specimens and average shrinkage curvature restrained by the frame, (a) mix NA30, (b) mix NA40, (c) mix NA50. 119
Figure 5. 19 Normalized compressive strength a- NA30, b- NA40, c- NA50. 121
Figure 5. 20 Sample for compressive strength from a restrained specimen. 122
Figure 5. 21 Positions of supports and loads in bending test for free shrinkage specimens (dimensions in mm). 122
Figure 5. 22 Positions of supports and loads in bending test for restrained shrinkage specimens (dimensions in mm). 123
Figure 5. 23 Load-deflection curves for WC (average), F (average) and restrained specimens, a- NA30, b- NA40, c-NA50. 124
Figure 5. 24 Flexural elastic modulus versus bending load for WC, F and restrained specimens, a- NA30, b- NA40, c- NA50 126
Figure 5. 25 Effect of crack width on the loss of Efmax. 127
Figure 6. 1 Frame for restrained shrinkage test (all dimensions in mm). 135
Figure 6. 2 Industrial steel fibres (ISF). 136
Figure 6. 3 Length distribution of RTSF. 137

xiv
Figure 6. 4 Location of Demec points for free shrinkage specimens (values presented are in mm). 138
Figure 6. 5 Development of free shrinkage strains of plain and SFR-NAC. 141
Figure 6. 6 Development of free shrinkage strains of plain NAC, plain RAC and RAC reinforced with RTSF. 142
Figure 6. 7 Development of free shrinkage strains of NA40 at top (T), sides (S) and bottom (B) surfaces. 143
Figure 6. 8 Development of free shrinkage strains of NA40R+I at top (T), sides (S) and bottom (B) surfaces. 143
Figure 6. 9 Development of free shrinkage strains of NA40R2 at top (T), sides (S) and bottom (B) surfaces. 144
Figure 6. 10 Strain ratio (for mixes NA40, NA40R+I and NA40R2) between a- top and bottom surfaces, b- top and side surfaces. 145
Figure 6. 11 Development of free shrinkage strains of RAm40 at top (T), sides (S) and bottom (B) surfaces. 146
Figure 6. 12 Development of free shrinkage strains of RAm40R2 at top (T), sides (S) and bottom (B) surfaces. 146
Figure 6. 13 Strain ratio (for mixes NA40, RAm40 and RAm40R2) between top and bottom surfaces. 147
Figure 6. 14 Strain ratio (for mixes NA40, RAm40 and RAm40R2) between top and side surfaces. 147
Figure 6. 15 Shrinkage curvature developed on the free specimens, (a) mix NA40R2, (b) mix NA40R+I. 148
Figure 6. 16 Average shrinkage curvature of fibre reinforced concretes compared to plain concrete. 148
Figure 6. 17 Shrinkage curvature developed on the free specimens, (a) mix RAm40, (b) mix RAm40R2. 149
Figure 6. 18 Comparison of average shrinkage curvature for plain and fibre reinforced RAC and plain NAC. 149
Figure 6. 19 Mass loss versus time for plain and fibre reinforced NAC. 150
Figure 6. 20 Mass loss versus time for plain and fibre reinforced RAC and plain NAC. 151
Figure 6. 21 Mass loss-shrinkage strains curves for plain and fibre reinforced NAC. 151
Figure 6. 22 Effect of recycled fibre and type of coarse aggregate on mass loss-shrinkage strains curves. 152

xv
Figure 6. 23 Distribution of the macro and full depth cracks, a- NA40, b-RAm40, c- RAm40R2. (shaded grey and diagonal lines zones are critical tension and compression zone, respectively, when prisms tested in bending). 153
Figure 6. 24 Cracking time and strain for NAC and RAC. 153
Figure 6. 25 Shrinkage strains (average) of T, M and B specimens, a- mix NA40I2 (on top and sides), b- all mixes (only sides). 155
Figure 6. 26 Shrinkage strains developed on the a-Sides and b- Top, average of the un-cracked specimens. 157
Figure 6. 27 Estimated (theoretical) RF ,a- for the T, M and B specimens of mix NA40I2, b- average RF for all mixes 158
Figure 6. 28 Apparent (measured) RF of mix NA40R+I, a- T specimen, b-M specimen , c- B specimen. 159
Figure 6. 29 Development of estimated and apparent RF for mix NA40I2. 160
Figure 6. 30 Position of supports and loads in bending test for free shrinkage specimens (dimensions in mm). 162
Figure 6. 31 Position of supports and loads in bending test for restrained shrinkage specimens (dimensions in mm). 163
Figure 6. 32 a-Load-deflection, b- Eflex -bending-load curves for: WC , F and R specimens (Top, Middle and Bottom) for mix NA40R+I. 165
Figure 6. 33 Comparison between shrinkage curvature of free and restrained specimens of mixes, a-NA40, b- NA40R+I and c- NA40R2. 169

xvi
LIST OF TABLES
Table 2. 1 Chemical analysis of OPC. 18
Table 2. 2 Physical and mechanical properties of OPC, PFA, GGBS, SF and LP. 18
Table 2. 3 Standard tests for RA characterization 19
Table 2. 4 Identified categories of RA according to BS EN 12620+A1:2008 [5] for recycled aggregate. 22
Table 2. 5 Rrequirements of BS EN 12620:2002+A1:2008 for both RA* and RCA**. 22
Table 2. 6 Particle size distribution of fine aggregate. 23
Table 2. 7 Physical and mechanical properties of NA and RA. 24
Table 2. 8 Quantities of coarse RA used in production of RAC. 27
Table 2. 9 Properties concrete: workability, air content and density. 28
Table 2. 10 Compressive strength of NAC and RAC. 29
Table 2. 11 Properties of RAC made with treated RA-M (%RA=100). 38
Table 3. 1 Cracking time and width and length of cracks (Note: 1mm = 0.04in). 63
Table 4. 1 Chemical composition of OPC . 82
Table 4. 2 Mix proportions (kg/m3) 82
Table 5. 1 Cracking time and width of crack. 102
Table 5. 2 Compressive strength, normalized strength and standard deviation (SD) of all mixes. 120
Table 5. 3 Flexural strength and Efmax for all mixes. 125
Table 6. 1 Properties of coarse aggregate. 136
Table 6. 2 Variables of research and code of mixes. 137
Table 6. 3 Restraint factor and recovered strains for all mixes. 159
Table 6. 4 Compressive strength, normalized strength and standard deviation (SD) of SFR-NAC mixes. 161
Table 6. 5 Flexural strength (flLOP and flult) and Efmax for all mixes. 164
Table 6. 6 Theoretical air content and measured density for all mixes. 166

xvii
LIST OF SYMBOLS AND ABBREVIATIONS
ρ
Particle density of aggregate ρrd
Particle density of aggregate (oven dry)
ρa Particle density of aggregate (apparent)
ρssd Particle density of aggregate (saturated surface dry)
∆T-B Ratio between the strains developed at the top and at the bottom surfaces
∆T-S Ratio between the strains developed at the top and at the side surfaces
µε Microstrain
AASHTO American Association of State Highway and Transportation Officials
ACI American Concrete Institute
ASTM American Society for Testing and Materials
BS British Standard
CDW Construction and demolition waste
C-S-H Calcium Silicate Hydrate
E Modulus of elasticity
Ec Modulus of elasticity
Eflex Flexural elastic modulus of concrete at any load
Efmax Maximum value of flexural elastic modulus (Eflex) in the range of 30% to 60% of the ultimate bending load
ɛfree Free shrinkage strain (strain measured on the free specimen)
ɛR Restrained shrinkage strain = shrinkage strain measured on the free specimen - shrinkage strain measured on the restrained specimen.
F Free (shrinkage)
FA Fly ash
Fc or Frig Tensile force due to restrained shrinkage
fcu Mean compressive strength (cube)
FEA Finite Element Analysis
flLOP Flexural strength at the limit of proportionality

xviii
flult Ultimate flexural strength (at ultimate bending load)
FRC Fiber reinforced concrete
FRC-NAC Natural aggregate concrete reinforced with steel fibre
FRC-RAC Recycled aggregate concrete reinforced with steel fibre
GGBS Ground granulated blast slag
I Second moment of area
ISF Industrial steel Fibres
ITZ Interfacial transition zone
K Stiffness ratio between concrete and restraining rig
kA Average shrinkage curvature
kS-B Shrinkage curvature between sides bottom surfaces
kT-S Shrinkage curvature between top and sides
LA Los Angeles
LOP Limit of proportionality
LP Lime stone powder
LVDT Linear variable displacement tranducer
NA Natural aggregate
NAC Natural aggregate concrete
NCM New cement mortar
OCM Old cement mortar
OPC Ordinary portland cement
P Usually Porosity or Load
PMT Pre-mixing technique
R Restrained (shrinkage)
RA Recycled aggregate
RA-B Coarse recycled brick aggregate from construction and demolition waste
RAC Recycled aggregate concrete

xix
RA-C Coarse recycled concrete aggregate from construction and demolition waste
RA-C1 Coarse recycled concrete aggregate produced by crushing old laboratory concrete samples
RAm Recycled aggregate from CDW
RA-M Coarse recycled mixed aggregate from construction and demolition waste
RC Reinforced concrete
RCA Recycled concrete aggregate
RF Restraint Factor
RH Relative humidity
RILEM Reunion Internationale des Laboratoires et Experts des Materiaux, Systemes de Construction et Ouvrages (International Union of Laboratories and Experts
RTSF Recycled tyre steel fibres
RTSFRC Recycled tyre steel fibre reinforced concrete
SF Silica fume
SSD Saturated surface dry
TSMA Two- stage mixing approach
TSMAsc Two- stage mixing approach with silica fume
w/c Water to cement ratio
WA Water absorption
WMT Within-mixing technique
δ Vertical displacement at the centre of the spam
ν Poisson's ratio

Chapter 1 Introduction
1
Chapter 1 Introduction

Chapter 1 Introduction
2
1 Introduction
1.1 Motivation
Over the last century, urbanization has expanded enormously worldwide as a result of
population growth and industrialization. This has generated a demand for the construction of
more infrastructure including housing, buildings, roads, bridges and tunnels. Concrete is the
dominant structural material used by the construction industry to accommodate this demand.
The global consumption rate of natural aggregates (NA) is estimated at 8-12 billion tonnes
per year [1], equivalent to 4000 km2 of 1 meter deep quarries, about the combined area of
both Greater London and Paris, leaving enormous scars on the landscape.
The large consumption of natural resources and consequent generation of massive quantities
of construction and demolition waste (CDW) make the construction industry responsible for
some of the most serious sustainability and environmental issues the world is currently
facing. In the UK alone, construction waste amounts to roughly 110 million tonnes per year,
corresponding to 60% of total waste [2]. However, the construction industry is capable of
mitigating environmental problems through the utilization of waste materials in the
production of concrete.
The use of recycled aggregates (RA), generated from processed CDW, in new constructions
can potentially conserve the non-renewable natural resource of virgin aggregates, eliminate
unnecessary consumption of limited landfill areas and reduce energy consumption.
However, the variability in the characteristics of RA and recycled aggregate concrete (RAC)
is the main engineering concern that hinders the widespread use of RA. Low density and
high water absorption and porosity, mainly caused by the heterogeneous nature of RA, can
lead to poor quality concrete (low compressive, tensile and flexural strength). As a result,
current standards and specifications [3-6] impose limitations on the use of RA in new
concrete and particularly in structural concrete. In general, only 20-30% of NA can be
replaced by RA in new structural concrete [3]. Therefore, more research in this field is
necessary to understand the effect of the various key parameters and explore approaches to
improve the properties of RA and RAC. This will help drive the use of RA as a viable
alternative to NA.
Other critical issues with RAC are high shrinkage and creep. Due to higher water absorption
and porosity of RA, RAC exhibits significantly higher shrinkage and creep than natural
aggregate concrete (NAC) [7]. Shrinkage in particular can increase the cracking tendency of

Chapter 1 Introduction
3
RAC and create more obstacles to the use of RAC. Therefore, it is vital to examine the
phenomenon of RAC shrinkage, with particular emphasis on restrained shrinkage and
associated cracking. Understanding the factors that influence restrained shrinkage, effects of
restrained shrinkage on the behaviour of concrete, assessment methods and crack mitigation
techniques are also crucial.
1.2 Background of Research Problem
1.2.1 Recycled Aggregates : Concerns and the Need for Improvement
RA are a by-product of crushing debris obtained from demolished concrete and masonry
structures and asphalt concrete pavements. RA may contain only concrete or a mixture of
concrete and masonry rubble or even asphalt, and can be produced as fine or coarse
aggregates. Due to their heterogeneous nature, RA possess high variability in their properties
and lower quality than NA. RA derived from CDW often suffer from a porous and weak
surface, mainly due to old mortar or inferior materials such as low strength bricks. When RA
are used in concrete, the high variability and low quality in their properties reflects on the
properties of RAC. Therefore it is recommended to always characterise RA before use in
concrete applications [4].
Studies in this field reveal that RA have lower particle density (up to 30% of that of NA) [7,
8] and higher water absorption (up to 10 times or more for RA contains crushed brick) [9,
10]. This is mainly attributed to the nature of RA and the porous and cracked nature of
attached mortar of recycled concrete aggregate. This has an adverse effect on density and
mechanical properties of concrete. In comparison to NAC, RAC shows lower: density (up to
15%), compressive strength (up to 40%), tensile strength (up to 15%) [1, 7, 11], flexural
strength (up to 10%) [7, 8] and modulus of elasticity (up to 40% ) [12, 13]. RAC also
exhibits higher shrinkage (up to 100% after 28 days of drying) [7, 14, 15] and creep (up to
60%) [7, 15, 16] than NAC. These losses are due to the heterogeneous composition, high
porosity, high water absorption and low internal restraint of RA. Large shrinkage strains can
increase cracking tendency, in particular when concrete is restrained. On the other hand, the
higher creep of RAC [7, 17] and its lower elastic modulus can play a mitigating role in
reducing the effects of shrinkage induced tensile stresses. Very limited work can be found in
the literature on the shrinkage behaviour of RAC under restrained conditions.
RA could be improved before use in concrete to mitigate the repercussions of high
variability in its characteristics on the properties of RAC. One possible solution is to

Chapter 1 Introduction
4
strengthen weaknesses on the surface of RA using fine reactive [18, 19] and non-reactive
powders.
1.2.2 Shrinkage
1.2.2.1 General
Concrete shrinkage leads to a reduction in the volume of concrete. Concrete shrinks in
response to moisture loss, temperature reduction and chemical reactions (hydration).
Concrete may experience shrinkage at different times (early ages -hours after casting- and
long term -many years) and under a variety of conditions. Generally, there are several types
of concrete shrinkage: plastic, autogenous, drying, thermal and carbonation shrinkage. They
can contribute to cracking in structural concrete elements to differing degrees [20-22]. The
types of shrinkage and their consequences are described further in Appendix A.
1.2.2.2 Restrained Shrinkage
Shrinkage induced deformations only lead to stresses and cracking if they are restrained.
However, in real life, all concrete elements are restrained to some degree, since some
restraint always exists and can be provided by supporting elements or from the different
parts of the element itself. Degree of restraint or restraint factor (RF) is one of the factors
that determines the magnitude of developed tensile stresses and cracking [23, 24]. In
general, there are two types of restraints: external and internal as described further in
Appendix B. Experimental procedures and tests for restrained shrinkage are vital to quantify
the restrained shrinkage behaviour of RAC.
1.2.2.3 Assessment of Restrained Shrinkage
Shrinkage of concrete can be assessed in two conditions free and restrained. Free shrinkage
tests can provide information on factors affecting shrinkage such as concrete composition,
environmental conditions, and size and shape of the concrete element being assessed.
However, they cannot provide information on the cracking behaviour of concrete under
restrained conditions [25-28]. Restrained shrinkage tests are the only way to assess: a) the
cracking tendency and ability of materials to withstand tensile stresses, and b) the effects of
shrinkage induced cracks on structural and durability performance of concrete [24, 29, 30].

Chapter 1 Introduction
5
The shrinkage tests available in the literature are presented briefly below and more
extensively in Appendix B.
Although attempts in assessing (testing) shrinkage of concrete under restrained conditions
started in the early decades of last century [29], it is only in the last decade when the
American Society for Testing and Materials (ASTM in 2004) and the American Association
of State Highway and Transportation Officials (AASHTO in 2008) adopted a test (the ring
test) as a standard test for restrained drying shrinkage of concrete.
The ring test was developed during WWII by Carlson [31] (cited in [24]). The fact that it
took more than 70 years for this test to be adopted highlights the difficulties associated with
quantifying restrained shrinkage. For a given drying environment, the ring test can provide
information on the cracking time and the width of crack and its rate of increase with time.
Hence, the ring test is considered as a qualitative method of comparing the cracking
tendency of different concrete mixes [24, 28, 32]. However, the test cannot quantify the
effect of shrinkage induced cracks on the residual strength of cracked concrete.
Several other test methods for restrained shrinkage have been developed. These can be
classified into plate or linear [33] by the shape of the specimen. These tests can provide
information on different properties of concrete such as: shrinkage restrained strains and
stresses, cracking (age and width), creep strains and rate of tensile stress development.
However, from a practical point of view, when many parameters are needed to be examined,
the setting up of such tests and their instrumentation can be complicated and expensive.
Automatic crack width measurements are also difficult since cracking positions are not
known a-priori. The small dimensions of the specimens used in some of these tests, mainly
to reduce costs and accelerate drying, is also another issue since they limit the use of normal
size coarse aggregates.
None of these tests allows dismounting of concrete specimen after exposure to restrained
shrinkage without destroying the specimen. As a result, restrained shrinkage tests are
avoided in common quality control testing and large-scale parametric investigations [24, 34-
36].
Therefore, it is crucial to develop a test procedure and a simple and economical rig for
restrained shrinkage assessment that enables dismounting of the specimen. This would
facilitate bending and compression tests to quantify the effect of shrinkage induced cracks
on residual mechanical properties.

Chapter 1 Introduction
6
1.2.2.4 Shrinkage Crack Control
Reinforcing bars are commonly used to control concrete cracking in concrete structures and
pavements. Fiber reinforced concrete (FRC) is also used to increase toughness, fatigue and
flexural strength of concrete, and to reduce the cost and increase the speed of the process of
construction. Different materials are used as fibres in structural and non-structural
applications. Non-metalic fibres are in general used for non-structural applications.
Randomly distributed steel fibres, due to their high modulus of elasticity, can control crack
propagation and hence enhance the post cracking behaviour of structural concrete. It has
been reported [26, 37-39] that the addition of steel fibres can also decrease free shrinkage in
concrete. This was attributed [40] to a physical restraining effect (similar to aggregate
restraining effect) which develops due to the interfacial bond strength between the fibres and
the matrix. Some studies [34, 39, 41, 42] have reported that the addition of low contents of
steel fibres (less than 1% by volume) does not alter the shrinkage behaviour of concrete.
Others [43, 44] have reported that fibres may be responsible for an increase in the porosity
of concrete resulting in higher free shrinkage strains. Therefore, it appears that there is no
general agreement on the effect of fibres on the free shrinkage behaviour of concrete.
Undoubtedly, the most significant effect of fibres in concrete is their ability to control crack
width and propagation after matrix failure. Fibres can play three significant roles: 1)
encourage the development of fine smeared cracks rather than a big single crack, 2) transfer
tensile stresses across cracks, 3) enable healing/(sealing) of cracks in the long-term [45, 46].
The random distribution of fibres in concrete means that to achieve the same flexural
performance as conventional reinforced concrete, larger volumes (than rebar) are required.
This, sometimes makes the use of fibres, particularly industrial steel fibres (ISF),
uneconomical. Therefore, recycled tyre steel fibres (RTSF) extracted from post-consumer
tyres have been put forward as a cheaper alternative to ISF. The first investigations on the
mechanical properties of recycled tyre steel fibre reinforced concrete (RTSFRC) mixes to
examine their structural performance were started at the University of Sheffield in early
2000 [47-49]. Utilizing RTSF in concrete has considerable environmental benefits since
only a small fraction of the energy needed to make steel wire is used in their production.
Only two experimental studies on the free shrinkage behaviour of these fibres were found in
the literature. Both studies were conducted under the EU project ''Ecolanes'' [50]. The
shrinkage behaviour of RTSF concrete under restrained conditions has not been explored.

Chapter 1 Introduction
7
The use of RTSF coupled with the use of RA in concrete could lead to a more sustainable
construction solution. The addition of RTSF can enhance both the mechanical properties and
shrinkage behaviour of RAC. Before utilizing any new type of fibre in real life applications,
it is of utmost importance to investigate its behaviour, especially under the effects of
restrained shrinkage. Apart from the work undertaken by Wang et al. (2000) which was done
using short fibres and NA, there are no studies on the restrained shrinkage behaviour of
concrete with recycled fibres. Thus, there is a vital need to assess the ability of RTSF to
control shrinkage cracks.
1.3 Aims and Objectives
This work is part of a wider set of projects at the University of Sheffield which aim to
facilitate the use of recycled materials such as RA and RTSF in the production of structural
concrete to reduce the sustainability and environmental issues associated with concrete. The
study aims in particular to contribute towards understanding the shrinkage behaviour of
NAC and RAC under restrained conditions. The objectives of this research are to:
On
RA
- Understand the effect of the various key parameters on the properties of
different types of RA through conducting an experimental study to
characterise the properties of RA.
- Characterise the rheological and mechanical properties of RAC through an
experimental study.
- Identify and quantify the parameters of RA that most affect the behaviour
of RAC.
- If possible, develop a strength predictive model for RAC.
- Explore approaches to improve the behaviour of RA and the properties of
RAC.

Chapter 1 Introduction
8
On
Res
trai
ned
Shri
nkag
e
- Develop a rig for restrained shrinkage testing and a procedure to
quantitatively assess the impact of shrinkage induced cracks due to
external restraints on the mechanical properties (compressive strength,
flexural strength and flexural modulus of elasticity) of concrete.
- Conduct a parametric study to quantify the post-restrained shrinkage
mechanical properties of mixes with different w/c ratios and assess the
effectiveness of the developed restraining frame.
- Examine the shrinkage effects on RAC under restrained conditions.
- Assess the use of RTSF as a mitigation method to reduce the negative
effects of restrained shrinkage induced cracking on the behaviour of NAC
and RAC.
1.4 Thesis Presentation
This thesis is presented in a non-conventional manner and two types of chapters: chapters
written following normal thesis format (chapters 1, introduction and 7, conclusions), and
chapters consisting of ''stand-alone'' journal papers (2 to 6). Literature on the common types
of concrete shrinkage and their main driving mechanisms can be found in Appendix A.
Information on the effect of the shrinkage induced cracks on the behaviour of concrete is
explained in Appendix B. Appendix B also includes literature and a discussion on the types
of the restraint and the available tests and experimental procedures for restrained shrinkage.
A brief description of each chapter is given below:
Chapter Two is based on Younis K. and K. Pilakoutas [51] and examines the effect of
various parameters on the performance of RAC and proposes a strength prediction model.
Three types of coarse aggregate: NA, RA originating from processing CDW and RA
produced by crushing old laboratory concrete samples were used. An extensive experimental
study was conducted and presented to characterise the properties of both NA and RA.

Chapter 1 Introduction
9
Utilizing multi-linear and non-linear regression analysis, relationships that link the
properties of RA to the strength of RAC are developed. To enhance the compressive strength
of RAC, the effect of surface treatment of RA using small quantities of reactive and non-
reactive microfillers is also investigated. The effectiveness of two mixing methods and the
addition of RTSF on the compressive strength of RAC are also examined. Based on the
obtained results it is shown that, the utilization of RTSF as well as reactive and non-reactive
microfillers can improve the strength of RAC.
Chapter Three is based on Younis K. and K. Pilakoutas [52] (submitted paper) and
proposes a test rig for restrained shrinkage and associated procedures to assess the post-
shrinkage mechanical properties (compressive and flexural strength) of concrete. Free and
restrained shrinkage tests are conducted and the change of apparent restraint factor (RF) with
time is determined. A simple finite element analysis is performed to quantify the theoretical
RF and the results are compared to the apparent RF. According to the results, the RF of the
proposed rig is dependent on the time and the stiffness of the concrete. Results of residual
mechanical properties show that restrained shrinkage induced cracks can affect the
mechanical behaviour (flexural and compressive strength and stiffness) of concrete.
Chapter Four is based on Younis K. and K. Pilakoutas [53] (submitted paper) and aims at
assessing the post-restrained shrinkage behaviour of concrete. This chapter deals with a new
restraining frame for restrained shrinkage test of concrete. A parametric experimental study
is performed to examine the effectiveness of the proposed restraining frame. In this chapter,
the development of the restraining frame is presented. Also, results of free shrinkage, mass
loss and mass loss vs shrinkage of three concrete mixes with different water/cement (w/c)
ratios are presented and discussed. The results show that, for unrestrained specimens, there
is a significant difference in shrinkage strains with depth, resulting in significant curvature
deformations.
Chapter Five is based on Younis K. and K. Pilakoutas [54] (submitted paper) and attempts
to quantify the post-restrained behaviour of concrete. In chapter 4, a new restrained
shrinkage test is presented and experimental parametric study was undertaken using three
mixes with w/c ratios of 0.3, 0.4 and 0.5. Also, in chapter 4, free shrinkage test results are
discussed. This chapter presents experimental results and discusses the behaviour of the
concrete mixes under restrained conditions, including variations in shrinkage strains, the
evolution of RF, failure of restrained concrete and the post-restrained mechanical behaviour.
The obtained results show that stress history, which depends on the rate of development of
stiffness and shrinkage, plays a key role in governing the failure of restrained concrete.

Chapter 1 Introduction
10
Shrinkage induced cracks reduced significantly the compressive strength, flexural strength
and flexural elastic modulus of concrete. Creep is identified as the possible mechanism for
the loss of the stiffness.
Chapter Six is based on Younis K., K. Pilakoutas and K. Neocleous (to be submitted) and
examines the restrained shrinkage behaviour of concrete mixes incorporating recycled
materials such as recycled tyre steel fibre RTSF -extracted from post consumer tyres- and
recycled aggregates RA -from construction and demolition waste-. For comparison
purposes, the experimental work in this chapter also includes mixes with industrial steel
fibres ISF and natural aggregates NA. The restraining frame and procedure to quantify the
post-restrained shrinkage behaviour of concrete, developed in chapter 4 are employed. Four
NAC mixes (one plain and three with fibres) and two RAC mixes (one plain and one with
RTSF) are investigated. Experiments performed include: free and restrained shrinkage, loss
of mass, compressive strength, flexural strength and flexural elastic modulus.
Chapter Seven includes a summary of the research work and general conclusions as well as
recommendations for future work.
Finally, The current status ( 26/03/2014) of the chapters (papers) mentioned previously are
as follows:
Chapter two: published in Construction and Building Materials.
Chapter three: submitted to ACI Materials Journal.
Chapter four: submitted to Cement and Concrete Composites.
Chapter five: submitted to Cement and Concrete Composites.
Chapter six: to be submitted to Cement and Concrete Composites.

Chapter 1 Introduction
11
References
1. Li, Y.J., et al., Study on the workability and mechanical properties of recycled aggregate concrete containing ultra-fine fly ash. Environmental Ecology and Technology of Concrete, 2006. 302-303: p. 314-320.
2. WRAP, Perfomance Related Approach to Use Recycled Aggregates. 2007, Waste and Resources Action Programme: Oxon.
3. BS 8500-2, Concrete complementary British Standard to BS EN 206 part 1 -Part 2: Specification for constituent materials and concrete, in. 2006, British Standard Institiution: London.
4. BS EN 12620 :2002 +A1, Aggregates for concrete. 2008, British Standards Institution, London.
5. DIN- 4226. Aggregate for Mortar and Concrete , Part 100: Recycled Aggregates 2002, DIN: Berlin.
6. WBTC No. 12/2002, Specifications Facilitating the Use of Recycled Aggregates. 2002, Works Bureau Technical Circular: Hong Kong.
7. Hansen, T.C., Recycled of Demolished Concrete and Masonry 1992, London: E & FN SPON.
8. Tam, W.W.V.C.M., Recycled Aggregate from Concrete Waste for Higher Grades of Concrete Construction , PhD thesis, in Department of Building and Construction. 2005, City University of Hung Kong: Hung Kong.
9. Zega, C., Y. Villagrán-Zaccardi, and A. Di Maio, Effect of natural coarse aggregate type on the physical and mechanical properties of recycled coarse aggregates. Materials and Structures, 2010. 43(1): p. 195-202.
10. Katz, A., Properties of concrete made with recycled aggregate from partially hydrated old concrete. Cement and Concrete Research, 2003. 33(5): p. 703-711.
11. Soutsos, M.N., K. Tang, and S.G. Millard, Concrete building blocks made with recycled demolition aggregate. Construction and Building Materials, 2011. 25(2): p. 726-735.
12. Kou, S.C., C. Poon, and D. Chan., Properties of Steam Cured Recycled Aggreagte Fly Ash Concrete, in Conference on the Use of Recycled Materials In Building and Structures, 2004: Bareclona , Spain.
13. Kou, S., C. Poon, and D. Chan, Influence of fly ash as a cement addition on the hardened properties of recycled aggregate concrete. Materials and Structures, 2008. 41(7): p. 1191-1201.
14. Hansen, T.C. and E. Boegh, Elasticity and Drying Shrinkage of Recycled-Aggregate Concrete. Journal of the American Concrete Institute, 1985. 82(5): p. 648-652.
15. Fan, Y., J. Xiao, and V.W.Y. Tam, Effect of old adhered mortar on creep of recycled aggregate concrete. Structural Concrete, 2013: p. n/a-n/a.
16. Ravindrarajah, R.S. and C.T. Tam, Methods of Improving the Quality of Recycled Aggregate Concrete. Demolition and Reuse of Concrete and Masonry, Vols 1-2, 1988: p. 575-584.

Chapter 1 Introduction
12
17. Ajdukiewicz, A. and A. Kliszczewicz, Influence of recycled aggregates on mechanical properties of HS/HPC. Cement & Concrete Composites, 2002. 24(2): p. 269-279.
18. Tam, V.W.Y. and C.M. Tam, Diversifying two-stage mixing approach (TSMA) for recycled aggregate concrete: TSMA(s) and TSMA(sc). Construction and Building Materials, 2008. 22(10): p. 2068-2077.
19. Katz, A., Treatments for the improvement of recycled aggregate. Journal of Materials in Civil Engineering, 2004. 16(6): p. 597-603.
20. Concrete Society TR 22 Non – Structural Cracks in Concrete. 2010, Concrete Society. : Surrey, UK.
21. Gribniak, V., G. Kaklauskas, and D. Bacinskas, Shrinkage in Reinforced Concrete Structures: A Computational Aspect. Journal of Civil Engineering and Management, 2008. 14(1): p. 49-60.
22. Qiao, P., McLean, D. and Zhuang, J.,, Mitigation Strategies for Early-Age Shrinkage Cracking in Bridge decks. 2010, Department of Civil and Environmental Engineering , Washington State University: Pullman, Washington. .
23. Bisschop Jan, Drying Shrinkage Microcracking in Cement-based Materials, in Civil engineering and Geoscience. 2002, Delft University of Technoloy: Delft, Netherlands.
24. ACI 231R-10, Report on Early-Age Cracking: Causes, Measurement, and Mitigation, in ACI Committee 231. 2010, American Concrete Institute: Farmington Hills, U.S.A.
25. Weiss, W.J., W. Yang, and S.P. Shah, Shrinkage cracking of restrained concrete slabs. Journal of Engineering Mechanics-Asce, 1998. 124(7): p. 765-774.
26. Swamy, R.N. and H. Stavrides, Influence of Fiber Reinforcement on Restrained Shrinkage and Cracking. Journal of the American Concrete Institute, 1979. 76(3): p. 443-460.
27. Grzybowski, M. and S.P. Shah, Shrinkage Cracking of Fibre Reinforced Concrete. ACI Materials Journal, 1990. 87(2).
28. Carlsward J. , Shrinkage Cracking of Steel Fibre Reinforced self compacting Concrete Overlays, in Department of civil and Environmental Engineering. 2006, Lulea University of Technology: Lulea,Sweden.
29. Carlson, R.W., Attempts to Measure the Cracking Tendency of Concrete ACI, 1940. 36: p. 533-537.
30. Altoubat, S.A., Early age stresses and creep-shrinkage interaction of restrained concrete. 2000.
31. Carlson, R.W., Cracking of Concrete. The Boston Society of Civil Engineers, 1942. 29(2): p. 98-109.
32. Banthia, N., C. Yan, and S. Mindess, Restrained shrinkage cracking in fiber reinforced concrete: A novel test technique. Cement and Concrete Research, 1996. 26(1): p. 9-14.
33. Bentur, A. and K. Kovler, Evaluation of early age cracking characteristics in cementitious systems. Materials and Structures, 2003. 36(3): p. 183-190.
34. Altoubat, S.A. and D.A. Lange, Creep, shrinkage, and cracking of restrained concrete at early age. Aci Materials Journal, 2001. 98(4): p. 323-331.

Chapter 1 Introduction
13
35. Tongaroonsri, S. and S. Tangtermsirikul, Influence of mixture condition and moisture on tensile strain capacity of concrete. ScienceAsia, 2008. 34(1): p. 59-68.
36. Hossain, A.B., and Weiss, W. J., , Assessing Residual Stress Development and Stress Relaxation in Restrained Concrete Ring Specimens. Cement and Concrete Composites, 2004. 26: p. 531-540.
37. Chern, J.-C. and C.-H. Young, Compressive creep and shrinkage of steel fibre reinforced concrete. International Journal of Cement Composites and Lightweight Concrete, 1989. 11(4): p. 205-214.
38. Tan, K. and P. Paramasivam, Creep and Shrinkage Deflections of RC Beams with Steel Fibers. Journal of Materials in Civil Engineering, 1994. 6(4): p. 474-494.
39. Zhang, J. and V.C. Li, Influence of Fibres on Drying Shrinkage of Fibre-Reinforced Cementitious Composite. Journal of Engineering Mechanics, ASCE, 2001. 127(1): p. 37-44.
40. Mangat, P.S. and M.M. Azari, A Theory for the Free Shrinkage of Steel Fibre Reinforced Cement Matrices. Journal of Material Science 1984. 19 (7): p. 2183-2194.
41. Li, Z., M.A. Perez Lara, and J.E. Bolander, Restraining effects of fibers during non-uniform drying of cement composites. Cement and Concrete Research, 2006. 36(9): p. 1643-1652.
42. Grzybowski, M. and S.P. Shah, Model to Predict Cracking in Fiber Reinforced-Concrete Due to Restrained Shrinkage. Magazine of Concrete Research, 1989. 41(148): p. 125-135.
43. Wang, K., S.P. Shah, and P. Phuaksuk, Plastic Shrinkage Cracking in Concrete Materials- Influence of Fly Ash and Fibres. ACI Materilas Journal, 2001. 98(6): p. 458-464.
44. Aly, T., J.G. Sanjayan, and F. Collins, Effect of polypropylene fibers on shrinkage and cracking of concretes. Materials and Structures 2008. 41: p. 1741–1753.
45. Hoff, G.C., Durability of fiber reinforced concrete in a severe marine environment. ACI Special Publication, 1987. 100.
46. ACI 544.1R-96, State-of-the-Art Report on Fiber Reinforced Concrete 1996, ACI: Detroit. p. 1-66.
47. Pilakoutas, K., K. Neocleous, and H. Tlemat, Reuse of steel fibres as concrete reinforcement. Engineering Sustainability,, 2004. 157(ES3): p. 131-138.
48. Tlemat H., Steel fibres from waste tyres to concrete: testing, modelling and design, in Department of Civil and Structural Engineering. 2004, The University of Sheffield: Sheffield UK.
49. Pilakoutas, K. and R. Strube. Re-use of Tyres Fibres in Concrete. in Proceedings of the International Symposium on Recycling and Reuse of Used Tyres. 2001: Thomas Telford, University of Dundee, Dundee, UK.
50. Neocleous, K., et al. (2011) Fibre-reinforced roller-compacted concrete transport pavements. Proceedings of the ICE - Transport 164, 97-109.
51. Younis, K.H. and K. Pilakoutas, Strength prediction model and methods for improving recycled aggregate concrete. Construction and Building Materials, 2013. 49(0): p. 688-701.

Chapter 1 Introduction
14
52. Younis, K.H. and K. Pilakoutas, Assessment of Post-Restrained Shrinkage Mechanical Properties of Concrete ACI Materials, 2014. Submitted for publication.
53. Younis, K.H. and K. Pilakoutas, New Restrained Shrinkage Test to Assess Post-Shrinkage Behaviour of Concrete - Part I: Development of Test and Free Shrinkage Results. Cement and Concrete Composites, 2014. Submitted for publication
54. Younis, K.H. and K. Pilakoutas, New Restrained Shrinkage Test to Assess Post-Shrinkage Behaviour of Concrete - Part II: Restrained and Post-Restrained Test Results. Cement and Concrete Composites, 2014. Submitted for publication.

Chapter 2 Strength Prediction Model and Methods for Improving RAC
15
Chapter 2 Strength Prediction Model and Methods for Improving Recycled Aggregate Concrete
Younis, K.H. and K. Pilakoutas, Strength prediction model and methods for improving recycled aggregate concrete. Construction and Building Materials, 2013. 49(0): p. 688-701.
This chapter examines the effect of various parameters on the performance of recycled
aggregate concrete (RAC) and proposes a strength prediction model. Relations that link the
properties of recycled aggregate (RA) to the strength of RAC are developed using multi-
linear and non-linear regressing analysis. To enhance the compressive strength of RAC, the
effect of surface treatment of RA using small quantities of reactive and non-reactive
microfillers is examined. For the same purpose, two mixing methods and the addition of
recycled tyres steel fibres (RTSF) are also investigated. The results show that RTSF as well
as reactive and non-reactive microfillers can enhance the strength of RAC by 30%.
Furthermore, density separation can be used to produce high quality RA from construction
and demolition waste (CDW).
This chapter consists of a “stand alone” journal paper and includes relevant bibliography
at the end of the chapter. Additional information and further test results are presented in
Appendix C.

Chapter 2 Strength Prediction Model and Methods for Improving RAC
16
2.1 Introduction
Large quantities of construction and demolition waste (CDW) materials arise annually
worldwide. In the UK alone, this waste amounts to roughly 110 million tonnes per year
which corresponds to 60% of total waste[1]. Only 40% of this amount is reused or recycled.
At the same time, large quantities of natural aggregates are extracted for construction every
year. The utilization of recycled aggregates (RA) in concrete production can potentially
conserve the non-renewable natural resource of virgin aggregates, eliminate unnecessary
consumption of limited landfill areas and reduce energy consumption. However, the
variability in the characteristics of RA and recycled aggregate concrete (RAC) are the main
engineering concern which hinders the use of RA. Low density and high water absorption
and porosity, mainly caused by the heterogeneous nature of RA, can lead to low quality
concrete (low compressive, tensile and flexural strength as well as high creep and
shrinkage). For example, the use of recycled concrete aggregate (RCA) can lead to reduction
of up to 40% in compressive strength [1-3]. As a result, current standards and specifications
[4-7] impose limitations on the use of RA in new concrete and particularly in structural
concrete. With limitations, such as only 20-30% of NA can be replaced by RA in new
structural concrete being common. Therefore, more research in this field is necessary to
understand the effect of the various key parameters and explore approaches to improve the
properties of RA and RAC.
Different approaches have been adopted by researchers to improve the characteristics of RA
and RAC. Some of these approaches deal with how to improve the RA itself while others
focus on concrete production technology. Examples include, detaching the attached cement
mortar from the aggregate through mechanical means (ball milling) [8], through immersing
the RA in chemical solvents (acids) [9], through heating and rubbing [10, 11] , heating using
microwaves [12], and through ultrasonic cleaning methods [13]. Although some of these
approaches helped improve some of the properties of RA, they have shortcomings such as
high costs, environmental pollution, energy consumption or compromising durability.
A possible better solution is surface treatment of RA with silica fume (SF) in liquid form.
Katz [13] showed that this improved both the compressive strength (15% increase at 28 day)
and the microstructure of the interfacial transition zone (ITZ). However, since the treatment
was applied before mixing, it may not prove cost-effective in practice, due to the additional
costs of this operation.

Chapter 2 Strength Prediction Model and Methods for Improving RAC
17
Cement treatment during mixing was also examined by others; for example, Tam et al [14-
17] developed a ''two-stage mixing approach'' (TSMA) aiming at coating the RCA with a
layer of cement paste during the mixing procedure and reported strength and durability
improvements. However, since cement particles are not small enough to penetrate and fill all
microcracks, Tam and Tam [18] and Li et al [19] tried to use the same technique, but with
utilizing reactive micro-fillers (pozzolans) such as SF , fly ash (FA) and ground granulated
blast furnace slag (GGBS). Kong et al [20] used a triple mixing method to coat RCA
(derived from crushing laboratory concrete samples with strength of 40 MPa) with first a
layer of either FA or GGBS and then with a layer of cement paste. An improvement of 29%
in compressive strength (at 28 day with 100% RCA) was obtained when RCA was coated
with GGBS. This was attributed to the enhancement of the microstructure of the ITZ. The
amount of cement replacement used (20% cement mass) was enough to provide a coating
layer around the RA with a thickness ranging between 500- 800 µm [19], which covered, not
only the ITZ but also, the cement paste around the ITZ. However, improving the cement
paste is known to improve the concrete properties irrespective of the aggregate used and if
possible should be eliminated in comparative studies. For this reason, the current study
attempts to exclude the effect of enhancing the cement paste by using small enough
quantities of coating materials that only provide a thin coating layer to cover the ITZ. Since
only few studies explored the effect of reactive micro-fillers on the properties of RAC and
nothing was found in the literature on the use of nonreactive micro-fillers, the influence of
reactive micro-fillers (SF, FA and GGBS) and non-reactive micro-fillers such as lime stone
powder (LP) are studied in this paper. Two techniques are used to coat the RA, pre-mixing
technique (PMT) and within mixing technique (WMT).The PMT is similar to the procedure
used by Katz [13]and the WMT is proposed as an improvement to the TSMA and TSMAsc
developed by Tam and Tam [18] as explained in section 2.7.1.The effect of fine recycled
tyres steel fibres (RTSF) is also examined as they were shown in previous studies [21] to
control microcracks propagation.
2.2 Materials
2.2.1 Cementitious Materials
Portland Cement CEM I 52.5 N, meeting the requirements of BS EN 197 [22] was used in
this research. The full chemical analysis of the cement is shown in Table 2.1. Table 2.2
presents the physical and mechanical properties of the cement, reactive micro-fillers (FA,
GGBS, SF) and non-reactive micro-fillers (LP) used in this study.

Chapter 2 Strength Prediction Model and Methods for Improving RAC
18
Table 2. 1 Chemical analysis of OPC.
SiO2 Al2O3 Fe2O3 CaO MgO SO3 Na2O K2O Na2Oeq
20.99 4.98 2.9 65.88 0.79 2.8 0.24 0.44 0.52
Table 2. 2 Physical and mechanical properties of OPC, PFA, GGBS, SF and LP.
Property OPC FA GGBS SF LP
Initial setting time (min) 110 - - - -
Fineness (m2/kg) 445 370 481 22300 640
Loss on ignition (%) 2.07 4.7 - 2.5 43.6
Compressive strength (MPa) 68.1 - - - -
Density (Mg/m3) 3.15 2.15 2.9 2.2 2.65
Activity Index (28 day) % - 86 96 107 -
2.2.2 Aggregates
The fine aggregate used throughout this study was natural sand with a maximum size of
5mm, whereas two types of coarse aggregates were used, natural and recycled. The natural
gravel was river aggregate with a maximum size of 20 mm. Two types of coarse RA were
used; a) construction and demolition waste CDW and b) recycled concrete aggregate RCA
produced by crushing old laboratory concrete specimens. The RCA from lab specimens can
be considered as high quality RCA, since it is not contaminated and has no impurities and
foreign matter.
The RA used originated from CDW and contained crushed concrete, masonry (brick) and
asphalt. It was crushed by a jaw crusher (primary crusher) and a cone crusher (secondary
crusher).The supplier could not provide information regarding the composition and
properties of the RA. This is also true in general practice, as it is hard to track the properties
or composition of rubble delivered to recycling plants from various demolition sites. Figure
2.1a shows the RA used in this study, as received from the supplier.

Chapter 2 Strength Prediction Model and Methods for Improving RAC
19
Figure 2. 1a Recycled Aggregates from CDW.
Methodologies described and published in the current (BS and EN) standards were
employed to conduct the characterization of all aggregates used (see Table 2.3). The purpose
of the characterization was firstly to assess their suitability for use in concrete, in particular
of that of RA, and secondly to determine the required mix design parameters.
Table 2. 3 Standard tests for RA characterization
Test Standard
Classification of coarse RA BS EN 933-11:2009 [23]
Physical
Gradation (particle size distribution) BS EN 933-1:1997 + A1:2005 [24]
Particle densities and water absorption BS EN 1097-6:2000 +A1 :2005 [25]
Porosity BS EN 1936:2006 [26]
Surface texture and shape BS EN 812-102:1989 [27]
Shape Index (SI) BS EN 933-4:2008 [28]
Bulk density and voids ratio BS EN 1097-3:1998 [29]
Mechanical
Resistance to fragmentation :Los Angeles (LA)
BS EN 1097-2 +A1:2006 [30]
Since one of the objectives of this study was to examine the effect of density of RA on
concrete strength, the first step taken was to separate the mixed CDW into different types.

Chapter 2 Strength Prediction Model and Methods for Improving RAC
20
This process started with the separation of RA by size (three fraction of sizes 14-20 , 10-14
and 5-10 mm) and then by type using visual inspection and hand sorting. Based on the
colours of the RA three distinct types of RA were identified:
- RA- Concrete ( white or grey)
- RA- Brick (red)
- RA- Asphalt (black)
Since the quantity of the third type (black) was very low, it was excluded from the study.
Therefore, the characterisation of the RA was conducted on the following types:
- NA (coarse and fine).
- RA-C (Coarse RA-Concrete from CDW).
- RA-B (Coarse RA-brick from CDW).
- RA-M (Coarse RA-Mixed from CDW).
- RA-C1 (Coarse RA-produced by crushing old laboratory concrete samples).
2.2.3 Recycled Tyres Steel Fibre (RTSF)
The RTSF used in this research is derived from the mechanical processing (e.g. shredding
and granulation) of post-consumer tyres [31]. The RTSF used had an average diameter of
(0.1-0.2) mm and tensile strength of around 2000 MPa [32]. The RTSF comes in variable
lengths ranging from 3-30 mm (5% of the fibres had length shorter than 3 mm and 5%
longer than 30 mm). The length distribution determined is shown in Figure 2.1b.
Figure 2. 1b Length distribution of RTSF.
0%
10%
20%
30%
40%
50%
60%
70%
80%
90%
100%
110%
120%
0
20
40
60
80
100
120
140
160
180
200
0 5 10 15 20 25 30 35 40 45 50 55 60
Freq
uenc
y
Length (mm)
Frequency
Cumulative

Chapter 2 Strength Prediction Model and Methods for Improving RAC
21
2.2.4 Superplasticizer and Air Entraining Admixture
An aqueous solution containing polycarboxylate ether (PCE) polymers was used as
superplasticizer. The air entraining admixture AEA used was Microair 103; both
superplasticizer and AEA comply with EN 934-2 .
2.3 Aggregate Characterization
2.3.1 Composition
Figure 2.2 illustrates the composition of all types of (5-20) mm coarse RA, while the
quantities of the constituent materials of RA is shown in Table C-1 in Appendix C. To
identify the category for each type of RA based on its composition (see Table 2.4), the
results were compared with categories described in (BS EN 12620+A1:2008) [5]. Although
around 80% of RA-M consists of concrete and unbound aggregate, it is classified as RA [4]
[5] (Table 2.5) similar to RA-B. Both RA-C and RA-C1 are classified as RCA.
Figure 2. 2 Composition of RA for sizes between (5-20 mm).
Rc, 68.4Ru, 13.3
Rb, 11.2
Ra, 5.1X+Rg , 1.9
Fine materials,
0.1
Rc, 77.2
Ru, 20.2
Rb, 0.6Ra, 0.7 X+Rg , 1.1 Fine
materials, 0.2
Rc, 80
Ru, 19
Rb, 0
Ra, 0 X+Rg , 0Fine
materials, 1
Rc, 0.4
Ru, 0.0
Rb, 93.8
Ra, 2.1
X+Rg , 2.5
Fine materials,
1.2
RA-C RA-M
RA-B RA-C1

Chapter 2 Strength Prediction Model and Methods for Improving RAC
22
Table 2. 4 Identified categories of RA according to BS EN 12620+A1:2008 [5] for recycled aggregate.
Table 2. 5 Rrequirements of BS EN 12620:2002+A1:2008 for both RA* and RCA**.
2.3.2 Size Distribution
The results of the size distribution of both NA and RA (5-20 mm) are illustrated in Figure
2.3. For each type of RA, a mix of aggregate of size 5-20 mm from the three fractions of size
was obtained in a way that ensured their size distribution lies within the upper and lower
limit curves of the current standard [5]. The same standard was used to assess the gradation
of fine NA. The results are shown in Table 2.6.
Type of RA
Category
Constituents (BS EN 12620:2008)
Rc Rc+Ru Rb Ra X+Rg FL
RA-C Rc70 Rcu95 Rb10- Ra1- XRg 1- FL0.2-
RA-M Rc50 Rcu70 Rb30- Ra10- XRg 2- FL2-
RA-B Rc1 Rcu1 Rb95- Ra5- XRg 2- FL2-
RA-C1 Rc80 Rcu95 - - - -
Rc Rc+Ru Rb Ra X+Rg FL
RA* not defined Rcu50 Rb50- Ra10- XRg 1- FL2-
RCA** Rc80 not defined Rb10- Ra5- XRg 1- FL2- * RA is described in BS 8500-2 as recycled aggregates with high content of masonry.
** RCA is described in BS 8500-2 as recycled aggregates with high content of concrete.

Chapter 2 Strength Prediction Model and Methods for Improving RAC
23
Figure 2. 3 Size distribution curves of coarse NA and RA.
Table 2. 6 Particle size distribution of fine aggregate.
Sieve size mm 8 6.3 4 1.18 0.6 0.3
% Passing 100 100 96.9 84.1 71.1 35.6
The results of the physical and mechanical properties of aggregate are shown in Table 2.7.
As a result of the crushing process, the RA had an angular and irregular shape with rough
surface while the NA had a rounded and irregular shape with smooth surface.
0
10
20
30
40
50
60
70
80
90
100
2 10 50
Pass
ing
%
Seive Size (mm)
Upper and lower limits
RA-C
NA
RA-B
RA-M
RA-C1

Chapter 2 Strength Prediction Model and Methods for Improving RAC
24
Table 2. 7 Physical and mechanical properties of NA and RA.
Physical and Mechanical Properties
Type of Aggregate
Size fraction mm NA RA-C RA-M RA-B RA-C1 Sand
Shape( Visual ) All Rounded-irregular
Angular-irregular
Angular-irregular
Angular-irregular
Angular-irregular Rounded
Surface Texture All Smooth Rough Rough Rough Rough Smooth
Shape Index %
14-20 11 7 11 15 6
10-14 9 12 10 9 10
5-10 9 7 10 9 7
5-20 11 8 11 12 7
Particle density Mg/m3
(ρ)
ρrd
(oven dried)
14-20 - 2.36 2.3 1.87 2.41
2.65 10-14 - 2.35 2.4 1.89 2.40
5-10 - 2.33 2.22 1.84 2.37
5-20 2.61 2.35 2.25 1.87 2.40
ρssd
(saturated
surface dry)
14-20 - 2.45 2.41 2.11 2.50
2.66 10-14 - 2.44 2.37 2.12 2.49
5-10 - 2.43 2.36 2.07 2.48
5-20 2.63 2.45 2.37 2.1 2.50
ρa
(apparent)
14-20 - 2.59 2.58 2.45 2.64
2.68 10-14 - 2.62 2.53 2.48 2.63
5-10 - 2.6 2.58 2.41 2.64
5-20 2.68 2.61 2.57 2.46 2.64
Bulk density kg/m3
14-20 1646 1310 1212 1027 1318
1646 10-14 1585 1283 1171 1038 1293
5-10 1603 1257 1184 1026 1287
5-20 1668 1338 1234 1042 1352
Voids % 5-20 36 43 45 44 42 38
Water absorption (WA) %
14-20 1 3.6 4.8 12.6 3.1
0.5 10-14 1 4.5 5.1 12.7 3.9
5-10 1 4.8 6.4 12.7 4.4
5-20 1 4.2 5.5 12.7 4.0
Porosity % 5-20 2.6 11.0 12.9 29.1 10.2 -
LA % 10-14 23 33 35 43 30 -

Chapter 2 Strength Prediction Model and Methods for Improving RAC
25
2.3.3 Density
Overall, the RA had lower densities than those of NA. For example, for size range 5-20 mm,
the ρssd for RA-C1, RA-C, RA-M and RA-B are less than that of NA by 5%, 7%, 10% and
20%, respectively. RA-C1 has the highest density (SSD); this is expected as RA-C1 is very
clean crushed RCA. Also, as their size decreases, the SSD density of RA-C1, RA-C and RA-
M decreases, whereas this is not always true in the case of RA-B. This reduction in SSD
density is a consequence of mortar attached to the surface of the particles. The smaller the
size of the RA is, the higher the amount of attached mortar on the RA surface. In fact, some
of the small particles of RA were entirely mortar. However, this is not applicable for RA-B
as its particles were free of attached mortar, but the brick itself was of low density.
Higher bulk density was observed for NA in comparison to RA. The lower particle density
of RA is partly responsible for its lower loose bulk density when compared to NA. Shape
also affects bulk density; usually rounded particles increase packing capacity. Since all
aggregates had almost the same gradation, it appears that the shape of the particles is the
main factor responsible for the fact that RA has higher void ratio than NA.
2.3.4 Water Absorption
The rate of WA for RA was obtained by measuring WA at 10 minutes, ½ hr, 1 hr, 2 hr, 9hr,
and 24 hr for three samples (see Figure 2.4). Approximately around 70% of the 24hr water
absorption capacity for all types occurred within the first 10 min. After that, the rate of
absorption decreased and about 97-100 % of the final absorption took place by the end of
2hr. Between 9hr and 24hr, no further absorption was observed.
As expected, higher values of WA were measured for RA than for NA. For example, for size
5-20 mm WA of 4.2 % was measured for RA-C, as compared to 1% for NA. The results of
RA-C1 show only slightly less WA than that for RA-C. The WA for RA-M and RA-B were
5.5 % and 12.7 % respectively. These results are in line with results reported elsewhere [1,
33]. Again the attached mortar on the RA surface and the inherent high porosity of RA-B are
considered responsible for their high WA. It is clear from table 2.7 that for RA-C, RA-C1
and RA-M, the smaller the aggregate size the higher the WA, mainly due to the higher
content of attached mortar as discussed earlier. However, this trend was not true for RA-B as
its particles were relatively free of attached mortar.

Chapter 2 Strength Prediction Model and Methods for Improving RAC
26
Figure 2. 4 Rate of WA of different types of RA.
2.3.5 Porosity and LA
The porosity of coarse RA (all types) is also higher than that of NA due to the open structure
of attached mortar and brick. Similar results were reported by others [2, 3, 34, 35].
The lowest value of LA (greatest resistance to fragmentation) was observed for NA and the
highest for RA-B. Although all types of RA exhibited lower mechanical performance than
that of NA, their LA values (apart from RA-B) still comply with the limit (≤ 40%) of BS
8500 for use in structural applications of concrete such as concrete for heavy duty
pavements. Similar results were reported by WRAP[1]. The high resistance to fragmentation
exhibited by RA-C1 can be attributed to the type of the NA (high quality granite) used in the
old concrete specimens. This was also found by Zega et al [36] who studied the effect of
type of natural coarse aggregate on the properties of RA. According to the categories
proposed by BS EN 12620:2002 [5] for LA, the NA and RA-C1 correspond to categories
LA25 and LA30, respectively, while both RA-C and RA-M correspond to LA35 and RA-B to
LA50.
2.4 Mix proportioning
The relative densities and WA of aggregates are used for mix proportioning. Various coarse
RA contents 20%, 50%, 75% and 100 % were examined in this study and the NA was
replaced by RA volumetrically. The mix proportions for NAC were: 340 kg/m3 of cement ,
w/c=0.47, coarse aggregate =1275 kg/m3, fine aggregate =556 kg/m3. The same mix
0
2
4
6
8
10
12
14
16
0 0.5 1 1.5 2 2.5 3 3.5 4
WA
(%)
log time (min)
RA-CRA-MRA-BRA-C1
10min 1/2hr 1hr 2hr 9hr 24hr10min 1/2hr 1hr 2hr 9hr 24hr

Chapter 2 Strength Prediction Model and Methods for Improving RAC
27
proportions were used for RAC except from the quantity of coarse aggregate which is given
in Table 2.8 and the water which is adjusted based on the moisture content of the aggregate.
Table 2. 8 Quantities of coarse RA used in production of RAC.
2.5 Concrete production
In concrete containing porous aggregates such as lightweight aggregate or RA (used in this
study), the absorption or moisture condition of the aggregate plays a key role in controlling
the microstructure of the ITZ. The moisture condition of the aggregates can be controlled
during the production of concrete [37]. Highly porous aggregates tend to absorb significant
amounts of water from the concrete mix and this can result in a dense structure of ITZ and
indeed benefit from some diffusion of fine cement grains into the outermost layer of the
aggregate. Therefore, introducing porous aggregates to the concrete mixer in a pre-wetted
condition could result in a poorer structure of ITZ [38, 39] and, hence, lower quality
concrete. Pre-wetting could also lead to accumulation of excessive water around aggregate
particles , thus increasing the micro bleeding effect on the ITZ structure[38].
It is strongly recommended to introduce the RA into the mixer in SSD condition to reduce
the impact of its high water absorption on concrete workability and to maintain the desired
w/c ratio required for strength. This can be done by pre-soaking the RA [2, 3]. However, in
practice, it is difficult to achieve the SSD condition.
Another approach was used in this study to overcome introducing excessive water around
the aggregate particles. The aggregates were added to the mixer in the dry condition and
mixed with half of the total water (w/c + water to account for the absorption of aggregates)
required for the mix. The aggregates were then left in the mixer for 10 minutes to achieve a
partially saturated condition. This period of time was selected based on the results of the
absorption tests on RA.
% RA Coarse aggregate kg/m3
RA-C NA Total RA-M NA Total RA-B NA Total RA-C1 NA Total
0 0 1275 1275 0 1275 1275 0 1275 1275 0 1275 1275
20 238 1020 1259 231 1020 1251 204 1020 1225 243 1020 1263
50 596 638 1234 577 638 1214 511 638 1149 608 638 1246
75 894 319 1213 865 319 1184 767 319 1085 912 319 1231
100 1192 0 1192 1154 0 1154 1022 0 1022 1216 0 1216

Chapter 2 Strength Prediction Model and Methods for Improving RAC
28
Slump tests were conducted to assess the workability of the fresh concrete by following the
procedure in BS EN 12350-2 [40]. The concrete was placed in moulds and compacted using
a vibrating table. After 24hr, the specimens were demoulded and coded. Specimens were
water cured at 20 ± 2 oC.
The density of hardened concrete cubes (100mm in dimension) was measured using BS EN
12390-7 [41]. The compressive strength of 100mm cubes was obtained using BS EN 12390-
3 [42].
2.6 Properties of NAC and RAC
2.6.1 Workability, Air voids and Density
Table 2.9 shows workability, air voids and density of concrete. The results show that the
incorporation of RA (except RA-M) had little effect on the workability of concrete. This
shows that the pre-mixing procedure worked. The slump values of the RAC incorporating
RA-M with 75% and 100% RA content were 30mm (lower than the 50mm target); therefore
superplastisizer was added to enhance workability.
Table 2. 9 Properties concrete: workability, air content and density.
* SP was added (0.32 % of cement mass). ** SP was added (0.16 % of cement mass).
Property RA %
Type of coarse Aggregate
NA RA-C RA-M RA-B RA-C1
Slump
0 60 - - - -
20 - 65 55 80 65
50 - 60 50 60 60
75 - 55 85* 60 60
100 - 55 65** 55 55 Air content % 100 3.5 4 5.5 5.5 4
Density kg/m3 (Normalised)
0 2378 (1) - - - -
20 - 2336 (0.98) 2348 (0.98) 2256 (0.95) 2351 (0.99)
50 - 2315 (0.97) 2275 (0.96) 2229 (0.94) 2334 (0.98)
75 - 2295 (0.96) 2242 (0.94) 2150 (0.90) 2309 (0.97)
100 - 2273 (0.95) 2205 (0.93) 2102 (0.88) 2285 (0.96)

Chapter 2 Strength Prediction Model and Methods for Improving RAC
29
The dosage of the AEA to achieve the required air entrained voids content (min 3.5 %) was
established at 0.11 of the cement mass. The air content of RAC was found to be only slightly
higher than that of NAC.
As expected, the RAC had lower density than NAC. Similar results were found by others [2,
3, 33, 43]. Since both had the same gradation and were compacted in the same way, any
reduction in density can be attributed to aggregate density and shape.
2.6.2 Compressive Strength Results
The results of the compressive strength (average of 3 samples) at 7 and 28 days are shown in
Table 2.10. Figure 2.5 shows the normalized compressive strength at 28 days (fcu,28,RA /
fcu,28,NA) versus RA content. RAC made of RA from CDW had lower compressive strength
than that of NAC regardless of the type of RA. In addition, as expected, increasing RA
content decreases strength.
Table 2. 10 Compressive strength of NAC and RAC.
RA content %
Compressive Strength MPa
7 days 28 days
NA RA-C RA-M RA-B RA-C1 NA RA-C RA-M RA-B RA-C1
0 43.6 - - - - 53.1 - - - -
20 - 41.9 41.2 33.9 44.1 - 50.0 48.0 40.0 53.2
50 - 37.9 36.3 30.5 45.2 - 45.3 41.7 37.0 54.0
75 - 37.5 33.1 28.8 46.7 - 44.0 39.5 33.1 55.8
100 - 35.4 30.8 27.6 47.3 - 41.6 38.1 31.5 58.3

Chapter 2 Strength Prediction Model and Methods for Improving RAC
30
Figure 2. 5 Normalized compressive strength of RAC at different RA content.
The behaviour of RAC made of RA-C1 was much better than that of RAC using RA from
CDW. For all contents, the compressive strength at both 7 and 28 days were higher than
those of NAC.
2.6.3 Effect of particle density on properties of RA and RAC
Figure 2.6 shows the effect of aggregate particle density on aggregate strength (LA %).
Unlike observations elsewhere [1], the particle density of RA had a clear relationship and
strong correlation with its mechanical behaviour (LA). The high values of LA for RA (29-
35%), which mean low resistance to fragmentation (low strength), are caused by low density
loose, porous and weak layers of mortar present on the surface of coarse RA.
Figure 2. 6 Effect of particle density of RA on its strength.
0.4
0.6
0.8
1
1.2
0 20 40 60 80 100
Nor
mal
ized
Sten
gth
(28
days
)
RA ratio (%)
RA-CRA-MRA-BRA-C1
y = -27.58x + 96.03R² = 0.97
15
20
25
30
35
40
45
1.6 1.8 2 2.2 2.4 2.6 2.8
LA (
%)
Particle Density (rd) (Mg/m3)

Chapter 2 Strength Prediction Model and Methods for Improving RAC
31
The attached mortar and the porosity of the brick also cause problems in terms of WA and
porosity of RA, as can be seen in Figure 2.7. For a particle density (ssd) decrease of 10%,
the WA increases by about 6% and porosity increases by around 12%.
Figure 2. 7 Effect of particle density of RA on its WA and porosity.
As expected, there is a linear correlation between density (ssd) of RA and normalized
density of RAC as can be seen in Figure 2.8. Figure 2.8 also shows the theoretical curve of
the normalized density of concrete which is calculated based on the particle density of the
aggregate and the mix proportions.
Figure 2. 8 Effect of particle density on the normalised density of RAC.
R² = 0.98
R² = 0.98
0
5
10
15
20
25
30
35
2 2.1 2.2 2.3 2.4 2.5 2.6 2.7
WA
or P
oros
ity (
%)
Particle Density (ssd) (Mg/m3)
Porosity
WA
R² = 0.98
0.86
0.88
0.9
0.92
0.94
0.96
0.98
1
2 2.2 2.4 2.6 2.8
Nor
mal
ized
Con
cret
e D
ensi
ty
Particles Density (ssd) (Mg/m3)
RA=100%NA
Theoretical

Chapter 2 Strength Prediction Model and Methods for Improving RAC
32
Figure 2.9 shows the effect of particle density on the normalized strength of RAC at 28 days
for different RA contents. A strong relationship with relatively good correlation appears to
exist between the particle density and the strength of RAC. It can be seen that an 8%
increase in particle density approximately leads to a 10 % increase in concrete strength
regardless the RA content.
Figure 2. 9 Effect of particle density of RA on normalized strength of RAC.
2.6.4 Parameters affecting Strength of RAC
Figure 2.10 shows the effect of normalized density of RAC containing RA from CDW on its
normalized compressive strength at 28 days. There appears to be a strong relationship
between the density of RAC and its strength with a good correlation (R2 =0.94). It can be
seen that when the density of concrete increases by 10%, its compressive strength increases
by 40%. A similar relationship was reported by Xiao et al. [44], who reviewed the results of
many published experimental studies. However, RAC made with RA-C1 does not support
this trend as although it has a similar concrete density to that containing RA-C and RA-M ,
its strength is substantially higher. Hence , it is clear that another parameter also affects the
strength of RAC. The obvious candidate to consider is the strength of RA (e.g. LA value)
and this is examined in Figure 2.11. A good correlation can be identified between LA of RA
and the normalized strength of RAC in Figure 2.11. Therefore, it is proposed that both LA
and particle density should be used to determine the effect of RA on the strength of RAC
using statistical analysis.
R² = 0.99
R² = 0.95
R² = 0.84
R² = 0.77
0.5
0.6
0.7
0.8
0.9
1.0
2 2.2 2.4 2.6
Nor
mal
ized
Stre
ngth
(28
days
)
Particle Density (Mg/m3)
20 %
50 %
75 %
100 %
RA-CRA-MRA-B

Chapter 2 Strength Prediction Model and Methods for Improving RAC
33
Figure 2. 10 Relation between normalized density and normalised strength of RAC.
Figure 2. 11 Effect of LA of RA on normalized strength of RAC.
2.6.5 Strength Prediction Equations
A multi-linear regression analysis was used to develop a multi-variable model to predict the
compressive strength of RAC. In this study the dependent variable is the compressive
strength of RAC while the independent variables are particle density (dry), LA, WA and RA
(ratio). The normalized form for all variables is used.
Three models were developed, as shown below: two linear models, eq. 1 and 2 and one non-
linear, eq. 3
y = 3.71x - 2.75R² = 0.94
0.5
0.6
0.7
0.8
0.9
1
0.88 0.9 0.92 0.94 0.96 0.98 1
Nor
mal
ized
Stre
ngth
(28
days
)
Normalized Density
R² = 0.81
0
0.2
0.4
0.6
0.8
1
1.2
20 25 30 35 40 45 50
Nor
mal
ized
stre
ngth
(28
days
)
LA ( %)

Chapter 2 Strength Prediction Model and Methods for Improving RAC
34
NAcuRAcu fRAWAWA
LALAf ,
NA
RA
NA
RA
NArd,
RArd,, 35.1012.02.047.27.13 ×
−−−+=
ρρ
R2 = 0.89 (1)
NAcuRAcu fRAWAWA
LALA
f ,RA
NA
RA
NA
NArd,
RArd,, 13.099.022.3245.1 ×
−−+−=
ρρ
R2 = 0.85 (2)
12.065.0
NA
RA6.3
NA
RA15.0
NArd,
RArd,,, )1()()()( +
×××= −− RA
WAWA
LALAff RAcuRAcu ρ
ρ R2 = 0.87 (3)
The difference between eq. 1 and 2 is that in the latter (LANA/ LARA) and (WANA/ WARA) were
used instead of (LARA/ LANA) and (WARA/ WANA). Figure 2.12 (a, b and c) examines the
accuracy of the developed models. It can be seen that all models can predict the fcu of RAC
reasonably well.
(a) (b)
(c)
Figure 2. 12 Predictive models for fcu of RAC, (a) linear model eq.1, (b) linear model eq.2, (c) non-linear model eq. 3.
R² = 0.82
0.0
0.2
0.4
0.6
0.8
1.0
1.2
0.0 0.2 0.4 0.6 0.8 1.0 1.2
Pred
icted
Nor
mal
ized
fcu
Measured Normalized fcu
Linear Model: eq.1
0.0
0.2
0.4
0.6
0.8
1.0
1.2
0.0 0.2 0.4 0.6 0.8 1.0 1.2
Pred
icted
Nor
mal
ized
fcu
Measured Normalized fcu
Linear Model : eq. 2
R2 = 0.85
0.0
0.2
0.4
0.6
0.8
1.0
1.2
0.0 0.2 0.4 0.6 0.8 1.0 1.2
Pred
icted
Nor
mal
ized
fcu
Measured Normalized fcu
Non-linear Model: eq.3
R2 = 0.81

Chapter 2 Strength Prediction Model and Methods for Improving RAC
35
To check the validity of the developed models, worldwide experimental results found in the
literature [1, 2, 39, 45-49] were examined. The results are shown in Figure 2.13 (a, b and c).
It can be seen that the linear model (eq. 2) can predict the compressive strength of RAC
better than the other two models. For the results of (Tam [15], Kou et al [20], Xiao et al [45]
and Brendt [48]) the values of LA were not given, so the equation shown in Figure 2.6 was
used to determine the value of LA.
Discussion
Although equation 2 has a negative value on the density ratio coefficient which could be
taken as that an increase in aggregate density can decrease strength, it should be remembered
that LA is also a function of the density and that causes this abnormality. The value of LA is
the sole indicator of RAC strength, but LA is not a property that can be controlled. Density,
on the other hand, can be controlled by using different separation techniques (such as
centrifugal force or floatation) that could be developed industrially. Hence, it is clear that the
development of density separation techniques can help produce RA of different strengths,
some of which could be used for high quality concrete.
The other main parameter that may be able to be controlled is WA, which may help improve
the concrete ITZ.

Chapter 2 Strength Prediction Model and Methods for Improving RAC
36
(a)
(b)
(c)
Figure 2. 13 Validity of the predictive models for fcu of RAC: a- linear model eq.1, b- linear model eq. 2, c-non-linear model eq.3
0.0
1.0
2.0
3.0
4.0
5.0
6.0
0 1 2 3 4 5 6
Pred
icted
Nor
mal
ized
Str
engt
h
Measured Normalized Strength
WRAP 2007Current studyKou et al 2008Brendt 2009Etxebberria 2007Buttler and Machado 2005Tam 2005Xiao et al 2005
Linear Model :eq. 1
R2 = 0.65
0.0
0.2
0.4
0.6
0.8
1.0
1.2
1.4
1.6
1.8
0 0.2 0.4 0.6 0.8 1 1.2 1.4 1.6 1.8
Pred
icte
d N
orm
aliz
ed S
tren
gth
Measured Normalized Strength
WRAP 2007Current studyKou et al 2008Brendt 2009Etxebberria 2007Xiao et al 2005Buttler and Machado 2005Tam 2005
Linear Model : eq. 2
R2 = 0.97
0.0
0.2
0.4
0.6
0.8
1.0
1.2
1.4
1.6
1.8
2.0
0 0.2 0.4 0.6 0.8 1 1.2 1.4 1.6 1.8 2
Pred
icte
d N
orm
aliz
ed S
tren
gth
Measured Normalized Strength
WRAP 2007Current studyKou et al 2008Brendt 2009Etxebberria 2007Buttler and Machado 2005Tam 2005Xiao et al 2005
Non-linear Model: eq. 3
R2 = 0.91

Chapter 2 Strength Prediction Model and Methods for Improving RAC
37
2.7 Surface Treatment of RA
As already mentioned RA often suffers from a weak and porous surface, mainly due to old
mortar or inferior materials such as low strength bricks. The cracked, loose, porous and
weak surface of RA may be strengthened by: (1) filling the cracks, (2) increasing the bond
between the loose particles and the surface, (3) decreasing the porosity of this layer.
Minimizing the effects of these weaknesses and densifying the surface of RA can enhance
the strength of RAC. Modifying the microstructure of the ITZ by incorporating mineral
admixtures is not uncommon [13]. This improvement is usually achieved through two
mechanisms: physical and chemical. The former is due to the ability of the mineral
admixtures to act as micro-fillers to fill micro-pores in the ITZ, whereas the latter is due to
the pozzolanic reaction between the SiO2 in the mineral admixtures and the CH existing in
the ITZ, in the presence of water to produce C-S-H. For porous aggregates such as
lightweight aggregate and RA, the ITZ is not limited to the vicinity of the aggregate surface,
rather it goes beyond that reaching a certain distance inside the RA through the attached old
mortar. Coating the RA with a layer of mineral admixtures facilitates the penetration of
micro-particles into the porous and cracked surface of RA.
In this study, an attempt was made to improve the surface properties of RA by coating with
very fine materials. Different types of materials were used to treat the RA including reactive
micro-fillers (mineral admixtures such as FA, GGBS and SF) and non-reactive micro-fillers
(LP). RA-M was selected to undertake the surface treatment utilizing two coating
techniques; pre-mixing treatment (PMT) and within-mixing treatment (WMT).
2.7.1 Methodology for Surface Treatment
In PMT, RA was immersed in a solution containing microfillers to apply a coating layer on
the surface of the RA. A liquid form of several fillers (SF, GGBS, LP, FA) was prepared by
using a mixing ratio (by mass) of 1 powder : 10 water. Superplastisizer was added (1% of
the mass of powder) to ensure dispersion of the powder particles in the water. The RA was
soaked in the solution in oven dry conditions. They were left in the solution for 24 hr. They
were then transferred to a tray and placed in the oven for 24hr.The mass of the RA was
measured before and after treatment (in dry condition) to calculate the mass of the powder
absorbed by the RA.
In the WMT, the treatment was undertaken during the mixing process as shown in

Chapter 2 Strength Prediction Model and Methods for Improving RAC
38
Figure 2.14. This differs from the TSMAs and TSMAsc developed by Tam and Tam [18] in
that no cement is added at the first stage and after the first stage, there is a 10 minute resting
period, during which moisture is allowed to penetrate to the RA and, pull-in some of the
fines, to block pores.
Figure 2. 14 Mixing steps of WMT
The same mix proportions as adopted earlier were used to produce -RAC made with treated
RA-M (100% content). Examinations on powder uptake, workability, density of concrete
and compressive strength were undertaken. The results are presented in Table 2.11.
Table 2. 11 Properties of RAC made with treated RA-M (%RA=100 %).
* Standard deviation. ** SP was added (0.1 % of cement mass).
Powder Type
Uptake % (by
mass of RA)
Uptake % (by mass
of cement)
Slump mm Density kg/m3 Compressive Strength MPa (SD)*
Normalized Strength
PMT WMT PMT WMT PMT WMT PMT WMT
None - - 65
2205
38.1 (1.2) 1
LP 2.6 4.6 65 70 2222 2217 40.8 (1.4) 41.2 (1.0) 1.07 1.08
SF 1.1 1.9 65 65 2221 2228 43.6 (1.1) 44.6 (1.1) 1.15 1.17
GGBS 2.1 3.8 65 70 2230 2224 40.1 (1.1) 40.4 (1.2) 1.05 1.06
FA 0.6 1.1 70 70 2207 2213 37.6 (1.0) 38.0 (2.0) 0.99 1.0
SF-RSF - 60** - - 49.7 (1.2) - 1.30
120s
mixing
60s
mixing
Stop for 10min
Surface treated
RA
RA coated with Powder+Cement RAC
30s
mixing
RA
Surface treated
RA
Cement Water (part 2) + Sand Water (part 1) + Powder

Chapter 2 Strength Prediction Model and Methods for Improving RAC
39
2.7.2 Results of the Treatment Techniques
2.7.2.1 Uptake of RA and workability
The results show that very small amounts of FA and SF were absorbed by the RA, whereas
larger amounts of LP and GGBS were absorbed.
The workability, in general, was better than that of NAC (60 mm) and equal (or higher) to
that of RAC of untreated RA-M (65 mm) which was achieved using superplasticizers. This
was expected as it is well known that mineral admixtures usually enhance the workability of
concrete.
2.7.2.2 Density and compressive strength
Regardless of the material and technique used for treatment of RA, concrete density (average
of three samples) was similar or slightly higher than without treatment (2205 kg/m3). This
indicates that the treatment process does not penetrate much into the RA and, hence, does
not improve much the density of concrete.
Regardless of the treatment method, comparable strength to that of untreated RA was
observed for RA coated with FA. As can be seen in Table 2.11 coating with FA did not help
the strength. One possible explanation for this result may be that the size of FA particles was
not small enough (as can be seen from its fineness Table 2.1) to effectively fill the micro
cracks on the surface of the RA. This view is also supported by the fact that the amount of
FA uptake (see table 2.11) is the lowest amongst the micro-fillers used. SEM scanning
undertaken by Kong et al [20] on RCA treated with FA shows that some un-reacted particles
of FA were present even after 28 days of curing leaving a large amount of CH crystals
around its particles. This may explain why the FA treatment resulted in lower strength than
the untreated RA.
Strength improvements of 6%, 17% and 8% were obtained when RA was coated with
GGBS, SF and LP, respectively. GGBS seems to perform better than FA and this can be
attributed mainly to the fact that GGBS used in this study had higher fineness than FA. This
enhanced the ability of GGBS particles to fill the voids on the RA and the much higher
uptake confirms this. GGBS also tends to be more uniform in chemical composition and
physical properties [50, 51] and as a result may have had less problems with reactivity.
Significant strength improvement was achieved with SF. The ability of SF particles to act as
micro-fillers (high fineness, see Table 2.1) and their high reactivity are well known [13, 18,

Chapter 2 Strength Prediction Model and Methods for Improving RAC
40
51]. The treatment with SF not only improves the ITZ, but it can also increase the
mechanical strength of the RA by: a) filling the cracks on the surface of RA, b) reacting with
the CH accumulated on the mortar attached to the RA and c) reducing the effect of the loose
particles on the strength of RA by effectively bonding them to the surface of the RA [13].
A strength improvement was seen when coating RA with LP. This again can be attributed to
the small size of the particles which resulted in the highest uptake. This was also found by
Goldman and Bentur [52] who showed that nonreactive micro-fillers (e.g. carbon black) can
strengthen the ITZ and improve the composite behaviour of concrete leading to strength
improvements as large as that obtained from the pozzolanic effect of SF. To a lesser extent,
a chemical mechanism may contribute to the strength enhancement by the formation of
calcium mono-carboaluminates when LP is used as a filler [53]. This strength improvement
can also be attributed to the nucleation effect, as the introduction of many nucleation sites
may homogenise the distribution of C-S-H and hence densify the pore-structure of cement
paste [54-56], in particular at the ITZ.
The use of WMT exhibited better strength improvement than PMT though the difference is
insignificant. The slight difference observed could be due to the fact that in WMT all the
microfiller used to coat the RA remained in the concrete mixtures, while in PMT some of the
microfillers came off when the dried and treated RA was transferred to the mixer as some of
the microfillers were seen in the drying tray. From a practical prospective, WMT is preferred
as it saves time and effort.
2.7.3 Effect of ITZ on the Strength of RAC
At the macroscopic level, concrete appears as a two phase material (aggregate particles
surrounded by cement matrix). However, at the microscopic level, a third phase, known as
ITZ, can be distinguished as a film of 10-50 microns thickness at the interface between
aggregate and cement matrix. ITZ possesses different properties and microstructure than
aggregate and cement paste and is responsible for many strength and durability behavioural
aspects of concrete. ITZ is in general weaker than the other two phases and is characterised
by high porosity caused by the 'wall effect' and internal bleeding [51]. The inclusion of RA
in concrete increases the complexity of the structure of concrete and whilst in NAC only one
type of ITZ exists, in RAC, three types can be identified (see Figure 2.15): a) ITZ1 between
old cement (attached) mortar (OCM) and the NA , b) ITZ2 between OCM part of RA and
the new cement mortar (NCM), c) ITZ3 between the NA part of RA and NCM. Since the

Chapter 2 Strength Prediction Model and Methods for Improving RAC
41
mix proportions and the properties of the old and new cement mortars in RAC are usually
different, the properties and microstructure of these ITZs are also expected to differ.
Figure 2. 15 Schematic representation of ITZs in RAC.
For this reason, SEM (Scanning Electron Microscope) tests were conducted on RAC
samples. Three different ITZs can be identified in Figure 2.16 (a, b, c, d and e). Better bond
between the NCM and the OCM can be identified (as there is no clear boundary between
them), whereas clear lines can be seen between the OCM and the NA and between the NCM
and the NA (ITZ1and ITZ2). It appears that the process of preparing the samples may have
affected the ITZ1 and the ITZ2 (mortar separated from NA), but this is not clear in ITZ3 and
this can confirm the better bond between the OCM and NCM in ITZ3.

Chapter 2 Strength Prediction Model and Methods for Improving RAC
42
(a) Microscope image of RAC (b) SEM image of RAC
(c) EDAX of a point in ITZ1 (d) EDAX of a point in ITZ2
(e) EDAX of a point in ITZ3
Figure 2. 16 Microscope and SEM images and EDAX of RAC.
It is reported [13, 18, 38, 57] that the surface of RA is characterised by a weak layer of loose
crumbs (particles) and macro and micro cracks caused by the crushing process in the
production of RA. These weaknesses can further diminish the quality of RAC at the ITZ and
increase the absorption of RA, causing an increase of the w/c ratio at the new ITZs (ITZ2
and ITZ3) which in turn can lead to the formation of large calcium hydroxide (CH) crystals
and increase the porosity in this zone [13, 15, 20] .
NA
OCM
RA
NCM
ITZ 3
ITZ 1
ITZ 2
FS = 404FS = 369
FS = 1152

Chapter 2 Strength Prediction Model and Methods for Improving RAC
43
Figure 2.17 a and b show microscope and SEM images of RAC samples with RA treated
with SF. Evidence of damage on ITZ1 and ITZ2 can be easily seen, however it is absent
from ITZ3. This can be attributed to the role of SF in reacting with CH on the surface of
OCM of RA enhancing the bond between OCM and NCM.
(a) (b)
Figure 2. 17 Microscope and SEM images of RAC with SF treated RA.
2.8 Effect of RTSF on Strength of RAC
RTSF had a positive effect on the compressive strength of RAC (see Table 2.11). When
RAC containing RA coated with SF (1.9% of cement mass) was reinforced with 2% by mass
(48 kg/m3) of RTSF, strength improvement of 11% was achieved (from 44.6 to 49.7 MPa).
In comparison to plain RAC (containing untreated RA), the treatment of RA with SF and the
addition of RSF led to a 30% strength improvement (from 38.1 to 49.7 MPa). The strength
enhancement resulted in RAC with 94% of the strength of NAC (53.1 MPa).
The positive effect of RTSF on compressive strength is in line with other studies which used
industrial steel fibres (ISF). It is reported [32, 58, 59] that the addition of ISF (up to a certain
content e.g. 3% by mass) can increase the compressive strength of concrete in the range of
6-25 %, though strength reductions were reported by others [60-62]. On the other hand, very
few studies investigated the behaviour of RTSF reinforced concrete under compressive
loading [21, 32, 63]. Strength increases of 6%, 10% and 25% were reported by [21], [32]
and [63] respectively for contents up to 3-4 % (by mass). The failure mechanism of concrete
under compression initiates with the development of micro-cracks, due to tensile stresses
normal to the direction of the compressive stresses, which coalescence to form macro-
NA
OCM
NCMRA
ITZ 3
ITZ 2
ITZ 1

Chapter 2 Strength Prediction Model and Methods for Improving RAC
44
cracks. The short RTSF appear to prevent/delay the propagation of micro-cracks and , hence,
help increase the compressive strength [21].
2.9 Conclusions
- Four types of RA conforming to BSI requirements [4] for RA and RCA were examined.
According to the British standards [4, 5], RA-C and RA-M can be classified as RCA, whilst
RA-B is classified as RA.
- The evolution of WA of RA shows that more than 70% of the 24hr WA capacity of all
types of RA can be achieved when immersing them in water for 10 min. For this reason, to
overcome the issue of high absorption, it is recommended to leave the RA in the mixer with
half of the mixing water for 10 minute.
- The particle density of RA has a clear relationship with its strength (LA), WA and
porosity. When the particle density decreases, its strength decreases while its WA and
porosity increases.
- A strong relationship with very good correlation appears to exist between the particle
density and the strength of RAC. It was found that an 8% increase in particle density leads to
an increase of approximately 10 % in concrete strength, regardless of RA content. Therefore,
just as in NA, the particle density of RA seems to be predominantly responsible for the
density of RAC. Also, the density of RA appears to directly affect the strength of RAC.
Hence, density separation is proposed to produce high quality of RA from CDW.
- A good correlation was identified between LA of RA and the normalized strength of RAC.
It is proposed that the use of LA coefficient alongside the particle density is used to
determine the effect of RA on the strength of RAC.
- A strength predictive model is proposed that takes into account the most important
parameters (ρrd, LA, WA and RA content) that affect the performance of RAC.
- Two techniques were used to treat the surface of RA-M (coating with reactive and non-
reactive microfillers), PMT and WMT. WMT leads to slightly better results, since all the
microfiller used to coat the RA remains in the concrete mixtures. Reactive microfillers such
as GGBS and SF led to an increase in compressive strength of RAC by 6% and 17%
respectively (using WMT). FA did not result in any strength improvement possibly due to

Chapter 2 Strength Prediction Model and Methods for Improving RAC
45
the large size of FA particles. Treatment with non-reactive (LP) enhanced the compressive
strength by 8%. SF gave the best results and is recommended for surface treatment of RA.
- Short RTSF delay the propagation of microcracks and enhance the compressive strength.
The inclusion of 2% (by mass) RTSF helps improve the compressive strength of RAC.

Chapter 2 Strength Prediction Model and Methods for Improving RAC
46
References
1. WRAP, Perfomance Related Approach to Use Recycled Aggregates. 2007, Waste and Resources Action Programme: Oxon.
2. Tam, W.W.V.C.M., Recycled Aggregate from Concrete Waste for Higher Grades of Concrete Construction , PhD thesis, in Department of Building and Construction. 2005, City University of Hung Kong: Hung Kong.
3. Hansen, T.C., Recycled of Demolished Concrete and Masonry 1992, London: E & FN SPON.
4. BS 8500-2, Concrete complementary British Standard to BS EN 206 part 1 -Part 2: Specification for constituent materials and concrete, in. 2006, British Standard Institiution: London.
5. BS EN 12620 :2002 +A1, Aggregates for concrete. 2008, British Standards Institution London.
6. RILEM TC 121-DRG, Specifications for concrete with recycled aggregates. Materials and Structures, 1994. 27(9): p. 557-559.
7. WBTC No. 12/2002, Specifications Facilitating the Use of Recycled Aggregates. 2002, Works Bureau Technical Circular: Hong Kong.
8. Montgomery, D.G., Workability and compressive strength properties of concrete containing recycled concrete aggregate. Proc. Sustainable Construction: Use of Recycled Concrete Aggregate, 1998: p. 289-296.
9. Tam, V.W.Y., C.M. Tam, and K.N. Le, Removal of cement mortar remains from recycled aggregate using pre-soaking approaches. Resources Conservation and Recycling, 2007. 50(1): p. 82-101.
10. Tateyashiki, H., et al., Properties of concrete with high quality recycled aggregate by heat and rubbing method. Proceedings of JCI, 2001. 23(2): p. 61-66.
11. Muller, H.A. and E. Linss, Processing of Concrete With High oerformance Sonic Impulses, in Conference on the Use of Recycled Materials In Building and Structures 2004: Barcelona, Spain
12. Akbarnezhad, A., et al., Microwave-assisted beneficiation of recycled concrete aggregates. Construction and Building Materials, 2011. 25(8): p. 3469-3479.
13. Katz, A., Treatments for the improvement of recycled aggregate. Journal of Materials in Civil Engineering, 2004. 16(6): p. 597-603.
14. Tam, V.W.Y., X.F. Gao, and C.M. Tam, Comparing performance of modified two-stage mixing approach for producing recycled aggregate concrete. Magazine of Concrete Research, 2006. 58(7): p. 477-484.
15. Tam, V.W.Y., X.F. Gao, and C.M. Tam, Microstructural analysis of recycled aggregate concrete produced from two-stage mixing approach. Cement and Concrete Research, 2005. 35(6): p. 1195-1203.
16. Tam, V.W.Y. and C.M. Tam, Assessment of durability of recycled aggregate concrete produced by two-stage mixing approach. Journal of Materials Science, 2007. 42(10): p. 3592-3602.
17. Tam, V.W.Y., C.M. Tam, and Y. Wang, Optimization on proportion for recycled aggregate in concrete using two-stage mixing approach. Construction and Building Materials, 2007. 21(10): p. 1928-1939.

Chapter 2 Strength Prediction Model and Methods for Improving RAC
47
18. Tam, V.W.Y. and C.M. Tam, Diversifying two-stage mixing approach (TSMA) for recycled aggregate concrete: TSMA(s) and TSMA(sc). Construction and Building Materials, 2008. 22(10): p. 2068-2077.
19. Li, J., H. Xiao, and Y. Zhou, Influence of coating recycled aggregate surface with pozzolanic powder on properties of recycled aggregate concrete. Construction and Building Materials, 2009. 23(3): p. 1287-1291.
20. Kong, D., et al., Effect and mechanism of surface-coating pozzalanics materials around aggregate on properties and ITZ microstructure of recycled aggregate concrete. Construction and Building Materials, 2010. 24(5): p. 701-708.
21. Graeff, A.G., et al., Fatigue resistance and cracking mechanism of concrete pavements reinforced with recycled steel fibres recovered from post-consumer tyres. Engineering Structures, 2012. 45(0): p. 385-395.
22. BS EN 197-1:2011, Cement. Composition, specifications and conformity criteria for common cements. 2011, British Standard Institution: London, UK.
23. BS EN 933-11:2009, Tests for geometrical properties of aggregates -Part 11: Classification test for the constituents of coarse recycled aggregate. 2010, British Standard Institution: London.
24. BS EN 933-1:1997, Tests for geometrical properties of aggregates -Part 1: Determination of particle size distribution — Sieving method. 2006, British Standard Institution: London.
25. BS EN 1097-6:2000, Tests for mechanical and physical properties of aggregates — Part 6: Determination of particle density and water absorption. 2005, British Standard Institution: London.
26. BS EN 1936:2006, Natural stone test methods — Determination of real density and apparent density, and of total and open porosity. 2007, British Standard Institution: London.
27. BS 812-102:1989, Testing aggregates. Methods for sampling. 1989, British Standard Institution: London-UK. p. 12.
28. BS EN 933-4:2008, Tests for geometrical properties of aggregates Part 4: Determination of particle shape — Shape index. 2009, British Standard Institution: London.
29. BS EN 1097-3:1998, Tests for mechanical and physical properties of aggregates - Part 3: Determination of loose bulk density and voids. 1998, British Standard Institution: London.
30. BS EN 1097-2:1998, Tests for mechanical and physical properties of aggregates-Part 2: Methods for the determination of resistance to fragmentation. 2006, British Standards Institution: London.
31. Musacchi, E., P. Iacobucci, and M. Pierfelice, Potential Process for Cleaning and Sorting of the recycled fibres, Deliverable report 13, FB6 STREP Project Ecolanes (031530). 2008.
32. Tlemat H., Steel fibres from waste tyres to concrete: testing, modelling and design, in Department of Civil and Structural Engineering. 2004, The University of Sheffield: Sheffield UK.
33. Soutsos, M.N., K. Tang, and S.G. Millard, Concrete building blocks made with recycled demolition aggregate. Construction and Building Materials, 2011. 25(2): p. 726-735.

Chapter 2 Strength Prediction Model and Methods for Improving RAC
48
34. Tam, V.W.Y., K. Wang, and C.M. Tam, Assessing relationships among properties of demolished concrete, recycled aggregate and recycled aggregate concrete using regression analysis. Journal of Hazardous Materials, 2008. 152(2): p. 703-714.
35. Angulo, S., et al., On the classification of mixed construction and demolition waste aggregate by porosity and its impact on the mechanical performance of concrete. Materials and Structures, 2010. 43(4): p. 519-528.
36. Zega, C., Y. Villagrán-Zaccardi, and A. Di Maio, Effect of natural coarse aggregate type on the physical and mechanical properties of recycled coarse aggregates. Materials and Structures, 2010. 43(1): p. 195-202.
37. Katz, A., A. Bentur, and K.O. Kjellesen, Normal and high strength concrete with lightwieght aggregates, in Engineering and Transport Properties of the Interfacial Transition Zone in Cementitious Composites, M.G. Alexander, et al., Editors. 1999, RILEM Report 20: France. p. 71-88.
38. Punkki, J. and O.E. Grov. Effect of water absorption by aggregate on properties of high-strength light weight concrete. in Int. Symposium on Structural Lightwieght Aggregate Concrete. 1995. Sardefjord, Norway: Norwegian Concrete Association.
39. Etxeberria, M., et al., Influence of amount of recycled coarse aggregates and production process on properties of recycled aggregate concrete. Cement and Concrete Research, 2007. 37(5): p. 735-742.
40. BS EN 12350-2, Testing fresh concrete – Part 2: Slump test. . 2009, British Standards Institution: London
41. BS EN 12390-7:2009, Testing hardened concrete Part 7: Density of hardened concrete. 2009, British Standards Institution: London.
42. BS EN 12390-3:2009, Testing hardened concrete Part 3: Compressive strength of test specimens. 2009, British Standards Institution: London.
43. Katz, A., Properties of concrete made with recycled aggregate from partially hydrated old concrete. Cement and Concrete Research, 2003. 33(5): p. 703-711.
44. Xiao, J.Z., J.B. Li, and C. Zhang, On relationships between the mechanical properties of recycled aggregate concrete: An overview. Materials and Structures, 2006. 39(6): p. 655-664.
45. Xiao, J.Z., J.B. Li, and C. Zhang, Mechanical properties of recycled aggregate concrete under uniaxial loading. Cement and Concrete Research, 2005. 35(6): p. 1187-1194.
46. Kou, S., C. Poon, and D. Chan, Influence of fly ash as a cement addition on the hardened properties of recycled aggregate concrete. Materials and Structures, 2008. 41(7): p. 1191-1201.
47. Gonzalez-Fonteboa, B. and F. Martinez-Abella, Concretes with aggregates from demolition waste and silica fume. Materials and mechanical properties. Building and Environment, 2008. 43(4): p. 429-437.
48. Berndt, M.L., Properties of sustainable concrete containing fly ash, slag and recycled concrete aggregate. Construction and Building Materials, 2009. 23(7): p. 2606-2613.
49. Buttler, A.M. and J.E.F. Machado, Properties of Concrete with Recycled Concrete Coarse Aggregates, Special publication Aci Materials Journal, 2005. 229: p. 497-510.

Chapter 2 Strength Prediction Model and Methods for Improving RAC
49
50. Neville, A.M., Properties of concrete. 1995, Harlow: Longman Group.
51. Mehta, P.K. and P.J.M. Monteiro, Concrete: Microstructure, Properties, and Materials. 2006, New York: McGraw-Hill.
52. Goldman, A. and A. Bentur, The Influence of Microstructures on Enhancement of Concrete Strength. Cement and Concrete Research, 1993. 23: p. 962-972.
53. Newman, J. and B.S. Choo, Advanced Concrete Technology: Constituent Materials. 2003, London: Elsevier Ltd.
54. Sellevold, E.J., Silica Fume - Cement Paste: Hydration and Pore Structure 1982, Report BML 82.610 Norwegian Institute of Technologhy: Trondheim, Norway. p. 19-50.
55. Peter Hawkins, Paul Tennis, and R. Detwiler, The use of limestone in the Portland Cement: A State-of-the-Art reveiw. 2003, PCA, Portland Cement Association Skokie,Illinois, USA.
56. Moosberg-Bustnes, H., B. Lagerblad, and E. Forssberg, The function of fillers in concrete. Materials and Structures, 2004. 37(2): p. 74-81.
57. Soutsos, M.N., K. Tang, and S.G. Millard, The use of recycled demolition aggregate in precast concrete products – Phase III: Concrete pavement flags. Construction and Building Materials, 2012. 36(0): p. 674-680.
58. Pilakoutas, K., K. Neocleous, and H. Tlemat, Reuse of steel fibres as concrete reinforcement. Engineering Sustainability,, 2004. 157(ES3): p. 131-138.
59. Graeff A., Long-Term Performance of Recycled Steel Fibre Reinforced Concrete for Pavement Application, in Department of civil and Structural Engineering. 2011, The University of Sheffield: Sheffield, UK.
60. Lee, M.K. and B.I.G. Barr, An overview of the fatigue behaviour of plain and fibre reinforced concrete. Cement and Concrete Composites, 2004. 26(4): p. 299-305.
61. Altun, F., T. Haktanir, and K. Ari, Effects of steel fiber addition on mechanical properties of concrete and RC beams. Construction and Building Materials, 2007. 21(3): p. 654-661.
62. Boulekbache, B., et al., Flowability of fibre-reinforced concrete and its effect on the mechanical properties of the material. Construction and Building Materials, 2010. 24(9): p. 1664-1671.
63. Centonze, G., M. Leone, and M.A. Aiello, Steel fibers from waste tires as reinforcement in concrete: A mechanical characterization. Construction and Building Materials, 2012. 36(0): p. 46-57.

Chapter 3 Assessment of Post-Restrained Shrinkage Mechanical Properties of Concrete- Pilot Study
50
Chapter 3 Assessment of Post-Restrained Shrinkage Mechanical Properties of Concrete- Pilot Study
Younis, K.H. and K. Pilakoutas, Assessment of post-restrained shrinkage mechanical properties of concrete using a new test. ACI Materials journal, 2014.Submitted.
This chapter proposes a simple and economical test rig for restrained shrinkage and
associated procedures to assess the post-shrinkage mechanical properties (compressive and
flexural strength) of concrete. Free and restrained shrinkage tests were conducted and the
change of apparent restraint factor (RF) with time was determined. A simple finite element
analysis was performed to quantify the theoretical RF and the results were compared to the
apparent RF. The results show that the restraining factor of the proposed rig is dependent on
the time and the stiffness of the concrete. Results of residual mechanical properties show
that restrained shrinkage induced cracks can affect the mechanical behaviour (flexural and
compressive strength and stiffness) of concrete by up to 21%.
This chapter consists of a “stand alone” journal paper and includes relevant bibliography
at the end of the chapter. Typical results are presented in this chapter and Appendix D
provides more test results.

Chapter 3 Assessment of Post-Restrained Shrinkage Mechanical Properties of Concrete- Pilot Study
51
3.1 Introduction
Due to chemical, thermal and physical changes, concrete develops unavoidable complex
volume changes which lead to time-dependent internally induced deformations. Drying and
autogenous shrinkage are the results of such changes. Restraint against these internally
induced deformations results in stress development [1], which can lead to cracking, if such
stresses exceed the instantaneous tensile strength of concrete [2]. Cracks, induced by
restrained shrinkage, can cause issues with serviceability and structural integrity. Shrinkage
induced cracks can also compromise durability by affecting properties such as permeability,
diffusivity and sorptivity, enhancing the ingress of detrimental substances, freeze-thaw
damage, corrosion of steel reinforcement and spalling. All these premature deteriorations
and structural deficiencies often occur prior to the application of external loads. Therefore,
the excessive development of concrete cracks should be controlled at early ages [3, 4].
If there is no restraint against volume changes, no significant cracks are expected to develop.
However, all concrete elements are practically restrained to some degree, since some internal
or external restraint always exists [5]. External restraint may result from supporting elements
(e.g. walls and columns), contact with adjacent elements, and (in the case of concrete
pavements or slabs on grade) applied loads and base friction [1, 6]. Internal restraint sources
comprise of aggregates and reinforcement [7, 8]. Internal restraint can also be caused by
non-uniform drying shrinkage, which is usually caused by either moisture or temperature
gradients [1].
The best way to mitigate the effect of shrinkage deformations is to prevent the loss of
moisture and protect the concrete from rapid cooling. Nonetheless, from a practical
perspective, the complete elimination of internal deformations is impossible. Hence, it is
important to find ways of quantifying restrained strains and associated stresses so as to
account for them at the design process.
Restrained shrinkage is a major design issue for concrete pavements. Technical report No.34
of Concrete Society [9] identifies the need for shrinkage induced stresses to be included in
the design procedures of concrete industrial floors and slabs on grade. However, due to lack
of advanced knowledge and design models, in the calculation of the hogging moment
capacity of the slabs, a fixed value of restrained flexural tensile stress is subtracted from the
flexural tensile strength of the concrete irrespective of the material properties and geometry
of the element. This restrained tensile stress is calculated using free shrinkage strains.

Chapter 3 Assessment of Post-Restrained Shrinkage Mechanical Properties of Concrete- Pilot Study
52
Nonetheless, TR34 does identify that the interaction between shrinkage induced stresses and
those caused by external loading need further research.
Free shrinkage tests can provide information on the shrinkage behaviour of different
concrete mixtures, based on the environmental conditions, and size and shape of concrete
elements being assessed. However, such tests cannot provide information on the post-
cracking behaviour of concrete under restrained conditions [10-14]. Restrained shrinkage
tests help in the assessment of cracking tendencies and the ability of concrete to withstand
shrinkage induced tensile stresses [1, 2, 15].
There is no standardized test to assess the post shrinkage behaviour of concrete under
restrained conditions [10, 14, 15]. However, both the American Association of State
Highway and Transportation Officials (AASHTO in 2008) and the American Society for
Testing and Materials (ASTM in 2004) adopted the ring test [16] (see Fig. 3.1) as a standard
test for restrained drying shrinkage. Simplicity and versatility, are the main features of this
test. For a given drying environment, the ring test can provide information on the age at
cracking, the width and rate of crack width increase with time. This information can be used
to compare the cracking sensitivity of different concrete mixtures or to assess the efficiency
of materials such as fibres in controlling crack width [1, 13]. However, the test has the
following drawbacks:
a- The test does not simulate and cannot predict concrete cracking in actual service life, and
rather reflects the relative cracking tendency of concrete mixtures [13, 17, 18],
b- The strains used to calculate the elastic stresses are not measured directly from the
concrete; instead they are measured on the outer face of the steel ring (see Fig. 3.1),
assuming a linear stress distribution throughout the steel ring [1],
c- The restrained shrinkage strain obtained from the ring test cannot be compared directly
with the free shrinkage strain of prismatic specimens [19],
d- The test cannot quantify the residual strength of cracked concrete.

Chapter 3 Assessment of Post-Restrained Shrinkage Mechanical Properties of Concrete- Pilot Study
53
Figure 3. 1 Ring test apparatus.
Several other test methods for restrained shrinkage have been proposed [20]. These can be
classified by the shape of the specimen into plate or linear tests [21], with the former
providing biaxial restraint, whereas the latter providing uniaxial restraint. In linear tests, the
ideal configuration to provide full restraint against shrinkage strains is to rigidly fix the
concrete specimen at its ends (see Fig. 2a). This is practically impossible since an infinitely
stiff reaction frame and fixity/gripping system is required. Therefore, other more practical
solutions have been attempted using 'passive' (Fig. 2b) and 'active' restraint control (Fig. 2c)
[20].
Figure 3. 2 (a-c) Schematics of previously attempted configurations to simulate restrained shrinkage, (d-f) End gripping arrangements.
In linear-passive tests (e.g. RILEM test [22]), the restraint is provided by stiff steel sections
or by embedding restraining steel reinforcement bars in the specimen ends (the bar being
Section A-A
A
A
Strain Gauges (4)
Sheet Metal Form
Wooden Base
Steel Ring
Concrete Specimen
(a) Ideal
ConcreteFixed end
(b) PassiveReaction rods
Concrete
(c) Active
Actuator Concrete
(d)
(e)
(f)

Chapter 3 Assessment of Post-Restrained Shrinkage Mechanical Properties of Concrete- Pilot Study
54
debonded in the middle part only) [2, 23, 24]. Passive tests usually provide partial, often
unknown, level of restraint. In linear-active tests, one end is fixed (restrained) and the other
is left free [20]. The free end is either manually adjusted using a screw [25, 26] or using an
actuator [27], but these can be fully/actively computer controlled to simulate full fixity [28]
(provided the gripping system is rigid). This method has the merit of quantifying tensile
creep strains and is used by others [15, 29, 30].
Different mechanisms can be used to grip the ends of the concrete specimen. These
mechanisms include:
1- bolt anchors using a number of steel threaded bars at the end of the concrete specimen
(see Fig. 2d) [31, 32],
2- lateral clamping utilizing steel plates and threaded bars at the ends of the specimen to
clamp the ends against the reaction frame (see Fig. 2e) [14],
3- fixity using enlarged end specimen to fit into steel grip reaction at the ends (e.g. dog-
bone, see Fig. 2f) [22, 28].
4- epoxy to bond the concrete specimen to end supports and the reaction rig [33].
From linear tests, a variety of concrete properties can be obtained such as: shrinkage (drying
and autogenous) strain and stress, age of cracking, crack width, creep strain of concrete,
development of tensile stress with time and degree of restraint. From a practical point of
view when many parameters are needed to be examined, the setting up of such tests and their
instrumentation can be complicated and expensive. Automatic strain measurements are also
difficult since cracking positions are not known a-priori. The small dimensions of the
specimens used in some of these tests, mainly to reduce costs, is also another issue, since
they limit the use of normal size coarse aggregates. In fact, in some of these tests no coarse
aggregate is used at all [18]. Another issue to consider is how to dismount the concrete
specimen at the end of the drying exposure time without destroying it. As a result of these
difficulties, such tests are avoided in common quality control testing and large-scale
parametric study investigations [1, 19, 34].
The impact of shrinkage induced cracks due to external restraints on the mechanical
properties (compressive strength, flexural strength and stiffness) of concrete is not well
studied and in fact, there is no standard experimental procedure to quantify the effect of
shrinkage cracks on these properties. Nonetheless, these are the most important properties

Chapter 3 Assessment of Post-Restrained Shrinkage Mechanical Properties of Concrete- Pilot Study
55
needed to design restrained concrete elements, such as slabs on grade. For this reason, the
current study attempts to develop a simple and economical test rig for restrained shrinkage
and a procedure that can quantify the post-shrinkage residual mechanical properties of
concrete.
The proposed rig is presented next followed by details of the experimental procedure used to
evaluate its effectiveness. These are followed by a critical discussion of the results and
recommendations for improvements.
3.1.1 Research Significance
Cracking due to restrained shrinkage is a major concern for both serviceability and durability
of concrete. To account for such issues at the design process, quantifying restrained strains
and associated stresses are crucial. The absence of a standard or a practice test to quantify
the effect of shrinkage induced cracks on the mechanical properties of concrete complicates
the issue. This study is an attempt to develop a new restrained shrinkage test and a procedure
to quantify the post-shrinkage residual mechanical properties.
3.2 Proposed Restrained Shrinkage Test Rig
For a restrained shrinkage test, a suitable starting point was found in the configuration used
by Weiss et al, [14] that aimed at developing a test method for assessing the shrinkage
cracking potential of normal and high strength concrete (with and without fibres) for
pavement applications (see Fig. 3.3). Nonetheless, the section size used by Weiss et al was
only 25 mm and hence, a deeper specimen is required to: 1) enable the use of coarse
aggregate (20 mm), 2) to allow the specimens to be used for flexural tests (e.g the ASTM
C1018-97). However, the increase in depth requires more effective end restraint conditions.
Furthermore, the test-rig should allow the demoulding of the concrete specimens at an early
stage and the demounting at the end of the restraining period.
Figure 3. 3 Geometry of the restraining rig used by Weiss et al.[14]
100x75x1000 mm Structural Steel Tube
Clamping plate
Concrete (depth=25 mm)
End supportThreaded rods

Chapter 3 Assessment of Post-Restrained Shrinkage Mechanical Properties of Concrete- Pilot Study
56
Fig. 3.4 shows the general layout of the developed rig. Fig. 3.5 shows a photo of the rig and
mould during the assembly stage.
Figure 3. 4 Front view of the developed rig for restrained shrinkage test.
Figure 3. 5 The developed rig after manufacturing.
The new set up consists of a reaction beam (I-section) with sufficient dimensions to provide
enough stiffness (at least 4 times the stiffness of hardened concrete) to resist axial
shortening. The reaction beam is 1m long with its upper flange polished to provide a smooth
and slippery surface to ensure that the restraint only develops at the ends. Two L-shaped
steel supports are bolted to the flange to provide restraint at the ends of the concrete
specimen. The concrete ends are fixed to the steel angles by four bolts split at the ends to
increase their ability to grip the concrete. These bolts will enable easy dismounting of the
concrete specimen after the completion of the drying period.
The concrete section is reduced from 130 mm to 100 mm away from the supports to avoid
crack formation at the anchorage zone. Furthermore, to achieve a more uniform drying
condition around the concrete section, removable framework is used to separate the bottom
of the concrete surface from the steel surface. To achieve this, a timber plate (15 mm thick
Sec. A-A

Chapter 3 Assessment of Post-Restrained Shrinkage Mechanical Properties of Concrete- Pilot Study
57
and 530 mm long with curved ends) cut into three parts with a wedge at the mid-section is
used to ensure easy removal (24h) after casting the concrete specimen. A similar plate is
used on the top face.
The proposed rig was used in trial tests described below to assess its effectiveness in
quantifying the post-shrinkage residual mechanical properties of concrete.
3.3 Materials and Experimental Procedure
3.3.1 Materials and specimen preparation
Portland Cement CEM I 52.5 N, meeting the requirements of BS EN 197:2009 [35] was
used in this research. The fine aggregate used in this study was sand with a maximum size of
5 mm. The coarse aggregate was river aggregate with maximum size of 20 mm.
The mix proportion was cement: water: sand: gravel= 390:176:560:1111 (kg/m3) with w/c
ratio 0.45.
In the moulds, the concrete was cast in three layers, and each layer was compacted using the
vibrating table. The specimens were then covered by plastic sheet and allowed to cure for 24
hours before being demoulded. A slightly shorter (500 mm long) control prism was stored in
water and a second control prism (750×100×100 mm) for free shrinkage test was stored next
to the restrained specimen at 22 ±2 oC and RH of 45 ±5 %. Furthermore, 15 cubes (100 mm)
were cast to determine the compressive strength at different times.
Immediately after demoulding, Demec gauge points were fixed to the concrete surface at 50
mm spacing (see Fig. 3.6) using a rapid-hardening adhesive on the top and side surfaces.
Figure 3. 6 Distribution of Demec points for restrained specimen.
Top target points Side target points

Chapter 3 Assessment of Post-Restrained Shrinkage Mechanical Properties of Concrete- Pilot Study
58
3.3.2 Tests
3.3.2.1 Free and Restrained Shrinkage
Three Demec gauges were used to measure strains having lengths of (50, 100 and 300 mm
and precision of 20, 16 and 5.2 µɛ. The first shrinkage strains were measured at 24 h (soon
after the adhesive hardened) and at 24 h intervals for the first week, followed by
measurements at 10,14, 21 and 28 days. Two or three readings were taken for each gauge
length, and the average values calculated.
According to ACI 207.2R-95 [36] the degree of restraint or restraint factor (RF) is given as
the ratio of actual stress induced by the restrained volume change to the stress which would
develop if the specimen was fully restrained. In other words, it is a ratio between the
amount of strain that is restrained to the free shrinkage strain [37, 38]. Assuming the
modulus of elasticity is constant, equation 3-1 can be used to calculate the RF:
free
R
εε
= RF (3-1)
where:
ɛR Restrained shrinkage strain = shrinkage strain measured on the free specimen - shrinkage strain measured on the restrained specimen.
ɛfree Free shrinkage strain (strain measured on the free specimen).
CRACK DETECTION
Regular daily checks for cracks were performed using an optical microscope with a
magnification factor of 40x and a precision of 20 µm and a digital microscope with a
magnification up to 200x and a precision of 10 µm. The crack width reported here is the
crack opening at its widest, normally at the edge of the specimen.
There is no clear definition of what is a microcrack in the literature. RILEM committee (TC-
122-MLC on ''Microcracking and life time performance of concrete'', cited in [39]) uses
width of less than 10 microns to define microcracks. Others [39-41] adopt 50 microns. In
this study 20 microns or less was used to define the microcracks, as it was found that cracks
with width larger than 20 microns are visible to the naked eye when properly illuminated.

Chapter 3 Assessment of Post-Restrained Shrinkage Mechanical Properties of Concrete- Pilot Study
59
3.3.2.2 Loss of Mass (loss of moisture)
The loss of mass for the free shrinkage specimen was determined using a balance with the
precision of 0.1 g. The first reading, which is considered as the initial mass, was measured at
24 h, after the Demec points were bonded. Thereafter, the readings were obtained at the
same time intervals as for the free shrinkage measurements.
3.3.2.3 Compressive Strength
The compressive strength was obtained at 1, 3, 7, 28 and 75 days using the (100 mm cubes)
and BS EN 12390-3 [42]. The compressive strength was also obtained from the two prisms
(free and restrained) tested in bending, by following the recommendations of BS 1881-119
[43].
3.3.2.4 Flexural tests
All prisms were tested in four-point loading over a length of 300 mm following the
recommendations of the ASTM C1018 (1997) [44] using a universal testing machine in
displacement control. A yoke was used to mount the deflection transducers and to eliminate
errors from support displacement and torsion. The central deflections were determined from
the average of two linear variable displacement transducers (LVDTs) placed on opposite
sides of the specimen. From the load versus-deflection curve, the flexural strength and
stiffness were calculated. Equation 3-2 was used to determine the flexural modulus of
elasticity Eflex (GPa) from the stiffness, based on the theory of classical elasticity.
( )
+
+= ν
δ1
1152161.
129623)(
23
flex Lh
ILPGPaE (3-2)
where :
P/δ is the slope of the linear elastic part of the load-deflection curve (kN/mm); L is the
supported span of the prism (mm); I is the second moment of area of the cross-section
(mm4); b is the width of the cross-section (mm); h is the height of the cross-section (mm);
and ν is the Poisson's ratio. The flexural elastic modulus of concrete (Efmax) was determined
as the maximum value of Eflex in the range of 30% to 60% of the ultimate bending load (see
Appendix D).

Chapter 3 Assessment of Post-Restrained Shrinkage Mechanical Properties of Concrete- Pilot Study
60
3.4 Experimental Results and Discussion
3.4.1 Free Shrinkage Strains
Fig. 3.7 and Fig. 3.8 show the results of free shrinkage strain using the three gauge lengths
50, 100 and 300 mm taken from the side and top surfaces, respectively. As expected the
shrinkage rate is high at the early age slowing down with time; the shrinkage strain after one
week was almost 40% of that measured at 75 days. Fig. 3.7 and Fig. 3.8, also show that the
measured strains using the different gauge lengths are similar.
Figure 3. 7 Free shrinkage strains of the side surface
Figure 3. 8 Free shrinkage strain of the top surface.
The shrinkage strains measured on the top surface of the concrete specimen are slightly
higher than those measured on the side surface. This may be due to concrete bleeding which
usually happens at the top (trowelled) surface altering the microstructure of this surface and
possibly resulting in slightly higher porosity which in turn causes more shrinkage.
0
100
200
300
400
500
600
0 10 20 30 40 50 60 70 80
Shrin
kage
str
ains
(µɛ)
Drying time (day)
Average/50 mm - Side
Average/100mm- Side
Average/300mm- Side
0
100
200
300
400
500
600
0 10 20 30 40 50 60 70 80
Shrin
kage
str
ains
( µɛ
)
Drying time (day)
Average/50 mm-Top
Average/100mm- Top
Average/300mm- Top

Chapter 3 Assessment of Post-Restrained Shrinkage Mechanical Properties of Concrete- Pilot Study
61
Furthermore, concrete is better compacted at bigger depths resulting in more dense concrete,
which tends to shrink less.
3.4.2 Restrained Shrinkage Strains, RF and Characterisation of Cracks
The shrinkage strains measured on the side of the concrete specimen are shown in Fig. 3.9
(for 50 mm gauge length) and in Fig. 3.10 (for the 300 mm gauge length). Fig. 3.10
represents the average shrinkage strains that occurred over time for 14 individual distances.
The development of large strains on the restrained sample indicates that the developed rig
only provides partial restraint.
Figure 3. 9 Shrinkage strains of the restrained specimen using 50 mm gauge length.
Figure 3. 10 Shrinkage strains of the restrained specimen using 300 mm gauge length.
Fig. 3.11 shows that the RF was 64% on the first day. After 5 days of drying, it decreased to
almost 46%. Thereafter, it decreased to 21% at 28 days and around 14% at 75 days.
0
100
200
300
400
500
0 5 10 15 20 25 30 35 40 45 50 55 60 65 70 75
Shrin
kage
str
ain
(με)
Drying time (day)
Restrained
Free
15 379111324681012
0
100
200
300
400
500
0 5 10 15 20 25 30 35 40 45 50 55 60 65 70 75
Shrin
kage
str
ain
(με)
Drying time(day)
12Free
15 3791113 12

Chapter 3 Assessment of Post-Restrained Shrinkage Mechanical Properties of Concrete- Pilot Study
62
Microcracks occurring at the ends of the sample also reduce the restraint efficiency, resulting
in a lower degree of apparent restraint.
Figure 3. 11 RF calculated from the strains measured (on the side of the specimen) using 300mm gauge length.
After 1 day of drying, the first microcracks were detected at several positions using the
digital micro-scope. A slight reduction in the shrinkage strain was observed (see Fig. 3.11)
after 7 days of drying, though no visible cracks were observed. Such a reduction can only be
due to cracks developing further. After 9 days of drying few visible cracks were recorded at
the top edges of the specimen. The width of the visible cracks were in the range of (0.025-
0.035) mm when first detected. Similar observations were reported by Grzbowski and Shah
[10] and Weiss et al [14] during the monitoring of restrained concrete specimens (ring type),
as they noticed a decrease in the strain measured on the steel ring prior to the detection of
cracks. Many microcracks were detected by the microscopes, but only 10 visible cracks were
observed. Details on the visible cracks at 75 days are summarized in Table 3.1.
0.0
0.2
0.4
0.6
0.8
1.0
0 5 10 15 20 25 30 35 40 45 50 55 60 65 70 75
Rest
rain
t Fac
tor
Drying time (days)
RF (300 mm -side)

Chapter 3 Assessment of Post-Restrained Shrinkage Mechanical Properties of Concrete- Pilot Study
63
Table 3. 1 Cracking time and width and length of cracks (Note: 1mm = 0.04in).
Crack code
Drying time
(day)*
Crack width (mm) Crack length (mm)
Initial Final ** Initial Final ***
1 9 0.025 0.055 15 43
2 9 0.025 0.035 12 32
3 9 0.025 0.045 10 35
4 9 0.025 0.04 12 30
5 10 0.035 0.045 11 38
6 11 0.025 0.04 11 25
7 11 0.025 0.04 12 28
8 11 0.025 0.045 12 30
9 11 0.02 0.04 12 33
10 11 0.02 0.04 11 30
* Drying time when the crack is visible. ** Crack width at age 75 days. *** Crack length at age 75 days.
Crack growth was very slow (see Table 3.1). The maximum crack width measured was
55µm (crack 1) at the age of 75 days. Although visible cracks developed on both sides of the
restrained specimen, none of them propagated and turned into a through crack. This can be
attributed to the following reasons: a- the cracks that formed at the ends of the specimen
may have reduced the degree of restraint, b- the slow rate of shrinkage strain development
after the first week of exposure, c- the effect of tensile creep which can serve to relax
shrinkage stresses.
The distribution of the cracks at age 75 day is shown in Fig. 3.12.

Chapter 3 Assessment of Post-Restrained Shrinkage Mechanical Properties of Concrete- Pilot Study
64
Figure 3. 12 Crack distribution at day 75 on the sides of the restrained specimen.
Microcracks were also observed on the surfaces of the free shrinkage specimens. These
randomly distributed discontinuous cracks had a net shape and developed at different areas
on the surfaces of the concrete. The larger crack width at day 75 was 0.02 mm. The main
cause of such cracks is internal restraint (differential drying) caused by moisture gradient.
3.4.3 Mass Loss
Mass loss versus time is presented in Fig. 3.13a. It can be seen that mass loss is faster at the
early stages, behaving in the same way as shrinkage. Nonetheless, when shrinkage strain is
plotted against mass loss (see Fig. 3.13b), a different trend can be seen as the initial rate of
mass loss is much faster than the shrinkage strain rate. This may be due to the fact that
during the first week, though moisture is lost at a higher rate, this moisture is being lost from
coarse pores, resulting in relatively low shrinkage due to low capillary pressures. With
further drying, finer pores start to lose moisture, causing higher capillary pressure, thus
resulting in higher shrinkage for a smaller mass loss.
Side 1
Side 2
4 83
59 1 2 6710
Visible cracks (width 0.035-0.055 mm)
non-visible part of the visible cracks

Chapter 3 Assessment of Post-Restrained Shrinkage Mechanical Properties of Concrete- Pilot Study
65
Figure 3. 13 a-Evolution of mass loss of the free sample, b- Mass loss against shrinkage strain
3.4.4 Effect of strain loss on RF and cracking development
It is evident from the recorded strain loss on the prisms that the rig only offers partial
restraint. Strain loss may occur due to deformations of the restraining beam (bending and
contraction) and the end supports (L-shape) caused by the tensile force applied by the
restrained concrete (see Fig. 3.14). Finite element elastic analysis (Fig. 3.15) shows that the
greatest part of strain loss is caused by the deformation of the end supports. For example, the
magnitude of the expected tensile force resulting from a 100 με shrinkage strain (Ec=26
GPa), will lead to a strain loss of 20 με due to shortening and 43 με due to beam bending.
The same force would also pull-in the end supports with a corresponding strain loss of 200
με. Part of these elastic strain losses will be counteracted by the creep effect.
Figure 3. 14 Schematic representation the deformations of the rig caused by the restrained shrinkage of concrete.
0.0
0.4
0.8
1.2
1.6
2.0
0 8 16 24 32 40 48 56 64 72 80
Mas
s lo
ss (%
)
Drying time (day)
(a)
0
100
200
300
400
500
600
0.0 0.2 0.4 0.6 0.8 1.0 1.2 1.4 1.6
Shrin
kage
str
ain
( με)
Mass loss (%)
(b)
5 3F F

Chapter 3 Assessment of Post-Restrained Shrinkage Mechanical Properties of Concrete- Pilot Study
66
Figure 3. 15 Finite element analysis a-stresses , b- strains.
To estimate the variation of the RF over time and compare it with the apparent (measured)
RF (Fig. 3.11), the ratio between the stiffness of the concrete and the rig must be known.
This can be determined by using equilibrium and compatibility conditions. Equation 3-3
represents the equilibrium equation of the forces that develop in the concrete (tensile force,
Fc or Frig) due to restrained shrinkage.
rigc FF = (3-3)
rigrigrigccc AEAE εε = (3-4)
where:
Ec, Erig = elastic modulus of concrete and rig, respectively.
Ac, Arig = cross-sectional area of concrete and rig, respectively .
εc = restrained shrinkage strain.
εrig = strain developed in the rig due to shrinkage induced forces.
c
rig
rigrig
cc
AEAE
εε
= (3-5)
if rigrig
cc
AEAE
K = (3-6)
then c
rigKεε
= (3-7)
(a) (b)
Chapter 3 Assessment of Post-Restrained Shrinkage Mechanical Properties of Concrete- Pilot Study
67
Hence, the stiffness ratio (K) between the concrete and the restraining rig is equal to the ratio
of the restrained shrinkage strain of concrete (εc or εR), which results in developing a
tensile force inside the concrete, to the strain of the rig (strain loss, εrig) caused by the same
force (see Fig. 3.16).
Figure 3. 16 Shrinkage induced strains (deformations) in concrete and rig.
From Fig. 3.16, the strain compatibility equation can be developed as follows:
freerigc εεε =+ (3-8)
From equation (3-7):
crig Kεε = (3-9)
Then: freecc K εεε =+ (3-10)
Kor free
Rc +=
1ε
εε (3-11)
Since, free
RRFεε
= (eq. 3-1)
Then, the estimated RF is: K
RF+
=1
1 (3-12)
Equation 3-12 can be used to assess the effect of Ec on the estimated RF. By using the same
previous example for Ec =26 GPa, K is 2.63 and the estimated RF at this particular concrete
stiffness is 0.28. Fig. 3.17 shows the effect of the Ec on the estimated RF by substituting
εfree
εc orεR εrig
strain loss
(a) before drying
(b) freeshrinkage
(c) full restraint
(d) partial restraint
Tensile stresses

Chapter 3 Assessment of Post-Restrained Shrinkage Mechanical Properties of Concrete- Pilot Study
68
different values of Ec in equation (3-12). The trend of the curve in the Fig. 3.17 is natural, as
an increase in Ec results in a higher restraining force and higher strain loss; hence decreasing
the RF.
Figure 3. 17 Effect of elastic modulus of concrete (Ec) on the estimated RF (Note: 1 GPa = 145 ksi).
The above relationship can be used to determine the variation of the estimated RF over time.
This can be done if the development of Ec over time is known. Ec can be linked to
compressive strength by using equations such as those given by Eurocode-2 [45] and the
development of the compressive strength with time is known from the measurements, as
shown in Fig. 3.18.
Figure 3. 18 Development of compressive strength (Note: 1 MPa = 145 psi).
0.0
0.2
0.4
0.6
0.8
1.0
0 10 20 30 40 50
Estim
ated
RF
Ec (GPa)
y = 8.57ln(x) + 22.28R² = 0.99
0
1
2
3
4
5
6
7
8
0
10
20
30
40
50
60
0 10 20 30 40 50 60 70 80
Com
pres
sive
Stre
ngth
×10
3 (p
si)
Com
pres
sive
Stre
ngth
(MPa
)
Age (day)

Chapter 3 Assessment of Post-Restrained Shrinkage Mechanical Properties of Concrete- Pilot Study
69
Fig. 3.19 shows the variation of the estimated and apparent RF over time. It can be seen that
the apparent RF is higher than the estimated RF (up to 25days). This may be attributed to the
fact that the estimated RF does not include the effect of tensile creep/relaxation which
reduces the tensile stress, resulting in a lower stain loss and consequently higher RF. Once
the concrete cracks, the concrete stiffness is reduced and the apparent RF increases
temporarily as a consequence.
Figure 3. 19 Variation of estimated and measured RF over time.
Fig. 3.20 shows the variation over time of the ratio of the estimated elastic tensile stress to
the instantaneous predicted tensile strength of concrete. The predicted tensile strength is
obtained using Eurocode 2 model for development of compressive strength [45]. The tensile
stress developed in the concrete is calculated based on the RF, free shrinkage and Ec (
product of: RF× freeε × Ec). It can be seen that the developed stress using the estimated RF
leads to a lower stress/strength ratio than that of apparent (measured) RF. This may again be
attributed to creep effects. A high stress/ strength ratio (around 0.75) can also be seen
developing at early stages of drying and, this ratio increased to 0.98 at 7 days. This predicts
very well the time of development of the first crack, which became visible after 9 days of
drying.
0.0
0.2
0.4
0.6
0.8
1.0
0 5 10 15 20 25 30
Rest
rain
t Fac
tor (
%)
Drying time (day)
Estimated RF
Apparent RF

Chapter 3 Assessment of Post-Restrained Shrinkage Mechanical Properties of Concrete- Pilot Study
70
Figure 3. 20 Variation of stress/strength ratio over time.
3.4.5 Compressive Strength
Almost all previous studies utilized uniaxial compression strength to quantify the effect of
drying on concrete mechanical properties. The results of the compressive strength for the
water cured cubes (WC/cubes) and portions of tested prisms (WC/prism) and the residual
compressive strength of the free and restrained specimens at 77 days, are shown in Fig. 3.21.
The result is the average of 3 samples for the cubes and 2 samples for the prisms. The
compressive strength (cubes) at 28 days was 52.5 MPa. It can be seen that the compressive
strength of the concrete exposed to restrained shrinkage reduced by 19% in comparison to
that of WC/prisms and 14% in comparison to the free specimen.
Figure 3. 21 Results of compressive strength. (Note: 1 MPa = 145 psi).
0.0
0.2
0.4
0.6
0.8
1.0
0 5 10 15 20 25 30
Tens
ile S
tres
s/Te
nsile
Str
engt
h
Drying times (days)
Estimated
Apparent
57.6 56.6
53.1
45.7
0
2000
4000
6000
8000
30
35
40
45
50
55
60
WC/cubes WC/prism Free Restrained
Com
pres
sive
Stre
ngth
at 7
7 da
ys (p
si)
Com
pres
sive
Stre
ngth
at 7
7 da
ys
(MPa
)
Specimen Type

Chapter 3 Assessment of Post-Restrained Shrinkage Mechanical Properties of Concrete- Pilot Study
71
The mechanical properties (strength and stiffness) of concrete may be affected by the drying
shrinkage (without external restraint) in two ways. On the one hand, the strength increases as
a result of an increase in capillary pressure (which acts as isotropic pressure) on the C-S-H
particles when the saturation decreases. This can lead to a stiffening effect by increasing the
bonding between the C-S-H particles [46] [47] [48] . On the other hand, the strength and the
stiffness decrease due to the formation of microcracks (which develop due to non-uniform
shrinkage, enhanced by local restraint by the aggregates) [46]. In these tests it is clear that
shrinkage cracks were dominant in reducing the compressive strength.
3.4.6 Flexural Strength and Flexural Elastic Modulus
The load-deflection curves of water cured (control) specimen, free specimen and restrained
shrinkage specimen are shown in Fig. 3.22. The unrestrained air and water cured specimens
behave in a similar manner having similar flexural stiffness (around 40GPa) and similar
strength (air 5.94 MPa and water 6.21 MPa). The restrained specimen only reached around
82% (4.89 MPa) of that of unrestrained specimen. This means that the restrained shrinkage
induced cracks caused a reduction of around 18% in its flexural strength. These cracks not
only affected the strength, but also reduced the initial stiffness (flexural modulus of
elasticity). Fig. 3.23 shows the estimated flexural modulus of elasticity (Eflex) against the
bending load. The Efmax is normally determined in the range of 30-60 % of the ultimate
bending load (linear part of the load-deflection curve where Eflex is almost constant). The
Efmax of the restrained specimen (31.6 GPa) is lower than that of both the free shrinkage
(40.5 GPa) and the control specimen (40.0 GPa). Restrained shrinkage induced cracks led to
around 21% loss in flexural stiffness affecting the stiffness in exactly the same way as the
strength.
Figure 3. 22 Mid -span deflection versus bending load (Note: 1 kN=224.8 lb).
0
1000
2000
3000
4000
5000
0
4
8
12
16
20
24
0 0.01 0.02 0.03 0.04 0.05 0.06 0.07 0.08
Load
(lb)
Load
(kN
)
Mid span deflection (mm)
Free
Restrained-
Water Cured

Chapter 3 Assessment of Post-Restrained Shrinkage Mechanical Properties of Concrete- Pilot Study
72
Figure 3. 23 Flexural elastic modulus (Eflex) versus bending load (Note 1 GPa= 145 ksi).
3.4.7 General Discussion
The proposed rig for restraining concrete only provided a variable RF which started for
around 0.64 and ended up at around 0.2. The drop of RF with time can be explained by the
development of the concrete stiffness. The rig managed to provide enough restrain to lead to
concrete cracking due to exceedance of the flexural strength around 7 days. More restraint
will help, but it is unlikely that the effect on residual stiffness will be great since it is clear
that concrete autoheals. Nonetheless, most of the strain loss is a result of rig deformations
and an improved rig needs to be developed. To counteract the change in RF with time, the
rig could be prestressed before concrete casting and the stress released as the concrete
hardens.
3.5 Conclusions
This paper proposes a new rig and a test procedure to assess the post shrinkage cracking
mechanical behaviour of concrete. Results from bending and compression tests showed that
restrained shrinkage induced cracks can affect the mechanical behaviour (flexural and
compressive strength and flexural stiffness) of concrete by up to 21%. However, this was a
very limited proof-of-concept study and more tests are required to validate this conclusion.
The proposed rig only provided partial restraint and proposals for improvements are made.
The RF was shown to vary with time due to the concrete strength/stiffness evolution and
crack development.
0
1000
2000
3000
4000
5000
6000
7000
8000
0
10
20
30
40
50
0 2 4 6 8 10 12 14 16 18 20 22
E fle
x(k
si)
E fle
x(G
Pa)
Load (kN)
Free
Restrained
Water cured

Chapter 3 Assessment of Post-Restrained Shrinkage Mechanical Properties of Concrete- Pilot Study
73
References
1. ACI 231R-10, Report on Early-Age Cracking: Causes, Measurement, and Mitigation, in ACI Committee 231. 2010, American Concrete Institute: Farmington Hills, U.S.A.
2. Carlson, R.W., Attempts to Measure the Cracking Tendency of Concrete ACI, 1940. 36: p. 533-537.
3. Hughes, B.P., A new look at rigid concrete pavement design. Proceedings of the Institution of Civil Engineers-Transport, 2003. 156(1): p. 29-36.
4. Bishop J., The early age Behaviour of Concrete Industrial Ground Floor Slabs. 2001, loughborough University: loughborough, UK
5. ACI 207.2R, Report on Thermal and Volume Change Effects on Cracking of Mass Concrete, A.C. 207, Editor. 2002, American Concrete Institute: Farmington Hills, U.S.A.
6. Banthia, N. and R. Gupta, Influence of polypropylene fiber geometry on plastic shrinkage cracking in concrete. Cement and Concrete Research, 2006. 36(7): p. 1263-1267.
7. Mehta, P.K. and P.J.M. Monteiro, Concrete: Microstructure, Properties, and Materials. 2006, New York: McGraw-Hill.
8. Bisschop, J. and J.G.M. Van Mier, Effect of aggregates on drying shrinkage microcracking in cement-based composites. Materials and Structures/Materiaux et Constructions, 2002. 35(252 SPEC.): p. 453-461.
9. Concrete Society TR 34, Concrete Industrial Ground Floors - A Guide to their Design and Construction. 2003, Concrete Society. : Surrey,UK
10. Grzybowski, M. and S.P. Shah, Model to Predict Cracking in Fiber Reinforced-Concrete Due to Restrained Shrinkage. Magazine of Concrete Research, 1989. 41(148): p. 125-135.
11. Swamy, R.N. and H. Stavrides, Influence of Fiber Reinforcement on Restrained Shrinkage and Cracking. Journal of the American Concrete Institute, 1979. 76(3): p. 443-460.
12. Tritsch, N., Darwin, D. and Browning, J.A. , Evaluating shrinkage and cracking behaviour of concrete using restrained ring and free shrinkage tests. 2005, Structural Engineering and Engineering Materials,The University of Kansas Center for Research Inc.: Lawrence, Kansas.
13. Carlsward J. , Shrinkage Cracking of Steel Fibre Reinforced self compacting Concrete Overlays, in Department of civil and Environmental Engineering. 2006, Lulea University of Technology: Lulea,Sweden.
14. Weiss, W.J., W. Yang, and S.P. Shah, Shrinkage cracking of restrained concrete slabs. Journal of Engineering Mechanics-Asce, 1998. 124(7): p. 765-774.
15. Altoubat, S.A. and D.A. Lange, Creep, shrinkage, and cracking of restrained concrete at early age. ACI Materials Journal/ SP, 2001. 98(4): p. 323-331.
16. Carlson, R.W., Cracking of Concrete. The Boston Society of Civil Engineers, 1942. 29(2): p. 98-109.

Chapter 3 Assessment of Post-Restrained Shrinkage Mechanical Properties of Concrete- Pilot Study
74
17. Banthia, N., C. Yan, and S. Mindess, Restrained shrinkage cracking in fiber reinforced concrete: A novel test technique. Cement and Concrete Research, 1996. 26(1): p. 9-14.
18. Qiao, P., McLean, D. and Zhuang, J.,, Mitigation Strategies for Early-Age Shrinkage Cracking in Bridge decks. 2010, Department of Civil and Environmental Engineering , Washington State University: Pullman, Washington. .
19. Tongaroonsri, S. and S. Tangtermsirikul, Effect of mineral admixtures and curing periods on shrinkage and cracking age under restrained condition. Construction and Building Materials, 2009. 23(2): p. 1050-1056.
20. Bentur, A. and K. Kovler, Evaluation of early age cracking characteristics in cementitious systems. Materials and Structures, 2003. 36(3): p. 183-190.
21. Bentur, A., Early Age Cracking Tests, in Early Age Cracking in Cementitious Systems - Report of RILEM Technical Committee 181-EAS - Early age shrinkage induced stresses and cracking in cementitious systems, A. Bentur, Editor. 2003, RELIM. p. 241-255.
22. Springenschmid, R., Breitenbucher, R., Mangold, R.,. Development of the cracking frame temperature-stress testing machine, . in Thermal Cracking in Concrete at Early Ages 1994. Proceedings RILEM Symposium E&FN SPON.
23. JCI, Committee Report: Technical Committee on Autogenous Shrinkage of Concrete in AUTOSHRINK'98, Worshop on Autogenous Shrinkage of Cocncrete, E. Tazawa, Editor. 1998, Japan Concrete Institute Japan. p. 5-66.
24. Collins, F. and J.G. Sanjayan, Cracking tendency of alkali-activated slag concrete subjected to restrained shrinkage. Cement and Concrete Research, 2000. 30(5): p. 791-798.
25. Bloom, R. and A. Bentur, Free and Restrained Shrinkage of Normal and High-Strength Concretes. Aci Materials Journal, 1995. 92(2): p. 211-217.
26. Springenschmidt, R., Prevention of Thermal Cracking in Concrete at Early Ages—State of the Art Report. 1998, London: E&FN Spon.
27. Paillere A. M., B.M., Serrano J. J. ,, Effect of Fiber Addition on the Autogenous Shrinkage of Silica Fume. ACI Materials Journal, 1989. 86(2): p. 6.
28. Kovler, K., Testing System for Determining the Mechanical-Behavior of Early Age Concrete under Restrained and Free Uniaxial Shrinkage. Materials and Structures, 1994. 27(170): p. 324-330.
29. Igarashi, S., A. Bentur, and K. Kovler, Stresses and creep relaxation induced in restrained autogenous shrinkage of high-strength pastes and concretes. Advances in Cement Research, 1999. 11(4): p. 169-177.
30. Igarashi, S., A. Bentur, and K. Kovler, Autogenous shrinkage and induced restraining stresses in high-strength concretes. Cement and Concrete Research, 2000. 30(11): p. 1701-1707.
31. Carlsward, J., Shrinkage Cracking of Steel Fibre Reinforced self compacting Concrete Overlays, in Department of civil and Environmental Engineering. 2006, Lulea University of Technology: Lulea,Sweden.
32. Banthia, N., M. Azzabi, and M. Pigeon, Restrained Shrinkage Cracking in Fiber-Reinforced Cementitious Composites. Materials and Structures, 1993. 26(161): p. 405-413.

Chapter 3 Assessment of Post-Restrained Shrinkage Mechanical Properties of Concrete- Pilot Study
75
33. Leung, C.K.Y., et al., A new testing configuration for shrinkage cracking of shotcrete and fiber reinforced shotcrete. Cement and Concrete Research, 2006. 36(4): p. 740-748.
34. Hossain, A.B., and Weiss, W. J., , Assessing Residual Stress Development and Stress Relaxation in Restrained Concrete Ring Specimens. Cement and Concrete Composites, 2004. 26: p. 531-540.
35. BS EN 197-1:2011, Cement. Composition, specifications and conformity criteria for common cements. 2011, British Standard Institution: London, UK.
36. ACI 207.2R-95, Effect of Restraint, Volume Change, and Reinforcement on Cracking of Mass Concrete, A.C. 207, Editor. 1995, American Concrete Institute: Farmington hills, MI, USA. p. 47.
37. Leung, C., A. Lee, and R. Lai, New Testing Procedure for Shrinkage Cracking of Fiber-Reinforced Shotcrete. Journal of Materials in Civil Engineering, 2007. 19(3): p. 214-218.
38. Abbasnia, R., P. Godossi, and J. Ahmadi, Prediction of restrained shrinkage based on restraint factors in patching repair mortar. Cement and Concrete Research, 2005. 35(10): p. 1909-1913.
39. Idiart, A.E., Coupled analysis of degradation processes in concrete specimens at the meso-level, in Geotechnical Engineerin and Geosciences. 2009, Polytechnic University of Catalunya: Barcelona.
40. Bisschop Jan, Drying Shrinkage Microcracking in Cement-based Materials, in Civil engineering and Geoscience. 2002, Delft University of Technoloy: Delft, Netherlands.
41. Shiotani, T., J. Bisschop, and J.G.M. Van Mier, Temporal and spatial development of drying shrinkage cracking in cement-based materials. Engineering Fracture Mechanics, 2003. 70(12): p. 1509-1525.
42. BS EN 12390-3:2009, Testing hardened concrete Part 3: Compressive strength of test specimens. 2009, British Standards Institution: London.
43. BS 1881-119:2011, Testing concrete. Method for determination of compressive strength using portions of beams broken in flexure (equivalent cube method). 2011, BSI: London-UK. p. 12.
44. ASTM-C1018-97, Standard Test Method for Flexural Toughness and First-Crack Strength of Fiber-Reinforced Concrete (Using Beam With Third-Point Loading). 1997, ASTM International.
45. BS EN 1992-1-1:2004, Eurocode 2: Design of concrete structures — Part 1-1: General rules and rules for buildings 2004, British Standard Institution: London, UK.
46. Yurtdas, I., et al., Influences of water by cement ratio on mechanical properties of mortars submitted to drying. Cement and Concrete Research, 2006. 36(7): p. 1286-1293.
47. Kanna, V., R.A. Olson, and H.M. Jennings, Effect of shrinkage and moisture content on the physical characteristics of blended cement mortars. Cement and Concrete Research, 1998. 28(10): p. 1467-1477.
48. Pihlajavaara, S.E., A review of some of the main results of a research on the ageing phenomena of concrete: Effect of moisture conditions on strength, shrinkage and creep of mature concrete. Cement and Concrete Research, 1974. 4(5): p. 761-771.
Chapter 4 Assessment of Post-Restrained Shrinkage Mechanical Properties of Concrete- Parametric Study (Part I)
76
Chapter 4 Assessment of Post-Restrained Shrinkage Mechanical Properties of Concrete- Parametric Study (Part I)
Younis, K.H. and K. Pilakoutas, New Restrained Test to Assess Post-Shrinkage Behaviour of Concrete-Part I: Development of Test and Free Shrinkage Results. Cement and Concrete Composites, 2014. Submitted.
This chapter deals with a new test for restrained shrinkage of concrete and aims at assessing
the post-restrained shrinkage behaviour of concrete. To examine the effectiveness of the
proposed restraining frame, a parametric experimental study was conducted. The
development of the restraining frame and results of free shrinkage, mass loss and mass loss
vs shrinkage of three concrete mixes with different water/cement (w/c) ratios are presented
and discussed in part I. Part II deals with the behaviour of the concrete mixes under
restrained conditions including: shrinkage strains, restrained factor (RF), failure of restrained
concrete and the post-restrained mechanical behaviour. The results of Part I show that, for
unrestrained specimens there is a significant variation in shrinkage strains with depth,
resulting in significant curvature deformations. In early ages, free shrinkage strains and their
rate of development in mixes with low w/c are larger than those with higher w/c whereas, for
later ages, the opposite applies.
This chapter consists of a “stand alone” journal paper and therefore, relevant bibliography
is presented at the end of the chapter. Appendix E includes additional information and
further test results.

Chapter 4 Assessment of Post-Restrained Shrinkage Mechanical Properties of Concrete- Parametric Study (Part I)
77
4.1 Introduction
Over time concrete undergoes unavoidable complex chemical, physical and thermal volume
related changes known as autogenous, drying and thermal shrinkage. The existence of
restraint against these volume changes leads to internal stress development resulting in
cracks when the instantaneous tensile strength of concrete is exceeded [1]. Cracks, induced
by restrained shrinkage, can lead to issues with serviceability and structural integrity.
Shrinkage cracks can also result in durability issues by affecting permeability, diffusivity
and sorptivity of concrete, thus causing deteriorations such as freeze-thaw damage, corrosion
of steel reinforcement and spalling. Such cracks and premature deterioration can start even
before the application of external loads. As a result, cracking potential, stress evaluation and
effect of cracks on concrete properties have received considerable attention by the concrete
community [1-4].
Preventing the rapid loss of moisture and temperature at an early age is the best practical
way to mitigate the effect of shrinkage deformations. However, the complete elimination of
these deformations is practically impossible. Hence, finding ways of quantifying restrained
strains and associated stresses is crucial to account for them during the design process.
Commonly used free shrinkage tests can provide information on shrinkage behaviour of
different concrete mixtures, environmental conditions, and size and shape of concrete
elements being assessed. However, they cannot provide information on the post-cracking
behaviour of concrete under restrained conditions [5-8]. On the other hand, restrained
shrinkage tests can help in the assessment of cracking tendencies and the ability of concrete
to withstand shrinkage induced tensile stresses [9]. There are different types of the restrained
shrinkage tests; for example the ring test, the linear passive and active tests and the plate test
[1, 10] .
The impact of shrinkage induced cracks due to external restraints on the mechanical
properties of concrete is still largely unknown and to date there is no standard experimental
procedure to quantify the effect of such cracks on these properties. For this reason, the
authors have recently developed a new linear rig test [11] (see Figure 4.1) and a procedure to
assess the post-shrinkage mechanical properties of concrete. It was found that the test rig
provided a variable partial restraining factor (RF) and improvements were proposed for the
restraining element and supports [11]. The current research aims to enhance the RF of the
restraining elements, integrate them into a frame for multi-specimen testing and to examine
the effectiveness of the developed frame through an experimental parametric study. The

Chapter 4 Assessment of Post-Restrained Shrinkage Mechanical Properties of Concrete- Parametric Study (Part I)
78
results and findings of the research are presented in two parts. Part I (the current paper) will
present the development of the restraining frame, describe the experimental procedures and
discuss the free shrinkage behaviour, mass loss and mass loss vs shrinkage of the three
concrete mixes of very different w/c ratios. Part II (second paper) will present the results and
discuss the behaviour of the concrete mixes under restrained conditions, including shrinkage
strains, RF, failure of restrained concrete and the post-restrained mechanical behaviour of
the three concrete mixes.
Figure 4. 1 Front view of the developed rig for restrained shrinkage test [11] (dimensions in mm).
4.2 Experimental Programme
4.2.1 Development of New Restraining Frame
Due to strain loss caused by the deformations of the supports (ends) and restraining beam,
the degree of the restraint achieved using the rig in Figure 4.1, was not enough to allow
potential through cracks to develop. Therefore, it was proposed to modify the concept of the
developed rig to: 1- provide higher restraint, and 2- examine 3 specimens at the same time,
to enable parametric investigations.
Sec. A-A

Chapter 4 Assessment of Post-Restrained Shrinkage Mechanical Properties of Concrete- Parametric Study (Part I)
79
The new restraining frame (see Figure 4.2) consists of three horizontally positioned beams
made of a 120×120×10 mm steel square hollow box sections (SHS) (as shown in Figures
4.2a and 4.2b). The beams are held by two channel sections (CS) columns (C150×75, flange
length =75mm, web length=150mm, thickness of flange = thickness of web= 10mm). For
ease of assembly, the three beams are welded onto one of the columns. To connect the two
columns, three pairs (one pair per beam) of threaded M16 steel rods (length × diameter
=1000×16 mm) were used. Each pair of steel rods passes through the length of the SHS and
is prestressed onto the columns using torque wrench (utilising 80% of the rod capacity). The
function of these rods is to keep all parts (beams and columns) together to form a rigid
frame. Another function of these rods is to enable the modification of the degree of restraint
during exposure to drying conditions. This could be done by releasing the prestressing force
when required. Steel plates stiffeners (120×120×10 mm) were welded onto the columns to
stiffen further the contact area with the beams.
Results from the previous study (chapter 3) carried out by the authors [11] indicated that
most loss of RF was due to bending of the gripping device (end supports). Therefore, a much
stiffer restraint with less freedom to rotate is required to minimise bending. Hence, rather
than using steel angles, the new rig utilises a channel section CS to connect the concrete
specimen onto the reaction beam through bolts. To provide continuity, the CS runs height
wise to create a three-specimen rig. To develop some ability to compensate for some of the
strain imposed on the restraining beams by the shrinking concrete specimens, prestressed
rods are also utilised.

Chapter 4 Assessment of Post-Restrained Shrinkage Mechanical Properties of Concrete- Parametric Study (Part I)
80
Figure 4. 2 New restraining frame (dimensions in mm).
view A-A
A
A
Plan view
Top (T)
Middle (M)
Bottom (B)
(a)
(b)
(c)

Chapter 4 Assessment of Post-Restrained Shrinkage Mechanical Properties of Concrete- Parametric Study (Part I)
81
Details of the frame after manufacturing are shown in Figures 4.3(a-f). Each specimen is
provided with 4 anchor bolts at each end made of M10 steel threaded rods (see Figures 4.2a
and 4.3e). The rods are bolted to the columns for easy dismounting of the concrete specimen
at the end of the test. Two steel plates (100×130×15 mm) were welded to the inner side of
the columns for each beam to strengthen this area (see Figure 4.3e).
Figure 4. 3 New restraining frame after manufacturing: a and b- general view c- side view d- frame with the timber sides and the top perspex cover in place. e- details of the end f- rectangular prespex piece with curved ends used to provide space at the bottom of each prism.
(c)(b)(a)
(d)
(e) (f)

Chapter 4 Assessment of Post-Restrained Shrinkage Mechanical Properties of Concrete- Parametric Study (Part I)
82
Rectangular timber pieces were initially tried at the top and bottom of the concrete specimen
in the rig, but were later replaced by two perspex pieces of the same dimensions (see Figure
4.3d and f) to ensure easy removal during demoulding. Timber plates with dimensions of
780×130×15 mm were used as side shutters (see Figure 4.3d).
The rig is mounted on a braced rectangular base with four wheels (see Figure 4.3a). This
facilitates movement inside the conditioning room.
4.2.2 Materials, Mix Proportions and Geometry and Preparation of
Specimens
In this study, Ordinary Portland Cement (OPC) CEM I 52.5 N, complying with BS EN 197-
1:2011 [12] was used. Table 4.1 presents the chemical analysis of the cement (as given by
the supplier). The aggregates used in this study were sand (maximum size of 5mm) as fine
aggregate and river gravel (maximum size of 20 mm) as coarse aggregate.
Table 4. 1 Chemical composition of OPC .
SiO2 Al2O3 Fe2O3 CaO MgO SO3 Na2O K2O Na2Oeq
21.0 5.0 2.9 65.9 0.80 2.8 0.24 0.44 0.52
The mix proportions of the three mixes investigated in this study are presented in Table 4.2.
Table 4. 2 Mix proportions (kg/m3)
Mix Code
w/c C CA FA SP
NA30 0.3 430 1203 659 0.64*
NA40 0.4 375 1147 715 0.32*
NA50 0.5 330 1109 752 0.07*
w/c: water to cement ratio. C: cement. CA: coarse aggregate. FA: fine aggregate. * % of cement mass.

Chapter 4 Assessment of Post-Restrained Shrinkage Mechanical Properties of Concrete- Parametric Study (Part I)
83
The following specimens were cast for each mix: 12 of 100 mm cubes, 3 control prisms
100×100×500 mm, 3 prisms 100×100×750 mm for free shrinkage test, and 3 prisms (in one
frame) for restrained shrinkage. The concrete was compacted on a vibrating table in two
layers [13]. The concrete specimens in the restraining frame were compacted by clamping
the frame to the vibrating table using a steel bar, as shown in Figure 4.4.
Figure 4. 4 Restraining frame clamped to vibrating table.
After compaction and levelling of the surface of the prisms, a rectangular perspex piece
(which was part of the mould) was placed on the top surface of each specimen in the
restraining frame. The specimens were then covered with plastic sheets to prevent moisture
loss before being demoulded at 24h. After demoulding, Demec gauge points were bonded to
the concrete surface at 300 and 500 mm spacing using a rapid-hardening adhesive (as
explained in next the section). The control prisms were then stored in water while the
specimens in the restraining frame and the prisms for free shrinkage were maintained in a
laboratory environment at 22 ±2 oC and RH of 45 ±5 %.
4.2.3 Shrinkage and Mass Loss Measurements
Two Demec gauges (seen in Figure 4.5a) were used to measure shrinkage strains having
length of 300 and 500 mm and precision of 5.2 µε and 3.2 µε, respectively. The location of
the Demec points for the free shrinkage specimens is shown in Figure 4.5a. At the centre of
each surface of the concrete prisms, four demec points are used to obtain one reading over a
length of 500 mm and two readings over a 300 mm length.

Chapter 4 Assessment of Post-Restrained Shrinkage Mechanical Properties of Concrete- Parametric Study (Part I)
84
Figure 4. 5 Location of Demec points for: a and c-free shrinkage specimens, b-restrained shrinkage specimens (all presented values are in mm).
For the restrained specimens, Demec points were fixed to the sides and top of each specimen
as can be seen in Figure 4.5b. In some cases, and to examine the distribution of the
shrinkage across the depth of the concrete specimen, Demec points were attached on the side
surfaces at three depths from the troweled surface (5 mm (top A), 50 mm (middle B), and
95 mm (bottom C)), see Figures 4.5b and c. The first shrinkage strains were measured at 24h
(immediately after the adhesive hardened) and at 24 hours intervals for the first week,
(a)
300300
500
ABC
300
300
300
(b)
AB
C
(c)

Chapter 4 Assessment of Post-Restrained Shrinkage Mechanical Properties of Concrete- Parametric Study (Part I)
85
followed by measurements at 10,14, 21 and 28 days. Two or three readings were taken for
each gauge length, and the average values calculated.
The loss of mass for the free shrinkage specimens was determined at regular intervals starting at 24 h soon after the Demec points were bonded.
4.3 Results and Discussion
4.3.1 Free Shrinkage Strains
4.3.1.1 Effect of gauge length
Figures 4.6, 4.7 and 4.8 show the results of free shrinkage strains (average of three
specimens) for the three mixes investigated in this study. Each figure presents the shrinkage
strains on the top (T) (troweled surface), sides (S) and bottom (B) surfaces. Generally, it can
be seen that there is insignificant difference between the results of the two gauges, with a
maximum difference of around 10%. Since gauge length had insignificant effect on
shrinkage strains, only strains measured using the 300 mm gauge length will be used in the
discussions and when considering other parameters in the next sections.
Figure 4. 6 Free shrinkage strains measured on top, sides and bottom surfaces for mix NA30.
0
50
100
150
200
250
300
350
400
450
500
0 5 10 15 20 25 30
Free
Shr
inka
ge st
rain
(µε)
Drying time (Days)
NA30/ Free-300mm TOP
NA30/ Free-300mm Sides
NA30/ Free-300mm Bottom
NA30/ Free-500mm TOP
NA30/ Free-500mm Sides
NA30/ Free-500mm BottomS
B
T
Drying Time (days)
Free
shrin
kage
Str
ain
(µɛ)

Chapter 4 Assessment of Post-Restrained Shrinkage Mechanical Properties of Concrete- Parametric Study (Part I)
86
Figure 4. 7 Free shrinkage strains measured on top, sides and bottom surfaces for mix NA40.
Figure 4. 8 Free shrinkage strains measured on top, sides and bottom surfaces for mix NA50.
4.3.1.2 Effect of surface (top, sides and bottom)
The shrinkage strains measured on these surfaces were different for each mix. Highest
shrinkage strains were observed at the top surface and lowest at the bottom; strains on the
sides were about the average of the two other faces (see Figures 4.6, 4.7 and 4.8). For
example, after 28 days of drying, the shrinkage strain developed at the top of the specimens
of mix NA40 (410 µε) is twice that developed at the bottom surface (202 µε) and higher than
that developed at the sides of the specimen (274 µε) by 136 µε. This may be due to concrete
bleeding which usually happens at the top (troweled) surface altering the microstructure of
this surface and possibly resulting in slightly higher porosity which in turn causes more
shrinkage. Furthermore, concrete is better compacted at greater depths resulting in more
dense concrete, which tends to shrink less. This difference in shrinkage strains between
0
50
100
150
200
250
300
350
400
450
500
0 5 10 15 20 25 30
Free
Shr
inka
ge st
rain
(µε)
Drying time (Days)
NA40/ Free-300mm TOP
NA40/ Free-300mm Sides
NA40/ Free-300mm Bottom
NA40/ Free-500mm TOP
NA40/ Free-500mm Sides
NA40/ Free-500mm Bottom
T
S
B
Drying Time (days)
Free
shrin
kage
Str
ain
(µɛ)
0
50
100
150
200
250
300
350
400
450
500
0 5 10 15 20 25 30
Free
Shr
inka
ge st
rain
(µε)
Drying time (Days)
NA50/ Free-300mm TOP
NA50/ Free-300mm Sides
NA50/ Free-300mm Bottom
NA50/ Free-500mm TOP
NA50/ Free-500mm Sides
NA50/ Free-500mm Bottom
T
S
B
Drying Time (days)
Free
shrin
kage
Str
ain
(µɛ)

Chapter 4 Assessment of Post-Restrained Shrinkage Mechanical Properties of Concrete- Parametric Study (Part I)
87
different surfaces indicates that upon drying the concrete will also bend due to curvature (see
section 4.3.1.4).
To assess the effect of w/c ratio on the variation in shrinkage on the different surfaces, the
ratio between the strains developed at the top and at the bottom (∆T-B) and side surfaces (∆T-
S) were calculated and shown in Figures 9 and 10. It can be seen that the ratio of strains
reduces with the decrease in w/c ratio. It can also be seen that though the ratios ∆T-B and ∆T-S
(for w/c = 0.4 and 0.5) are variable at the early ages (up to 7 days), there is a general trend
for an increase in the first few days followed by a decrease and then stabilization.
Nonetheless, for w/c ratio 0.3, strain ratios (∆T-B and ∆ T-S) appear to increase slightly with
time.
Figure 4. 9 Difference in the strains between top and bottom surfaces.
Figure 4. 10 Difference in the strains between top and side surfaces.
1.2
1.4
1.6
1.8
2.0
2.2
2.4
2.6
0 5 10 15 20 25 30
Δ T-B
(%
)
Drying Time (days)
NA40
NA30
NA50
1
1.2
1.4
1.6
1.8
0 5 10 15 20 25 30
Δ T-S
(%)
Drying Time (days)
NA40
NA30
NA50

Chapter 4 Assessment of Post-Restrained Shrinkage Mechanical Properties of Concrete- Parametric Study (Part I)
88
4.3.1.3 Effect of depth (variation of shrinkage over specimen depth)
Figures 4.11, 4.12 and 4.13 show the shrinkage strains (average of two specimen for each
mix) at the middle part of the sides at three different depths: 5mm (top-T), 50 mm (centre-
C), 95 mm (bottom-B) from the troweled face of the specimen (see Figure 4.5c). Regardless
of the w/c ratios, it is clear that there is significant difference between the shrinkage
measured at the top (upper edge) and bottom (lower edge) of the side face. For example, this
difference (at 28 days) is equal to 204 µε, 162 µε and 218 µɛ, which corresponds to around
122%, 89% and 76% of the strains developed at the lower edge for the mixes NA30, NA40
and NA50, respectively. These results indicate that there is differential (non-uniform)
shrinkage over the depth of the concrete specimens. This variation in shrinkage strains
causes curvature as discussed in the next subsection. Furthermore, this may increase the
intensity of the tensile stress, that develops due to non-uniform shrinkage (differences in the
moisture between surface and core), at the upper edges.
Figure 4. 11 Shrinkage strains at upper edge, centre and lower edge of the side face of mix NA30.
0
100
200
300
400
500
0 5 10 15 20 25 30
Free
shrin
kage
Stra
in (µ
ε)
Drying Time (Days)
NA30/Free-Average Top
NA30/Free-Average Centre
NA30/Free-Average Bottom T
C
B

Chapter 4 Assessment of Post-Restrained Shrinkage Mechanical Properties of Concrete- Parametric Study (Part I)
89
Figure 4. 12 Shrinkage strains at upper edge, centre and lower edge of the side face of mix NA40.
Figure 4. 13 Shrinkage strains at upper edge, centre and lower edge of the side face of mix NA50.
Figures 4.14 a-c show the distribution of the shrinkage strains over the depth at different
time intervals for mixes NA30, NA40 and NA50, respectively.
0
100
200
300
400
500
0 5 10 15 20 25 30
Free
shrin
kage
Stra
in (µ
ε)
Drying Time (Days)
NA40/Free-Average Top
NA40/Free-Average Centre
NA40/Free-Average Bottom T
C
B
0
100
200
300
400
500
0 5 10 15 20 25 30
Free
shrin
kage
Stra
in (µ
ε)
Drying Time (Days)
NA50/Free-Average Top
NA50/Free-Average Centre
NA50/Free-Average Bottom
T
C
B

Chapter 4 Assessment of Post-Restrained Shrinkage Mechanical Properties of Concrete- Parametric Study (Part I)
90
Figure 4. 14 Variation of shrinkage strains over the depth of the concrete specimen (a) mix NA30, (b) mix NA40, (c) mix NA50.
0
50
100
0 100 200 300 400 500
Dept
h fr
om th
e bo
ttom
surf
ace
(mm
)
Shrinkage strain (με)
1 d
7 d
14 d
28 d
Centre
Bottom
NA30
Top
0
50
100
0 100 200 300 400 500
Dept
h fr
om th
e bo
ttom
surf
ace
(mm
)
Shrinkage strain (με)
1 d
7 d
14 d
28 d
Centre
Bottom
NA40
Top
0
50
100
0 100 200 300 400 500
Dep
th fr
om t
he b
otto
m su
rfac
e (m
m)
Shrinkage strain (με)
1 d
7 d
14 d
28 d
Centre
Bottom
NA50
Top
(c)
(a)
(b)

Chapter 4 Assessment of Post-Restrained Shrinkage Mechanical Properties of Concrete- Parametric Study (Part I)
91
4.3.1.4 Shrinkage curvature
Figures 4.15 (a-c) show the development of curvature over time for all mixes. Curvature is
shown as calculated between top and sides (kT-S), sides and bottom (kS-B) surfaces and
average (kA) (average of three specimens) for all mixes. It can be seen that curvature
increases overall with an increase in w/c. For NA40 and NA50 the curvature of the upper
half of the concrete specimens is higher than the lower half, whereas, for NA30, it is uniform
for the first few days and after that the curvature of the lower half is higher than that of the
upper half. This may be due to the high amount of microcracks observed on the surface of
specimens of mix NA30 which can cause relaxation of the top surface.
Figure 4. 15 Shrinkage curvature developed on the free specimens, (a) mix NA30, (b) mix NA40, (c) mix NA50.
0.0
0.5
1.0
1.5
2.0
2.5
3.0
0 5 10 15 20 25 30
Curv
atur
e ×1
0-3 (m
-1)
Drying time (days)
Average KA
KS-B
KT-S
NA30- Free
(a)
(kT-S)
(kS-B)
0.0
0.5
1.0
1.5
2.0
2.5
3.0
0 5 10 15 20 25 30
Curv
atur
e ×1
0-3 (m
-1)
Drying time (days)
Average KAKS-BKT-S
NA40 - Free
(b)
(kT-S)
(kS-B)
0.0
0.5
1.0
1.5
2.0
2.5
3.0
3.5
4.0
0 5 10 15 20 25 30
Curv
atur
e ×1
0-3 (m
-1)
Drying time (days)
Average KAKS-BKT-S
NA50 - Free
(c)
(kS-B)
(kT-S)

Chapter 4 Assessment of Post-Restrained Shrinkage Mechanical Properties of Concrete- Parametric Study (Part I)
92
4.3.1.5 Effect of w/c
Shrinkage strains developed at the sides of the specimens versus time for all mixes are
shown in Figure 4.16.
Figure 4. 16 Shrinkage strains development for all mixes.
The figure shows that, in the early ages, shrinkage strains increase faster for the lower w/c
ratios. This can be attributed to the influence of the autogenous shrinkage which is more
pronounced in low w/c ratio mixes. Similar results were reported by Altoubat and Lange [9].
After 7-15 days, however, for the mixes with lower w/c ratios shrinkage development slows
down faster. This may be due to the fact that for the lower w/c mixes there is less moisture
that can be lost upon drying due to their denser (finer) microstructure.
4.3.2 Mass Loss
Mass loss versus time for the three mixes is shown in Figure 4.17. As, expected, it is clear
that the w/c has significant influence on mass loss, with the higher w/c ratio mixes having
much higher mass loss, especially at the early ages.
0
50
100
150
200
250
300
350
0 5 10 15 20 25 30
Free
Shrin
kage
str
ain
(µε)
Drying Time (Days)
NA30/Free -Sides
NA40/Free -Sides
NA50/Free -Sides

Chapter 4 Assessment of Post-Restrained Shrinkage Mechanical Properties of Concrete- Parametric Study (Part I)
93
Figure 4. 17 Mass loss versus time.
4.3.3 Mass Loss vs Free Shrinkage Strains
The mass loss versus shrinkage strains for all mixes is shown in Figure 4.18. Regardless of
the w/c ratio, the mass loss- shrinkage strain curve is characterised by a two stage behaviour.
Initially, the rate of shrinkage strain per mass loss decreases with increasing w/c ratio. This
rate appears to be influenced partly by autogenous shrinkage and partly by the pore
structures of the mixes. In the second stage, the effect of the w/c on the rate of shrinkage
strain per mass loss appears to be negligible as all three curves have the same gradient. This
may be attributed to the slow-down of autogenous shrinkage and also to the fact that the
majority of coarse pores are dry and the drying causes moisture loss from the finer capillary
pores. Similar results were reported by Powers 1959 [14] (cited in [15]), who specifically
examined the effect of different porosity mixtures having different aggregate contents. It is
argued that water is initially lost from large capillary pores with little shrinkage thus
contributing mainly to the rapid loss of mass.
Figure 4. 18 Mass loss-shrinkage strains curves.
0.0
0.2
0.4
0.6
0.8
1.0
1.2
1.4
1.6
0 4 8 12 16 20 24 28
Mas
s lo
ss
Drying Time (Days)
Mass loss - NA40
Mass loss -NA50
Mass loss -NA30
0
100
200
300
400
0 0.4 0.8 1.2 1.6 2
Shrin
kage
str
ain
(µɛ)
Mass Loss %
Mass loss -NA30
Mass loss - NA40
Mass loss -NA50

Chapter 4 Assessment of Post-Restrained Shrinkage Mechanical Properties of Concrete- Parametric Study (Part I)
94
The smoothed behaviour of shrinkage strain-mass loss curves are shown in Figure 4.19.
Figure 4. 19 Shrinkage strain-mass loss curves at different times of drying.
4.4 Conclusions
This study proposes a new test for restrained shrinkage to assess the post-restrained
shrinkage mechanical behaviour of concrete. This chapter dealt with the development of the
restraining frame and discussed results on free shrinkage. Chapter 5 (Part II) will deal with
the post-restrained behaviour of concrete. The main findings of this chapter are:
For unrestrained specimens, the shrinkage strains on the top surface of the concrete are
higher than those on the sides and the bottom surface by up to 100% after 28 days drying.
The variation in strains is higher at an early age and more pronounced in mixes with high
w/c ratios, possibly due to their higher porosity and better compaction of the lower layer of
the concrete. As a result, this paper quantifies that free shrinkage specimens develop
curvatures due to differences in shrinkage strains along the depth. Differential shrinkage can
also develop between the surfaces and core of the specimens, which can lead to surface
tensile stresses which can amplify the effects of restrained shrinkage. This issue requires
further investigation.
In early ages, for the low w/c mix (NA30), the free shrinkage strains and their rate of
development are higher than those for higher w/c mixes (NA40 and NA50) due to higher
autogenous shrinkage. For later ages, the development of the shrinkage strains of low w/c
mixes slows down faster than for higher w/c mixes, possibly due to the fact that there is less
R² = 0.999
R² = 0.995
R² = 0.998
0
50
100
150
200
250
300
350
400
0.0 0.2 0.4 0.6 0.8 1.0 1.2 1.4 1.6 1.8
Shrin
kage
Str
ain
(µε)
Mass loss %
2 day s
4 days 3day s
5day s
7day s
14 day s
21 day s
2 8day sw/c= 0.3
w/c= 0.4w/c= 0.5
1 day

Chapter 4 Assessment of Post-Restrained Shrinkage Mechanical Properties of Concrete- Parametric Study (Part I)
95
moisture that can be lost upon drying due to their denser microstructure. High w/c ratios
mixes initially lose mass faster, due to moisture loss from large capillary pores and this
results in relatively low initial shrinkage strain.

Chapter 4 Assessment of Post-Restrained Shrinkage Mechanical Properties of Concrete- Parametric Study (Part I)
96
References
1. ACI 231R-10, Report on Early-Age Cracking: Causes, Measurement, and Mitigation, in ACI Committee 231. 2010, American Concrete Institute: Farmington Hills, U.S.A.
2. Banthia, N., C. Yan, and S. Mindess, Restrained shrinkage cracking in fiber reinforced concrete: A novel test technique. Cement and Concrete Research, 1996. 26(1): p. 9-14.
3. Banthia, N. and R. Gupta, Influence of polypropylene fiber geometry on plastic shrinkage cracking in concrete. Cement and Concrete Research, 2006. 36(7): p. 1263-1267.
4. Bishop J., The early age Behaviour of Concrete Industrial Ground Floor Slabs. 2001, loughborough University: loughborough, UK
5. Swamy, R.N. and H. Stavrides, Influence of Fiber Reinforcement on Restrained Shrinkage and Cracking. Journal of the American Concrete Institute, 1979. 76(3): p. 443-460.
6. Weiss, W.J., W. Yang, and S.P. Shah, Shrinkage cracking of restrained concrete slabs. Journal of Engineering Mechanics-Asce, 1998. 124(7): p. 765-774.
7. Carlsward J. , Shrinkage Cracking of Steel Fibre Reinforced self compacting Concrete Overlays, in Department of civil and Environmental Engineering. 2006, Lulea University of Technology: Lulea,Sweden.
8. Grzybowski, M. and S.P. Shah, Shrinkage Cracking of Fibre Reinforced Concrete. ACI Materials Journal, 1990. 87(2).
9. Altoubat, S.A. and D.A. Lange, Creep, shrinkage, and cracking of restrained concrete at early age. ACI Materials Journal/ SP, 2001. 98(4): p. 323-331.
10. Bentur, A., Early Age Cracking Tests, in Early Age Cracking in Cementitious Systems - Report of RILEM Technical Committee 181-EAS - Early age shrinkage induced stresses and cracking in cementitious systems, A. Bentur, Editor. 2003, RELIM. p. 241-255.
11. Younis, K.H. and K. Pilakoutas, Assessment of Post-Restrained Shrinkage Mechanical Properties of Concrete ACI Materials, 2014. Submitted for publication.
12. BS EN 197-1:2011, Cement. Composition, specifications and conformity criteria for common cements. 2011, British Standard Institution: London, UK.
13. BS EN 12390-2:2009, Testing hardened concrete Part 2: Making and curing specimens for strength tests. 2009, British Standards Institution: London.
14. Powers, T.C., Causes and Control of Volume Change. PCA Research and Development Laboratories, 1959. 1(1): p. 29-39.
15. Johnston, C.D. and E.H. Sidewell, Influence of Drying on Strength of Concrete Specimens. ACI, 1969. 66-63: p. 748-755.

Chapter 5 Assessment of Post-Restrained Shrinkage Mechanical Properties of Concrete- Parametric Study (Part II)
97
Chapter 5 Assessment of Post-Restrained Shrinkage Mechanical Properties of Concrete- Parametric Study (Part II)
Younis, K.H. and K. Pilakoutas, New Restrained Test to Assess Post-Shrinkage Behaviour of Concrete-Part II: Restrained and Post-Restrained Test Results. Cement and Concrete Composites, 2014.Submitted.
This chapter attempts to quantify the restrained and post-restrained shrinkage behaviour of
concrete. In Part I (chapter 4) a new restrained shrinkage test was presented and free
shrinkage test results were discussed. The experimental parametric study undertaken
included three mixes with w/c ratios of 0.3, 0.4 and 0.5. This part (Part II, chapter 5)
presents experimental results and discusses the behaviour of the similar concrete mixes
under restrained conditions, including variations in shrinkage strains, the evolution of
restraint factor (RF), failure of restrained concrete and the post-restrained mechanical
behaviour. The results reveal that stress history, which depends on the rate of development
of stiffness and shrinkage, is an important factor that governs the failure of restrained
concrete. Shrinkage induced cracks reduce the compressive strength, flexural strength and
flexural elastic modulus of concrete by up to 14%, 24% and 29% respectively. Mixes with
high w/c ratios lose more elastic modulus but less strength. Creep is identified as the
possible mechanism for the loss of the stiffness. Mixes with low w/c ratios benefit less from
creep and tend to mature and crack earlier, losing relatively more strength than high w/c
mixes.
This chapter consists of a “stand alone” journal paper and includes relevant bibliography
at the end of the chapter. Further test results are included in Appendix F.

Chapter 5 Assessment of Post-Restrained Shrinkage Mechanical Properties of Concrete- Parametric Study (Part II)
98
5.1 Introduction
Restrained shrinkage induced cracks can adversely affect the mechanical properties of
concrete, in particular flexural strength and flexural rigidity (flexural modulus of elasticity),
and can lead to unacceptable serviceability performance. In the first part (Part I-chapter 4) a
restrained shrinkage test was developed which is used in this chapter to get better
understanding of the post-restrained behaviour of concrete. The experimental parametric
study undertaken uses three mixes with w/c ratios of 0.3, 0.4 and 0.5. Details on the
materials used, mix proportions, geometry and preparation of specimens, shrinkage strains
and mass loss measurements were presented in chapter 4.
Drying of concrete takes place by nonlinear diffusion of moisture [1], which leads to non-
uniform distribution of moisture and makes differential shrinkage between the surface and
core inevitable [2, 3]. Differential shrinkage leads to tensile stresses which can result in
surface microcracking. Nonetheless, it was also found in chapter 4, that free shrinkage
strains on the top surface are higher than those on the sides and the bottom surface of the
prisms examined. This was confirmed by strains measured on the sides of the concrete
specimens. The variation was found to be higher at early ages and more pronounced in
mixes with high w/c ratios. This variation in shrinkage strain causes curvature of the
unrestrained specimens. This may cause additional stress under restrained conditions. It may
also lead to restraint factor (RF) variation between the different surfaces of the concrete and
over its depth.
Restrained shrinkage cracking depends on the rates of development of shrinkage strains,
tensile strength, elastic modulus (Ec) and creep (tensile relaxation). The results in chapter 4
indicated that shrinkage strains are also a function of w/c ratio. It was also found that, at
early ages, the low w/c ratio mixes exhibites higher rate of shrinkage than high w/c mixes
and the opposite applies for later ages. This may affect the failure or cracking tendency of
such mixes. However, the interaction of these time-dependent material properties in the
presence of external or internal restraint governs the initiation of cracking [3]. Creep, due to
its role in relaxing shrinkage induced tensile stresses, is considered a beneficial relaxation
mechanism reducing the crack potential of restrained concrete [3, 4]. Altoubat and Lange [3]
studied the interaction of shrinkage and creep of restrained concrete at early ages and
concluded that tensile creep relaxes the shrinkage induced tensile stresses by up to 50 %.

Chapter 5 Assessment of Post-Restrained Shrinkage Mechanical Properties of Concrete- Parametric Study (Part II)
99
In general, dried beams (under free condition) tested in bending show lower flexural strength
in comparison to saturated specimens [5]. A reduction of up to 30% was reported by Nielsen
[6] and between 30-40% by Yurtdas et al [7].
Very limited work has been undertaken on the effect of external restraint on the mechanical
properties of concrete, in particular the flexural strength of concrete. The interactions
between the development of strength and stiffness versus the development of shrinkage
(autogenous and drying) and creep strains are also not well understood.
This chapter (Part II) presents experimental results and discusses the behaviour of the
concrete mixes under restrained conditions, including: shrinkage strains, restraint factor
(RF), failure of restrained concrete and the post-restrained mechanical behaviour.
5.2 Test procedures and Measurements
This section introduces briefly the test procedures and measurements taken during and after
the restraining period.
Crack Detection
Regular checks for cracks were performed using an optical microscope with a magnification
factor of 40x and a precision of 20 µm and a digital microscope with a magnification up to
200x and a precision of 10 µm. The crack width reported is the crack opening at its widest,
normally at the edges of the specimens.
In the literature there is no clear definition of what defines a microcrack. RILEM committee
(TC-122-MLC), (on Microcracking and Life Time Performance of Concrete) uses widths of
less than 10 micron to define microcracks. Others [8-10] adopt 50 microns. In this study 20
microns or less was used to define microcracks, as it was found that cracks with width larger
than 20 microns are visible to the naked eye when properly illuminated.
Restraint Factor (RF)
Shrinkage strains were measured using two Demec gauges having lengths of 300 and 500
mm and precision of 5.2 µm and 3.2 µm, respectively. For the free shrinkage tests, readings
were taken at the centre of each surface of the prisms to obtain one strain measurement over
a length of 500 mm and two over a 300 mm length. For the restrained shrinkage specimens,
strains were measured over a gauge length of 300 mm, on the sides and top of each
specimen. The variation of shrinkage strains across the depth of concrete specimen was

Chapter 5 Assessment of Post-Restrained Shrinkage Mechanical Properties of Concrete- Parametric Study (Part II)
100
examined (in some cases) by measuring strains on the side surfaces at three depths from the
troweled surface (5 mm (top A), 50 mm (middle B), and 95 mm (bottom C)). The first
readings of shrinkage strains were taken at 24h, soon after the adhesive hardened, and at 24
hours intervals for the first week, followed by measurements at 10,14, 21 and 28 days. Two
or three readings were taken for each gauge length, and the average values determined.
The extent of restraint (degree of restraint or restraint factor) plays a significance role in the
development of tensile stresses inside the concrete. Bentur [11] mentioned that the degree of
restraint can be defined as the ratio of the stiffness of the restraining member and the
shrinking element and when the two are equal the degree of restraint is 50%. According to
ACI 207.2R [12] the restraint factor is the ratio of actual stress induced by the restrained
volume change to the stress that would develop if the specimen was fully restrained. In other
words, it is a ratio between the amount of strain that is restrained to the free shrinkage strain
[13]. Therefore, assuming that the modulus of elasticity is constant, equation 1 can be used
to calculate RF:
free
R
εε
= RF (5-1)
where:
ɛR Restrained shrinkage strain = shrinkage strain measured on the free specimen-shrinkage strain measured on the restrained specimen.
ɛfree Free shrinkage strain (strain measured on the free specimen).
5.2.1 Compressive Strength
The compressive strength was obtained at 1, 3, 7 and 28 days using the 100 mm cubes and
BS EN 12390-3 [14]. The compressive strength was also obtained from the prisms (free and
restrained specimens) tested in bending, by following the recommendations of BS 1881-119
[15]. The compressive strength test for prisms was conducted one or two days after testing
the prisms in bending.

Chapter 5 Assessment of Post-Restrained Shrinkage Mechanical Properties of Concrete- Parametric Study (Part II)
101
5.2.2 Bending Tests (Flexural strength and Modulus of Elasticity)
Specimens were tested following the recommendations of the ASTM C1018 [16] in four-
point flexural loading over a length of 300 mm. A yoke [17] was used to mount the
deflection transducers to eliminate errors from support displacement and torsion. Central
deflections were taken as the average of two displacements measured on opposite sides of
the specimen. The flexural strength and stiffness (flexural modulus of elasticity) were
determined using the load versus-deflection and load versus flexural modulus of elasticity
Eflex (GPa) curves (determined based on the theory of classical elasticity) [18]. The flexural
elastic modulus of concrete (Efmax) was determined as the maximum value of Eflex in the
range of 30% to 60% of the ultimate bending load.
5.3 Results and Discussion
5.3.1 Crack Characterization
Microcracks were detected on all surfaces (sides and top) of the specimens from the first day
of drying. The width of these microcracks was in the range of 10-20 µm when first detected.
Most of the microcracks were developed on the upper edges of both sides since shrinkage on
these regions is higher than other regions as also observed during the free shrinkage tests.
Some of these microcracks propagated and coalesced into macrocracks (cracks with width of
more than or equal to 20 µm and up to 50 µm, visible if properly illuminated), while others
turned first into a through crack (crack along the entire top surface) and then propagated to a
full-depth crack. Figure 5.1 (a-c) shows the distribution of the macro and full depth cracks
for all mixes at the end of the exposure time. Solid lines represent the visible part of the
macro cracks or the through cracks and the dotted lines are the non-visible part (width less
than 20 µm) of these cracks. It can be seen that high strength concrete (NA30) shows a
higher intensity of macro-cracking.
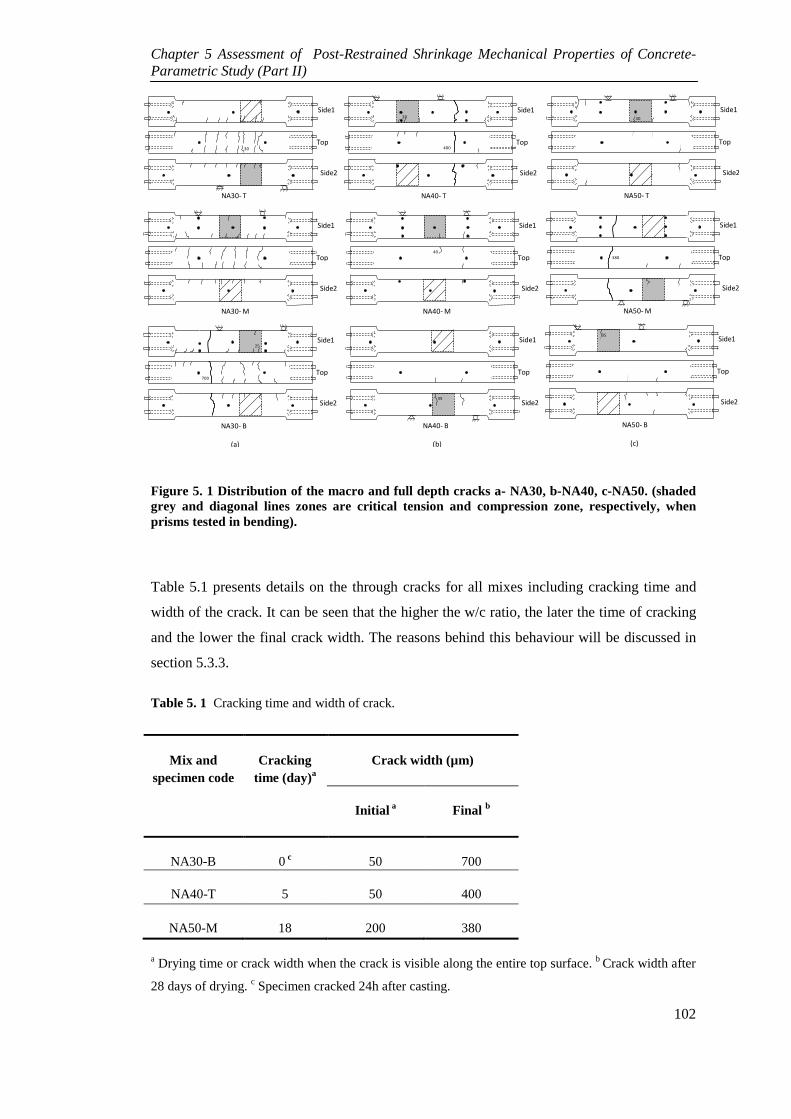
Chapter 5 Assessment of Post-Restrained Shrinkage Mechanical Properties of Concrete- Parametric Study (Part II)
102
Figure 5. 1 Distribution of the macro and full depth cracks a- NA30, b-NA40, c-NA50. (shaded grey and diagonal lines zones are critical tension and compression zone, respectively, when prisms tested in bending).
Table 5.1 presents details on the through cracks for all mixes including cracking time and
width of the crack. It can be seen that the higher the w/c ratio, the later the time of cracking
and the lower the final crack width. The reasons behind this behaviour will be discussed in
section 5.3.3.
Table 5. 1 Cracking time and width of crack.
Mix and specimen code
Cracking time (day)a
Crack width (µm)
Initial a Final b
NA30-B 0 c 50 700
NA40-T 5 50 400
NA50-M 18 200 380
a Drying time or crack width when the crack is visible along the entire top surface. b Crack width after
28 days of drying. c Specimen cracked 24h after casting.
Side235
Side1
Top
NA40- B
(b)
Side2
30
Side1
Top
NA50- T
Side2
30
Side1
Top
NA30- T
Side2
Side1
Top
NA30- M
Side2
25Side1
Top
NA30- B
(a)
700
Side2
40
Side1
Top
NA40- M
Side2
20Side1
Top
NA40- T
400
Side2
35 Side1
Top
NA50- B
(c)
Side2
380
Side1
Top
NA50- M

Chapter 5 Assessment of Post-Restrained Shrinkage Mechanical Properties of Concrete- Parametric Study (Part II)
103
5.3.2 Restrained Shrinkage
This section presents and discuses the development of shrinkage strains over time (on the
specimen sides and top surfaces) in the restrained specimens located at the top (T), middle
(M) and bottom (B) of the restraining frame. For the sides (Side), values presented are the
average of four measurements taken at the centre line. For the top surface (top), one
measurement was taken at its centre over 300mm. The results of the specimens which did
not crack during the restraining period are presented and discussed first followed by a
discussion on the cracked specimens.
5.3.2.1 Un-cracked specimens
Figures 5.2 (a-f) show the development of shrinkage strains on the un-cracked specimens for
all mixes. Just as for the free shrinkage specimens (see Part I), the shrinkage developed on
the top surface is higher than that on the sides. For all mixes the strains developed on the top
surface are higher than those developed on the sides during the drying exposure time. For
example, on the first day of drying, for w/c 0.3, 0.4 and 0.5 the strains developed on the top
surface (average of two specimens) were higher than those developed on the sides by 54%,
118% and 63%, respectively. Similar behaviour was also observed on the free shrinkage
specimens and this was attributed to the higher porosity of the top surface and to the better
compaction of the bottom surface.

Chapter 5 Assessment of Post-Restrained Shrinkage Mechanical Properties of Concrete- Parametric Study (Part II)
104
Figure 5. 2 Shrinkage strains developed on the top and sides (average) of the uncracked specimens, (a-b) mix NA30, (c-d) mix NA40, (e-f) mix NA50.
The average shrinkage strain on the sides at 7 days is compared for all w/c ratios in Figure
5.3. It can be seen that the lower the w/c the higher the shrinkage rate is, as was the case
with the free shrinkage specimens. This can be attributed to the higher autogenous shrinkage
of low w/c ratio mixes.
0
50
100
150
200
250
0 5 10 15 20 25 30
Shrin
kage
Str
ain
(µε)
Drying time (days)
Side
Top
(a)NA30 - T
0
50
100
150
200
250
0 5 10 15 20 25 30
Shrin
kage
Str
ain
(µε)
Drying time (days)
Side
Top
NA30 - M (b)
0
50
100
150
200
250
0 5 10 15 20 25 30
Shrin
kage
Str
ains
(µε
)
Drying time (days)
Side
Top
NA40 - M (c)
0
50
100
150
200
250
0 5 10 15 20 25 30
Shrin
kage
Str
ains
(µε
)
Drying time (days)
Side
Top
NA40 - B (d)
0
50
100
150
200
250
300
0 5 10 15 20 25 30
Shrin
kage
Str
ain
(µε)
Drying time (days)
Side
Top
NA50 - T (e)
0
50
100
150
200
250
300
0 5 10 15 20 25 30
Shrin
kage
Str
ain
(µε)
Drying time (days)
Side
Top
NA50 - B (f)

Chapter 5 Assessment of Post-Restrained Shrinkage Mechanical Properties of Concrete- Parametric Study (Part II)
105
Figure 5. 3 Average shrinkage strain on the sides at 7 days for free and restrained specimens.
The sharp reduction in shrinkage strains, seen in Figure 5.2 on day 7 for all specimens, is
due to the release of the strain on the main threaded bars that link the two columns of the
restraining frame. Releasing the strain was done to compensate for some strain loss and to
increase the RF that decreases with time (as will be discussed in subsection 5.3.4). The two
readings at 7days represent the readings prior to and just after strain releasing. This time was
chosen since the results of the trial mixes revealed that all three mixes at 7 days achieved
more than 80% of their 28 day strength. The release of the frame led to strain recovery (on
the sides) of 16 με (average of T and M specimens) for mix NA30, 20 με (average of M and
B specimens) for mix NA40 and 35 με (average of T and B specimens) for mix NA50.
Strain recovery measured on the top surface was similar to that on the sides. Due to the fact
that all mixes had the same level of prestress applied on the frames, it is normal to expect
that mixes with higher w/c ratio (0.5) exhibit more strain recovery than the mixes with lower
w/c ratio due to their elastic modulus. Hence, the amount of prestress applied in all mixes
appears to be consistent.
5.3.2.2 Cracked specimens
NA30 (B specimen)
The development of shrinkage strains on specimen B is shown in Figure 5.4. A crack of 50
μm was observed on the specimen after demoulding (24h after casting and before the start of
drying). After 3 days of drying, the width of the crack increased to 70 μm, which explains
the apparent expansion in the early ages in the regions where the crack developed, whereas
concrete in the other regions continues to shrink (see Figure 5.5). Early cracking for this
mix is likely to be caused by high autogenous shrinkage which is estimated at 20 μɛ after
1day [19]. Another possible reason is thermal shrinkage caused by the transient temperature
0
50
100
150
200
250
0.3 0.4 0.5
Stra
ins (
µε)
W/C ratio
Restrained -Sides
Free- Sides

Chapter 5 Assessment of Post-Restrained Shrinkage Mechanical Properties of Concrete- Parametric Study (Part II)
106
rise due to cement hydration during hardening as shown in Figure 5.6, which represents the
evolution of temperature inside the concrete (T, M and B specimens) monitored by using
thermo-couples.
The effect of releasing strain in the frame after 7 days can be seen as a sharp increase in the
strain in the regions where the crack developed. For example, the strain on the top, Side1, A
(upper edge of side1) and Side1,1 increased from -82 με, -100 με, -30 με to -1659 με, -1712
με, -1484με, respectively. The average strain increase in these regions corresponds to
0.47mm increase in the crack width. After 7days and up to the end of drying time, the crack
width kept increasing with a similar rate in all cracked regions. The crack width at the end of
the exposure time was 0.7 mm.
Figure 5. 4 Development of shrinkage strains on specimen B (mix NA30).
Figure 5. 5 Shrinkage strains of the sides of free specimens and those of restrained specimens in the uncracked regions for mix NA30.
-2000
-1800
-1600
-1400
-1200
-1000
-800
-600
-400
-200
0
200
400
0 5 10 15 20 25 30
Stra
in (µ
ε)
Drying time (days)
Top
Side1, 1
Side1, 2
Side2,1
Side2,2
Side 1, A
Side 1, B
Shrinkage NA30 - B
0
100
200
300
400
0 5 10 15 20 25 30
Shrin
kage
Str
ain
(µε)
Drying time (days)
Free/ sides
Restained /Average-sides
NA30- B

Chapter 5 Assessment of Post-Restrained Shrinkage Mechanical Properties of Concrete- Parametric Study (Part II)
107
Figure 5. 6 Temperature evolution inside the concrete due to cement hydration for restrained specimens (mix NA30).
NA40 (T specimen)
Figure 5.7 shows the development of shrinkage strains on specimen T measured on the sides
(Side1,1, Side1,2, Side2,1, Side2,2), on the top (top), upper edge of side1 (Side1,A), upper
edge of side2 (Side2,A) and centre of side1 (Side1,B). The first through crack of width
50μm developed on day 5. This can be seen as a sharp reduction in shrinkage strain on
Side1,2, Side2,1, top, Side1,A and Side2,A (where the crack developed). Side1,1 and
Side2,2 remained uncracked and carried on shrinking (same as the free specimens see Figure
5.8). Between day 5 and 7, a very slow rate of strain development (crack width increase) was
observed in the cracked regions.
A sharp increase in the strain (apparent expansion) occurred after strain release on day 7.
Strains on the top, Side1,A and Side2,A increased from -80 με, -103 με, -106 με to -578 με, -
596 με, -636 με, respectively; the average strain increase in these regions corresponds to
0.15 mm increase in the crack width. The estimated crack width on the top and the edges
was higher than that on the centre of the sides. After 7 days, the crack width increased with
similar rate in all cracked regions. At the end of the test, the crack width reached around 0.4
mm.
18
19
20
21
22
23
24
25
26
27
0 4 8 12 16 20 24
Tem
pera
ture
(o C
)
Time (h)
Top
Middle
Bottom
Thermo-coupleNA30

Chapter 5 Assessment of Post-Restrained Shrinkage Mechanical Properties of Concrete- Parametric Study (Part II)
108
Figure 5. 7 Development of shrinkage strains on specimen T (mix NA40).
Figure 5. 8 Shrinkage strains of the sides of free specimens and those of restrained specimens in the uncracked regions for mix NA40.
NA50 (M specimen)
The development of shrinkage for specimen M is shown in Figure 5.9. None of the
specimens of mix NA50 cracked before or right after releasing the strain in the frame. Up to
7 days, all regions experienced shrinkage with higher values on the top and edges than the
other regions. Releasing the strain recovered 40 με of strain (on the top) and an average of
36 με of strain (on the sides). However, no full depth crack was observed. Up to 14 days, in
some regions the concrete kept on shrinking, while in other regions the shrinkage strains
either decreased or remained constant. A crack of 0.25 mm width was observed on day 18.
The effect of the crack on the strain values can be seen as a sharp change in strain from
-1100
-1000
-900
-800
-700
-600
-500
-400
-300
-200
-100
0
100
200
300
400
0 5 10 15 20 25 30
Stra
ins
(µε)
Drying time (days)
Top Side1, 1Side1, 2 Side2,1Side2,2 Side 2, ASide 1, A Side 1,B
NA40 - T
0
100
200
300
400
0 5 10 15 20 25 30
Shrin
kage
Str
ains
(µε
)
Drying time (days)
Free/ sides Restained-Average-sides
NA40 - T

Chapter 5 Assessment of Post-Restrained Shrinkage Mechanical Properties of Concrete- Parametric Study (Part II)
109
positive values (shrinkage ) to negative values (expansion). For example, the strain on the
top, Side1,A and Side1,1 changed from 77 με, 58 με, 90 με (on day 14) to -935 με, -1049 με,
-652 με, (on day 21), respectively. However, in other regions, where no through cracks
developed, strains were similar to free shrinkage strains (see Figure 5.10). The average
strain increase on the top and the edge (Side1,A) corresponds to a crack width of 0.32 mm.
The crack width was found to be 0.38 mm at the end of the drying exposure time (28 days).
Figure 5. 9 Development of shrinkage strains on specimen M (mix NA50).
Figure 5. 10 Shrinkage strains of the sides of free specimens and those of restrained specimens in the uncracked regions for mix NA50.
-1300
-1200
-1100
-1000
-900
-800
-700
-600
-500
-400
-300
-200
-100
0
100
200
300
0 5 10 15 20 25 30
Stra
ins
(µε)
Drying time (days)
TopSide1, 1Side1, 2Side2,1Side2,2Side 1, ASide 1, BSide 1, C
NA50 - M
0
100
200
300
0 5 10 15 20 25 30
Shrin
kage
Str
ain
(µε)
Drying time (days)
Free/sides
Average
NA50 - M

Chapter 5 Assessment of Post-Restrained Shrinkage Mechanical Properties of Concrete- Parametric Study (Part II)
110
5.3.3 Failure of Concrete under Restrained Conditions
The results of the restrained shrinkage of the specimens that cracked show that the failure
(time of cracking and final crack width) of restrained concrete varies according to the w/c
ratio. This can only be attributed to the effect of the strength (magnitude and rate of
development) since all mixes were subjected to the same restraint and drying conditions.
Figure 5.11a shows the compressive strength (fcu) development of all mixes, whilst Figure
5.11 b shows the predicted stiffness (Ec) development according to Eurocode-2 [19]. If
ultimate strength is used as a failure criterion, the weaker mix (w/c= 0.5) is expected to fail
first. However, the lower w/c ratio (high strength) mix (w/c= 0.3) failed earlier (at 24 h) than
the mixes with higher w/c ratios (lower strength), w/c= 0.4 at 4 days and w/c=0.5 at 18days.
Similar result were reported by Altoubat and Lange [3]. It is therefore, important to
understand factors responsible for the failure of restrained concrete. One factor can be the
stress history (magnitude and rate of development) which depends on the stiffness
(magnitude and rate of development) and shrinkage strains. For w/c =0.3 the stiffness
develops faster (Figure 5.11b) which can lead to higher tensile stress developing at very
early ages. Furthermore, autogenous and thermal shrinkage strains are higher in low w/c
ratios mixes and less moderated by creep.

Chapter 5 Assessment of Post-Restrained Shrinkage Mechanical Properties of Concrete- Parametric Study (Part II)
111
Figure 5. 11 (a) Evolution of compressive strength, (b) and predicted evolution of elastic modulus for all mixes.
5.3.4 Restraint Factor RF
5.3.4.1 Theoretical RF
Linear elastic Finite Element Analysis (FEA) was undertaken (see Figure 5.12) to assess
strain losses due to deformations of the restraining frame and local deformations of the
specimens ends. Similar analysis was also undertaken by the authors previously [18] for the
single rig. The analysis was carried out by applying a tensile force on each of the threaded
bars to simulate the tensile force that develops inside restrained concrete upon drying. The
analysis shows that there are global deformations (bending and contraction) in the
restraining frame and local deformations at the ends (where the threaded bars are attached to
the frame). For example, when a 100 µε of concrete shrinkage (Ec= 26 GPa) is restrained,
the expected tensile force will result in a total strain loss (shortening and bending of the
10
20
30
40
50
60
70
80
0 2 4 6 8 10 12 14 16 18 20 22 24 26 28
fcu
(MPa
)
Age (days)
NA30
NA40
NA50(a)
20
25
30
35
40
0 2 4 6 8 10 12 14 16 18 20 22 24 26 28
Ec
(GPa
)
Age (days)
NA30
NA40
NA50(b)

Chapter 5 Assessment of Post-Restrained Shrinkage Mechanical Properties of Concrete- Parametric Study (Part II)
112
beams and deformations of the ends) of 205 µε, 112 µε and 132 µε for T, M and B
specimens, respectively. It should be noted that the top concrete specimen is likely to resist
the rotation of the frame and hence its RF may be better than determined by this analysis.
For the single rig, the same tensile force causes a total strain loss of 263 µε. This means that
the use of the frame reduced the strain loss by an average of 43% (22% for T, 57% for M
and 50 % for B).
Figure 5. 12 Deformed shape and axial stresses of the restraining frame.
To determine the variation of the estimated (theoretical) RF over time and compare it with
the apparent (measured) RF for the restraining frame, a procedure developed in previous
work by the authors [18] is used to estimate the theoretical RF of the rig. Figures 5.13 (a-c)
show the estimated RF of the T, M and B specimens for all mixes. As expected the lower the
w/c ratio of the mix the lower the RF as stiffer concrete can pull in the ends more, thus
leading to more deformation and strain loss.

Chapter 5 Assessment of Post-Restrained Shrinkage Mechanical Properties of Concrete- Parametric Study (Part II)
113
Figure 5. 13 Estimated RF of the T, M and B specimens a- NA30, b- NA40, c- NA50.
5.3.4.2 Results of Un-cracked specimens
NA30
Figures 5.14 a and b show the RF versus time of non-failed specimens for NA30. As
expected the RF for the sides is higher than the top surface. For example, the RF after one
day of drying for specimens T and M are 55% and 63% (on the sides) and 42% and 58% (on
the top), respectively. However, by day 7, the RF for specimens T and M decreases to 30%
and 36% (on the sides) and to 18% and 30% (on the top), respectively. After releasing the
0.0
0.2
0.4
0.6
0.8
1.0
0 5 10 15 20 25 30
Rest
rain
t Fac
tor
Drying time (day)
Estimated RF-T
Estimated RF-M
Estimated RF-B
Average-Estimated RF
NA30 (a)
0.0
0.2
0.4
0.6
0.8
1.0
0 5 10 15 20 25 30
Rest
rain
t Fac
tor
Drying time (day)
Estimated RF-T
Estimated RF-M
Estimated RF-B
Average- Estimated RF
NA40 (b)
0.0
0.2
0.4
0.6
0.8
1.0
0 5 10 15 20 25 30
Rest
rain
t Fac
tor
Drying time (day)
Estimated RF-T
Estimated RF-M
Estimated RF-B
Average- Estimated RF
NA50 (c)

Chapter 5 Assessment of Post-Restrained Shrinkage Mechanical Properties of Concrete- Parametric Study (Part II)
114
strain on day 7, the RF of specimens T and M increased on average 9% on the sides and
8.5% on the top. This was caused by an expansion of around 15 με. After this time, RF more
or less stabilizes.
Figure 5. 14 Restraint factor versus drying time on the sides and the top surface for mix NA30 a- Specimen T, b- Specimen M.
NA40
Figures 5.15 a and b show the development of the RF for mix NA40. For the first few days,
the RF for the sides is higher than that of the top, but after that the opposite applies. After
24h of drying exposure, the RF values of the M and B specimens were 71% and 60% (for
sides) and 59% and 50% (for top), respectively. These values decreased to 31% and 31%
(for sides) and 43% and 40% (for top) after 7 days. For both specimens the development of
RF slows down after the first few days. After releasing the strain, specimen T failed (as
discussed in section 3.2.2). The RF on average increased by 14%, corresponding to an
apparent expansion of around 20 με.
0
10
20
30
40
50
60
70
80
90
100
0 5 10 15 20 25 30
RF (%
)
Drying time (days)
Side
Top
NA30 - T (a)
0
10
20
30
40
50
60
70
80
90
100
0 5 10 15 20 25 30
RF (%
)
Drying time (days)
Side
Top
NA30 - M (b)

Chapter 5 Assessment of Post-Restrained Shrinkage Mechanical Properties of Concrete- Parametric Study (Part II)
115
Figure 5. 15 Restraint factor versus drying time on the sides and the top surface for mix NA40 a- Specimen M, b- Specimen B.
NA50
The RF development of un-cracked specimens T and B for mix NA50 are shown in Figures
5.16 a and b. Unlike mix NA30, RF for the top is higher than that of the sides, especially
during the first week of drying. After 24h of drying, the RF values of the T and B specimens
were 64% and 70% (for sides) and 76% and 69% (for top), respectively, These values
decreased sharply by an average of 45% on the sides and 33% on top just before releasing
the strain in the frame. After strain release, none of the specimens failed and the RF of the
sides increased to around 53 % due to an apparent expansion of around 35 με.
0
10
20
30
40
50
60
70
80
90
100
0 5 10 15 20 25 30
RF (%
)
Drying time (days)
Side
Top
NA40 - M (a)
0
10
20
30
40
50
60
70
80
90
100
0 5 10 15 20 25 30
RF (%
)
Drying time (days)
Side
Top
NA40 - B (b)

Chapter 5 Assessment of Post-Restrained Shrinkage Mechanical Properties of Concrete- Parametric Study (Part II)
116
Figure 5. 16 Restraint factor versus drying time on the sides and the top surface for mix NA50 a- Specimen T, b- Specimen B.
5.3.4.3 Discussion on RF of un-cracked specimens
Overall RF loss
Figures 5.17 (a-f) show theoretical (estimated) and the apparent (measured) RF of the
uncracked specimens for each mix. It can be seen that the majority of strain and RF loss for
all specimens can be attributed to the relative stiffness between the frame and the concrete
specimens. Nonetheless, the theoretical prediction still underestimates the long-term RF loss,
possibly due to some loss of stiffness or creep (relaxation) of concrete due to the enforced
expansion.
0
10
20
30
40
50
60
70
80
90
100
0 5 10 15 20 25 30
RF (%
)
Drying time (days)
Side
Top
NA50 - T (a)
0
10
20
30
40
50
60
70
80
90
100
0 5 10 15 20 25 30
RF (%
)
Drying time (days)
SideTop
NA50 - B (b)

Chapter 5 Assessment of Post-Restrained Shrinkage Mechanical Properties of Concrete- Parametric Study (Part II)
117
Figure 5. 17 Average theoretical RF and measured RF on the top and the sides of un-cracked restrained specimens for all mixes.
Initial RF loss
Apparent RF is initially very high for all mixes and on all surfaces (see Figures 5.17 a-f), but
decreases at a high rate during the first few days. This may be attributed to that fact that the
early age microcracking may have reduced the stiffness gain of the concrete, resulting in less
strain loss than expected. After that initial stage and up to 7 days, the rate of reduction in RF
either slows down (stabilises) or even increases. This can be due the effect of unwanted
cracks developing at the end of the specimen beyond the shrinkage measuring region,
impairing the restraint efficiency of these anchored ends and resulting in low apparent RF.
0.0
0.2
0.4
0.6
0.8
1.0
0 5 10 15 20 25 30
Rest
rain
t Fac
tor
Drying time (day)
Average-Estimated RF
Apparent RF-Top
Apparent RF-Side
NA30 - T(a)
0.0
0.2
0.4
0.6
0.8
1.0
0 5 10 15 20 25 30
Rest
rain
t Fac
tor
Drying time (day)
Average-Estimated RF
Apparent RF-Top
Apparent RF-Side
NA30 - M(b)
0.0
0.2
0.4
0.6
0.8
1.0
0 5 10 15 20 25 30
Rest
rain
t Fac
tor
Drying time (day)
Average- Estimated RF
Apparent RF-Top
Apparent RF-Side
NA40 - M(c)
0.0
0.2
0.4
0.6
0.8
1.0
0 5 10 15 20 25 30
Rest
rain
t Fac
tor
Drying time (day)
Average- Estimated RF
Apparent RF-Top
Apparent RF-Side
NA40 - B(d)
0.0
0.2
0.4
0.6
0.8
1.0
0 5 10 15 20 25 30
Rest
rain
t Fac
tor
Drying time (day)
Average- Estimated RF
Apparent RF-Top
Apparent RF-Side
NA50 - T(e)
0.0
0.2
0.4
0.6
0.8
1.0
0 5 10 15 20 25 30
Rest
rain
t Fac
tor
Drying time (day)
Average- Estimated RF
Apparent RF-Top
Apparent RF-Side
NA50 - B(f)

Chapter 5 Assessment of Post-Restrained Shrinkage Mechanical Properties of Concrete- Parametric Study (Part II)
118
Difference between RF on the top and sides surfaces for different mixes
The RF at the top is lower than that of the average of the sides for mix NA30, whereas the
opposite applies for NA50. For mix NA40, the RF at the top is lower only for the first few
days. It was observed, from both free (Part I) and restrained shrinkage strains, that for all
mixes the shrinkage strains on the top are always higher than those developed on the sides.
Hence, the RF (measured) is expected to be lower at the top than the sides. This can explain
the trend of RF of mixes NA30 and NA40, but not that of mix NA50. Therefore, there
should be another factor that affects the RF results. This could be the effect of shrinkage
curvature (due to difference in shrinkage strains between top, sides and bottom surfaces of
the concrete specimens), shown in Part I for free shrinkage. To assess the effect of the
shrinkage curvature on the RF, the efficiency of the frame in restraining curvature should be
evaluated. This can be done by comparing the amount of the curvature on the restrained and
free specimens. The restrained specimens curvature can be obtained by calculating the
difference in restrained shrinkage strains, between the top and the sides of the specimens.
Though the configuration of the frame does not allow measuring shrinkage strains at the
bottom of the restrained specimen, curvature of the upper half of the specimens (kT-S) can be
obtained.
Figures 5.18 (a-c) show the evolution of the average curvature for the free specimen and the
relative restrained curvature for uncracked specimens for all mixes. It can be seen that there
is significant difference in the degree of restraint that the frame provides against shrinkage
curvature for different mixes. The stronger the mix, the lower the degree of restraint and this
can explain why the RF at the top is not always lower than that of the sides. There is almost
no restraint against curvature for mix NA30, since the top surface shrinks more than the
sides leading to lower RF values at the top than the side (see Figure 5.14). For the weaker
mix NA50 which wants to curve more, there is more resistance to the curvature by the frame
and as a result, the apparent RF at the top is higher than that for the sides (see Figure 5.16).

Chapter 5 Assessment of Post-Restrained Shrinkage Mechanical Properties of Concrete- Parametric Study (Part II)
119
Figure 5. 18 Average shrinkage curvature developed on free specimens and average shrinkage curvature restrained by the frame, (a) mix NA30, (b) mix NA40, (c) mix NA50.
5.4 Mechanical Properties
Almost all previous studies utilize uniaxial compression tests to quantify the effect of drying
on concrete mechanical properties (strength and stiffness). Such mechanical properties may
be affected by the drying shrinkage (without external restraint) in two ways:
1) The strength increases as a result of an increase in capillary pressure (which acts as
isotropic pressure) on the C-S-H particles when saturation decreases. This can lead to a
stiffening effect by increasing the bonding between the C-S-H particles [20-22]. This is
-0.5
0.0
0.5
1.0
1.5
2.0
2.5
3.0
3.5
4.0
0 5 10 15 20 25 30Cu
rvat
ure
×10-3
(m-1
) Drying time (days)
KT-S Free-NA30
KT-S Restrained NA30
(a)
0.0
0.5
1.0
1.5
2.0
2.5
3.0
3.5
4.0
0 5 10 15 20 25 30
Curv
atur
e ×1
0-3 (m
-1)
Drying time (days)
KT-S Free-NA40
Restrained NA40
(b)
0.0
0.5
1.0
1.5
2.0
2.5
3.0
3.5
4.0
0 5 10 15 20 25 30
Curv
atur
e ×1
0-3 (m
-1)
Drying time (days)
KT-S Free-NA50
Restrained NA50
(c)

Chapter 5 Assessment of Post-Restrained Shrinkage Mechanical Properties of Concrete- Parametric Study (Part II)
120
amplified by the confining effect of the core of the specimen due to moisture gradients
increasing the concrete rigidity [7] .
2) The strength and the stiffness decrease due to the formation of microcracks (which
develop due to non-uniform shrinkage, enhanced by local restraint by the aggregates) [20].
The evolution of the mechanical properties is dominated by the opposing effects of these
two phenomena: strengthening (stiffening) of materials and drying shrinkage induced
microcracking [20, 23].
5.4.1 Compressive Strength (Cubes)
Compressive strength after 1, 3, 7 and 28 days of curing is presented in Table 5.2 and
Figure 5.11. Table 5.2 also includes the standard of deviation (SD) of the results and the
normalized strength to that of NA40. As expected, the high strength concrete (w/c =0.3)
exhibited higher compressive strength and also showed higher rate of strength development
in comparison to mixes 0.4 and 0.5 w/c.
Table 5. 2 Compressive strength, normalized strength and standard deviation (SD) of all mixes.
Mix Type
Compressive Strength (MPa) at different ages
Normalized Strength at different ages
SD
1 3 7 28 1 3 7 28 1 3 7 28
NA30 46.6 58.0 63.0 70.1 1.42 1.25 1.28 1.18 0.6 0.4 0.6 1.4
NA40 23.7 46.5 49.3 59.4 1 1 1 1 0.6 0.7 1.2 0.3
NA50 20.6 33.8 39.6 50.1 0.63 0.73 0.8 0.84 0.5 0.3 0.3 0.5
5.4.2 Compressive Strength (Prisms)
The compressive strength was also determined from specimens exposed to free (F) and
restrained shrinkage (R) and for the control prisms (water cured prisms, WC) as shown in
Figure 5.19 a-c. The tests were conducted on portions of prisms already tested and broken in
bending. All results presented in this section are the average of three tests per mix and

Chapter 5 Assessment of Post-Restrained Shrinkage Mechanical Properties of Concrete- Parametric Study (Part II)
121
normalized to the values of the compressive strength of the water cured cube specimens
(Cube) at 28 days.
A comparison between the normalized compressive strength obtained from portions of water
cured prisms (WC) with those obtained from water cured cube specimens (Cube), for all
mixes, reveals that the difference between the two samples is negligible. Hence, using the
BS 1881-119 [15] approach to obtain compressive strength can be considered fairly
accurate.
As expected, drying (in both conditions free and restrained) reduces the compressive
strength by about 10-14%. Regardless of the w/c ratio, the normalized strength of the dried
specimens is in the range of 0.86-0.87 for F specimens and in the range of 0.86-0.90 for R
specimens. Though surface microcracking due to shrinkage could reduce compressive
strength, its effect appears to be relatively small compared to the long term effect of
maturity. This may partly explain discrepancies in the results in the previous studies [20].
(a) (b)
(c)
Figure 5. 19 Normalized compressive strength a- NA30, b- NA40, c- NA50.
There is insignificant difference between the compressive strength of F and R specimens.
This means that the cracks developed on the unrestrained specimens and on the restrained
specimens had almost the same effect on the compressive strength of the concrete. One
1.000.86 0.90 0.95
0.0
0.2
0.4
0.6
0.8
1.0
1.2
Cube F R WC
Nor
mal
ized
fcu
/28
day
Specimen Type
NA30
1.000.87 0.86
0.99
0.0
0.2
0.4
0.6
0.8
1.0
1.2
Cube F R WC
Nor
mal
ized
fcu
/28
day
Specimen Type
NA40
1.000.86 0.86
0.99
0.0
0.2
0.4
0.6
0.8
1.0
1.2
Cube F R WC
Nor
mal
ized
fcu
/28
day
Specimen Type
NA50

Chapter 5 Assessment of Post-Restrained Shrinkage Mechanical Properties of Concrete- Parametric Study (Part II)
122
possible reason behind this is the way the specimens are tested in the compression machine.
Most shrinkage induced macrocracks (developed on the edges) lay in the regions close to
the upper and lower plates of the machine (see Figure 5.20), which are well confined. Hence,
this test may overestimate the actual strength by up to 10-15%.
Figure 5. 20 Sample for compressive strength test from a restrained specimen.
5.4.3 Flexural Strength
After 28 days of drying, the free shrinkage specimens were prepared for the bending test.
The position of the supports and load points varied according to the type of the specimens
(free or restrained). This is explained below:
Free Shrinkage specimens
When possible, the bending test was conducted twice on two parts of the same specimen.
The position of the supports and the point loads in the two cases are illustrated in Figure
5.21.
Figure 5. 21 Positions of supports and loads in bending test for free shrinkage specimens (dimensions in mm).
Confined zones
Bending test crack
100
100 100 100P P
P P100 100 100
750
Troweled surface

Chapter 5 Assessment of Post-Restrained Shrinkage Mechanical Properties of Concrete- Parametric Study (Part II)
123
Restrained Shrinkage specimens
The load points and supports used are shown in Figure 5.22. The location of these were
selected so as to capture within the critical region the widest crack and as many cracks
caused by the restrained shrinkage. In Figure 5.1, the critical region is shaded in grey when
in tension and with diagonal lines when in compression. The macrocracks and their
maximum width at the edge are also shown in the Figure 5.1.
Figure 5. 22 Positions of supports and loads in bending test for restrained shrinkage specimens (dimensions in mm).
Figures 5.23 a-c show the average (from 3 specimens) load-deflection curves for water cured
(WC) and free shrinkage specimens (F), as well as the curves of all restrained shrinkage
specimens (RT, RM and RB) for all mixes. Table 5.3 shows the results of the flexural strength
(magnitude and normalized to that of WC) for all mixes. It is clear that shrinkage induced
cracks affect the flexural strength of mixes with different w/c ratios in a different manner.
For mix NA30, in comparison to WC, F specimens showed lower flexural strength (decrease
of 23%). The strength reduction for the restrained specimens was in a similar range of 11-
24%. The free and restrained specimens of mix NA40 showed comparable or even higher
flexural strength to that of the WC specimens. For mix NA50, the flexural strength was
slightly increased (by 5% ) for F specimens or slightly reduced (by 2-5%) for restrained
specimens.
It is clear that shrinkage of concrete under free and restrained conditions affects the flexural
strength of low w/c (0.3) mixes more than that of high w/c mixes (0.4 and 0.5). This may be
due to higher autogenous and thermal shrinkage (due to hydration). The higher rate of
(3)
(2)
(1)
P P100 100 100
P P100 100 100
P P100 100 100
750(1)
(2)
(3)
Troweled surface

Chapter 5 Assessment of Post-Restrained Shrinkage Mechanical Properties of Concrete- Parametric Study (Part II)
124
shrinkage (autogenous and drying, see Part I) and elastic modulus evolution (see Figures
5.11) of mix NA30 (w/c= 0.3), in comparison to mixes NA40 and NA50, also leads to faster
rate of tensile stress development. A higher rate of shrinkage and elastic evolution also
reduces relaxation by creep. These lead to earlier and more intensive microcracking (see
Figure 5.1) which can affect adversely the flexural strength.
Figure 5. 23 Load-deflection curves for WC (average), F (average) and restrained specimens, a- NA30, b- NA40, c-NA50.
0
4
8
12
16
20
24
0.00 0.02 0.04 0.06 0.08 0.10
Bend
ing
load
(kN
)
Mid-span deflection (mm)
(a)
Average WCAverage F Top Middle Bottom
NA30
0
4
8
12
16
20
0.00 0.02 0.04 0.06 0.08 0.10
Bend
ing
load
(kN
)
Mid-span deflection (mm)
(b) NA40
Average WCAverage F Top Middle Bottom
0
4
8
12
16
0.00 0.02 0.04 0.06 0.08 0.10
Bend
ing
Load
(kN
)
Mid-span deflection (mm)
(c) NA50
Average WCAverage F Top Middle Bottom

Chapter 5 Assessment of Post-Restrained Shrinkage Mechanical Properties of Concrete- Parametric Study (Part II)
125
Table 5. 3 Flexural strength and Efmax for all mixes.
Mix No. of specimens
Type of specimen
Flexural strength
in MPa (*)
Normalized Flexural strength
Efmax in
GPa (*)
Normalized Efmax
NA30
3 WC 6.4 (0.1) 1 42.3 (0.2) 1
4 F 4.9 (0.3) 0.77 38.6 (2.3) 0.91
1 RT 4.8 0.76 37.6 0.85
1 RM 5.7 0.89 38.0 0.89
1 RB 4.9 0.77 35.6 0.84
NA40
3 WC 4.9 (0.2) 1.0 39.7 (0.3) 1
4 F 4.9 (0.3) 1.0 38.7 (0.2) 0.97
1 RT 4.6 0.94 36.3 0.91
1 RM 5.1 1.04 33.5 0.84
1 RB 5.0 1.02 33.4 0.84
NA50
3 WC 3.9 (0.4) 1.0 36.2 (4.2) 1
5 F 4.1 (0.3) 1.05 34.3 (1.2) 0.95
1 RT 3.8 0.98 32.2 0.89
1 RM 3.7 0.95 27.3 0.75
1 RB 3.8 0.98 25.8 0.71
*Standard deviation. Values in italic represents results of cracked restrained specimens.
5.4.4 Flexural Elastic Modulus Efmax
Figures 5.24 a-c show the averaged Eflex- bending load curves for WC and F specimens and
the curves of restrained specimens (Top, Middle and Bottom) for all mixes. The results of
Efmax (magnitude and normalized to that of WC) for all mixes are also shown in Table 5.3. In
general, it can be seen that shrinkage induced cracks affected negatively the Efmax of both
free and restrained specimens with more pronounced effects on the restrained specimens.

Chapter 5 Assessment of Post-Restrained Shrinkage Mechanical Properties of Concrete- Parametric Study (Part II)
126
Figure 5. 24 Flexural elastic modulus versus bending load for WC, F and restrained specimens, a- NA30, b- NA40, c- NA50
In comparison to that of the WC specimens, the average Efmax of the unrestrained specimens
decreased by 9%, 3% and 5% for mixes NA30, NA40, and NA50, respectively. Just as the
flexural strength, the damage of Efmax in the mix with low w/c ratio (0.3) was higher than
mixes with high w/c ratios (0.4 and 0.5). This reduction is also attributable to the same
previously mentioned effect of surface microcracking.
Macro and micro cracks affected the Efmax more adversely in restrained specimens. In
particular, Efmax for RM and RB of mix NA50 was lower than that of the WC specimens by
25% and 29% , respectively, whereas Efmax of specimen RT reduced by only 11%. The lower
reduction of RT specimen may be due to the fact that during drying exposure, two
0
10
20
30
40
50
60
0 2 4 6 8 10 12 14 16 18 20 22E f
lex
(GPa
)
Bending Load (kN)
(a)
Average WCAverage F Top Middle Bottom
NA30
0
10
20
30
40
50
60
0 2 4 6 8 10 12 14 16 18 20 22
E flex
(GPa
)
Bending Load (KN)
Average WCAverage FTopMiddleBottom
NA40(b)
0
10
20
30
40
50
60
0 2 4 6 8 10 12 14 16
E fle
x(G
Pa)
Bending Load (kN)
(c)
Average WCAverage F Top Middle Bottom
NA50

Chapter 5 Assessment of Post-Restrained Shrinkage Mechanical Properties of Concrete- Parametric Study (Part II)
127
macrocracks developed at the ends of the specimen which may have reduced the restraint
efficiency resulting in less cracking development see Figure 5.1. The reduction in Efmax of
the restrained specimens for mixes NA40 and NA30 was in the range of 9-16 % and 11-16
%, respectively as can be seen in Table 5.3. These results point towards creep as a
mechanism of relaxation that stretches the material, creating many microcracks and reducing
the elastic modulus. In fact there is a correlation between the width of the cracks in the
critical region and Efmax loss as shown in Figure 5.25.
Figure 5. 25 Effect of crack width on the loss of Efmax.
5.5 Conclusions
For restrained concrete, cracking and failure due to shrinkage strains is a function of the
concrete properties, since they govern the stiffness and the stress history.
For the proposed ''passive'' restraining frame, the majority of strain and RF loss can be
attributed to the relative stiffness between the frame and the concrete specimens. Long-term
RF loss may also be recorded due to loss of stiffness in the anchored zone and creep of
concrete due to the enforced expansion.
Apparent RF decreases at a relatively high rate over the first few days due to early age
microcracking which slows down elastic modulus development. Nonetheless, microcracking
reduces the overall stiffness gain of the concrete, resulting in less overall strain loss than
expected.
Drying (in both conditions free and restrained) reduces the compressive strength of concrete
by about 10-14%. Though surface microcracking due to shrinkage is expected to reduce
y = 4.90e0.04x
R² = 0.61
-35
-30
-25
-20
-15
-10
-5
00 10 20 30 40 50
Loss
of E
flex
(%)
Crack width (µm)

Chapter 5 Assessment of Post-Restrained Shrinkage Mechanical Properties of Concrete- Parametric Study (Part II)
128
compressive strength, its effect appears to be relatively small compared to the long term
effect of maturity on strength. This may partly explain discrepancies in compressive strength
trends in previous studies.
There is insignificant difference between the residual compressive strength of free and
restrained specimens, possibly due to the fact that most restrained shrinkage induced
macrocracks are found in the regions close to the upper and lower plates of the compression
test machine, which are well confined. Hence, the standard compression test may
overestimate the actual strength of concrete. Frictionless surfaces may help reduce this
problem.
Shrinkage induced cracks affect the flexural strength of concrete mixes with different w/c
ratios in a different manner. The effects are more pronounced for mixes with low w/c (0.3)
(reduction 11-24%) than for mixes with high w/c (0.4 and 0.5) (reduction in the range of 2-
5%). This may be due to high autogenous and early thermal shrinkage (due to hydration). A
higher rate of shrinkage and elastic modulus evolution can lead to a faster rate of tensile
stress development and may reduce relaxation /creep if stiffness develops too fast. This can
lead to earlier and more intensive microcracking which can affect adversely the flexural
strength.
For ''Free'' shrinkage specimens, just as the flexural strength, the damage of Efmax in the mix
with low w/c ratio (0.3) was higher (reduction of 9%) than high w/c ratios mixes (0.4 and
0.5) (reduction of 3-5%) due to the effect of surface microcracking.
For restrained specimens, the reduction in Efmax for w/c ratios 0.3 and 0.4 was up to 16%
whilst mix 0.5 suffered the highest reduction up to 29%. This is despite the fact that this mix
had little or no flexural strength loss.
Overall, macro and micro cracks affected the Efmax more adversely in restrained specimens.
These results point towards creep as a mechanism of relaxation that stretches the material,
creating many microcracks reducing the elastic modulus. The higher this relaxation the
larger it takes for the through crack to develop as was the case with w/c 0.5.
There is a correlation between increasing width of cracks in the critical region and flexural
elastic modulus loss.

Chapter 5 Assessment of Post-Restrained Shrinkage Mechanical Properties of Concrete- Parametric Study (Part II)
129
References
1. Bažant, Z.P. and L.J. Najjar, Drying of concrete as a nonlinear diffusion problem. Cement and Concrete Research, 1971. 1(5): p. 461-473.
2. Wittmann F.H., Creep and Shrinkage Mechanisms, in Creep and Shrinkage in Concrete Structures, Z.P. Bazǎnt and Wittmann F.H., Editors. 1982, John Wiley &Sons: Chichester. p. 129-161.
3. Altoubat, S.A. and D.A. Lange, Creep, shrinkage, and cracking of restrained concrete at early age. ACI Materials Journal/ SP, 2001. 98(4): p. 323-331.
4. ACI 231R-10, Report on Early-Age Cracking: Causes, Measurement, and Mitigation, in ACI Committee 231. 2010, American Concrete Institute: Farmington Hills, U.S.A.
5. Neville, A.M., Properties of concrete. 1995, Harlow: Longman Group.
6. Nielsen, K.E.C., Effect of various factors on the flexural strength of concrete test beams Magazine of Concrete Research, 1954. March 1954: p. 105-114.
7. Yurtdas, I., et al., Evolution of the mechanical behaviour of a high performance self-compacting concrete under drying. Cement and Concrete Composites, 2011. 33(3): p. 380-388.
8. Bisschop, J. and J.G.M. Van Mier, Drying shrinkage microcracking in cement-based materials. Heron, 2002. 47(3): p. 163-184.
9. Idiart, A.E., Coupled analysis of degradation processes in concrete specimens at the meso-level, in Geotechnical Engineering and Geoscience 2009, Polytechnic University of Catalunya: Barcelona.
10. Shiotani, T., J. Bisschop, and J.G.M. Van Mier, Temporal and spatial development of drying shrinkage cracking in cement-based materials. Engineering Fracture Mechanics, 2003. 70(12): p. 1509-1525.
11. Bentur, A., Early-Age Shrinkage and Cracking in Cementitious Systems. Concrete Science and Engineering, 2001. 3: p. 3-12.
12. ACI 207.2R, Report on Thermal and Volume Change Effects on Cracking of Mass Concrete, A.C. 207, Editor. 2002, American Concrete Institute: Farmington Hills, U.S.A.
13. Abbasnia, R., P. Godossi, and J. Ahmadi, Prediction of restrained shrinkage based on restraint factors in patching repair mortar. Cement and Concrete Research, 2005. 35(10): p. 1909-1913.
14. BS EN 12390-3:2009, Testing hardened concrete Part 3: Compressive strength of test specimens. 2009, British Standards Institution: London.
15. BS 1881-119:2011, Testing concrete. Method for determination of compressive strength using portions of beams broken in flexure (equivalent cube method). 2011, BSI: London-UK. p. 12.
16. ASTM-C1018-97, Standard Test Method for Flexural Toughness and First-Crack Strength of Fiber-Reinforced Concrete (Using Beam With Third-Point Loading). 1997, ASTM International.
17. Japan Society of Civil Engineers(JSC)-SF4, Methods of tests for flexural strength and flexural toughness of steel fibre reinforced concrete. 1994, Concrete Library of JSCE. p. 58-61.

Chapter 5 Assessment of Post-Restrained Shrinkage Mechanical Properties of Concrete- Parametric Study (Part II)
130
18. Younis, K.H. and K. Pilakoutas, Assessment of Post-Restrained Shrinkage Mechanical Properties of Concrete ACI Materials, 2014. Submitted for publication.
19. BS EN 1992-1-1:2004, Eurocode 2: Design of concrete structures — Part 1-1: General rules and rules for buildings 2004, British Standard Institution: London, UK.
20. Yurtdas, I., et al., Influences of water by cement ratio on mechanical properties of mortars submitted to drying. Cement and Concrete Research, 2006. 36(7): p. 1286-1293.
21. Kanna, V., R.A. Olson, and H.M. Jennings, Effect of shrinkage and moisture content on the physical characteristics of blended cement mortars. Cement and Concrete Research, 1998. 28(10): p. 1467-1477.
22. Pihlajavaara, S.E., A review of some of the main results of a research on the ageing phenomena of concrete: Effect of moisture conditions on strength, shrinkage and creep of mature concrete. Cement and Concrete Research, 1974. 4(5): p. 761-771.
23. Burlion, N., F. Skoczylas, and T. Dubois, Induced anisotropic permeability due to drying of concrete. Cement and Concrete Research, 2003. 33(5): p. 679-687.

Chapter 6 Post-Restrained Shrinkage Behaviour of Concrete Made with Recycled Materials
131
Chapter 6 Post-Restrained Shrinkage Behaviour of Concrete Made with Recycled Materials
Younis, K.H. , K. Pilakoutas and K. Neocleous, Post-restrained shrinkage behaviour of concrete: Effect of Recycled Materials. Cement and Concrete Composites, 2014.to be Submitted.
Shrinkage induced cracks can have an adverse effect on strength and durability of concrete
in particular when using recycled aggregate (RA). Randomly distributed steel fibres are
normally used to control crack development due to shrinkage. This study examines the effect
of recycled tyre steel fibres (RTSF) -extracted from post consumer tyres- and RA -from
construction and demolition waste- on the restrained shrinkage behaviour of concrete.
Experiments were performed on six mixes in different drying and restraining conditions to
determine free and restrained shrinkage, loss of mass, compressive strength, flexural
strength and flexural elastic modulus. The results show that whilst conventional fibres do not
affect much shrinkage strain development, RTSF increase initial shrinkage strains due to
higher air content in the mix. Despite that, it was found that RTSF lead to an overall better
flexural performance, even when using RA concrete due to the role of RTSF in controlling
shrinkage induced microcracking, enhancing tensile relaxation and promoting auto-healing
of microcracks. The results confirm that it is possible to use RA to produce concrete for
structural applications.
This chapter consists of a “stand alone” journal paper and includes relevant bibliography
at the end of the chapter. Appendix G provides further test results.

Chapter 6 Post-Restrained Shrinkage Behaviour of Concrete Made with Recycled Materials
132
6.1 Introduction
To enhance the sustainability of concrete, recycled aggregate (RA) and recycled aggregate
concrete (RAC) is beginning to be used in practice. However, there are concerns relating to
RA and RAC variability, low density, high water absorption and porosity which can result in
low quality concrete (low compressive, tensile and flexural strength and low elastic
modulus). Another critical issue is high shrinkage [1-4] due to the heterogeneous
composition, high porosity and water absorption and low restraint from RA particles. High
shrinkage can increase the cracking tendency, in particular when RAC is restrained. On the
other hand, the higher creep of RAC [2, 4], and its lower elastic modulus, can play a role in
reducing the effects of shrinkage induced tensile stresses. Very limited work has been
conducted on the behaviour of RAC under restrained conditions.
Concrete loses volume in response to the chemical reactions of hydration, as well as to
initial temperature and moisture loss. This volume loss, or shrinkage, can lead to
unacceptable strain development and limit state perfromance [5, 6]. Due to internal (e.g.
aggregate and reinforcement) and external (e.g. ground or adjacent members) restraints,
shrinkage strains also cause tensile stresses. When tensile stresses exceed the strength of the
concrete, cracks develop. Such cracks can start before the application of external loads and
even at very early ages [7]. Shrinkage induced cracks can adversely affect structural
appearance, structural strength and durability of concrete. Delaying the development of
cracks and minimizing their width are vital in mitigating performance deterioration.
Randomly distributed steel fibres are often used to control crack development due to
shrinkage strains. It is reported by some [8-11] that the addition of fibres can decrease free
shrinkage in concrete. This is attributed to the physical restraining effect (similar to
aggregate restraining effect) which develops due to the interfacial bond between fibres and
matrix [12]. Other studies [11, 13-15] show that the addition of low contents of steel fibres
(less than 1% by volume) does not alter the shrinkage behaviour of concrete. Finally, some
studies [16, 17] show that fibres may be responsible of an increase in the porosity of
concrete resulting in higher free shrinkage strains. Therefore, it appears that there is no
general agreement on the effect of fibres even on the free shrinkage behaviour of concrete.
Undoubtedly, the most significant effect of fibres in concrete is their ability to control crack
width and propagation after matrix failure. In this respect, fibres can play three significant
roles: 1) encourage the development of fine smeared cracks rather than a few wide cracks, 2)

Chapter 6 Post-Restrained Shrinkage Behaviour of Concrete Made with Recycled Materials
133
transfer tensile stress across cracks, 3) enable the long-term healing/(sealing) of cracks [18,
19].
The effect of fibres on the shrinkage behaviour of concrete under restrained conditions is
commonly studied using the ring test [10, 14, 20-23] or linear ('passive' or 'active') test
configurations [7, 24-26]. These tests have been used to show that fibres delay the
occurrence of cracks and reduce the width of shrinkage induced cracks. Altoubat and Lange
[7] studied the effect of fibres (0.5% volume) on the early age shrinkage-creep interaction
behaviour of concrete under restrained conditions. Although both type of mixes (plain and
FRC) used in the study failed more or less at the same level of shrinkage induced stress, it
was found that steel fibres delay failure time, in comparison to plain mixes, by 44% and
21% for w/c ratios of 0.32 and 0.4, respectively. This was attributed to the role of fibres in
enhancing the tensile relaxation mechanism of concrete due to creep (basic and drying
creep), by engaging a larger volume of the matrix in stress transfer and reducing micro level
damage (microcracking). Altoubat and Lange [27] classified the ''real'' and ''apparent''
mechanisms of creep into beneficial and detrimental. The real mechanism associated with
moisture movement was considered beneficial and the apparent mechanism associated with
microcracking detrimental. They concluded that steel fibres enhance the desirable creep
mechanisms and suppress the undesirable mechanism of microcracking.
Due to the random distribution of steel fibres in concrete, large quantities are needed to yield
the same structural performance of a conventionally reinforced concrete. This can make the
use of industrial steel fibres (IF) non-economical. Recycled Tyre Steel Fibre (RTSF)
extracted from post-consumer tyres can be utilized as a cheaper alternative to IF. The first
investigations on the mechanical properties of recycled tyre steel fibre reinforced concrete
(RTSFRC) mixes to examine their structural performance were started at the University of
Sheffield [28-30]. Utilizing RTSF in concrete has considerable environmental benefits since
only a small fraction of the energy needed to make steel wire is used in their production.
Two unpublished experimental studies on the free shrinkage behaviour of these fibres were
conducted under the EU project ''Ecolanes'' [30]. The shrinkage behaviour of RTSF concrete
under restrained conditions has not been explored yet.
In previous work [31], the authors developed techniques to upgrade the performance of RA
and RAC by treating the surface (coating) of RA using reactive microfillers (e.g silica fume)
and by adding RTSF to the RAC. The promising results (enhancement of the ITZ and an
increase of 30% in compressive strength) have led the authors to investigate the effect of

Chapter 6 Post-Restrained Shrinkage Behaviour of Concrete Made with Recycled Materials
134
these techniques on other properties of RAC such as flexural strength, modulus of elasticity
and shrinkage behaviour (both free and restrained).
This chapter aims to examine the effect of RTSF on the shrinkage behaviour of RAC under
restrained conditions. For comparison purposes, the work includes mixes with industrial
steel fibres (ISF) and natural aggregate (NA). A restraining frame (see Figure 6.1) and
procedure to assess the post-shrinkage behaviour of concrete, previously developed (in
chapter 4 and 5) are utilized. In the next sections, experimental details and testing
procedures will first be explained followed by results and discussion on shrinkage behaviour
(free and restrained) and post-shrinkage mechanical properties for the investigated mixes.

Chapter 6 Post-Restrained Shrinkage Behaviour of Concrete Made with Recycled Materials
135
Figure 6. 1 Frame for restrained shrinkage test (dimensions in mm).
6.2 Experimental Details and Testing Procedures
6.2.1 Materials
In this study, Ordinary Portland Cement (OPC) CEM I 52.5 N, complying with BS EN 197-
1 [32] was used. Natural sand was used as fine aggregates (maximum size of 5mm). Two
types of coarse aggregate (CA) (maximum size of 20 mm) were used; a natural (gravel) river
A-A
Plan view
B
Top (T)
Middle (M)
Bottom (B)

Chapter 6 Post-Restrained Shrinkage Behaviour of Concrete Made with Recycled Materials
136
aggregate and recycled aggregate (RA) (denoted as RAm in this chapter) obtained from
crushing a mix of construction and demolition waste CDW containing crushed concrete,
masonry (brick) and asphalt. Table 6.1 presents the main properties of the NA and RAm
coarse aggregate. Silica fume SF (2% by cement mass) in liquid form was used to coat the
RAm to improve its properties. More details on the composition and other properties of the
RAm can be found elsewhere [31].
Table 6. 1 Properties of coarse aggregate.
Property NA RAm
a Particle density (Mg/m3) 2.63 2.37
Bulk density (kg/m3) 1668 1234
Water absorption (%) 1 5.5
Los Angeles, LA (%) 23 35
a Saturated surface dry.
Industrial fibres from a cold-drawn process (type I according to BS EN 14889-1) were used
and they had a deformed shape as shown in Figure 6.2. The fibre length was 50 mm and the
diameter was 1.0 mm. The fibres had nominal tensile strength of 1100 MPa.
Figure 6. 2 Industrial steel fibres (ISF).
The RTSF used in this research were obtained by post-processing tyre wire derived from the
mechanical processing of post-consumer tyres [33]. The RTSF used had a diameter in the
range of 0.1-0.2 mm and a tensile strength of around 2000 MPa [34] The RTSF comes in
variable lengths ranging from 3-30 mm (5% of the fibres had length shorter than 3mm and
5% longer than 30 mm). The length distribution as determined using a specially developed
image analysis technique is shown in Figure 6.3.

Chapter 6 Post-Restrained Shrinkage Behaviour of Concrete Made with Recycled Materials
137
Figure 6. 3 Length distribution of RTSF.
6.2.2 Variables and Mix Proportions
Six different mixes were prepared with the same w/c ratio (0.4) as shown in Table 6.2. The
mixes can be divided into two groups according to the type of coarse aggregate used. All
mixes had the same quantity of cement (375 kg/m3), water (150 kg/m3) and fine aggregate
(715 kg/m3), whilst the quantity of coarse aggregate used was 1147 kg/m3 for group 1 (NA)
and 1037 kg/m3 for group 2 (RAm). The volume of aggregate was kept constant for all
mixes (0.7 m3). Only one content (2% mass of concrete = 48 kg/m3 ) of fibre was used with
all FRC mixes. Different amounts of superplasticizers were used (see Table 6.2) to achieve
concrete with workability (slump test) between 70-110 mm.
Table 6. 2 Variables of research and code of mixes.
Mix Type of coarse aggregate
Fibre type and content %a
Mix code SPb(l/m3)
1 NA 0 (plain) NA40 1.12
2 NA R, 2 NA40R2 2.25
3 NA I, 2 NA40I2 2.25
4 NA R, (1) + I, (1) NA40R+I 2.25
5 RAm 0 (plain) RAm40 1.40
6 RAmc R, 2 RAm40R2 2.50
a By concrete mass (R= Recycled, I=Industrial). b Superplastiziser. c The surface of the RAm is treated
by coating them with silica fume.
0%
10%
20%
30%
40%
50%
60%
70%
80%
90%
100%
110%
120%
0
20
40
60
80
100
120
140
160
180
200
0 5 10 15 20 25 30 35 40 45 50 55 60
Freq
uenc
y
Length (mm)
Frequency
Cumulative

Chapter 6 Post-Restrained Shrinkage Behaviour of Concrete Made with Recycled Materials
138
6.2.3 Geometry and Preparation of Specimens
For each mix: twelve (100mm) cubes, three control prisms 100*100*500 mm, three prisms
100*100*750 mm for free shrinkage tests, and three prisms (in one frame) for the restrained
shrinkage tests (see Figure 6.1) were cast. The concrete was compacted following the
recommendations of BS EN 12390-2 [35]. The compaction of the concrete specimens in the
restraining frame was achieved by rigidly attaching the frame to the vibrating table through a
steel bar.
6.2.4 Strain Measurements
After compaction and levelling, a rectangular perspex piece was placed on the top surface of
each specimen in the restraining frame. The specimens were then covered by plastic sheets
to prevent moisture loss before demoulding at 24h. After demoulding, the control prisms
were stored in water while the specimens in the restraining frame and the prisms for free
shrinkage were maintained in laboratory environment (22 ±2 oC and RH of 45 ±5 %).
A Demec gauge was used to measure shrinkage strains with length of 300 mm and precision
of 5.2 µɛ. The Demec gauge points spaced at 300 mm were bonded to the concrete surface
using a rapid-hardening adhesive.
The location of the Demec points for the free shrinkage specimens is shown in Figure 6.4a
and for the restrained specimens in Figure 6.1. At the centre of each surface of the concrete
prisms, three demec points were attached to obtain two readings over a length of 300 mm at
specified times.
Figure 6. 4 Location of Demec points for free shrinkage specimens (values presented are in mm).
(a)
300300
AB
C(b)

Chapter 6 Post-Restrained Shrinkage Behaviour of Concrete Made with Recycled Materials
139
Demec points were bonded at 24h just prior to the transfer of the prisms (free and restrained)
to the drying environment. For the restrained specimens, Demec points were fixed to the
sides and top of each specimen as can be seen in Figure 6.1. In some cases, and to examine
the distribution of the shrinkage across the depth of the concrete specimen, Demec points
were attached on the sides surfaces at three depths from the trowelled surface (5 mm (top
A), 50 mm (middle B), and 95 mm (bottom C)), see Figures 6.4b and 6.1. The first shrinkage
strains were measured at 24h (immediately after the adhesive hardened) and at 24 hours
intervals for the first week, followed by measurements at 10, 14, 21 and 28 days. Two or
three readings were taken for each gauge length, and the average values calculated.
6.2.5 Restraint Factor (RF)
According to ACI 207.2R [36] the degree of restraint or restraint factor RF is the ratio of
actual stress induced by the restrained volume change to the stress which would develop if
the specimen was fully restrained. This can also be seen as the ratio of restrained shrinkage
to free shrinkage strain [37]. Assuming a modulus of elasticity that is constant, equation 1
can be used to calculate the RF:
free
R
εε
= RF (6-1)
where:
ɛR Restrained shrinkage strain = shrinkage strain measured on the free specimen - shrinkage strain measured on the restrained specimen.
ɛfree Free shrinkage strain (strain measured on the free specimen).
6.2.6 Crack Detection
Cracks were measured using an optical microscope (40x, precision 20 µm) and a digital
microscope (200x, precision 10 µm). The reported crack width is the crack opening at its
widest, normally at the edges of the specimens. A width of 20 microns or less was used to
define the microcracks, since wider cracks were visible to the naked eye when properly
illuminated.

Chapter 6 Post-Restrained Shrinkage Behaviour of Concrete Made with Recycled Materials
140
6.2.7 Loss of Mass (loss of moisture)
The loss of mass for the free shrinkage specimens were determined at regular intervals using
a balance with the precision of 0.1 g. The first reading, which is considered as the initial
mass, was taken at 24h (after the Demec points were bonded).
6.2.8 Compressive Strength
The compressive strength was obtained at 1, 3, 7, 28 days using the 100 mm cubes and BS
EN 12390-3:2009 [38]. Compressive strength was also obtained from the prisms (free,
restrained and water cured prisms) tested in bending, by following the recommendations of
BS 1881-119:2011[39]. The compressive strength test for prisms was conducted one or two
days after the bending test.
6.2.9 Bending Tests (Flexural Strength and Modulus of Elasticity)
Specimens were tested in four-point flexural loading over a length of 300 mm following the
recommendations of the ASTM C1018 [40]. To eliminate errors from support displacement
and torsion, a yoke [41] was used to mount the deflection transducers. Two linear variable
displacement transducers (LVDTs), placed on opposite sides of the specimen, were used to
determine the average central deflections. From the load versus-deflection curve, the flexural
strength and stiffness were calculated. Flexural modulus of elasticity Eflex (GPa) was
determined based on the theory of classical elasticity [42]. The flexural elastic modulus for
the concrete (Efmax) was determined as the maximum value in the range of 30% to 60% of
the ultimate bending load.
6.3 Results and Discussion - Free Shrinkage Tests
6.3.1 Steel Fibre Reinforced (SFR) NAC
Shrinkage strains (average of three specimens) measured on plain and SFR-NAC mixes are
presented in Figure 6. 5. The addition of 2% (by mass) of IF and 2% of blend fibres appears
to have an insignificant influence on shrinkage strain. However, the addition of same amount
of RTSF, increased the shrinkage strains of the concrete by 35-85 % at early ages (first
week) but only 15% at 28 days.

Chapter 6 Post-Restrained Shrinkage Behaviour of Concrete Made with Recycled Materials
141
Figure 6. 5 Development of free shrinkage strains of plain and SFR-NAC.
As explained earlier there is no general agreement on the effect of steel fibres on free drying
shrinkage of concrete. Fibres can reduce the shrinkage of concrete through their stiffness by
restraining the shrinkage of cement paste. On the other hand, steel fibres may increase the
shrinkage as a result of increased porosity, as air voids can be trapped on their surface. In
these tests there was insignificant difference between the shrinkage values of the plain
concrete (NA40) and the mixes reinforced with ISF (NA40I2 and NA40R+I). However, the
mix reinforced with RTSF (NA40R2) exhibited high shrinkage at the early ages. This may
be attributed to: 1- the curved shape of the RTSF providing less restrain than ISF (which are
more linear and rigid). 2- the smaller diameter of RTSF (4-10 times than ISF) leading to
much larger number per volume and larger surface area, which can lead to more trapped air
and high porosity. Alternatively, at the micro-level, due to the much better distribution of
RTSF fibres, less micro damage (drying microcracks) will develop in the concrete.
Consequently, more intact material per unit volume is expected and higher shrinkage will be
developed on the macro-level. Similar explanation was given by Altoubat and Lange [7] to
account for the higher shrinkage of concrete with (0.5 by volume) polypropylene fibers.
These mechanisms will be discussed again later when other results are examined.
6.3.2 Plain and SFR-RAC
Figure 6.6 shows free shrinkage strains (average of three specimens) developed at the centre
of the specimen sides for mixes NA40, RAm40 and RAm40R2. As expected, both 28 day
shrinkage strain and their rate of development at the early ages for RAC are higher than
those of NAC. The shrinkage strains are 306 µɛ and 405 µɛ at 28 days for NA40 and
0
50
100
150
200
250
300
350
400
450
500
0 5 10 15 20 25 30
Free
Shrin
kage
str
ain
(µε)
Drying Time (days)
NA40/Free -Sides
NA40R+I/Free- Sides
NA40I2/ Free-Sides
NA40R2/Free- Sides

Chapter 6 Post-Restrained Shrinkage Behaviour of Concrete Made with Recycled Materials
142
RAm40, respectively. The shrinkage strains of the RAC is higher than that of NAC by about
31% at 1 day and by 35% at 28 days.
The process of drying of RAC is different than that of NAC. Upon drying, for NAC the
moisture migrates mainly from the cement paste to the surrounding environment, whereas,
in RAC, due to the heterogeneity in composition and the high porosity of the RA, moisture
diffuses out of the concrete through both cement paste and the aggregate itself. Therefore,
the shrinkage of RAC is usually higher than that of NAC. Another reason for the higher
shrinkage of RAC can be the low elastic modulus of RA that provides lower restraining
effect to the shrinkage tendency of the cement paste.
Figure 6. 6 Development of free shrinkage strains of plain NAC, plain RAC and RAC reinforced with RTSF.
Figure 6.6 also shows that the addition of 2% (by mass) of RTSF and the treatment of RA
with SF had an insignificant effect on the shrinkage values of RAC. This may be the result
of two competing effects: increase of shrinkage caused by the effect of RTSF (additional
micro voids) and reduction in shrinkage due to the coating of the RA. Though the amount of
SF used in this study (2%) is quite small in comparison to other studies, the coating may
have densified the ITZ of the RAC and hindered moisture migration to the RA. It should be
noted that SF is known to increase shrinkage of concrete [6, 43].
0
50
100
150
200
250
300
350
400
450
500
0 5 10 15 20 25 30
Free
Shr
inka
ge st
rain
(µɛ)
Drying time (days)
RAm40R2/ Free-Sides
RAm40/ Free- Sides
NA40/Free -Sides

Chapter 6 Post-Restrained Shrinkage Behaviour of Concrete Made with Recycled Materials
143
6.3.3 Effect of Surface and Depth
SFR-NAC
For all mixes, the shrinkage strains at the top, side and bottom surfaces were different. The
highest shrinkage strains were observed at the top surface and the lowest at the bottom
surface, strains on the sides were about the average of the two other faces (see Figures 6.7,
6.8 and 6.9). This may be due to concrete bleeding which usually happens at the top
(troweled) surface altering the microstructure of this surface and possibly resulting in
slightly higher porosity which in turn causes faster drying and more shrinkage. Furthermore,
concrete is better compacted at greater depths resulting in more dense concrete which tends
to shrink less. This difference in shrinkage strains between surfaces at different depths
indicates that upon drying the concrete will also bend due to curvature (see section 3.4).
Figure 6. 7 Development of free shrinkage strains of NA40 at top (T), sides (S) and bottom (B) surfaces.
Figure 6. 8 Development of free shrinkage strains of NA40R+I at top (T), sides (S) and bottom (B) surfaces.
0
50
100
150
200
250
300
350
400
450
500
0 5 10 15 20 25 30
Free
Shr
inka
ge st
rain
(µε)
Drying time (days)
T
S
B
NA40
0
50
100
150
200
250
300
350
400
450
500
0 5 10 15 20 25 30
Free
Shr
inka
ge st
rain
(µε)
Drying time (days)
T
S
B
NA40R+I

Chapter 6 Post-Restrained Shrinkage Behaviour of Concrete Made with Recycled Materials
144
Figure 6. 9 Development of free shrinkage strains of NA40R2 at top (T), sides (S) and bottom (B) surfaces.
The difference in shrinkage strains measured on the different surfaces of SFR-NAC mixes is
substantially lower than that of plain concrete (particularly at the early ages) as can also be
seen in Figure 6.10a. Figure 6.10a shows the ratio between the strains developed at the top
relative to those at the bottom (∆T-B) and Figure 6.10b the ratio between the top and the sides
(∆T-S). The mix reinforced with 2% of RTSF exhibits a lower difference than the mix
reinforced with blended industrial and recycled steel fibre. The differences in shrinkage
strain (ΔT-B) for mixes NA40R2 and NA40R+I were less than those for NA40 by around
80% and 75% at the very early age (first few days) and by around 55% and 45% thereafter
(up to 28 days).
0
50
100
150
200
250
300
350
400
450
500
0 5 10 15 20 25 30
Free
Shr
inka
ge st
rain
(µε)
Drying Time (days)
T
S
B
NA40R2

Chapter 6 Post-Restrained Shrinkage Behaviour of Concrete Made with Recycled Materials
145
Figure 6. 10 Strain ratio (for mixes NA40, NA40R+I and NA40R2) between a- top and bottom surfaces, b- top and side surfaces.
SFR-RAC
For the mixes containing RA (both plain and SFR), the shrinkage strains on the top surface
were higher than the sides and the bottoms surfaces (see Figures 6.11 and 6.12). This
behaviour is similar to that of NAC mixes. However, the differences (∆T-B and ∆T-S) are
much lower in comparison to the mixes with NA as seen in Figures 6.13 and 6.14. The
difference in shrinkage strain (ΔT-B) of the plain RAC was less than that of plain NAC by
around 100% at the very early age (first few days) and by around 70% thereafter (up to 28
days).
0.8
1.2
1.6
2.0
2.4
2.8
0 5 10 15 20 25 30
Δ T-B
Drying Time (days)
NA40
NA40R+I
NA40R2
(a)
1
1.2
1.4
1.6
1.8
0 5 10 15 20 25 30
Δ T-S
Drying Time (days)
NA40
NA40R+I
NA40R2
(b)

Chapter 6 Post-Restrained Shrinkage Behaviour of Concrete Made with Recycled Materials
146
Figure 6. 11 Development of free shrinkage strains of RAm40 at top (T), sides (S) and bottom (B) surfaces.
Figure 6. 12 Development of free shrinkage strains of RAm40R2 at top (T), sides (S) and bottom (B) surfaces.
0
50
100
150
200
250
300
350
400
450
500
0 5 10 15 20 25 30
Free
Shr
inka
ge St
rain
(µε)
Drying time (days)
T
S
B
RAm40
0
50
100
150
200
250
300
350
400
450
500
0 5 10 15 20 25 30
Free
Shr
inka
ge st
rain
(µε)
Drying time (days)
T
S
B
RAm40R2

Chapter 6 Post-Restrained Shrinkage Behaviour of Concrete Made with Recycled Materials
147
Figure 6. 13 Strain ratio (for mixes NA40, RAm40 and RAm40R2) between top and bottom surfaces.
Figure 6. 14 Strain ratio (for mixes NA40, RAm40 and RAm40R2) between top and side surfaces.
6.3.4 Shrinkage Curvature of SFR-NAC
SFR-NAC
Figure 6.15 (a and b) show the development of shrinkage curvature (average of three
specimens) over time for mixes NA40R2 and NA40R+I. Curvature is shown as calculated
between top and sides (kT-S), sides and bottom surfaces (kS-B) and average (kA). For
NA40R2, it can be seen that the curvature of the upper half of the concrete specimens is
higher than the lower half, whereas, for NA40R+I, curvatures are more uniform. The
curvature of the plain concrete is higher than that of FRC (see Figure 6.16).
0.0
0.4
0.8
1.2
1.6
2.0
2.4
2.8
0 5 10 15 20 25 30
Δ T-B
Drying Time (days)
NA40RAm40R2RAm40
0.0
0.4
0.8
1.2
1.6
2.0
2.4
2.8
0 5 10 15 20 25 30
Δ T-S
Drying Time (days)
NA40
RAm40R2
RAm40

Chapter 6 Post-Restrained Shrinkage Behaviour of Concrete Made with Recycled Materials
148
Figure 6. 15 Shrinkage curvature developed on the free specimens, (a) mix NA40R2, (b) mix NA40R+I.
Figure 6. 16 Average shrinkage curvature of fibre reinforced concretes compared to plain concrete.
SFR-RAC
The development of curvature (kT-S, kS-B and kA) over time for mixes RAm40 and RAm40R2
is shown in Figure 6.17 (a and b). There is no significant difference in the average curvature
(kA) for plain and SFR-RAC as can be seen in Figure 6.18. Figure 6.18 also shows that the
shrinkage curvature of RAC mixes (both plain and SFR) is lower than that of plain NAC.
0.0
0.5
1.0
1.5
2.0
0 5 10 15 20 25 30Cu
rvat
ure
×10-3
(m-1
)
Drying time (days)
Average KAKS-BKT-S
NA40R2- Free
(a)
0.0
0.5
1.0
1.5
2.0
0 5 10 15 20 25 30
Curv
atur
e ×1
0-3 (m
-1)
Drying time (days)
Average KAKS-BKT-S
D-NA40R+I- Free
(b)
0
0.5
1
1.5
2
0 5 10 15 20 25 30
Curv
atur
e ×1
0-3 (m
-1)
Drying time (days)
Free-NA40
Free-NA40R2
Free-NA40R+I

Chapter 6 Post-Restrained Shrinkage Behaviour of Concrete Made with Recycled Materials
149
Figure 6. 17 Shrinkage curvature developed on the free specimens, (a) mix RAm40, (b) mix RAm40R2.
Figure 6. 18 Comparison of average shrinkage curvature for plain and fibre reinforced RAC and plain NAC.
There is clearly a mechanism that results in relatively large curvatures in free NAC
specimens and RA and fibres appear to mitigate the effect.
0.0
0.5
1.0
1.5
2.0
0 5 10 15 20 25 30
Curv
atur
e ×1
0-3 (m
-1)
Drying time (days)
Average KAKS-BKT-S
RAm40 - Free
(a)
0.0
0.5
1.0
1.5
2.0
0 5 10 15 20 25 30
Curv
atur
e ×1
0- 3 (m
-1)
Drying time (days)
Average KAKS-BKT-S
RAm40 R2- Free
(b)
0
0.5
1
1.5
2
0 5 10 15 20 25 30
Curv
atur
e ×1
0-3 (m
-1)
Drying time (days)
Free-NA40
Free-RAm40
Free-RAm40R2

Chapter 6 Post-Restrained Shrinkage Behaviour of Concrete Made with Recycled Materials
150
6.3.5 Mass Loss
NAC
The curves of mass loss versus drying time for plain and SFR-NAC are presented in Figure
6.19. In general, it can be seen that the addition of 2% (by mass) of ISF or RTSF or a blend
of (1% IF + 1% RTSF) did not alter the trend of mass loss.
Figure 6. 19 Mass loss versus time for plain and fibre reinforced NAC.
Since the mass loss in Figure 6.19 is almost identical for all mixes, it is expected that the
shrinkage strains will be similar. However, the shrinkage strains for NA40R2 are higher than
these of NA40 (see Figure 6.5). This confirms that though the overall cement shrinkage
might be the same, better distributed fibres (such as RTSF) can reduce damage at the micro
level, leading to higher shrinkage strains at the macro level. If this is true, then a better
structural performance is expected.
RAC
The results of mass loss for the plain and SFR-RAC (RAm40 and RAm40R2) mixes are
shown in Figure 6.20. The figure also shows the results of mix NA40. As expected, both
moisture loss and its rate of RAC are higher than NAC. The mass loss behaviour of the RAC
mixes is consistent with their shrinkage strain development, as there was no difference
between the shrinkage strains of these two mixes (RAm40 and RAm40R2) (see section
6.3.2).
0.0
0.2
0.4
0.6
0.8
1.0
1.2
1.4
1.6
0 4 8 12 16 20 24 28
Mas
s Lo
ss %
Drying Time (Days)
Mass loss - NA40
Mass loss- NA40R2
Mass loss NA40I2
Mass loss - NA40R+I

Chapter 6 Post-Restrained Shrinkage Behaviour of Concrete Made with Recycled Materials
151
Figure 6. 20 Mass loss versus time for plain and fibre reinforced RAC and plain NAC.
6.3.6 Mass Loss vs Free Shrinkage Strain
The shrinkage strain versus mass loss curves for NAC with steel fibres are shown in Figure
6.21. It appears that the addition of fibres (regardless of type) has an insignificant effect on
the relationship behaviour of shrinkage strain versus mass loss for these mixes.
Figure 6. 21 Mass loss-shrinkage strains curves for plain and fibre reinforced NAC.
The effect of the aggregate type on the shrinkage strain-mass loss curves is shown in Figure
6.22. As expected, there is a significant difference between the two mixes NAC and RAC
0.0
0.4
0.8
1.2
1.6
2.0
0 4 8 12 16 20 24 28
Mas
s Lo
ss %
Drying Time (Days)
Mass loss -RAm40
Mass loss - NA40
Mass loss -RAm40R2
0
100
200
300
400
500
0.0 0.4 0.8 1.2 1.6
Shrin
kage
str
ain
(µɛ)
Mass Loss %
Mass loss - NA40
Mass loss- NA40R2
Mass loss NA40I2
Mass loss - NA40R+I
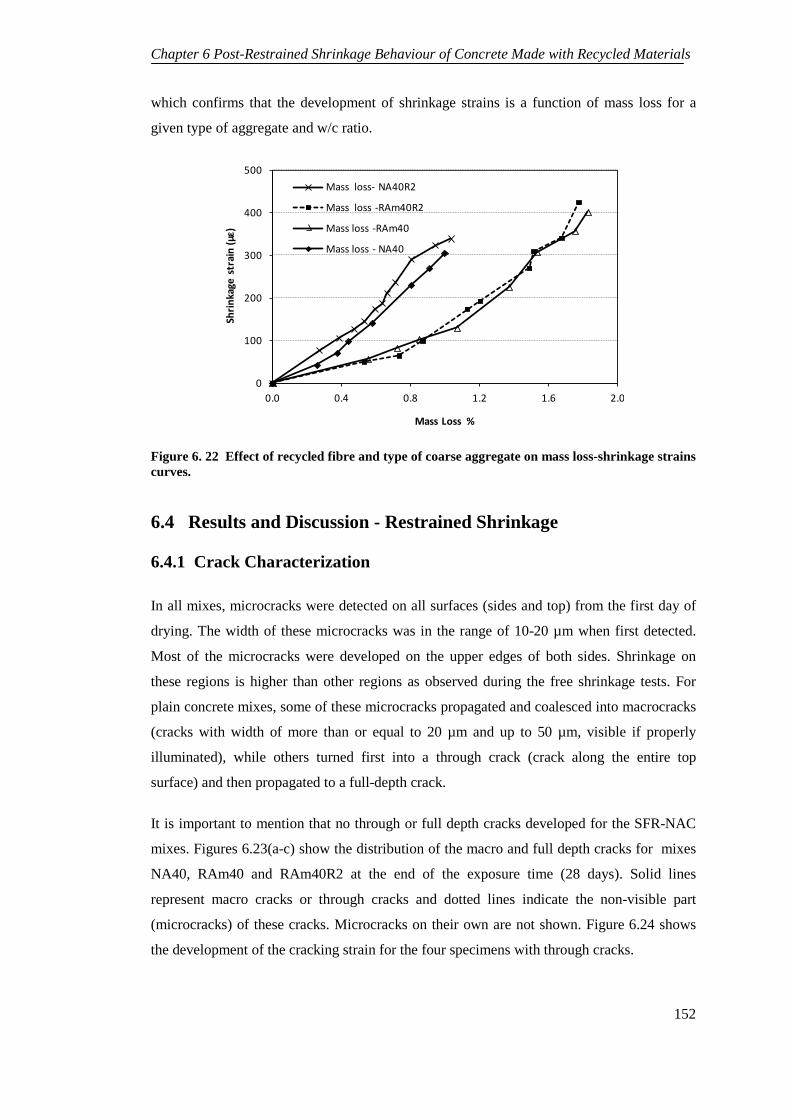
Chapter 6 Post-Restrained Shrinkage Behaviour of Concrete Made with Recycled Materials
152
which confirms that the development of shrinkage strains is a function of mass loss for a
given type of aggregate and w/c ratio.
Figure 6. 22 Effect of recycled fibre and type of coarse aggregate on mass loss-shrinkage strains curves.
6.4 Results and Discussion - Restrained Shrinkage
6.4.1 Crack Characterization
In all mixes, microcracks were detected on all surfaces (sides and top) from the first day of
drying. The width of these microcracks was in the range of 10-20 µm when first detected.
Most of the microcracks were developed on the upper edges of both sides. Shrinkage on
these regions is higher than other regions as observed during the free shrinkage tests. For
plain concrete mixes, some of these microcracks propagated and coalesced into macrocracks
(cracks with width of more than or equal to 20 µm and up to 50 µm, visible if properly
illuminated), while others turned first into a through crack (crack along the entire top
surface) and then propagated to a full-depth crack.
It is important to mention that no through or full depth cracks developed for the SFR-NAC
mixes. Figures 6.23(a-c) show the distribution of the macro and full depth cracks for mixes
NA40, RAm40 and RAm40R2 at the end of the exposure time (28 days). Solid lines
represent macro cracks or through cracks and dotted lines indicate the non-visible part
(microcracks) of these cracks. Microcracks on their own are not shown. Figure 6.24 shows
the development of the cracking strain for the four specimens with through cracks.
0
100
200
300
400
500
0.0 0.4 0.8 1.2 1.6 2.0
Shrin
kage
str
ain
(µɛ)
Mass Loss %
Mass loss- NA40R2
Mass loss -RAm40R2
Mass loss -RAm40
Mass loss - NA40

Chapter 6 Post-Restrained Shrinkage Behaviour of Concrete Made with Recycled Materials
153
Figure 6. 23 Distribution of the macro and full depth cracks, a- NA40, b-RAm40, c- RAm40R2. (shaded grey and diagonal lines zones are critical tension and compression zone, respectively, when prisms tested in bending).
Figure 6. 24 Cracking time and strain for NAC and RAC.
Side2
Side1
Top
RAm40R2- M
Side2
Side1
Top
RAm40- M
Side2
Side1
Top
RAm40- B
(b)
Side2
40
Side1
Top
NA40- M
Side2
20Side1
Top
NA40- T
400
Side235
Side1
Top
NA40- B
(a)
Side2
Side1
Top
RAm40- T
25
Side2
Side1
Top
RAm40R2- B
(c)
25
Side2
Side1
Top
RAm40R2- T
25
350
100
0
500
1000
0 5 10 15 20 25 30
NA40 - T
RAm40 - B
RAm40 - M
0
500
1000
RAm40R2 - M
500
1000
500
1000
Cracking time = 25 days
Cracking time = 7 days
Cracking time = 4 days
Cracking time = 5 days
Drying time (days)
Crac
king
Str
ain
(µε)

Chapter 6 Post-Restrained Shrinkage Behaviour of Concrete Made with Recycled Materials
154
6.4.2 Failure of FRC under Restrained Conditions
NAC
The behaviour of plain concrete (chapter 5) (for different w/c ratios) under restrained
conditions revealed that the failure of restrained plain concrete varies according to the w/c
ratio and the use of strength alone as a criterion for determining the time of restrained
concrete failure (cracking) is misleading. It was found that both stress history (magnitude
and rate of development) and cracking, depend on stiffness and shrinkage strain magnitude
and rate of development.
It is important to mention that specimen T in mix NA40 failed after 5 days of drying under
restrained conditions. In this study, none of the NAC mixes reinforced with RTSF and IF
failed during the drying exposure time. This underlying the ability of fibres in enhancing
tensile relaxation/creep and redistributing internal stresses, thus reducing damage at the
micro level [7, 44].
For plain RAC, specimens B and M failed after 4 and 7 days of drying, respectively. For
SFR-RAC, specimen B failed at day 25. This delay in cracking may be attributed to the role
of fibres in enhancing the tensile relaxation of restrained concrete.
Through cracks developed during the first week in one specimen of both plain NAC and
RAC. Early cracking for RAC was somehow expected, since its initial (day 1) shrinkage
strains were higher (by 31%) than for NAC (see section 6.3.2). On the other hand, its lower
overall stiffness (see section 6.5.2.1) is expected to lead to higher creep [2, 45] which could
delay the initiation of cracks. In this case, it appears that these two opposing mechanisms
cancelled one another.
6.4.3 Shrinkage Strains
Shrinkage strains developed on the restrained specimens are presented and discussed in this
subsection. For side strains (Side), values presented here are the average of four
measurements taken along the centre line of the specimen. For the top surface (top), one
measurement was taken at its centre line over 300mm. The results are presented and
discussed first for SFR-NAC followed by plain and SFR-RAC mixes.
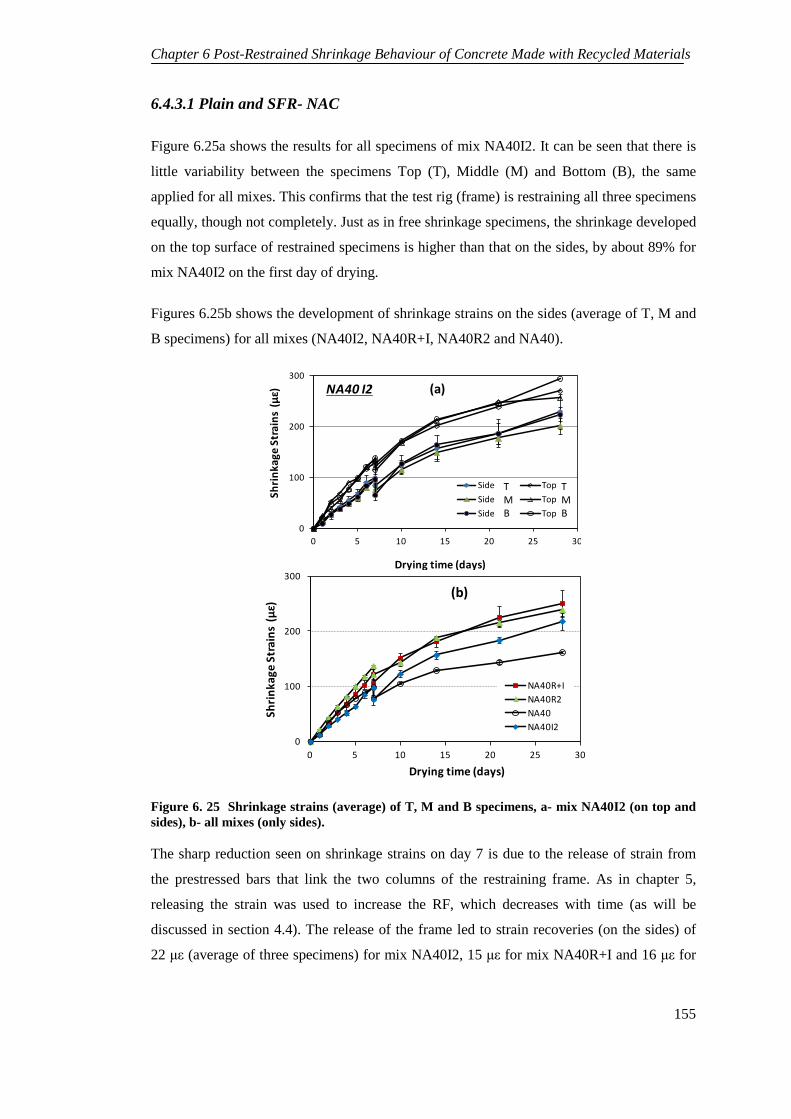
Chapter 6 Post-Restrained Shrinkage Behaviour of Concrete Made with Recycled Materials
155
6.4.3.1 Plain and SFR- NAC
Figure 6.25a shows the results for all specimens of mix NA40I2. It can be seen that there is
little variability between the specimens Top (T), Middle (M) and Bottom (B), the same
applied for all mixes. This confirms that the test rig (frame) is restraining all three specimens
equally, though not completely. Just as in free shrinkage specimens, the shrinkage developed
on the top surface of restrained specimens is higher than that on the sides, by about 89% for
mix NA40I2 on the first day of drying.
Figures 6.25b shows the development of shrinkage strains on the sides (average of T, M and
B specimens) for all mixes (NA40I2, NA40R+I, NA40R2 and NA40).
Figure 6. 25 Shrinkage strains (average) of T, M and B specimens, a- mix NA40I2 (on top and sides), b- all mixes (only sides).
The sharp reduction seen on shrinkage strains on day 7 is due to the release of strain from
the prestressed bars that link the two columns of the restraining frame. As in chapter 5,
releasing the strain was used to increase the RF, which decreases with time (as will be
discussed in section 4.4). The release of the frame led to strain recoveries (on the sides) of
22 με (average of three specimens) for mix NA40I2, 15 με for mix NA40R+I and 16 με for
0
100
200
300
0 5 10 15 20 25 30
Shrin
kage
Str
ains
(µε
)
Drying time (days)
Side TopSide TopSide Top
NA40 I2
TMB
TMB
(a)
0
100
200
300
0 5 10 15 20 25 30
Shrin
kage
Str
ains
(µε
)
Drying time (days)
NA40R+INA40R2NA40NA40I2
(b)

Chapter 6 Post-Restrained Shrinkage Behaviour of Concrete Made with Recycled Materials
156
mix NA40R2. Strain recovery measured on the top surface was similar to that measured on
the sides.
Figure 6.25b shows that overall there is little difference in shrinkage strains between the
different FRC mixes. However, there is clear difference between plain and FRC mixes.
Mixes reinforced with RTSF show higher overall shrinkage strains. This can be attributed to
the ability of these fibres to reduce the microcrcaking (softening) of restrained concrete
(similar to the effect of RTSF on free shrinkage see section 6.3.1). It seems that fibers play a
significant role in engaging a larger volume of the matrix in the transfer of tensile stresses in
restrained concrete. This results in less microcracking and is reflected on the macro level as
higher shrinkage strains [27]. Similar behaviour was also reported by Altoubat and Lange
[27]. Bazant and Raftshol [46] and others [47, 48] (cited in [44]) also pointed out the effect
of strain softening due to microcracking on modifying the shrinkage behaviour of plain
concrete.
6.4.3.2 Plain and SFR-RAC
Results of Un-cracked specimens
Figures 6.26 a and b show the development of shrinkage strains on the side and top surfaces
for un-cracked restrained specimens of mixes RAm40 and RAm40R2. The figures also show
the results of mixes NA40 and NA40R2. Just as in NAC mixes, RAC mixes exhibit higher
strains on the top than the sides. Figure 6.25a shows that for measurements on the sides,
overall there is insignificant difference in shrinkage strains between the plain and FRC
mixes of both NAC and RAC. However, at early ages the shrinkage of the plain NAC is
higher than that of RAC. This can again be attributed to the development of more
microscracks in RAC (due to higher shrinkage, see Figure 6.6) leading to less measured
shrinkage strain. For plain mixes, higher shrinkage strains are measured on the top surface
for RAC, possibly due to the higher surface porosity.

Chapter 6 Post-Restrained Shrinkage Behaviour of Concrete Made with Recycled Materials
157
Figure 6. 26 Shrinkage strains developed on the a-Sides and b- Top, average of the un-cracked specimens.
6.4.4 Restraint Factor RF
6.4.4.1 Theoretical RF
The procedure developed in chapters three and five is used to estimate the theoretical RF of
the restraining frame using linear elastic FEA and the expected development of concrete
properties according to Eurocode-2 [49]. Figures 6.27a shows the estimated RF for a typical
mix (NA40I2) for all specimens (T, M and B). Similar results were determined for the other
mixes as shown in Figure 6.27b which shows the average RF (average of T, M and B
specimens) for all mixes is around 40%. The RF curves are similar due to the fact that for
the different mixes there are small differences in the expected elastic modulus and its rate of
development. It should be noted that most of the loss in restraint is the result of anchor
deformations.
0
100
200
300
400
0 5 10 15 20 25 30Sh
rinka
ge S
trai
ns (
µε)
Drying time (days)
NA40
RAm40
NA40R2
RAm40R2
(a)(Sides)
0
100
200
300
400
0 5 10 15 20 25 30
Shrin
kage
Str
ains
(µε
)
Drying time (days)
NA40
RAm40
NA40R2
RAm40R2
(b)(Top)

Chapter 6 Post-Restrained Shrinkage Behaviour of Concrete Made with Recycled Materials
158
Figure 6. 27 Estimated (theoretical) RF, a- for the T, M and B specimens of mix NA40I2, b- average RF for all mixes
6.4.4.2 Apparent RF
The development of apparent RF for a typical mix (NA40R+I) on the sides and the top of the
specimens is shown in Figures 6.28(a-c). It can be seen that the RF developed at the top is
lower than that on the sides, especially during the first week of drying, due to the fact that
shrinkage develops faster on the top surface than the sides. After 24h of drying, the average
RF for mix NA40R+I (T, M and B specimens) was 68%. The RF decreases sharply by an
average of 30% up to 7days. At 7 days, after strain release, none of the specimens failed and
the RF on the sides increased to around 38 % due to an apparent enforced expansion of
around 15 με.
0.0
0.2
0.4
0.6
0.8
1.0
0 5 10 15 20 25 30
Rest
rain
t Fac
tor
Drying time (day)
Estimated RF-T
Estimated RF-M
Estimated RF-B
Average- Estimated RF
NA40I2 (a)
0.0
0.2
0.4
0.6
0.8
1.0
0 5 10 15 20 25 30
Rest
rain
t Fac
tor
Drying time (day)
NA40NA40I2NA40R+INA40R2RAm40RAm40R2
(b)

Chapter 6 Post-Restrained Shrinkage Behaviour of Concrete Made with Recycled Materials
159
Figure 6. 28 Apparent (measured) RF of mix NA40R+I, a- T specimen, b-M specimen , c- B specimen.
Similar behaviour was observed for the other mixes. Table 6.3 shows the average RF on the
sides (average of two specimens for NA40 and RAm40R2, three for all SFR-NAC and one
for RAM40) on the first day of drying (RF1) and just before (RF7B) and right after (RF7A)
strain release and the amount of recovered strain for all mixes.
Table 6. 3 Restraint factor and recovered strains for all mixes.
Mix RF1 (%) RF7b (%) RF7a (%) Recovered Strain (µε)
NA40 65 31 45 20
NA40I2 68 38 50 22
NA40R+I 69 30 38 15
NA40R2 67 34 42 16
RAm40 72 44 65 41
RAm40R2 65 29 47 35
Estimated* 40 37 37 - * Avearge value of estimated RF of all mixes.
Figure 6.29 shows the estimated and apparent average RF values for mix NA40I2. It can be
seen that initially, in comparison to the estimated RF, the apparent RF is very high, but the
0
20
40
60
80
100
0 5 10 15 20 25 30
RF (%
)
Drying time (days)
Ave. Side
Top
NA40R+I -T (d)(a)
0
20
40
60
80
100
0 5 10 15 20 25 30
RF (%
)
Drying time (days)
Ave. Side
Top
NA40R+I -M (e)(b)
0
20
40
60
80
100
0 5 10 15 20 25 30
RF (%
)
Drying time (days)
Ave. S
Top
NA40R+I -B (f)(c)

Chapter 6 Post-Restrained Shrinkage Behaviour of Concrete Made with Recycled Materials
160
RF catches up after a few days. This may be attributed to the effect of the early age
microcracks (''apparent'' mechanism of drying creep) which may have negatively affected
the apparent stiffness gain of the restrained concrete. A lower stiffness gain means less strain
loss than expected and, hence, higher RF. After that initial stage, the rate of decrease in RF
slows down and the values of apparent RF reach the estimated values and drop even lower
(as can be seen in Table 6.3) at the age of 7 days. This may be due the effect of undesired
cracks, beyond the shrinkage measuring region, impairing the restraint efficiency of the
anchored ends.
Figure 6. 29 Development of estimated and apparent RF for mix NA40I2.
6.5 Results and Discussion - Mechanical Properties
6.5.1 Compressive Strength
The results of the compressive strength at 28 days and their standard deviation (SD) for all
mixes are presented in Table 6.4. The compressive strength was determined for cubes cured
in water (Cube) and for portions of prisms (broken in bending) under free (F) and restrained
shrinkage (R) and water cured (WC) conditions. All results presented in this section are the
average of three specimens per mix and normalized to the values of the compressive strength
of the water cured cube specimens (Cube) at 28 days.
0.0
0.2
0.4
0.6
0.8
1.0
0 5 10 15 20 25 30
RF
Drying time (day)
Average- Estimated RF
Average Apparent RF-Side
NA40I2

Chapter 6 Post-Restrained Shrinkage Behaviour of Concrete Made with Recycled Materials
161
Table 6. 4 Compressive strength, normalized strength and standard deviation (SD) of SFR-NAC mixes.
Mix Type Compressive Strength at 28 days, MPa (SD) Normalized Strength
Cube F R WC Cube F R WC
NA40 59.4 (0.3) 51.5 (1.0) 51.2 (2.6) 58.8 (01.3) 1.0 0.87 0.86 0.99
NA40R2 66.0 (1.7) 61.9 (2.1) 60.7 (2.6) 70.8 (1.8) 1.0 0.94 0.92 1.07
NA40I2 60.2 (2.0) 57.8 (3.0) 53.9 (0.8) 59.9 (2.9) 1.0 0.96 0.90 0.99
NA40R+I 62.2 (1.9) 56.7 (1.6) 53.9 (3.6) 61.2 (0.6) 1.0 0.91 0.87 0.98
RAm40 43.5 (1.4) 40.1 (0.4) 39.8 (0.6) 45.2 (1.3) 1.0 0.92 0.91 1.04
RAm40R2 54.4 (2.0) 49.7 (0.6) 49.0 (0.7) 55.0 (1.2) 1.0 0.91 0.90 1.01
Average 1.0 0.92 0.90 1.01
Cubes
For ''Cube'' specimens, the addition of 2 % (by mass of concrete) RTSF increased the
compressive strength of NAC by 12%. ISF at 2% had an insignificant effect on the
compressive strength. The addition of blended (1% RTSF+1% ISF) fibres resulted in an
increase of 5%.
As expected, the use of RA (mix RAm40) resulted in 27% lower compressive strength in
comparison to that of NA40. Table 4 also shows that the inclusion of 2% of RTSF and the
surface treatment of RA with 2% of SF increased the strength of RAC by 25%. Similar
results were obtained by the authors in a previous study [31] (chapter 2).

Chapter 6 Post-Restrained Shrinkage Behaviour of Concrete Made with Recycled Materials
162
Prisms
The compressive strength from prisms for WC is similar to those of the Cubes. In fact, on
average they are slightly stronger, but that can be attributed to the fact that on one axis the
specimen is confined by additional concrete.
On average, air dried specimen 'F' had a 8% less compressive strength than that of the Cube
at 28 days partly due to less hydration and partly due to the development of microcracks
induced by differential shrinkage. Surprisingly, the restrained specimen 'R' only differed
from 'F' specimens by 2% which means that the shrinkage cracks induced by external
restraint did not have as significant effect as one might expect.
6.5.2 Flexural Behaviour
After 28 days of drying, the free shrinkage specimens were tested in bending. The position
of the supports and load points varied according to the type of the specimens (free or
restrained), as described below:
a) For free shrinkage specimens, when possible, the bending test was conducted twice on
two parts of the same specimen. The position of supports and point loads in the two tests are
illustrated in Figure 6.30.
Figure 6. 30 Position of supports and loads in bending test for free shrinkage specimens (dimensions in mm).
b) For restrained shrinkage specimens, the load points and supports used are shown in Figure
6.31. The location of these was selected so as to capture the widest crack (and as many
cracks caused by restrained shrinkage) within the critical region. In Figure 6.23 (see section
6.4.1), the critical region is shaded grey when in tension and with diagonal lines when in
compression.
100
100 100 100P P
P P100 100 100
750
Trowled surface

Chapter 6 Post-Restrained Shrinkage Behaviour of Concrete Made with Recycled Materials
163
Figure 6. 31 Position of supports and loads in bending test for restrained shrinkage specimens (dimensions in mm).
Tables 6.5 shows the results of the flexural elastic modulus (Efmax), flexural strength (flLOP) at
the limit of proportionality (LOP) and the ultimate flexural strength (flult) of WC, F and R
specimens for all mixes. The results are the average of three or four specimens, as shown in
Table 6.5. Table 6.5 also shows the normalized results to the values of WC specimens. The
flexural strength (flLOP) is determined at the estimated first crack load. This is not easy to
assess visually, hence, the load versus calculated flexural elastic modulus (Eflex) curve is
used. Typical load-deflection and Eflex-bending load curves are shown in Figures 6.32 a and
b. The first crack is considered to initiate at a load at which Eflex drops to 0.85Efmax as shown
for mix NA40R+I/ restrained-bottom specimen.
(3)
(2)
(1)
P P100 100 100
P P100 100 100
P P100 100 100
750
Trowled surface

Chapter 6 Post-Restrained Shrinkage Behaviour of Concrete Made with Recycled Materials
164
Table 6. 5 Flexural strength (flLOP and flult) and Efmax for all mixes.
Mix No. and
Type of
specimen
Efmax in
GPa (*)
Normalized Efmax
Flexural strength (Ultimate) Flexural strength (LOP)
MPa (*) Normalized MPa (*) Normalized
NA40
3 WC 39.7 (0.3) 1.0 4.9 (0.2) 1.0 4.7 (0.3) 1.0
4 F 38.7 (0.2) 0.97 4.9 (0.3) 1.0 4.1 (0.1) 0.87
1 RT 36.3 34.4 (0.1)
0.91 4.6 4.9
(0.3)
0.95 4.3 4.7
(0.1)
0.91
1 RM 33.5 0.84 5.1 1.04 4.8 1.02
1 RB 33.4 0.84 5.0 1.02 4.9 1.04
NA40I2
3 WC 33.4 (1.0) 1.0 5.7 (1.2) 1.0 4.4 (0.5) 1.0
3 F 34.2 (0.5) 1.02 5.7 (0.5) 1.0 5.2 (0.3) 1.18
1 RT 32.5 31.2 (1.2)
0.98 5.1 5.2
(0.9)
0.90 4.9 4.8
(0.5)
1.11
1 RM 30.3 0.91 6.1 1.07 5.2 1.18
1 RB 30.8 0.92 4.3 0.75 4.2 0.95
NA40R2
3 WC 36.2 (0.1) 1.0 5.9 (1.0) 1.0 5.2 (0.1) 1.0
3 F 34.1 (3.6) 0.94 5.6 (0.8) 0.95 5.2 (0.7) 1.0
1 RT 36.7 36.6 (1.8)
1.01 5.8 6.1
(0.3)
0.98 5.4 5.5
(0.3)
1.04
1 RM 38.3 1.06 6.0 1.0 5.9 1.13
1 RB 34.7 0.96 6.4 1.08 5.4 1.04
NA40R+I
3 WC 32.7 (1.6) 1.0 6.4 (0.1) 1.0 4.6 (0.8) 1.0
3 F 35.5 (3.6) 1.07 5.4 (0.5) 0.84 4.6 (0.4) 1.0
1 RT 33.5 34.1 (2.8)
1.01 5.9 5.7
(0.4)
0.92 5.3 5.2
(0.4)
1.15
1 RM 31.7 0.97 5.2 0.81 4.8 1.04
1 RB 37.1 1.12 6.0 0.94 5.5 1.19
RAm40
3 WC 30.5 (0.7) 1.0 4.7 (0.1) 1.0 4.6 (0.2) 1.0
4 F 26.6 (0.9) 0.87 5.0 (0.3) 1.05 4.4 (0.3) 0.97
1 RT 24 24.6
(1.8)
0.79 4.9 4.7
(0.2)
1.04 4.7 4.4
(0.4)
1.02
1 RM 23.2 0.76 4.4 0.94 4.0 0.87
1 RB 26.6 0.87 4.7 1.00 4.5 0.98
RAm40R2
3 WC 30.4 (0.6) 1.0 5.2 (0.5) 1.0 5.1 (0.4) 1.0
4 F 26.8 (2.1) 0.88 5.5 (0.4) 1.05 5.0 (0.4) 0.98
1 RT 25.6 24.6
(0.9)
0.84 5.7 5.5
(0.1)
1.10 5.2 4.9
(0.4)
1.02
1 RM 24.2 0.8 5.5 1.05 5.3 1.04
1 RB 23.8 0.78 5.1 0.98 4.2 0.83
*Standard deviation. Values in italic represents results of restrained specimens that cracked under restrained conditions.

Chapter 6 Post-Restrained Shrinkage Behaviour of Concrete Made with Recycled Materials
165
Figure 6. 32 a-Load-deflection, b- Eflex -bending-load curves for: WC , F and R specimens (Top, Middle and Bottom) for mix NA40R+I.
6.5.2.1 Flexural Elastic Modulus Efmax
NAC
The Efmax of WC and F specimens for mix NA40 (plain NAC) is higher than that of FRC
mixes (NA40I2, NA40R+I and NA40R2). This may be attributed to the higher air voids
content (see Table 6.6) of FRC mixes (due to fibre addition). The theoretical air content
shown was determined for each mix based on the measured density and rule of mixtures..
0
10
20
30
40
50
0 4 8 12 16 20 24
E fle
x(G
Pa)
Bending Load (kN)
Average WCAverage F Top Middle Bottom
NA40R+I
Efmax
0.85Efmax
Flexural load at LOP(a)
0
5
10
15
20
25
0.0 0.5 1.0 1.5 2.0
Bend
ing
load
(kN
)
Mid-span deflection (mm)
Average WCAverage F Top Middle Bottom
NA40R+I(b)

Chapter 6 Post-Restrained Shrinkage Behaviour of Concrete Made with Recycled Materials
166
Table 6. 6 Theoretical air content and measured density for all mixes.
Property Mix Type
NA40 NA40I2 NA40R+I NA40R2 RAm40 RAm40R2
Density (kg/m3) 2375 2355 2376 2367 2246 2241
Air content (%) 2.9 5.1 4.2 4.6 5.7 7.2
Short (RTSF) fibres appear to enhance the stiffness of restrained specimens. This will be
further examined by comparing the results of WC, F and R specimens for each mix.
For mix NA40 (plain mix), the Efmax of F specimens is slightly lower than Efmax of WC
specimens. However, Efmax is lower by up to 16 % for specimens subjected to restrained
shrinkage. This is expected as shrinkage induced cracks can cause some loss of stiffness due
to the lengthening/softening of restrained specimens.
For the mixes with short fibres (RTSF), the Efmax for F and R specimens were comparable or
slightly higher (in the case of R specimens) than those of the WC specimens. Surprisingly,
this means that the lengthening of the specimens due to the restraint did not lead to
softening.
RAC
The Efmax of plain and FRC- RAC mixes is lower (by 23% for WC specimens) than that of
NAC mixes possibly due to the softer nature of the RA themselves and their higher air
content (see Table 6.6). For RAm40, the Efmax of the F specimens was lower by 13% and by
24% for R specimens in comparison to WC specimens, partly also due to a lower hydration
rate. The addition of RTSF and the surface treatment of RA did not alter the Efmax of the
RAC. This can be attributed to the effect of the higher air void content in this mix.
Role of fibres under restrained conditions
Under restrained conditions, FRC mixes performed better in comparison to the plain mix.
This can be attributed to the role of fibres in enhancing tensile creep/relaxation mechanisms
by better control (reduce) of microcracks as reported by Altoubat and Lange [50]. Altoubat
and Lange stated that fibres can: 1- enhance the' beneficial' (real) mechanisms of creep by
the ability of fibres in providing more uniform distribution of internal stresses and engaging

Chapter 6 Post-Restrained Shrinkage Behaviour of Concrete Made with Recycled Materials
167
a larger volume of the matrix in stress transfer; and 2- reduce the 'detrimental' (apparent)
mechanism of creep (microcracking). These mechanisms are also predicted to lead to higher
shrinkage of restrained specimens for mixes with fibres as was observed in this study (see
Figures 6.25 and 6.26). The better control and delay of the propagation of microcracks to
macrocracks can also assist in the self-healing of microcracks.
6.5.2.2 Flexural strength (flLOP and flult)
NAC
For the plain mix (NA40), the flexural performance of F specimens was lower by 13% (in
terms of flLOP) and comparable (in terms of flult) compared to those of WC specimens.
Unexpectedly, the flexural strength of R specimens was similar to WC specimens.
For the FRC mixes (apart from NA40I2), the flLOP for F and R specimens were comparable
or slightly higher (in the case of R specimens) than those of the WC specimens.
All FRC specimens exhibited comparable or higher flexural performance (flLOP and flult) in
comparison to the plain concrete. It appears that mixes with short fibres (RTSF) performed
better than ISF, in particular for WC and R specimens.
RAC
For mix RAm40, the flLOP of F and R specimens were only slightly lower than that of WC
specimens.
Similar to the NAC, both free and restrained specimens of RAC containing RTSF and
treated RA showed unexpectedly comparable flLOP and slightly higher flult compared to those
of the WC specimens.
The addition of RTSF and surface treatment of RA resulted in higher (10-14 %) flLOP and flult
for WC, F and R specimens of RAC

Chapter 6 Post-Restrained Shrinkage Behaviour of Concrete Made with Recycled Materials
168
6.5.2.3 Discussion on Flexural Properties
The unexpected flexural performance with and without fibres can be attributed to the effect
of two additional mechanisms (beside the role of fibres mentioned in subsection 6.5.2.1): 1-
shrinkage curvature and internal stress state, 2- self-heal of microcracks. These mechanisms
are explained below:
Shrinkage curvature and internal stress state
The shrinkage curvature (due to differences in strain between the top and bottom surfaces)
observed on the free specimens (section 6.3.4) can increase the self induced tensile stresses
leading to microcracks and increase the intensity of the microcracks induced by differential
shrinkage. The shrinkage curvature under free condition is higher than for the restrained
condition as can be seen in Figures 6.33 a and b which show the shrinkage curvatures for
typical plain and FRC mixes. The lower shrinkage curvature of restrained specimens may be
due to restraint induced tensile stresses that reduce shrinkage curvature by stretching the
concrete specimen. This (restraint induced tensile stress) can also change the state of internal
stresses of concrete from tensile (on the surface) and compression (in the core) in the free
load condition (F specimens), to a more uniform distribution of tensile stresses over the
cross section in the restrained condition (R specimens). This can result in more, but smaller
and shorter, microcracks. The change in microcrack characteristics (number, size and
distribution) may be the possible reason behind the better or comparable flexural behaviour
(flLOP and flult) of R specimens in comparison to F specimens.

Chapter 6 Post-Restrained Shrinkage Behaviour of Concrete Made with Recycled Materials
169
Figure 6. 33 Comparison between shrinkage curvature of free and restrained specimens of mixes, a-NA40, b- NA40R+I and c- NA40R2.
Self-heal of microcracks
Smaller microcracks can also facilitate self-healing. The development of micrcocracks
creates moisture gradients inside the concrete due to the creation of local vacuum zones.
Such gradients promote permeation of moisture to the microcracks from the capillaries in the
vicinity promoting hydration of unhydrated cement particles. Provided the microcracks are
small enough, this results in healing [51].
6.5.2.4 Discussion on Effect of Restrained Shrinkage on Mechanical Properties
Restraining of concrete leads to a 10% reduction in compressive strength. For plain NAC,
the flexural elastic modulus (Efmax) also reduced by 16% but this did not reduce the flexural
strength, in particular for the restrained specimens. It appears that restraining had a
0.0
0.5
1.0
1.5
2.0
2.5
3.0
3.5
4.0
0 5 10 15 20 25 30
Curv
atur
e ×1
0-3 (m
-1)
Drying time (days)
KT-S Free-NA40
Restrained NA40
(a)
0.0
0.5
1.0
1.5
2.0
0 5 10 15 20 25 30
Curv
atur
e ×1
0-3(m
-1)
Drying time (days)
KT-S Free-NA40R2
KT-S Restrained NA40R2(c)(b)

Chapter 6 Post-Restrained Shrinkage Behaviour of Concrete Made with Recycled Materials
170
beneficial effect on strength by moderating the internal stresses developed due to differential
shrinkage.
The addition of fibres in NAC mixes, especially the short recycled fibres (RTSF), appears to
have affected the Efmax but has slightly increased the flexural behaviour.
The addition of RTSF and the treatment of RA significantly improved the compressive
strength of RAC, but had no effect on the Efmax due to the nature of the RA. However, the
flexural strength obtained was higher than that of NAC without fibres and similar to the
performance of NAC with fibres. This confirms that recycled fibres can address the
weaknesses of RA and lead to RAC of comparable mechanical performance to that of NAC.
6.6 Conclusions
This chapter examined the effect of RA and RTSF on the shrinkage behaviour of concrete
under unrestrained and restrained conditions. The following can be concluded.
- Conventional steel fibre at 2% dose had no effect on free shrinkage. RTSF increased initial
shrinkage strains due to higher air content and lower internal restraint.
- Relative to NAC, RA from CDW reduced the compressive strength by 27% , the flexural
modulus of elasticity by around 23% and increased shrinkage by 31% (at 1 day) and 35% (at
28 days).
- Despite their differences in mechanical performance, under restrained conditions NAC and
RAC cracked at around the same time.
- The compressive strength of restrained specimens only reduced by around 2% relative to
unrestrained specimens. In unreinforced NAC, the elastic modulus decreased by up to 16%.
However, for RTSF reinforced specimens the elastic modulus did not decrease.
- The flexural strength of all specimens was not affected much by the different exposure
conditions. Nonetheless, the restrained specimens of the mixes with RTSF appear to have a
slightly higher flexural strength than without fibres and without restrain.
- It is concluded that RTSF, despite increasing the air content of concrete, control shrinkage
induced microcracks propagation better than IF. It is believed that this is a result of the role

Chapter 6 Post-Restrained Shrinkage Behaviour of Concrete Made with Recycled Materials
171
of short fibres in enhancing the tensile creep behaviour of concrete by : 1) providing more
uniform distribution of internal stresses and engaging a larger volume of the matrix in stress
transfer; 2) reducing the micro-damage, and 3) promoting self healing of microcracks.
Hence, they are ideal for enhancing the flexural properties of RAC to the level achieved by
NAC.

Chapter 6 Post-Restrained Shrinkage Behaviour of Concrete Made with Recycled Materials
172
References
1. Hansen, T.C. and E. Boegh, Elasticity and Drying Shrinkage of Recycled-Aggregate Concrete. Journal of the American Concrete Institute, 1985. 82(5): p. 648-652.
2. Hansen, T.C., Recycled of Demolished Concrete and Masonry 1992, London: E & FN SPON.
3. Katz, A., Properties of concrete made with recycled aggregate from partially hydrated old concrete. Cement and Concrete Research, 2003. 33(5): p. 703-711.
4. Ajdukiewicz, A. and A. Kliszczewicz, Influence of recycled aggregates on mechanical properties of HS/HPC. Cement & Concrete Composites, 2002. 24(2): p. 269-279.
5. Bishop J., The early age Behaviour of Concrete Industrial Ground Floor Slabs. 2001, loughborough University: loughborough, UK
6. ACI 231R-10, Report on Early-Age Cracking: Causes, Measurement, and Mitigation, in ACI Committee 231. 2010, American Concrete Institute: Farmington Hills, U.S.A.
7. Altoubat, S.A. and D.A. Lange, Creep, shrinkage, and cracking of restrained concrete at early age. ACI Materials Journal/ SP, 2001. 98(4): p. 323-331.
8. Chern, J.-C. and C.-H. Young, Compressive creep and shrinkage of steel fibre reinforced concrete. International Journal of Cement Composites and Lightweight Concrete, 1989. 11(4): p. 205-214.
9. Tan, K. and P. Paramasivam, Creep and Shrinkage Deflections of RC Beams with Steel Fibers. Journal of Materials in Civil Engineering, 1994. 6(4): p. 474-494.
10. Swamy, R.N. and H. Stavrides, Influence of Fiber Reinforcement on Restrained Shrinkage and Cracking. Journal of the American Concrete Institute, 1979. 76(3): p. 443-460.
11. Zhang, J. and V.C. Li, Influence of Fibres on Drying Shrinkage of Fibre-Reinforced Cementitious Composite. Journal of Engineering Mechanics, ASCE, 2001. 127(1): p. 37-44.
12. Mangat, P.S. and M.M. Azari, A Theory for the Free Shrinkage of Steel Fibre Reinforced Cement Matrices. Journal of Material Science 1984. 19 (7): p. 2183-2194.
13. Li, Z., M.A. Perez Lara, and J.E. Bolander, Restraining effects of fibers during non-uniform drying of cement composites. Cement and Concrete Research, 2006. 36(9): p. 1643-1652.
14. Grzybowski, M. and S.P. Shah, Model to Predict Cracking in Fiber Reinforced-Concrete Due to Restrained Shrinkage. Magazine of Concrete Research, 1989. 41(148): p. 125-135.
15. Altoubat, S.A. and D.A. Lange, Creep, shrinkage, and cracking of restrained concrete at early age. Aci Materials Journal, 2001. 98(4): p. 323-331.
16. Wang, K., S.P. Shah, and P. Phuaksuk, Plastic Shrinkage Cracking in Concrete Materials- Influence of Fly Ash and Fibres. ACI Materilas Journal, 2001. 98(6): p. 458-464.
17. Aly, T., J.G. Sanjayan, and F. Collins, Effect of polypropylene fibers on shrinkage and cracking of concretes. Materials and Structures 2008. 41: p. 1741–1753.

Chapter 6 Post-Restrained Shrinkage Behaviour of Concrete Made with Recycled Materials
173
18. Hoff, G.C., Durability of fiber reinforced concrete in a severe marine environment. ACI Special Publication, 1987. 100.
19. ACI 544.1R-96, State-of-the-Art Report on Fiber Reinforced Concrete 1996, ACI: Detroit. p. 1-66.
20. Pour-Ghaz, M., et al., Experimental Methods to Detect and Quantify Damage in Restrained Concrete Ring Specimens. Journal of Advanced Concrete Technology, 2011. 9(3): p. 251-260.
21. Shah, H.R. and J. Weiss, Quantifying shrinkage cracking in fiber reinforced concrete using the ring test. Materials and Structures, 2006. 39(9): p. 887-899.
22. Grzybowski, M. and S.P. Shah, Shrinkage Cracking of Fibre Reinforced Concrete. ACI Materials Journal, 1990. 87(2).
23. Kwon, S.H. and S.P. Shah, Prediction of early-age cracking of fiber-reinforced concrete due to restrained shrinkage. ACI Materials Journal, 2008. 105(4): p. 381-389.
24. Kovler, K., Testing System for Determining the Mechanical-Behavior of Early Age Concrete under Restrained and Free Uniaxial Shrinkage. Materials and Structures, 1994. 27(170): p. 324-330.
25. Carlsward J. , Shrinkage Cracking of Steel Fibre Reinforced self compacting Concrete Overlays, in Department of civil and Environmental Engineering. 2006, Lulea University of Technology: Lulea,Sweden.
26. Weiss, W., W. Yang, and S. Shah, Shrinkage Cracking of Restrained Concrete Slabs. Journal of Engineering Mechanics, 1998. 124(7): p. 765-774.
27. Altoubat, S.A. and D.A. Lange, The Pickett effect at early age and experiment separating its mechanisms in tension. Materials and Structures, 2002. 35(4): p. 211-218.
28. Pilakoutas, K., K. Neocleous, and H. Tlemat, Reuse of steel fibres as concrete reinforcement. Engineering Sustainability,, 2004. 157(ES3): p. 131-138.
29. Tlemat, H., K. Pilakoutas, and K. Neocleous, Stress-strain characteristic of SFRC using recycled fibres. Materials and Structures, 2006. 39(3): p. 365-377.
30. Neocleous, K., et al. (2011) Fibre-reinforced roller-compacted concrete transport pavements. Proceedings of the ICE - Transport 164, 97-109.
31. Younis, K.H. and K. Pilakoutas, Strength prediction model and methods for improving recycled aggregate concrete. Construction and Building Materials, 2013. 49(0): p. 688-701.
32. BS EN 197-1:2011, Cement. Composition, specifications and conformity criteria for common cements. 2011, British Standard Institution: London, UK.
33. Musacchi, E., P. Iacobucci, and M. Pierfelice, Potential Process for Cleaning and Sorting of the recycled fibres, Deliverable report 13, FB6 STREP Project Ecolanes (031530). 2008.
34. Tlemat H., Steel fibres from waste tyres to concrete: testing, modelling and design, in Department of Civil and Structural Engineering. 2004, The University of Sheffield: Sheffield UK.
35. BS EN 12390-2:2009, Testing hardened concrete Part 2: Making and curing specimens for strength tests. 2009, British Standards Institution: London.

Chapter 6 Post-Restrained Shrinkage Behaviour of Concrete Made with Recycled Materials
174
36. ACI 207.2R-95, Effect of Restraint, Volume Change, and Reinforcement on Cracking of Mass Concrete, A.C. 207, Editor. 1995, American Concrete Institute: Farmington hills, MI, USA. p. 47.
37. Abbasnia, R., P. Godossi, and J. Ahmadi, Prediction of restrained shrinkage based on restraint factors in patching repair mortar. Cement and Concrete Research, 2005. 35(10): p. 1909-1913.
38. BS EN 12390-3:2009, Testing hardened concrete Part 3: Compressive strength of test specimens. 2009, British Standards Institution: London.
39. BS 1881-119:2011, Testing concrete. Method for determination of compressive strength using portions of beams broken in flexure (equivalent cube method). 2011, BSI: London-UK. p. 12.
40. ASTM-C1018-97, Standard Test Method for Flexural Toughness and First-Crack Strength of Fiber-Reinforced Concrete (Using Beam With Third-Point Loading). 1997, ASTM International.
41. Japan Society of Civil Engineers(JSC)-SF4, Methods of tests for flexural strength and flexural toughness of steel fibre reinforced concrete. 1994, Concrete Library of JSCE. p. 58-61.
42. Younis, K.H. and K. Pilakoutas, Assessment of Post-Restrained Shrinkage Mechanical Properties of Concrete ACI Materials, 2014. Submitted for publication.
43. Kovler, K., and Zhutovsky S., , Over view and future trends of shrinkage research. Materials and Structures, 2006. 39: p. 827-847.
44. Altoubat, S.A. and D.A. Lange. Early age shrinkage and creep of fiber reinforced concrete for airfield pavement. in Aircraft/Pavement Technology In the Midst of Change. 1997.
45. Fan, Y., J. Xiao, and V.W.Y. Tam, Effect of old adhered mortar on creep of recycled aggregate concrete. Structural Concrete, 2013: p. n/a-n/a.
46. Bazǎnt, Z.P. and W.J. Raftshol, Effect of cracking in drying and shrinkage specimens. Cement and Concrete Research, 1982. 12(2): p. 209-226.
47. Wittmann F.H., Creep and Shrinkage Mechanisms, in Creep and Shrinkage in Concrete Structures, Z.P. Bazǎnt and Wittmann F.H., Editors. 1982, John Wiley &Sons: Chichester. p. 129-161.
48. Alvaredo, A. and F.H. Wittmann. Shrinkage as influenced by strain softening and creep formation. in Creep and Shrinkage of Concrete, Proc. of the 5th International RILEM Symposium. 1993: E & FN SPON
49. BS EN 1992-1-1:2004, Eurocode 2: Design of concrete structures — Part 1-1: General rules and rules for buildings 2004, British Standard Institution: London, UK.
50. Altoubat, S.A. and D.A. Lange, A New Look at Tensile Creep of Fiber-Reinforced Concrete. ACI Special Publication, 2003. 216.
51. Rossi, P., J.-L. Tailhan, and F. Le Maou, Comparison of concrete creep in tension and in compression: Influence of concrete age at loading and drying conditions. Cement and Concrete Research, 2013. 51: p. 78-84.

Chapter 7 Summary and Conclusions, and Recommendations for Future Work
175
Chapter 7 Summary and Conclusions, and Recommendations for Future Work
This chapter presents the main conclusions that can be drawn from the work conducted in
this thesis. The chapter also proposes some recommendations for future work, aiming to
facilitate the use of recycled materials and enhance the understanding of the behaviour of
concrete containing such materials under restrained conditions.

Chapter 7 Summary and Conclusions, and Recommendations for Future Work
176
7.1 Summary and Conclusions
This study forms part of a wider body of work that aims to facilitate the use of recycled
materials such as RA and RTSF in the production of structural concrete through developing
a better understanding of shrinkage behaviour of NAC and RAC under restrained conditions.
To achieve this:
1- An experimental study was conducted, using RA originating from processing CDW and
crushing old laboratory concrete samples, to characterise the properties of RA. The
properties of RAC was quantified and compared with NAC. Surface treatment of RA and the
addition of short RSTF were used to improve the properties of RAC.
2- A new restrained shrinkage test and a procedure to quantify the mechanical properties of
post-restrained shrinkage of concrete was developed. A parametric study was conducted to:
a) check the effectiveness of the developed restraining frame,
b) quantify the effects of restrained shrinkage induced cracks on the behaviour of concrete
mixes incorporated RA, surface treated RA and RTSF.
Based on the results, the following conclusions can be drawn:
7.1.1 Characterisation of RA and Properties of RAC
The results of the WA tests show that, regardless of type of RA, more than 70% of
their 24hr WA capacity can be achieved when immersing RA in water for 10min.
For this reason, to overcome the issue of high absorption, it is recommended to
leave the RA in the mixer with half of the mixing water for 10 minutes.
A clear relationship can be identified between the particle density of RA and its
strength (LA), WA and porosity. When the particle density decreases, its strength
decreases whilst its WA and porosity increases.
The particle density of RA seems to have a strong relationship with very good
correlation with the strength of RAC. It was found that an 8% increase in particle
density leads to an increase of approximately 10 % in concrete strength, regardless
of RA content. Therefore, just as in NA, the particle density of RA seems to be

Chapter 7 Summary and Conclusions, and Recommendations for Future Work
177
predominantly responsible for the density of RAC. Also, the density of RA appears
to directly affect the strength of RAC. Consequently, to produce high quality of RA
from CDW, density separation is vital.
There is a good correlation between LA of RA and the normalized strength of RAC.
It is proposed that the use of LA coefficient alongside the particle density is used to
quantify the effect of RA on the strength of RAC.
The most important parameters (ρrd, LA, WA and RA content) that affect the
strength performance of RAC were used to develop a strength predictive model.
7.1.2 Methods to Improve RAC Strength
PMT and WMT were examined as techniques to treat the surface of RA-M (coating
with reactive and non-reactive microfillers). The results obtained from WMT were
slightly better, since all the microfiller used to coat the RA remains in the concrete
mix. Reactive microfillers such as GGBS and SF led to an increase in compressive
strength of RAC by 6% and 17% respectively (using WMT). FA did not result in
any strength improvement possibly due to the large size of FA particles. When non-
reactive microfillers (LP) were used, the compressive strength improved by 8%. SF
gave the best results and is recommended for surface treatment of RA.
It appears that the addition of 2% (by mass) RTSF delays/prevents the propagation
of microcracks and improves the compressive strength of RAC.
7.1.3 Restrained Shrinkage Test: Pilot Study-Single Rig
A developed pilot single rig only provided partial restraint and proposals for
improvements were made. The RF was found to vary with time due to the concrete
strength/stiffness evolution and crack development.
Bending and compression tests were undertaken on specimens exposed to restrained
shrinkage. Results obtained from these tests show that induced cracks can affect the
mechanical behaviour (flexural and compressive strength and flexural stiffness) of

Chapter 7 Summary and Conclusions, and Recommendations for Future Work
178
concrete by up to 21%. However, this was a very limited proof-of-concept study and
a parametric study was recommended to validate this conclusion.
7.1.4 Restrained Shrinkage Test: Parametric Study-Restraining Frame
A new restrained shrinkage rig (frame) was developed for this parametric study.
For the free shrinkage tests, the shrinkage strains on the top surface of the concrete
specimens are higher than those on the sides and the bottom surface. The variation
in strains is higher at an early age and more pronounced in mixes with high w/c
ratios. This is attributed to their higher porosity and better compaction of the lower
layer of the concrete.
This study quantifies that free shrinkage specimens develop curvatures due to
differences in shrinkage strains along the depth of the specimens. Differential
shrinkage can also develop between the surfaces and core of the specimens, which
can lead to surface tensile stresses which can amplify the effects of restrained
shrinkage.
In early ages, for the low w/c mix (NA30), the free shrinkage strains and their rate of
development are higher than those for higher w/c mixes (NA40 and NA50) due to
higher autogenous shrinkage. For later ages, the development of the shrinkage
strains of mixes with low w/c ratios slows down faster than for mixes with higher
w/c ratios, possibly due to the fact that there is less moisture that can be lost upon
drying due to their denser microstructure. Mixes with high w/c ratios initially lose
mass faster, due to moisture loss from large capillary pores and this results in
relatively low initial shrinkage strain.
For concrete under restrained conditions, shrinkage strains induced cracking is a
function of the concrete properties, since they govern the stiffness and the stress
history.
The majority of strain and RF loss of the proposed ''passive'' restraining frame, can
be attributed to the relative stiffness between the frame and the concrete specimens.
Long-term RF loss is also recorded due to loss of stiffness in the anchored zone and
creep of concrete due to the enforced expansion.
Chapter 7 Summary and Conclusions, and Recommendations for Future Work
179
Due to early age microcracking, which slows down elastic modulus development,
the apparent RF decreases at a relatively high rate over the first few days.
Nonetheless, microcracking reduces the overall stiffness gain of the concrete,
resulting in less overall strain loss than expected.
Drying (in both free and restrained conditions) reduces the compressive strength of
concrete by about 10-14%. Though surface microcracking due to shrinkage is
expected to reduce compressive strength, its effect appears to be relatively small
compared to the long term effect of maturity on strength. This may partly explain
discrepancies in compressive strength trends in previous studies.
The residual compressive strength of free specimens does not differ much from that
of restrained specimens. This is possibly due to the fact that most restrained
shrinkage induced macrocracks are found in the regions close to the upper and lower
plates of the compression test machine, which are well confined. Hence, standard
compression tests may overestimate the actual strength of restrained concrete.
Frictionless surfaces may help address this issue.
Shrinkage induced cracks affect the flexural strength of concrete mixes with
different w/c ratios in a different manner. The effects are more pronounced on mixes
with low w/c ratios (0.3) (reduction 11-24%) than on mixes with high w/c ratios (0.4
and 0.5) (reduction in the range of 2-5%). This may be due to high autogenous and
early thermal shrinkage (due to hydration). A higher rate of shrinkage and elastic
modulus evolution can lead to a faster rate of tensile stress development and may
reduce relaxation by creep if stiffness develops too fast. This can lead to earlier and
more microcracking, which can affect adversely the flexural strength of concrete.
For ''Free'' shrinkage specimens, just as the flexural strength, the damage of Efmax in
low w/c ratio (0.3) mix was higher (reduction of 9%) than in high w/c ratios mixes
(0.4 and 0.5) (reduction of 3-5%) due to the effect of surface microcracking.
For restrained specimens, the reduction in Efmax for w/c ratios 0.3 and 0.4 was up to
16% whilst mix 0.5 suffered the highest reduction up to 29%. This is despite the fact
that this mix (w/c= 0.5) had little or no flexural strength loss.
Overall, macro and micro cracks affected the Efmax more adversely in restrained
specimens. These results point towards creep as a mechanism of relaxation that

Chapter 7 Summary and Conclusions, and Recommendations for Future Work
180
stretches the material, creating many microcracks reducing the elastic modulus. The
higher this relaxation the larger it takes for the through crack to develop (as was the
case for w/c 0.5).
There is a clear correlation between increasing width of cracks in the critical region
and elastic modulus loss.
7.1.5 Restrained Shrinkage Behaviour of Mixes with ISF, RTSF and RA.
Industrial steel fibre at 2% dose used for slabs on grade applications did not greatly
influence the free shrinkage of concrete. However, RTSF increased initial shrinkage
strains due to higher air content and lower internal restraint. Another explanation for
the behaviour of RTSF is that, at the micro-level, short fibres (due to their large
number per volume) help in reducing micro damage (drying microcracks). As a
result, more intact material per unit volume is expected and higher shrinkage is
developed on the macro-level.
In comparison to NAC, RA from CDW lead to: a reduction in the compressive
strength by 27% and the flexural modulus of elasticity by around 23% and an
increase in shrinkage by 31% (at 1 day) and 35% (at 28 days).
Despite the fact that the mechanical properties of RAC and NAC were not similar,
under restrained conditions, both types of mixes cracked (failed) at around the same
time. This can be due to two opposing mechanisms: 1) higher shrinkage strains (of
RAC), which can lead to earlier failure. 2) lower stiffness (around 23% in flexural)
and expected higher creep which can delay the cracking of RAC by relaxation
mechanisms.
Under restrained conditions, the compressive strength of concrete mixes only
reduced by 3% in comparison to unrestrained condition. In unreinforced NAC, the
elastic modulus decreased by up to 16%. However, for RTSF reinforced specimens
the flexural elastic modulus did not decrease.
The addition of RTSF and surface treatment of RA resulted in higher (10-14%)
flexural performance (flLOP and flult) of RAC in all conditions (WC, F and R).

Chapter 7 Summary and Conclusions, and Recommendations for Future Work
181
The flexural strength of all specimens was not affected much by the different
exposure conditions. Nonetheless, the restrained specimens of the mixes with RTSF
appear to have a slightly higher flexural strength than without fibres and without
restrain.
In spite of the increase in the air content of concrete, RTSF help control shrinkage
induced microcracks propagation better than IF. This can be due to the role of short
fibres in enhancing the tensile creep behaviour of concrete by: 1) providing more
uniform distribution of internal stresses and engaging a larger volume of the matrix
in stress transfer; 2) reducing the micro-damage, and 3) promoting self healing of
microcracks. Hence, they are ideal for enhancing the flexural properties of RAC to
the level achieved by NAC.
7.2 Recommendations for Future Work
In this section, recommendations for future work are presented. These recommendations are
important to improve the understanding of some RAC behavioral issues that due to time
restrictions, were not dealt with in this work.
7.2.1 On Improving RAC Properties
1. The effect of surface treatment of RA on the durability of RAC should be further
studied to assess the long-term performance of RAC. This can be undertaken
through evaluating the transportation mechanisms (such as permeability, diffusivity
and sorptivity), pore-structure related properties (porosity) and other properties
(freeze and thaw, carbonation and sulphate attack).
2. More contents of SF (4%, 6% and 8%) for RA treatment should be considered to
determine the optimum content that provides the best structural and durability
performance for RAC.
3. Other types of reactive microfillers (such as Metakaolin) to treat the RA should be
examined to find out the other options of high reactivity microfillers that can be used
to improve the RAC behaviour.

Chapter 7 Summary and Conclusions, and Recommendations for Future Work
182
4. The effect of surface treatment of RA with a small quantity (2% by mass of cement)
of SF on the performance of RAC containing 100% recycled concrete aggregate
(RCA) should be studied.
5. The microstructure of the ITZs of RAC incorporated treated RA should be
quantitatively assessed (using large number of specimens) to obtain a firm
conclusion on the improved ITZs of RAC. This can be conducted using techniques
such as SEM and image analysis techniques to quantify the porosity of the ITZs of
RAC with and without treated RA.
7.2.1 On Restrained Shrinkage
1. The effect of shrinkage induced cracks (due to external restraint) on the durability
behaviour of NAC and RAC should be considered to evaluate the effect of these
cracks on the long term performance of concrete. This can be achieved by assessing
transportation related properties (such as permeability, diffusivity and sorptivity),
pore-structure related properties (porosity) and other properties (freeze and thaw,
carbonation, corrosion and sulphate attack).
2. The effect of curing (in particular at early ages) on the performance of concrete
under restrained (cracking time and post-shrinkage mechanical properties)
conditions should be examined.
3. When dealing with restrained shrinkage, studying the effect of autogenous, thermal
and drying shrinkage separately on the cracking behaviour of NAC and RAC (with
and without fibres) should be considered. This will help to improve understanding
the driving mechanisms of concrete cracking, in particular at early ages. For
example, sealing the restrained specimens (utilizing self adhesive aluminium foil)
can be used to quantify the autogenous shrinkage of concrete under restrained
conditions.
4. The technique used to recover strain loss should be improved. A step-wise method
to release the applied prestress (on the restraining frame) would help in the better
control of the amount of restraint (RF) provided and reduce the effects of sudden
release of the applied prestress.

Chapter 7 Summary and Conclusions, and Recommendations for Future Work
183
5. The degree of restraint achieved by the developed rigs is still relatively low and
stiffer arrangements need to be developed to achieve nearly 100% restraint. This
could be achieved by a better control of the overall strain loss.
6. Creep is clearly coupled with shrinkage in the developed set up and it is necessary to
assess creep deformations using separate measurements techniques or active control
rigs.
7. Taking individual manual measurements of cracks and crack development is
extremely time consuming and, hence, optical measurements could be used to
reduce effort. This also help to link the effect of cracks and crack development on
the strength and stiffness loss.
8. For the restraining frame, the gripping efficiency of the ends (where the concrete is
enlarged) should be improved to decrease strain losses at these ends. This can be
achieved by using steel plates as the sides of these ends. The sides should have teeth
to help the four threaded bars in gripping the ends of the restrained specimen. Easy
demoulding with minimal damage to the concrete at the end of the exposure time
should be ensured.
9. The utilization of high resolution cameras and image analysis techniques should be
considered to measure shrinkage strains, assess surface microcracking and determine
cracking time. The use of images will help in initiating shrinkage measurements in a
matter of few hours after casting.
10. The effect of the use of short RTSF on the creep behaviour of NAC and RAC should
be quantified. Based on the results of this study, RTSF showed good cracking
resistance and post-shrinkage mechanical performance, which are attributed to the
role of these fibres in enhancing creep/relaxation behaviour of concrete reinforced
with such fibres. The study should consider both compression and tensile creep in
both condition, sealed (basic creep) and unsealed (drying creep).

A-1
Appendices
Appendix A Shrinkage of Concrete
Appendix B Restrained Shrinkage (Effects, Types of Restraints and Assessment)
Appendix C Experimental Results - Chapter 2
Appendix D Experimental Results - Chapter 3
Appendix E Experimental Results - Chapter 4
Appendix F Experimental Results - Chapter 5
Appendix G Experimental Results - Chapter 6

Appendix A
A-2
Appendix A:
A. Shrinkage of Concrete
A.1 General
Concrete shrinkage leads to a reduction in the volume of concrete. Concrete shrinks in
response to moisture loss, temperature reduction and chemical reactions (hydration).
Concrete may experience shrinkage at different times, early ages (hours after casting) and
long term (many years) and under a variety of conditions. Generally, there are several types
of concrete shrinkage: thermal, plastic, autogenous, drying and carbonation shrinkage. To
various degree, they can contribute to cracking in structural concrete elements [1-3]. This
appendix reviews types of shrinkage and their main driving mechanisms.
A.1.1 Thermal Shrinkage
Internal and external reductions in temperature result in thermal shrinkage in concrete.
Thermal shrinkage of concrete results from temperature decrease at both very early ages
(hours after casting) and later ages. The latter includes the impacts of daily base and
seasonal base temperature variations, whilst the former is the response of concrete material
to the heat produced by the hydration process of cement. This process is accompanied by a
heat generation in large quantities, especially in massive concrete structures. In such
structures, the dissipation of this heat is relatively slow [4].
Following the placing of the concrete, almost all types of concrete display an expansion
induced by the heat generated from cement hydration. After that, the concrete cools and the
temperature falls down from a peak value to the ambient temperature. This cooling process
force the concrete to shrink [4, 5]. Concrete’s temperature reaches a peak value in the first
hours after placing and its magnitude depends on the initial temperature and the temperature
rise caused by hydration process. The peak value equals to the sum of both initial
temperature and temperature rise. The greater the initial temperature and the heat rise, the
higher the subsequent decline from peak temperature cooling down to ambient temperature
[4, 6]. The amount of thermal shrinkage influenced by many factors such as placement
temperature, temperature of fresh concrete and composition of concrete (type of cement and
aggregate, mineral admixtures [4]. The parameter that plays a key role in converting the
temperature change into strain in concrete is the thermal dilation (expansion) coefficient. It

Appendix A
A-3
is generally agreed that this coefficient is a function of the moisture state of the pore system
[4, 7] with very low values around 10-12 microstrain/oC for fully saturated pore system and
empty (dried) pore system and high values for partly saturated pore system with an ultimate
values in the range of 18-25 microstarin/oC. According to Powers and Brownyard [8] (cited
in [4]), the high values for the semi saturated pore system is due to redistribution of the pore
water and changes in capillary pressure exerted on the solid skeleton of cement paste.
It is reported by Hedlund [9] (cited in [4]) that in the early ages, thermal expansion
coefficient changes very rapidly with the strength development of the concrete (see Figure
A.1). As can be seen the thermal coefficient reaches almost a constant values of
approximately 12 microstrain /oC after 24h.
Figure A. 1 Early age thermal dilation coefficient for concrete [9] (cited in Holt [10])
A.1.2 Plastic shrinkage
Plastic shrinkage can be defined as the loss of water from wet concrete to the surrounding
environment. The name implies that this type of shrinkage occurs in concrete at very early
ages (hours after the concrete is placed) and before it gains any significant strength. It is
more common in thin concrete element such as slab and concrete pavements [1]. It happens
when the rate of water loss by the evaporation process is greater than the rate at which water
from the bleed of concrete is supplied to the surface [1, 11]. The main mechanism of
developing plastic shrinkage in fresh concrete is the formation of negative capillary pressure
in the concrete. If the water, which surrounds the concrete particles in plastic condition,
removed, menisci are formed between these particles. Negative capillary pressure develops
as a result of these menisci. A reduction in the volume of the cement paste occurs due to the

Appendix A
A-4
capillary pressure which pulls on the cement particles. If the loss of water from the concrete
surface continues, the pressure continues to rise and more decrease in the volume of concrete
occurs and at a critical value of the capillary pressure the remaining water in the matrix
rearranges to form distributed zones with empty pores in between. Plastic shrinkage cracks
develops at this point [11, 12].
A.1.3 Autogenous Shrinkage
Autogenous Shrinkage takes place at an early age as a results of the loss of volume (due to
consuming water inside the concrete by cement hydration process) under sealed (without
moisture loss to the surrounding environment) and isothermal conditions [4, 7]. Chemical
shrinkage is considered as the underlying driving mechanism of the development of
autogenuos shrinkage [4]. Chemical shrinkage is ‘’ the phenomena in which the absolute
volume of hydration products is less than the total volume of unhydrated cement and water
before hydration’’ [13] that is volume of the reaction products is smaller than that of
reactants due to the densification of the solid phases during the hydration process.
Chemical shrinkage is the dominant factor in autogenous shrinkage during the time prior to
setting and self-desiccation becomes dominant after setting [4, 14]. Autogenous and
chemical shrinkage are equal as long as the paste is in a liquid state. However, when the time
of setting is reached and the hydrated cement has gained certain rigidity, the measured
autogenous shrinkage becomes much lesser than the chemical shrinkage. This happens
because a solid skeleton begins to form around this time allowing empty pores to form and
constraining the extension of the contraction developed by chemical shrinkage. Self-
desiccation results from the consumption of the internal water due to the hydration of the
cement. The autogenous shrinkage induced by self- desiccation depends on the w/c ratio and
it increases with the decrease of w/c. The lack of the external water supply (curing) will lead
to self-desiccation and a set of unfilled pores will be generated in the microstructure of
cement paste. Consequently, capillary depression will be produced resulting in a measurable
physical shrinkage of concrete [4].
As far as the cracking of cement is concerned, it is also believed that the period around this
time (setting time) is very crucial and sensitive. Since cement paste or concrete has strength
but with low capacity to withstand stresses [15].

Appendix A
A-5
The first time when autogenous shrinkage recognized was in 1934 by C.G.Lyman (cited in
[16]). At that time however no further research in this field was undertaken [16] as it has not
been deemed of major important in normal strength concrete and even, decades after that, a
clear distinguish from drying shrinkage (see next section), except possibly for mass
concrete, has not established [7]. Nevertheless, the introduction of high strength and high
performance concrete which are produced with a very low w/cm ratio, has brought the
phenomenon of autogenous shrinkage to the attention of the researchers and become a ‘hot
topic’ [4, 17]
Generally, the typical strain caused by autogenous shrinkage for normal strength concrete is
about 20-110 με [2] which is considered small when compared to other type of concrete
deformations. On the other hand, a strain of up to 200- 400 με may occur in concrete with
low w/c or w/b ratios [18]. Furthermore, it has been reported that the autogenous shrinkage
becomes as much as drying shrinkage for low w/c concretes. For example the autogenous
shrinkage can reach a value of 40%, 50% and 100% of the total drying shrinkage of concrete
with w/c of 0.4, 0.3 and 0.17, respectively [19] (cited in [7]). The development of
autogenous shrinkage starts from the very early ages and this potentially increase the risk of
cracking [4, 13, 15].
Sometimes external supply of water (curing) is not helpful to mitigate the deformations
caused by autogenous shrinkage, in particular when the w/c ratio is very low. This happens
due to the fine pore structure of the low w/c concrete, the composition of concrete and the
inherent discontinuity of the pore structure of concrete which all reduce the ability of water
to penetrate into the concrete in short time [16].
The aforementioned discussion, explains how the phenomena of autogenous shrinkage is
complex and it is one of the significant mechanisms for restrained concrete to crack at early
age.
A.1.4 Drying Shrinkage
Drying shrinkage of concrete is a time dependent deformation and defined as a change
(decrease) in the volume of concrete caused by the migration of the moisture from the
concrete's surface to the atmosphere in an environment of low RH and constant temperature.
To ensure the workability of concrete at placement time, the quantity of water added to the
concrete mix is higher than what exactly the cement needs for the hydration process [20].

Appendix A
A-6
Part of this water has no contribution in producing hydration products. Consequently, it will
not take part in the chemical reaction between cement and water; hence there is no chemical
bond between this water and the solid phase of cement. Therefore, after the completion of
curing process, if concrete is exposed to drying conditions, a moisture gradient occurs which
cause the moisture to migrate out of the concrete accompanied by a volume reduction [21].
This moisture (water) is exist in the capillary (large) pores and gel (small) pores. The loss of
moisture from the former causes insignificant shrinkage deformations, whilst moisture loss
from the latter results in considerable shrinkage [18, 22].
The process of moisture movement is a slow process and it depends on the range of RH and
the composition of concrete as well as on the degree of hydration at the starting time of
drying exposure. Therefore, it takes place over many years to the shrinkage of concrete to
reach the ultimate values (long term drying shrinkage). However, significant part of the final
value of shrinkage occurs at the first weeks after being exposed to drying and the rate of
shrinkage diminishes rapidly with time [17, 18].
The drying shrinkage of concrete has been studied extensively and its main characteristics in
terms of mechanisms and affecting factors it has been reported and summarized in several
research papers and text books, for example : Bazant and Wittmann [23], Mindess and
Younig [24] and Neville [18].
There are several mechanisms behind the shrinkage of concrete, in particular drying
shrinkage. The most prominent mechanisms, which have been reported in the literature are
explained in next sections.
A.1.4.1 Driving Mechanisms of Drying Shrinkage
The most four known mechanisms of drying shrinkage in concrete that proposed in the
literature are: capillary pressure, variations in surface tension, movement of interlayer water
and disjoining pressure. These mechanism are all associated with the movement and loss of
water from concrete during drying [17, 25]. These mechanisms are complex and interrelated,
primarily due to the extended range of the distribution of the microstructure (pore size) of
normal concrete mixtures, which determine the various transport mechanisms during drying.
The evolution of pore system continues with time as results of hydration and maturity. The
transportation of moisture through the pores solids comprises water in a liquid state as well
as water vapour. The transportation of moisture may happen in different ways. Permeation
Appendix A
A-7
induced by a pressure head, diffusion caused by a concentration gradient, capillary suction
resulted from surface tension acting in the capillaries and others are the main mechanisms of
moisture transportation and may occur simultaneously within the concrete (particularly in
different areas of the cement paste as aggregates usually deemed to be impervious, apart
from light weight aggregate and RA) under drying conditions [17, 21].
A detailed explanation of these mechanisms is discussed and summarized by Wittmann [23]
and by Kovler and Zhutovsky [17]. A brief of these mechanisms is explained below.
Capillary pressure
Capillary pressure is probably the most well known phenomenon in drying porous media. In
brief, under drying, a meniscus is formed in the capillaries of the hardened cement
microstructure (capillary pores), resulting in tensile stresses in the capillary water (due to
surface tension forces). These tensile stresses are balanced by compressive ones in the
surrounding solid, causing shrinkage strains. This mechanism is belived to act in the high
RH range (until approximately 50% RH , since it fails to explain shrinkage deformations at
low RH [17, 21].
Surface tension
The mechanism of surface tension deals with the attractive forces of atoms or molecules at
the surface. This mechanism works at relatively low RH (less than 40%). Above that limit of
relative humidity, the whole surface is covered by adsorbed water molecules, thus, the
variation in RH can no longer vary the surface tension [17].
Movement of interlayer water
This mechanism is related to the layered-structure of the CSH within the cement gel [23,
26]. In general, it is agreed that interlayer water may diffuse out of the CSH sheets when RH
drops to about 10%, resulting in reducing the distance between these layers and causing
macroscopic shrinkage strains. Loss of a small amount of interlayer water results in
considerable volume reductions [17, 25, 26].
Disjoining pressure
The mechanism of disjoining pressure concerns the interaction between two solid surfaces.
As the thickness of the adsorbed water molecule layer increases, disjoining pressure can no
longer develop freely. As the relative humidity increases, the adsorption of water tends to

Appendix A
A-8
separate the two solid surfaces. Thus, the two surfaces undergo a pressure called “disjoining
pressure.” The maximum disjoining pressure occurs at the saturated state. When the system
goes from a saturated to unsaturated state, shrinkage occurs because of decreased disjoining
pressure [25].

Appendix A
A-9
References 1. Concrete Society TR 22 Non – Structural Cracks in Concrete. 2010, Concrete
Society. : Surrey, UK.
2. Gribniak, V., G. Kaklauskas, and D. Bacinskas, Shrinkage in Reinforced Concrete Structures: A Computational Aspect. Journal of Civil Engineering and Management, 2008. 14(1): p. 49-60.
3. Qiao, P., McLean, D. and Zhuang, J.,, Mitigation Strategies for Early-Age Shrinkage Cracking in Bridge decks. 2010, Department of Civil and Environmental Engineering , Washington State University: Pullman, Washington. .
4. ACI 231R-10, Report on Early-Age Cracking: Causes, Measurement, and Mitigation, in ACI Committee 231. 2010, American Concrete Institute: Farmington Hills, U.S.A.
5. ACI 207.2R, Report on Thermal and Volume Change Effects on Cracking of Mass Concrete, A.C. 207, Editor. 2002, American Concrete Institute: Farmington Hills, U.S.A.
6. Hughes, B.P., A new look at rigid concrete pavement design. Proceedings of the Institution of Civil Engineers-Transport, 2003. 156(1): p. 29-36.
7. Altoubat, S.A. and D.A. Lange. Early age shrinkage and creep of fiber reinforced concrete for airfield pavement. in Aircraft/Pavement Technology In the Midst of Change. 1997.
8. Powers, T. and T. Brownyard, Studies of the physical properties of hardened Portland cement paste. Bulletin, 1947. 22.
9. Hedlund, H., Stresses in high performance concrete due to temperature and moisture variations at early ages. 1996.
10. Holt, E.E., Early age autogenous shrinkage of concrete. Vol. 446. 2001: Technical Research Centre of Finland.
11. Naaman, A.E., T. Wongtanakitcharoen, and G. Hauser, Influence of different fibers on plastic shrinkage cracking of concrete. Aci Materials Journal, 2005. 102(1).
12. Brown, M.D., Sellers, G., Folliard, K.J., and Fowler, D.W. ,, Restrained Shrinkage Cracking of Concrete Bridge Decks: State-of-the-Art Review. 2001, Center for Transportation Research, The University of Texas at Austin: Texas.
13. JCI, Committee Report: Technical Committee on Autogenous Shrinkage of Concrete in AUTOSHRINK'98, Worshop on Autogenous Shrinkage of Cocncrete, E. Tazawa, Editor. 1998, Japan Concrete Institute Japan. p. 5-66.
14. Lamond, J.F. and J.H. Pielert, Significance of tests and properties of concrete and concrete making materials. Vol. 169. 2006: Astm International.
15. Altoubat, S.A. and D.A. Lange, Creep, shrinkage, and cracking of restrained concrete at early age. ACI Materials Journal/ SP, 2001. 98(4): p. 323-331.
16. Lam, H., Effects of internal curing methods on restrained shrinkage and permeability. 2005, University of Toronto.
17. Kovler, K. and S. Zhutovsky, Overview and future trends of shrinkage research. Materials and Structures, 2006. 39(9): p. 827-847.
18. Neville, A.M., Properties of concrete. 1995, Harlow: Longman Group.

Appendix A
A-10
19. Tazawa, E. and S. Miyazawa, Influence of constituents and composition on autogenous shrinkage of cementitious materials. Magazine of Concrete Research, 1996. 48(5): p. 15-22.
20. Mehta, P.K. and P.J.M. Monteiro, Concrete: Microstructure, Properties, and Materials. 2006, New York: McGraw-Hill.
21. Idiart, A.E., Coupled analysis of degradation processes in concrete specimens at the meso-level, in GEOTECHNICAL ENGINEERING AND GEOSCIENCES. 2009, Polytechnic University of Catalunya: BARCELONA.
22. Powers, T.C., Structure and physical properties of hardened Portland cement paste. Journal of the American Ceramic Society, 1958. 41(1): p. 1-6.
23. Wittmann F.H., Creep and Shrinkage Mechanisms, in Creep and Shrinkage in Concrete Structures, Z.P. Bazǎnt and Wittmann F.H., Editors. 1982, John Wiley &Sons: Chichester. p. 129-161.
24. Mindess, S. and J.F. Young, Concrete, Prentice Hall. Englewood Cliffs, NJ, 1981: p. 481.
25. Mokarem, D.W., Development of concrete shrinkage performance specifications. 2002, Virginia Polytechnic Institute and State University.
26. Bazant, Z.P. and R. L'Hermite, Mathematical modeling of creep and shrinkage of concrete. 1988: Wiley New York.

Appendix B
B-1
Appendix B:
Restrained Shrinkage (Effects, Types of Restraint and Assessment)
B. General
Deformations caused by shrinkage concrete can only lead to stresses and cracking if they are
restrained. Nonetheless, in real life, all concrete elements are practically restrained to some
degree, since some restraint always exists and can be provided by supporting elements or
from the different parts of the element itself. Degree of restraint is one of the factors that
determines the magnitude and distribution of developed tensile stresses and cracking. [1, 2].
Experimental procedures and tests for restrained shrinkage are vital to quantify the
restrained shrinkage behaviour of concrete.
In the next sections, the effect of the shrinkage induced cracks on the behaviour of concrete
is explained, the types of restraint are described and the available tests and experimental
procedures for restrained shrinkage are reviewed and discussed.
B.1 Restrained Shrinkage: Effects and Involved Factors
Shrinkage of concrete causes deformations (strains and curvatures) of all concrete structures.
Shrinkage associated deformations can be detrimental to the performance of concrete since
concrete is usually restrained. Restrained shrinkage induces tensile stresses which can lead
to concrete cracking if theses stresses exceed the tensile strength of concrete. Shrinkage
induced cracking is a main concern and challenge in constructing structures with large
exposed surface area such as pavements and slabs on grade [2]. Cracks induced by restrained
shrinkage of concrete usually compromises its structural integrity. Not only the structural
integrity of concrete structures is affected by shrinkage induced cracks, but also its
durability, serviceability and maintenance cost. Shrinkage cracks in concrete can
considerably affect properties such as permeability, diffusivity, sorptivity and porosity. This
significantly enhances the ingress of detrimental substances through these cracks into the
concrete. As a result, the effects of freeze-thaw damage, spalling caused by sulphate attack
and chloride penetration as well as corrosion of steel reinforcement will potentially increase.
Furthermore, reduced stiffness or strength loss and excessive deflection are other impacts of
shrinkage cracking [2, 3]. All these deteriorations and structural deficiencies may happen

Appendix B
B-2
prior to the application of external loads. Undoubtedly, applying loads on a precracked
concrete element can accelerate the cracking process and all associated deficiencies.
The mechanism of the development of shrinkage cracking (due to external restraint) is
complicated and depends on several factors. On one side, there are: the extent of shrinkage
and its rate of development, the amount of restraint imposed on the concrete, the mechanical
properties (tensile strength and elastic modulus) of the concrete at the time when the tensile
stresses are developed. On the other side, there is the tensile creep which counteracts the
shrinkage effect by acting as a stress relaxation mechanism [2, 4]. Understanding the role of
each of these factors in the development of shrinkage induced stresses and the associated
cracks is very important in the assessment of cracking tendency and the effects of the cracks
on the behaviour of concrete. More importantly, is the need for understanding the effect of
the interaction of these factors on the cracking development.
B.2 Restraint Types and Restraint Factor
In general, there are two types of restraints: external and internal. The former can restrain
concrete shrinkage on a large '' macrscopic'' scale and the latter on much smaller scale ''meso
and micro''. External restraints includes: surrounding (supporting) elements (e.g. walls and
columns) and (in the case of concrete pavements or slabs on grade) applied loads and base
friction [1, 3].
Internal restraint sources comprise of aggregates and reinforcement. Due to their higher
modulus of elasticity, reinforcement (steel bars) and aggregates (apart from light weight
aggregate) can restrain shrinking concrete. Internal restraint can also be caused by non-
uniform drying shrinkage (also called ''self-restraint''), which is usually caused by either
moisture or temperature gradients [5].
Restraint factor (RF) or restrained degree is usually used as an indication to the extent of
restraint applied to the concrete. According to Bentur [6], the RF can be defined as the ratio
of the stiffness of the restraining member and the shrinking element and when the two are
equal the degree of restraint is 50%, in this case the shrinkage of restrained element is 50%
of that of its free shrinkage [6]. According to ACI 207.2R-95 [3] the RF is given as the ratio
of actual stress induced by the restrained volume change to the stress which would develop
if the specimen was fully restrained. In other words, it is a ratio between the amount of
strain that is restrained to the free shrinkage strain [2, 7, 8].

Appendix B
B-3
B.3 Assessment of Restrained Shrinkage
Shrinkage of concrete is usually assessed/quantified in two conditions free and restrained.
Generally, the free shrinkage is expressed in axial strains (the change in length-longitudinal
direction- divided by the original length). There are many of the standard tests that deal with
free shrinkage such as BS ISO 1920-8 [9]. The free shrinkage tests consist of casting a
concrete beam and measuring the displacement on its ends as a direct relation to the time
elapsed after stripping the moulds.
Free shrinkage tests can provide information on the shrinkage behaviour of different
concrete mixtures. The effect of different factors such as concrete composition, environment
and storing conditions, and size and shape of concrete element can be assessed using these
tests. However, such tests cannot provide information on the post-cracking behaviour of
concrete under restrained conditions [10-14]. Restrained shrinkage tests help in the
assessment of cracking tendencies and the ability of concrete to withstand shrinkage induced
tensile stresses [2, 4, 14-16].
Over the last century, numerous test methods have been utilized to assess the behaviour of
mortar and concrete when they are restrained from free shrinkage [2, 17]. There is no
standardized test to assess the shrinkage behaviour of concrete under restrained conditions
[10-12, 14, 18]. However, both the American Association of State Highway and
Transportation Officials (AASHTO in 2008) and the American Society for Testing and
Materials (ASTM in 2004) adopted the ring test (see Figure B.1) as a standard test for
restrained drying shrinkage. The ring test was used as early as 1942 [19] (cited in [2]). The
ring test and some other tests used for restrained concrete is described in the following sub-
sections.

Appendix B
B-4
Figure B. 1 Schematic illustration of ring test.
B.3.1 Ring Test
In this test, a concrete annuls (ring) with a specific outer and inner radius is simply cast
around the perimeter of an internal steel ring. For a certain period of time the concrete is
cured and then exposed to drying conditions (constant temperature around 20 oC and RH
around 50%). The loss of moisture from concrete is allowed either through the
circumferential face or through the top and bottom faces. When the concrete ring shrinks
circumferential tensile stresses develop, due to restraints provided by the inner steel ring
against the free movement of the concrete. The stress distribution depends to some extent on
the type (direction) of drying as can be seen in Figure B.2. In the standards mentioned in
previous section, it is specified that the top and bottom faces should be sealed, thus allowing
drying only through the circumferential face. This results in a maximum tensile stress at the
circumference while drying through the top and bottom of the ring leads to a high stress at
the internal face as shown in Figure B.2.
Section A-A
A
A
Strain Gauges (4)
Sheet Metal Form
Wooden Base
Steel Ring
Concrete Specimen

Appendix B
B-5
Figure B. 2 Schematic description of the restraint stresses developed in ring test (Weiss et al [20]).
Generally, the stress development inside the concrete is usually quantified using strain
gauges. Four or two strain gauges are placed on the inner surface of the steel ring and used
to determine strain of concrete. The average strain is used to calculate the tensile stress
developed inside the concrete. The average developed stress in the concrete ring is
calculated by assuming a linear stress distribution throughout the steel ring. The concept of
equilibrium is then used, equalizing the compressive force in the steel ring to the tensile
force in the concrete ring. This enables the determination of the average tensile stress in the
concrete ring [2].
In the ring test, the time that it requires concrete rings made of different mixtures to crack
are measured. In addition to the cracking time, the development of the crack width is also
monitored and recorded. The free shrinkage strains of the concrete mixtures is also measured
using prismatic specimens. Therefore, for a given drying environment, the ring test can
provide information on the age at cracking, the width and rate of crack width increase and
number of cracks. This information can be used to compare the cracking sensitivity of
different concrete mixtures or to assess the efficiency of materials such as fibres in
controlling crack width [2, 13, 17, 21]
B.3.1.1 AASHTO Ring Test
In AASHTO ring test [22] , the standard steel ring has a thickness of 12.7 ± 0.4 mm, an
outer diameter of 305 mm, and a height of 152 mm. The outer ring form can be made of 6.4
mm thick cardboard with an inside diameter of 457 mm. On the inner surface of the steel
Steel
Concrete
Due to steel restraint
drying directionsealed
sealed
+
Stree distribution Concrete
Steel
Due to non-uniformshrinkage
Due to steel restraint
drying direction
sealed
sealed

Appendix B
B-6
ring, four strain gauges are placed at equidistant points at midheight. The strains from the
four gauges are recorded automatically using data acquisition equipment. The wooden base
can be made of 0.6 x 0.6 x 0.016 m plywood sheet. Prewetted burlap covered with plastic
sheet can be used as concrete curing. After removing the outer form at an age of 24±1 hr, the
specimens are transferred to the controlled room (constant air temperature of 23 ± 2oC and
50 ± 5 % RH). Every 30 minutes, the time and strain from the strain gages are recorded.
Also, every 2 or 3 days, visual inspection of cracking is conducted. A failure or cracking of a
concrete ring is related to sudden reduction of more than 30 με in strain values in one or
more strain gauge(s). After cracking, cracking time and crack length and width on the
exterior face are recorded [21].
B.3.1.2 ASTM Ring Test
The ASTM ring test [23] is to some extent different from the AASHTO ring. The steel ring
in ASTM standard test has thickness of 13 ± 0.12 mm. The outer diameter of the steel ring is
330 ± 3.3 mm and its height is 152 ± 6 mm. Two strain gages are placed on the inner surface
(midhieght) of the steel ring and used to measures strains. Data acquisition system is used to
automatically record strains at intervals no greater than 30 minutes. The base form can be
made of epoxy-coated plywood or other non-reactive surface. PVC or Steel can be sued for
the outer form with 406 ± 3 mm inside diameter and 152 ± 6 mm height. The testing drying
condition are 23.0 ± 2.0 oC and 50 ± 4% RH. A 30 με (or more) sudden decrease in strain in
one or both strain gauges indicates cracking of the concrete. After that, cracking time and the
length and width of crack are recorded. Unless cracking occurs prior to 28 days,the concrete
ring is monitored for at least 28 days after the exposure to drying,
B.3.1.3 Comparison between the AASHTO and ASTM Ring Tests
Generally, both standards follow the same concepts and procedures. However, there are
some differences between the two methods. The concrete ring dimensions and the maximum
size of aggregates allowed are the main differences. The AASHTO standard concrete ring
has a thickness of 76.2 mm, with an inner diameter of 305mm and an outer diameter of 457
mm, whilst the ASTM concrete ring has a thickness of 38.1 mm, with an inner diameter of
330 mm and an outer diameter of 406 mm. In ASTM test, the maximum size of aggregate is
less than 12.7 mm, whereas there is no requirement for the maximum aggregate size in the

Appendix B
B-7
AASHTO test. Due to its higher thickness, the concrete ring in AASHTO allows assessment
of larger aggregate sizes. In addition, the time of drying exposure is not specified in
AASHTO, whereas, this time is specified as 28 days in ASTM test.
B.3.1.4 Discussion on the ring test
Simplicity and versatility, are the main features of the ring-test. The test is easy to conduct
and does not require the use of complicated instruments and heavy machines. Also, the test
can be utilized to assess the effect of different materials (such as : fibres and shrinkage
reducing admixtures) and to evaluate the effects of influencing factors on the shrinkage
cracking behaviour of concrete [12]. These features have led the test to be the more
commonly used test to evaluate the potential for shrinkage cracking of different concrete
mixtures over the last decade. The same reasons have led ASTM and AASHTO to adapt the
ring test as a standard test for restrained shrinkage of concrete [2]. The test can also be used
as a quality-control test.
On the other hand, the test does not simulate and cannot predict concrete cracking in actual
service life, and rather reflects the relative cracking tendency of concrete mixtures [12, 13,
21, 24]. Also, the strains used to calculate the elastic stresses are not measured directly from
the concrete; instead they are measured on the outer face of the steel ring (see Figure B.1),
assuming a linear stress distribution throughout the thickness of the steel ring [2]. In
addition, the restrained shrinkage strain obtained from the ring test cannot be compared
directly with the free shrinkage strain of prismatic specimens [25]. Furthermore, the test
cannot quantify the residual strength of cracked concrete. For these reasons, the test can be
considered as a qualitative tool to assess the cracking tendency of different concrete
mixtures. Researchers have tried to develop other tests in order to find a quantitative tool to
assess concrete behaviour under restrained conditions. The next section deals with such
tests.
B.3.2 Linear (Longitudinal) and Plate tests
Several other test methods for restrained shrinkage have been proposed. These tests can be
classified into two categories: panel (Plate) tests in which the restrain is provided at the
circumference of the panel (biaxial restraint) and longitudinal tests which provide unaxial
restraint. According to the mode of restrain, the longitudinal tests can be further classified

Appendix B
B-8
into: fixed grips, external rigid frame or internal reinforcing bar, or by an active mechanism
which facilitates applying a load on one of the grips (the other one is fixed) to prevent
shrinkage of the concrete specimen [17, 26]. These methods and the way the data is
obtained and results are interpreted are discussed in the following sub-sections.
B.3.2.1 Plate test
The general shape of the plate test is shown in Figure B.3. With the intention of assessing
the effect of adding low volume content of polymer fibres on the plastic shrinkage
behaviour, the plate test have been used by several studies [27, 28] (cited in [17]). The test
includes casting a concrete specimen in a square mould with dimensions of about 1m × 1m,
or somewhat smaller. The restrain is provided along the perimeter of the mould using steel
bars. The surface of the slab is exposed to drying by blowing air (using a fan) to mimic
windy environments. There are different ways used to quantify the extent of concrete
cracking such as : maximum crack width, average crack width, total crack length, total crack
area (crack width × crack length) and number of cracks per unit area [26].
Figure B. 3 Configuration of plate test used by Yokoyama et al [28] (cited in [17]).
B.3.2.2 Linear (Longitudinal) Tests
Shrinkage restrained tests in this category can be divided into three types [17]:
0.6 m0.
6 m
Steel bars

Appendix B
B-9
(a) Longitudinal-qualitative test in which linear geometry is used as a restrain to measure
cracking only.
(b) Longitudinal-passive test, the test is passive as the restrain is applied by longitudinal bars
on which strain gauges are mounted. The rig in this test is partially instrumented to measure
the restraining forces and stresses.
(c) Longitudinal-active test, the test is an active test in nature as one of the grips is
continuously adjusted to keep the concrete specimen at zero strains or close to it and the
other one is fixed.
(d) Fully active longitudinal test, in this type, a close loop computer controlled system is
used to adjust the grip position and hold it at zero strain. Meanwhile, the load and strains in
restrained and free companion specimen are continuously recorded.
B.3.2.2.1 Longitudinal (Linear)-qualitative
Aiming at assessing the plastic shrinkage cracking in a pre-notched specimens, Berke and
Dallaire (1994) [29] used the rig shown in Figure B.4. The width of the rig is 370mm. A
metal strip was placed in the rig just before concrete casting. The function of this metal strip
is to produce a notch acting as a stress raiser. Also, riser were placed at the ends of the
mould to provide end restrain. The restrained specimen was exposed to drying conditions,
which achieved by blowing air, for 24h. To determine the cracking (at the end of the drying
exposure time), the specimen surface was divide into a mesh (50×50mm). The length and
width of cracks in these squares were traced and recorded. The total crack area (average
width × length) of the specimen surface was calculated and used as a measure of the
cracking tendency for the investigated mixes [17].
Figure B. 4 Schematic description of the longitudinal restraining rig used by Berke and Dallaire [29].
4cm
10 cm16 cm
Concrete sample
Sheet metal (stress riser) 560 mm

Appendix B
B-10
The restraining rig developed by Banthia et a.l [30, 31] is shown in Figure B.5. The restrain
is provided using end grips. The rig consists of a 50 mm thick plate base with two vertical
posts at the ends. The concrete specimens (40×40×500mm) is cast into a mould with anchors
(three bars) at each end. After demoulding, the concrete specimen is mounted on the rig by
attaching the anchors rigidly to the vertical posts. The specimen is placed on two frictionless
rollers with free movement in the longitudinal direction. The assembly is placed in a
chamber with drying conditions of 50oC and 50% RH. A microscope is used to detect
cracks. In this test, number, width and length of cracks are recorded. The cracking
characteristics of different concrete mixes is measured based on the calculated total crack
width and length.
Figure B. 5 Linear rig test with end restraint used by Banthia et al. [30].
B.3.2.2.2 Longitudinal (Linear)-Passive
Cracking Frame
To study the effect of thermal stresses on the behaviour of restrained concrete under
adiabatic conditions, a linear-passive restraining rig (also called cracking frame) was
developed at the University of Munich [17, 32]. It is considered as the first generation of
linear stress testing machine [2] and it was adopted by RILEM (Réunion Internationale des
Laboratoires d'Essais et de recherche sur les Matériaux et les) as a recommended test
method-TC 119 [33] for cracking evaluation, see Figure B.6. The rig consists of two mild-
steel crossheads which are connected by two rigid steel linear side bars (100 mm). Fixing
the concrete specimen at the ends is important for the rigid linear bars to provide the
sufficient restraint. This is achieved by casting the concrete directly into the ends at the
crossheads. The ends have ''teeth'' that hold (grip) the specimens. To provide further gripping
and reducing the slippage of the specimen ends, crossbars are bolted on the top and bottom
of each crosshead [2, 17, 32].
500*40*40 mm
Concrete sample
680 mm
1000 mm

Appendix B
B-11
Figure B. 6 Restrained test rig ''Cracking frame'' recommended by RILEM to assess thermal cracking of concrete.
Nickel steel alloy (very low coefficient of thermal expansion 1×10⁻⁶/oC) is utilized to keep
the effect of temperature change on the length change of the linear side bars to minimum
level. The linear side bars are instrumented with two strain gauges that can detect very small
axial strains caused by the combined effect of the thermal and autoagenous shrinkage [34]
(cited in ACI 231.R [2]). The uniaxial stresses developed in the middle part of the concrete
specimen is assumed uniform and calculated from the measured strain on the steel bars and
the cross section areas of the bars and the concrete specimen. The test can measure
restraining stresses in compression and tension. The former develops as the concrete
temperature rises (due to hydration) soon after casting and the latter develops on cooling
later.
To minimize dissipation of concrete temperature ''ensure adiabatic condition'', the concrete
specimen is insulted by using a formwork made of polystyrene with thickness of 50 mm.
Also, there is a 0.2 mm copper plate in between the insulted material and the specimen to
ensure uniform thermal change. In addition, the formwork is equipped with a pipe network
that enable circulation of water (with different temperature) for more control (adjustment) of
thermal conditions. The high insulation system used in the test allows initiation of
measurements immediately after concrete casting.
In this thermal test, the concrete specimen can be cooled to the ambient temperature. The
concrete specimen is monitored for cracking for four days first. If no cracks develop in the
first 4 days, then the system is cooled artificially at a constant rate by decreasing the
Crosshead brace
Crosshead
Concrete sample Strain gauges
Invar barInsulated formwork

Appendix B
B-12
temperature (using the circulated water) until cracking occurs. The temperature at which
cracking occurs is recorded and called cracking temperature. The cracking temperature is
used as an indication to measure the cracking tendency of different concrete mixtures.
Higher cracking temperature indicates higher cracking tendency of concrete. Other
parameters that can be obtained from the tests are stress development curve, zero stress
temperature (temperature at which the developed compressive strength- due to rise in
concrete temperature-decreases to zero) corresponding to stress-free condition [26].
Weiss et al (1998) testing rig
A linear passive rig test was introduced by Weiss et al (1998) [14]. The aim of the study was
to develop a test method for assessing the shrinkage cracking potential of normal and high
strength concrete (with and without fibres) for pavement applications (see Figure B.7). The
developed rig consist of a restraining reaction beam (with hollow box section) The
longitudinal concrete specimen has a cross-section of 100×25 mm (width × depth) and
length of 1m. The mechanism used to grip the concrete ends is achieved using lateral
clamping utilizing steel plates and threaded bars at the ends of the specimen to clamp the
ends against the reaction beam. In this study, a second rig to simulate base restraint was also
developed by same authors . In the second rig, steel strips (6.5×3×100 mm) spacing at 14
mm (centre to centre) were welded on the top surface of the reaction beam. The mechanism
used to grip the specimen ends was also used in the second rig. The parameters used to
assess the cracking behaviour of different type of concrete (normal and high strength, plain
and fibre reinforced concrete) are age of cracking, average crack width, development of
crack width and number of cracks (at 50 days).
Figure B. 7 Schematic illustration of rig test used by Weiss et al [14].
Similar rig configuration to that developed by Weiss et al. [14] was also used by Carlsward,
[13] to assess the cracking behaviour of thin overlays exposed to drying shrinkage. under
restrained conditions.
100x75x1000 mm Structural Steel Tube
Clamping plate
Concrete (depth=25 mm)
End supportThreaded rods

Appendix B
B-13
Restraining steel bars
Another technique that can be classified as passive method to restrain concrete shrinkage is
the use of internal restraining bar(s). The restraint is provided by embedding restraining steel
reinforcement bars in the specimen ends (the bar being debonded in the middle part only, see
Figure B.8) [4, 35] or with the use of anchor nuts at the end of the specimen. [36]. The
cracking behaviour assessed according to the time of cracking, crack width and the increase
of crack width with time.
Figure B. 8 Schematic illustration of ring test used by recommended by JCI [35].
B.3.2.2.3 Longitudinal (Linear)-Active
In the passive tests, the extent of stress development in the shrinking element relies on the
ratio between the stiffness of the concrete and to that of the restraining element and can
provide partial (unknown) restraint. Linear active rigs with no relay on the rigidity of the
restraining element were developed aiming at providing high degree of restraint ''full
restraint''. Same configuration of the enlarged ends used in the passive tests was exploited by
researchers to develop the active tests [26].
In such rigs, the concrete specimen is gripped at its both ends with one end free to move and
the other is fixed. The axial displacement of the movable end is observed using a
displacement gauge. The original position of the free end is recovered by applying a tensile
load whenever shrinkage deformation occurs. Deformation recovering (applying the load) is
achieved manually (using screw) or in an automatic manner (using hydraulic motor). The
applied load can be measured using a load cell [17].
Polyester filmPTFEPolyester film Foamed polystyrene sheet
D= 31.8mm
100
mm
600 mm300 mm600 mm
1500 mm100 mm

Appendix B
B-14
According the direction of the specimen alignment, the linear active tests can be divided into
vertical and horizontal. The latter facilitates the initiation of the test directly after concrete
placement whilst, in the former the tests can be started after one day or later [17].
Horizontal Active Rigs
This configuration of the active rigs was reported by Springenschmid et al [33] and Bloom
and Bentur [37]. The load used to adjust the length of the specimen is applied in cycles in a
way that keeps the deformation between the cycles to very small level (1- 5 micron for 1m
long specimen) so as to consider the concrete under ''100%'' restraint. To assess the thermal
stresses and cracking of concrete, Springenschmid et al [33] developed their horizontal
passive rig (mentioned in preivius section) to an active rig and they called it ''Temperature
Stress Testing Machine (TSTM)''. The TSTM (shown in Figure B.9) was also used to assess
the behaviour of concrete under isothermal which included studying the effect of autogenous
shrinkage [38] (cited in [17]). This confirmed that TSTM can be used to assess both thermal
and atougenous shrinkage under restrained condition and this is very important as in real life
stresses induced by thermal (due to hydration) and autogenous shrinkage develop
simultaneously. The horizontal rigs was also used by Bloom and Bentur [37] aiming at
evaluating concrete cracking induced by autogenous shrinkage for plain and fiber reinforced
high strength concrete [17].
Figure B. 9 Schematic illustration of TSTM test rig (Springenschmid et al. [39] (cited in [2])
Electronic control and recording Thermostat
MotorDynamometer
Fixed crosshead
Free crosshead
Length measuring system
Concrete Specimen
Temperature-regulated formwork
15
cm
100 cm

Appendix B
B-15
Verticall Active Rigs
Similar shape of test rig to that used by the horizontal tests is used by Paillere et al. [40] but
in this case the concrete specimen tested in vertical position. The lower end of the concrete
specimn was fixed and the upper one was movable. The upper end was attached to air
pressure equipment. The load required to adjust the change in length of the concrete
specimen was recorded with time. The accuracy of measuring change in length was 1
micron.
B.3.2.2.4 Fully automated (closed loop) active test
In 1994, Kovler [16] developed a fully automated test rig. The concept of restraining the
concrete specimen in this test is the same as the concept of the horizontal active rigs used by
Springenschmid [33] and Bloom and Bentur [37] but instrumented with a closed loop
computer controlled system. Such system lead to results with high accuracy. In the test twin
specimens were used, one is free to shrink and the other is restrained as shown in Figure
B.10.
Figure B. 10 Schematic illustration of closed loop of restrained test developed by Kovler [16].
One of the most important feature of this test is the compensation cycle. The compensation
cycle is the amount of the load that needed to adjust the movable end every time when a 5
microstrain of shrinkage strain develops in the concrete specimen. Each cycle consists of an
LVDTs
PC
Amplifier
Free end Fixed end
Gripped end
Shrinkage
Universal jointLoad cell
motor
Shaft
Contoller
Free specimen
Restrained specimen

Appendix B
B-16
elastic strain (5 microstrain) due the increase in load. The strain between two subsequent
applications of load consist of :1- the additional shrinkage strain which is simply the
increment of free shrinkage during the cycle (obtained from the free specimen). 2- the creep
strain due to the load application as can be seen in Figure B.11. In this type of restrained
shrinkage test, a variety of properties can be determined such as:. shrinkage strains and
stresses, age of cracking, crack width, rate of stress/strength and development of tensile
stress. Additionally, the comparison between two specimens (free and restrained ) enable the
quantification of creep as relaxation mechanism. Hence, this method has the merit of
quantifying creep strain beside determining shrinkage strains and stresses.
Figure B. 11 Schematic description of the compensation cycles, free shrinkage and creep of concrete in restrained test developed by Kovler [16].
This system motivated other researchers [15, 41, 42] to investigate the behaviour of different
type of concretes such as fibre reinforced concrete and high strength concretes and also
examine the behaviour of concrete at early ages under restrained conditions.
B.3.2.2.3 Summary and Discussion on Linear Tests
In most of the studies that dealt with these tests, researchers have tried to develop uniaxial
restrained shrinkage tests. Therefore, the shape of the specimen is a beam with a square or
Time
Stra
ins
Free shrinkage + Creep (Cumulative Curve)
Creep
Free shrinkage
Incremental elastic strain
Compensation cycles
shrinkage + Creep

Appendix B
B-17
rectangular cross section with straight or flared ends. In some of these methods a concrete
specimen is cast in a restraining steel frame and connected to the frame by increasing the
cross section at both ends in steel crossheads or by utilizing anchors with or without
clamping. In some of these tests, the shrinkage stress developed inside the concrete is
calculated by using the strain gauge fixed to the surrounding steel frame. Other methods
have been introduced by modifying the same previous test rig but with adjustable
crossheads. In these methods, a concrete specimen is put in a horizontal position and gripped
at its ends. One of these ends is movable and the other is fixed. The drying shrinkage
induces horizontal displacements (movement of free end) that is periodically observed by a
displacement gauge. The displacment is recovered by applying a tensile load on the
specimen after the occurrence of a pre-defined amount of displacement. The tensile load is
applied using a load cell and a hydraulic servo actuator. Some of these tests have been
developed so they are controlled by using a closed- loop computer control. Some of these
tests provide unknown (partial) restrained degree and others provide 100% ''full'' restrained.
By using the above methods, a variety of concrete properties can be obtained. For example
shrinkage (drying and autogenous) strain, shrinkage stress, age of cracking, crack width, rate
of stress/strength, creep of concrete, development of tensile stress with time and degree of
restrained. Some of these properties can only be used as qualitative tools to compare
different concrete mixtures, while others can quantify the behaviour of concrete under
restrained conditions. However, they do not provide vital information regarding the residual
strength of the concrete under restrained conditions and do not quantify the effect of the
micro and macro shrinkage induced cracks on the behaviour of concrete.
The drawbacks of these methods can generally be summarized as the following:
- Just as in uniaxial tensile test of concrete, conducting uniaxial restrained shrinkage tests by
providing full restraint for the ends is questionable. This is because, practically it is almost
impossible to grip the ends of the linear specimen providing full restraint and avoiding
slippage and premature failure due to stress concentration [43, 44].
- The way of applying the restraining load needs high accuracy and also the load must be
applied in a smooth way without irregularities, so that load shocks can be avoided to prevent
premature failure, especially of the concrete at early age. Additionally, avoiding
misalignment of the restraining applied load is also difficult [44].
- From a practical prospective when many parameters are needed to be examined, the setting
up of such tests and their instrumentation can be too complicated and expensive. For

Appendix B
B-18
example, devises with very high accuracy is required to measure displacements and loads
[12, 44]. Automatic strain measurements are also difficult since cracking positions are not
known a-priori.
- The limited dimensions of the specimens used, in particular the depth, in some of these
tests is also another issue. This can limit the use of normal size coarse aggregates. In fact, in
some of these tests no coarse aggregate is used at all [12] [21]
- None of these tests allow dismounting the concrete specimen after the exposure to
restrained shrinkage without destroying the specimen. Developing a rig that enables
dismounting the concrete specimen would facilitate conducting tests such bending and
compression test to quantify the effect of the shrinkage induced cracks on the residual
mechanical properties such as flexural and compressive strength and elastic modulus.
As a result of the aforementioned difficulties, such tests are avoided in common quality
control testing and large-scale parametric study investigations [2, 45-47].

Appendix B
B-19
References
1. Bisschop Jan, Drying Shrinkage Microcracking in Cement-based Materials, in Civil engineering and Geoscience. 2002, Delft University of Technoloy: Delft, Netherlands.
2. ACI 231R-10, Report on Early-Age Cracking: Causes, Measurement, and Mitigation, in ACI Committee 231. 2010, American Concrete Institute: Farmington Hills, U.S.A.
3. ACI 207.2R-95, Effect of Restraint, Volume Change, and Reinforcement on Cracking of Mass Concrete, A.C. 207, Editor. 1995, American Concrete Institute: Farmington hills, MI, USA. p. 47.
4. Carlson, R.W., Attempts to Measure the Cracking Tendency of Concrete ACI, 1940. 36: p. 533-537.
5. Bisschop, J. and J.G.M. Van Mier, Effect of aggregates on drying shrinkage microcracking in cement-based composites. Materials and Structures/Materiaux et Constructions, 2002. 35(252 SPEC.): p. 453-461.
6. Bentur, A., Early-Age Shrinkage and Cracking in Cementitious Systems. Concrete Science and Engineering, 2001. 3: p. 3-12.
7. Leung, C., A. Lee, and R. Lai, New Testing Procedure for Shrinkage Cracking of Fiber-Reinforced Shotcrete. Journal of Materials in Civil Engineering, 2007. 19(3): p. 214-218.
8. Abbasnia, R., P. Godossi, and J. Ahmadi, Prediction of restrained shrinkage based on restraint factors in patching repair mortar. Cement and Concrete Research, 2005. 35(10): p. 1909-1913.
9. BS ISO 1920-8:2009, Testing of concrete. Determination of the drying shrinkage of concrete for samples prepared in the field or in the laboratory. 2009, British Standard Institution: London, UK.
10. Grzybowski, M. and S.P. Shah, Model to Predict Cracking in Fiber Reinforced-Concrete Due to Restrained Shrinkage. Magazine of Concrete Research, 1989. 41(148): p. 125-135.
11. Swamy, R.N. and H. Stavrides, Influence of Fiber Reinforcement on Restrained Shrinkage and Cracking. Journal of the American Concrete Institute, 1979. 76(3): p. 443-460.
12. Tritsch, N., Darwin, D. and Browning, J.A. , Evaluating shrinkage and cracking behaviour of concrete using restrained ring and free shrinkage tests. 2005, Structural Engineering and Engineering Materials,The University of Kansas Center for Research Inc.: Lawrence, Kansas.
13. Carlsward J. , Shrinkage Cracking of Steel Fibre Reinforced self compacting Concrete Overlays, in Department of civil and Environmental Engineering. 2006, Lulea University of Technology: Lulea,Sweden.
14. Weiss, W.J., W. Yang, and S.P. Shah, Shrinkage cracking of restrained concrete slabs. Journal of Engineering Mechanics-Asce, 1998. 124(7): p. 765-774.
15. Altoubat, S.A. and D.A. Lange, Creep, shrinkage, and cracking of restrained concrete at early age. ACI Materials Journal/ SP, 2001. 98(4): p. 323-331.

Appendix B
B-20
16. Kovler, K., Testing System for Determining the Mechanical-Behavior of Early Age Concrete under Restrained and Free Uniaxial Shrinkage. Materials and Structures, 1994. 27(170): p. 324-330.
17. Bentur, A. and K. Kovler, Evaluation of early age cracking characteristics in cementitious systems. Materials and Structures, 2003. 36(3): p. 183-190.
18. Altoubat, S.A. and D.A. Lange. Early age shrinkage and creep of fiber reinforced concrete for airfield pavement. in Aircraft/Pavement Technology In the Midst of Change. 1997.
19. Carlson, R.W., Cracking of Concrete. The Boston Society of Civil Engineers, 1942. 29(2): p. 98-109.
20. Weiss, W.J., W. Yang, and S.P. Shah, Influence of specimen size/geometry on shrinkage cracking of rings. Journal of Engineering Mechanics-Asce, 2000. 126(1): p. 93-101.
21. Qiao, P., McLean, D. and Zhuang, J.,, Mitigation Strategies for Early-Age Shrinkage Cracking in Bridge decks. 2010, Department of Civil and Environmental Engineering , Washington State University: Pullman, Washington. .
22. AASHTO T 334-08, Standard Practice for Estimating the Crack Tendency of Concrete. 2008, AASHTO Washington D.C.
23. ASTM C1581-04, Standard Test Method for Determining Age at Cracking and Induced Tensile Stress Characteristics of Mortar and Concrete under Restrained Shrinkage. 2004, ASTM International. p. 791-796.
24. Banthia, N., C. Yan, and S. Mindess, Restrained shrinkage cracking in fiber reinforced concrete: A novel test technique. Cement and Concrete Research, 1996. 26(1): p. 9-14.
25. Tongaroonsri, S. and S. Tangtermsirikul, Effect of mineral admixtures and curing periods on shrinkage and cracking age under restrained condition. Construction and Building Materials, 2009. 23(2): p. 1050-1056.
26. Bentur, A., Early Age Cracking Tests, in Early Age Cracking in Cementitious Systems - Report of RILEM Technical Committee 181-EAS - Early age shrinkage induced stresses and cracking in cementitious systems, A. Bentur, Editor. 2003, RELIM. p. 241-255.
27. Kraai, P.P., A proposed test to determine the cracking potential due to drying shrinkage of concrete. Concrete Construction, 1985. 30(9): p. 775-778.
28. Yokoyama, K., et al., Shrinkage and Cracking of High-Strength Concrete and Flowing Concrete at Early Ages. ACI Special Publication, 1994. 148.
29. Berke, N. and M. Dallaire, Effect of low addition rates of polypropylene fibers on plastic shrinkage cracking and mechanical properties of concrete. ACI Special Publication, 1994. 142.
30. Banthia, N., M. Azzabi, and M. Pigeon, Restrained shrinkage tests on fiber reinforced cementitious composites. Testing of Fiber Reinforced Concrete, 1995. 155: p. 137-151.
31. Banthia, N., M. Azzabi, and M. Pigeon, Restrained Shrinkage Cracking in Fiber-Reinforced Cementitious Composites. Materials and Structures, 1993. 26(161): p. 405-413.
32. Mangold, M., Methods for Experimental Determination of Thermal Stresses and Crack Sensitivity in the Laboratory. RILEM REPORT, 1998: p. 26-39.

Appendix B
B-21
33. Springenschmid, R., Breitenbucher, R., Mangold, R.,. Development of the cracking frame temperature-stress testing machine, . in Thermal Cracking in Concrete at Early Ages 1994. Proceedings RILEM Symposium E&FN SPON.
34. Breitenbücher, R., Investigation of thermal cracking with the cracking-frame. Materials and Structures, 1990. 23(3): p. 172-177.
35. JCI, Committee Report: Technical Committee on Autogenous Shrinkage of Concrete in AUTOSHRINK'98, Worshop on Autogenous Shrinkage of Cocncrete, E. Tazawa, Editor. 1998, Japan Concrete Institute Japan. p. 5-66.
36. Collins, F. and J.G. Sanjayan, Cracking tendency of alkali-activated slag concrete subjected to restrained shrinkage. Cement and Concrete Research, 2000. 30(5): p. 791-798.
37. Bloom, R. and A. Bentur, Free and Restrained Shrinkage of Normal and High-Strength Concretes. Aci Materials Journal, 1995. 92(2): p. 211-217.
38. Van Breugel, J. K. De Vries, and K. Takada, Mixture optimization of low water/cement ratio high strength concretes in view of reduction of autogenous shrinkage in High Performance Concretes, . August,1998: Sherbrooke, Canada.
39. Springenschmid, R., E. Gierlinger, and W. Kiernozycki. Thermal stress in mass concrete: a new testing method and the influence of different cements. in Proceedings of the 15th International Congress for Large Dams. 1985.
40. Paillere A. M., B.M., Serrano J. J. ,, Effect of Fiber Addition on the Autogenous Shrinkage of Silica Fume. ACI Materials Journal, 1989. 86(2): p. 6.
41. Igarashi, S., A. Bentur, and K. Kovler, Stresses and creep relaxation induced in restrained autogenous shrinkage of high-strength pastes and concretes. Advances in Cement Research, 1999. 11(4): p. 169-177.
42. Pigeon, M., et al., Equipment for the analysis of the behaviour of concrete under restrained shrinkage at early ages. Magazine of Concrete Research, 2000. 52(4): p. 297-302.
43. Grzybowski, M. and S.P. Shah, Shrinkage Cracking of Fibre Reinforced Concrete. ACI Materials Journal, 1990. 87(2).
44. Altoubat, S.A., Early age stresses and creep-shrinkage interaction of restrained concrete. 2000.
45. Altoubat, S.A. and D.A. Lange, Creep, shrinkage, and cracking of restrained concrete at early age. Aci Materials Journal, 2001. 98(4): p. 323-331.
46. Tongaroonsri, S. and S. Tangtermsirikul, Influence of mixture condition and moisture on tensile strain capacity of concrete. ScienceAsia, 2008. 34(1): p. 59-68.
47. Hossain, A.B., and Weiss, W. J., , Assessing Residual Stress Development and Stress Relaxation in Restrained Concrete Ring Specimens. Cement and Concrete Composites, 2004. 26: p. 531-540.

Appendix C
C-1
Appendix C:
Experimental Results -Chapter 2
C.1 Constituents of Coarse RA According to BS EN 933-11:2009[1]
Table C-1 Description of constituents of coarse recycled aggregates [1]
Constituent Description
Rc Concrete, Concrete products, Mortar, Concrete masonry units
Ru Unbound aggregate , Natural stone , Hydraulically bound aggregate
Rb Clay masonry units (i.e bricks and tiles), Calcium silicate masonry units,
Aerated non-floating concrete
Ra Bituminous materials
FL Floating materials (in volume)
X Others:
Cohesive (i.e clay and soil)
Miscellaneous : metal (ferrous and non-ferrous
Non-floating wood, plastic and rubber
Gypsum plaster
Rg Glass

Appendix C
C-2
C.2 Composition Test Results of Coarse RA
Table C-2 The constituents materials of coarse RA of different sizes*.
Constituents
RA-C RA-M RA-B RA-C1
20-14
14-10
10-5
20-14
14-10
10-5
20-14
14-10
10-5
20-14
14-10
10-5
Rc 71.1 80.5 77.3 67.2 70.9 67.3 0.0 0.0 1.0 77.7 76.1 83.1
Ru 28.0 17.3 17.6 17.0 13.3 11.0 0.0 0.0 0.0 22.3 23.9 16.2
Rb 0.5 0.8 1.0 9.8 10.1 12.9 95.0 95.6 89.1 0 0 0
Ra 0.3 1.0 0.9 4.3 4.8 5.7 1.0 1.6 3.0 0 0 0
X 0.0 0.2 1.4 0.7 0.1 2.5 1.2 1.1 3.3 0 0 0
Fine materials 0.1 0.1 1.0 0.1 0.1 0.1 1.1 1.3 2.2 0 0 0.7
Rg 0.0 0.0 0.6 0.9 0.7 0.5 1.7 1.0 1.4 0 0 0
FL 0.2 0.25 0.2 0.7 1.1 0.9 0.4 0.5 0.8 0 0 0
* Sizes are in mm.

Appendix C
C-3
C.3 Analysis of Length of Recycled Steel Tyre Fibres
Table C-3 Results of length distribution .
Length (mm) Frequency Cumulative %
0 0 0.00% 2.5 22 1.89% 5 89 9.51%
7.5 55 14.22% 10 50 18.51%
12.5 81 25.45% 15 121 35.82%
17.5 175 50.81% 20 182 66.41%
22.5 156 79.78% 25 92 87.66%
27.5 55 92.37% 30 32 95.12%
32.5 22 97.00% 35 13 98.11%
37.5 6 98.63% 40 6 99.14%
42.5 4 99.49% 45 1 99.57%
47.5 2 99.74% 50 1 99.83%
52.5 1 99.91% 55 1 100.00%
57.5 0 100.00% 60 0 100.00%

Appendix C
C-4
Table C-4 Results of statistical analysis of length of RTSF fibres.
Statistical Analysis Results Mean 16.99 Standard Error 0.23 Median 17.26 Standard Deviation 7.90 Sample Variance 62.4 Kurtosis 0.94 Skewness 0.34 Range 51.75 Minimum 2.06 Maximum 53.80 Count 1167 Confidence Level(95.0%) 0.45
C.4 Bulk Density of Coarse Aggregates
Table C-5 Results of bulk density test of NA and RA.
Type of aggregate Size mm Density kg/m3
Natural
14-20 1646 10-14 1585 5-10 1603 5-20 1668
Mixed
14-20 1212 10-14 1171 5-10 1184 5-20 1234
Concrete
14-20 1310 10-14 1283 5-10 1257 5-20 1338
Brick
14-20 1027 10-14 1038 5-10 1026 5-20 1042

Appendix C
C-5
C.5 Compressive strength and density of concrete at 28 days
Table C-6 Results of compressive strength at 28 days.
Type % RA Compressive
strength MPa
Average Strength
Normalized strength
Natural 100% 53.01
53.1 1.00 53.88 52.49
RA-C
20% 48.5
50.0 0.94 51.9 49.6
50% 46.84
45.3 0.85 44.09 44.88
75% 45.24
44.0 0.83 43.85 42.91
100% 41.53
41.6 0.78 39.55 43.75
RA-M
20% 49.73
48.0 0.90 46.81 47.4
50% 39.8
41.7 0.79 42.7 42.6
75% 41.7
39.5 0.74 38.8 37.94
100% 37.2
38.1 0.72 39.0 38.1
RA-B
20% 40.3
40.0 0.75 40.4 39.42
50% 38.61
37.0 0.70 39.12 33.3
75% 35.2
33.1 0.62 31.15 32.85
100% 32.56
31.5 0.59 29.70 32.23

Appendix C
C-6
Type % RA Compressive
strength MPa
Average Strength
Normalized strength
RA-C1
20% 53.60
53.2 1.00 54.00 52.10
50% 55.50
54.1 1.02 53.70 53.20
75% 56.80
55.8 1.05 56.20 54.30
100% 59.18
58.3 1.1 58.43 57.35

Appendix C
C-7
Table C-6 Results of concrete density at 28 days.
Type % RA Sample No.
Mass in air (kg)
Mass in
water (kg)
Density kg/m3
Average Density
Normalized Density
Natural 100% 1 2386 1385 2384
2378 100% 2 2370 1374 2380 3 2380 1376 2371
RA-C
20% 1 2350.4 1343 2333
2336 98% 2 2348.3 1348 2348 3 2332.3 1330 2327
50% 1 2346 1333 2316
2315 97% 2 2341 1330 2316 3 2338 1328 2315
75% 1 2337 1323 2305
2295 96% 2 2317.5 1307 2293 3 2318 1304 2286
100% 1 2312 1295 2273
2273 96% 2 2299 1285 2267 3 2314 1298 2278
RA-M
20% 1 2392 1378 2359
2348 99% 2 2378 1363 2343 3 2368 1357 2342
50% 1 2308 1295 2278
2275 96% 2 2317 1302 2283 3 2302 1285 2264
75% 1 2285 1269 2249
2242 94% 2 2279 1260 2237 3 2279 1262 2241
100% 1 2256 1237 2214
2205 93% 2 2224 1211 2195 3 2241 1225 2206
RA-B
20% 1 2320 1294 2261
2256 95% 2 2305 1283 2255 3 2318 1289 2253
50% 1 2284 1262 2235
2229 94% 2 2281 1255 2223 3 2282 1258 2229
75% 1 2214 1186 2154
2150 90% 2 2211 1182 2149 3 2208 1180 2148
100% 1 2150 1127 2102
2102 88% 2 2149 1125 2099 3 2151 1129 2105

Appendix C
C-8
Type % RA Sample No.
Mass in air (kg)
Mass in
water (kg)
Density kg/m3
Average Density
Normalized Density
RA-C1
20 1 2139 1112 2082
2065 0.87 2 2124 1095 2065 3 2108 1079 2048
50 1 2092 1063 2032
2015 0.85 2 2077 1046 2015 3 2061 1030 1998
75 1 2045 1013 1982
2156 0.91 2 2030 997 1965 3 2014 981 1949
100 1 1998 964 1932
1916 0.81 2 1983 948 1916 3 1967 931 1899
1. BS EN 933-11:2009, Tests for geometrical properties of aggregates -Part 11: Classification test for the constituents of coarse recycled aggregate. 2010, British Standard Institution: London.

Appendix D
D-1
Appendix D:
Experimental Results -Chapter 3
D.1 Free Shrinkage
Table D-1 Shrinkage strains (in microstrains) measured on top surface over 50 mm gauge length.
Drying Time ( days)
50 mm / Top
1 2 3 4 5 6 7 8 Average
1 53 38 31 58 61 73 50 41 51 2 84 57 44 79 72 79 60 65 68 3 102 90 59 86 94 106 86 90 89 4 143 123 101 130 126 139 115 124 125 5 166 141 125 144 142 152 137 138 143 6 176 150 140 151 149 158 147 145 152 7 192 159 148 158 159 172 151 152 161
10 222 180 172 180 186 183 180 179 185 14 168 230 216 216 251 218 245 246 224 21 372 311 288 317 318 302 310 311 316 28 420 352 346 360 337 340 353 352 357 34 462 380 396 432 384 401 396 386 405 41 492 408 414 450 410 406 406 422 426 47 480 468 456 456 462 475 456 468 465 55 510 498 504 480 492 503 480 492 495 75 528 522 516 504 516 541 510 520 520

Appendix D
D-2
Table D-2 Shrinkage strains (in microstrains) measured on side surface over 50 mm gauge length.
Drying Time ( days)
50 mm / Side 1 2 3 4 5 6 7 8 Average
1 40 30 24 48 53 66 42 36 42 2 54 46 34 66 62 72 50 56 55 3 76 72 46 72 82 96 72 78 74 4 106 98 78 108 109 126 96 108 104 5 120 113 96 120 124 138 114 120 118 6 126 120 108 126 130 144 122 126 125 7 132 127 114 132 138 156 126 132 132
10 154 144 132 150 169 174 150 156 154 14 210 192 180 180 228 208 204 214 202 21 270 259 240 264 289 288 258 270 267 28 300 293 288 300 306 324 294 306 301 34 336 327 330 360 366 382 330 336 346 41 362 348 354 366 384 386 348 372 365 47 408 395 384 414 432 432 400 420 411 55 438 418 422 444 456 468 420 444 439 75 468 456 456 474 480 492 462 468 470
Table D-3 Shrinkage strains (in microstrains) measured on top surface over 100 mm gauge length.
Drying Time ( days)
100 mm / Top
1 2 3 4 Average
1 65 60 65 60 63 2 85 75 85 85 83 3 110 100 110 110 108 4 130 120 135 120 126 5 150 140 145 145 145 6 160 155 155 155 156 7 180 165 170 165 170
10 205 190 195 190 195 14 270 255 250 250 256 21 340 325 330 335 333 28 365 350 355 355 356 34 400 380 395 395 393 41 430 405 430 430 424 47 475 450 470 460 464 55 490 470 480 480 480 75 510 500 510 500 505

Appendix D
D-3
Table D-4 Shrinkage strains (in microstrains) measured on side surface over 100 mm gauge length.
Drying Time ( days)
100 mm / Side 1 2 3 4 Average
1 55 50 52 45 51 2 70 65 68 60 66 3 90 85 90 80 86 4 105 105 110 100 105 5 125 122 125 115 122 6 135 135 135 130 134 7 150 145 148 140 146
10 170 170 170 160 168 14 225 225 225 220 224 21 295 290 295 290 293 28 320 315 315 310 315 34 355 345 350 345 349 41 385 380 385 380 383 47 405 405 405 410 406 55 445 440 450 445 445 75 480 475 485 480 480
Table D-5 Shrinkage strains (in microstrains) measured on top surface over 300 mm gauge length.
Drying Time ( days)
300 mm / Top
1 2 Average
1 70 70 70 2 90 85 88 3 110 120 115 4 135 125 130 5 150 145 148 6 165 155 160 7 185 180 183
10 215 210 213 14 265 275 270 21 355 345 350 28 385 375 380 34 410 400 405 41 435 450 443 47 485 475 480 55 490 500 495 75 530 520 525

Appendix D
D-4
Table D-6 Shrinkage strains (in microstrains) measured on side surface over 300 mm gauge length.
Drying Time ( days)
300 mm / Side
1 2 Average
1 55 55 55 2 70 80 75 3 95 95 95 4 115 109 112 5 135 140 138 6 150 160 155 7 160 165 163
10 190 185 188 14 235 240 238 21 308 309 309 28 330 340 335 34 365 360 363 41 400 405 403 47 420 435 428 55 460 465 463 75 490 500 495

Appendix D
D-5
D.2 Restrained Shrinkage
Table D-7 Shrinkage strains (in microstrains) measured on side surface over 50 mm gauge length.
Drying Time
50 mm /Side 1 2 3 4 5 6 7 8 9 10 11 12 13 14 Ave.
1 0 0 12 12 0 0 0 0 36 24 12 24 0 0 9 2 12 24 18 24 12 12 24 0 42 30 24 36 0 0 18 3 24 36 24 36 24 24 36 12 42 42 24 36 12 12 27 4 30 48 36 48 42 42 54 36 48 54 36 48 24 24 41 5 42 54 48 72 60 66 60 60 60 66 48 60 48 42 56 6 54 72 66 90 78 78 72 72 72 84 60 78 60 60 71 7 54 72 66 78 78 66 66 60 60 72 54 60 60 60 65
10 78 102 96 120 102 114 96 96 108 108 90 102 84 96 99 14 102 120 114 144 126 132 120 120 132 132 108 120 108 120 121 21 174 192 186 222 204 192 180 192 204 204 180 180 168 192 191 28 228 228 228 264 240 240 246 264 264 240 234 240 240 240 243 34 288 264 270 306 288 288 294 318 312 276 288 300 300 288 291 41 312 282 288 312 312 312 318 348 336 288 312 312 312 312 311 47 360 330 336 360 372 372 378 396 384 336 372 372 372 360 364 55 396 360 366 384 408 408 396 420 420 372 396 396 408 396 395 75 432 384 414 444 438 432 420 444 450 408 438 432 432 426 428
Table D-8 Shrinkage strains (in microstrains) measured on side surface over 100 mm gauge length.
Drying Time
100 mm / Side 1 2 3 4 Average
1 23 0 0 0 6 2 28 22 11 11 18 3 39 34 22 22 29 4 50 45 39 39 43 5 62 50 56 62 57 6 78 67 73 73 73 7 62 62 73 73 67
10 101 95 95 106 99 14 123 112 118 123 119 21 190 179 190 179 185 28 224 213 224 224 221 34 258 246 269 269 260 41 269 263 291 291 279 47 314 308 347 347 329 55 358 347 392 392 372 75 426 414 426 426 423

Appendix D
D-6
Table D-9 Shrinkage strains (in microstrains) measured on side surface over 300 mm gauge length.
Drying Time
300 mm / Side 1 2 Average
1 20 20 20 2 34 36 35 3 46 46 46 4 56 57 57 5 73 76 75 6 88 92 90 7 84 87 86
10 113 118 116 14 150 160 155 21 220 230 225 28 260 270 265 34 280 290 285 41 315 320 318 47 345 355 350 55 385 395 390 75 430 425 428
D.3 Determination of Efmax
The flexural modulus of elasticity Eflex was obtained from the results of bending test. It is
calculated from the load-deflection curve (obtained from the bending test) using equation 3-
1 (chapter 3). This equation is derived from the elastic theory. In the equation, the second
term (of the right side) accounts for shear effects during flexural test. The flexural modulus
of elasticity of the concrete prism Efmax is determined from a graph representing the relation
between the bending load (P) and the flexural modulus of elasticity Eflex, see Figure D.1.
Efmax is the maximum flexural elastic modulus determined from the curve in the range of
30% to 60% of the ultimate bending load (Pult) as can be seen in Figure D.1.

Appendix D
D-7
Figure D.1 Determination of Efmax (water cured specimen).
D. 4 Determination of Compressive Strength for Prisms
The compressive strength was obtained for the prisms exposed to water cured, free and
restrained shrinkage. The test was performed following the recommendations of BS 1881-
119 (2011). This standards adopts a method called equivalent cube method to determine the
compressive strength of the hardened concrete portions of prisms broken in flexural
(bending test). According to this standard the samples shall be broken portions of prisms
which have been tested in flexural. These portions must have a minimum length of not less
than the nominal width of the beam plus 50mm. A special steel jig must be used to perform
the test. The details of this jig is shown in Figure D.2. Figure D.3 shows portion of broken
prisms prepared for compression test.
0
10
20
30
40
50
60
0 2 4 6 8 10 12 14 16 18 20 22
E fle
x(G
Pa)
Bending Load (kN)
30% - 60% of Pult
Efmax
Pult

Appendix D
D-8
Figure D.2 Details of the jig used for compression test of prisms tested in bending. (BS 1881-
119,2011).
Figure D.3 Portion of broken prisms prepared for compression test.

Appendix E
E-1
Appendix E:
Experimental Results-Chapter 4
E.1 Free Shrinkage
E.1.1 Shrinkage strains measured on Top (T), Sides (S) and Bottom (B)
surfaces over 500 mm length
Mix NA30
Figure E. 1 Shrinkage strains of mix NA30 /sample 1
0
100
200
300
400
500
0 5 10 15 20 25 30
Free
Shr
inka
ge S
trai
n (µɛ)
Drying time (Days)
NA30 - 500 mm / Sample 1 T
S
B

Appendix E
E-2
Figure E. 2 Shrinkage strains of mix NA30 /sample 2
Figure E. 3 Shrinkage strains of mix NA30 /sample 3
0
100
200
300
400
500
0 5 10 15 20 25 30
Free
Shr
inka
ge S
trai
n (µɛ)
Drying time (days)
NA30 - 500 mm / Sample 2
T
S
B
0
100
200
300
400
500
0 5 10 15 20 25 30
Free
Shr
inka
ge S
trai
n (µɛ)
Drying time (days)
NA30 - 500 mm / Sample 3 T
S
B

Appendix E
E-3
Mix NA40
Figure E. 4 Shrinkage strains of mix NA40 /sample 1
Figure E. 5 Shrinkage strains of mix NA40 /sample 2
0
100
200
300
400
500
0 5 10 15 20 25 30
Free
Shr
inka
ge S
trai
n (µɛ)
Drying time (days)
NA40 - 500 mm / Sample 1 T
S
B
0
100
200
300
400
500
0 5 10 15 20 25 30
Free
Shr
inka
ge S
trai
n (µɛ)
Drying time (days)
NA40 - 500 mm / Sample 2 T
S
B

Appendix E
E-4
Figure E. 6 Shrinkage strains of mix NA40 /sample 1
Mix NA50
Figure E. 7 Shrinkage strains of mix NA50 /sample 1
0
100
200
300
400
500
0 5 10 15 20 25 30
Free
Shr
inka
ge S
trai
n (µ
ɛ)
Drying time (days)
T
S
B
NA40 - 500 mm / Sample 3
0
100
200
300
400
500
0 5 10 15 20 25 30
Free
Shr
inka
ge S
trai
n (µɛ)
Drying time (days)
NA50 - 500 mm / Sample1 T
S
B

Appendix E
E-5
Figure E. 8 Shrinkage strains of mix NA50 /sample 2
Figure E. 9 Shrinkage strains of mix NA50 /sample 3
0
100
200
300
400
500
0 5 10 15 20 25 30
Free
Shr
inka
ge S
trai
n (µɛ)
Drying time (days)
NA50 - 500 mm / Sample 2 T
S
B
0
100
200
300
400
500
0 5 10 15 20 25 30
Free
Shr
inka
ge S
trai
n (µɛ)
Drying time (days)
NA50 - 500 mm / Sample 3 T
S
B

Appendix E
E-6
E.1.2 Shrinkage strains measured on Top (T), Sides (S) and Bottom (B)
surfaces over 300 mm length
Mix NA30
Figure E. 10 Shrinkage strains of mix NA30 /sample 1
Figure E. 11 Shrinkage strains of mix NA30 /sample 2
0
100
200
300
400
500
0 5 10 15 20 25 30
Free
Shr
inka
ge S
trai
n (µɛ)
Drying time (days)
NA30 - 300 mm / Sample 1
T
S
B
0
100
200
300
400
500
0 5 10 15 20 25 30
Free
Shr
inka
ge S
trai
n (µɛ)
Drying time (days)
NA30 - 300 mm / Sample 2
T
S
B

Appendix E
E-7
Figure E. 12 Shrinkage strains of mix NA30 /sample 3
Mix NA40
Figure E. 13 Shrinkage strains of mix NA40 /sample 1
0
100
200
300
400
500
0 5 10 15 20 25 30
Free
Shr
inka
ge S
trai
n (µɛ)
Drying time (days)
NA30 - 300 mm / Sample 3
T
S
B
0
100
200
300
400
500
0 5 10 15 20 25 30
Free
Shr
inka
ge S
trai
n (µɛ)
Drying time (days)
NA40 - 300 mm / Sample 1 T
S
B

Appendix E
E-8
Figure E. 14 Shrinkage strains of mix NA40 /sample 2
Figure E. 15 Shrinkage strains of mix NA40 /sample 3
0
100
200
300
400
500
0 5 10 15 20 25 30
Free
Shr
inka
ge S
trai
n (µɛ)
Drying time (days)
T
S
B
NA40 - 300 mm / Sample 2
0
100
200
300
400
500
0 5 10 15 20 25 30
Free
Shr
inka
ge S
trai
n (µɛ)
Drying time (days)
T
S
B
NA40 - 300 mm / Sample 3

Appendix E
E-9
Mix NA50
Figure E. 16 Shrinkage strains of mix NA50 /sample 1
Figure E. 17 Shrinkage strains of mix NA50 /sample 2
0
100
200
300
400
500
0 5 10 15 20 25 30
Free
Shr
inka
ge S
trai
n (µɛ)
Drying time (days)
NA50 - 300 mm / Sample1 T
S
B
0
100
200
300
400
500
0 5 10 15 20 25 30
Free
Shr
inka
ge S
trai
n (µɛ)
Drying time (days)
NA50 - 300 mm / Sample 2 T
S
B

Appendix E
E-10
Figure E. 18 Shrinkage strains of mix NA50 /sample 3
0
100
200
300
400
500
0 5 10 15 20 25 30
Free
Shr
inka
ge S
trai
n (µɛ)
Drying time(days)
NA50 - 300 mm / Sample 3 T
S
B

Appendix F
F-1
Appendix F:
Experimental Results-Chapter 5
F.1 Load -deflection curves
F.1.1 Mix NA30
Figure F.1 Load-deflection curve of water cured specimens (mix NA30).
0
5
10
15
20
25
0.00 0.02 0.04 0.06 0.08 0.10
Bend
ing
load
(kN
)
Mid-span deflection (mm)
NA30 - WC
Sample 1Sample 2Sample 3Average
0
5
10
15
20
25
0.00 0.02 0.04 0.06 0.08 0.10
Bend
ing
load
(kN
)
Mid-span deflection (mm)
Sample 1Sample 2Sample 3Average Sample 2- nd attempt
NA30 - Free

Appendix F
F-2
Figure F.2 Load-deflection curve of free specimens (mix NA30).
F.1.2 Mix NA40
Figure F.3 Load-deflection curve of water cured specimens (mix NA40).
Figure F.4 Load-deflection curve of free specimens (mix NA40).
0
4
8
12
16
20
0.00 0.02 0.04 0.06 0.08 0.10
Bend
ing
load
(kN
)
Mid-span deflection (mm)
NA40 - WC
Sample 1Sample 2Sample 3Average
0
4
8
12
16
20
0.00 0.02 0.04 0.06 0.08 0.10
Bend
ing
load
(kN
)
Mid-span deflection (mm)
Sample 1Sample 2Sample 3Average Sample 2- nd attempt
NA40 - Free
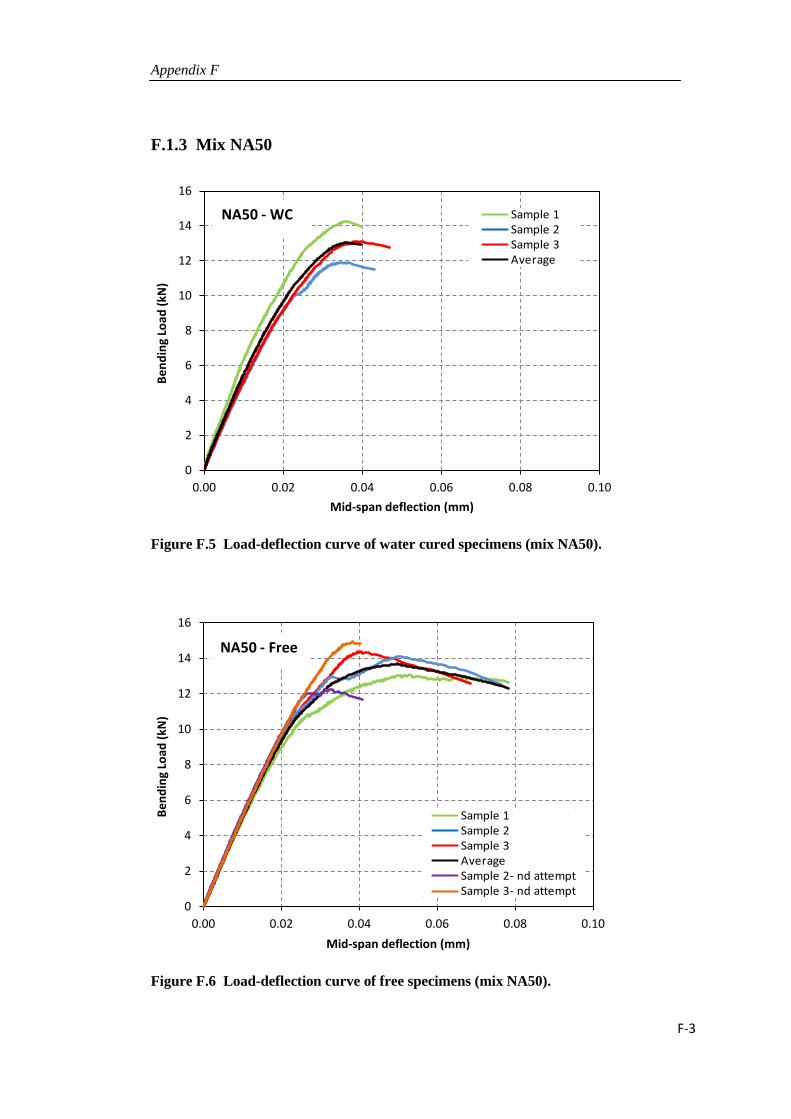
Appendix F
F-3
F.1.3 Mix NA50
Figure F.5 Load-deflection curve of water cured specimens (mix NA50).
Figure F.6 Load-deflection curve of free specimens (mix NA50).
0
2
4
6
8
10
12
14
16
0.00 0.02 0.04 0.06 0.08 0.10
Bend
ing
Load
(kN
)
Mid-span deflection (mm)
NA50 - WC
Sample 1Sample 2Sample 3Average
0
2
4
6
8
10
12
14
16
0.00 0.02 0.04 0.06 0.08 0.10
Bend
ing
Load
(kN
)
Mid-span deflection (mm)
NA50 - Free
Sample 1Sample 2Sample 3Average Sample 2- nd attemptSample 3- nd attempt

Appendix F
F-4
F.2 Flexural elastic modulus - bending load curves
F.2.1 Mix NA30
Figure F.7 Flexural elastic modulus - bending load curve of water cured specimens
(mix NA30).
Figure F.8 Flexural elastic modulus - bending load curve of free specimens (mix
NA30).
0
10
20
30
40
50
60
70
0 2 4 6 8 10 12 14 16 18 20 22 24
E fle
x (G
Pa)
Bending Load (kN)
NA30 - WC
Sample 1Sample 2Sample 3Average
0
10
20
30
40
50
60
70
0 2 4 6 8 10 12 14 16 18 20 22 24
E fle
x (G
pa)
Bending Load (kN)
NA30 - Free
Sample 1Sample 2Sample 3Average Sample 2- nd attempt

Appendix F
F-5
F.2.2 Mix NA40
Figure F.9 Flexural elastic modulus - bending load curve of water cured specimens
(mix NA40).
Figure F.10 Flexural elastic modulus - bending load curve of free specimens (mix
NA40).
0
10
20
30
40
50
60
0 2 4 6 8 10 12 14 16 18 20
E fle
x (G
Pa)
Bending Load (kN)
NA40 - WC
Sample 1Sample 2Sample 3Average
0
10
20
30
40
50
60
0 2 4 6 8 10 12 14 16 18 20
E fle
x (G
pa)
Bending Load (kN)
NA40 - Free
Sample 1Sample 2Sample 3Average Sample 2- nd attempt

Appendix F
F-6
F.2.3 Mix NA50
Figure F.11 Flexural elastic modulus - bending load curve of water cured specimens
(mix NA50).
Figure F.12 Flexural elastic modulus - bending load curve of free specimens (mix
NA50).
0
10
20
30
40
50
60
0 2 4 6 8 10 12 14 16
E fle
x
(GPa
)
Bending Load (kN)
NA50 - WC
Sample 1Sample 2Sample 3Average
0
10
20
30
40
50
60
0 2 4 6 8 10 12 14 16
E fle
x (
GPa
)
Bending Load (kN)
Sample 1Sample 2Sample 3Average Sample 2- nd attemptSample 3- nd attempt
NA50 - Free

Appendix F
F-7
F.3 Results of compressive strength
F.3.1 Mix NA30
Table F.1 Compressive strength of cubes and portions of prisms under WC, F and R
conditions- mix NA30
Type and time
Compressive strength
Mpa Average Normalized
strength SD
Cubes at 1 day
46.41 46.6 66 0.59 46.05
47.2
Cubes at 3 days
58.45 58.0 83 0.4 57.88
57.69
Cubes at 7 days
63.65 63.0 90 0.6 62.46
62.88
Cubes at 28days
68.72 70.1 100 1.4 71.45
70.22
Free at 28 days
59.51 60.3 86 1.3 61.81
59.62
Restrained 58.95
63.2 90 3.7 64.98 65.68
WC specimens
68.43 66.5 95 2.0 64.45
66.55
SD: standard deviation.

Appendix F
F-8
F.3.2 Mix NA40
Table F.2 Compressive strength of cubes and portions of prisms under WC, F and R conditions-
mix NA40.
Type and time
Compressive strength
MPa Average Normalized
strength SD
Cubes at 1 day
32.04 32.7 55 0.6 32.98
33.09
Cubes at 3 days
46.8 46.5 78 0.7 45.65
46.99
Cubes at 7 days
49.48 49.3 83 1.2 50.38
48.01
Cubes at 28days
59.43 59.4 100 0.3 59.05
59.71
Free at 28 days
50.42 51.5 87 1.0 51.5
52.5
Restrained 48.65
51.2 86 2.6 51.1 53.76
WC specimens
59.77 58.8 99 1.3 57.4
59.31
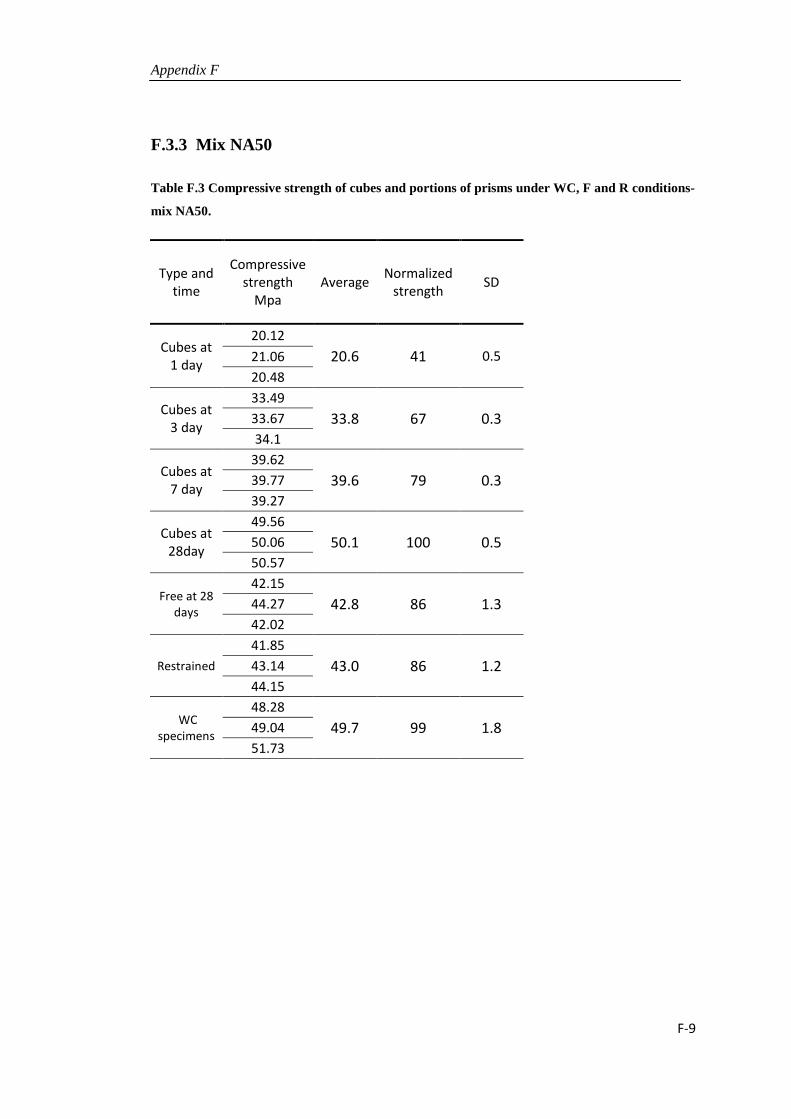
Appendix F
F-9
F.3.3 Mix NA50
Table F.3 Compressive strength of cubes and portions of prisms under WC, F and R conditions-
mix NA50.
Type and time
Compressive strength
Mpa Average Normalized
strength SD
Cubes at 1 day
20.12 20.6 41 0.5 21.06
20.48
Cubes at 3 day
33.49 33.8 67 0.3 33.67
34.1
Cubes at 7 day
39.62 39.6 79 0.3 39.77
39.27
Cubes at 28day
49.56 50.1 100 0.5 50.06
50.57
Free at 28 days
42.15 42.8 86 1.3 44.27
42.02
Restrained 41.85
43.0 86 1.2 43.14 44.15
WC specimens
48.28 49.7 99 1.8 49.04
51.73

Appendix F
F-10
F.4 Photographs
Figure F. 13 Types and number of moulds (used in this study) for each mix
Figure F. 14 Restraining frame just after concrete casting (mix NA50).

Appendix F
F-11
Figure F. 15 Monitoring concrete temperature using thermocouples (mix NA30).

Appendix F
F-12
Figure F. 16 Restrained specimens at the end of exposure time (Mix NA30).

Appendix F
F-13
Figure F. 17 Restrained specimens at the end of exposure time (Mix NA40).

Appendix F
F-14
Figure F. 18 Restrained specimens at the end of exposure time (Mix NA50).

Appendix F
F-15
Figure F. 19 Measure of free shrinkage using Demec gauages.
Figure F. 20 Demounting of restrained specimens (just before bending test).

Appendix F
F-16
Figure F. 21 Concrete prism during bending test using universal hydraulic machine
and closed loop system (labview technique) .

Appendix G
G-1
Appendix G:
Experimental Results-Chapter 6
G.1 Free Shrinkage
G.1.1 Shrinkage strains measured on top (T), sides (S) and bottom (B)
surfaces over 300 mm gauge length
G.1.1.1 Mixes with Natural Aggregate
Figure G. 1 Shrinkage strains of mix NA40R2 /sample 1
0
50
100
150
200
250
300
350
400
450
500
0 5 10 15 20 25 30
Free
Shr
inka
ge S
trai
n (µ
ɛ)
Drying time (days)
NA40R2- 300 mm / Sample 1 T
S
B

Appendix G
G-2
Figure G. 2 Shrinkage strains of mix NA40R2 /sample 2
Figure G. 3 Shrinkage strains of mix NA40R2 /sample 3
0
50
100
150
200
250
300
350
400
450
500
0 5 10 15 20 25 30
Free
Shr
inka
ge S
trai
n (µ
ɛ)
Drying time (days)
NA40R2- 300 mm / Sample 2 T
S
B
0
50
100
150
200
250
300
350
400
450
500
0 5 10 15 20 25 30
Free
Shr
inka
ge S
trai
n (µɛ)
Drying time (days)
NA40R2- 300 mm / Sample 3 T
S
B

Appendix G
G-3
Figure G. 4 Shrinkage strains of mix NA40R+I /sample 1
Figure G. 5 Shrinkage strains of mix NA40R+I /sample 2
0
50
100
150
200
250
300
350
400
450
500
0 5 10 15 20 25 30
Free
Shr
inka
ge S
trai
n (µɛ)
Drying time (days)
NA40R+I - 300 mm / Sample 1 T
S
B
0
50
100
150
200
250
300
350
400
450
500
0 5 10 15 20 25 30
Free
Shr
inka
ge S
trai
n (µ
ɛ)
Drying time (days)
NA40R+I - 300 mm / Sample 2
T S
B

Appendix G
G-4
Figure G. 6 Shrinkage strains of mix NA40R+I /sample 3
Figure G. 7 Shrinkage strains of mix NA40I2 /sample 1
0
50
100
150
200
250
300
350
400
450
500
0 5 10 15 20 25 30
Free
Shr
inka
ge S
trai
n (µ
ɛ)
Drying time (days)
NA40R+I - 300 mm / Sample 3
0
50
100
150
200
250
300
350
400
450
500
0 5 10 15 20 25 30
Free
Shr
inka
ge S
trai
n (µɛ)
Drying time (days)
NA40I2 - 300 mm / Sample 1
S
B

Appendix G
G-5
Figure G. 8 Shrinkage strains of mix NA40I2 /sample 2
Figure G. 9 Shrinkage strains of mix NA40I2 /sample 3
0
50
100
150
200
250
300
350
400
450
500
0 5 10 15 20 25 30
Free
Shr
inka
ge S
trai
n (µɛ)
Drying time (days)
NA40 I2- 300 mm / Sample 2
S
B
0
50
100
150
200
250
300
350
400
450
500
0 5 10 15 20 25 30
Free
Shr
inka
ge S
trai
n (µɛ)
Drying time (days)
NA40 I2- 300 mm / Sample 2
S
B

Appendix G
G-6
G.1.1.2 Mixes with Recycled Aggregate
Figure G. 10 Shrinkage strains of mix RAm40 /sample 1
Figure G. 11 Shrinkage strains of mix RAm40 /sample 2
0
50
100
150
200
250
300
350
400
450
500
0 5 10 15 20 25 30
Free
Shr
inka
ge S
trai
n (µɛ)
Drying time (days)
RAm40 - 300 mm / Sample 1 T
S
B
0
50
100
150
200
250
300
350
400
450
500
0 5 10 15 20 25 30
Free
Shr
inka
ge S
trai
n (µ
ɛ)
Drying time (days)
RAm40 - 300 mm / Sample 2 T S
B
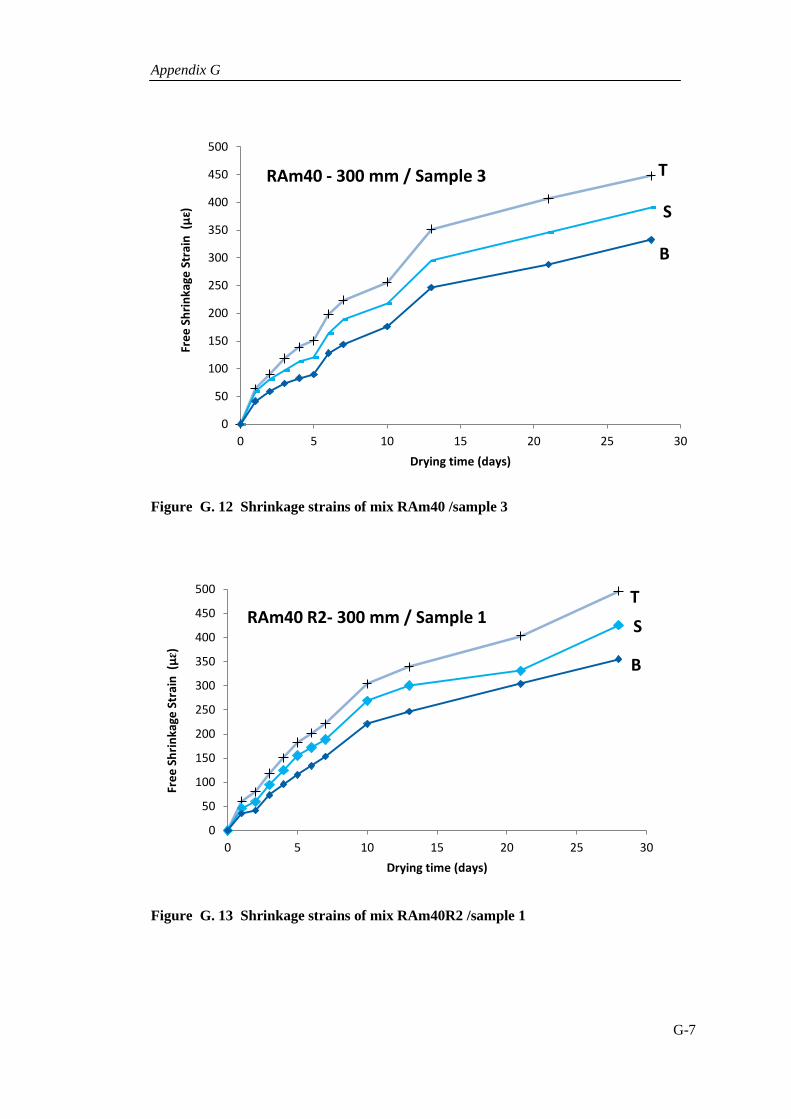
Appendix G
G-7
Figure G. 12 Shrinkage strains of mix RAm40 /sample 3
Figure G. 13 Shrinkage strains of mix RAm40R2 /sample 1
0
50
100
150
200
250
300
350
400
450
500
0 5 10 15 20 25 30
Free
Shr
inka
ge S
trai
n (µ
ɛ)
Drying time (days)
RAm40 - 300 mm / Sample 3 T
S
B
0
50
100
150
200
250
300
350
400
450
500
0 5 10 15 20 25 30
Free
Shr
inka
ge S
trai
n (µɛ)
Drying time (days)
RAm40 R2- 300 mm / Sample 1 T S
B

Appendix G
G-8
Figure G. 14 Shrinkage strains of mix RAm40R2 /sample 2
Figure G. 15 Shrinkage strains of mix RAm40R2 /sample 3
0
50
100
150
200
250
300
350
400
450
500
0 5 10 15 20 25 30
Free
Shr
inka
ge S
trai
n (µɛ)
Drying time (days)
RAm40R2- 300 mm / Sample 2 T
S
B
0
50
100
150
200
250
300
350
400
450
500
0 5 10 15 20 25 30
Free
Shr
inka
ge S
trai
n (µɛ)
Drying time (days)
RAm40R2- 300 mm / Sample 3 T
S
B

Appendix G
G-9
G.2 Restrained Shrinkage
In this section the shrinkage strains measured on the top and sides surfaces of the restrained
specimens :top (T), middle (M) and bottom (B) are presented.
G.2.1 Strains- Mixes with Natural Aggregate
Figure G. 16 Apparent RF of mix NA40R2 /Top specimen
0
100
200
300
400
0 5 10 15 20 25 30
Shrin
kage
Str
ains
(µε
)
Drying time (days)
Top Side1, 1 Side1, 2 Side2,1 Side2,2
NA40R2- T

Appendix G
G-10
Figure G. 17 Apparent RF of mix NA40R2 /Middle specimen
Figure G. 18 Apparent RF of mix NA40R2 /Bottom specimen
0
100
200
300
400
0 5 10 15 20 25 30
Shrin
kage
Str
ains
(µε
)
Drying time (days)
Top Side1, 1 Side1, 2 Side2,1 Side2,2
NA40R2- M
0
100
200
300
400
0 5 10 15 20 25 30
Shrin
kage
Str
ains
(µε
)
Drying time (days)
Top
Side1, 1
Side1, 2
Side2,1
Side2,2
NA40R2- B

Appendix G
G-11
Figure G. 19 Shrinkage strains of mix NA40R+I /Top specimen
Figure G. 20 Apparent RF of mix NA40R+I /Middle specimen
0
100
200
300
400
0 5 10 15 20 25 30
Shrin
kage
Str
ains
(µε
)
Drying time (days)
Top
Side1, 1
Side1, 2
Side2,1
Side2,2
NA40R+I- T
0
100
200
300
400
0 5 10 15 20 25 30
Shrin
kage
Str
ains
(µε
)
Drying time (days)
Top
Side1, 1
Side1, 2
Side2,1
Side2,2
NA40R+I- M

Appendix G
G-12
Figure G. 21 Apparent RF of mix NA40R+I /Bottom specimen
Figure G. 22 Apparent RF of mix NA40I2 /Top specimen
0
100
200
300
400
0 5 10 15 20 25 30
Shrin
kage
Str
ains
(µε
)
Drying time (days)
Top Side1, 1 Side1, 2 Side2,1 Side2,2
NA40R+I- B
0
100
200
300
400
0 5 10 15 20 25 30
Shrin
kage
Str
ains
(µε
)
Drying time (days)
Top
Side1, 1
Side1, 2
Side2,1
Side2,2
NA40I2 - T

Appendix G
G-13
Figure G. 23 Apparent RF of mix NA40I2 /Middle specimen
Figure G. 24 Apparent RF of mix NA40I2 /Bottom specimen
0
100
200
300
400
0 5 10 15 20 25 30
Shrin
kage
Str
ains
(µε
)
Drying time (days)
Top
Side1, 1
Side1, 2
Side2,1
Side2,2
NA40I2 - M
0
100
200
300
400
0 5 10 15 20 25 30
Shrin
kage
Str
ains
(µε
)
Drying time (days)
Top
Side2,1
Side2,2
NA40I2 - B

Appendix G
G-14
G.2.2 Strains- Mixes with Recycled Aggregate
Figure G. 25 Apparent RF of mix RAm40 /Top specimen
Figure G. 26 Apparent RF of mix RAm40 /Middle specimen
0
100
200
300
400
0 5 10 15 20 25 30
Shrin
kage
Str
ains
(µε
)
Drying time (days)
Top Side1, 1 Side2,1 Side2,2 Side1, 2
RAm40 - T
-1000
-750
-500
-250
0
250
500
0 5 10 15 20 25 30
Stra
ins
(µε)
Drying time (days)
Top Side1, 1 Side2,1 Side2,2 Side1, 2
RAm40 - M
(a)
+ve shrinkage strains

Appendix G
G-15
Figure G. 27 Apparent RF of mix RAm40 /Bottom specimen
Figure G. 28 Apparent RF of mix RAm40R2 /Top specimen
-800
-600
-400
-200
0
200
400
0 5 10 15 20 25 30
Shrin
kage
Str
ains
(µε
)
Drying time (days)
Top Side1, 1 Side2,1 Side2,2 Side1, 2
RAm40 - B
+ve shrinkage strains
0
100
200
300
400
0 5 10 15 20 25 30
Shrin
kage
Str
ains
(µε
)
Drying time (days)
Top Side1, 1 Side2,1 Side2,2 Side1, 2
RAm40R2 - T

Appendix G
G-16
Figure G. 29 Shrinkage strains of mix RAm40R2 /Middle specimen
Figure G. 30 Apparent RF of mix RAm40R2 /Bottom specimen
-800
-600
-400
-200
0
200
400
0 5 10 15 20 25 30
Shrin
kage
Str
ains
(µε
)
Drying time (days)
Top Side1, 1 Side2,1 Side2,2 Side1, 2
RAm40R2 - M
+ve shrinkage strains
0
100
200
300
400
0 5 10 15 20 25 30
Shrin
kage
Str
ains
(µε
)
Drying time (days)
Top Side1, 1 Side2,1 Side2,2 Side1, 2
RAm40R2 - B

Appendix G
G-17
G.3 Apparent Restraint Factor (RF)
G.3.1 Apparent RF for Mixes with Natural Aggregate
Figure G. 31 Apparent RF of mix NA40R2 /Top specimen
Figure G. 32 Apparent RF of mix NA40R2 /Middle specimen
0
20
40
60
80
100
0 5 10 15 20 25 30
RF (%
)
Drying time (days)
Side1, 1
Side1, 2
Side2,1
Side2,2
Top
NA40R2-T
0
20
40
60
80
100
0 5 10 15 20 25 30
RF (%
)
Drying time (days)
Side1, 1 Side1, 2 Side2,1 Side2,2 Top
NA40R2-M

Appendix G
G-18
Figure G. 33 Shrinkage strains of mix NA40R2 /Bottom specimen
Figure G. 34 Apparent RF of mix NA40R+I /Top specimen
0
20
40
60
80
100
0 5 10 15 20 25 30
RF (%
)
Drying time (days)
Side1, 1 Side1, 2 Side2,1 Side2,2 Top
NA40R2-B
0
20
40
60
80
100
0 5 10 15 20 25 30
RF (%
)
Drying time (days)
Side1, 1
Side1, 2
Side2,1
Side2,2
Top
NA40R+I -T

Appendix G
G-19
Figure G. 35 Apparent RF of mix NA40R+I /Middle specimen
Figure G. 36 Apparent RF of mix NA40R+I /Bottom specimen
0
20
40
60
80
100
0 5 10 15 20 25 30
RF (%
)
Drying time (days)
Side1, 1
Side1, 2
Side2,1
Side2,2
Top
NA40R+I -M
0
20
40
60
80
100
0 5 10 15 20 25 30
RF (%
)
Drying time (days)
Side1, 1 Side1, 2
Side2,1 Side2,2
Top
NA40R+I -B

Appendix G
G-20
Figure G. 37 Apparent RF of mix NA40I2 /Top specimen
Figure G. 38 Apparent RF of mix NA40I2 /Middle specimen
0
20
40
60
80
100
0 5 10 15 20 25 30
RF (%
)
Drying time (days)
Side1, 1 Side1, 2 Side2,1 Side2,2
NA40I2 -T
0
20
40
60
80
100
0 5 10 15 20 25 30
RF (%
)
Drying time (days)
Side1, 1 Side1, 2 Side2,1 Side2,2
NA40I2 -M

Appendix G
G-21
Figure G. 39 Shrinkage strains of mix NA40I2 /Bottom specimen
G.3.2 Apparent RF for Mixes with Recycled Aggregate
Figure G. 40 Apparent RF of mix RAm40 /Top specimen
0
20
40
60
80
100
0 5 10 15 20 25 30
RF (%
)
Drying time (days)
Side2,1
Side2,2
Ave. Side
NA40I2 -B
0
20
40
60
80
100
0 5 10 15 20 25 30
RF (%
)
Drying time (days)
Top Side1, 1 Side1, 2 Side2,1 Side2,2
RAm40 -T

Appendix G
G-22
Figure G. 41 Apparent RF of mix RAm40 /Middle specimen
Figure G. 42 Apparent RF of mix RAm40 /Bottom specimen
0
50
100
150
200
250
300
350
400
0 5 10 15 20 25 30
RF (%
)
Drying time (days)
Top Side1, 1 Side1, 2 Side2,1 Side2,2
RAm40 -M
0
50
100
150
200
250
300
0 5 10 15 20 25 30
RF (%
)
Drying time (days)
Top Side1, 1 Side1, 2 Side2,1 Side2,2
RAm40 -B

Appendix G
G-23
Figure G. 43 Apparent RF of mix RAm40R2 /Top specimen
Figure G. 44 Apparent RF of mix RAm40R2 /Middle specimen
0
20
40
60
80
100
0 5 10 15 20 25 30
RF (%
)
Drying time (days)
Top Side1, 1 Side1, 2 Side2,1 Side2,2
RAm40R2 -T
0
50
100
150
200
250
300
0 5 10 15 20 25 30
RF (%
)
Drying time (days)
Top Side1, 1 Side1, 2 Side2,1 Side2,2
RAm40 R2-M

Appendix G
G-24
Figure G. 45 Apparent RF of mix RAm40R2 /Bottom specimen
G.4 Estimated Restraint Factor
In this section the Estimated (theoretical) RF of the restrained specimns Top (T), Middle
(M) and Bottom (B) are presented .
G.4.1 Estimated RF for Mixes with Natural Aggregate
Figure G. 46 Estimated RF of T, M and B specimens - NA40.
0
10
20
30
40
50
60
70
80
90
100
0 5 10 15 20 25 30
RF (%
)
Drying time (days)
Top Side1, 1 Side1, 2 Side2,1 Side2,2
RAm40R2 -B
0.0
0.2
0.4
0.6
0.8
1.0
0 5 10 15 20 25 30
Rest
rain
t Fac
tor
Drying time (days)
Estimated RF-T
Estimated RF-M
Estimated RF-B
Average- Estimated RF
NA40

Appendix G
G-25
Figure G. 47 Estimated RF of T, M and B specimens - NA40R2.
Figure G. 48 Estimated RF of T, M and B specimens - NA40R+I.
0.0
0.2
0.4
0.6
0.8
1.0
0 5 10 15 20 25 30
Rest
rain
t Fac
tor
Drying time (days)
Estimated RF-T
Estimated RF-M
Estimated RF-B
Average- Estimated RF
NA40R2
0.0
0.2
0.4
0.6
0.8
1.0
0 5 10 15 20 25 30
Rest
rain
t Fac
tor
Drying time (days)
Estimated RF-T
Estimated RF-M
Estimated RF-B
Average- Estimated RF
NA40R+I

Appendix G
G-26
Figure G. 49 Estimated RF of T, M and B specimens - NA40I2.
G.4.2 Estimated RF for Mixes with Recycled Aggregate
Figure G. 50 Estimated RF of T, M and B specimens - RAm40.
0.0
0.2
0.4
0.6
0.8
1.0
0 5 10 15 20 25 30
Rest
rain
t Fac
tor
Drying time (days)
Estimated RF-T
Estimated RF-M
Estimated RF-B
Average- Estimated RF
NA40I2
0.0
0.2
0.4
0.6
0.8
1.0
0 5 10 15 20 25 30
Rest
rain
t Fac
tor
Drying time (days)
Estimated RF-T
Estimated RF-M
Estimated RF-B
Average- Estimated RF
RAm40

Appendix G
G-27
Figure G. 51 Estimated RF of T, M and B specimens - RAm40R2.
G.5 Load -deflection curves
G.5.1 Mixes with Natural Aggregate
Figure G. 52 Load-deflection curve of water cured specimens (mix NA40).
0.0
0.2
0.4
0.6
0.8
1.0
0 5 10 15 20 25 30
Rest
rain
t Fac
tor
Drying time (days)
Estimated RF-T
Estimated RF-M
Estimated RF-B
Average- Estimated RF
RAm40R2
0
4
8
12
16
20
0.00 0.02 0.04 0.06 0.08 0.10
Bend
ing
load
(kN
)
Mid-span deflection (mm)
NA40 - WC
Sample 1Sample 2Sample 3Average

Appendix G
G-28
Figure G. 53 Load-deflection curve of free specimens (mix NA40).
Figure G. 54 Load-deflection curve of restrained specimens (mix NA40).
0
4
8
12
16
20
0.00 0.02 0.04 0.06 0.08 0.10
Bend
ing
load
(kN
)
Mid-span deflection (mm)
Sample 1Sample 2Sample 3Average Sample 2- nd attempt
NA40 - Free
0
4
8
12
16
20
0.00 0.02 0.04 0.06 0.08 0.10
Bend
ing
load
(kN
)
Mid-span deflection (mm)
NA40/ TopNA40/ MiddleNA40/ Bottom

Appendix G
G-29
Figure G. 55 Load-deflection curve of free specimens (mix NA40R2).
Figure G. 56 Load-deflection curve of restrained specimens (mix NA40R2).
0
5
10
15
20
25
0 0.5 1 1.5 2
Bend
ing
Load
(kN
)
Mid-span deflection (mm)
Sample 1Sample 2Sample 3Average
NA40R2 - Free
0
5
10
15
20
25
0 0.5 1 1.5 2
bend
ing
Load
(kN
)
Mid-span deflection (mm)
TopMiddleBottom
NA40R2 - R
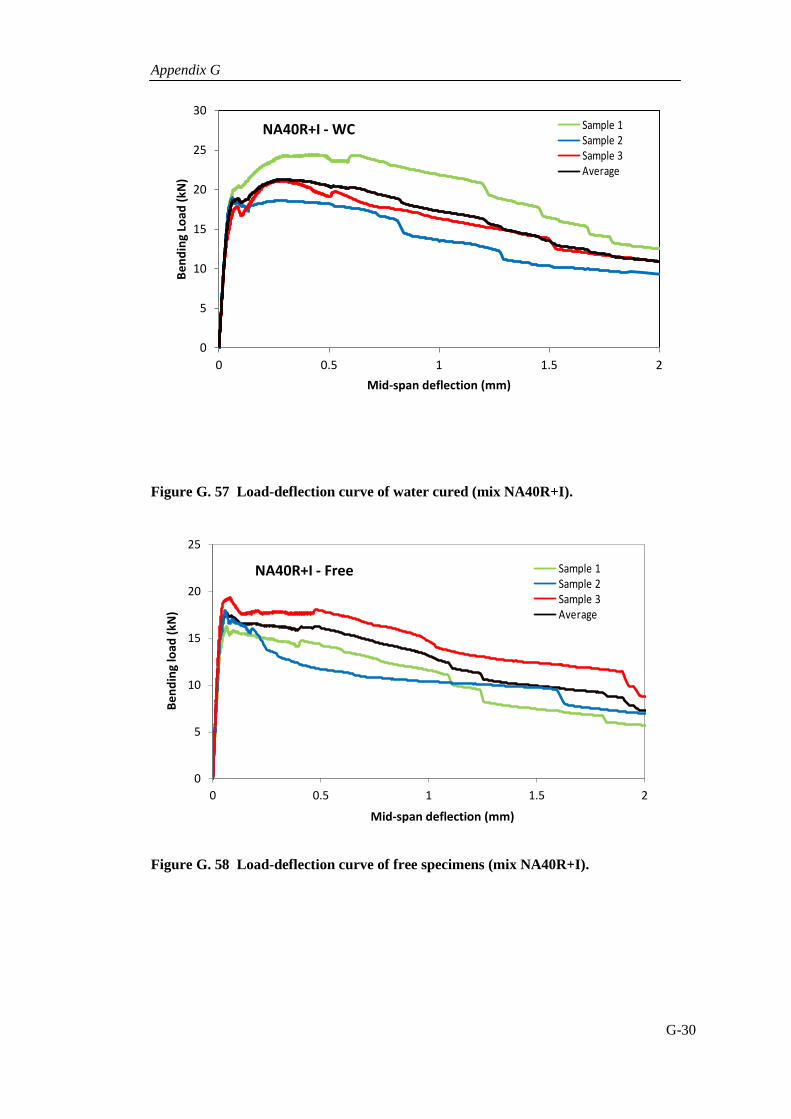
Appendix G
G-30
Figure G. 57 Load-deflection curve of water cured (mix NA40R+I).
Figure G. 58 Load-deflection curve of free specimens (mix NA40R+I).
0
5
10
15
20
25
30
0 0.5 1 1.5 2
Bend
ing
Load
(kN
)
Mid-span deflection (mm)
Sample 1Sample 2Sample 3Average
NA40R+I - WC
0
5
10
15
20
25
0 0.5 1 1.5 2
Bend
ing
load
(kN
)
Mid-span deflection (mm)
Sample 1Sample 2Sample 3Average
NA40R+I - Free

Appendix G
G-31
Figure G. 59 Load-deflection curve of restrained specimens (mix NA40R+I).
Figure G. 60 Load-deflection curve of water cured (mix NA40I2).
0
5
10
15
20
25
0 0.5 1 1.5 2
Bend
ing
load
(kN
)
Mid-span deflection (mm)
TopMiddleBottom
NA40R+I - R
0
5
10
15
20
25
0 0.5 1 1.5 2
Bend
ing
Load
(kN
)
Mid-span deflection (mm)
Sample 1Sample 2Sample 3Average
NA40I2 - WC

Appendix G
G-32
Figure G. 61 Load-deflection curve of free specimens (mix NA40I2).
Figure G. 62 Load-deflection curve of restrained specimens (mix NA40I2).
0
5
10
15
20
25
0 0.5 1 1.5 2
Bend
ing
load
(kN
)
Mid-span deflection (mm)
NA40I2 - Free
Sample 1Sample 2Sample 3Average
0
5
10
15
20
25
0 0.5 1 1.5 2
Bend
ing
load
(kN
)
Mid-span deflection (mm)
TopMiddleBottom
NA40I2 - R

Appendix G
G-33
G.5.2 Mixes with Recycled Aggregate
Figure G. 63 Load-deflection curve of water cured specimens (mix RAm40).
Figure G. 64 Load-deflection curve of free specimens (mix RAm40).
0
4
8
12
16
20
0 0.02 0.04 0.06 0.08 0.1
Bend
ing
Load
(kN
)
Mid-span deflection (mm)
Sample 1Sample 2Sample 3Average
RAm40 - WC
0
4
8
12
16
20
0 0.02 0.04 0.06 0.08 0.1
Bend
ing
Load
(kN
)
Mid-span deflection (mm)
Sample 1Sample 2Sample 3Average
RAm40 -Free

Appendix G
G-34
Figure G. 65 Load-deflection curve of restrained specimens (mix RAm40).
Figure G. 66 Load-deflection curve of water cured specimens (mix RAm40R2).
0
4
8
12
16
20
0.00 0.02 0.04 0.06 0.08 0.10
Bend
ing
Load
(kN
)
Mid-span deflection (mm)
TopMiddleBottom
RAm40 - R
0
4
8
12
16
20
0 0.5 1 1.5 2
Bend
ing
Load
(kN
)
Mid-span deflection (mm)
Sample 1Sample 2Sample 3Average
RAm40R2 - WC

Appendix G
G-35
Figure G. 67 Load-deflection curve of free specimens (mix RAm40R2).
Figure G. 68 Load-deflection curve of restrained specimens (mix RAm40R2).
0
4
8
12
16
20
24
0 0.5 1 1.5 2
Bend
ing
Load
(kN
)
Mid-span deflection (mm)
Sample 1Sample 2Sample 3Average Sample 2- nd attempt
RAm40R2 - Free
0
5
10
15
20
25
0.0 0.5 1.0 1.5 2.0
Bend
ing
load
(KN
)
Mid-span deflection (mm)
TopMiddleBottom
RAm40 R2- R

Appendix G
G-36
G.6 Flexural elastic modulus - bending load curves
G.6.1 Mixes with Natural Aggregate
Figure G.69 Flexural elastic modulus - bending load curve of water cured specimens
(mix NA40).
Figure G.70 Flexural elastic modulus - bending load curve of free specimens (mix
NA40).
0
10
20
30
40
50
60
0 2 4 6 8 10 12 14 16 18 20
E fle
x (G
pa)
Bending Load (kN)
NA40 - WC
Sample 1Sample 2Sample 3Average
0
10
20
30
40
50
60
0 2 4 6 8 10 12 14 16 18 20
E fle
x (G
pa)
Bending Load (kN)
NA40 - Free
Sample 1Sample 2Sample 3Average Sample 2- nd attempt

Appendix G
G-37
Figure G.71 Flexural elastic modulus - bending load curve of restrained specimens
(mix NA40).
Figure G.72 Flexural elastic modulus - bending load curve of water cured specimens
(mix NA40R2).
0
10
20
30
40
50
60
0 2 4 6 8 10 12 14 16 18 20 22
E fle
x (G
Pa)
Bending Load (KN)
Top
Middle
Bottom
NA40 - R
0
10
20
30
40
50
60
0 5 10 15 20 25
E fle
x (G
Pa)
Bending Load (kN)
Sample 1Sample 2Sample 3Average
NA40 R2- WC

Appendix G
G-38
Figure G.73 Flexural elastic modulus - bending load curve of free specimens (mix
NA40R2).
Figure G.74 Flexural elastic modulus - bending load curve of restrained specimens
(mix NA40R2).
0
10
20
30
40
50
60
0 5 10 15 20 25
E fle
x (G
Pa)
Bending Load (kN)
NA40R2 - Free
Sample 1Sample 2Sample 3Average
0
10
20
30
40
50
60
0 5 10 15 20 25
E fle
x (G
Pa)
Bending Load (kN)
NA40R2
TopMiddleBottom

Appendix G
G-39
Figure G.75 Flexural elastic modulus - bending load curve of water cured specimens
(mix NA40R+I).
Figure G.76 Flexural elastic modulus - bending load curve of free specimens (mix
NA40R+I).
0
10
20
30
40
50
60
0 2 4 6 8 10 12 14 16 18 20 22 24
E fle
x (G
Pa)
Bending Load (kN)
Sample 1Sample 2Sample 3Average
0
10
20
30
40
50
60
0 2 4 6 8 10 12 14 16 18 20 22 24
E fle
x (G
Pa)
Bending Load (KN)
Sample 1Sample 2Sample 3Average

Appendix G
G-40
Figure G.77 Flexural elastic modulus - bending load curve of restrained specimens
(mix NA40R+I).
Figure G.78 Flexural elastic modulus - bending load curve of water cured specimens
(mix NA40I2).
0
10
20
30
40
50
60
0 2 4 6 8 10 12 14 16 18 20 22 24
E fle
x (G
Pa)
Bending Load (kN)
Top
Middle
Bottom
0
10
20
30
40
50
60
0 2 4 6 8 10 12 14 16 18 20 22 24
E fle
x (G
Pa)
Bending Load (kN)
Sample 1Sample 2Sample 3Average

Appendix G
G-41
Figure G.79 Flexural elastic modulus - bending load curve of free specimens (mix
NA40I2).
Figure G.80 Flexural elastic modulus - bending load curve of restrained specimens
(mix NA40RI2).
0
10
20
30
40
50
60
0 2 4 6 8 10 12 14 16 18 20 22 24
E fle
x (G
Pa)
Bending Load (kN)
Sample 1Sample 2Sample 3Average
0
10
20
30
40
50
60
0 2 4 6 8 10 12 14 16 18 20 22 24
E fle
x (G
Pa)
Bending Load (kN)
TopMiddleBottom

Appendix G
G-42
G.6.2 Mixes with Recycled Aggregate
Figure G.81 Flexural elastic modulus - bending load curve of water cured specimens
(mix RAm40).
Figure G.82 Flexural elastic modulus - bending load curve of free specimens (mix
RAm40).
0
10
20
30
40
50
60
0 2 4 6 8 10 12 14 16 18 20 22 24
E fle
x (G
Pa)
Bending Load (KN)
Sample 1Sample 2Sample 3Average
0
10
20
30
40
50
60
0 2 4 6 8 10 12 14 16 18 20 22 24
E fle
x (G
Pa)
Bending Load (KN)
Sample 1Sample 2Sample 3Average Sample 2- nd attempt

Appendix G
G-43
Figure G.83 Flexural elastic modulus - bending load curve of restrained specimens
(mix RAm40).
Figure G.84 Flexural elastic modulus - bending load curve of water cured specimens
(mix RAm40R2).
0
10
20
30
40
50
60
0 2 4 6 8 10 12 14 16 18 20
E fle
x (G
Pa)
Bending Load (kN)
TopMiddleBottom
0
10
20
30
40
50
60
0 2 4 6 8 10 12 14 16 18 20
E fle
x (G
Pa)
Bending Load (kN)
Sample 1Sample 2Sample 3Average

Appendix G
G-44
Figure G.85 Flexural elastic modulus - bending load curve of free specimens (mix
RA40mR2).
Figure G.86 Flexural elastic modulus - bending load curve of restrained specimens
(mix RA40mR2).
0
10
20
30
40
50
60
0 2 4 6 8 10 12 14 16 18 20 22 24
E fle
x (G
Pa)
Bending Load (KN)
Sample 1Sample 2Sample 3Average Sample 2- nd attempt
0
10
20
30
40
50
60
0 2 4 6 8 10 12 14 16 18 20 22
E fle
x (G
Pa)
Bending Load (kN)
TopMiddleBottom

Appendix G
G-45
G.7 Results of compressive strength
G.7.1 Mixes with Natural Aggregate
Table G.1 Compressive strength of cubes and portions of prisms under WC, F and R
conditions- mix NA40.
Type and time
Compressive strength
MPa Average Normalized
strength SD*
Cubes at 1 day
32.04 32.7 55 0.6 32.98
33.09
Cubes at 3 days
46.8 46.5 78 0.7 45.65
46.99
Cubes at 7 days
49.48 49.3 83 1.2 50.38
48.01
Cubes at 28days
59.43 59.4 100 0.3 59.05
59.71
Free at 28 days
50.42 51.5 87 1.0 51.5
52.5
Restrained 48.65
51.2 86 2.6 51.1 53.76
WC specimens
59.77 58.8 99 1.3 57.4
59.31
*Standard Deviation

Appendix G
G-46
Table G.2 Compressive strength of cubes and portions of prisms under WC, F and R
conditions- mix NA40R2.
Type and time
Compressive strength
Mpa Average Normalized
strength SD*
Cubes at
1 day
36.1 36.1 55 1.8 37.9
34.3
Cubes at
3 day
50.1 50.8 77 1.1 52.1
50.3
Cubes at
7 day
58.33 57.4 87 0.9 57.51
56.44
Cubes at
28day
65.6 66.0 100 1.7 67.9
64.5
Free at 28
days
64.2
61.9 94 2.1 61.5
60.1
Restrained 61.4
60.7 92 2.6 57.8 62.9
WC
specimens
70.1 70.8 107 1.8 49.04
51.73
*Standard Deviation

Appendix G
G-47
Table G.3 Compressive strength of cubes and portions of prisms under WC, F and R
conditions- mix NA40I2.
Type and time
Compressive strength
MPa Average Normalized
strength SD*
Cubes at 1 day
34.31 33.8 56 0.6 33.9
33.15
Cubes at 3 day
45.76 45.3 75 1.7 46.67
43.36
Cubes at 7 day
50.38 51.3 85 1.8 50.08
53.35
Cubes at 28day
61.9 60.2 100 2.0 60.64
58
Free 60.5
57.8 96 3.0 58.3 54.6
Restrained 53.4
53.9 90 0.8 54.8 53.5
WC specimens
59.5 59.9 99 2.9 62.9
57.2
*Standard Deviation

Appendix G
G-48
Table G.4 Compressive strength of cubes and portions of prisms under WC, F and R
conditions- mix NA40R+I.
Type and time
Compressive strength
MPa Average Normalized
strength SD*
Cubes at 1 day
37.25 35.6 57 1.4 34.88
34.69
Cubes at 3 day
47.99 47.5 76 1.2 46.08
48.34
Cubes at 7 day
51.24 51.5 83 3.6 48.03
55.22
Cubes at 28day
64.42 62.2 100 1.9 61.52
60.77
Free 54.84
56.7 91 1.6 57.8 57.55
Restrained 49.97
53.9 87 3.6 56.89 54.81
WC specimens
60.55 61.2 98 0.6 61.2
61.73
*Standard Deviation

Appendix G
G-49
G.7.2 Mixes with Recycled Aggregate
Table G.5 Compressive strength of cubes and portions of prisms under WC, F and R
conditions- mix RAm40.
Type and time
Compressive strength
MPa Average Normalized
strength SD*
Cubes at 1 day
26.65 27.6 63 1.0 28.55
27.57
Cubes at 3 day
34.72 34.4 79 0.3 34.32
34.25
Cubes at 7 day
40.15 39.3 90 0.7 39.02
38.81
Cubes at 28day
43.82 43.5 100 1.4 42.02
44.72
Free 39.75
40.1 92 0.4 40.52 39.89
Restrained 39.91
39.8 91 0.6 39.11 40.36
WC specimens
46.58 45.2 104 1.3 45.07
43.95
*Standard Deviation

Appendix G
G-50
Table G.6 Compressive strength of cubes and portions of prisms under WC, F and R
conditions- mix RAm40.
Type and time
Compressive strength
MPa Average Normalized
strength SD*
Cubes at 1 day
27.71 28.1 52 1.1 27.32
29.35
Cubes at 3 day
36.25 36.5 67 0.7 35.92
37.21
Cubes at 7 day
42.15 43.1 79 0.9 43.63
43.65
Cubes at 28day
56.65 54.4 100 2.0 53.82
52.74
Free 49.01
49.7 91 0.6 49.89 50.17
Restrained 48.96
49.0 90 0.7 48.29 49.63
WC specimens
53.83 55.0 101 1.2 56.18
55.05
*Standard Deviation
Copyright © 2022 FDOKUMEN