quantitative measurements of shrinkage and cracking during ...
266
QUANTITATIVE M EASUREMENTS OF S HRINKAGE AND C RACKING DURING F REEZE -D RYING OF A MORPHOUS C AKES Der Naturwissenschaftlichen Fakult¨ at der Friedrich-Alexander-Universit¨ at Erlangen-N ¨ urnberg zur Erlangung des Doktorgrades Dr. rer. nat vorgelegt von Sabine Ullrich aus Aschaffenburg
-
Upload
khangminh22 -
Category
Documents
-
view
1 -
download
0
Transcript of quantitative measurements of shrinkage and cracking during ...

QUANTITATIVE MEASUREMENTS OF SHRINKAGE ANDCRACKING DURING FREEZE-DRYING
OF AMORPHOUS CAKES
Der Naturwissenschaftlichen Fakultat
der Friedrich-Alexander-Universitat
Erlangen-Nurnberg
zur
Erlangung des Doktorgrades Dr. rer. nat
vorgelegt von
Sabine Ullrich
aus Aschaffenburg

Als Dissertation genehmigt
von der Naturwissenschaftlichen Fakultat
der Friedrich-Alexander-Universitat Erlangen-Nurnberg
Tag der mundlichen Prufung: 26.Juni 2014
Vorsitzender der Prufungsorgans: Prof. Dr. Johannes Barth
Gutachter/in: Prof. Dr. Geoffrey Lee
Prof. Dr. Hartwig Steckel

Fur meine Eltern und Sebastian.
Danke, dass ich immer auf euch zahlen kann.


ACKNOWLEDGEMENTS
The research work presented in this thesis has been performed between January 2010 and
March 2014 at the Division of Pharmaceutics, University of Erlangen-Nuremberg, Erlangen,
Germany.
First of all, Prof. Dr. Geoffrey Lee is gratefully acknowledged for giving me the opportunity to
work in the Division of Pharmaceutics, serving as my doctoral adviser, and for refereeing this
thesis. Many thanks for choosing the fascinating topic of this research, for the continuous
support throughout my work and for the tolerance to discuss and implement own ideas.
Prof. Dr. Steckel of the Department of Pharmaceutics and Biopharmaceutics at the Christian
Albrecht University of Kiel is gratefully acknowledged for co-refereeing this thesis.
Further I would like to thank Prof. Dr. Dr. Willi Kalender, Prof. Dr. Engelke, Dr. Svitlana
Gayetskyy, Dr. Oleg Museyko and Marek Karolczak from the Institute of Medical Physics for
their inestimable help with the µ-CT analysis and their development of the image evaluation
method.
Many thanks to all the staff at the Cauerstraße for making it a great pleasure for me to work
at that place. Very special thanks to Dr. Stefan Seyferth for always having an open door
for discussions, for the joint development of new ideas within my research work and for the
continuous support with all IT concerns or measurement devices within the department.
Petra Neubarth is gratefully acknowledged for her continual and competent support with all
kind of administrative issues. Thank you so much for receiving all my packages and for nice
chats. I would further like to thank Joseph Hubert for his invaluable and persevering support
concerning technical and mechanical questions, especially for his inestimable help to cut the
top shelf, to built the dark cell, and to take care of our ”Christ”. I would further gratefully thank
Luise Schedl for taking excellent SEM pictures of various lyophilizates and for the help and
conjoint time while supervising the student’s basic practical course. Thanks to Christiane
Blaha for the fast and reliable ordering of supplies and support of new equipment.
Thanks to Erasmus student Daria Rychlicka, my ”Wahlpflichtfach” students Theresa Franz,
Maraike Geier, and Alexandra Boersting. Your work has been a great help.

VI
Many thanks to my former colleagues Dr. Stefan Schneid, Dr. Georg Straller, Dr. Simone
Landwehr, Dr. Jakob Beirowski, and Dr. Susanne Hibler for giving me a warm welcome and
for your support. Special thanks to Dr. Georg Straller, who introduced me to the operating
of the ”Christ” and its tricky troubleshooting. You saved me plenty of time. Dr. Simone
Landwehr, thank your for out great time not only at the Department and for our enjoyable
conversations. Dr. Elke Lorenzen, Anne Mundstock, Felix Wolf, and Joachim Schafer,
thanks a lot for our joint attendance of the ”Fachapotheker” seminars and the wonderful and
unforgettable time we had together. In particular I would like to thank my favorite lab-mate
Felix Wolf for the great time we had in Erlangen, for the fruitful discussions and for sharing all
ups and downs through all the years at the department. I would like to thank Ulrike Stange
for our expert discussions, for introducing me to the Pore Master and for our lovely chats.
Matthias Erber, Anders Kunst, Julia Staudenecker, Sandra Wiedemann, Natalie Keil, Zixin
Huang, Alexander Grebner, Claudia Kunz, Jens Holtappels, Peter Startzel, I would like
to thank you for spicing up my time at the department. I enjoyed our funny time and
conversations during our new ”breakfast coffee”, lunch, coffee breaks and evenings. To the
girls, thanks for our enjoyable conversations and discussions during our lovely ”girly nights”.
Melinda Rupp, thank you for sharing my last months with me in the lab. I enjoyed our daily
”sweets break” very much. Claudia Kunz, thank your for making the last months at the
department unique. I enjoyed your friendship so much, I did not want to leave. Outside the
department I would like to thank Nele Bargmann for refereeing the Zusammenfassung and
for the wonderful time we had together.
Last but not the least important, I owe more than thanks to my parents Hanna and Klaus
who paved the way for my doctorate, to my brother Stefan, and Sebastian. Thank you so
much for your continuous support and encouragement during all the years, taking me as I
am and for being always on my side while I follow my path.

PARTS OF THIS THESIS HAVE ALREADY BEEN PRESENTED
I. : S. Ullrich, S. Seyferth and G.Lee, Technique to Determine Kinetics of Shrinkage
and Cracking of Amorphous Cakes during Freeze-Drying. Joint Meeting of the
Austrian and German Pharmaceutical Societies, Innsbruck (Austria), September
20-23, 2011. Poster presentation
II. S. Ullrich, S. Seyferth and G.Lee, Technique to Determine Kinetics of Shrink-
age and Cracking of Amorphous Cakes during Freeze-Drying, 8th World Meeting
on Pharmaceutics, Biopharmaceutics and Pharmaceutical Technology, Istanbul
(Turkey), March 19-22, 2012. Poster presentation
III. S. Ullrich, S. Seyferth and G.Lee, Formulation and Process Optimization to avoid
Shrinkage and Cracking during Freeze-Drying, 9th World Meeting on Pharma-
ceutics, Biopharmaceutics and Pharmaceutical Technology, Lisbon (Portugal), 31
March to April 3, 2014. Poster presentation

Table of contents
List of Abbreviations XIII
1 General Introduction 1
2 The Freeze-Drying Process 5
2.1 Freeze-Drying Equipment . . . . . . . . . . . . . . . . . . . . . . . . . . . . 5
2.2 Process Steps . . . . . . . . . . . . . . . . . . . . . . . . . . . . . . . . . . 6
2.2.1 Freezing . . . . . . . . . . . . . . . . . . . . . . . . . . . . . . . . . 7
2.2.2 Primary Drying . . . . . . . . . . . . . . . . . . . . . . . . . . . . . 9
2.2.3 Secondary Drying . . . . . . . . . . . . . . . . . . . . . . . . . . . . 11
2.3 Heat and Mass Transfer . . . . . . . . . . . . . . . . . . . . . . . . . . . . . 12
2.3.1 Mass Transfer . . . . . . . . . . . . . . . . . . . . . . . . . . . . . . 12
2.3.2 Heat Transfer . . . . . . . . . . . . . . . . . . . . . . . . . . . . . . 13
2.3.3 Coupling between Heat and Mass Transfer . . . . . . . . . . . . . . 17
2.4 Monitoring Technology used for Freeze-Drying . . . . . . . . . . . . . . . . . 17
2.4.1 Invasive Measurements . . . . . . . . . . . . . . . . . . . . . . . . . 18
2.4.1.1 Thermocouples . . . . . . . . . . . . . . . . . . . . . . . . 18
2.4.1.2 Resistance Thermal Detectors . . . . . . . . . . . . . . . . 19
2.4.1.3 Microbalance . . . . . . . . . . . . . . . . . . . . . . . . . 20
2.4.2 Non-invasive Measurements . . . . . . . . . . . . . . . . . . . . . . 21
2.4.2.1 Vacuum Gauges . . . . . . . . . . . . . . . . . . . . . . . 21
2.4.2.2 Comparative Pressure Measurement . . . . . . . . . . . . 25
2.4.2.3 Dew Point Sensor . . . . . . . . . . . . . . . . . . . . . . 25
2.4.2.4 Pressure Rise Technology . . . . . . . . . . . . . . . . . . 26
2.4.2.5 Mass Spectrometry . . . . . . . . . . . . . . . . . . . . . . 27

Table of contents IX
3 Freeze-Drying of Amorphous Materials 29
3.1 The Amorphous State . . . . . . . . . . . . . . . . . . . . . . . . . . . . . . 29
3.2 Glass Transitions . . . . . . . . . . . . . . . . . . . . . . . . . . . . . . . . 30
3.2.1 Thermodynamic Approach considering Enthalpy and Free Volume . . 30
3.2.2 Thermodynamic Approach considering Entropy . . . . . . . . . . . . 31
3.2.3 The Kinetic Relaxation Approaches . . . . . . . . . . . . . . . . . . 32
3.2.4 Glass transition during Freeze-Drying . . . . . . . . . . . . . . . . . 33
3.2.5 Temperature Dependence of Viscosity and Relaxation Time . . . . . 34
3.2.6 Prediction of the Glass Transition Temperature . . . . . . . . . . . . . 36
3.3 Protein Stabilization . . . . . . . . . . . . . . . . . . . . . . . . . . . . . . . 37
3.4 Product Appearance . . . . . . . . . . . . . . . . . . . . . . . . . . . . . . 38
4 Fracture Mechanics of Solids 43
4.1 Mechanical Behavior of Solids . . . . . . . . . . . . . . . . . . . . . . . . . 43
4.2 Fracture Mechanics . . . . . . . . . . . . . . . . . . . . . . . . . . . . . . . 47
4.2.1 Brittle Fracture and Ductile Fracture . . . . . . . . . . . . . . . . . . 47
4.2.2 The Energy-Balance Approach . . . . . . . . . . . . . . . . . . . . . 50
4.2.3 The Stress Intensity Approach . . . . . . . . . . . . . . . . . . . . . 53
4.3 Fracture of Glassy Materials . . . . . . . . . . . . . . . . . . . . . . . . . . 55
5 Materials and Methods 57
5.1 Materials . . . . . . . . . . . . . . . . . . . . . . . . . . . . . . . . . . . . . 57
5.1.1 Amorphous Disaccharides . . . . . . . . . . . . . . . . . . . . . . . 57
5.1.1.1 D-(+)-trehalose dihydrate . . . . . . . . . . . . . . . . . . . 57
5.1.1.2 D-(+)-sucrose . . . . . . . . . . . . . . . . . . . . . . . . . 57
5.1.1.3 D-(+)-maltose . . . . . . . . . . . . . . . . . . . . . . . . . 58
5.1.2 Bovine Serum Albumin (BSA) . . . . . . . . . . . . . . . . . . . . . 59
5.1.3 Overview of Excipients and Reagents . . . . . . . . . . . . . . . . . 59
5.1.4 Packaging Equipment . . . . . . . . . . . . . . . . . . . . . . . . . . 61
5.1.4.1 Freeze Dryer . . . . . . . . . . . . . . . . . . . . . . . . . 61
5.1.4.2 Microbalance . . . . . . . . . . . . . . . . . . . . . . . . . 61
5.1.5 Camera System . . . . . . . . . . . . . . . . . . . . . . . . . . . . . 62

X Table of contents
5.2 Freeze-Drying Methods . . . . . . . . . . . . . . . . . . . . . . . . . . . . . 63
5.2.1 Endpoint Detection of Shrinkage and Cracking . . . . . . . . . . . . 63
5.2.2 Determination of the Kinetics of Shrinkage and Cracking . . . . . . . 64
5.2.3 Freeze-drying Protocols . . . . . . . . . . . . . . . . . . . . . . . . . 65
5.3 Analytical Methods . . . . . . . . . . . . . . . . . . . . . . . . . . . . . . . 66
5.3.1 Differential Scanning Calorimetry (DSC) . . . . . . . . . . . . . . . . 66
5.3.2 Mercury Porosimetry . . . . . . . . . . . . . . . . . . . . . . . . . . 67
5.3.3 Scanning Electron Microscopy (SEM) . . . . . . . . . . . . . . . . . 67
5.3.4 Texture Analyzer . . . . . . . . . . . . . . . . . . . . . . . . . . . . 68
5.3.5 Contact Angle Measurements . . . . . . . . . . . . . . . . . . . . . 68
5.3.6 µ-CT-Imaging Analysis . . . . . . . . . . . . . . . . . . . . . . . . . 68
5.3.7 Ring Tensiometry . . . . . . . . . . . . . . . . . . . . . . . . . . . . 71
5.4 Image Evaluation . . . . . . . . . . . . . . . . . . . . . . . . . . . . . . . . 71
5.4.1 Image Evaluation of the Endpoint-Detection . . . . . . . . . . . . . . 71
5.4.2 Image Evaluation of the Kinetics . . . . . . . . . . . . . . . . . . . . 71
5.4.3 Image Evaluation of the µ-CT-Reconstructions . . . . . . . . . . . . . 72
6 Results 73
6.1 Endpoint Evaluation Method . . . . . . . . . . . . . . . . . . . . . . . . . . 73
6.1.1 Development of the Image Evaluation Method . . . . . . . . . . . . . 73
6.1.1.1 Standardized Picture Taking . . . . . . . . . . . . . . . . . 73
6.1.1.2 Semi-Automatic Evaluation with Axio Vision . . . . . . . . . 76
6.1.1.3 Automatic Evaluation with Matlab . . . . . . . . . . . . . . 82
6.1.2 Statistical Comparison between Axio Vision and Matlab . . . . . . . . 85
6.1.3 Sample Selection and Edge Effect . . . . . . . . . . . . . . . . . . . 88
6.1.4 Shrinkage, Cracking and the Amount of Unfrozen Water, w′ . . . . . . 93
6.1.5 Impact of the Trehalose Concentration . . . . . . . . . . . . . . . . . 99
6.1.6 Impact of the Surface Chemistry on Shrinkage and Cracking . . . . . 106
6.1.7 Impact of the Fill Height and the Vial Diameter . . . . . . . . . . . . . 110
6.1.8 Impact of Hydrophobic Vial Coating . . . . . . . . . . . . . . . . . . 113
6.1.9 Impact of a Variation of the Freezing Step . . . . . . . . . . . . . . . 121
6.1.9.1 Standard Cooling Rate versus Slow Cooling Rate . . . . . . 122
Table of contents XI
6.1.9.2 Standard Cooling Rate versus Shock Freezing . . . . . . . 127
6.1.9.3 The Crack Pattern at Different Cooling Rates . . . . . . . . 129
6.1.10 Impact of the Freezing Protocol . . . . . . . . . . . . . . . . . . . . . 132
6.1.11 Impact of a Variation of the Freezing Step in Combination with the Use
of a Toplyo R© Vial . . . . . . . . . . . . . . . . . . . . . . . . . . . . 136
6.2 Kinetic Method . . . . . . . . . . . . . . . . . . . . . . . . . . . . . . . . . . 141
6.2.1 Development of Online Video Method during Freeze-Drying . . . . . . 142
6.2.1.1 Illumination of the Experiment Setup . . . . . . . . . . . . . 145
6.2.1.2 Selection of the Camera Setup . . . . . . . . . . . . . . . . 149
6.2.1.3 Heat Transfer on the Top Shelf . . . . . . . . . . . . . . . . 152
6.2.1.4 Influence of Vial Cutting on Shrinkage and Cracking . . . . 154
6.2.2 Development of a Kinetic Image Evaluation Method . . . . . . . . . . 156
6.2.2.1 Semi Automatic Picture Evaluation . . . . . . . . . . . . . . 156
6.2.2.2 Image Evaluation with Axio Vision . . . . . . . . . . . . . . 161
6.2.3 Kinetics of Shrinkage and Cracking of a 10% Trehalose Solution . . . 164
6.2.4 Kinetics of Different Trehalose Concentrations . . . . . . . . . . . . . 172
6.2.5 Impact of Ramp Rate to Secondary Drying . . . . . . . . . . . . . . 180
6.2.6 Impact of a Lower Primary Drying Temperature . . . . . . . . . . . . 185
6.2.7 Impact of Tween 80 or Glycerol . . . . . . . . . . . . . . . . . . . . . 190
6.2.8 Impact of a Protein . . . . . . . . . . . . . . . . . . . . . . . . . . . 196
6.2.9 Kinetics of Different Disaccharides . . . . . . . . . . . . . . . . . . . 199
6.3 µ-CT Analysis . . . . . . . . . . . . . . . . . . . . . . . . . . . . . . . . . . 203
6.3.1 Sample Selection . . . . . . . . . . . . . . . . . . . . . . . . . . . . 203
6.3.2 Development of Adequate Measuring Conditions . . . . . . . . . . . 204
6.3.3 Image Evaluation of the µ-CT-Reconstructions . . . . . . . . . . . . . 205
6.3.4 Comparison between 2D-Analysis (Endpoint Evaluation Method) and
3D-Analysis (µ-CT) . . . . . . . . . . . . . . . . . . . . . . . . . . . 208
6.3.5 Comparison between the 3D-Structure of Samples obtained in a Reg-
ular and a Toplyo R© Vial . . . . . . . . . . . . . . . . . . . . . . . . . 213
7 Conclusions 217

XII Table of contents
8 Zusammenfassung 221
9 Appendix 225

List of Abbreviations
EXPRESSIONS
Symbol Meaning
API Active Pharmaceutical Ingredient
AEB Auto Exposure Bracketing
BSA Bovine Serum Albumin
BTM Barometric Temperature Measurement
CM Capacitance Manometer
CMC Critical Micelle Concentration
DSC Differential Scanning Calorimetry
EPFM Elastic-Plastic Fracture Mechanics
FDA Food and Drug Administration
GMP Good Manufacturing Practice
HDR High Dynamic Range Image
HP High Pressure Measurement
LED Light Emitting Diode
LEFM Linear-Elastic Fracture Mechanics
LP Low Pressure Measurement

XIV Table of contents
MTM Manometric Temperature Measurement
RGA Residual Gas Analysis
PDT Primary Drying Temperature
RTD Resistance Thermal Detector
SEM Scanning Electron Microscopy
TC Thermocouple
VOI Volume of Interest
CAPITAL LETTERS
Symbol Unit Meaning
A% [%] Fragment’s Area to the Area of the Whole Cake
AC [m2] Crack Area
AI [m2] Inner Area of the Vial
Af [m2] Area of a Cake Fragment
AF [m2] Area of the Whole Cake
Av [m2] Cross sectional Area of the Vial (outer diameter)
Ap [m2] Product Area (outer diameter)
Cp [J/K] Heat Capacity
df [-] Degree of Freedom
E [GPa] Young’s Modulus
mc [-] Mean Color Value of the Cake

Table of contents XV
H [J] Enthalpy
Hs [J] Heat/Enthalpy of Sublimation
Kc [J/s m2 K] Vial Heat Transfer Coefficient (Conduction)
Kr [J/s m2 K] Vial Heat Transfer Coefficient (Radiation)
Kg [J/s m2 K] Vial Heat Transfer Coefficient (Convection)
KIc [MPa ·m1/2] Stress Intensity Factor
Kv [J/s m2 K] Vial Heat Transfer Coefficient (Total)
Lice [m] Thickness of the Ice Layer (Total)
Pc [Pa] Chamber Pressure
Pcd [Pa] Vapor Pressure of Ice at the Surface of the Condenser
Pice [Pa] Equilibrium Vapor Pressure of Ice at the Sublimation Interface
Psat [Pa] Saturation Vapor Pressure
Pv [Pa] Partial Pressure of Water Vapor in the Head Space of the Vial
PY [-] Yielding Point
lm [m] Major Width of a Cake Fragment
R% [%] Fragment’s Width to the Radius of the Whole Cake
Rp [m2 Pa s/kg] Product Resistance
Rs [m2 Pa s/kg] Stopper Resistance
S [J/K] Entropy
T0 [K] Vogel Fulcher Temperature (see TK)
Tc [K] Collapse Temperature
Te [K] Eutectic Temperature

XVI Table of contents
Tg [K] Glass Transition Temperature
T ′g [K]
Glass Transition Temperature of the Maximally
Freeze Concentrated Solute
Tg(mix) [K] Estimated Glass Transition Temperature of the Formulation
TK [K] Kauzmann Temperature
Tf [K] Freezing Temperature
Tp [K] Product Temperature
Ts [K] Shelf Temperature
Vocc [m3] Occupied Volume
Vspec [m3] Specific Volume
Vf [m3] Free Volume
SMALL LETTERS
Symbol Unit Meaning
w′ [%]Content of non-frozen Water in the Maximally
Freeze Concentrated State
B IG GREEK LETTERS
Symbol Unit Meaning
Γ [mg/m2] Surface Excess Concentration
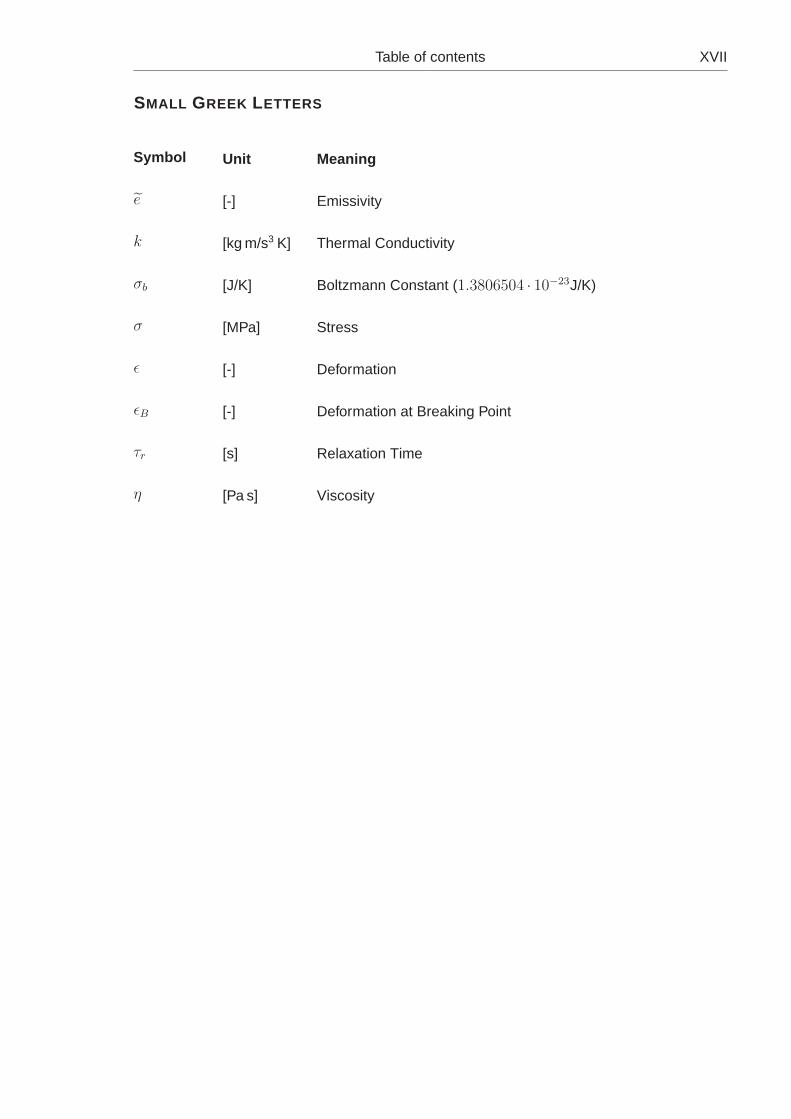
Table of contents XVII
SMALL GREEK LETTERS
Symbol Unit Meaning
e [-] Emissivity
k [kg m/s3 K] Thermal Conductivity
σb [J/K] Boltzmann Constant (1.3806504 · 10−23J/K)
σ [MPa] Stress
ǫ [-] Deformation
ǫB [-] Deformation at Breaking Point
τr [s] Relaxation Time
η [Pa s] Viscosity

1 General Introduction
Freeze-drying or lyophilization is still the method of choice to establish a stable biopharma-
ceutical product [1, 2] despite its complexity and cost. Approximately 50% of all biophar-
maceuticals during the last 20 years were stabilized with freeze-drying [3]. Nevertheless,
the lyophilization process can cause a diversity of potential difficulties during the freezing
and drying procedure such as pH change, formation of ice crystals and solute concentration
which may damage proteins. Therefore it is in most cases important to use stabilizers in a
formulation to keep labile proteins in their native state during the entire lyophilization pro-
cess. A number of carbohydrates, especially amorphous disaccharides, are used as such
stabilizers [4].
However, the application of these stabilizers or bulking agents may cause problems
with cake appearance (pharmaceutical elegance). The freeze-drying of fully amorphous
lyophilizates from protein drugs in combination with a bulking agent like trehalose or sucrose
usually leads to a product with optical defects known as shrinkage and cracking [5, 6, 7].
Shrinkage is a contraction of the lyo mass and cake detachment of the freeze-dried cake
from the inside walls of the glass vial. Consequently, the cake does not fill the entire interior
of the vial, but leaves a gap between the inner wall of the vial and the cake. In the case of
cracking the cake is lacerated in numerous places and the product shows fissures or cracks
inside the dry matrix. These two phenomena occur either alone or together [5].
Shrinkage is a macroscopic change in cake structure and therefore must be carefully dis-
tinguished from a loss of microstructure of the cake resulting in a collapse of the solute
framework [8]. This collapse is caused by the product temperature, Tp, exceeding the col-
lapse temperature, Tc, of an amorphous formulation. Tc is related to the glass transition
temperature of the maximally freeze-concentrated solute, T ′g, and collapse can occur either
during primary drying (Tc ≈ T ′g) or secondary drying, when Tc approaches the glass transi-

2 1 General Introduction
tion temperature, Tg. Cracking and shrinkage appear to be no consequence of exceeding Tc,
but are likely caused by tension or stress in the cake that lead to plastic flow or brittle fracture
of the lyophilizate mass during drying [5]. Cracks may be a result of removal of unfrozen
water by evaporative drying and leads to an accelerated rate of freeze-drying because of
enhanced water vapor transfer through cavities and fissures [8].
Shrinkage produces a serious heterogeneity with respect to the residual water content.
The rate of mass transfer is offered less resistance in the peripheral cake region in the result-
ing gap between cake and glass wall than in the central region. This may lead to a nonuni-
form drying behavior [9]. A heterogeneous water content through the cake can exacerbate
damage to proteins and lead to a shorter shelf life as well as a narrower range for storage
temperature [5, 10]. In addition, reconstitution may be hindered, so a particulate-free solu-
tion with satisfactory content uniformity cannot be assured [10, 11]. Consumer and physician
acceptance for a shrunken and cracked product is also questionable if not doubtful [12]. In
summary, the question of pharmaceutical elegance constitutes not only a visual problem, but
is a relevant product property of a lyo as already cited by the Food and Drug Administration
(FDA) [3, 13].
The research presented in this thesis is focused on studying freeze-drying introduced
shrinkage and cracking, on developing a quantification method for in situ measurement and
reducing or avoiding either or both. On the basis of the current state of knowledge a general
avoidance or reduction in shrinkage and cracking is tackled by different ways. Freeze-drying
cycles can be applied that - according to visual observation - lead to less shrinkage of a fully
amorphous cake. The few publications on this topic report the application of product temper-
atures that are well below Tc and give therefore long process durations, hardly acceptable for
a commercial application [5, 14]. The inclusion of an annealing step at the end of the freezing
phase may also counteract to some extent the development of cracking [15].
The mechanisms underlying these more or less successful measures to avoid shrinkage
and cracking have never been investigated. Either ”internal stresses” [15] or the formation of
”crystalline networks” [14, 16] were suspected to be accountable, but these are only vague
ideas. Above all, there is a lack of a basic outline of the cause and development of shrinkage
and cracking during the three phases of freeze-drying. Furthermore, the relationship between
the two separate phenomena is unclear: there may occur both, or just one and also neither.

3
It is also questionable whether the total amount of changes, i.e. shrinkage and cracking of
the cake, is dependent on the formulation. An apparent correlation between shrinkage and
the content of non-frozen water in the maximum freeze-concentrated state, w′, has been
reported on the basis of a single substance, sucrose [5]. The same authors postulate that
adhesion between the inside wall and the lyo mass may be relevant for shrinkage, but without
verifiable data. Even the time point of occurrence is uncertain: either after the removal of the
ice (i.e. first during the secondary drying step) or already during primary drying.
There are no quantitative measurements of the extent of shrinkage and cracking and their
kinetics determined in situ during the three phases of lyophilization. There is also no suitable
method for an accurate, quantitative determination of the degree of both processes in one
finished vial. The stresses or adhesion forces occurring in the lyo have also never been
investigated.These deformations of a freeze-dried product can substantially affect both the
process time and the energy consumption, owing to the reduced contact area between the
cake and the inside wall for thermal conduction.
The results of this work should therefore offer a better understanding of both the kinetics
and the incidence of shrinkage and cracking in dependence on process and formulation
parameters. The mechanisms that trigger these cake changes should be elucidated. The
central issue is to establish a method to quantify shrinkage and cracking both in the end
product and in situ. The results should provide the user of amorphous cakes during freeze-
drying with more knowledge for a targeted prevention or reduction in shrinkage and cracking.

2 The Freeze-Drying Process
Freeze-drying is a desiccation technique used to produce a solid form characterized by a
sponge-like appearance and a high specific surface area. Sensitive materials such as pro-
teins or aromatic ingredients can also be preserved by their immobilization during freezing
and the low process temperatures used [17, 18]. The advantages of lyophilization over other
drying techniques are numerous, for example rapid and complete reconstitution owing to the
large specific surface area, accurate and reproducible dosing, as well as the ability of sterile
manufacturing. However, there are some distinct disadvantages to the freeze-drying method.
The long process time and the associated high operating costs of vacuum and freezing equip-
ment. Though there are continuous freeze-dryers available, lyophilization is in most cases a
batch process that charges a limited amount of vials or trays processed in each run [18].
2.1 Freeze-Drying Equipment
To achieve the low temperatures and pressures required for the lyophilization process, spe-
cific equipment is necessary (Figure 2.1). The main parts are a drying chamber (2), a con-
denser chamber (5) and a vacuum pumping system (6) [3]. The drying chamber encloses the
shelves on which the containers (e.g. vials or trays) are placed. It also ensures attainment of
the necessary pressures and aseptic conditions [19]. The shelves (1) and (3) are hollow with
a cooling and heater circuit to control the required temperatures [20]. In some laboratory
scale freeze-dryers, the shelves are only heatable and the freezing step has to be carried
out externally. In some machines the top shelf represents an unusable shelf (1), a radiation
shield for the vials on the lower usable shelf [19]. A hydraulic system is usually attached to
move the shelves together for the stoppering procedure at the end of lyophilization.
The configuration of the drying chamber depends on the application (e.g. laboratory scale

6 2 The Freeze-Drying Process
(1)(2)
(3)
(4)
(5)
(6)
Figure 2.1: General layout of a Freeze-Dryer: (1): Top shelf, (2): Drying Chamber, (3): Usableshelves, (4): Condenser, (5): Condenser chamber, (6): Vacuum pumping system.Adapted from [19].
or food/plant products). A baseplate with a bell, cylindrical chambers or tunnels with circu-
lar cross-sections are also possible [21]. In the majority of cases, however, the door is of
stainless steel, acrylic glass or PlexiglasTM with the chamber walls made of stainless steel.
The drying chamber is linked to a condenser chamber via a valve. A pumping system is
used to produce the sub-atmospheric pressures required during the freeze-drying process
and to remove non-condensable gases [19]. The condenser is constructed having several
plates or loops which are suitable to hold low temperatures down to -70 C [19]. On its surface
the water vapor generated during drying is condensed to ice [22].
2.2 Process Steps
The freeze-drying process is classically split in three parts: freezing, primary drying and
secondary drying. During freezing most of the liquid phase, usually water, is converted to ice
[21, 22]. Primary drying is the step where the ice is removed by sublimation. During the last

2.2 Process Steps 7
step, secondary drying, the unfrozen part of the solvent is desorbed and eliminated [18].
2.2.1 Freezing
After the preparation and filtration of the formulation (composed of the drug and several
excipients) the product solution is filled into containers. These are mostly tubing or molded
glass vials, but others e.g. plastic vials, glass ampoules, syringes and blisters can also be
used. The containers are positioned on the shelves of the freeze-dryer and chilled typically
to about -40 C to execute the freezing step. The product solution is cooled only slightly
more slowly than the shelf and stays several degrees above the shelf temperature, Ts [22,
23]. Kasper et. al. [24] describe this freezing step as in the following. On crossing the
equilibrium freezing point of the solution it remains liquid without spontaneous freezing (A,
Figure 2.2). Ice crystallization (point B) usually starts at temperatures about 10-15 C below
A
B
CD
E
Figure 2.2: Freezing behavior: Product and shelf temperatures during shelf freezing with A:supercooling and cluster forming, B: ice crystallization, C-D: Freezing time, icecrystal growth, E: completion of freezing. Adapted from [24].
the equilibrium freezing point [25]. This can depend on the degree of vibrations experienced
in any particular machine. The range between the equilibrium freezing point and incipient ice

8 2 The Freeze-Drying Process
crystallization is called supercooling and is a meta-stable state. It can be considered as an
”activation energy” that is required for the nucleation procedure [24].
On decrease in temperature density fluctuations occur in the supercooled liquid water,
whereupon molecular clusters (nuclei) arranged similar to ice crystals are formed transiently.
This state is energetically more favorable at lower temperatures, and accordingly the forma-
tion, maintenance and growth of the clusters becomes more pronounced as the temperature
falls. At point B the clusters have reached a sufficient extent that the formation of ice crystals
starts. A crystallization procedure where only one ice cluster is formed that subsequently
grows is termed homogeneous nucleation and should occur at about -40 C for water [26].
Even when using sterile-filtered water it is unlikely that homogeneous nucleation can take
place. Clusters form at higher temperatures is caused by the formation of nuclei on ”im-
purities” in the solution such as foreign particles (heterogeneous nucleation). From point B
to point C an incipient ice network is formed as ice crystal growth proceeds. The product
solution’s temperature now rises because of the release of latent heat of fusion [26]. Sub-
sequently, the major freezing period from point C to point D takes place in which a large
proportion of the water is converted to ice. At point E the freezing of the sample is completed
and the temperature decreases further in near parallel to the shelf.
During ice formation (C-E) the non-frozen interstitial fluid between the growing ice crystals
becomes more concentrated (”freeze-concentration”) until it finally solidifies due to crystal-
lization of the residual water alongside the crystalline excipient [22, 26]. An eutectic mixture
is generated at the eutectic temperature, Te. If no crystallization of the excipient occurs, the
interstitial fluid remains amorphous. With increasing ice crystal growth the amorphous phase
becomes more concentrated until at T ′g its viscosity increases to >1014 Pa s and the ice crys-
tal growth stops [26]. At this point an amorphous glass is formed with a specific amount of
unfrozen water, w′ [3, 22]. Knowledge of Te and T ′g of a formulation is essential, as these
values determine the temperature during freezing and also the maximum possible product
temperature during primary drying in order to avoid loss of cake structure by deformation,
partial or total collapse and meltback [5, 26].
The ice formation process is complex because it depends on several factors like process
parameters, formulation characteristics, filling volume or depth, concentration of the ingredi-
ents, as well as the properties of the vial surface [24, 25]. Yet, freezing is the ”key” step of the

2.2 Process Steps 9
whole process as it determines the quantity, the shape and the dimensions of the ice crystals
and pores. A high degree of supercooling (low nucleation temperature) and a high nucleation
rate leads to numerous small crystals. A low degree of supercooling and a low nucleation
rate causes a lower number of large ice crystals [23]. The specific surface area of the final
product is therefore already fixed during freezing. Small ice crystals should lead to a high
product resistance to vapor flow, Rp, and therefore prolonged primary drying times [7, 27].
The duration of secondary drying should, however, be reduced, since small ice crystals offer
a large specific surface area and an easy desorption of unfrozen water from the pore surface
[27]. This, in particular, has to be considered during the lyophilization of amorphous materials
possessing a high amount of unfrozen water. The freezing step represents the desiccation
process, as the majority of water is phase-separated from the solute components in the form
of ice crystals [5].
2.2.2 Primary Drying
Primary drying is defined as the process of solvent removal by sublimation and is performed
after the complete solidification of the solution during freezing. The sublimation of ice, i.e.
water, is enabled since ice has a vapor pressure. The system pressure is reduced to below
that of the triple point (in the range of 4-40 Pa) and the shelf temperature is increased to
provide the necessary enthalpy of sublimation [22].
The product temperature, Tp, at the sublimation interface is a major process parameter, as
it determines primary drying time and influences product quality (stability, residual moisture,
reconstitution time) [12]. It depends on the formulation properties, shelf temperature and
chamber pressure, Pc [28]. A 5 C rise in product temperature reduces the primary drying
time by a factor of 2, since a higher product temperature accelerates sublimation [29]. Hence,
primary drying should be performed at the highest possible Tp to achieve a short process time
(primary drying is normally the longest step in the whole freeze-drying cycle). However, the
upper limit of Tp, termed the ”maximum allowable temperature” or ”critical temperature” [29]
has also to be considered. This relates to Te for crystalline solutes and to Tc or T ′g if the
solute does not crystallize. Exceeding it leads to a loss of structure since the porous cake
formed close to the sublimation front still contains high amounts of water. Furthermore, the
viscosity of an amorphous solid decreases as a function of T−T ′g [30]. As a consequence the

10 2 The Freeze-Drying Process
matrix undergoes viscous flow causing loss of microstructure with closure of pores. Thereby
the specific surface area is reduced and the moisture content remains high [30]. This may
cause adverse effects on protein stability during storage and reconstitution behavior [10]. The
target product temperature is therefore selected approximately 2 C lower than the critical
temperature to obtain a dry product with acceptable appearance [22].
The chamber pressure, Pc, impacts both heat and mass transfer (see chapter 2.3). The
gradient between Pc and Pice, the equilibrium vapor pressure of ice at the sublimation inter-
face, constitutes the driving force for sublimation. If Pc is kept well below Pice at the target
product temperature, a high sublimation rate is accomplished. However, very low chamber
pressures are technically difficult to maintain at a constant value. Product quality can also be
compromised by contamination with vaporized vial stopper components or pump oil. Heat
transfer to the product is also low. A suitable chamber pressure, Pc, at known target product
temperature, Tp, can be estimated via Equation 2.1 [31].
Pc = 0.29 · 10(0.019 ·Tp) (2.1)
As soon as Pc falls below Pice in the product, sublimation begins from the top of the frozen
cake and moves down to the vial base with progressing primary drying. The boundary be-
tween ice and dried product is the ice-vapor interface. It is thought not to remain planar during
primary drying, but rather curved, because the sublimation process runs faster in the region
near the vial wall, as depicted in Figure 2.3 [9]. The water vapor reaches the condenser and
Linear Actual
Dry
Frozen
Figure 2.3: Schema of suggested geometry of the ice-vapor interface during primary drying.Adapted from [9].
is condensed and frozen on the condenser coils or plates which are cooled to about -70 C.
At the former position of the ice crystals there are now pores or ”ice ghosts” when the sub-
limation process is finished. Hence, an open network of pores is formed which serves as

2.2 Process Steps 11
pathways for the water vapor created in subsequently secondary drying [22]. Since sublima-
tion consumes energy, the product is cooled and sublimation slows down. To maintain the
ongoing removal of ice the shelves are heated to compensate this enthalpy consumption. To-
wards the end of primary drying this demand for heat reduces and Tp rises to approximately
that of Ts [19].
2.2.3 Secondary Drying
At the end of primary drying, the porous cake still contains moisture in terms of unfrozen
water. For a crystalline solute the remaining water comprises surface-adsorbed water, hy-
dration water, or water of crystallization. Mass transfer is therefore determined by desorption
and vaporization. As the amount of water is limited by the available specific surface area and
therewith low, the product is almost dry at the end of primary drying and secondary drying
is short [26]. In contrast for an amorphous solute with a glassy matrix the content of w′ ac-
counts for up to 40%, which is dissolved in the glassy amorphous phase as a solid solution
[26, 32]. Since mass transfer proceeds by molecular diffusion within the glassy phase and
the content of water is large, this drying stage can be long.
The secondary drying process is not clearly delineated from primary drying. Instead, both
processes run parallel. Once the ice has been locally removed by sublimation, the residual
dissolved water starts to leave in this region [32]. Ts is increased to a level higher than that
during primary drying to accelerate desorption. If Tp rises above Tg, due to the progres-
sive drying, a risk of collapse is likely [31]. Hence the temperature ramp has to be carried
out slowly for amorphous materials. In contrast, for crystalline products there is no danger
of collapse and a high ramp rate to secondary drying can be performed. As the chamber
pressure has no influence on the desorption rate, a further reduction in Pc is not necessary
[9, 31, 32, 33]. For most freeze-dried active pharmaceutical ingredients (APIs) the stabil-
ity increases with lower moisture content and secondary drying should therefore produce a
moisture of less than 1% [9, 34]. For proteins it is especially important to develop adequate
drying conditions that compromise between high thermal stress and low moisture content.

12 2 The Freeze-Drying Process
2.3 Heat and Mass Transfer
2.3.1 Mass Transfer
During primary drying, the water vapor has to overcome several barriers (resistances) on
its way between sublimation front and condenser. These lie in the partially dried product,
the openings of the stopper and the gas phase in the chamber to condenser pathway as
shown in Figure 2.4 [29]. The resistance impairing the mass transfer most is that of the
Resistance
Chamber
Stopper
Product
Condenser, Pcd
Pc
Pv
Dried Product
Ice, Pice
Figure 2.4: Schema of resistances to mass transfer in primary drying. Pice: vapor pressureof ice at the sublimation interface, Pv: Partial pressure of water vapor in the headspace of the vial, Pc: Partial pressure of water vapor in the chamber, Pcd: vaporpressure of ice at the surface of the condenser. Adapted from [35].
dried layer, the so-called product resistance, Rp. It accounts for nearly 80% of the total
mass transfer resistance between sublimation front and condenser [35, 36]. This resistance
depends on the cross-section area of the product as well as the vial diameter, the thickness
of the product layer and the container wall used [29]. Accordingly, Rp is higher with higher
solute concentration and increases as primary drying proceeds and the thickness of the
dried product layer lengthens [22]. Another parameter affecting Rp is the morphology of the
dried cake the water vapor has to pass through. The amount, shape, interconnection, and

2.3 Heat and Mass Transfer 13
dimensions of the ice crystals and therefore the pore size of the dried cake all depend on the
freezing protocol [37].
A further mass transfer barrier is the openings of the stoppers, the only outlet for the water
vapor from the vial. Before freeze-drying the stoppers are positioned, but not pushed onto
the necks of the vials to leave an opening for the water vapor. The diameter of the stopper
openings is in the range of 0.2-0.4 cm, which means that the area for vapor flow is large
in comparison to that of 15-60µm of the pores [38]. Therefore stopper resistance, Rs, is
negligible in comparison to the resistance of the dried product, with the possible exception
of the freeze-drying of very dilute solutions [22, 36]. The chamber to condenser pathway
constitutes another resistance to mass flow, since the water vapor needs to pass through
this gas phase. The dimensions of this distance vary greatly from machine to machine, so
that the resistance arising during this pathway varies accordingly [38].
The mass transfer rate, dmdt
, is therefore related to the difference between Pice and Pc, and
the resistance to vapor flow from the frozen product to the drying chamber [31]:
dm
dt=
Pice − Pc
Rp +Rs
. (2.2)
The mass transfer rate increases directly with larger pressure gradient between the subli-
mation front and the chamber and decreases with higher resistance to vapor flow. As the
stopper resistance is insignificant, the primary drying rate depends in the first instance on Rp
as largely determined by the freezing step [37].
2.3.2 Heat Transfer
For the sublimation process some 660 cal/g [38, 39] is necessary to convert ice to water
vapor and is provided by the freeze-dryer shelves [38, 39]. This heat has to be transferred
under vacuum from the shelves to the sublimation front. During this process the heat has to
cross a number of barriers like the transport through the shelf to its surface, the gap between
the shelf surface and the vial base, as well as the base of the vial and the frozen product [36].
Pikal [35] identified the major barrier to heat transfer as the gas-filled gap between the surface
of the shelf and the base of the vial (Figure 2.5). Only about 5% of the total surface between
the shelf and the vial is directly in contact due to an uneven vial base [26]. This curved base

14 2 The Freeze-Drying Process
results from the vial production process and is more pronounced for molded vials, but even
tubing vials exhibit only a small direct contact interface to the shelf [40, 41, 42]. The product,
the thickness of the glass, and the transfer of heat through the shelf up to its surface have
no substantial influence on heat transfer in a modern freeze dryer [36, 38, 40]. The heat
exchange takes place mainly between the glass vials and the stainless steel shelf on which
the vial is loaded. The walls of the freeze-drying chamber and the shelf above the vials also
contribute to heat transfer [43]. As shown in Figure 2.5 there are three mechanisms for heat
exchange: convection, conduction and radiation [36, 43].
d
g
convection
shelf
conduction
water vapor
radiation
dry layer
sublimation front Tp < Tc
ice core
Figure 2.5: Mechanisms of heat transfer to the product. Adapted from [44].
Conduction is the direct exchange of energy between two solid materials by molecular
motion. At freeze-drying it takes place in the contact zones between the shelves and the vials,
and subsequently between the vial and the product. The rate of heat transfer is described by
Fourier’s law, Equation 2.3:dQ
dt= −kA · dT
dx(2.3)
where dQdt
is the rate of heat transfer, k is the thermal conductivity, A is the area normal to the
direction of heat flow and dTdx
is the temperature gradient [26]. The amount of heat transfer, Q,
as expressed in Equation 2.3, is therefore proportional to the temperature difference between
the warmer shelf and the colder vial. The contact area between the base of the vial and the
shelf is determined by the container type used, as described above [43]. The fraction of

2.3 Heat and Mass Transfer 15
the total heat transfer caused by conduction cannot be calculated, since the temperature
difference between the shelf surface and the product at the container base results from all
three contributions to heat transfer. The contact area for a vial type may be estimated with
print tests shown in Figure 2.6 [36]. In this example the 10 ml Thuringer Pharmaglas tubing
(a) (b)
Figure 2.6: Prints of a 10 ml Thuringer Pharmaglas tubing vial (a) and a 10 ml Schott Toplyo R©
tubing vial (b).
vial (a) has a higher contact area with the shelf than the 10 ml Schott Toplyo R© tubing vial (b).
Radiation takes place, for example, between the cold vial and the shelf, the overlying
shelf as well as the chamber door and its walls [38]. Thermal radiation requires no medium
for energy transport, as the energy is transmitted by electromagnetic waves from warmer
surfaces and is absorbed by colder surfaces. The amount of energy per time transmitted by
radiation is given in terms of the Stefan-Boltzmann equation [36]
dQr
dt= Av · e · σb · (T 4
2 − T 41 ), (2.4)
where dQr
dtis the radiation heat flow, Av is the cross sectional area of the vial, e is the effective
emissivity for exchange of radiation (in the range of 0 and 1), σb is the Boltzmann constant
and T 42 −T 4
1 is the difference in the absolute temperatures of the two surfaces to the power of
four. The temperature difference between both surfaces is therefore the most powerful factor.
The effective emissivity e varies for different surface materials used in the construction of
a freeze-dryer. For example, for acrylic glass doors which show a high emissivity (0.86). The
walls are made of polished stainless steel with a much lower effective emissivity of about 0.59
[45]. Thermal radiation does not contribute a major part to heat transfer because of the low
temperatures during freeze-drying [46]. It affects, however, the inter-vial homogeneity in heat
transfer rates depending on the position on the shelf, especially for scale-up. The so-called
”edge effect” impacts in first instance the vials in an outer position closer to the warm surfaces

16 2 The Freeze-Drying Process
of the chamber walls and door. This leads to a higher drying rate of these vials up to 15%
[36] to 50% [46]. These differences are a serious issue in process control, since the product
temperature is often monitored in center positioned vials with a lower product temperature.
Vials positioned closer to the condenser chamber could radiate energy to the condenser
and have therefore a lower sublimation rate. To attenuate heat transfer by radiation a tightly
arranged, hexagonal positioning of the vials on the shelf is recommended [47].
Convection takes mainly place in the air gap between shelf and vial base. In this cavity
energy is transferred from the shelf to the gas molecules which move upwards to contact
the vial base. Convection is a pressure-dependent process and the heat flow increases with
increasing gas pressure since a higher amount of energy can be transported [38]. Convection
is influenced by the vial geometry, as the width of the gap varies accordingly [35]. The
distance that an average gas molecule can pass between two collisions is termed the mean
free path, depending on the pressure [18]. If the mean free path is small compared with
specified distance (vials with a large gap), then collisions between gas molecules are more
likely than collisions between gas molecules and the vial base wall and heat transfer is limited
[26]. The heat flow is expressed as
dQ
dt= Av ·Kv · (Ts − Tp), (2.5)
where dQdt
is the heat flow from the shelf to the product in a given vial, and Kv is the vial
heat transfer coefficient [29, 36, 38]. Equation 2.5 assumes that the overlying shelf above
the vials is at the temperature Ts and considers the temperature differential between ice at
the vial base and the subliming ice [36]. Kv is composed of the three different contributions
to heat transfer [35]:
Kv = Kc +Kr +Kg. (2.6)
Kc is the fraction arising from direct conduction from shelf to vial via direct contact (gas-
independent), Kr is the contribution by radiative heat (gas-independent), and Kg is the
pressure-dependent gas conduction inside the gap between shelf surface and vial base
[36, 38]. Kv is furthermore defined as the ratio of the area (Av) normalized heat flow (dQdt
)
and Hs the heat of sublimation of ice (660 cal/g), to the temperature difference between Ts
2.4 Monitoring Technology used for Freeze-Drying 17
and Tp:
Kv =dQdt
·∆Hs
Av · (Ts − Tp). (2.7)
Kv is dependent on the type of vial and increases with higher Pc [29].
2.3.3 Coupling between Heat and Mass Transfer
The coupling between heat and mass transfer is depicted in Equation 2.8 in the usual way
and linked by ∆Hs:dQ
dt= ∆Hs ·
dm
dt. (2.8)
dQdt
is the heat flow, and dmdt
is the mass flow rate [38]. During primary drying in vials the main
part of this process step is carried out under steady state conditions. The heat input from
the shelf fluid is in equilibrium with the amount of heat removed by sublimation, and Tp does
not change. The insertion of Equations 2.2 and 2.5 into Equation 2.8 describes this balance
between heat input from the shelf (left side) and heat removed by sublimation (right side)
during the steady state, to give:
Av ·Kv · (Ts − Tp) = ∆Hs ·P0 − Pc
Rp +Rs
. (2.9)
2.4 Monitoring Technology used for Freeze-Drying
Tp is the major product parameter during a lyophilization process and needs to be maintained
below the critical temperature to give a product with the desirable properties [48]. Neverthe-
less, primary drying should be performed at the highest possible product temperature to
achieve process efficiency. Tp is determined by the relative rates of heat and mass transfer
which in turn depend on Ts and Pc. The monitoring technology for these process parameters
is described in the following section.

18 2 The Freeze-Drying Process
2.4.1 Invasive Measurements
2.4.1.1 Thermocouples
The monitoring of Tp during freeze-drying on the laboratory scale is carried out using thin wire
thermocouples (TC) [18]. A TC is build on two dissimilar metals (e. g. copper-constantan,
chromel-alumel ) brazed at the tip [26]. TCs can be applied over a wide temperature range
depending on the combined metals used. They usually show an accuracy of only ±1 K
[49]. TCs have the advantage of allowing temperature measurement at a precise location
within the product container [50]. Furthermore, they are small, simple, self-powered and in-
expensive [18]. The functionality works on the Seedbeck effect which describes the electrical
potential difference that occurs in an electrically-conducting material with a nonuniform tem-
perature distribution [51]. If two wires composed of dissimilar materials are joined at both
ends and the two junctions are at different temperatures, then a continuous electric current is
created around the circuit (Figure 2.7a). If there is only one junction between the two wires,
Metal A
Metal B
Metal A
Metal B
+
-
(a) (b)
Figure 2.7: The Seedbeck effect (a) and the Seebeck voltage (b). Adapted from [18].
as is the case with a TC, a voltage (Seebeck voltage) can be measured across both open
ends (Figure 2.7b). This voltage is linearly proportional to the temperature at the junction
for small changes in temperature. The Seebeck voltage can therefore be correlated to the
temperature [52]. TCs are placed through the stopper into the center of the vial with con-
tact between its temperature-sensitive tip and the vial base. This position regime is of great
importance for endpoint-detection of primary drying. Drying progress proceeds from the top
to the base of the vial and from its edge to center [9, 22]. Hence, the final sublimation of
ice takes place at the base center of the vial and is accompanied by a sharp increase in
Tp. Incorrect thermocouple placement could thereby give a too-early endpoint and impair the
product quality. To ensure correct TC fixing during loading or freezing, the TC wire should be

2.4 Monitoring Technology used for Freeze-Drying 19
placed under slight tension.
The use of TCs is an invasive measurement. Thermocouples can produce heterogeneous
ice nucleation as the bare TC constitutes an ice nucleation site and reduces the degree
of supercooling. Hence, nucleation proceeds at higher temperatures than without a TC.
Accordingly, the frozen matrix in which the thermocouple is located has a different frozen
structure with larger ice crystals and consequently larger pores in the dried product layers.
This results in a lower resistance to mass transfer making vials with inserted thermocouples
dry faster [22, 48]. The vials containing thermocouples are not representative of the rest
of the batch. For primary drying endpoint detection an additional, so-called soak period of
10-30% is therefore added to the time point at which the thermocouple Tp approaches the
shelf temperature [53]. Thermocouples cannot be used with automatic loading systems and
are usually positioned in the front row close to the door to minimize the chance of sterility
compromise during their placement. These vials suffer higher heat transfer due to radiation
effects [46]. In addition, the positioning of the thermocouples wires, the loading of these
vials, and connection to the thermocouple port has to be carried out manually. A sterility risk
cannot be excluded.
2.4.1.2 Resistance Thermal Detectors
Resistance thermal detectors (RTDs, Pt100) can be used for the monitoring of temperature.
They are constructed from platinum due to its corrosion resistance as well as its relatively
high electrical resistance [18]. Standard platinum RTDs offer a resistance of 100Ω at 0 C.
They are chemical inert and show linear behavior, they resist corrosion, are easy to steril-
ize and offer a mechanical robustness. Furthermore, the electrical signal is stable over a
wide temperature range [50]. The principle of measurement is based on the temperature
dependence of the electrical resistances of metals. With increasing temperature the resis-
tance increases linearly. To determine the resistance a Wheatstone bridge is used. To avoid
temperature changes, the platinum element is separated from the bridge, as illustrated in
Figure 2.8. Since an electrical current is necessary for measurement of the temperature-
dependent resistance, more heat transfer is possible. In addition, the sensing tip possesses
a large mass leading to disadvantages like an imprecise location and a temperature profile
across the length of the tip. This is especially relevant with small product containers or low

20 2 The Freeze-Drying Process
+-
RTD
Figure 2.8: Wheatstone bridge: RTD.
fill volumes, where the RTD may extend above the solution and measure a mixture of gas
headspace and Tp. As temperature measurement with RTDs takes place in a single vial, the
errors of ice nucleation occur together with the consequences on morphology of the cake,
drying behavior and endpoint detection (see 2.4.1.1). In comparison to TCs, RTDs are expen-
sive, larger and require a power source [18]. The overall disadvantage during temperature
measurements with TCs or RTDs is their non-applicability with automatic loading systems
during manufacturing scale [54]. Wireless solutions (active transponders) are available to
avoid this problem, but they require battery capacity leading to a limited operation time and
risks during sterile production [55].
2.4.1.3 Microbalance
For continuous measurement of mass transfer by sublimation of ice a microbalance sys-
tem can be used. The drying rate and the endpoint of primary drying can be calculated via
weight loss. The sample weight of a vial is low and the differences in weight during drying are
therefore small. The balance also has to work accurately under a wide temperature range be-
tween -50 C and +40 C, as well as vacuum. The construction of a feasible microbalance is
therefore a major challenge. Different attempts have been made to establish a microbalance
system. Pikal et. al. [7] investigated the sublimation rate as a function of freezing rate, thick-
ness of the dried product, residual air pressure, temperature and solute concentration during
isothermal drying of a small sample suspended from a balance arm in a high-vacuum cold
stage. Four different classes of product resistance behavior and evaporation coefficients for
ice were identified. For the monitoring of secondary mass transfer Pikal et. al. [32] adapted
the size of the sample cell of the microbalance to achieve a much larger sample capacity.
By placing a thermocouple into the microbalance, some temperature compensation was also
2.4 Monitoring Technology used for Freeze-Drying 21
possible.
More recent microbalances can also be applied with non-isothermal processes. Roth et.
al. [56] showed that such a microbalance is suitable for endpoint detection of primary drying
by continuous monitoring of the cumulative water loss and the momentary drying rate of
a product in a standard vial within the drying chamber. Furthermore, a microbalance is a
useful tool in the research field as Gieseler and Lee [47, 57, 58] showed. The effects of
vial packing density on the drying rate and primary drying time were determined between
different drying chamber designs and geometries [47]. Furthermore, the product resistance
of different materials was studied [57] and also differences in the drying profile between spray
freeze-dried powders in vials and regular freeze-dried samples were determined [58].
A limitation of such a weighing system is that an application during a sterile process is not
possible [59]. Furthermore, an automatic stoppering is not possible as the microbalance is
larger in the height than the vials. In addition, the vials surrounding the single test vial as
well as the monitored test vial itself are more exposed to radiation from the microbalance
because of their lack of a hexagonal packing arrangement [56]. This leads to accelerated
drying of these samples [48]. Monitoring of secondary drying rates is not possible because
of low differences in weight [60]. The microbalance is a useful tool for laboratory studies, but
not suitable for scale up [48].
2.4.2 Non-invasive Measurements
2.4.2.1 Vacuum Gauges
As well as the monitoring of Tp, the control of Pc is also used for process control. Since
the chamber pressure influences the product temperature, it determines directly the drying
behavior. The pressure differential between the chamber and the vapor pressure of ice at
the sublimation interface is affected by Pc. Thus, this process parameter can be monitored
and maintained at a desired set point during the whole freeze-drying cycle. Three different
types of measurement systems are available: Pirani gauges, capacitance manometers (CM),
and thermocouple vacuum gauges. Vacuum gauges are measuring systems that record
pressures below atmospheric, whereas pressure gauges determine pressures greater than
atmospheric [18].

22 2 The Freeze-Drying Process
With CMs the pressure is metered by the movement of a metal diaphragm (usually inconel)
as caused by collisions of gas molecules [48]. The relative displacement of the diaphragm
from its position of rest provides a pressure measurement constituted by the gas molecules.
The diaphragm has on one side an electrical capacitor that changes its capacitance with the
movement or displacement of the membrane [19]. Figure 2.9 shows the general construction
of the pressure sensor. It is composed of two chambers containing the diaphragm in the
Figure 2.9: Construction of a capacitance manometer [61].
center position [18]. The first is sealed and serves as a reference chamber evacuated and
maintained at low pressures of <0.0013 Pa [19]. The second is open to the vacuum system
and represents the measuring cell. Electrically-insulated plates are mounted as a part of
the electrical capacitor. The pressure difference between the chamber pressure and the ref-
erence cell determines the displacement of the diaphragm and the distance to the insulated
plates. The capacitance of the electrical capacitor varies therefore inversely with the distance
between the plate and the flexible diaphragm. The measurement of Pc is determined from
the resulting voltage. The CM is independent of the gas composition in the chamber, and
a controlled vacuum level remains identical during both primary and secondary drying [22].
CMs provide high accuracy and cover a wide pressure range. They can be used under GMP

2.4 Monitoring Technology used for Freeze-Drying 23
conditions and steam sterilization is possible. The CM is therefore ”the method of choice” for
monitoring of Pc [48].
Pirani or thermocouple vacuum gauges work on the principle of thermal conductivity of
gases. Energy is transmitted from a warm metal filament to the gas phase. A thermocouple
vacuum gauge consists of a power supply heating a platinum wire (filament). Platinum is used
as it has a very low emissivity (0.03-0.1 [26]) and heat loss due to radiation can be neglected.
On this wire a TC is mounted (Figure 2.10). The temperature of the heated platinum filament
Figure 2.10: Construction of a thermocouple gauge [62].
changes with Pc due to its thermal conductivity (i. e. decreasing temperature with increasing
pressure). This temperature variation is recorded by the voltage reading of the TC and from
this the change in chamber pressure can be calculated [19].
The second gauge working on thermal conductivity is the Pirani gauge (Figure 2.11). In
contrast to a thermocouple vacuum gauge, a Pirani consists of two current-carrying platinum
filaments. One serves as a sensor which is enclosed by the vacuum system (sensor filament),
and the other constitutes the reference (reference filament) and is positioned in a separate
chamber evacuated to a pressure <13 mPa. As pictured in Figure 2.11, both filaments are
integrated in a Wheatstone bridge [19]. The resistance of the platinum filament is dependent
on the temperature and its increase leads to a rise in electrical resistance [19]. If the chamber
pressure around the sensor filament approaches the pressure of the reference chamber, the
resistance of the sensor filament equals the resistance of the reference filament and the
output voltage approaches zero. When the chamber pressure surpasses the pressure of the
reference chamber, the temperature and the resistance of the chamber filament decrease

24 2 The Freeze-Drying Process
Figure 2.11: Construction of a Pirani gauge [19].
and an imbalance of the bridge occurs (Rreference > Rsenor). Consequently, an output voltage
can be observed. Due to the consistency of the reference resistance, and the resistances
R(1) and R(2) of the Wheatstone bridge (Figure 2.11), the resulting voltage can be allocated
to the resistance change of the sensor filament. From this Pc can be calculated. Pirani and
thermocouple gauges have a lower accuracy than CMs but are cheaper, more stable, easily
calibrated and have a faster response time [18].
One problem can arise during the chamber pressure measurement with a thermocouple
vacuum gauge or a Pirani is potential oxidation or contamination of the filaments. The emis-
sivity of the surface now increases leading to energy loss by radiation [26]. Should the gauge
become coated by oil or organic material, then an insulating film is generated and the tem-
perature of the filament will tend to be higher resulting in a false low pressure signal [19].
Additionally, the linearity between temperature change and chamber pressure is limited to a
specific range [26].
The thermal conductivity of gases is governed by the gas composition. Calibration of ther-
mocouple vacuum gauges or Pirani gauges is usually performed using nitrogen. The gauges
indicate therefore false pressures in the presence of other gases, since they possess a higher

2.4 Monitoring Technology used for Freeze-Drying 25
(e. g. water vapor) or lower (e. g. argon) thermal conductivity [19]. The partial pressure of
gases varies during freeze-drying in particular at the end of primary drying when the vapor
composition changes from almost exclusively water vapor to mainly air, i. e. nitrogen. The
measured value is therefore higher than the true pressure during primary drying due to the
presence of water vapor. At the end of this process step the value declines because of the
progressive reduction in water vapor [18]. This is a potential problem for scale up or transfers
if different vacuum gauges (Pirani/thermocouple vacuum gauge vs. CM) for chamber pres-
sure control are used. Since the Pirani and the thermocouple vacuum gauges show higher
values at the beginning of primary drying, the set point of pressure is overestimated. Using
this set point with a CM gauge, the pressure of water vapor is higher. The reason for this is
that CMs are not governed by the gas composition and show the true pressure values [18].
2.4.2.2 Comparative Pressure Measurement
To determine the endpoint of primary and secondary drying for the whole batch, a combi-
nation of Pirani and CM (see chapter 2.4.2.1) is used [22, 48]. During primary drying the
gaseous phase consists largely of water vapor from the sublimation process. When the rapid
production of water vapor declines at the end of primary drying, the partial pressure of wa-
ter decreases until the chamber gas is mostly composed of nitrogen. As the Pirani gauge
is calibrated against nitrogen, its pressure values are therefore higher at the beginning of
primary drying (because of the water vapor presence) than those of the CM. The thermal
conductivity of water vapor is ∼1.6-fold higher in comparison to nitrogen [53]. As the com-
position changes at the end of primary drying, the Pirani pressure signal drops to the CM
measurement value and the endpoint is indicated [48].
2.4.2.3 Dew Point Sensor
This method also relies on the changing gas composition in the freeze-drying chamber dur-
ing the cycle. The decreasing concentration of water vapor is measured by the electronic
moisture sensor with output as the dew point of water [22]. The dew point is the temperature
at which the equilibrium vapor pressure of ice achieves the partial pressure of water in the
chamber [48]. A thin aluminum oxide film changes its capacitance by means of water adsorp-
tion at any given partial pressure [53]. This capacitance is converted to a voltage signal that

26 2 The Freeze-Drying Process
reads as the dew point. From this data the endpoint can be estimated the drop of the dew
point signal [48]. The sensor is more sensitive than comparative pressure measurements
because it can determine the presence of residual ice in less than 0.1% of the vials [48]. Fur-
thermore, the electronic moisture sensor can be applied for endpoint detection during bulk
freeze-drying of very small containers, where, for example, a product temperature response
(described in 2.4.1.1) cannot be utilized [63]. The sensor has, however, to be isolated during
steam sterilization by both a valve and a sterilizing filter [48].
2.4.2.4 Pressure Rise Technology
The temperature of the moving sublimation front can be estimated with barometric temper-
ature measurement (BTM). Oetjen and Haseley [21] describe the basic principle as follows.
The drying chamber is isolated from the condenser chamber by closing the connection valve
which interrupts the flow of water vapor from the chamber to the condenser. The pressure
in the chamber rises until the saturation vapor pressure, Psat, is attained. This value is de-
pended on the temperature of the sublimation interface which can be estimated by the water
vapor/ temperature diagram. This technique was further developed by Milton et. al. [64] and
is denoted the manometric temperature measurement (MTM) using closed valve times of up
to 25 s and monitoring the pressure rise in the chamber over that time. As the ice tempera-
ture will increase because of the continuing heat flow, Milton et. al. developed a pressure vs.
time relation, the MTM equation (Equation 2.10)
P (t) = Pice − (Pice − P0) · exp
[−3.461 ·N ·Ap ·Ts
V · (Rp +Rs)· t]+
0.0465 ·Pice ·∆T ·[1− 0.811 · exp(−0.114
Lice
· t)]+X · t,
(2.10)
in which P (t) is the chamber pressure of the time during the experiment, P0 is the chamber
pressure measured before isolation valve closure, N is the total number of product vials, Ap
is the total product area, V is the chamber volume including the duct to the closed separa-
tion valve, Rp + Rs is the total area normalized resistance of product and stopper to water
vapor transport, ∆T is the temperature difference between the sublimation interface and the
product at the vial base (which is dependent on Lice, the thickness of the ice layer), and X is
a constant. This model was further improved by Tang [65, 66].

2.4 Monitoring Technology used for Freeze-Drying 27
A direct determination of Pice and Rp is now possible. As the vapor pressure declines,
the end point of primary drying can be estimated by MTM [48]. The endpoint of secondary
drying is also detectable [65]. The temperature of the ice sublimation interface during primary
drying can also be deduced, as well as the drying rate [48], heat and mass transfer [65], and
the ice thickness [66]. The implementation of MTM offers several advantages. The product
temperature measurement is a non-invasive method and representative for the whole batch
[28]. Moreover, product contamination is unlikely because an operator intervention (e.g.
placement of sensors) is not necessary for product temperature measurement.
The measurement of Tp, however, is problematic as a minimum ice sublimation area is
required for an accurate measurement [48]. Moreover, temperature determination in different
vials is not possible, and only one temperature value can be measured in terms of a system
average which favors the coldest, interior vials [65]. Tp measurement by MTM is therefore
currently thought to be reliable to a value around -35 C to -45 C. These are only reliable
during the first 23
of primary drying due to heterogeneities in drying [48, 65]. As the sublima-
tion process is decelerated while the valve is closed, the self-cooling effect declines resulting
in a higher product temperature [48].
MTM is not the recommended method for concentrated amorphous formulations, since
water reabsorption within the dried layer takes place during the pressure rise. This leads
to a false value of vapor ice pressure and therewith all further calculations are erroneous
[28]. Nevertheless, MTM is a useful process-monitoring tool. This is reflected in the ”Smart
Freeze Drying” system that produces an optimized cycle program. During primary drying this
system monitors the drying process and varies the protocol by means of shelf temperature
and chamber pressure on the basis of user-predefined input variables, if necessary [48].
2.4.2.5 Mass Spectrometry
The principle of mass spectrometry (RGA) is the separation of the analyte components by
means of their mass-to-charge ratio [mq]. For this process the analyte is evaporated (if neces-
sary), ionized and subsequently accelerated by an electric field for the transfer to the analyzer
(e.g. a quadrupole consisting of four parallel arranged electrodes for the segmentation pro-
cess). After separation, the ion current is transmitted to the detector. Here, in dependence of
the concentration and the type of the gas component, a signal is generated, from which the

28 2 The Freeze-Drying Process
gas composition within the lyophilization chamber can be determined [48, 67]. The moisture
content of the product can be related to the partial water vapor pressure. On reaching the
desired residual moisture content the end of secondary drying has been achieved. RGA in-
strumentation is more sensitive than the comparative pressure sensors (see chapter 2.4.2.2)
[19]. Additional applications are also possible, like the detection of leaks in the drying cham-
ber or contamination from residues like vacuum pump oil, cleaning supplies or extractables
from stoppers or formulation components [19]. RGA instrumentation is, however, very ex-
pensive and is not a common technique.

3 Freeze-Drying of Amorphous Materials
3.1 The Amorphous State
The amorphous or glassy state has two main characteristics: the absence of equilibrium
phase changes and an isotropic behavior. These characteristics result from the inter-
particulate arrangement of the material, as illustrated in Figure 3.1. In the crystalline state
crystalline solid amorphous solid gas
heterogeneity of amorphous solid
Figure 3.1: Schematic representation of the structure of a crystalline solid, a gas and anamorphous solid with respect to their heterogeneities. Adapted from [68].
the particles are arranged continuously in a three-dimensional long-range order [69]. This
leads to a discrete phase transition. In the gas phase the molecules are random assembled.
The order of a glassy state, however, is intermediate showing a short-range order between
the long-range order of a crystalline system and the random assembly of the molecules in
the gaseous phase [69, 70]. The inter-atomic distances differ therefore in an amorphous
system which causes bonds with varying intensities. These heterogeneities lead to transient

30 3 Freeze-Drying of Amorphous Materials
phase transitions and different physical properties of amorphous materials in comparison
to their corresponding crystalline states. Some distinct regions (α and β, Figure 3.1) with
different densities, relaxation behavior and residual crystallinity can occur in amorphous ma-
terials [68]. Amorphous materials are thermodynamically unstable and tend to rearrange to
the crystalline state [71]. Common ways to obtain a pharmaceutical amorphous system are
supercooling of the melt, mechanical activation of a crystalline mass, and rapid precipitation
from solution (e. g. during freeze-drying or spray drying) [69].
3.2 Glass Transitions
The glass transition process can be described as using a thermodynamic approach that
considers the changes in enthalpy H and in free volume Vf , or in a thermodynamic approach
that refers to a change in entropy S and a description of a kinetic relaxation process.
3.2.1 Thermodynamic Approach considering Enthalpy and Free
Volume
Hancock and Zografi [69] described the differences between the formation of glassy and
crystalline materials by their changes in enthalpy, H , or in free volume Vf with temperature,
see Figure 3.2. The cooling of a crystalline system from the liquid state to a temperature
lower than the freezing temperature, Tf , leads to a first order phase transition to a thermo-
dynamically stable crystalline state with respect to non-crystalline forms. This exothermic
crystallization process causes a contraction of the system to a regular arrangement of the
molecules. During this process H and Vf decrease to lower values in comparison to a
supercooled liquid or glass. During a rapid cooling through the freezing temperature of a
glass-forming material in the liquid state no crystalline state is formed, since insufficient time
is available for an ordering process. A supercooled liquid is formed and no discontinuities in
H or Vf are observed on crossing Tf . During further cooling the molecular mobility of the
system is reduced [71]. At Tg the system is kinetically unable to stay in the equilibrium state.
Hence, a change to higher values of H and Vf in comparison to the crystalline state and the
formation of a non-equilibrium state occur. The material becomes fixed in the glassy state. In
this system the bonds between molecules are essentially the same compared to those of a

3.2 Glass Transitions 31
Figure 3.2: Schematic depiction of changes in enthalpy, H , or in free volume Vf as a functionof temperature. Adapted from [69].
liquid. Translational and rotational motions (high H) are reduced and vibrational motions (low
H) appear. During the glass forming process a step change in heat capacity, Cp, occurs:
Cp =
(δH
δT
)
p
. (3.1)
Tg is dependent on the cooling rate since a slower reduction in temperature (dashed line)
results in lower values for Vf and H , as shown in Figure 3.2. In this model, the glass transition
is a second order thermodynamic phase transition due to the discontinuity of H and Vf
at the transition point [71]. Inconsistent with this classification is the dependence of the
glass transition on the cooling rate, since a second order thermodynamic transition is rate
independent.
3.2.2 Thermodynamic Approach considering Entropy
The entropy S of an amorphous system at the equilibrium state can be related to Cp:
Cp = T (δS
δT)p. (3.2)

32 3 Freeze-Drying of Amorphous Materials
In a glass the heat capacity arises from vibrational contributions, whereas above Tg additional
configurational degrees of freedom exist. The values of heat capacity above Tg are higher
compared to the values of an amorphous system. A higher S of the system occurs in the
rubbery state than in the glassy state and the glass transition is characterized by a step
change in S [71]. The glass transition can be considered as a thermodynamic requirement
for a supercooled liquid to avoid a fall in the entropy of the supercooled-liquid below the
entropy of a crystalline system at some critical temperature (a violation of the third law of
thermodynamics) [71]. This critical temperature is termed the Kauzmann temperature, TK ,
(Figure 3.2) which defines the lowest possible Tg.
3.2.3 The Kinetic Relaxation Approaches
The glass transition can also be considered as a structural relaxation process, e. g. a reorga-
nization of hydrogen bonds in hydrogen-bonded fluids developed when the liquid is cooled.
The time necessary for this relaxation, the relaxation time τr, is dependent on the tempera-
ture (longer relaxation times with decreasing temperature) [71]. In this model, the velocities
of relaxations are compared to characterize Tg. Above Tg, reorganization processes of hy-
drogen bonds are fast within the observation time, tO (τr < tO). The system behaves like a
liquid and responds to changes in temperature in the timescale of the temperature change.
The system is therefore in equilibrium with the cooling process [71]. Below Tg, however, the
relaxation process is slow with respect to the observation time (τr > tO). Molecular mobility
is reduced and the material takes on the characteristics of a solid. Hence, Tg is defined as
the time point when τr ≈ tO.
A related model to describe the glass transition considers the free volume, Vf , and has
been suggested by Fox et. al. [72, 73] and developed by Turnbull and Cohen [74]. The
basis of this concept is the differentiation between the volume taken up by the molecules
of the constituents, Vocc, and a free volume, Vf , available for movements of the molecules.
Vf consists of voids of varying sizes and positions due to the random movements of the
molecules. It is assumed that diffusion of the molecules through the system is only possible
when Vf is above a critical value. During a temperature decrease both volumes contract since
the configurational structure of the constituents becomes more compact and movements are
retarded. Vf of a glassy system reaches a lower limit independent of further cooling, when

3.2 Glass Transitions 33
glass transition occurs. Afterwards, the molecules are densely packed, the internal mobility is
negligibly small, and no further contraction of Vf by a temperature reduction takes place. The
molecular mobility and the macroscopic fluidity of amorphous systems can be associated
with this relaxation behavior that describes many of the characteristic properties of glassy
materials [71].
3.2.4 Glass transition during Freeze-Drying
During freeze-drying the amorphous state is formed by a high freezing rate. Freeze-
concentration occurs until T ′g is reached. At T ′
g the viscosity increases greatly, the ice crystal
growth stops, and an amorphous glass is formed [26]. In the thermogram a slight change in
the temperature-time profile occurs (Figure 3.3). Nail and Gatlin [26] described the freezing
Figure 3.3: Temperature vs. time during freezing of amorphous solute [26].
behavior of amorphous materials on the basis of the state diagram shown in Figure 3.4. The
different states of an amorphous material are a solution state (upper left area), an ice plus
freeze-concentrated solute state (middle section) and a glassy state (lower right area). The
solution is bordered by two curves, the equilibrium freezing temperature of water (function
of weight fraction of solutes) and the solubility curve of the substance. The intersection of
the lines is the eutectic point indicating the crystallization (dashed vertical line) of interstitial
fluid. Instead of crystallizing at the eutectic point, the amorphous solute remains liquid and

34 3 Freeze-Drying of Amorphous Materials
Figure 3.4: Schematic state diagram of a non-crystallizing solute. Adapted from [75].
the system follows the equilibrium behavior of a liquid (”rubbery state”). With decreasing tem-
perature the viscosity increases due to ice crystal growth and freeze concentration, but the
dynamics of the system decrease. The freeze-concentrated solute is distinguished from the
glass by the solid line. This is the glass transition point of the amorphous solid as a function
of water content. It is an isoviscosity curve representing a viscosity of about 1014 Pa s [26].
When the freeze-concentrated liquid crosses this line a glass is formed.
3.2.5 Temperature Dependence of Viscosity and Relaxation Time
The Arrhenius law is not valid for amorphous systems to predict the temperature dependence
of the viscosity, η, or the relaxation time, τr. The viscosity of amorphous systems near Tg is in
the range of 1012-1014 Pa s. But above Tg these materials show temperature-dependent vis-
cosity values [71]. The magnitude of this temperature dependence varies between different
amorphous materials. Some show a weak temperature dependence and obey the Arrhe-
nius law over a certain temperature range, while others deviate strongly from this behavior.

3.2 Glass Transitions 35
Immediately above Tg, amorphous systems follow the Vogel-Tamman-Fulcher equation:
η = η0 · exp[
B
T − T0
],
τr = τ0 · exp[
B
T − T0
].
(3.3)
B is a constant and T0 is the Vogel-Fulcher temperature which can set equal to TK (see
chapter 3.2.2) [76, 77]. As described at Angell [76], this equation can be written in the form:
η = η0 · exp[D ·T0
T − T0
],
τr = τ0 · exp[D ·T0
T − T0
].
(3.4)
Systems obeying this relationship show a temperature dependent activation energy instead
of the constant activation energy of the Arrhenius relationship. The parameter D (fragility)
is a constant characteristic of each amorphous material and can be used to characterize
the sensitivity of its η and τr to changes in temperature. A changing value of D shows the
change of T0 relatively to Tg [76]Tg
T0
= 1 +D
39.14. (3.5)
With increasing D the difference between Tg and T0 therefore increases (i. e. larger ratio ofTg
T0
). From Equation 3.4 it is apparent that in the region immediately above Tg, when T ≈ Tg,
this larger difference means a smaller temperature dependence of η or τr. The activation
energy and therewith the deviation from Arrhenius behavior is smaller. Angell [76] denoted
materials with large values of D as strong glasses and those with small D-values (less than
10 [78]) as fragile glasses. Strong glasses build a network in the liquid state, obey the
Arrhenius relationship, and feature minimal molecular mobility changes at the glass transition.
The shift in heat capacity during the glass transition is therefore small. Fragile glasses offer
non-directional, non-covalent interactions, and show a distinct reorganization during the glass
transition. They differ from Arrhenius and a distinctive change in Cp can be observed [71].
D therefore indicates the acceleration of a structural relaxation or an increase in η when a
glass approaches and passes through Tg. Since amorphous systems are used as stabilizers
during freeze-drying, the classification into strong and fragile glasses may predict the ability
of an excipient for adequate stabilization. One of the stabilizing effects of an amorphous

36 3 Freeze-Drying of Amorphous Materials
system is glassy immobilization. This hypothesis assumes that a low degradation rate can
be correlated to a high η and a large τr. Hence, fragile glasses such as trehalose and
sucrose (sharp change in η, large τr) are the excipients of choice during freeze-drying and
subsequent storage [38, 79].
3.2.6 Prediction of the Glass Transition Temperature
The most common equation applied to freeze-drying is an adaption of the Gordon-Taylor
equation given in Equation 3.6 which was originally developed for polymer compositions [80]:
Tg(mix) =w1 ·Tg1 +K ·w2 ·Tg2
w1 +K ·w2
. (3.6)
Tg(mix) is the estimated glass transition temperature of the mixture, w1, w2 are weight frac-
tions of the components and Tg1, Tg2 are the glass transition temperatures of each compo-
nent. K is a constant and can be calculated from the densities ρ1, ρ2 of each component and
Tg1,Tg2 via [71, 81, 82]:
K =ρ1 ·Tg1
ρ2 ·Tg2
. (3.7)
If the densities of the components are equal, Equation 3.6 can be simplified to the Fox equa-
tion1
Tg(mix)
=w1
Tg1
+w2
Tg2
, (3.8)
and calculation of the influencing effect of water is possible [72]. Water lowers the glass tran-
sition of the formulation and is therefore a plasticizer [22, 83]. Equation 3.8 is said not to be
accurate for low molecular glass formers such as sugars since the densities will not be equal.
The effect of glycine on T ′g of aqueous sucrose systems, however, has been shown [84]. The
plasticizing effect may be explained by an increased mobility in terms of molecular rotation
by the addition of plasticizing excipients [85]. The most important and potent plasticizer is
water which is apparent in most of the lyos and has a low Tg of -135 C [81, 86]. Hence, even
a slight increase in water content reduces Tg(mix) greatly. The residual water content at the
end of the lyophilization has therefore to be considered to specify the storage temperature.
The influencing effect of some components on the glass transition can be a benefit, since low
glass transition temperatures can be raised by adding a further component with a high glass

3.3 Protein Stabilization 37
transition temperature to improve the drying conditions or storage stability [71].
3.3 Protein Stabilization
Freeze-drying of APIs, especially proteins, is almost always not possible without the addition
of excipients [1, 22, 87]. They account for a correct pH-range, isotonicity, stabilization, and
protection of the API during freeze-drying and on storage. Additives operate specifically (e.
g. antioxidants) or unspecifically like sugars. Unspecific stabilizers can be differentiated by
their effectiveness into cryoprotectants and lyoprotectants.
Cryoprotectants preserve proteins during the liquid state. Representatives of this group
are carbohydrates, especially disaccharides, amino acids and inorganic and organic salts
[87]. Arkawa et. al. [87] summarized the cryoprotective mechanism as an effect of ”prefer-
ential interaction”. In the liquid state, the protein prefers to interact with either the dissolved
excipient or water. In the presence of a cryoprotective agent the protein prefers to interact
with water (”preferential hydration”) and the excipient is excluded from the surface of the pro-
tein (”preferential exclusion”). This leads to an irregular distribution of the stabilizer with a
lower concentration in the area around the protein increasing with distance. The chemical
potentials of the protein and the additive are thereby increased leading to a thermodynam-
ically unfavorable situation. Denaturation would cause a greater contact area between the
protein and the solvent resulting in a more thermodynamically unfavorable state. The protein
remains therefore in its native structure. Since the change in the chemical potentials depends
on the concentration of the excipient, a relatively high amount is necessary for its sufficient
change. Since this stabilizing mechanism depends on the presence of water, a stabilizing
effect does not occur in the dehydration stage of the protein.
Lyoprotectants preserve proteins during both freezing and drying [17]. Two mechanisms
for the stabilizing effect have been suggested in literature, water replacement and glass for-
mation. Water replacement is a direct interaction between the excipient and the protein by
hydrogen bonds [88]. During drying dehydration of the protein occurs which usually leads to
an irreversible unfolding of the protein. A lyoprotectant replaces the dehydrated water and
saturates the free hydrogen binding sites developed during drying [89]. This mechanism re-
quires the amorphous state of the stabilizing agent because sufficient formation of hydrogen

38 3 Freeze-Drying of Amorphous Materials
bonds between a crystalline structure and the protein is not possible. It has been shown
that the protective effect of lyoprotectants is increased with a higher weight ratio of the ex-
cipient to the protein, to form the required monomolecular layer on the protein surface [88].
Furthermore, the extent of possible hydrogen bonds (increasing concentration of stabilizer)
correlates with the degree of structural protection. However, an upper concentration limit
of the stabilizer that can lead to its crystallization has to be considered [87]. An example
for such an upper concentration is a trehalose content of 400 mg/ml [89]. The geometry of
the stabilizer is also important because steric hindrance (e. g. dextran) prevents adequate
hydrogen bonds of the excipient with the protein [90].
A further lyoprotective mechanism is the formation of a highly viscous glass around the
protein during freezing. Molecular mobility and the rate of degradation pathways including
unfolding or aggregation are then slowed down [4, 91]. Some carbohydrates such as tre-
halose or sucrose are preferential used as stabilizers since they act both as cryoprotectants
and lyoprotectants. This is an exception because cryoprotectants will not automatically stabi-
lize the API during drying. The stresses the protein is exposed to as well as the mechanisms
of stabilization in the solid and liquid state are different [4, 87, 89]. Depending on the stabilizer
one, two or more excipients with a stabilizing effect have to be added.
3.4 Product Appearance
Freeze-dried products occasionally show undesired defects. Especially the lyophilization of
fully amorphous cakes can lead to a product with optical defects such as shrinkage, cracking,
and partial or total collapse [5, 54]. Products with optical defects are rejected based on lack
of pharmaceutical elegance [3]. Currently, no classification of different product appearances
exists. Some appearances frequently cited in literature are described in the following with
regard to their possible causes and remedies. To describe the optical defects of lyophilizates
an optimal cake structure has to be defined. The cake structure depends on the compo-
sition, the concentration and the volume of the freeze-drying formulation, the geometry of
the container and several equipment and process parameters that influence heat and mass
transfer [92]. An ”ideal” product, Figure 3.5a, should offer a highly porous and sponge-like
appearance with a volume similar to the previous frozen matrix [19]. Discoloration should

3.4 Product Appearance 39
be avoided and the cake should form a single entity. The cake should provide mechanical
strength to resist a disruption during handling and distribution [1].
b c d e
a f g
h i j kl
m
Freezing
Drying
Formulation
Figure 3.5: Scheme of product defection resulting from freezing, drying or formulation prop-erties: Optical cake structure (a), chimney (b), foam (c), crust or glaze (d), ringformation (e), shrinkage (f), cracking (g), total collapse (h), partial collapse (i), to-tal melt back (j), partial melt back (k), browning (l), poor self-supporting structure(m).
A chimney-like structure in the middle of the cake may be visible on the top surface of
the product, as depicted in Figure 3.5b. This phenomenon is a result of the freezing process.
During ice crystal growth from the bottom to the top, the product is separated into two phases,
a liquid phase in the upper area and a mushy phase in the lower area of the product. The
mushy phase is a mixture of solid and liquid phases. At the interface between them two
modes of convection appear, as illustrated in Figure 3.6. One is developed in the liquid
at the border to the mushy region in which the second form exists. On the basis of these
convections the chimney-like structure is formed [19].
The final product can show a dried foam on the upper surface area (Figure 3.5c) that leads
to a heterogeneous product. This may result in a denaturation of proteins. Its cause is a rapid
filling especially of protein formulations in vials. Foam on the surface is thereby produced and
dries in place during the lyophilization process. An impact of the freezing step is also possible

40 3 Freeze-Drying of Amorphous Materials
Liquid
Mush
Figure 3.6: Streamlines at the interface of liquid and ”mush” during freezing. Adapted from[19].
if the formulation contains dissolved gases at saturation in the interstitial region. These can
be transferred to the cake surface leading to production of a foam [19]. This optical defect can
be avoided by a slowing of the filling step or by purging the formulation with a low-solubility
gas.
A crust or glaze (Figure 3.5d) is characterized by formation of a less porous film on the
surface of the cake. When the ice expands during freezing the remaining liquid is displaced.
Since this forced movement of the liquid is limited by the base and the wall of the container, it
is pushed up to the product’s surface. There it accumulates and freezes to a film. The result
is a product with a heterogeneity in solid’s concentration and an accumulation of proteins at
the surface. This phenomenon appears in formulations with a high content of amorphous
excipients, in containers with small diameters, or at high solute concentrations [7, 18]. The
thin solid film is a greater resistance to mass transfer and may affect the transport of water
vapor from the product [93]. This phenomenon can be reduced by changing of the freezing-
rate, adding of a small amount of ethanol in the formulation, or a selecting other containers.
As depicted in Figure 3.5e the cake can show horizontal layering. The components are
separated from each other during freezing by different freezing behavior of the formulation or
by varying freezing conditions.
A further undesired product appearance is shrinkage, where the cake volume is smaller
than the frozen matrix, as illustrated in Figure 3.5f. During lyophilization the lyo mass con-
tracts and the cake detaches from the inside wall of the vial. The result is a gap between the
vial and the cake. In contrast to microscopic collapse, shrinkage is a macroscopic change in

3.4 Product Appearance 41
cake structure [5]. With cracking (Figure 3.5g) the cake is lacerated in numerous places and
the product shows fissures or cracks inside the dry matrix. The cake usually does not form a
single entity. Cracking and shrinkage can occur either alone or together. During handling and
storage parts of the non-coherent cake may detach from the product in the case of cracking
or the whole cake moves in the vial when shrinkage occurs.
Should Tc be exceeded during primary or secondary drying, different degrees of cake
structure loss can occur ranging from total to partial collapse (Figure 3.5h and 3.5i). By
exceeding Tc at the drying interphase, there is a decrease in the viscosity of the amor-
phous matrix. As a consequence the interstitial concentrate possesses insufficient viscosity
to preserve its own structure without the additional support of the ice crystals. In regions
of sublimating ice the viscous liquid flows into the cavities and the porosity of the cake de-
creases. This process forms a layer that reduces evaporative cooling facilitating a further
increase in Tp. Depending on the magnitude of this process, a collapse with a complete loss
of microstructure is distinguished from a partial collapse where only a certain region of the
cake is affected. Partial collapse is a result of minimally exceeding Tc, for instance during an
improperly designed cycle or in the edge vials of the batch with an increased heat transfer.
Partial collapse occurs in most cases at the base center of the cake. The consequences
of collapse can be a heterogeneity in inter-vial moisture values, longer reconstitution times,
in-process degradation, or a higher residual moisture content [12]. To prevent collapse it is
necessary to determine Tc of the formulation to develop an appropriate process cycle as well
as to monitor Tp during lyophilization.
The freeze-dried product can show melt back (Figure 3.5j) or partial melt back (Figure
3.5k). A lyophilizate with total melt back possesses a ring of redissolved materials in its
lower region. At partial melt back only a small region at the base of the vial is affected.
Melt back occurs during an early start of secondary drying [92]. If the sublimation process
is incomplete, a frozen matrix at the vial base still exists. During the rise of Ts this frozen
matrix melts in a small region (partial melt back) or at the whole base area (total melt back).
As a consequence, the self support of the interstitial region is reduced and a melting of the
product occurs in certain regions [19]. Melt back is cosmetically unacceptable and is termed
”one of the major concerns (...) with regard to cake appearance by the FDA‘” [13]. It can
cause aggregation of the constituents. Due to the lower surface area the reconstitution time

42 3 Freeze-Drying of Amorphous Materials
can be increased. Undissolved substances may lead to a loss of potency. Changes in the
physical form of the drug substance as well as inhomogeneous moisture content are related
to melt back. This may lead to an increased instability and product degradation [13]. To avoid
meltback the end of primary drying has properly to be determined, as described above (see
chapter 2.4).
Browning (Figure 3.5l) is a discoloration of the cake, in most cases from white to yellow or
brown. It occurs in a formulation containing a reducing sugar and a protein or a peptide by
the Maillard reaction. To avoid browning the formulation can be optimized and more gentle
drying conditions can be used.
A lyophilizate can possess a poor self-supporting structure (Figure 3.5m). A solute content
lower than 2% and a high filling volume cause a fine cake structure that provides not enough
strength to withstand the stresses developed during lyophilization or handling. The risk of
physical disruption of the cake into a powder is therefore increased which leads to a possible
loss of the product and the API from the container [19]. If the powder reaches the area be-
tween the stopper and the neck, then stoppering is not possible which may cause insufficient
product stability. An increase in solute concentration or the addition of further excipients is
recommended.

4 Fracture Mechanics of Solids
4.1 Mechanical Behavior of Solids
The mechanical behavior of a material refers to its response to forces [94]. If a load is applied,
a material may deform or break [95]. Under a small stress the deformation of the material
can be elastic and the body will return to its original shape when the load is removed. This
material’s behavior is based on a disturbance of the interatomic equilibrium distances due to
the applied load. This produces a change in the inter-atomic distances and an increase in
the energy state of the system. Restoring forces appear as the atomic union works toward
a return to the original shape of the material. Energy is released and the system returns to
its original energy state. The deformation process is therefore reversible [96]. In the case of
a plastic material behavior on load removal, only a portion of the energy is released and the
body will not revert to its original shape. The deformation is therefore non-reversible [96, 97].
The material behavior can be ascertained by stress-strain tests if the load is static or
changes only slowly with time and is applied uniformly. The forces that act on the area of body
are described as stress. The amount of deformation of a material is described by the strain.
During a stress-strain test the deformation of the specimen (e. g. elongation, compression,
shear deformation, torsion deformation), usually to fracture, is measured as a function of a
gradually increasing load (e. g. nominal tension, compression, shear or torsion). In a tensile
test the output is load or force against the elongation of a specimen [94]. To take geometrical
factors into account, load and elongation are normalized to the parameters stress, σ, and
strain, ǫ. The si unit of stress is MPa (1 MPa =106 N/m2). Strain is dimensionless, but [m/m]

44 4 Fracture Mechanics of Solids
or [%] are often used. It holds for a tensile load:
σ =F
A0
,
ǫ =∆l
l0,
(4.1)
where F is the applied tensile load [N], A0 is the original cross-sectional area before any load
is applied [m2], l0 is the original length before load application [m] and ∆l is the deformation
elongation [m] [94]. Materials are typically not pure elastic or plastic, but rather linear elastic
or nonlinear elastic, elastic-plastic as well as visco-elastic. For a linear elastic material the
stress and strain are proportional to each other and the stress-strain relationship for tension
or compression stress is given by Hooke’s law:
σ = E · ǫ, (4.2)
where E is the Young’s modulus. The si unit of E is GPa (1 GPa =109 N/m2) [96]. E
corresponds to the slope of the stress-strain plot and describes the stiffness of a material or
its resistance to elastic deformation [94]. A stress-strain plot for a linear elastic material is
illustrated in Figure 4.1(a). On release of the load before breakage at point B, the stress-strain
(a) (b)
Figure 4.1: Schematic tensile stress-strain diagram showing (a) linear elastic deformationand (b) nonlinear elastic deformation. σ: stress, ǫ: strain, B: occurrence of break-ing, σB: stress at breaking point, ǫB: deformation at breaking point. Adapted from[94, 97].
curve is reversed and the material returns to its original shape. The area under the curve
represents the absorbed energy. It is in the case of material fracture the energy necessary

4.1 Mechanical Behavior of Solids 45
for the fracture of the material. If the stress-strain curve is not linear (Figure 4.1(b)), E has to
be determined for each specific stress level and the material possesses a nonlinear elastic
behavior [94].
Elastic-plastic material behavior, schematically shown for a tensile stress-strain testing in
Figure 4.2, is characterized by an incipient nonlinear or linear elastic behavior. With increas-
ing stress a transition from reversible elastic to irreversible plastic deformation occurs. The
onset of plastic deformation on microscopic level is termed ”yielding point” (PY , Figure 4.2)
[94]. Above this point the stress increases until at point M the maximum stress is reached.
The stress corresponding to point M is termed ”tensile strength” and displays the maximum
stress a material can withstand without breakage. An application and maintenance of this
stress leads to a fracture of the material at point B [96]. By release of the load before reach-
ing point M, however, the material does not return to its original form. Accordingly, the stress-
strain curve for the unloading process deviates from that of the loading process. Based on
plastic deformation, only a minor elastic recovery (e.g. Figure 4.2 1 → 2) occurs. On the
Figure 4.2: Schematic tensile stress-strain diagram showing elastic-plastic behavior. σ:stress, ǫ: strain, B: occurrence of breaking, σB: stress at breaking point, ǫB:deformation at breaking point, PY : Yielding Point. Adapted from [94].
microscopic level plastic deformation causes the breakage of atomic bonds with the original
neighbors. Since a high amount of atomic movement relative to one another occur, bonds
with new neighbors can now be formed. A return to the original atomic arrangement on load
release is therefore not possible [96].

46 4 Fracture Mechanics of Solids
Viscous behavior is characterized by a non-instantaneous deformation on stress. Hence,
the deformation in response to an applied stress changes with time. This deformation is
neither reversible nor completely recovered after stress release. Amorphous polymers, for
instance, show visco-elastic behavior. This material behavior, depicted in Figure 4.3 for ten-
sile stress, is dependent on temperature, loading rate, and time [97]. A slow and long-lasting
load application (or high temperature condition) leads to progressive elongation and predom-
inantly plastic deformation. A fast and short-time load application (or low temperature condi-
tion), however, leads to a high amount of elastic deformation [97]. The time and temperature
dependence of the material can be quantified with a stress relaxation measurement. During
this experiment a specimen is strained rapidly (e. g. in tension) to a low strain level. The
stress which is necessary to maintain this strain is then measured at a constant temperature.
The time-dependent relaxation modulus, Er(t), is determined by
Er(t) =σ(t)
ǫ0, (4.3)
where σ(t) is the measured time-dependent stress and ǫ0 is the constant strain [94]. The
time and temperature dependence of Er is illustrated in Figure 4.4.
decrease of loading rateincrease in temperature
increase of loading ratedecrease of temperature
Figure 4.3: Schematic tensile stress-strain diagram showing visco-elastic behavior. σ: stress,ǫ: strain. Adapted from [97].
The magnitude of Er decreases with time, owing to molecular relaxation in the specimen.
The curves also run at lower Er value with increasing temperature.

4.2 Fracture Mechanics 47
T2
Log
Er(t
)
Log time
T1
T1<T2
Figure 4.4: Schematic plot of logarithm of relaxation modulus versus logarithm of time.Adapted from [94].
4.2 Fracture Mechanics
4.2.1 Brittle Fracture and Ductile Fracture
Fracture is the separation of a body into at least two pieces as a response to an imposed
stress and at temperatures well below the melting point of the material. To fracture, a split
of inter-atomic bonds at the fracture cross-section is necessary [96]. The possible fracture
modes are ductile and brittle fracture based on the ductility of the material, which is the ability
of a material to undergo plastic deformation (see Figure 4.5). Upon stress, a brittle material
breaks without substantial plastic deformation and a low amount of energy is absorbed before
its fracture. This is termed ”brittle fracture” [94].
A ductile material, however, undergoes extensive plastic deformation with high energy
absorption before fracture. This is referred to as ”ductile fracture” [96]. Ductility is a function
of the strain rate, the stress rate and temperature and is quantified by percent elongation or
percent reduction in cross-sectional area [94].
A fracture process involves crack formation and subsequent crack propagation in response
to an applied stress [94]. With a ductile fracture, extensive plastic deformation occurs at the
tip of the crack (Figure 4.6a) and crack propagation proceeds slowly. The fracture is stable
since no further extension occurs without further applied stress. A brittle fracture occurs

48 4 Fracture Mechanics of Solids
Figure 4.5: Schematic representations of tensile stress-strain behavior for brittle and ductilematerials loaded to fracture. Adapted from [94].
suddenly (Figure 4.6c) and with rapid crack propagation [98]. This fracture is termed unstable
since a crack propagates spontaneously without any further stress application [94]. Ductile
materials are generally tougher than brittle materials as more strain energy is required to
induce a ductile fracture than a brittle fracture [94, 97, 98]. In the case of a highly ductile
a b c
Figure 4.6: Schematic representation of fracture modes (tensile stress) and surface charac-teristics of cylindrical specimen. a: highly ductile fracture, b: moderately ductilefracture, c: brittle fracture. Adapted from [94].
material (Figure 4.6a), plastic deformation occurs after initial elastic deformation when the
yield stress is exceeded. A uniformly-proceeding plastic elongation in combination with a
reduction of the cross section then takes place. Further deformation proceeds predominantly

4.2 Fracture Mechanics 49
at the neck, where finally the fracture occurs [96]. The most common mode is a fracture with
only a moderate amount of necking (Figure 4.6b). In this case small cavities occur in the
cross section area (Figure 4.7b). With continuing deformation an expansion and fusion of
these cavities takes place forming an elliptical crack normal to stress direction. This crack
grow along its major axis with further fusion (Figure 4.7c). In the area around the crack
a fracture then occurs (Figure 4.7d). The final fracture is formed by shear deformation at
an angle of about 45 to the direction of the tensile stress (Figure 4.7e) [96]. The area of
fracture usually shows an irregular and fibrous appearance. A brittle fracture is shown in
a b c d e
Figure 4.7: Schematic representations of a fracture process of ductile materials. Adaptedfrom [94].
Figure 4.6c. The type of brittle fracture is termed ”intergranular” if the fracture runs along
the grain boundaries (Figure 4.8a). A ”transgranular” fracture (Figure 4.8b) runs through the
grains [94]. The direction of the crack is normal to the direction of the applied tensile stress
a b
Figure 4.8: Schematic cross-section profile showing crack propagation. a: intergranular, b:transgranular. Adapted from [94].
and exhibits a flat fracture surface, as illustrated in Figure 4.6c.

50 4 Fracture Mechanics of Solids
4.2.2 The Energy-Balance Approach
A fracture can be initiated or extended if the applied stress exceeds a critical value. Since
atomic bonds must be broken for crack formation, the fracture strength of a material should
be in the range of the atomic binding energy. But the measured fracture strength for most
brittle material is much lower than the fracture strength predicted on the basis of atomic
binding energies [96]. An explanation is the presence of cracks and flaws at the boundary or
within the material. These defects propagate at a maximum stress, σm, that is lower than the
force of the atomic bonds [96]. This maximum stress, σm, can be approximated by modeling
the crack as an elliptical hole through a plate surface positioned normal to the applied stress
(Figure 4.9a):
σm = 2 · σ0 ·√
a
ρt; (4.4)
σ0 is the magnitude of the nominal applied stress, a is the length of a surface crack or half
the length of a crack in the interior. The radius of the curvature of the crack tip is ρt. Equation
4.4 holds for macroscopic internal defects such as voids, sharp corners, and notches in large
structures. Those macroscopic defects as well as microscopic discontinuities are denoted
as stress raisers [94]. At the tip of such a defect the applied stress becomes concentrated,
as demonstrated in Figure 4.9b. Stress concentration means that the stress along the line
X − X ′ increases to its maximum value, σm, as the flaw’s tip is approached. Inglis [99]
calculated in 1913 the pattern of stress concentration around an elliptical hole. His work
was the basis for Griffith to employ an energy-balance approach to define a criterion for
crack propagation [100]. Crack propagation in a completely elastic material proceeds if more
potential energy is released than the energy necessary for the formation of further crack
surfaces. As a result of stress concentration at a surface crack with length a, two triangular
regions each of length a and height h adjacent to the crack are relaxed, as illustrated in
Figure 4.10. According to Griffith the strain energy, U , of these two regions is now released
by crack growth and is given by:
U = − σ2
2E· π · a2, (4.5)
where σ is the nominal tensile stress, and E is Young’s modulus of the elastic solid. The
strain energy released on cracking is consumed partly during the fracture process since two
new surfaces are formed [101]. For the surface energy, S, associated with a crack of length

4.2 Fracture Mechanics 51
x
x
x′
x′2a
a
X X ′
σ0
σ0
ρt
a b
σm
σ0
Str
ess
Position along X −X ′
Figure 4.9: (a) Geometry of surface and internal cracks, (b) schematic stress profile alongthe line X − X ′ in a to demonstrate stress concentration at the tip of a crack.Adapted from [94].
a
h
σ
σ
Figure 4.10: Idealization of unloaded region near crack flanks. Adapted from [101].
a holds:
S = 2 · a · γ, (4.6)
where γ [J/m2] is the specific surface energy and the factor 2 accounts for two surfaces. The
energy required for crack propagation, W , is now the sum of the energy absorbed to create

52 4 Fracture Mechanics of Solids
the new surfaces, S, and the strain energy released by relaxation of the regions adjacent to
the crack, U . In Figure 4.11 the energy curves of S, W , and U are plotted against the crack
length, a. S increases linearly with crack length (Equation 4.6) whereas U increases as the
af
−U
Crack lengthW
S
Ene
rgy
Figure 4.11: Fracture energy balance. Adapted from [101].
square power of crack length (Equation 4.5). After the intersection of W and U the value of
W does not further increase with greater crack length and the crack will therefore become
self-propagating. From this point on the energy release is greater than the energy required
for crack propagation. At the intersection point of W and U it follows that dW/da = 0. Hence,
a critical crack length, af , can be defined by setting the derivative of W to zero (and a = af ):
d(U + S)
da=
dW
da= 2 · γ − σf
2
E· π · af = 0. (4.7)
σf is therefore the stress associated with an imminent fracture. Solving Equation 4.7 for af
gives [94]
af =2 ·E · γπ · σ2
f
. (4.8)
At crack lengths < af any crack propagation requires energy, whereas at crack length > af
energy is released by crack propagation. Equation 4.8 holds for a specimen that is assumed
to be thick relative to the crack length (plane-strain condition). In this case no strain relax-
ation in thickness direction exists. For a thin specimen having full relaxation in the thickness

4.2 Fracture Mechanics 53
direction (plane-stress condition) Equation 4.8 should be modified to:
af =2 ·E · γ
[1− ν2] · π · σ2f
, (4.9)
where ν is the Poisson’s ratio which takes the strain in the thickness direction into account.
Griffith’s work delt with brittle materials. His theory has been modified by Orowan in the
1950s to take the ductility of materials into account [95]. Orowan proposed that even at a
brittle fracture some energy is consumed by plastic deformation that is much greater than γ
and which occurs in the region around the crack [101]. The highest amount of the released
strain energy is therefore absorbed by the energy consumption of plastic flow near the crack
tip, instead of by the creation of new surfaces. Orowan modified Equation 4.8 to:
σf =
√E ·Gc
π · af, (4.10)
where Gc includes the plastic work and replaces 2γ [95].
4.2.3 The Stress Intensity Approach
The formation or propagation of a crack is influenced by the strength and the ductility of
the material and by environmental conditions such as temperature as well as the type and
magnitude of the load [102]. Three fracture modes (I-III) can be defined by the type of loading
with respect to crack orientation, as illustrated in Figure 4.12. Mode I describes a crack that
I II III
Figure 4.12: Fracture modes. I: Opening or tensile mode, II: sliding mode, III: tearing mode[98].
is a result of a nominal tensile stress, σ. With mode II the crack results from a shear stress

54 4 Fracture Mechanics of Solids
normal to the tip of the crack, whereas with mode III the crack is a result of a shear stress
parallel to the tip of the crack [98]. The basis of the stress intensity approach is the occurrence
of stress concentration at the tip of a crack or flaw, as pictured above in Figure 4.9b [102].
To predict the stress field near the tip of a crack, a stress intensity factor, K, is defined. It
can be calculated for a brittle material in dependence of the fracture mode I, II or III. For the
example of a central crack of length 2a in an infinite plate:
KI = Y · σ ·√π · a,
KII = Y · τ ·√π · a, with τ = τxy,
KIII = Y · τ ·√π · a, with τ = τyz,
(4.11)
where the subscript of K denotes the crack opening mode and σ and τ are the stress around
the crack (σ for normal stress and τ for shear stress). The subscript of τ describes the
direction of the shear stress as illustrated in Figure 4.13. Y is a dimensionless factor that
includes the crack and specimen geometries and sizes [94, 102]. For a central crack of
length 2a in an infinite plate it can be set to unity. For an edge crack of a length a in a semi-
infinite plate it is set to 1.12 [103]. K allows a single-parameter description of the processes
aaaax
x
y
y
z
σ0
σ0
(a) (b) (c)
τ
τ
τ
τ
Figure 4.13: Scheme of the directions of σ and τ at (a) Mode I, (b) Mode II and (c) Mode III.
near the crack, i.e. the deformations and stresses are described independent of loading or
the geometries of the specimen and the crack [100]. In literature there are expressions for K
for a large number of different loading and crack geometries.
In Irwin’s fracture analysis values of K are compared with a threshold value, the critical
stress intensity factor, which depends on the fracture mode and is termed KIc, KIIc, or KIIIc

4.3 Fracture of Glassy Materials 55
[101]. Each critical stress intensity factor represents the fracture toughness of the material.
It measures the material’s resistance to brittle fracture containing a crack. KIc is valid for
stress application according to mode I and the governing mode of brittle fracture [101]. In the
case of mode I for a central crack of length 2a in an infinite plate KIc is therefore given by
σf =KIc√π · a. (4.12)
Since KIc depends on the specimen thickness, it is determined for a specimen whose thick-
ness is much greater than the dimensions of the crack. For this specimen geometry only
plane-strain occurs and KIc is a material property [94]. To measure KIc there are standard
test methods developed, for example, by ASTM International [104]. KIc values are also avail-
able in literature [105]. A brittle fracture occurs if the stress intensity factor equals or exceeds
KIc. By using KIc it is possible to calculate a critical crack length at given stress, or a critical
stress at given crack length. Comparison of Equations 4.10 and 4.12 shows the interrelation
between the energy balance approach and the stress intensity approach (a = af ):
σf =KIc√π · a =
√E ·Gc
π · a → K2Ic = E ·Gc. (4.13)
4.3 Fracture of Glassy Materials
Defects of solid materials can be dislocations which are localized lattice distortions [94].
Those lead to a change in the bonding state like different atomic distances in parts of the
lattice. Accordingly tensile stresses or attractive bond forces and compression stresses or
repellent bond forces occur. Those forces promote displacements of atomic rows by rupture
and reformation of atomic bonds [96]. Solid materials may also possess point defects like
vacancies and interstitials, where an atom or a ion is missing in the ordered structure or
is crowded into an interstitial site. If the solid material is composed of long chains with
polymers, for instance, the chain ends or branches in the polymer are considered to be a
point defect, because they are chemically dissimilar to normal chain units and vacancies
can be associated to them [94]. Localized plastic deformation can lead to the formation of
small and interconnected microvoids wherein the molecular chains of the polymer become
oriented and form fibrillar bridges between those microvoids. Upon sufficient load these

56 4 Fracture Mechanics of Solids
bridges elongate and break that causes the microvoids to grow and coalescence and cracks
begin to form (crazing). The basic concept of defects in solids is therefore a deviation of the
system’s long range order or the existence of definite chains. Since a long-range order or
definite chains do not exist in glassy materials this concept cannot be implemented to this
material group.
The material behavior of a glassy system is dependent on its temperature. At low tem-
peratures the glassy material is rigid and plastic deformations are not possible since the
molecules are fixed in their positions. In the glass transition region a deformation is time-
dependent and not totally recoverable by the release of an applied load. The material shows
visco-elastic behavior. At temperature above the glass transition, the material transits to a
rubbery state and finally to a viscous fluid. Since at temperatures below Tg plastic deforma-
tion processes are not possible, a stress concentration can therefore not be relaxed by micro
plastic deformation of a crack’s tip by rounding out notches or stress rearrangements. Hence,
glasses show a brittle material behavior [96]. Possible causes and propagates of stress in
glassy materials can be microcracks, internal pores and moisture [94].

5 Materials and Methods
5.1 Materials
5.1.1 Amorphous Disaccharides
5.1.1.1 D-(+)-trehalose dihydrate
D-(+)-trehalose dihydrate (α,α-trehalose dihydrate) is a non-reducing disaccharide formed
by a 1,1-glucoside bond between two α-glucose molecules [106]. Its chemical structure is
given in Figure 5.1. D-(+)-trehalose dihydrate forms supersaturated liquids and an amor-
phous glass during freezing [20]. It can be found in numerous species such as plants, algae,
bacteria, and insects. These organisms can survive complete dehydration and exist in a state
of anhydrobiosis. This ability can be correlated with the large amount of trehalose present
in this organisms serving as a cryoprotectant [71]. The chemical and physical properties of
trehalose can be found in Table 5.1
Figure 5.1: Structure of D-(+)-trehalose dihydrate [107].
5.1.1.2 D-(+)-sucrose
D-(+)-sucrose is a non-reducing sugar linked via the anomeric carbons of glucose and fruc-
tose [111]. Its chemical structure is illustrated in Figure 5.2. During freezing sucrose forms
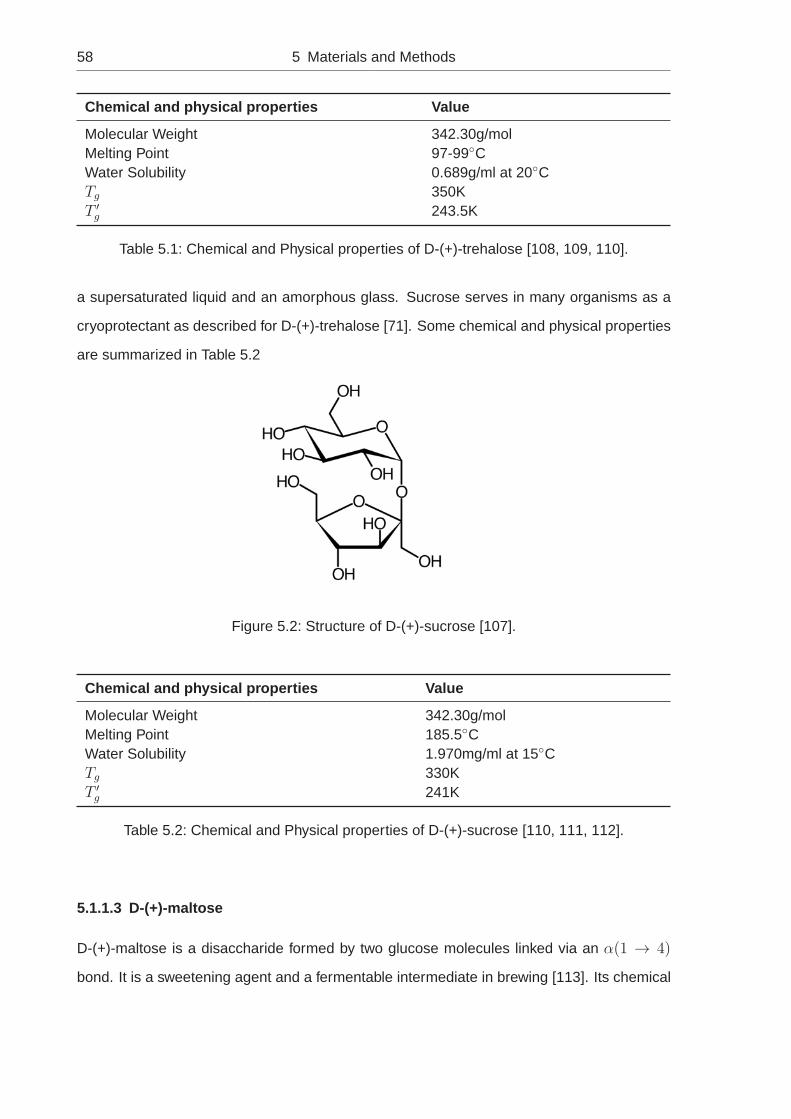
58 5 Materials and Methods
Chemical and physical properties Value
Molecular Weight 342.30g/molMelting Point 97-99CWater Solubility 0.689g/ml at 20CTg 350KT ′g 243.5K
Table 5.1: Chemical and Physical properties of D-(+)-trehalose [108, 109, 110].
a supersaturated liquid and an amorphous glass. Sucrose serves in many organisms as a
cryoprotectant as described for D-(+)-trehalose [71]. Some chemical and physical properties
are summarized in Table 5.2
Figure 5.2: Structure of D-(+)-sucrose [107].
Chemical and physical properties Value
Molecular Weight 342.30g/molMelting Point 185.5CWater Solubility 1.970mg/ml at 15CTg 330KT ′g 241K
Table 5.2: Chemical and Physical properties of D-(+)-sucrose [110, 111, 112].
5.1.1.3 D-(+)-maltose
D-(+)-maltose is a disaccharide formed by two glucose molecules linked via an α(1 → 4)
bond. It is a sweetening agent and a fermentable intermediate in brewing [113]. Its chemical

5.1 Materials 59
structure is given in 5.3. Some chemical and physical properties of D-(+)-maltose are given
in Table 5.3
Figure 5.3: Structure of D-(+)-maltose [114].
Chemical and physical properties Value
Molecular Weight 342.30g/molMelting Point 119-121CWater Solubility 1.080g/mL at 20CTg 316KT ′g 243.5K
Table 5.3: Chemical and Physical properties of D-(+)-maltose [110, 113, 115].
5.1.2 Bovine Serum Albumin (BSA)
BSA is a single polypeptide chain consisting of about 583 amino acid residues and no car-
bohydrates. It has a molecular weight of ∼66,000 Da. The sequence has 17 disulfide bonds,
resulting in 9 loops (see Figure 5.4) [116]. It belongs to the class of albumins which ac-
counts for 56% of the proteins in human plasma. They serve as a carrier for small molecules,
are involved in the protein-buffer system for pH-maintenance in blood and play a role in the
regulation of the water distribution between the plasma and the extra cellular fluid. Serum
albumins are a major factor in pharmacokinetics since they bind APIs and influence therefore
their body distribution [117].
5.1.3 Overview of Excipients and Reagents
All excipients used for the preparation of the freeze-dried formulations during this work are
summarized in Table 5.4. The aqueous solutions for freeze-drying were prepared with double
distilled water from an all-glass apparatus (Destamat Bi 18 T, Heraeus) and filtered through

60 5 Materials and Methods
Figure 5.4: X-ray structure of BSA at 2.25 A resolution [118].
0.2µm filters (Sartorius RC, Sartorius Stedim Biotech GmbH, Goettingen, Germany) before
use. An overview of further substances used in this work is given in Table 5.5.
Substance Lot Number Supplier
Bovine serum albumin 051M1875V Sigma-Aldrich, Steinheim, GermanyGlycerol ≥99,5%D-(+)-Maltose monohydrate 020M1588V Sigma-Aldrich, Steinheim, GermanyPolysorbate 80 72334517 Caesar & Loretz GmbH, Hilden,
GermanyD-(+)-Sucrose 096K0026 Sigma-Aldrich, Steinheim, GermanyD-(+)-Trehalose dihydrat 099K7351 Sigma-Aldrich, Steinheim, GermanyTris pufferan 06042843 Carl Roth GmbH & Co. KG,
Karlsruhe, Germany
Table 5.4: Substances used in this work in alphabetical order.
Reagents and further substances Supplier
Nitrogen (gaseous) Linde, Munich, GermanyNitrogen (liquid) Linde, Munich, Germany
Table 5.5: Reagents and further substances used in this work in alphabetical order.

5.1 Materials 61
5.1.4 Packaging Equipment
Table 5.6 gives an overview of the packaging materials used in this work.
Equipment Description (Item Number), Supplier
Vials 2.0 ml, 2R,Toplyo (1229432), Schott, Muhlheim, Germany10.0 ml, 10R, Toplyo (1229431), Schott, Muhlheim, Germany3.0 ml 2R, ”regular vial” (VC002-13c), Schott, Muhlheim, Germany10.0 ml 10R, ”regular vial” (13041450), Thuringer Pharmaglas & Co. KG,Neuhaus am Rennweg, Germany
Stoppers 13 mm Freeze-drying stoppers, gray silicone B (FDW13) AdelphiHealthcare Packaging, Haywards Heath, West Sussex, UnitedKingdom20 mm Rubber Stopper, RfS (Ready for Sterilization),gray bromobutyl (V9172 FM460), Helvoet Pharma, Karlsbad,Germany
Seals 20 mm Flip-Off (5921-2831), WEST Pharmaceutical Services,Lionville, PA, USA13 mm Flip-Off (FOT13W), Adelphi Healthcare Packaging,Haywards Heath, West Sussex, United Kingdom
Table 5.6: Substances used in this work in alphabetical order.
5.1.4.1 Freeze Dryer
A Martin Christ Delta 1-24 KD freeze-dryer with three usable shelves (0.36 m diameter,
a shelf area of 0.31 m2) and a plastic cover was used for the freeze-drying experiments.
The freeze-dryer was equipped with thermocouples linked to a data logging unit (Omega,
OM-SQ2010). To observe the product temperature thin thermocouples (T-type, PTFE, 36,
Item-number 5SRTC-TT-Tl-36) were used. For the monitoring of the shelf temperature self-
adhesive thermocouples (Omega, SA1-TI-1M-SC) were fixed on the shelf and connected
with the data logging unit.
5.1.4.2 Microbalance
The microbalance (Martin Christ, CWS-40, 2nd edition) is designed to work under extreme
conditions (vacuum, low temperature, high temperature differences) during the lyophilization
process with an accuracy of measurement of ±0.005 g and a weighing range of 0.05 g -
50.0 g. The measuring principle is based on electromagnetic power compensation. Because

62 5 Materials and Methods
of its small size it is possible to place it on a shelf during drying. The balance weighs a single
commercial vial (2R-10R) fixed by a clamped ring on the lifting arm, as pictured in Figure
5.5a. At preprogrammed time intervals the lifting arm lifts the vial for weighing (as illustrated
Figure 5.5: Christ microbalance CWS-40 in the lowered (a) and lifted (b) position.
in Figure 5.5b). Afterward the vial is lowered back on the shelf and released. This procedure
lasts approximately 10 s [56]. The total measuring time accounts for approximately 5 min,
so the duration of interruption of heat transfer across the contact area between the shelf
and the vial bottom caused by weighing is only <2% of the primary drying time. The data
obtained is monitored online via a computer software (WZ-KO 40-6, MTC-HUB), which is
relatively robust to changes in temperature and vacuum as a internal temperature compen-
sation mechanism is integrated. The obtained data is transferred to spreadsheet software.
5.1.5 Camera System
A camera system (Canon EOS 60D, Canon, Krefeld, Germany) with a macro lens (Canon
macro lens EF 100 mm f2.8 USM, Canon, Krefeld, Germany) and a Siocore 48-LED macro
ring light (Siolex GmbH, Lubeck, Germany) was mounted via a tripod (Manfrotto 055XPROB,
Manfrotto Distribution, Cologne, Germany) to the freeze-drying unit. The camera system is
linked to computer software (EOS Utilities 2.9, Canon, Krefeld, Germany) to enable automatic
control. The camera settings used are summarized in Table 5.7. A Canon Digital Ixus 801S
(Canon, Krefeld, Germany) with a Canon zoom lens 3xIS and 8 megapixels was also used.
The manual modus and the macro module were enabled, the flash was turned off, and the
ISO speed was set to 80.

5.2 Freeze-Drying Methods 63
Function Settings
Zone mode AVFocus MF -0.31mAperture 16Drive mode Single shootingShutter speed automaticallyExposure compensation 0Metering mode Spot meteringISO 800Image record quality RAW onlyAmbience MonochromeWhite balance Daylight
Table 5.7: Settings of EOS 60D for the freeze-drying kinetics.
5.2 Freeze-Drying Methods
5.2.1 Endpoint Detection of Shrinkage and Cracking
For the endpoint detection of shrinkage and cracking the fill solution was placed in vials that
were then semi-closed with stoppers on the neck of the vials. The vials were placed in a
hexagonal arrangement on the shelves of the freeze-dryer. At least two vials with thermo-
couples in a center position and one shelf thermocouple were placed on each shelf for tem-
perature monitoring every 10 s. The freeze-drying cycles described (see chapter 5.2.3) were
used unless otherwise stated. After completion of the secondary drying step the lyophilizer
was ventilated with nitrogen gas. The vials were stoppered, sealed and stored in a -80 C re-
frigerator (Heraeus Instruments, Germany). For the quantitative evaluation of shrinkage and
cracking the vials were horizontally cut with a Proxon FBS 240/E (see Figure 5.6) and a dia-
mond grinding wheel to visualize the whole cake and the inner wall of the vial. Subsequently
the vial was placed in a dark cell (Figure 5.7) to ensure uniform illumination conditions and
distances to the camera. This was positioned in the circular cavity of the closed cell. An
image was taken of every freeze-dried cake.

64 5 Materials and Methods
(a) (b)
Figure 5.6: (a): Equipment to horizontally cut the vials, (b) close-up view of the grindingwheel.
Figure 5.7: Dark cell for standardized image taking.
5.2.2 Determination of the Kinetics of Shrinkage and Cracking
To determine the kinetics of shrinkage and cracking during a freeze-drying run some vials
were cut horizontally below the neck (sample vials) as illustrated in Figure 5.8. No stop-
pers were used for these sample vials. All vials were filled with the respective fill solution
and freeze-dried on the second shelf from the top in the Martin Christ Delta 1-24 KD in a
hexagonal arrangement around the microbalance and around seven sample vials in a center
position.
A vial with a cut neck was mounted in the lifting arm of the microbalance to obtain the mo-
mentary water loss during primary drying. The freeze-drier was equipped with thermocouples
connected to the data logging system to monitor the product temperature of a sample vial

5.2 Freeze-Drying Methods 65
Figure 5.8: Horizontal cut of a vial (3.0 ml, 2R, Schott). Left: complete vial, right: horizontallycut vial.
and the shelf temperature. The unusable top shelf was perforated circularly directly above
the cut vials, as illustrated in Figure 5.9. This ensured a radiation shield, but still enabled
Figure 5.9: Circular perforation of the top shelf.
observation of the sample vials by the camera placed vertically above them. Every 10 min
an image (Raw-file, .CR2) was taken. The freeze-drying cycles described in Table 5.8 (see
chapter 5.2.3) were used unless otherwise stated.
5.2.3 Freeze-drying Protocols
The freeze-drying cycles used in this work are summarized in Table 5.8. Vacuum was ap-
plied after freezing (0.04 mbar) and hold during primary and secondary drying. If a two-step
freezing process was included, the freezing protocol was adapted to a ramp at 1 C/min to
5 C hold for 30 min, a ramp at 1 C/min to -5 C hold for 60 min, and a ramp at 0.4 C/min

66 5 Materials and Methods
to -40 C hold for 60 min. An annealing step was performed at -15 C for 8 h with a ramp at
1 C/min. The endpoint of primary drying was determined when the product temperature had
Process name Freezing Ramp to 1 D 1D Ramp to 2 D[C/min] [C/min] [C] [C/min]
1 0.4 0.11 -20 0.152 0.4 0.17 -20 0.153 0.4 0.17 -20 0.734 0.4 0.17 -20 0.245 0.4 0.17 -25 0.156 0.4* 0.17 -20 0.157 0.4*,** 0.17 -20 .015
Table 5.8: Description of the freeze-drying protocols. *A two-step freezing was included; **Anannealing step was included.
reached the shelf temperature. A soak period of 30% was added to this timepoint.
5.3 Analytical Methods
5.3.1 Differential Scanning Calorimetry (DSC)
Thermal transitions of lyophilized cakes and fill solutions were analyzed with a DSC822e
(Mettler Toledo, Gießen, Germany). To purge and dry the measuring cell nitrogen gas was
used. Solid samples of approximately 50 mg (AT 261 DeltaRange, Mettler Toledo) were
sealed in 40µl aluminum pans at room temperature at 0.1% relative humidity within a dry-
air purged glove box. For Tg determination each solid sample was heated and cooled at
5 C/min. To eliminate interference from enthalpic relaxation and to ensure the reversibility
of each run, a second heating scan was performed and used for evaluation [71]. For the
determination of T ′g 30µl of the fill solution was sealed in a 40µl aluminum pan, cooled down
to -80 C at 1 C/min, hold for 5 min and then reheated at 3 C/min to 5 C. The values of
Tg and T ′g as the inflection point of the transitions were calculated with the Mettler STARe
Software.

5.3 Analytical Methods 67
5.3.2 Mercury Porosimetry
The pore distribution of the freeze-dried samples was determined with a Poremaster R© 60
GT, manufactured by Quantachrome GmbH & Co. KG. A short sample cell with an inner
diameter of 2 mm (P/N 74012) with a stem volume of 0.5 cm3 was used. This analytical
technique is based on the intrusion of mercury at pressure into the pores of the sample.
The pore size is determined as a function of the external pressure necessary to force the
liquid into a pore against the opposing surface tension of the liquid. For cylindrical pores the
Washburn equation is valid:
2 · π · r · l · γ · cosΘ = P ·∆V, (5.1)
where r is the radius and l is the length of the pore, γ is the liquid’s surface tension, P is the
pressure and V the volume. The term cosΘ is introduced since the capillary pressure that
inhibits the mercury from pore intrusion acts through the contact angle θ.
Samples of approximately 100 mg of the freeze-dried cake were weighed into a sample
container and placed in the sample cell. This was positioned with its housing in the low
pressure station to perform a low pressure measurement (LP). LP was performed up to a
final pressure of 50 psi. After completion of the analysis the station was re-evacuated and
refilled in preparation for a high pressure analysis (HP). Afterward the sample was transferred
to the HP cavity and the high pressure measurement was performed up to a final pressure of
60000 psi.
5.3.3 Scanning Electron Microscopy (SEM)
The inner and outer microscopic structures of the freeze-dried cakes were investigated with
scanning electron microscopy (SEM). The lyophilizates were carefully taken out of the vial
and broken into smaller pieces. These had the original crack edges in the case of a cracked
sample to characterize the structure from the cracks and the inner structure of the cake.
The pieces were mounted on an aluminum stub G301 (Plano GmbH,Wetzlar, Germany),
Plano), gold-sputtered at 20 mA/5 kV (Hummer JR Techniques, ANATECH, Union City, CA,
USA) and examined on an Amray 1810 T Scanning Electron Microscope (Amray, Bedford,
Massachusetts) at 20 kV with different magnifications.

68 5 Materials and Methods
5.3.4 Texture Analyzer
The hardness of the lyophilizates was measured with a TA.XT.Plus (Stable MicroSystems,
Surrey, United Kingdom) equipped with a 5 kg load cell. A cylindrical, 5 mm-diameter probe
was used. The zero-calibration of the probe was performed with an empty vial. The sample
vial was positioned on the measuring bench and the probe was penetrated vertically in the
middle with a speed of 6 mm/s. The hardness was defined as the measured peak force after
1 mm penetration. The hardness of five lyophilizates of each formulation was determined.
5.3.5 Contact Angle Measurements
To investigate the wetting behavior of the D-(+)-trehalose dihydrate solutions an OCA 20
contact angle measuring device (Dataphysics, Filderstadt, Germany) was used. A contact
angle is the angle that is formed between the solid-liquid and liquid-vapor interface of a
liquid drop on a solid surface. For the experiments a small drop of each formulation was
positioned on a microscope slide (Thermo Scientific, Menzel-Glaser, Menzel GmbH & Co
KG, Braunschweig, Germany) at room temperature in front of the camera (”sessile drop”
method). The drop was focused and zoomed in by the camera to obtain a large field of
view. An image was taken and the SCA 20 software (Dataphysics, Filderstadt, Germany)
was used to evaluate the contact angle. The basis and the shape of the drop were therefore
manually defined and the contact angle was automatically calculated by the software. To
obtain the contact angle of a solution on a Toplyo R© vial, its bottom area was used instead of
a microscope slide.
5.3.6 µ-CT-Imaging Analysis
Micro Computed Tomography (µ-CT) analysis offers a three-dimensional method to exam-
ine non-destructively the inner structure, the path of the cracks, the volume of the cracks,
and the volume of the whole cake structure. The high resolution scanner Forbild R© devel-
oped at the Institute of Medical Physics (Erlangen, Germany) consists of a microfocus X-ray
tube, a two-dimensional, low area noise detector (flat detector) and a rotating sample holder,
as illustrated in Figure 5.10 [119]. The freeze-dried cake was left in the 2R-vial and stabi-
lized by styrofoam to prevent cake movement due to its shrinkage. The use of styrofoam is

5.3 Analytical Methods 69
Figure 5.10: µ-CT-Scanner developed at the Institute of Medical Physics, Erlangen, Germany[119].
interference-free since it shows nearly the same X-ray absorption as air. For this fixation the
vial was opened and a piece of styrofoam was clamped between the cake and the stopper.
To obtain a 3D-Image of the lyophilized cake two steps were necessary (Figure 5.11). The
first consisted of data acquisition by the X-ray scanning process (1) to receive several records
so-called ”projections” (2) of the sample. In the second step those projections were combined
to a 3D-data set (3), the stack. This stack-building process is termed ”reconstruction”. For
X-ray tube
Flat detectorSample
StopperBalk-like styrofoam stilit
(2) Projections (3) Reconstruction(1) Scanning
Figure 5.11: µ-CT-analysis flow chart.
the scanning process the sample was placed on the sample holder (rotation table) upside
down to allow the X-ray beam to penetrate the whole sample. The X-rays were absorbed by
the solid material, but not by the air within the pores. A power of 10 W and a high voltage

70 5 Materials and Methods
of 40 kV were used for the scans sufficient for carbohydrates with a low weakening behav-
ior. A mechanical shutter (0.5 mm aluminum-plate) was fixed to limit exposure (photons not
affecting the measurement result were retained). The distance between tube-to-object and
tube-to-detector were adjusted to the sample size and its position was fixed. All scanner ele-
ments were controlled by computer software and a volumetric scanning was carried out by a
single rotation of the sample around its y-axis. During this rotation the sample was scanned
horizontally by the X-ray beam from 2880 directions, evenly distributed in a 360 circle. The
radiogram was recorded by the flat detector. This measurement setup is deviant from the
typical gantry rotation measuring method where the X-ray tube and the detector rotate and
the sample holder is fixed. The duration for one scan was 2 h. The flat detector has an active
area with a width of 1536 pixel and a height of 864 pixel so that a maximum of 864 2D-slices
of the sample volume could be recorded during the whole scan.
During the subsequent µ-reconstruction process the single projections were combined to
obtain the density distribution of the sample in a 3D data set. The volume of the samples
scanned had the dimensions of 400-500 slices and a range of 1250x1250-1400x1400 pixels
for every slice. A spatial resolution of 10µm was achieved. One voxel (three-dimensional
pixel) had the size of 10x10x10µm3. The stacks of the lyophilizates were analyzed as de-
scribed in 5.4.3 to obtain the 3D cake volume and the 3D crack volume. The measurement of
principle is as follows: The X-ray beam that penetrates the sample consists of photons with
an energy in the range of 0keV up to 40keV. During penetration the sample interacts with the
photons. In dependence of the photons energy (the higher energy of a photon the higher
the penetration power and therewith a higher achieved depth in the sample) and the material
behavior of the sample, the photons were either absorbed or no absorption takes place. In
the case of absorption the photons were removed from the beam and the detector registers
a lower number of photons as well as a lower photon energy in comparison to a beam with-
out photon removal by absorption. If no interaction occurs the beam falls unhindered on the
detector. As a consequence brightness (intensity) differences in levels of gray can be seen
in the projection.

5.4 Image Evaluation 71
5.3.7 Ring Tensiometry
With the Kruss Digital Tensiometer K 10 ST (Kruss GmbH, Hamburg, Germany) the equilib-
rium interfacial tension was measured. A platinum/iridium ring, annealed after each measure-
ment was used. 20 ml of aqueous solutions were investigated at 25±0.5 C. Each solution
was equilibrated for 180 min before measurement.
5.4 Image Evaluation
5.4.1 Image Evaluation of the Endpoint-Detection
For endpoint detection the images of the freeze-dried cake upper surface were evaluated.
The inner area of the vial, AI , was determined with the circle tool and the top face area of
the whole cake, AF , with the ”contour tool” of Axio Vision software (release 4.8.2, Carl Zeiss
Vision GmbH, Aalen, Germany). In the case of a circular cake surface the crack area was
determined with a Matlab script (MathWorks R©, Inc., Ismaning, Germany). For an irregular
cake surface the crack area was determined with the ”auto measure” module of Axio Vision
(Carl Zeiss Vision GmbH, Aalen, Germany). A standardized measuring program was created
containing defaults for image processing such as brightness, contrast and filters as well as
segmentation conditions. The shrinkage of the freeze-dried cake was calculated as
Shrinkage[%] = 100%− AF · 100%AI
. (5.2)
The cracking of the cake was defined in % of the crack area AC to AF .
5.4.2 Image Evaluation of the Kinetics
The brightness of each image (RAW-file (.CR2) obtained during the freeze-drying cycle was
initially normalized against each of the other images regarding its brightness by Digital Photo
Professional (Canon, Krefeld, Germany) and converted to the Tagged Image File format
(.TIF). For the image evaluation with Avio Vision software (release 4.8.2, Carl Zeiss Vision
GmbH, Aalen, Germany) the ”auto measure” module (Carl Zeiss Vision GmbH, Aalen, Ger-
many) was used. The measuring program was adapted for each image to account for fluc-

72 5 Materials and Methods
tuations in contrast and any reflections of the lyophilization equipment (shelf, microbalance).
Shrinkage and cracking were calculated, as described in 5.4.1.
5.4.3 Image Evaluation of the µ-CT-Reconstructions
The volumes of the samples received by the µ-CT-analysis were analyzed with MIAF-
software (developed at the Institute of Medical Physics in Erlangen) at the Institute of Medical
Physics in Erlangen. The volumes of the whole cake and of the cracks were determined for
each slice of the stack. The overall cracking of the freeze-dried cake in % of the whole
cracking volume to the whole cake volume was calculated, as described in 5.4.1.

6 Results
6.1 Endpoint Evaluation Method
The development of the complex system developed in this work is first given, before consid-
ering the application to various freeze-drying experiments.
6.1.1 Development of the Image Evaluation Method
6.1.1.1 Standardized Picture Taking
To quantify the amount of shrinkage and cracking of the lyophilizate a focused image is
required showing the whole cake and the complete inside wall of the vial in two dimensions.
Pictures taken through the neck of the vial are shown Figure 6.1a. The neck of the vial
obstructs the view of the cake’s complete outline and of the inside wall of the vial. Another
problem is incorrect focus of the cake (Figure 6.1b). Figure 6.1c shows the influence of
uncontrolled exposure to light on the laboratory bench. In this case lateral exposure to light
a b c
Figure 6.1: Images of freeze-dried D-(+)-trehalose dihydrate with a: obstructed view, b: in-correct focus, c: uncontrolled exposure to light.
occurs in the upper cake region. The cracks in this region appear therefore brighter compared
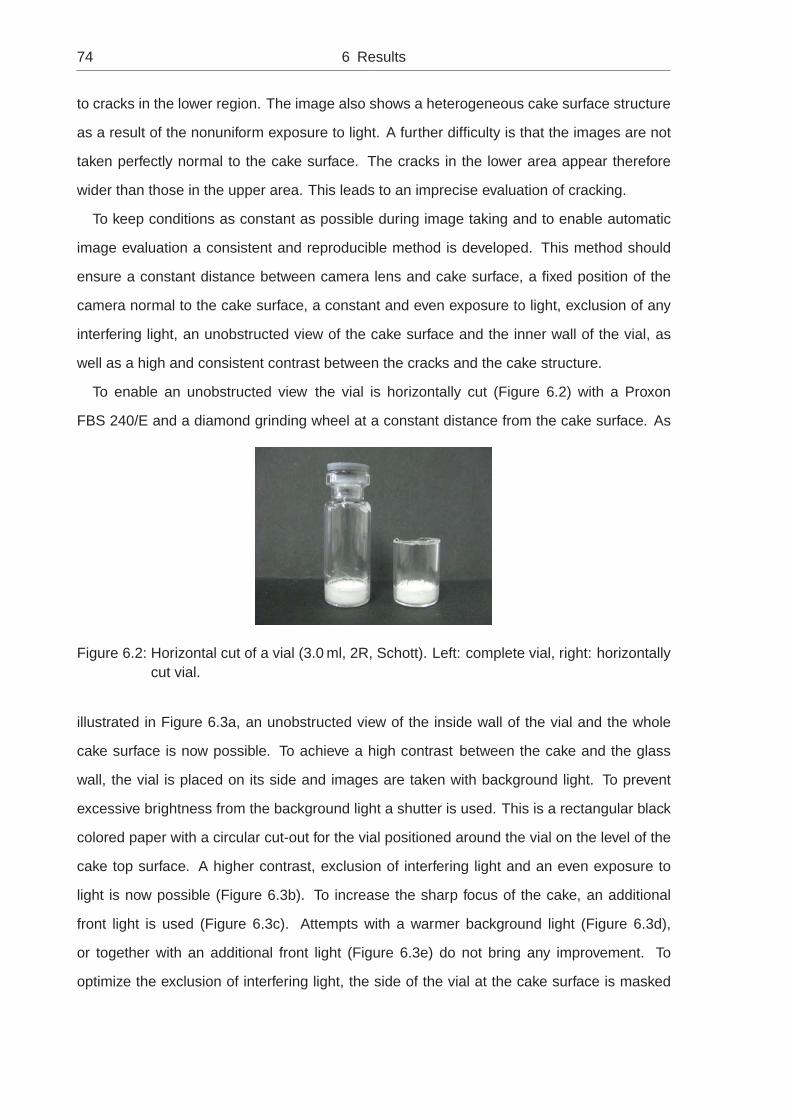
74 6 Results
to cracks in the lower region. The image also shows a heterogeneous cake surface structure
as a result of the nonuniform exposure to light. A further difficulty is that the images are not
taken perfectly normal to the cake surface. The cracks in the lower area appear therefore
wider than those in the upper area. This leads to an imprecise evaluation of cracking.
To keep conditions as constant as possible during image taking and to enable automatic
image evaluation a consistent and reproducible method is developed. This method should
ensure a constant distance between camera lens and cake surface, a fixed position of the
camera normal to the cake surface, a constant and even exposure to light, exclusion of any
interfering light, an unobstructed view of the cake surface and the inner wall of the vial, as
well as a high and consistent contrast between the cracks and the cake structure.
To enable an unobstructed view the vial is horizontally cut (Figure 6.2) with a Proxon
FBS 240/E and a diamond grinding wheel at a constant distance from the cake surface. As
Figure 6.2: Horizontal cut of a vial (3.0 ml, 2R, Schott). Left: complete vial, right: horizontallycut vial.
illustrated in Figure 6.3a, an unobstructed view of the inside wall of the vial and the whole
cake surface is now possible. To achieve a high contrast between the cake and the glass
wall, the vial is placed on its side and images are taken with background light. To prevent
excessive brightness from the background light a shutter is used. This is a rectangular black
colored paper with a circular cut-out for the vial positioned around the vial on the level of the
cake top surface. A higher contrast, exclusion of interfering light and an even exposure to
light is now possible (Figure 6.3b). To increase the sharp focus of the cake, an additional
front light is used (Figure 6.3c). Attempts with a warmer background light (Figure 6.3d),
or together with an additional front light (Figure 6.3e) do not bring any improvement. To
optimize the exclusion of interfering light, the side of the vial at the cake surface is masked

6.1 Endpoint Evaluation Method 75
a b c d
e f g h
Figure 6.3: Images of lyophilizates of the development of the standardized picture taking. a:only shutter, b: shutter and background light, c: shutter, background light, addi-tional front light, d: shutter, warm background light, e: shutter, warm backgroundlight, additional front light, f: shutter, warm background light, mask, g: LED back-ground light, front light, h: LED Background light, shutter, taken in the dark cell.
with a lightproof adhesive tape to ensure exposure only to light from the bottom of the vial
(Figure 6.3f). This leads to a strong darkening effect without any decrease in sharpness and
contrast. The best contrast is achieved by the use of background light emitting diodes (LED)
in combination with front light (Figure 6.3g).
a b c d
Figure 6.4: Images of lyophilizates of the development of the standardized picture taking.a: without modification b: shutter and warm background light, c: shutter, LEDbackground light, additional front light, d: LED Background light, shutter, taken inthe dark cell.
It is also necessary to achieve a high contrast between cake and any cracks present at
its surface. Figure 6.4b in comparison to Figure 6.4a shows that background light results in
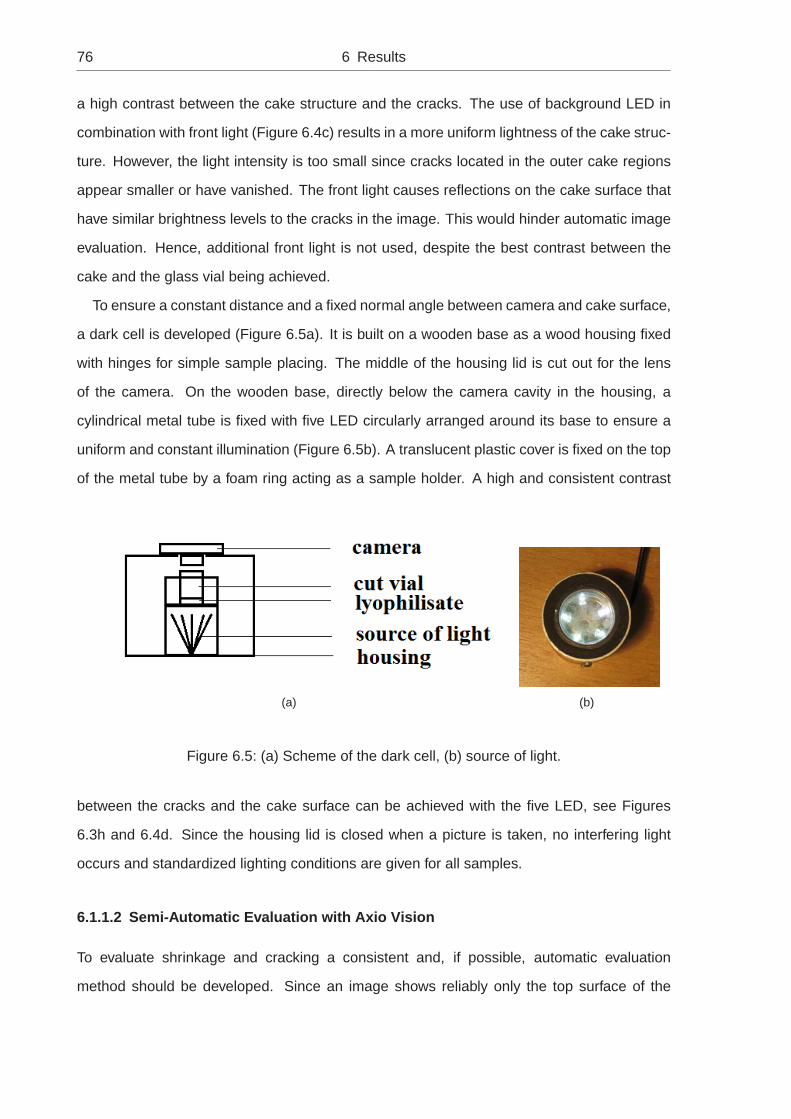
76 6 Results
a high contrast between the cake structure and the cracks. The use of background LED in
combination with front light (Figure 6.4c) results in a more uniform lightness of the cake struc-
ture. However, the light intensity is too small since cracks located in the outer cake regions
appear smaller or have vanished. The front light causes reflections on the cake surface that
have similar brightness levels to the cracks in the image. This would hinder automatic image
evaluation. Hence, additional front light is not used, despite the best contrast between the
cake and the glass vial being achieved.
To ensure a constant distance and a fixed normal angle between camera and cake surface,
a dark cell is developed (Figure 6.5a). It is built on a wooden base as a wood housing fixed
with hinges for simple sample placing. The middle of the housing lid is cut out for the lens
of the camera. On the wooden base, directly below the camera cavity in the housing, a
cylindrical metal tube is fixed with five LED circularly arranged around its base to ensure a
uniform and constant illumination (Figure 6.5b). A translucent plastic cover is fixed on the top
of the metal tube by a foam ring acting as a sample holder. A high and consistent contrast
(a) (b)
Figure 6.5: (a) Scheme of the dark cell, (b) source of light.
between the cracks and the cake surface can be achieved with the five LED, see Figures
6.3h and 6.4d. Since the housing lid is closed when a picture is taken, no interfering light
occurs and standardized lighting conditions are given for all samples.
6.1.1.2 Semi-Automatic Evaluation with Axio Vision
To evaluate shrinkage and cracking a consistent and, if possible, automatic evaluation
method should be developed. Since an image shows reliably only the top surface of the

6.1 Endpoint Evaluation Method 77
cake, the evaluation is limited to a 2D analysis. The basis of the image analysis is the eval-
uation of the number of pixels belonging to the crack area, AC , for cracking, the number of
pixels of the top surface of the whole cake, AF , and the number of pixels of the inner area of
the glass vial cross-section, AI , for shrinkage.
For the determination of AI the ”circle measure” tool of Axio Vision is used. Marks left by
the cake on the inner wall of the vial are used as a reference point (Figure 6.6). Axio Vision
calculates the radius of the defined circle in pixels to allow calculation of AI . AF is evaluated
Figure 6.6: Evaluation of AI (white line) and AF (black line) of a sample with a circular cakestructure.
for a circular cake in the same way (Figure 6.6). In the case of a non-circular cake profile
(Figure 6.7a, black line compared to white line) the ”contour measure” tool is used. A manual
border is drawn along the cake’s contour (Figure 6.7a, white line) and the cake area in pixel2
is calculated by the software. For the sample shown in Figure 6.7a an area of 962432 pixel2
(= 22% shrinkage) is obtained for AF with the ”contour measure” tool. If the cake area of this
sample is evaluated with the ”circle measure” tool a value of only 19% shrinkage is obtained,
illustrating the importance of measuring contour correctly. In this example the cake shows
only a small deviation from a circular shape, but a large measuring error is made by using
the ”circle measure” tool.
In Figure 6.7a the cake detachment from the vial wall is complete. In the majority of cases
parts of the cake remained attached to the vial wall, as illustrated in Figure 6.7b (bottom
of the image). In Figure 6.8a the cake is lacerated into seven regions. This necessitates

78 6 Results
(a) (b)
Figure 6.7: (a): Non-circular cake structure, (b) Incomplete cake detachment.
a standardized method to define whether the fragment that remains attached to the glass
wall is either allocated to AF or can be neglected. A threshold is defined as the percentage
of a fragment’s width to the radius of the whole cake as determined from 30 images. A
fragment is defined as a piece of the cake that has no connection to the intact cake structure.
Figure 6.8b shows a cake with two apparent fragments, 1 and 2. The regions marked with
black rectangles show, however, that the fragments are connected to the intact cake and are
therefore not considered as fragments. For each image the area of the cake fragments, Af ,
and their major width, lm, is determined, see Figure 6.8a. Six fragments are identified, each
(a) (b)
Figure 6.8: (a): Evaluation of a threshold value (b): Definition of fragments.

6.1 Endpoint Evaluation Method 79
numbered in black. Each fragment is completely detached from the intact cake structure,
numbered 7 in white. The lm of each fragment, its area, Af , and the area of the intact
cake, AF , without any fragments, are evaluated for each image, given in Table 6.1 for Figure
6.8a. AF , marked with the thick white line, is determined as 786159.5 pixel2. To obtain the
percentage of the fragment’s major width to the radius of the whole cake, R%, the radius of
a circle with the same area as AF is determined (500.24 pixel2 for Figure 6.8a). For every
fragment its percentage area to AF , A%, and R% is determined, see Table 6.1.
Fragment Major width of Fragment area Af Percentage Percentagenumber the fragment lm [Pixel 2] width, R% area, A%
1 234.88 72972.50 46.95% 9.28%2 131.47 38671.00 26.28% 4.91%3 63.80 20097.50 12.75% 2.55%4 41.59 7562.50 8.31% 0.96%5 121.17 36370.50 24.22% 4.63%6 97.62 34992.00 19.51% 4.45%7 786159.50
Table 6.1: Values of the fragments of Figure 6.8a.
The results of this fragment analysis (n=37) determine whether a fragment belongs to AF
or is neglected. The mean value of lm of the fragments for the example in Figure 6.9 is 3
Figure 6.9: Evaluation of narrow fragments.
pixel (n=37). These fragments in this image are very small and barely detectable. This area
of 3 pixel is therefore selected as the threshold value. Since the mean value of the radius
of AI for the 30 images is 650 pixel, fragments with a width of 3 pixel account for 12233.94

80 6 Results
pixel2. The mean value of AF of the 30 images is 961465.46 pixel2, leaving A% as 1.27%,
the lower threshold for fragment detection.
Af and lm as well as A% and R% are evaluated for all 30 images and their A% values are
compared with the threshold value. Among the fragments included in AF by the threshold,
the smallest R% is 7.40%. Hence, the threshold for R% for fragments whether to be included
or not is set to 7%. On the basis of this threshold all fragments of the image given in Figure
6.8a have to be included in the calculation of AF since the percentage width of each fragment
is greater than the threshold value of 7%. The applicable region of AF is therefore given by
the black line in Figure 6.8a. This also shows the treatment of the fragments. The whole
fragment is included and the border between fragment and cake is generated perpendicular
to the glass wall at the end of each fragment.
For the evaluation of AC the Axio Vision’s ”auto-measure” module is used. The region of
interest is defined so as to minimize the size of the image (Figure 6.10a). Then the module is
started using a measuring program suitable for all images. AC cannot, however, be defined
correctly, as illustrated by the unsatisfactory result for outlining cracks in Figure 6.10b. Due
to the background light all images show brighter values at the edge of the cake compared
to those in the middle. A threshold that satisfactory captures and outlines the cracks in the
middle of the cake falsely includes pixels of the cake structure in the cake’s edge regions
as well. Furthermore, the image shows bright regions in the cake’s middle due to its porous
structure, which are incorrectly included (numerous red dots in Figure 6.10b). The bright
regions outside the cake structure that arise from the background light are included to the
crack area as well.
To solve this problem the contour evaluated by the determination of AF (Figure 6.10c,
green line) is used, since along this line separate regions are defined by the threshold pro-
cess. In the regions marked with a rectangle in Figure 6.10d where the cracks run to the
edge, a manual separation between crack and outer bright regions with the ”separator” tool
is necessary. In all other edge regions the separation is carried out automatically along the
contour, so that the outer area is manually deleted, as shown in Figure 6.10e. The rectangles
in this figure show small regions that are not deleted in this separation step since they are
not connected to the large outer area. As these small regions are clearly located outside
the cake structure, they must be deleted manually. The outlined crack area shown in Fig-
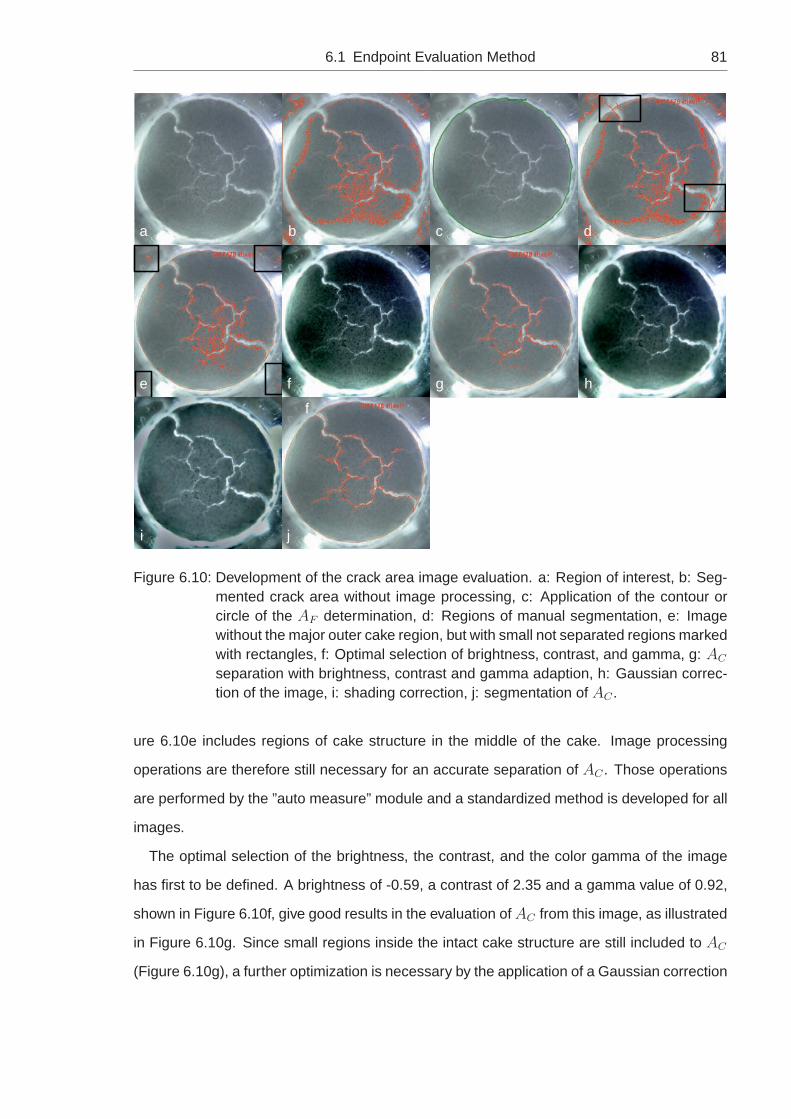
6.1 Endpoint Evaluation Method 81
a b c d
e f
f
g h
i j
Figure 6.10: Development of the crack area image evaluation. a: Region of interest, b: Seg-mented crack area without image processing, c: Application of the contour orcircle of the AF determination, d: Regions of manual segmentation, e: Imagewithout the major outer cake region, but with small not separated regions markedwith rectangles, f: Optimal selection of brightness, contrast, and gamma, g: AC
separation with brightness, contrast and gamma adaption, h: Gaussian correc-tion of the image, i: shading correction, j: segmentation of AC .
ure 6.10e includes regions of cake structure in the middle of the cake. Image processing
operations are therefore still necessary for an accurate separation of AC . Those operations
are performed by the ”auto measure” module and a standardized method is developed for all
images.
The optimal selection of the brightness, the contrast, and the color gamma of the image
has first to be defined. A brightness of -0.59, a contrast of 2.35 and a gamma value of 0.92,
shown in Figure 6.10f, give good results in the evaluation of AC from this image, as illustrated
in Figure 6.10g. Since small regions inside the intact cake structure are still included to AC
(Figure 6.10g), a further optimization is necessary by the application of a Gaussian correction

82 6 Results
given in Figure 6.10h. The Gaussian filter used is a linear technique working via convolution.
During convolution the value of any given pixel in the output image is given by the weighted
sum of neighboring pixel values in the input image [120]. The neighborhood is normally
a rectangle of given size (e. g. 3x3, 5x5) and the pixel itself can be included or excluded.
The Gaussian filter reduces noise in the images and has therefore a smoothing effect. The
decisive factor of this filter is the variance, σ, which controls the degree of smoothing. A large
value of σ leads to a large smoothing of the image [120]. For the evaluation of AC the σ value
is intuitively set to 20. The ”auto measure” module furthermore contains a shading correction
to balance an uneven brightness gradient. A satisfactory balance is possible by a shading
correction of 4, as illustrated in Figure 6.10i. With all these corrections the evaluation of AC
is possible, as shown in Figure 6.10j. This is the best result achieved.
6.1.1.3 Automatic Evaluation with Matlab
For a complete automatic evaluation of AC a Matlab program is used. An image is loaded in
the form of a (i,j)-matrix in which each entry represents one pixel of an image. The values of
i and j give the information of the location of each pixel, where i = rows and j = columns. In
a gray-scale image each entry contains the intensity of the pixel in the image. There are two
classes for the representation of the number that gives the brightness of the pixels. In the
”double” data type the intensities are given as a floating number between 0 and 1, at which
the value 0 corresponds to black and the value of 1 corresponds to white. In the ”uint8” class
an integer between 0 and 255 is used, where the value of 0 corresponds to black and 255 to
white. Since many mathematical functions can only be applied to the double data class, the
image has to be converted in Matlab to ”double”. In a color image (RGB-image) the intensity
of each pixel is given by three channels, a red, a green and a blue one. It is therefore given
by three matrices where each matrix corresponds to one of the three colors and contains the
information of the composition of each pixel. In Matlab every pixel can therefore be identified
by using a (i,j,z) matrix, where z contains the information of the red component (z = 1), of
the green component (z = 2) and the blue component (z = 3).
After the conversion to ”double” the pixels belonging to the cake are defined to neglect
pixels located outside the cake area. This lets the program run faster due to the lower data
volume. To identify the pixels of the image belonging to the cake area, AF , Axio Vision is

6.1 Endpoint Evaluation Method 83
used. AF is defined by the ”circle measure” tool, as described in 6.1.1.2. The coordinates
of the midpoint of this circle and its radius are identified and used in Matlab for a reference
point given by the coordinates (mx/my).
In a first step every pixel with an x-value and a y-value not obeying the following equation
is excluded for a rough definition of the cake area of interest:
mx− radius < x < mx+ radius
my − radius < y < mx+ radius(6.1)
The reference point is the midpoint of a square whose half-height equals the radius of the
cake. The image section included for the evaluation during this step is shown in Figure 6.11.
By using the Pythagoras’ theorem the squared distance of each pixel to the reference point
(a) (b)
Figure 6.11: (a): Sample Image, (b) Image section included for the evaluation.
is calculated and compared with the squared radius. If the sum of both squared distances
(x-direction and y-direction) exceeds the squared radius, the pixel is located outside of the
circular cake area and its value is set to ”-1”. With an ”if/else” function the pixels belonging
only to AF can now be selected. For further operations on each pixel value an averaged value
of the three z-channels (red, green, blue) is used. Figure 6.12 shows the red (a), the green
(b), and the blue (c) channel in a 3D shaded surface plot from the z components (color data),
with the height z as a single-valued function defined over a rectangular grid. The color of z is
proportional to the surface height. To enable automatic image evaluation, a flexible threshold
is necessary to account for differences between all images. The threshold is therefore linked

84 6 Results
(a) (b)
(c)
Figure 6.12: (a): Red component, (b) Green component, (c) Blue component.
to the mean color value of the cake, mc, and is calculated by the mean value of all pixel
values with a value 6= 1. To account for the brighter pixel values at the edge of the cake
a polyfit function is included. All pixels of each row belonging to the cake area (6=1) are
written in a row vector and the numbers of entries are counted. With the ”polyfit” function
a fitting polynomial of fourth order is produced and used to fit every row with the ”polyval”
function. From each fitted value, the mean color value of the cake area is subtracted. This
fitting procedure (polyfit, polyval) is performed for the columns of the cake area as well.
At this stage all pixel values (6= 1) are compared with the threshold value, taken as
1.15 ·mc. A pixel value >1.15 ·mc is defined as belonging to the crack; a pixel value <mc
as a pixel of the cake. The cracking in % is calculated from the sum of the crack pixels and
the sum of the cake pixels already calculated for mc. An example of a separated cake area
is given in Figure 6.13. With the Matlab program automatic rapid evaluation of the AC of

6.1 Endpoint Evaluation Method 85
Figure 6.13: Separated crack area in red, cake area in yellow.
numerous images without any operator intervention is possible. An evaluation of shrinkage,
however, is not possible and must be performed manually with Axio Vision. Moreover, the
evaluation of sample images with a non-circular cake structure must also be done with Axio
Vision because of the uneven cake shape and the fragment problem described in 6.1.1.2.
6.1.2 Statistical Comparison between Axio Vision and Matlab
D-(+)-trehalose dihydrate (hereafter referred to ”trehalose”) solutions in four different concen-
trations (7.5%, 10%, 20% and 30%) were freeze-dried with cycle 1 (see chapter 5.2.3) and
images of each cake taken, as described in 6.1.1.1. All images were evaluated with Axio
Vision and in the case of a circular cake structure with Matlab. Since the values of % crack-
ing obtained with both programs come from the same image, the samples are ”paired” and
a dependent t-test may be performed [121]. For each evaluation method and at each con-
centration a Chi2-test is performed to verify a normal distribution with a significance level, α,
of 0.05%. The null hypothesis is proposed that the cracking values are normally distributed
with the expectancy value of µ and the variance of σ. The alternative hypothesis is that the
cracking values are not normally distributed with the expectancy value of µ and the variance
of σ.

86 6 Results
For the Chi2-test the mean value, µ, the standard deviation, s, and the sample size, n are
calculated. The % cracking values are divided into classes and the actual frequencies of
each class, fa, are calculated. The basis of the test is a comparison of the actual and the
expected frequencies of each class. For the calculation of the expected frequency of each
class, fe, the z-values of each class are calculated via:
z =xu − µ
s, (6.2)
where xu is the upper limit of each class. The φ(z)-values of each class are obtained from
the distribution function, F (z), of the standardized normal distribution by the value of z [121].
The φ(z) value constitutes the area under the standardized normal distribution curve from 0
to z. The difference of φ(z) of each class to its prior class is calculated and multiplied with
the sample size, n, to obtain the expected frequency of the class, fe.
Figure 6.14 shows for each evaluation method and each trehalose concentration the fre-
quencies of each cracking class. The black columns give the actual cracking frequencies,
fa, and the gray columns the calculated expected values, fe. To compare fe with fa of each
class, the standardized residue, fs, of each classes is calculated by:
fs =(fa − fe)
2
fe. (6.3)
The sum of fs gives the test statistic, χ2, which is compared with the critical value of the
Chi2-distribution, χ2c. This critical value is obtained from the table of the Chi2-distribution and
the degree of freedom, df (given by the number of classes minus 3) [121]. Table 6.2 gives
an overview of the values obtained. It shows for all test groups that χ2 is smaller than χ2c,
and the proposed null hypothesis can be accepted. The cracking values of each test group
are therefore normally distributed and a dependent t-test for paired samples (α =0.05) may
be performed.
The null hypothesis is that the cracking values obtained by the evaluation with Axio Vision
equal those obtained with Matlab. The alternative hypothesis is that there is a difference be-
tween the cracking values obtained by the different evaluation programs. For the dependent
t-test for paired samples the differences between all pairs are calculated. From this data the
number of pairs, n, the mean value, XD, and the standard deviation, SD, are calculated. The

6.1 Endpoint Evaluation Method 87
0-1 1-2 2-3 3-4 4-5 5-6 6-7 7-8 >80
2
4
6
8
10
12
14
16 Observed Expected
Freq
uenc
y A
xioV
isio
n 7,
5%
Classes cracking [%]
(a)
0-1 1-2 2-3 3-4 4-5 5-6 6-7 7-8 >80
2
4
6
8
10
12
14
16 Observed Expected
Freq
uenc
y M
atla
b 7,
5%
Classes cracking [%]
(b)
0-1 1-2 2-3 3-4 4-5 5-6 6-7 7-8 8-9 9-10 10-11 >110
2
4
6
8
10
12
Observed Expected
Freq
uenc
y A
xioV
isio
n 10
%
Classes cracking [%]
(c)
0-1 1-2 2-3 3-4 4-5 5-6 6-7 7-8 8-9 9-10 10-11 >110
2
4
6
8
10
12 Observed Expected
Freq
uenc
y M
atla
b 10
%Classes cracking [%]
(d)
0-9,5 9,5-10 10-10,5 10,5-11 11-11,5 11,5-12 12-12,5 12,5-13 13-13,5 13,5-14 14-14,5 >14,50
2
4
6
8
10
12
14
16 Observed Expected
Freq
uenc
y A
xioV
isio
n 20
%
Classes cracking [%]
(e)
0-9,5 9,5-10 10-10,5 10,5-11 11-11,5 11,5-12 12-12,5 12,5-13 13-13,5 13,5-14 14-14,5 >14,50
2
4
6
8
10
12
Observed Expected
Freq
uenc
y M
atla
b 20
%
Classes cracking [%]
(f)
0-9,5 9,5-10 10-10,5 10,5-11 11-11,5 11,5-12 12-12,5 12,5-13 13-13,5 13,5-14 14-14,5 >14,50
2
4
6
8
10
12
14 Observed Expected
Freq
uenc
y A
xioV
isio
n 30
%
Classes cracking [%]
(g)
0-9,5 9,5-10 10-10,5 10,5-11 11-11,5 11,5-12 12-12,5 12,5-13 13-13,5 13,5-14 14-14,5 >14,502468
101214161820 Observed
Expected
Freq
uenc
y M
atla
b 30
%
Classes cracking [%]
(h)
Figure 6.14: Observed and expected cracking values for each class and the following testgroups: 7.5% trehalose (w/v) evaluated with Axio Vision (a) and with Matlab (b),10% trehalose (w/v) evaluated with Axio Vision (c) and with Matlab (d), 20%trehalose (w/v) evaluated with Axio Vision (e) and with Matlab (f), 30% trehalose(w/v) evaluated with Axio Vision (g) and with Matlab (h).

88 6 Results
Test Group n µ s σ χ2 χ2c
7.5% AV 44 2.70 1.76 3.09 10.3133 12.59167.5% ML 44 2.74 1.71 2.92 12.0131 12.591610% AV 41 6.18 1.99 3.96 6.2147 16.919010% ML 41 6.12 1.96 3.84 3.9262 16.919020% AV 55 11.64 1.09 1.19 9.3711 16.919020% ML 55 11.67 1.09 1.19 5.7306 16.919030% AV 64 12.19 0.96 0.92 2.8469 16.919030% ML 64 12.23 0.85 0.72 10.5754 16.9190
Table 6.2: Results of the χ2-test. AV: Evaluation with Axio Vision, ML: Evaluation with Matlab.
test value, t, is calculated via:
t =XDsD√n
. (6.4)
t is than compared to the value of the t-distribution, tc, with a significance level of 2α/2 and a
degree of freedom, df , of n−1 obtained from the table of the T-distribution [121]. The results
of the dependent t-test for paired samples are given in Table 6.3. It shows for all test groups
Test Group XD SD n t tc
7.5 0.04 0.22 44 1.2464 2.018110 0.06 0.25 41 1.6572 2.021120 0.02 0.36 55 0.4986 2.004930 0.04 0.51 64 0.5907 1.9983
Table 6.3: Results of the dependent t-test for paired samples with the test groups 7.5% tre-halose (w/v), 10% trehalose (w/v), 20% trehalose (w/v), 30% trehalose (w/v).
that t is smaller than tc, and the proposed null hypothesis can be accepted. The evaluation
with Matlab equals therefore that of Axio Vision. Figure 6.15 shows a comparison between
the cracking values obtained with each evaluation method. Judged visually there is also no
difference between the two methods. This result in Figure 6.15 will be discussed later.
6.1.3 Sample Selection and Edge Effect
For endpoint evaluation the vials are positioned in a hexagonal arrangement (Figure 6.16)
on the shelf of the freeze-drier contained within a hexagonal metal ring. The influence of an
edge effect on shrinkage and cracking is unknown. The vials at the outer positions that show
a different cake appearance in comparison to center vials need therefore to be investigated

6.1 Endpoint Evaluation Method 89
5 10 15 20 25 30
2
4
6
8
10
12
14
Cra
ckin
g [%
]
Concentration of trehalose (w/v)
Axio Vision Matlab
Figure 6.15: Mean values of cracking obtained with Axio Vision (square) and Matlab (circle).The coordinates for cracking are the mean average ± standard error of all valuesobtained.
3456789
10
21
Figure 6.16: Arrangement of the vials in a hexagonal position. The numbers 1-10 mark therows of the arrangement.
and, if needed, excluded from further experiments.
To analyze the edge effect on shrinkage and cracking the batch is classified in rows num-

90 6 Results
bered with 1 to 10 from the outside to the inside, as illustrated in Figure 6.16. All vials are
marked with the corresponding row number and freeze-dried with cycle 1 (see chapter 5.2.3).
After the freeze-drying process is complete images of every vial are taken and evaluated with
regard to shrinkage and cracking. To compare the values of shrinkage and cracking the t-
test for independent samples is performed. Since the number of vials is less at higher row
number, the rows located in the center are combined to one test group, as shown in Figure
6.16. The number of vials in this row is the sample size n. For this test homogeneity of
both variances is provided and an F-test is performed. This requires calculation of the stan-
dard deviations, s1 and s2, and the variances of both test groups, σ1 and σ2, with regard to
shrinkage and cracking. The test statistic, F , is given by:
F =σ1
σ2
. (6.5)
The critical values, Fc, are obtained from the table of the F-distribution with df of n1 − 1 and
n2 − 1 and a significance level, α, of 0.01 [122]. The null hypothesis is that the variances
of the test groups, σ1, σ2 are homogeneous. The alternative hypothesis is that they are
not homogeneous. Tables 9.1 and 9.2 (both in Appendix, see chapter 9) give an overview
of the calculated values and the critical values for cracking and shrinkage, respectively. The
F-values that indicate rows with inhomogeneous variances are printed in bold text. For homo-
geneous variances, σ1, σ2, the standard deviation of the sample distribution of sample-mean
differences, sm−m is calculated as:
sm−m =
√s21n1
+s22n2
, (6.6)
where s1, s2 are the standard deviations of each test group and n1, n2 are the group sizes.
Then the test statistic, t, can be calculated via:
t =
√n1 ·n2
n1 + n2
· µ1 − µ2
sm−m
, (6.7)
where µ1, µ2 are the mean values of the test groups. The null hypothesis is that the mean
values of the test groups, µ1, µ2 are equal. The alternative hypothesis is that µ1, µ2 are
not equal. The critical values, tc, are obtained from the table of the t-distribution with df

6.1 Endpoint Evaluation Method 91
of n1 + n2 − 2 and α of 0.01 [121]. The results of the t-test for independent samples and
homogeneous variances for cracking and shrinkage are given in Table 9.3 and Table 9.4
(both in Appendix, see chapter 9), respectively. The vales of t and tc belonging to rows with
differences in the mean values are printed in bold text. The rows for shrinkage show only
inhomogeneous variances (see Table 9.1 and Table 9.2, both in Appendix, see chapter 9).
For these rows the t-test for independent samples with inhomogeneous variances, σ1, σ2, is
performed. In this case the test statistic, t, is calculated as:
t =µ1 − µ2
sm−m
. (6.8)
The critical values, tc, are obtained from the table of the t-distribution with df and α of 0.01
[121]. df is calculated via:
df =1
c2
n1−1+ (1−c)2
n2−1
, with c =
s21
n1
s21
n1
+s22
n2
. (6.9)
An overview of the results of this t-test is given in Table 9.5 (see Appendix in chapter 9).
Table 9.6 (see Appendix in chapter 9) summarizes the uniformity of the values of shrinkage
and cracking depending on position of the vials, as obtained by the t-test for independent
samples.
The behavior of shrinkage is seen to be more independent of the position of the vials than
is the behavior of cracking. The results indicate a trend to more inhomogeneous cracking or
shrinkage behavior at the edge of the shelf compared to a center position. This trend is more
pronounced with cracking. Up to row four inhomogeneity is found in cracking. To ensure a
sample selection with high uniformity of shrinkage and cracking and no influence of the edge
effect, the vials positioned at rows one to four are therefore excluded from evaluation. Only
the vials from row 5 up to row 10 are included.
To investigate the edge effect on shrinkage and cracking, the vials of row 1-4 and of row
5-10 are combined into two groups. The mean values, µ, the standard deviations, s, and the
group sizes, n are given in Table 6.4. For the t-test for independent samples the F-test is
performed to investigate the homogeneity of the variances, σ1 and σ2. The null hypothesis
is that the variances of the test groups, σ1, σ2 are homogeneous. The alternative hypothesis
is that they are not homogeneous (α =0.01). Table 6.5 gives an overview of the calculated

92 6 Results
Concentration µ1−4 µ5−10 s1−4 s5−10 n1−4 n5−10
Cracking 7.5% 2.74 2.65 1.87 1.65 25 19Cracking 10% 6.39 6.25 2.02 2.01 30 11Cracking 20% 11.72 11.49 1.17 0.93 37 18Cracking 30% 12.13 12.30 0.97 0.95 39 25
Shrinkage 7.5% 13.71 12.64 5.49 3.39 25 19Shrinkage 10% 16.97 17.19 5.31 5.92 30 11Shrinkage 20% 7.41 6.97 0.80 0.63 37 18Shrinkage 30% 7.58 7.49 1.20 1.25 39 25
Table 6.4: Mean values, µ, the standard deviations, s, of shrinkage and cracking and thegroup sizes, n of the vials with 7.5%-30% trehalose concentration belonging torow 1-4, and 5-10.
values and the critical values for cracking and shrinkage. The critical values, Fc, are obtained
from the table of the F-distribution with df of n1 − 1 and n2 − 1 and a α of 0.01 [122]. The
F-values that indicate rows with inhomogeneous variances are printed in bold text. Since
Concentration s1 s2 σ1 σ2 F Fc
Cracking 7.5% 1.87 1.65 3.49 2.72 1.28 3.04Cracking 10% 2.02 2.01 4.09 4.05 1.01 3.94Cracking 20% 1.17 0.93 1.36 0.86 1.58 2.63Cracking 30% 0.95 0.97 0.90 0.95 0.96 2.96
Shrinkage 7.5% 3.39 5.49 11.50 30.19 0.38 2.81Shrinkage 10% 5.92 5.31 35.04 28.15 1.24 2.90Shrinkage 20% 0.80 0.63 0.63 0.40 1.58 2.63Shrinkage 30% 1.25 1.20 1.56 1.44 1.09 2.96
Table 6.5: Results of the F-test for the cracking and shrinkage values of 7.5% trehalose (w/v),10% trehalose (w/v), 20% trehalose (w/v), 30% trehalose (w/v). Test groups foreach concentration are the combination of rows 1-4 and 5-10. F-values that indi-cate rows with inhomogeneous variances are printed in bold text.
the variances of each test group are homogeneous, the t-test for independent samples and
homogeneous variances is performed for all samples. The null hypothesis is that the mean
values of the test groups, µ1, µ2, are equal. The alternative hypothesis is that the mean
values of the test groups, µ1, µ2 are not equal (α =0.01). The critical values, tc, are obtained
from the table of the t-distribution with df of n1 + n2 − 2 and a α of 0.01 [121]. The results of
the t-test for independent samples and homogeneous variances for cracking and shrinkage
are given in Table 6.6. The vales of t and tc belonging to rows with differences in the mean

6.1 Endpoint Evaluation Method 93
values are printed in bold text. Table 6.6 shows that a difference between the mean values
Concentration s1 s2 sm−m µ1 µ2 t df tc
Cracking 7.5% 1,87 1,65 0,53 2,74 2,65 0,5559 42 2,6981Cracking 10% 2,02 2,01 0,71 6,39 6,25 0,5591 39 2,7079Cracking 20% 1,17 0,93 0,29 11,72 11,49 2,7482 53 2,6718Cracking 30% 0,95 0,97 0,25 12,30 12,13 2,6987 62 2,6575
Shrinkage 7.5% 3,39 5,49 1,35 12,64 13,71 2,6068 42 2,6981Shrinkage 10% 5,92 5,31 2,03 17,19 16,97 0,3076 39 2,7079Shrinkage 20% 0,80 0,63 0,20 7,41 6,97 7,6323 53 2,6718Shrinkage 30% 1,25 1,20 0,32 7,49 7,58 1,1409 62 2,6575
Table 6.6: Results of the t-test for the shrinkage values of 7.5% trehalose (w/v), 10% tre-halose (w/v), 20% trehalose (w/v), 30% trehalose (w/v) with homogeneous vari-ances. Conc.= trehalose concentration (w/v). Rows with differences in the meanvalues are printed in bold text.
of the outer rows (1-4) and the center rows (5-10) can be found with 20% and 30% trehalose
(w/v) for cracking and with 20% trehalose (w/v) for shrinkage. A clear influence of an edge
effect is therefore not found at all trehalose concentrations. Table 6.6 shows no tendency to
any influence of an edge effect on either cracking or shrinkage.
6.1.4 Shrinkage, Cracking and the Amount of Unfrozen Water, w′
The endpoint evaluation method is used to investigate any apparent correlation between the
content of non-frozen water in the maximum freeze-concentrated state, w′, of an amorphous
cake and shrinkage, as has been suggested by Rambhatla et. al. [5]. These authors used 5%
sucrose solutions (w/v) and measured the geometric shrinkage of the cake after lyophiliza-
tion from its average diameter and height. They found a value of shrinkage of 17.3% at
a low primary drying temperature (-38 C) and a slow ramp rate towards secondary drying
(0.1 C/min). Tg was at no time exceeded by the product temperature, Tp, during secondary
drying. When using an aggressive cycle (-25 C, 2.5 C/min), Tp exceeded Tg during sec-
ondary drying, but a cake shrinkage of only 19.5% was measured. The authors reasoned
that secondary drying conditions have only a second-order effect. They suggested a correla-
tion between w′ and shrinkage, since sucrose contains about 18% water at T ′g. They hypoth-
esized that w′ occupies volume which must be preserved as void space during secondary
drying or shrinkage will occur. This shrinkage would then lead to a decrease in volume of the

94 6 Results
sucrose phase by the same volume occupied by w′.
The disaccharides trehalose, D-(+)-Maltose, and D-(+)-Sucrose that have different w′ were
freeze-dried with cycle 1 (see chapter 5.2.3). A wide concentration range (7.5% (w/v), 10%
(w/v), 20% (w/v) and 30% (w/v)) was used. To confirm the T ′g values found in the literature,
DSC measurements were first carried out with a 7.5% aqueous solution (w/v) of each dis-
accharide. The thermograms in the region of the inflection point are shown in Figure 6.17.
Table 6.7 gives an overview of the disaccharides used and their corresponding w′ and T ′g
-80 -70 -60 -50 -40 -30 -20 -10 0 10-6,0
-5,5
-5,0
-4,5
-4,0
-3,5
-3,0
endo
Hea
t Flo
w [m
W]
Temperature [°C]
D-(+)-Sucrose D-(+)-Trehalose D-(+)-Maltose
exo
Figure 6.17: DSC scans in the region of the inflection point of D-(+)-Maltose (circle), trehalose(triangle), and D-(+)-Sucrose (square).
values reported from Slade and Levine [83], and also the mean value of T ′g determined by
the current DSC measurements. The measured values for T ′g are about 2.5 C lower than
those reported by Slade and Levine [123]. The deviation may be explained by the use of
different measurement methods. The value of the glass transition depends on the heating
and cooling rate.
Above Tg the system behaves like a liquid and responds to changes in temperature in the
timescale of the temperature change and is therefore in equilibrium with the cooling process.
At Tg, the system is kinetically unable to stay in the equilibrium state, since its molecular

6.1 Endpoint Evaluation Method 95
Disaccharide w′[83] T ′g[83] Mean value of T ′
g (midpoint)
trehalose 16.7% -28,65C -30.99CD-(+)-Maltose 20.0% -28,65C -31.59CD-(+)-Sucrose 35.9% -31,15C -33.81C
Table 6.7: Overview of the disaccharides used and the corresponding w′ and T ′g obtained
from Slade and Levine [83].
mobility is reduced, and it is therefore not able to respond to the changes in temperature in
the timescale of the temperature change. At lower cooling rates, the timescale for relaxation
is higher and the systems stays in the equilibrium state till lower temperatures compared to
a faster cooling rate. Hence, a lower value of the glass transition temperature is measured
[71].
The exact cooling rate used for the determination of the glass transition temperature is not
given at Slade and Levine [123], only the information that a slow cooling rate was used. The
differences between the measured data and the values of T ′g reported by these authors are
likely caused by different cooling rates.
Lyophilization was performed in the hexagonal vial packaging according to Figure 6.16.
After its completion images were taken of every vial in rows 4-10 and evaluated for shrinkage
and cracking.
D-(+)-sucrose has the highest w′ and should show the highest amount of shrinkage, fol-
lowed by D-(+)-maltose and trehalose. Figure 6.18 shows the mean values of shrinkage
for each disaccharide at each concentration. With increasing concentration less shrinkage
occurs. The values for % shrinkage with a 7.5% disaccharide concentration are some three
times higher than at 30% disaccharide concentration for D-(+)-sucrose (circle), D-(+)-maltose
(triangle) and more than sevenfold higher for trehalose (square). The highest amount of
shrinkage is found for D-(+)-sucrose which possesses the highest value of w′. The lowest
amount of shrinkage is observed for trehalose that has the lowest w′. These results appear
to confirm the assumption suggested by Rambhatla et. al. [5] of a direct causal correlation
between shrinkage and w′, but needed to be considered in more detail.
Rambhatla et. al. [5] correlated the value of shrinkage to the value of w′. Table 6.8 gives
an overview of w′ and the values of shrinkage obtained in the current work from the 7.5%
disaccharide samples. Rambhatla et. al. [5] compared their degree of shrinkage with a w′

96 6 Results
5 10 15 20 25 30
0
5
10
15
20
25
30
Shr
inka
ge [%
]
Concentration [%] (w/v)
Sucrose Maltose Trehalose
Figure 6.18: Shrinkage values of freeze-dried D-(+)-sucrose (circle), D-(+)-maltose (triangle),and trehalose (square) solutions with 7.5% (w/v), 10% (w/v), 20% (w/v), and30% (w/v) disaccharide concentration. The coordinates for shrinkage are themean average ± standard error of all values obtained (trehalose: 7.5%: n=32,10%: n=33, 20%: n=30, 30%: n=26; D-(+)-sucrose: 7.5%: n=20, 10%: n=17,20%: n=24, 30%: n=19; D-(+)-maltose: 7.5%: n=19, 10%: n=23, 20%: n=13,30%: n=14).
Disaccharide w′ Shrinkage
7.5% trehalose 16.7% 16.43%7.5% D-(+)-maltose 20.0% 18.69%7.5% D-(+)-sucrose 35.9% 23.57%
Table 6.8: Values of shrinkage obtained from the 7.5% disaccharide samples in comparisonto the corresponding values of w′ reported by Slade and Levine [123].
value for sucrose of approximately 18%, but Slade and Levine [123] determined 35.9% for
w′. The literature contains conflicting values for w′ and T ′g, as shown in Table 6.9. Miller
et. al. [124] and Craig et. al. [71] explain these different values as a probable result of the
measuring method since these may use the same heating and cooling rate, but the different
solutions measured have different characteristic time scales. Since Slade and Levine [123]
used a method that accounted for the dependence on the solution composition, the values of

6.1 Endpoint Evaluation Method 97
w′ (printed in bold text in Table 6.9) are obtained by these authors. Hence, a value of 35.9%
of unfrozen water for sucrose instead of about 18% reported by Rambhatla [5] seems to be
more likely.
Disaccharide w′ Tg′ Reference
Trehalose 16.7% -28.65 C [123]18.8% -22.20 C [124]18.4% -35.00 C [125]
Maltose 20.0% -28.65 C [123]23.0% -31.00 C [126]
Sucrose 17.0% -31.50 C [127]18.8% -39.15 C [128]20.0% -36.15 C [127]21.0% -48.15 C [127]35.9% -31.15 C [82, 123]
Table 6.9: Values of w′ and T ′g of trehalose, D-(+)-maltose, and D-(+)-sucrose reported by
various authors.
Trehalose follows the correlation between the values of w′ and T ′g and D-(+)-maltose shows
with 20.0% w′ and 18.69% (shrinkage) almost similar values. But a large deviation between
w′ (35.9%) and the degree of shrinkage (23.57%) is observed for D-(+)-sucrose. Ramb-
hatla et. al. suggested that additional free volume in the cake is generated as a result of the
desorption of the unfrozen water. D-(+)-sucrose may transform the excess free volume not
only to cake shrinkage, but also to free volume in the cake. This does not occur with D-(+)-
maltose and trehalose, where possibly the complete excess free volume is transformed to
cake shrinkage.
Another explanation is that the cake cracks during the desorption of the unfrozen water.
The amount of cracking for D-(+)-sucrose should then be greater than that for D-(+)-maltose
and trehalose. This would explain the difference between the high amount of w′ but the
low degree of shrinkage. Figure 6.19 illustrates the amount of cracking observed for D-(+)-
sucrose, D-(+)-maltose, and trehalose for solutions with 7.5% (w/v), 10% (w/v), 20% (w/v),
and 30% (w/v) disaccharide concentration. The highest amount of cracking is not found for
D-(+)-sucrose, but rather for trehalose. The excess free volume is therefore evidently not
transformed in cracking.
Shrinkage increases in the order: trehalose > D-(+)-maltose > D-(+)-sucrose. Cracking

98 6 Results
5 10 15 20 25 30
0
5
10
15
20
25
30
Cra
ckin
g [%
]
Concentration [%] (w/v)
Trehalose Sucrose Maltose
Figure 6.19: Cracking values of freeze-dried D-(+)-sucrose (circle), D-(+)-maltose (triangle),and trehalose (square) solutions with 7.5% (w/v), 10% (w/v), 20% (w/v), and30% (w/v) disaccharide concentration. The coordinates for cracking are themean average ± standard error of all values obtained (trehalose: 7.5%: n=32,10%: n=33, 20%: n=30, 30%: n=26; D-(+)-sucrose: 7.5%: n=20, 10%: n=17,20%: n=24, 30%: n=19; D-(+)-maltose: 7.5%: n=19, 10%: n=23, 20%: n=13,30%: n=14).
increases in the order: D-(+)-maltose > D-(+)-sucrose > trehalose. The order of shrinkage
is neither equal nor opposite to that of shrinkage. A correlation between the amount of w′
and the degree of cracking is not therefore observed.
Figure 6.19 also illustrates that the degree of cracking depends on the disaccharide con-
centration, as already observed for shrinkage. With increasing disaccharide concentration
the values for cracking increase while those for shrinkage decrease. At low concentrations
D-(+)-sucrose and D-(+)-maltose show very little cracking, but trehalose shows up to 7%
cracking at 10% disaccharide concentration. As concentration increases the behavior of D-
(+)-sucrose and trehalose runs parallel, but D-(+)-maltose behaves differently and remains
at a low level.

6.1 Endpoint Evaluation Method 99
6.1.5 Impact of the Trehalose Concentration
A 2R vial was used and filled with trehalose solutions at concentrations of 5%, 7.5%, 15%,
20%, and 30% to a fill height of 2.5 mm. The semi-stoppered vials were freeze-dried in a
hexagonal vial packaging with cycle 1 (see chapter 5.2.3). After lyophilization images of
each vial were taken in rows 4-10 and evaluated for shrinkage and cracking. The measured
values of cracking at each concentration are given in Figure 6.20.
5 10 15 20 25 300
5
10
15
20 Shrinkage [%] Cracking [%]
Trehalose concentration [%]
Cra
ckin
g [%
]
0
5
10
15
20
Shr
inka
ge [%
]
Figure 6.20: Cracking (black circle) and shrinkage (black square) values of freeze-dried tre-halose solutions with 5% (w/v), 7.5% (w/v), 10% (w/v), 15% (w/v), 20% (w/v),and 30% (w/v) trehalose concentration. The coordinates for cracking are themean average ± standard error of all values obtained (trehalose: 5%: n=4,7.5%: n=32, 10%: n=33, 15%: n=19, 20%: n=30, 30%: n=26).
The curve for cracking lies at 5%, 7.5% and 10% trehalose concentrations at lower values
compared to shrinkage. At a concentration between 10% and 15% both curves cross and
with higher trehalose concentrations the values of cracking exceed those of shrinkage. In-
creased values of cracking and decreased values of shrinkage are seen with higher trehalose
concentration.

100 6 Results
Figure 6.21 shows representative sample images at each trehalose concentration. The
a b c
d e f
Figure 6.21: Sample images of lyophilizates with a: 5% (w/v), b: 7.5% (w/v), c: 10% (w/v), d:15% (w/v), e: 20% (w/v), and f: 30% (w/v) trehalose.
cakes show narrow, long cracks at 5% trehalose that propagate from the outside of the cake
to its center, as shown in Figure 6.21a. The crack width is greater at the edge of the cake
compared to its center. With this crack pattern the cake surface is mostly separated into two
parts.
For samples at 7.5% trehalose the cracks run together in the center of the cake and split
its surface generally into four to five pieces, illustrated in Figure 6.21b. As already seen for
the samples at 5% trehalose, the crack width of the samples is greater at the cake’s edge
than in the central region.
At 10% trehalose (Figure 6.21c) the cracks run through the whole cake surface from the
edge to the center. The cakes show a multiple cracked surface which is separated into four
to six pieces, typically with a center piece. This center piece in Figure 6.22a is shown for
a quartered cake and in Figure 6.22b for a cake that is split into six regions. These crack
patterns suggest that samples with four or five pieces are intermediate stages of a cake
with six pieces. The quartered cake in Figure 6.22a suggests a split into five pieces as a

6.1 Endpoint Evaluation Method 101
a b
Figure 6.22: Sample images of lyophilizates with 10% trehalose (w/v). The path of the cracksseparated the cake surface in a: four and b: six pieces.
crack propagates from the right towards the cake’s edge, but not completely to its edge. The
development of a fifth surface piece is therefore initiated, but not finished. The sixth piece of
cake may also be developed based on the crack pattern of a cake with five cake pieces, since
a further crack runs through the center piece (Figure 6.22b). Such a split is also initiated on
the left side of the center piece of the cake shown in Figure 6.22a.
Samples containing 15% trehalose (Figure 6.21d) show a greater amount of cracks which
separate the cake into at least nine pieces. The size of the pieces differs strongly from
one cake to another, much more than for samples at lower trehalose concentrations. This
observation suggests that fragments are additionally separated by further crack growth. A
center piece which is observed for samples at 10% trehalose is not clearly found.
Cakes that contain 20% and 30% trehalose (Figure 6.21e, f) possess a crack pattern
similar to each other but different to samples with less trehalose. Both show fine cracks in
the outer region of the cake with no connection to the cake’s edge. The crack width increases
inwards and at least ten surface pieces can be identified. The sizes of the pieces are similar
to each other and are likely caused by further crack growth through original connected areas
of the cake.
The lyophilizates can also be analyzed for mechanical strength when compressed in the
texture analyzer. The typical stress-strain curves are shown in Figure 6.23. The lyophilizates
show the typical irregular, oscillating (”jagged”) strain during the compression of a brittle
solid foam described at Peleg [129] and Harnkarnsujarit [130]. The deformation leads to
major and minor failure-events by the breaking of the pore walls within the highly porous
cake. A fracture-controlled crushing process takes place. The stress decreases sharply after

102 6 Results
-0,5 0,0 0,5 1,0 1,5
0
10
20
30
40
50
60
Forc
e [N
]
Displacement [mm]
0
10
20
30
40
50
60
0
10
20
30
40
50
60
0
10
20
30
40
50
60
0
10
20
30
40
50
60
30% 20% 15% 10% 7,5% 5%
0
10
20
30
40
50
60
Figure 6.23: Compressive force-displacement curves of freeze-dried trehalose cakes in theconcentration range 5% - 30%.
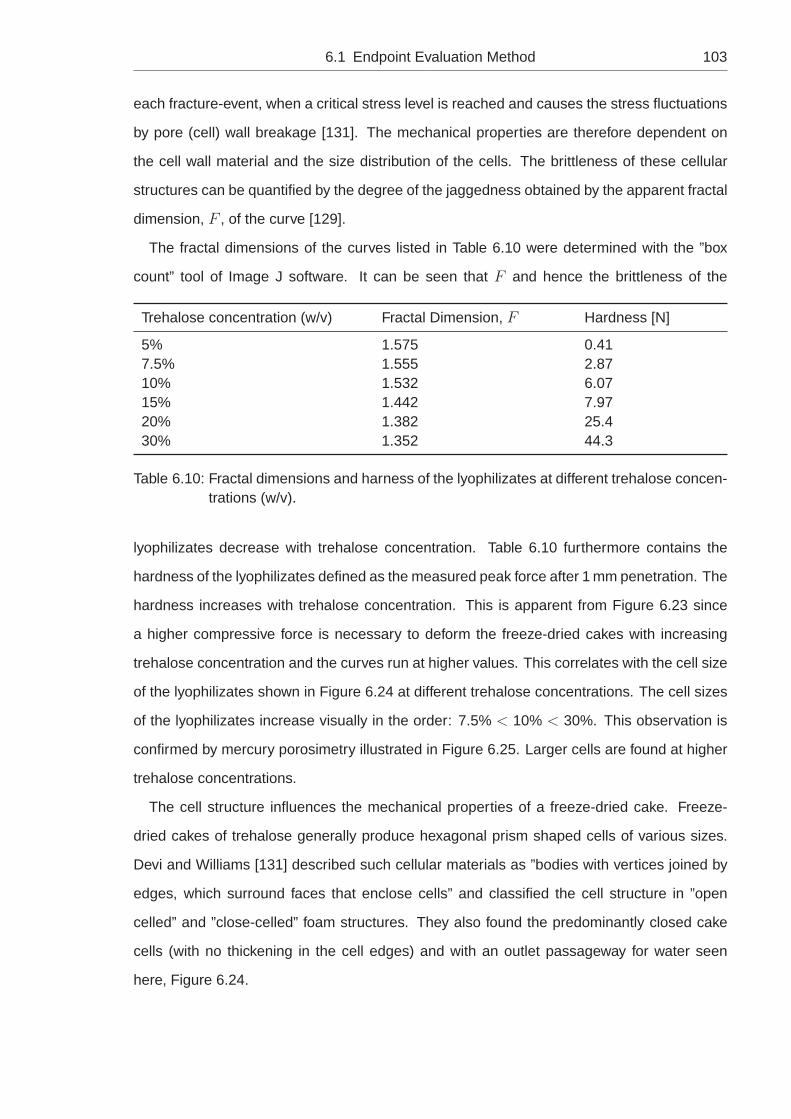
6.1 Endpoint Evaluation Method 103
each fracture-event, when a critical stress level is reached and causes the stress fluctuations
by pore (cell) wall breakage [131]. The mechanical properties are therefore dependent on
the cell wall material and the size distribution of the cells. The brittleness of these cellular
structures can be quantified by the degree of the jaggedness obtained by the apparent fractal
dimension, F , of the curve [129].
The fractal dimensions of the curves listed in Table 6.10 were determined with the ”box
count” tool of Image J software. It can be seen that F and hence the brittleness of the
Trehalose concentration (w/v) Fractal Dimension, F Hardness [N]
5% 1.575 0.417.5% 1.555 2.8710% 1.532 6.0715% 1.442 7.9720% 1.382 25.430% 1.352 44.3
Table 6.10: Fractal dimensions and harness of the lyophilizates at different trehalose concen-trations (w/v).
lyophilizates decrease with trehalose concentration. Table 6.10 furthermore contains the
hardness of the lyophilizates defined as the measured peak force after 1 mm penetration. The
hardness increases with trehalose concentration. This is apparent from Figure 6.23 since
a higher compressive force is necessary to deform the freeze-dried cakes with increasing
trehalose concentration and the curves run at higher values. This correlates with the cell size
of the lyophilizates shown in Figure 6.24 at different trehalose concentrations. The cell sizes
of the lyophilizates increase visually in the order: 7.5% < 10% < 30%. This observation is
confirmed by mercury porosimetry illustrated in Figure 6.25. Larger cells are found at higher
trehalose concentrations.
The cell structure influences the mechanical properties of a freeze-dried cake. Freeze-
dried cakes of trehalose generally produce hexagonal prism shaped cells of various sizes.
Devi and Williams [131] described such cellular materials as ”bodies with vertices joined by
edges, which surround faces that enclose cells” and classified the cell structure in ”open
celled” and ”close-celled” foam structures. They also found the predominantly closed cake
cells (with no thickening in the cell edges) and with an outlet passageway for water seen
here, Figure 6.24.

104 6 Results
(a) (b) (c)
Figure 6.24: SEM of freeze-dried trehalose solutions at (a) 7.5%, (b) 10%, and (c) 30% (w/v));all at 3000x magnification.
Figure 6.25: Pore size distribution of different trehalose concentrations obtained by mercuryporosimetry.
To estimate the amount of cracking of a cellular foam structure the tensile fracture tough-
ness for a closed cell without thickening of the cell edges can be used.
KIc = B
(ρ
ρS
)2
σf
√πl, (6.10)

6.1 Endpoint Evaluation Method 105
where KIc is the critical stress intensity factor, B is a structure geometry [dimensionless
constant], ρ is the density of the foam, ρS is the true density of the pure solid, σf is the
modulus of rupture of cell-wall material, and l is the cell length [132]. Equation 6.11 shows
the connection between the densities ρ, ρS and the cell-wall thickness, t, and l:
(ρ
ρS
)≈
(t
l
)2
. (6.11)
KIc increases at greater density and a lower porosity of the foam, as well as with smaller
pores and thicker cell walls. Harnkarnsujarit et. al. [130], Kim et. al. [133], and Kazmina and
Semukhin [134] also correlated the cell wall size to the mechanical strength of the porous
system and found a higher strength at smaller cell sizes. The influence of the cell size on
the mechanical properties of porous glass and ceramics was investigated by Hasselman and
Fulrath [135]. These authors investigated the micro mechanical stress concentrations in two-
phase brittle-matrix ceramic composites containing a homogeneous, uniform, and pore-free
matrix material as one phase and spherical pores as the other phase. They found the same
dependence of the material’s strength on the degree of porosity.
They further found if the size of the cell is substantially larger than the size of a Griffith flaw
(case I) then the stress concentration approach (KIc) can be applied and the structure fails
when the maximum stress concentration exceeds the strength of the material. These authors
described cases where the flaw size approaches the cell size (case II) and where the cell size
is much smaller than the flaw size (case III). Amorphous freeze-dried samples contain two
phases, the amorphous framework as one phase and ice or vapor as the second phase.
Freeze-dried samples usually show a high porosity and a large pore volume in comparison
to the matrix volume. A possible flaw in the freeze-dried matrix has therefore to be smaller
than cell. Case I can now be applied to freeze-dried systems.
Bertolotti and Fulrath [136] investigated the strength of porous glass and also found a
precipitous decrease in strength with increasing pore sizes or porosity. These author explain
how differences in elastic properties of the components lead to stress inhomogeneities and
a decrease in strength of brittle materials.
Since freeze-dried cakes with a high trehalose concentration possess larger cells, they
should show a lower strength and a lower KIc. Adhesion of the cake to the inside wall of the
vial leads to tensile forces in the cake, since a contraction of the lyo mass may is hindered.

106 6 Results
The larger cells found at higher trehalose concentrations cause therefore a lower KIc and a
higher amount of cracking is developed during drying [5].
6.1.6 Impact of the Surface Chemistry on Shrinkage and Cracking
Rambhatla et. al. [5] suggested that poor adhesion of the dried product to the glass wall
leads to a more uniform cake shrinkage, whereas great adhesion produces fracture of the
product and the development of cracks. To investigate this correlation the wetting behavior
of different trehalose concentrations (5%, 7,5%, 10%, 15%, 20%, 30%) was investigated
with the OCA 20 contact angle measuring device. If a cutout base of a 2R vial is used, its
curvature prohibits a centered positioning of the drop (Figure 6.26a). A precise definition of
(a) (b)
Figure 6.26: Images of aqueous solutions with 15% trehalose on a) a 2R vial base and b) amicroscope slide taken with an OCA 20 contact angle measuring device.
the boundary between the vial base and the drop is therefore difficult and the variability of the
measured data is high (mean average ± standard error >1.4, Figure 6.27). A microscope
slide was therefore used and a sample image obtained is given in Figure 6.26b. A distinct
drop shape is now evident and wetting is much greater. The contact angles for the different
trehalose solutions on the vial base are therefore larger (Figure 6.27, black square) than on
the slide (Figure 6.27, black circle). The wetting behavior between the trehalose solutions
and the microscope slide is therefore better than between the trehalose solutions and the
vial base.

6.1 Endpoint Evaluation Method 107
The cutout vial base is made of neutral glass with the hydrolytic class 1, and the micro-
scope slide consists of soda-lime glass with the hydrolytic class 3 [137, 138]. The amount
and the type of atoms and ions in each glass type differs (see Table 6.11) which may be re-
sponsible for some part of the different wetting behavior. Difference in cleanliness may also
play a role. As Figure 6.27 shows, the contact angles decrease with increasing trehalose
Chemical composition Cutout vial base Microscope slide
SiO2 75% 72.2%Al2O3 5% 1.2%Na2O 7% 14.3%CaO 1.5% 6.70%B2O3 10.5% -K2O - 1.20%MgO - 4.30%Fe2O3 - 0.03%SO3 - 0.30%
Table 6.11: Chemical Composition of the vial base and the microscope slide [137, 139].
concentration, i. e. the wetting improves. The surface tension of 5% trehalose is in the range
of that of water (72.8 mN/m) and is increased with higher trehalose concentration (Figure
6.28). This behavior has already be seen by Kaushik and Bhat [140]. Trehalose in negatively
adsorbed at the water/air interface. The surface excess concentration of the solute over that
in bulk solution, Γ, can be calculated by:
Γ = − 1
RT
(dγ
dlnc
), (6.12)
where c is the solute concentration in the bulk phase of the aqueous solution, R is the univer-
sal gas constant, T is the temperature, and γ is the interfacial tension. Figure 6.29 illustrates
that Γ is negative at all trehalose concentrations and the value converges to an upper limit of
approximately -0.0050 mg/m2 for a saturated solution (=68.9%) of trehalose [141]. The con-
centration of trehalose inside the liquid phase compared to the concentration at the boundary
surface to the vapor decreases, i.e. the difference becomes smaller.
The relation between the contact angle and the surface tension of a drop on a planar solid

108 6 Results
5 10 15 20 25 30
5
35
40
45
Con
tact
ang
le [°
]
Trehalose concentration [%]
Vial base Microscope slide
Figure 6.27: Effect of the trehalose (w/v) concentration on the contact angle [] between a vialbase (square) or an microscope slide (circle) and the aqueous solution of tre-halose. The coordinates for the contact angle are the mean average ± standarderror of all values obtained (n=5).
surface is given by the Young’s equation:
γSG = γSL + γLG · cosΘ, (6.13)
where γSG, γSL, and γLG are the interfacial tensions between the the solid and the vapor, the
solid and the liquid, and the liquid and the vapor, respectively. Θ is the contact angle []. As
γLG increases in Figure 6.28, the Θ also decreases in Figure 6.27. The solid/gas interfacial
tension has to be independent of the trehalose concentration. From Equation 6.13 it is there-
fore apparent that the increasing value of γLG and the decreasing value of Θ with increasing
trehalose concentration indicate a decreasing value of γSL. Trehalose decreases therefore
the value γSL likely by an adsorption to the surface of the microscope slide. This behav-
ior is favored by the decreasing excess concentration at the glass/liquid interface found at
higher trehalose concentrations (Figure 6.29). Increasing trehalose concentration improves
therefore the wetting behavior of the inner vial wall by the solution.

6.1 Endpoint Evaluation Method 109
5 10 15 20 25 30
73,2
73,3
73,4
73,5
73,6
73,7
73,8
73,9
Sur
face
tens
ion
[mN
/m]
Trehalose concentration [%]
Figure 6.28: Effect of the trehalose (w/v) concentration on the surface tension [mN/m] of anaqueous solution. The coordinates for the surface tension are the mean average± standard error of all values obtained (n=6).
This experiment was intend to correlate the adhesion of the product to the wall of the vial
to the amount of shrinkage. Should Γ at the liquid/solid interface be positive, then an adhe-
sive effect of the solid trehalose cake produced during primary drying to the inner vial wall
is possible. During drying shrinkage occurs to balance the tensions that are built up [142].
If the adhesion between the dried cake and the glass vial is high, then any shrinkage of
the lyophilizate mass to relax these tensions in the cake will be hindered. When the tensions
exceed the cohesion within the cake, the lyophilizate mass will now fracture or crack for relax-
ation. This explains the low amount of shrinkage and the high values of cracking of samples
with 20% and 30% trehalose. If the tensions that occur during drying are greater than the
adhesion of the cake to the wall of the vial, but are lower than the cohesive forces, then
shrinkage occurs. This behavior appears at samples with a trehalose concentration lower
than 20%. The simultaneous occurrence of shrinkage and cracking with 5-20% trehalose,
indicate that adhesion and cohesion are of similar strength.

110 6 Results
5 10 15 20 25 30-0,0080
-0,0075
-0,0070
-0,0065
-0,0060
-0,0055
-0,0050S
urfa
ce e
xcce
ss [m
g/m
²]
Trehalose concentration [%]
Figure 6.29: Surface excess concentration, Γ, as a function of solution concentration of tre-halose solutions.
6.1.7 Impact of the Fill Height and the Vial Diameter
Solutions were filled in 2R and 10R vials with a fill height of 2.5 mm or 5 mm and are
lyophilized with cycle 1 (see chapter 5.2.3) in the hexagonal positioning of the vials. Figure
6.30 shows the cracking values obtained for each trehalose concentration prepared in both
vial sizes at both fill heights. The curves for cracking have similar shape over all trehalose
concentrations. Cracking decreases in the order 10R 5 mm > 10R 2.5 mm > 2R 2.5 mm >
2R 5 mm. Cracking is therefore more pronounced in vials with a larger diameter. Cracking
increases to a greater extent in 2R vials than in 10R vials with rising trehalose concentration.
The result is a similar degree of cracking at trehalose concentration ≥ 20%. With 2R vials
the smaller fill height causes higher cracking values compared to the higher fill height, but at
10R vials no impact of the fill height on cracking is observed.
Figure 6.31 illustrates the shrinkage values obtained for each trehalose concentration pre-
pared in both vial sizes and at both fill heights. The curves for shrinkage have similar shape
over all trehalose concentrations. Shrinkage decreases in the order 2R 5 mm > 2R 2.5 mm
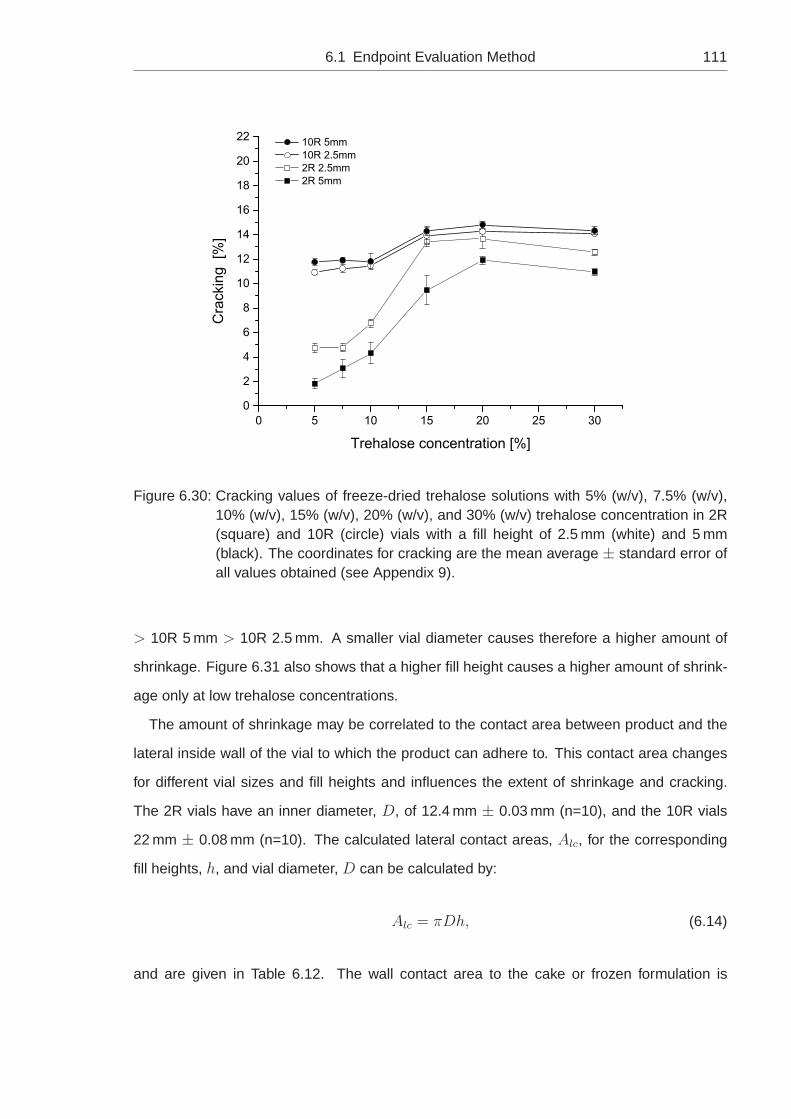
6.1 Endpoint Evaluation Method 111
0 5 10 15 20 25 300
2
4
6
8
10
12
14
16
18
20
22 10R 5mm 10R 2.5mm 2R 2.5mm 2R 5mm
Trehalose concentration [%]
Cra
ckin
g [%
]
Figure 6.30: Cracking values of freeze-dried trehalose solutions with 5% (w/v), 7.5% (w/v),10% (w/v), 15% (w/v), 20% (w/v), and 30% (w/v) trehalose concentration in 2R(square) and 10R (circle) vials with a fill height of 2.5 mm (white) and 5 mm(black). The coordinates for cracking are the mean average ± standard error ofall values obtained (see Appendix 9).
> 10R 5 mm > 10R 2.5 mm. A smaller vial diameter causes therefore a higher amount of
shrinkage. Figure 6.31 also shows that a higher fill height causes a higher amount of shrink-
age only at low trehalose concentrations.
The amount of shrinkage may be correlated to the contact area between product and the
lateral inside wall of the vial to which the product can adhere to. This contact area changes
for different vial sizes and fill heights and influences the extent of shrinkage and cracking.
The 2R vials have an inner diameter, D, of 12.4 mm ± 0.03 mm (n=10), and the 10R vials
22 mm ± 0.08 mm (n=10). The calculated lateral contact areas, Alc, for the corresponding
fill heights, h, and vial diameter, D can be calculated by:
Alc = πDh, (6.14)
and are given in Table 6.12. The wall contact area to the cake or frozen formulation is

112 6 Results
0 5 10 15 20 25 30
2
4
6
8
10
12
14
16
18
20
22 2R 5mm 2R 2.5mm 10R 5mm 10R 2.5mm
Trehalose concentration [%]
Shr
inka
ge [%
]
Figure 6.31: Shrinkage values of freeze-dried trehalose solutions with 5% (w/v), 7.5% (w/v),10% (w/v), 15% (w/v), 20% (w/v), and 30% (w/v) trehalose concentration in 2R(square) and 10R (circle) vials with a fill height of 2.5 mm (white) and 5 mm(black). The coordinates for shrinkage are the mean average ± standard errorof all values obtained (see Appendix 9).
2.5 mm 5 mm
2R 97 mm2 195 mm2
10R 173 mm2 346 mm2
Table 6.12: Lateral contact areas in dependence of the fill heights in a 2R and a 10R vial.
therefore 1.8 times larger in a 10R vial than in a 2R vial. If the area of the vial’s glass at
which the cake or frozen formulation can adhere to is larger, than may the interaction of the
product to the glass be more pronounced. The detachment of the cake from the inside wall
of the vial to relax stress may therefore be easier in a 2R vial with a smaller Alc than in a
10R vial with a larger Alc. Shrinkage is therefore more pronounced in a vial with a smaller
diameter.
In a 10R vial this stronger adhesion results in the higher amount of cracking, as the drying
tensions must be released this way. This observation confirms the relation between a low
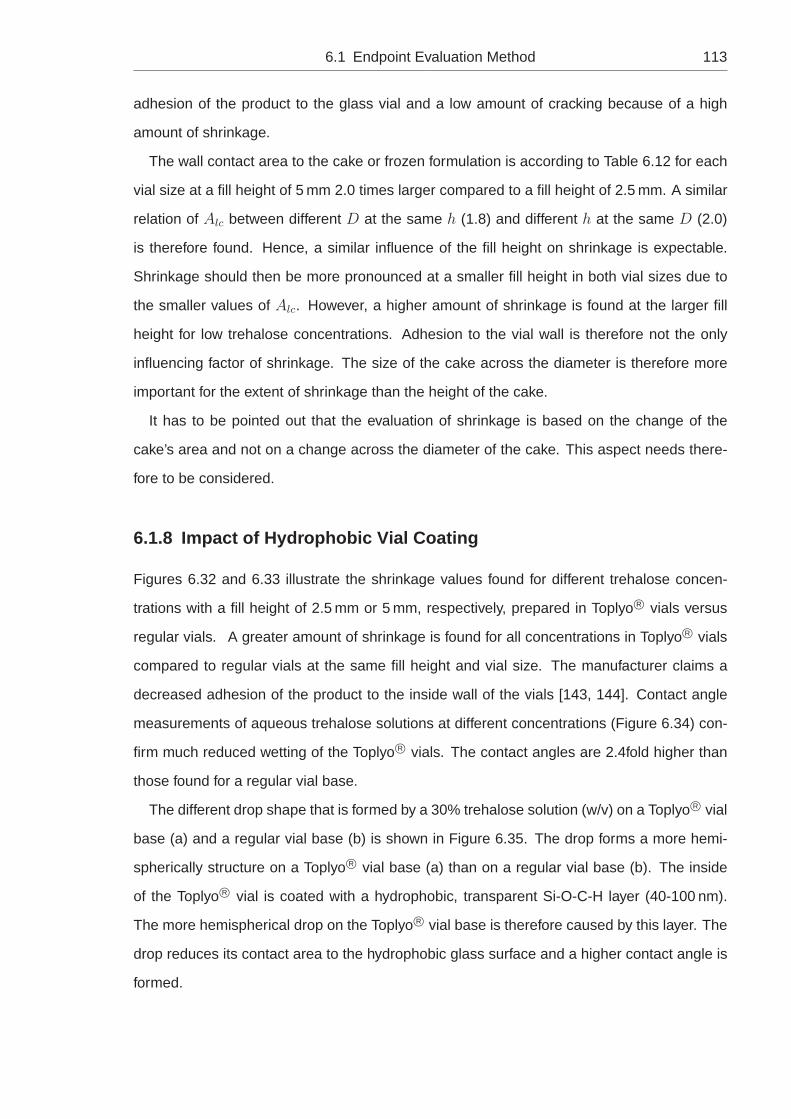
6.1 Endpoint Evaluation Method 113
adhesion of the product to the glass vial and a low amount of cracking because of a high
amount of shrinkage.
The wall contact area to the cake or frozen formulation is according to Table 6.12 for each
vial size at a fill height of 5 mm 2.0 times larger compared to a fill height of 2.5 mm. A similar
relation of Alc between different D at the same h (1.8) and different h at the same D (2.0)
is therefore found. Hence, a similar influence of the fill height on shrinkage is expectable.
Shrinkage should then be more pronounced at a smaller fill height in both vial sizes due to
the smaller values of Alc. However, a higher amount of shrinkage is found at the larger fill
height for low trehalose concentrations. Adhesion to the vial wall is therefore not the only
influencing factor of shrinkage. The size of the cake across the diameter is therefore more
important for the extent of shrinkage than the height of the cake.
It has to be pointed out that the evaluation of shrinkage is based on the change of the
cake’s area and not on a change across the diameter of the cake. This aspect needs there-
fore to be considered.
6.1.8 Impact of Hydrophobic Vial Coating
Figures 6.32 and 6.33 illustrate the shrinkage values found for different trehalose concen-
trations with a fill height of 2.5 mm or 5 mm, respectively, prepared in Toplyo R© vials versus
regular vials. A greater amount of shrinkage is found for all concentrations in Toplyo R© vials
compared to regular vials at the same fill height and vial size. The manufacturer claims a
decreased adhesion of the product to the inside wall of the vials [143, 144]. Contact angle
measurements of aqueous trehalose solutions at different concentrations (Figure 6.34) con-
firm much reduced wetting of the Toplyo R© vials. The contact angles are 2.4fold higher than
those found for a regular vial base.
The different drop shape that is formed by a 30% trehalose solution (w/v) on a Toplyo R© vial
base (a) and a regular vial base (b) is shown in Figure 6.35. The drop forms a more hemi-
spherically structure on a Toplyo R© vial base (a) than on a regular vial base (b). The inside
of the Toplyo R© vial is coated with a hydrophobic, transparent Si-O-C-H layer (40-100 nm).
The more hemispherical drop on the Toplyo R© vial base is therefore caused by this layer. The
drop reduces its contact area to the hydrophobic glass surface and a higher contact angle is
formed.

114 6 Results
0 5 10 15 20 25 300
2
4
6
8
10
12
14
16
18
20
22
24 2R 2.5mm Toplyo 2R 2.5mm 10R 2.5mm Toplyo 10R 2.5mm
Trehalose concentration [%]
Shr
inka
ge [%
]
Figure 6.32: Shrinkage values of freeze-dried trehalose solutions with 5% (w/v), 7.5% (w/v),10% (w/v), 15% (w/v), 20% (w/v), and 30% (w/v) trehalose concentration witha fill height of 2.5 mm in 2R (circle) and 10R (square) vials prepared in regularvials (black) and Toplyo R© vials (white). The coordinates for shrinkage are themean average ± standard error of all values obtained (see Appendix 9).
As already discussed above (see chapter 6.1.6), Γ appears to be positive at the liquid/solid
interface. An adhesive effect of the solid trehalose cake produced during primary drying to
the inner vial wall is therefore possible. The higher contact angles indicate that an adhesive
effect is reduced in Toplyo R© vials compared to regular vials. Shrinkage of the freeze-dried
cake to relax the drying tensions will then be favored in a Toplyo R© vial compared to a regular
vial. The result is a higher amount of shrinkage found for samples freeze-dried in Toplyo R©
vials.
Figures 6.32 and 6.33 show that the shape of the curves for shrinkage are different. The
values of shrinkage decrease at higher trehalose concentration to the same extent for both
10R vials (regular and Toplyo R©). For the 2R vials, however, the values of shrinkage decrease
less in Toplyo R© vials than in regular vials as trehalose concentration increases. The differ-
ences in shrinkage between the Toplyo R© vials and the regular vials are always smaller in
2R vials than in 10R vials. This can be explained by the lateral contact area Alc. As shown

6.1 Endpoint Evaluation Method 115
0 10 20 300
2
4
6
8
10
12
14
16
18
20
22
24 2R 5mm Toplyo 2R 5mm 10R 5mm Toplyo 10R 5mm
Trehalose concentration [%]
Shr
inka
ge [%
]
Figure 6.33: Shrinkage values of freeze-dried trehalose solutions with 5% (w/v), 7.5% (w/v),10% (w/v), 15% (w/v), 20% (w/v), and 30% (w/v) trehalose concentration with afill height of 5 mm in 2R (circle) and 10R (square) vials prepared in regular vials(black) and Toplyo R© vials (white). The coordinates for shrinkage are the meanaverage ± standard error of all values obtained (see Appendix 9).
in Table 6.12, Alc is larger in a 10R vial greater than in a 2R vial for both fill heights. The
area available for adhesion is greater in a vial with a larger vial diameter. The reduction in
adhesion achieved in Toplyo R© vials is then stronger in a 10R vial than in a 2R vial. This effect
is more pronounced at higher trehalose concentrations due to a higher adhesion of a more
dense cake structure and causes the parallel run of the curves for the 10R vials. Because
of the lower contact area in 2R vials, the influence of adhesion is less pronounced at higher
trehalose concentrations and the concentration dependence is more distinct.
The values obtained for cracking in regular vials and Toplyo R© vials are plotted against the
different trehalose solutions for both fill heights and vial sizes in Figures 6.36 and 6.37.
For all concentrations, fill heights and vial sizes a lower amount of cracking is found in the
Toplyo R© vials. The amount of cracking is reduced to below 2% in the concentration range
≤ 15%. This reduction is particularly pronounced for the samples prepared in 10R vials at
both fill heights. The use of 10R Toplyo R© instead of regular 10R vials leads to a reduction in

116 6 Results
5 10 15 20 25 30
40
80
90C
onta
ct a
ngle
[°]
Trehalose concentration [%]
Toplyo vial base Vial base
Figure 6.34: Effect of the trehalose (w/v) concentration on the contact angle [] between aToplyo R© vial base (square) or a regular vial base (circle) and the aqueous solu-tion of trehalose. The coordinates for the contact angle are the mean average± standard error of all values obtained (n=7).
(a) (b)
Figure 6.35: Sample images of aqueous solutions with 30% trehalose on a) a Toplyo R© vialbase and b) a regular vial base taken with an OCA 20 contact angle measuringdevice.

6.1 Endpoint Evaluation Method 117
0 10 20 300
2
4
6
8
10
12
14
16
18
20 10R 2.5mm 2R 2.5mm 2R 2.5mm Toplyo 10R 2.5mm Toplyo
Trehalose concentration [%]
Cra
ckin
g [%
]
Figure 6.36: Cracking values of freeze-dried trehalose solutions with 5% (w/v), 7.5% (w/v),10% (w/v), 15% (w/v), 20% (w/v), and 30% (w/v) trehalose concentration witha fill height of 2.5 mm in 2R (circle) and 10R (square) vials prepared in regularvials (black) and Toplyo R© vials (white). The coordinates for cracking are themean average ± standard error of all values obtained (see Appendix 9).
cracking from about 11%-12% to 0%-1.5%. At 2R vials, however, only a reduction from 2%-
9% to nearly 0% is observed. The large reduction in cracking by the use of Toplyo R© vials is
caused by greater shrinkage that releases the drying tensions. Cracking is then reduced. As
shrinkage is more pronounced in 10R than in 2R vials, a higher reduction in cracking takes
place.
Figures 6.38 and 6.39 show representative sample images of all trehalose concentrations
and compare the crack patterns that arise in regular 2R vials (left) and 2R Toplyo R© vials
(right). The Toplyo R© 2R vials illustrate the lower amount of cracking as well as the higher
amount of shrinkage compared to regular 2R vials. The sample images of the Toplyo R© vials
at concentrations between 5% and 15% (Figure 6.38(b), (d), (f) and 6.39(b)) show a more-
or-less intact cake structure with at most some fine cracks that propagate from the outside of
the cake to its center. The reduction of cracking with Toplyo R© vials is obvious, especially at
trehalose concentrations higher than 7.5%, where distinct cracks are found.
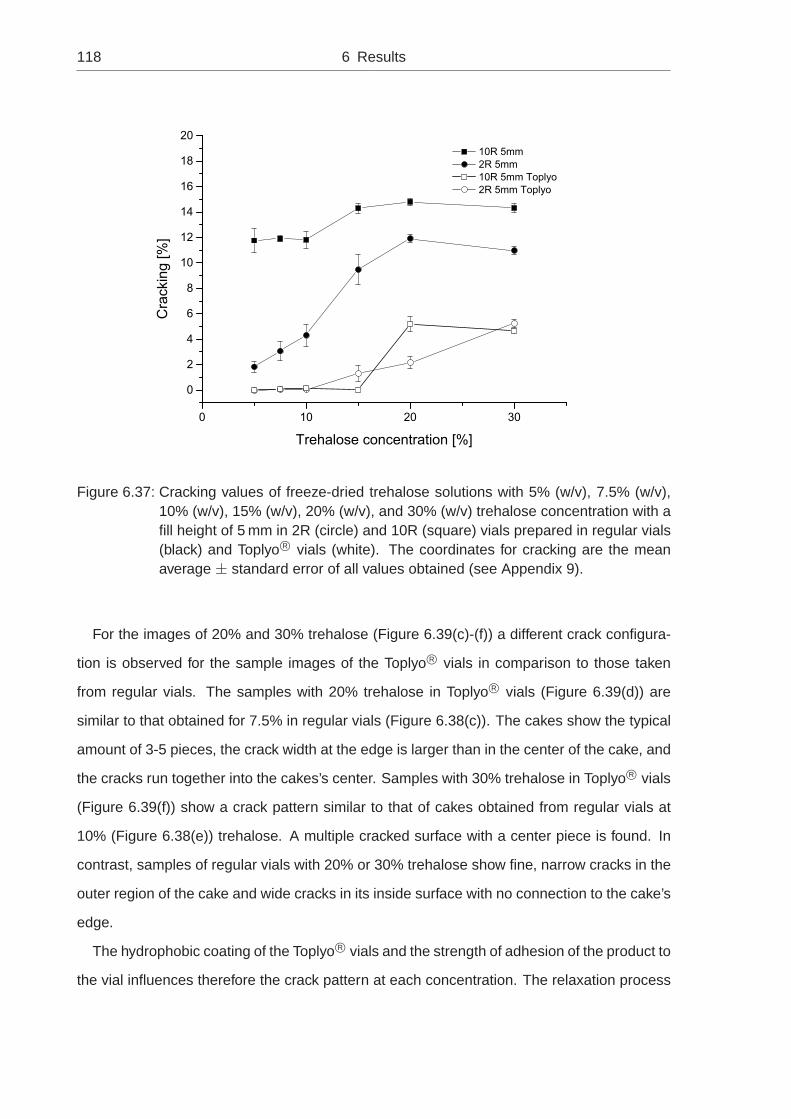
118 6 Results
0 10 20 30
0
2
4
6
8
10
12
14
16
18
20 10R 5mm 2R 5mm 10R 5mm Toplyo 2R 5mm Toplyo
Trehalose concentration [%]
Cra
ckin
g [%
]
Figure 6.37: Cracking values of freeze-dried trehalose solutions with 5% (w/v), 7.5% (w/v),10% (w/v), 15% (w/v), 20% (w/v), and 30% (w/v) trehalose concentration with afill height of 5 mm in 2R (circle) and 10R (square) vials prepared in regular vials(black) and Toplyo R© vials (white). The coordinates for cracking are the meanaverage ± standard error of all values obtained (see Appendix 9).
For the images of 20% and 30% trehalose (Figure 6.39(c)-(f)) a different crack configura-
tion is observed for the sample images of the Toplyo R© vials in comparison to those taken
from regular vials. The samples with 20% trehalose in Toplyo R© vials (Figure 6.39(d)) are
similar to that obtained for 7.5% in regular vials (Figure 6.38(c)). The cakes show the typical
amount of 3-5 pieces, the crack width at the edge is larger than in the center of the cake, and
the cracks run together into the cakes’s center. Samples with 30% trehalose in Toplyo R© vials
(Figure 6.39(f)) show a crack pattern similar to that of cakes obtained from regular vials at
10% (Figure 6.38(e)) trehalose. A multiple cracked surface with a center piece is found. In
contrast, samples of regular vials with 20% or 30% trehalose show fine, narrow cracks in the
outer region of the cake and wide cracks in its inside surface with no connection to the cake’s
edge.
The hydrophobic coating of the Toplyo R© vials and the strength of adhesion of the product to
the vial influences therefore the crack pattern at each concentration. The relaxation process

6.1 Endpoint Evaluation Method 119
(a) (b)
(c) (d)
(e) (f)
Figure 6.38: Sample images of lyophilizates with a fill height of 2.5 mm and 5% (a,b) , 7.5%(c,d), 10% (e,f) (w/v) trehalose. Left: regular 2R vial, right: Toplyo R© 2R vial.

120 6 Results
(a) (b)
(c) (d)
(e) (f)
Figure 6.39: Sample images of lyophilizates with 2.5 mm and 15% (a,b), 20% (c,d) and 30%(e,f) (w/v) trehalose. Left: regular 2R vial, right: Toplyo R© 2R vial.

6.1 Endpoint Evaluation Method 121
of the cake at a particular concentration is altered by the different adhesion behavior and
confirms a connection between the extent of shrinkage and cracking. Figures 6.38 and 6.39
show that a more intact cake structure is found for samples prepared in a Toplyo R© vial, as well
as less fragments that stick to the inside of the glass vial. These advantages of Toplyo R© vials
as noted by Dietrich et. al. [145] are shown quantitatively in the current work. The ”optimized
geometry” of the vial may also hinder the adherence [143, 144].
6.1.9 Impact of a Variation of the Freezing Step
Solutions at different trehalose concentrations were filled into 2R and 10R vials with a fill
height of 2.5 mm or 5 mm and lyophilized with cycle 1 (see chapter 5.2.3). The standard
shelf cooling rate of 0.4 C/min was varied to a slower rate of 0.2 C/min. For a high cooling
rate (”shock freezing”) liquid nitrogen (LN2) was used filled in a metal tray with immersion
of the samples, as illustrated in Figure 6.40. The frozen samples were then transferred to
the pre-cooled shelf (-40 C) of the freeze-drier, arranged in the hexagonal positioning and
surrounded by frozen dummy vials. The subsequent steps of cycle 1 were performed after
an equilibration time (at -40 C) of at least 2 h.
Figure 6.40: Freezing of the samples with liquid nitrogen.

122 6 Results
6.1.9.1 Standard Cooling Rate versus Slow Cooling Rate
The values for shrinkage obtained for different cooling rates, different vial sizes and different
fill heights are illustrated in the Figures 6.41 - 6.44. It can be seen that a higher amount
0 10 20 30
0
2
4
6
8
10
12
14
16
18
20
22
24 10R 2.5mm Shock freezing 10R 2.5mm Slow cooling rate 10R 2.5mm Standard cooling rate
Shr
inka
ge [%
]
Trehalose concentration [%]
Figure 6.41: Shrinkage values of freeze-dried trehalose solutions with 5% (w/v), 7.5% (w/v),10% (w/v), 15% (w/v), 20% (w/v), and 30% (w/v) trehalose concentration with afill height of 2.5 mm in 10R vials obtained from samples with the standard coolingrate (black square), a slow cooling rate (white circle) and by shock freezing(black circle). The coordinates for shrinkage are the mean average ± standarderror of all values obtained (see Appendix 9).
of shrinkage is found with the slow cooling rate in comparison with the standard cycle. The
application of a slower cooling rate promotes cake detachment from the inside walls of the
vial.
A slow cooling rate can lead to a higher degree of supercooling, to a faster subsequent
solution freezing rate, and to a high number of small ice crystals [24]. At the same trehalose
concentration, smaller ice crystals have a higher specific surface area within the whole sam-
ple. At the boundary between product and glass this may lead to a smaller contact area
between trehalose and the glass and to less adhesion. An easier detachment of the cake
from the inside wall of the vial is promoted and more shrinkage occurs. However, as Figure

6.1 Endpoint Evaluation Method 123
0 10 20 30
0
2
4
6
8
10
12
14
16
18
20
22
24 10R 5mm Slow cooling rate 10R 5mm Standard cooling rate 10R 5mm Shock freezing
Shr
inka
ge [%
]
Trehalose concentration [%]
Figure 6.42: Shrinkage values of freeze-dried trehalose solutions with 5% (w/v), 7.5% (w/v),10% (w/v), 15% (w/v), 20% (w/v), and 30% (w/v) trehalose concentration with afill height of 5 mm in 10R vials obtained from samples with the standard coolingrate (black square), a slow cooling rate (white circle) and by shock freezing(black circle). The coordinates for shrinkage are the mean average ± standarderror of all values obtained (see Appendix 9).
6.45 illustrates, similar pore sizes for both slow and standard cooling rates are observed.
Another possible reason may be the more homogeneous cake structure illustrated in Fig-
ure 6.45(a) in comparison to the heterogeneous cake structure obtained for the standard
cooling rate (Figure 6.45(b)). A more uniform cake structure could give the cake a better
coherence and an easier detachment of the cake from the vial wall causing more shrinkage.
Figures 6.46 - 6.49 show for all trehalose concentrations that the slow cooling rate
(0.2 C/min) causes a lower amount of cracking in both vial sizes at both fill heights com-
pared to the standard cooling rate. This reduction in cracking is especially pronounced for
samples in 10R vials with the smaller fill height (Figure 6.48) where for all concentrations
nearly 0% cracking is achieved. The same strong reduction is observed in 2R vials with the
higher fill height up to 20% trehalose (Figure 6.47). Such low cracking values are only seen
at the lowest trehalose concentration with the 2R vial/2.5 mm (Figure 6.46) or with 10R/5 mm

124 6 Results
0 10 20 300
2
4
6
8
10
12
14
16
18
20
22
24S
hrin
kage
[%]
Trehalose concentration [%]
2R 2.5mm Slow cooling rate 2R 2.5mm Standard cooling rate 2R 2.5mm Shock freezing
(a)
Figure 6.43: Shrinkage values of freeze-dried trehalose solutions with 5% (w/v), 7.5% (w/v),10% (w/v), 15% (w/v), 20% (w/v), and 30% (w/v) trehalose concentration with afill height of 2.5 mm in 2R vials obtained from samples with the standard coolingrate (black square), a slow cooling rate (white circle) and by shock freezing(black circle). The coordinates for shrinkage are the mean average ± standarderror of all values obtained (see Appendix 9).
(Figure 6.49).
The more uniform cake structure found for samples with the slow cooling rate (see Figure
6.45) is a possible explanation for the lower amount of cracking obtained for these samples.
The heterogeneous regions of the cake structure formed by standard cooling rate constitute
a defect in the material’s structure. Small pores adjacent to larger pores are similar to a
localized lattice distortion that leads to a higher stress in this region and promotes cracking.
In a uniform cake structure the drying tensions are evenly distributed over the whole structure
and stress hotspots are less likely.
The mechanical properties of porous materials are influenced by the homogeneity of their
pore distribution [134]. An increase in the material’s strength is achieved by a homogeneous
and integrated solid network [146, 147]. Inhomogeneity of the pore structure leads to differ-

6.1 Endpoint Evaluation Method 125
0 10 20 30
0
2
4
6
8
10
12
14
16
18
20
22
24
Shr
inka
ge [%
]
Trehalose concentration [%]
2R 5mm Standard cooling rate 2R 5mm Slow cooling rate 2R 5mm Shock freezing
Figure 6.44: Shrinkage values of freeze-dried trehalose solutions with 5% (w/v), 7.5% (w/v),10% (w/v), 15% (w/v), 20% (w/v), and 30% (w/v) trehalose concentration with afill height of 5 mm in 2R vials obtained from samples with the standard coolingrate (black square), a slow cooling rate (white circle) and by shock freezing(black circle). The coordinates for shrinkage are the mean average ± standarderror of all values obtained (see Appendix 9).
(a) (b)
Figure 6.45: SEM of a freeze-dried trehalose solution (10% (w/v)). (a): slow cooling rate, (b):standard cooling rate, both at 3000x magnification.

126 6 Results
0 10 20 30
0
2
4
6
8
10
12
14
16
18
20 2R 2.5mm Standard cooling rate 2R 2.5mm Shock freezing 2R 2.5mm Slow cooling rate
Cra
ckin
g [%
]
Trehalose concentration [%]
Figure 6.46: Cracking values of freeze-dried trehalose solutions with 5% (w/v), 7.5% (w/v),10% (w/v), 15% (w/v), 20% (w/v), and 30% (w/v) trehalose concentration with afill height of 2.5 mm in 2R vials obtained from samples with the standard (blacksquare), a slow (white circle) cooling rate and by shock freezing (black circle).The coordinates for cracking are the mean average ± standard error of all valuesobtained (see Appendix 9).
ences in the density distribution that cause regional differences in material behavior within
a sample [148]. Some regions have therefore low strength and a fracture of the sample in
this region is favored. A high amount of cracking may therefore be caused by nonuniform
pore structure. The large reduction in cracking by the use of a slower cooling rate could be
caused by a more homogeneous pore structure. However, more important than this may be
the greater amount of shrinkage of these samples, as already observed. Drying tensions are
released by shrinkage and then less cracking occurs as the tensile fracture toughness is not
exceeded. The more homogeneous pore structure found at these samples may only favor
this behavior.

6.1 Endpoint Evaluation Method 127
0 10 20 30
0
2
4
6
8
10
12
14
16
18
20
Cra
ckin
g [%
]
Trehalose concentration [%]
2R 5mm Shock freezing 2R 5mm Standard cooling rate 2R 5mm Slow cooling rate
Figure 6.47: Cracking values of freeze-dried trehalose solutions with 5% (w/v), 7.5% (w/v),10% (w/v), 15% (w/v), 20% (w/v), and 30% (w/v) trehalose concentration witha fill height of 5 mm in 2R vials obtained from samples with the standard (blacksquare), a slow (white circle) cooling rate and by shock freezing (black circle).The coordinates for cracking are the mean average ± standard error of all valuesobtained (see Appendix 9).
6.1.9.2 Standard Cooling Rate versus Shock Freezing
Figures 6.41 - 6.44 show for samples frozen with liquid nitrogen (”shock freezing”) no clear
pattern of shrinkage compared to samples obtained by the standard cooling rate. Even the
concentration dependence of shrinkage (higher shrinkage values for low trehalose) is only
observed for a fill height of 2.5 mm in both vial sizes and is not as pronounced as seen
before. But a lower amount of cracking is found for the shock frozen samples (Figures 6.46
- 6.49). It has to be pointed out that this tendency is not found in 2R/5 mm (Figure 6.47) at
concentrations ≤ 10% trehalose.
Figure 6.50 illustrates the pore structure of freeze-dried samples obtained by the standard
freezing rate (a) and shock freezing (b)-(d). The pores of the freeze-dried cake obtained by
shock freezing are narrow, long and lamellar with a degree of vertical orientation at the base
and the sides of the cake. The spherulitic, non-orientated pores produced with the standard

128 6 Results
0 10 20 30
0
2
4
6
8
10
12
14
16
18
20
Cra
ckin
g [%
]
Trehalose concentration [%]
10R 2.5mm Standard cooling rate 10R 2.5mm Shock freezing 10R 2.5mm Slow cooling rate
Figure 6.48: Cracking values of freeze-dried trehalose solutions with 5% (w/v), 7.5% (w/v),10% (w/v), 15% (w/v), 20% (w/v), and 30% (w/v) trehalose concentration with afill height of 2.5 mm in 10R vials obtained from samples with the standard coolingrate (black square), a slow cooling rate (white circle) and by shock freezing(black circle).The coordinates for cracking are the mean average ± standarderror of all values obtained (see Appendix 9).
cooling rate are only found in the middle of the cake.
A fine pore structure caused by shock freezing has already been found at Webb et. al.
[15], Searles et. al. [23, 149], and Dawson and Hockley [150]. It leads to a low degree of
supercooling and to a directional freezing due to the extreme temperature gradients along
the vial bottom and its sides [23]. This directional freezing takes place when a small portion
of the volume is supercooled to the point of ice nucleation. The fronts between nucleation
and freezing then move in the direction of the non-nucleated liquid (from the surfaces of
the vial inwards (Figure 6.50(c),(d)) and are temporal and spatially close together [23]. The
pores run therefore along the direction of freezing and the pore channels are oriented in a
plane normal to the ice front propagation. This lamellar structure is formed by the anisotropic
growth of ice (hexagonal crystal form of ice) and can exhibit a high mechanical strength. Its
strength depends on the nature of the material, increases with smaller channels and shows

6.1 Endpoint Evaluation Method 129
0 10 20 30
0
2
4
6
8
10
12
14
16
18
20
Cra
ckin
g [%
]
Trehalose concentration [%]
10R 5mm Standard cooling rate 10R 5mm Shock freezing 10R 5mm Slow cooling Rate
Figure 6.49: Cracking values of freeze-dried trehalose solutions with 5% (w/v), 7.5% (w/v),10% (w/v), 15% (w/v), 20% (w/v), and 30% (w/v) trehalose concentration with afill height of 5 mm in 10R vials obtained from samples with the standard coolingrate (black square), a slow cooling rate (white circle) and by shock freezing(black circle). The coordinates for cracking are the mean average ± standarderror of all values obtained (see Appendix 9).
a strongly anisotropic response the more the pores are unidirectionally orientated [151].
The lamellar structure at the edge of the cake obtained by shock freezing may therefore
influence the strength of the cake. A connection then exists between a stronger porous struc-
ture and a lower amount of cracking. As previous results show, a lower amount of cracking
is caused by a higher amount of shrinkage because of stress release by contraction of the
lyophilizate mass from the vial wall. This relation as well as the concentration dependence is
not seen clearly with the shock frozen samples. This point will be discussed later.
6.1.9.3 The Crack Pattern at Different Cooling Rates
The crack pattern and the cake appearance for different vial sizes, fill heights and cooling
rates is shown in Figure 6.51 for lyophilizates with 20% trehalose. The images show the
different cake appearances of samples frozen with liquid nitrogen in comparison to the shelf-

130 6 Results
(a) (b)
(c) (d)
Figure 6.50: SEM of a freeze-dried trehalose solution (10% (w/v)). (a): standard cooling rate(b): shock freezing, (c): shock freezing (lamellar structure at the wall of the vial),(d): shock freezing (lamellar structure at the wall and the bottom of the vial), allat 3000x magnification.
frozen samples with either standard or slow cooling rate. Shelf-frozen samples show, if cracks
are present, the typical crack pattern with fine and narrow cracks in the outer region of the
cake and an inwardly increasing crack width. The lower amount of cracking found at the slow
cooling rate compared to the standard cooling rate can also be seen. The strongest decrease
in cracking found at samples in 2R/5 mm and in 10R/2.5 mm is also visible.
For shock frozen samples in 2R/2.5 mm, a crack pattern similar to that of shelf frozen
samples at low trehalose concentrations is found. At all other shock frozen samples, however,
a different crack pattern is observed. In a 2R vial at 5 mm the cracks run lunate. In the 10R
vial at the low fill height the crack pattern is only similar to that of the self-frozen samples in

6.1 Endpoint Evaluation Method 131
2R 2.5 mm 2R 5 mm 10R 2.5 mm 10R 5 mm
Standard
Slow
Shock
CR
CR
Freezing
Figure 6.51: Sample images for 20% trehalose for different vial sizes, fill heights and coolingrates (CR).
the center cake region. The edge of the cake, however, is more intact compared to the cake
obtained by the standard cooling rate at the same fill height and the same vial size. In a 10R
vial at the high fill height sometimes star-like cracks are observed.
The edges of the cakes frozen with liquid nitrogen are less affected by cracks compared to
the samples frozen on the shelf. The edges of the cracks are more sharp. The detachment of
the lyophilizate mass from the vial is less complete with the samples that were shock frozen.
The crack patterns indicate therefore the different cracking and shrinkage behavior of these
samples. One possible cause is the different pore structure in the outer cake regions which is
formed by directional freezing. The lamellar arrangement of long pores with a small diameter
in the outer cake region would have a higher mechanical strength and can resist the drying
tensions to a greater extent than inside the cake structure. A different stress relaxation in
the sample over the cake’s diameter might occur. It is for this reason that the correlation
between shrinkage and cracking as well as the concentration dependency found for shelf-

132 6 Results
frozen samples is not seen with shock frozen samples.
6.1.10 Impact of the Freezing Protocol
Solutions with different trehalose concentrations were filled into 2R and 10R vials with a fill
height of 2.5 mm or 5 mm and freeze-dried in a hexagonal positioning of the vials with cycle
1 (see chapter 5.2.3). A two-step freezing process in combination with an annealing step
(”2stepA”) was implemented in the freezing phase.
The results of shrinkage for different vial sizes, fill heights and trehalose concentrations
are given in Figures 6.52 and 6.53. For all concentrations, all fill heights and all vial sizes a
0 10 20 300
2
4
6
8
10
12
14
16
18
20
22
24
Shr
inka
ge [%
]
Trehalose concentration [%]
2R 2.5mm 2stepA 2R 5mm 2stepA 2R 5mm 2R 2.5mm
Figure 6.52: Shrinkage values of freeze-dried trehalose solutions with 5% (w/v), 7.5% (w/v),10% (w/v), 15% (w/v), 20% (w/v), and 30% (w/v) trehalose concentration with afill height of 2.5 mm (square) and 5 mm (circle) in 2R vials obtained from sam-ples with the standard cycle (black) and a two-step freezing cycle with includedannealing (2stepA, white). The coordinates for shrinkage are the mean average± standard error of all values obtained (see Appendix 9).
higher amount of shrinkage is found with 2stepA in comparison to samples freeze-dried with
the standard cycle. Exceptions are the mean shrinkage values found in the 2R vial with a fill
height of 5 mm at low trehalose concentrations and in 10R vials at 30% trehalose for both fill

6.1 Endpoint Evaluation Method 133
0 10 20 30
2
4
6
8
10
12
14
16
18
20
22
24 10R 5mm 2stepA 10R 2.5mm 2stepA 10R 5mm 10R 2.5mm
Shr
inka
ge [%
]
Trehalose concentration [%]
Figure 6.53: Shrinkage values of freeze-dried trehalose solutions with 5% (w/v), 7.5% (w/v),10% (w/v), 15% (w/v), 20% (w/v), and 30% (w/v) trehalose concentration with afill height of 2.5 mm (square) and 5 mm (circle) in 10R vials obtained from sam-ples with the standard cycle (black) and a two-step freezing cycle with includedannealing (2stepA, white). The coordinates for shrinkage are the mean average± standard error of all values obtained (see Appendix 9).
heights. The use of the 2stepA cycle promotes therefore cake detachment from the inside
walls of the vial. This may be explained by the processes in the product that occur during ice
nucleation and annealing.
With the standard cycle different degrees of supercooling (about ± 3 C from the mean)
take place during freezing and cause variability in the porosity and the product appearance
of the lyophilizates (inter-vial heterogeneity) [92]. Intra-vial heterogeneity may also appear
which is influenced by the distribution of the solutes across the vial during freezing. The
distribution of solutes is determined in a vial with limited amount of water by the different
rates of ice nucleation and ice crystal growth [25]. During freezing with the standard cycle
the ice crystal growth is more rapid than the ice nucleation. Large ice crystal are therefore
formed and create heterogeneity in solute distribution [19]. It is also observed that the single-
step freezing used in the standard cycle causes vertical heterogeneity in the sample with a

134 6 Results
coarse-grained irregularity in the middle (concentrated core). This is formed in the freezing
stage which also causes heterogeneity in solute distribution [25, 19]. Such a coarse-grained
irregularity is also found for the standard cycle in this experiment, as illustrated in Figure
6.54(a).
(a) (b)
(c)
Figure 6.54: SEM of a freeze-dried trehalose solution 10% (w/v). (a): standard cycle (b)+(c):two-step freezing in combination with annealing, all at 3000x magnification.
To improve intra- and inter-vial homogeneity of ice crystallization a two-step freezing is
recommended by Tang and Pikal [31]. The vials should be equilibrated for about 15-30 min on
the shelves at 5 C. Afterward Ts is linearly decreased to -5 to -10 C and hold for 30-60 min.
This step is termed ”supercooling holding” and leads to a more homogeneous supercooling
state within the whole fill volume. By further decrease in Ts ice formation proceeds with a
greater rate of ice nucleation than of ice crystal growth. The ice formation occurs therefore
nearly instantaneous and is relatively homogeneous in the whole sample. A uniform intra-vial
distribution of solutes is achieved. This nucleation type causes many small ice crystals and
prevents vertical heterogeneity [25, 152].
Liu et. al. [25] reported that two-step freezing in conjunction with annealing results in high

6.1 Endpoint Evaluation Method 135
intra-vial cake uniformity. Annealing is a hold step at a specified subfreezing temperature for a
defined period and is routinely performed after freezing [153]. Its purpose is an improvement
in the inter-vial heterogeneity [31]. Annealing has a rigorous effect on the ice nuclei size
distribution. Annealing above T ′g causes melting of ice. Smaller ice crystals melt faster and
preferentially than larger ones, and very small ice crystals may melt completely. Furthermore,
the size of larger ice crystals increases by Ostwald ripening (recrystallization) as the water
migrates to larger ice crystals. This reduces the differences in ice crystal sizes between all
samples and the particle size distribution narrows. Since on further re-cooling the larger ice
crystals serve as nucleation sites, the small ice crystals do not reappear [149, 153].
Figures 6.54(b) and 6.54(c) show a sample of a freeze-dried cake received by the appli-
cation of two-step freezing with an additional annealing step. A more uniform pore structure
without vertical heterogeneity is visibly found. The pore sizes of the annealed samples frozen
with the two-step protocol sizes are visibly similar to those obtained by the standard cycle in
the coarse-grained region. This may be caused by melting and recrystallization during the
annealing step [25, 149, 153]. A possible reason for the higher amount of shrinkage is there-
fore the more homogeneous cake structure. Such a relation was also found for the slow
cooling rate (see chapter 6.1.9.1). A more uniform cake structure provides better coherence
and an easier detachment of the cake from the vial wall.
It also can be seen that the differences in shrinkage at trehalose concentrations ≥ 15%
are greater in 2R vials than in 10R vials. Furthermore less shrinkage is developed in 10R
vials compared to 2R vials for the 2stepA cycle at each concentration. A possible reason
may be the smaller contact area found in 2R vials than in 10R vials (see Table 6.12) which
favors shrinkage.
Figures 6.55 and 6.56 depict the values of cracking obtained by this process cycle with
different vial sizes and different fill heights.
It is apparent for all concentrations, fill heights and vial sizes that a lower amount of crack-
ing is achieved by the inclusion of 2stepA compared to the standard cycle. The homogeneous
cell structure obtained by the 2stepA protocol (see Figure 6.54) causes homogeneity in the
density distribution, a uniform material behavior within the whole sample and an increased
material strength [146, 147, 148]. Fracture caused by differences in the material strength
and density distribution may thereby be reduced. This behavior was already observed with

136 6 Results
0 10 20 30
0
2
4
6
8
10
12
14
16
Cra
ckin
g [%
]
Trehalose concentration [%]
2R 2.5mm 2R 5mm 2R 2.5mm 2stepA 2R 5mm 2stepA
Figure 6.55: Cracking values of freeze-dried trehalose solutions with 5% (w/v), 7.5% (w/v),10% (w/v), 15% (w/v), 20% (w/v), and 30% (w/v) trehalose concentration with afill height of 2.5 mm (square) and 5 mm (circle) in 2R vials obtained from sam-ples with the standard cycle (black) and a two-step freezing cycle with includedannealing (2stepA, white). The coordinates for cracking are the mean average± standard error of all values obtained (see Appendix 9).
samples freeze-dried at the slow cooling rate (see chapter 6.1.9.1). This cracking behavior
may also by explained by the greater amount of shrinkage found, as already observed for the
slow cooling rate (see chapter 6.1.9.1). Drying tensions are released by shrinkage and then
less cracking occurs since the tensile fracture limit is not exceeded. The more homogeneous
pore structure found at these samples may only favor this behavior.
6.1.11 Impact of a Variation of the Freezing Step in Combination with
the Use of a Toplyo R© Vial
Both 2stepA and the use of Toplyo R© vials lead individually to less cracking and more shrink-
age. A combination of both is now used to investigate any further influence on cake behavior.
Solutions were filled into 2R and 10R Toplyo R© vials with a fill height of 2.5 mm or 5 mm and

6.1 Endpoint Evaluation Method 137
0 10 20 30
0
2
4
6
8
10
12
14
16
10R 5mm 10R 2.5mm 10R 2.5mm 2stepA 10R 5mm 2stepA
Cra
ckin
g [%
]
Trehalose concentration [%]
Figure 6.56: Cracking values of freeze-dried trehalose solutions with 5% (w/v), 7.5% (w/v),10% (w/v), 15% (w/v), 20% (w/v), and 30% (w/v) trehalose concentration with afill height of 2.5 mm (square) and 5 mm (circle) in 10R vials obtained from sam-ples with the standard cycle (black) and a two-step freezing cycle with includedannealing (2stepA, white). The coordinates for cracking are the mean average± standard error of all values obtained (see Appendix 9).
were freeze-dried with cycle 1 with 2stepA in hexagonal positioning of the vials. Figures
6.57 and 6.58 show the values of shrinkage obtained for 2stepA in regular vials and Toplyo R©
vials. For all fill heights, vial sizes and trehalose concentrations a higher amount of shrink-
age is observed. The only exception is found in 2R vial with a fill height of 5 mm as no clear
difference is seen for the trehalose concentrations ≤ 15%.
The higher amount of shrinkage in a Toplyo R© vial compared to regular vials at these freez-
ing conditions can be explained by the hydrophobic layer of the Toplyo R© vial. A possible
reduction in adhesion of the cake to the inside glass may occur and shrinkage is then fa-
vored. Thus, the drying tensions must be released by shrinkage. Figure 6.59 compares the
pore structure of lyophilizates obtained in Toplyo R© vials (a)+(b) and regular vials (c)+(d) by
the usage of 2stepA. The pore structure of the cakes in a Toplyo R© vial show visibly the same
uniform, predominantly cell-closed pore structure as the lyophilizate freeze-dried in regular

138 6 Results
0 10 20 306
8
10
12
14
16
18
20
22
24S
hrin
kage
[%]
Trehalose concentration [%]
2R 2.5mm Topylo2stepA 2R 5mm Topylo2stepA 2R 5mm 2stepA 2R 2.5mm 2stepA
Figure 6.57: Shrinkage values of freeze-dried trehalose solutions with 5% (w/v), 7.5% (w/v),10% (w/v), 15% (w/v), 20% (w/v), and 30% (w/v) trehalose concentration with afill height of 2.5 mm (diamond) and 5 mm (square) in 2R vials obtained by a two-step freezing protocol with included annealing in regular vials (2stepA, white)and Toplyo R© vials (Toplyo2stepA, black) . The coordinates for shrinkage are themean average ± standard error of all values obtained (see Appendix 9).
vials. Over the whole fill height no regions with different pore structures are found. This ho-
mogeneous pore structure causes a better coherence and promotes an easy detachment of
the cake from the vial. Hence, more shrinkage is observed at the same cycle in a Toplyo R©
vial than in a regular vial.
From Figures 6.57 and 6.58 it is apparent that the differences in shrinkage between the
regular and Toplyo R© vials are more pronounced in 10R vials than in 2R vials. This was
already found in the comparison between regular vials and Toplyo R© vials at the standard
freeze-drying cycle. It confirms the greater influence of the hydrophobic layer at a higher
Alc. In addition, the differences are more pronounced at both vial sizes at higher trehalose
concentrations. This was also found in 2R vials at the comparison between regular vials
and Toplyo R© vials with the standard cycle. Adhesion may be greater at higher trehalose
concentrations and the influence of the hydrophobic layer is then more pronounced.

6.1 Endpoint Evaluation Method 139
0 10 20 302
4
6
8
10
12
14
16
18
20
22
24 10R 2.5mm Topylo2stepA 10R 5mm Topylo2stepA 10R 5mm 2stepA 10R 2.5mm 2stepA
Shr
inka
ge [%
]
Trehalose concentration [%]
Figure 6.58: Shrinkage values of freeze-dried trehalose solutions with 5% (w/v), 7.5% (w/v),10% (w/v), 15% (w/v), 20% (w/v), and 30% (w/v) trehalose concentration witha fill height of 2.5 mm (diamond) and 5 mm (square) in 10R vials obtained bya two-step freezing protocol with included annealing in regular vials (2stepA,white) and Toplyo R© vials (Toplyo2stepA, black) . The coordinates for shrinkageare the mean average ± standard error of all values obtained (see Appendix 9).
Figures 6.60 and 6.61 compare the cracking values obtained by Toplyo R© and regular vials.
The usage of Toplyo R© vials with the implementation of 2stepA leads to a further reduction
in cracking to < 0.5% in 2R vials for all concentrations. This reduction is in particular large
for trehalose concentrations higher than 15% where for the regular vials cracking of about
6.1% (20% trehalose (w/v)) or 10.0% (30% trehalose (w/v)) for the fill height of 2.5 mm and
3.4% (20% trehalose (w/v)) and 6.4% (30% trehalose (w/v)) for the fill height of 5 mm is
found. The same tendency is found for 10R Toplyo R© vials and both fill heights. For 20%
and 30% trehalose a reduction from 9% to <2% in Toplyo R© is reached. The concentration
dependence of cracking is therefore strongly reduced in Toplyo R© vials with a 2stepA freezing
protocol.
As the homogeneous pore structure is found in regular vials and also in Toplyo R© vials
(see Figure 6.59), the reduction in cracking is explained by the increased strength of the

140 6 Results
(a) (b)
(c) (d)
Figure 6.59: SEM of a freeze-dried trehalose solution 10% (w/v) obtained by two-step freez-ing in combination with annealing. (a)+(b): Toplyo R© vial, (c)+(d): regular vial,both freeze-dried with the 2stepA cycle, both at 3000x magnification.
lyophilizate. As already found (see chapter 6.1.9.1), the higher amount of shrinkage is more
crucial for reduced of cracking, as drying tensions must be released in this way. The tensile
fracture limit is then not exceeded. The more homogeneous pore structure found with these
samples may only favor this behavior.
Figure 6.62 illustrates some representative sample images of the lyophilizates. For sam-
ples at 15% trehalose or less (Figure 6.62 (a), (d)), the change in the cake appearance is
not as pronounced as for samples with a higher trehalose concentration. The images show
therefore no substantial difference.
A comparison of the images (b), (c) with (e), (f) in Figure 6.62 shows the large reduction
in cracking by change of container. Whereas wide cracks in the cake structure are found in
regular vials (b), (c), the cakes obtained with Toplyo R© vials (e), (f) show a whole entity with
only hair-line cracks. At samples with 30% trehalose in Toplyo R© vials (f) cracking occurs only
in the outer regions of the cake and an intact middle region is found. This middle region is
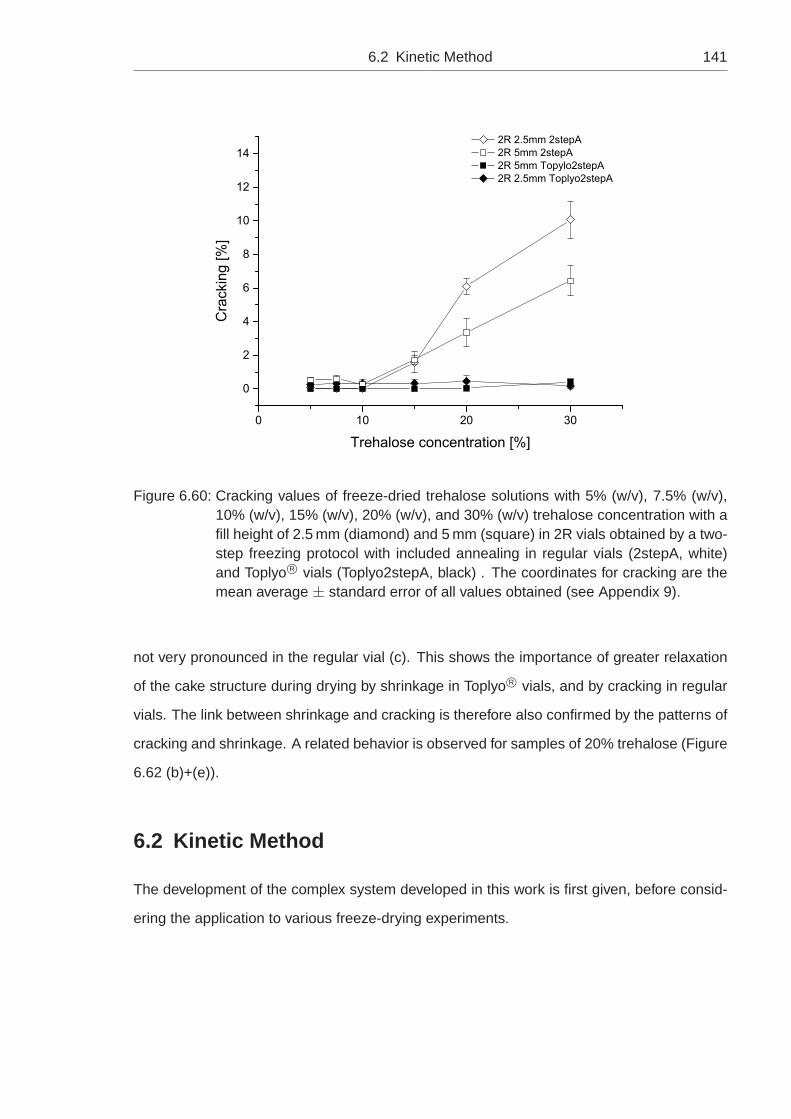
6.2 Kinetic Method 141
0 10 20 30
0
2
4
6
8
10
12
14 2R 2.5mm 2stepA 2R 5mm 2stepA 2R 5mm Topylo2stepA 2R 2.5mm Toplyo2stepA
Cra
ckin
g [%
]
Trehalose concentration [%]
Figure 6.60: Cracking values of freeze-dried trehalose solutions with 5% (w/v), 7.5% (w/v),10% (w/v), 15% (w/v), 20% (w/v), and 30% (w/v) trehalose concentration with afill height of 2.5 mm (diamond) and 5 mm (square) in 2R vials obtained by a two-step freezing protocol with included annealing in regular vials (2stepA, white)and Toplyo R© vials (Toplyo2stepA, black) . The coordinates for cracking are themean average ± standard error of all values obtained (see Appendix 9).
not very pronounced in the regular vial (c). This shows the importance of greater relaxation
of the cake structure during drying by shrinkage in Toplyo R© vials, and by cracking in regular
vials. The link between shrinkage and cracking is therefore also confirmed by the patterns of
cracking and shrinkage. A related behavior is observed for samples of 20% trehalose (Figure
6.62 (b)+(e)).
6.2 Kinetic Method
The development of the complex system developed in this work is first given, before consid-
ering the application to various freeze-drying experiments.

142 6 Results
0 10 20 30
0
2
4
6
8
10
12
14C
rack
ing
[%]
Trehalose concentration [%]
10R 2.5mm 2stepA 10R 5mm 2stepA 10R 5mm Topylo2stepA 10R 2.5mm Topylo2stepA
Figure 6.61: Cracking values of freeze-dried trehalose solutions with 5% (w/v), 7.5% (w/v),10% (w/v), 15% (w/v), 20% (w/v), and 30% (w/v) trehalose concentration witha fill height of 2.5 mm (diamond) and 5 mm (square) in 10R vials obtained bya two-step freezing protocol with included annealing in regular vials (2stepA,white) and Toplyo R© vials (Toplyo2stepA, black) . The coordinates for crackingare the mean average ± standard error of all values obtained (see Appendix 9).
6.2.1 Development of Online Video Method during Freeze-Drying
Some aspects of the endpoint detection method can be transferred to the kinetic method,
for example the cut vial without a stopper and a fixed camera mounting normal to the cake
surface. The influence of the use of a cut and unstoppered vial instead of a stoppered and
unmodified vial will be discussed later.
For camera fixation the center leg of the tripod is moved to a horizontal position to enable
positioning of the lens directly above the vial. The cut vial is placed on the top shelf to enable
an unobstructed view through the transparent PlexiglasTM cover of the freeze-drier. The cam-
era is linked to computer software (EOS Utilities) to enable automatic control. Sublimation
rate is measured during primary drying using a microbalance technique.
To keep the process conditions as far as possible equivalent to the endpoint evaluation
method, several dummy vials (stoppered, unmodified) containing the product formulation are

6.2 Kinetic Method 143
(a) (b) (c)
(d) (e) (f)
Figure 6.62: Sample images of lyophilizates freeze-dried in 2R vials with a fill height of 5 mmwith a two-step freezing and an annealing step in regular vials with (a): 15%,(b): 20%, and (c): 30% trehalose ((w/v), upper row) or in Toplyo R© vials with (d):15%, (e): 20%, and (f): 30% trehalose (w/v, lower row).
arranged in a hexagonal positioning around the microbalance and the sample vials. This
experimental setup is shown in Figure 6.63.
Atypical heat transfer is experienced by the weighing vial held in the microbalance. It is
exposed to the warmer surfaces of the front of the microbalance [29, 60, 46]. The weighing
vial is therefore not chosen for photography but only to estimate sublimation rate. A radiation
shield (Figure 6.63) is placed around the microbalance to protect the weighing vial against
mechanical interference. The weighing vial is cut like the sample vial.
The lifting system of the microbalance is constructed to lift the vial via a ring clamped
around its neck. A modified technique is therefore required for a cut vial without a neck. A O-
ring is clamped around the cut vial. As the position of the O-ring is lower than the cut-off neck,
the lifting arm needs to be adapted to the height of its sample holder. An extension (Figure

144 6 Results
Cut vial
Dummy vials
Sample vial
Microbalance
Radiation shield
Figure 6.63: Experimental setup of the vials in a hexagonal position around the microbalanceand the sample vial.
6.64(a)) was developed to lower the regular lifting arm and sample holder (Figure 6.64(b)).
The adapted lifting technique is illustrated in Figure 6.64(c)+(d). The six vials surrounding
the sample vials are cut similarly to the sample vial, since their necks obscure the view of the
sample vial. This group of cut vials is placed in a center position between the microbalance
and the edge vials to ensure uniform heat transfer (Figure 6.63).
To correlate the product temperature to shrinkage and cracking a TC is placed in one of
the cut sample vials. TC placement direct in the sample vial for photography is not possible
as heterogeneous ice nucleation might occur [22, 48]. This would influence the extent of
shrinkage and cracking.
The placement of the TC in a cut vial is illustrated in Figure 6.65(a), (b). To position the tip
of the TC in the center of the cut vial it is placed with its end at the outside wall of the vial.
This is fixed in a loop with adhesive tape to keep this position during subsequent operations.
The tip of the TC is then carefully bent with tweezers to the center base of the vial until it

6.2 Kinetic Method 145
(a) (b)
(c) (d)
Figure 6.64: Adaption of the lifting arm for the weighting of a cut vial. (a): lifting arm withextension, (b): regular lifting arm, (c) cut vial with o-ring in the lowered position,(d) cut vial with o-ring in the lifted position.
stays in the correct central position, as illustrated in Figure 6.65(a), (b).
6.2.1.1 Illumination of the Experiment Setup
To ensure constant and even light-exposure all windows of the laboratory are shaded during
the whole measurement. To prevent uncontrolled lateral exposure to light the freeze-drier’s
cover is blacked-out on its sides. This leads to a strong darkening of the images that requires
an adequate illumination.
Figure 6.66 illustrates that the inside wall of the vial and the outline of the cake can be
defined in all pictures. The contrast problem between cake structure and cracks as solved
by background light in the endpoint method cannot be transferred to the kinetic setup, since

146 6 Results
(a) (b)
Figure 6.65: Thermocouple placement in a cut vial.
the samples are placed on the shelf during freeze-drying. A uniform appearance of the cake
structure is, however, vital for crack detection as well as automatic image evaluation. Figure
6.66(a) shows the image taken with a large LED mounted next to the camera for highlight
exposure. Bright and wide reflections occur on the cake surface with circular reflections that
illuminate the cracks in some regions. Shadows are found which come from the upper edge
of the vial wall caused by the lateral mounting of the light source. This darkening makes the
cracks appear darker in some areas and further impairs non-uniform crack and cake structure
appearance. Automatic image evaluation would not be possible.
Figure 6.66(b) illustrates the changes in the image caused by a different positioning of the
large LED placed above the camera to minimize exposure to light. This improved arrange-
ment attenuates the distinct reflections of Figure 6.66(a), but some in the upper right and
lower left regions still exist. The shadows observed in the upper left and lower right regions
of the image maybe caused by camera mounting. These cause a non-uniform cake appear-
ance and automatic image evaluation as well as a manual image evaluation would not be
possible.
In Figure 6.66(c) the laboratory ceiling lighting in combination with a large LED is used to
achieve uniform illumination of the lyophilizate. The LED is fixed at a larger distance com-
pared to (b) above the camera to attenuate its reflections on the cake. With this uniform
illumination no shadows and only a small reflection in the lower right region appear on the

6.2 Kinetic Method 147
(a) (b) (c)
(d) (e) (f)
(g) (h) (i)
Figure 6.66: Images of lyophilizates during the development of the kinetic method. Illumina-tion by (a): LED mounted next to the camera, (b): LED mounted above the cam-era, (c): the ceiling lighting of the laboratory in combination with LED, (d): theceiling lighting of the laboratory in combination with LED and an energy-savinglamp (warm white), (e): the ceiling lighting of the laboratory in combination anenergy-saving lamp (white), (f): the ceiling lighting of the laboratory, only, (g):the ceiling lighting of the laboratory with covered reflection source, (h) the ceil-ing lighting of the laboratory with a polarizing filter, (i) the ceiling lighting of thelaboratory with a ring light extension for the camera.

148 6 Results
lyophilizate. The contrast between cracks in the edge region of the cake and the cake struc-
ture, however, is very low and a crack detection in these regions is not possible.
A combination of the ceiling lighting of the laboratory, a large LED, and a white energy-
saving lamp is illustrated in Figure 6.66(d). This arrangement leads to strong reflections in
the lower right area and a poor illumination in the upper left region of the cake. Accurate
crack detection is not possible, since pixels belonging to cracks have the same brightness
as those belonging to the cake structure. Use of the strong LED is therefore unfeasible for
the illumination of a lyophilizate in the freeze-drier. Its illumination power is too strong and
causes large reflections.
If a white energy-saver lamp is used in combination with the ceiling lighting, its effect on
the image of the cake is shown in Figure 6.66(e). A uniform cake structure, less reflections
compared to (b), (c) and (d), as well as good contrast between cracks located at the edge of
the cake and the cake structure are found. The picture, however, has poor quality and also
increased noise due to insufficient lighting. Automatic crack detection is not possible.
If only laboratory ceiling lighting is used to prevent reflections, the result is as in Figure
6.66(f). This result shows that the reflections come not only from the strong LED but also
from the laboratory ceiling lighting. Reflections similar to (b) can be seen in the right and
lower left regions. The cracks located in the upper region of the cake are hardly visible,
worse than in the experimental setup of (b).
The cause of the reflections from outside the freeze-drier is further investigated. The
metal mounting of the cover or the metal housing of the microbalance’s connector could
be the sources of reflections. These regions are therefore covered with paper towels. Some
possible sources of reflections are also located inside the freeze-drier and cannot be avoided,
such as the shelves, the dummy vials and the microbalance. The consequences of this
modification is shown in Figure 6.66(g), where the laboratory ceiling lighting is only used. A
uniform illumination of the lyophilizate is found with only some punctual reflections close to
the lower middle of the cake. No shadows are observed. With this adaption uniformity of the
cake structure is achieved. The separation of cracks from the cake structure, however, is not
possible in the outer regions of the cake due the low contrast between the pixels of the cake
structure and of the cracks.
To counter the reflections caused by reflective surfaces inside the freeze-drier, a circular

6.2 Kinetic Method 149
polarizing filter is placed in front of the camera macro lens. Since reflections are only partially
linearly-polarized, a linear polarizer gives a better balance of light in the image. The rotational
orientation of the filter is adjusted until the best effect is achieved. A circular polarizer is
composed of a linear polarizer and a quarter-wave plate to polarize the waves first linearly
and second circularly before they enter the camera. The effect of a polarizing filter in this
experimental setup without any coverage of reflective areas is illustrated in Figure 6.66(h).
Less reflections are found since only a small area with punctual reflection is observed on
the left side of the lyophilizate. Those are detrimental to automatic image evaluation since
they are caused by the lyophilizate itself and appear only in regions without cracks. The cake
structure appears nearly uniform and only a smaller area with brighter pixels compared to the
other pixels of the cake structure is found in the right region of the lyophilizate. The cracks
appear nearly uniform, and even small fissures in the outer cake region can be recognized.
The quality of the image, however, is poor and possesses increased noise due to insufficient
lighting which makes automatic image evaluation difficult.
The best results are obtained by the use of a macro ring light placed directly in front of
the macro lens via an adapter ring. An image taken with this adjustment is shown in Figure
6.66(i). The ring light is produced by 48 LED and guarantees a shadow-free illumination.
With this accessory averaged image sharpness, good contrast and uniform illumination is
possible. Small fissures at the edge of the cake can be recognized and the cake structure
appears uniform. The outline of the cake as well as the inside walls of the vial for shrinkage
are clearly detectable. This source of light was therefore chosen for the experimental setup.
6.2.1.2 Selection of the Camera Setup
The vertical position of the cake surface as well as the surface itself changes during the
freeze-drying process. The use of automatic focus led to images with different focused and
non-focused regions, making manual focus necessary. The closest focusing distance is se-
lected as 0.31 m, since the distance between the cake surface and the camera is always
smaller than this value. The focus is set in the region between the middle and the edge of
the lyophilizate due to its curved surface during the whole drying process and is adapted,
if needed. The camera’s zone mode is set to ”AV” (Aperture Value). This mode is termed
”aperture priority” at which the aperture can by selected manually and the shutter speed is

150 6 Results
automatically set by the camera to obtain the standard exposure suiting the subject bright-
ness. The best aperture was found at the value 16. This leads to a relatively small aperture
hole that accentuates the foreground, but the background is also within an acceptable focus.
This setup is suitable for unfavorable lighting conditions, since it enables a sharp image due
to a short shutter speed.
In this mode the ISO value can be chosen manually. This is the sensitivity of the camera’s
sensor to light. A high ISO value is used for darker objects and is set in this experimental
setup to 800. For this value an acceptable picture with a low noise level and a good image
quality is obtained.
Despite equal camera settings (values of aperture, ISO) and constant illumination, fluctu-
ations in the image brightness between all images of a freeze-drying run are observed. The
differences are very small and can hardly be seen by the observer. Nevertheless different
brightness values occur for the cracks in all images making an automatic evaluation difficult.
The high dynamic range image, HDR, technique is therefore used to balance brightness
fluctuations and to obtain details which are usually lost in bright and dark areas. HDR are
created by bracketing, at which several pictures are taken with different exposures, an un-
derexposure, a normal exposure and an overexposure. The camera is able to execute auto
exposure bracketing, AEB. The AEB amount is set to -0.3, 0.7, 1.7. Since it is not possible
to control the camera with enabled AEB automatically, a macro was written which starts and
stops the AEB at predefined time intervals to obtain AEB during the whole freeze-drying cy-
cle. The bracketing of one time point is illustrated in Figure 6.67(a)-(c). The HDR are then
produced with Digital Photo Professional software. The HDR corresponding to the bracket-
ing of Figure 6.67(a)-(c) is shown in Figure 6.67(d). It exhibits increased image sharpness,
fewer reflections or shadows, and uniformity of cake structure. Figure 6.67(e)+(f) clarifies the
improvement caused by the HDR technique. In the HDR (Figure 6.67(f)) the cracks appear
clearer, the contrast between the cake structure and the cracks is increased, and the sharp-
ness is considerably higher. The HDR offers a better depth effect as well as clearer edges
of the cracks. It yields details which are usually lost in bright and dark areas by common
photography. However, granulation of the image is found which may impair the results of au-
tomatic image evaluation. Furthermore, the fluctuations in the image brightness between all
HDR are not prevented by this technique. A possible reason may be the flickering of the LED

6.2 Kinetic Method 151
(a) (b) (c)
(d) (e) (f)
Figure 6.67: Bracketing of lyophilizates with an AEB amount of (a): -0.3, (b): 0.7, (c): 1.7.(d): Produced HDR image. Detailed view of the cracks obtained by the image of(e): -0.3 AEB and (f): HDR.
which may lead to variations in the illumination of the lyophilizate. The use of HDR technique
does not therefore improve automatic image evaluation. This is discussed later.
To solve the problem of brightness fluctuations the image format is changed from JPEG to
RAW. A camera RAW image file contains data from the image sensor of the digital camera
which is only minimally processed. The advantage of a RAW over a JPEG file is that precise
adjustments can be made before the file is converted to TIFF or JPEG. The RAW constitutes
the digital negative of an image and possesses a higher image quality like a better brightness
resolution and more shades of colors than the final image format.
As the image color is non-relevant for the evaluation of shrinkage and cracking,
monochrome RAW-images are taken. The RAW files are then loaded in Digital Photo Profes-
sional and the brightness of each picture is adjusted to obtain more similar brightness values
to prevent brightness fluctuations. Subsequently the RAW files are converted to TIFF.
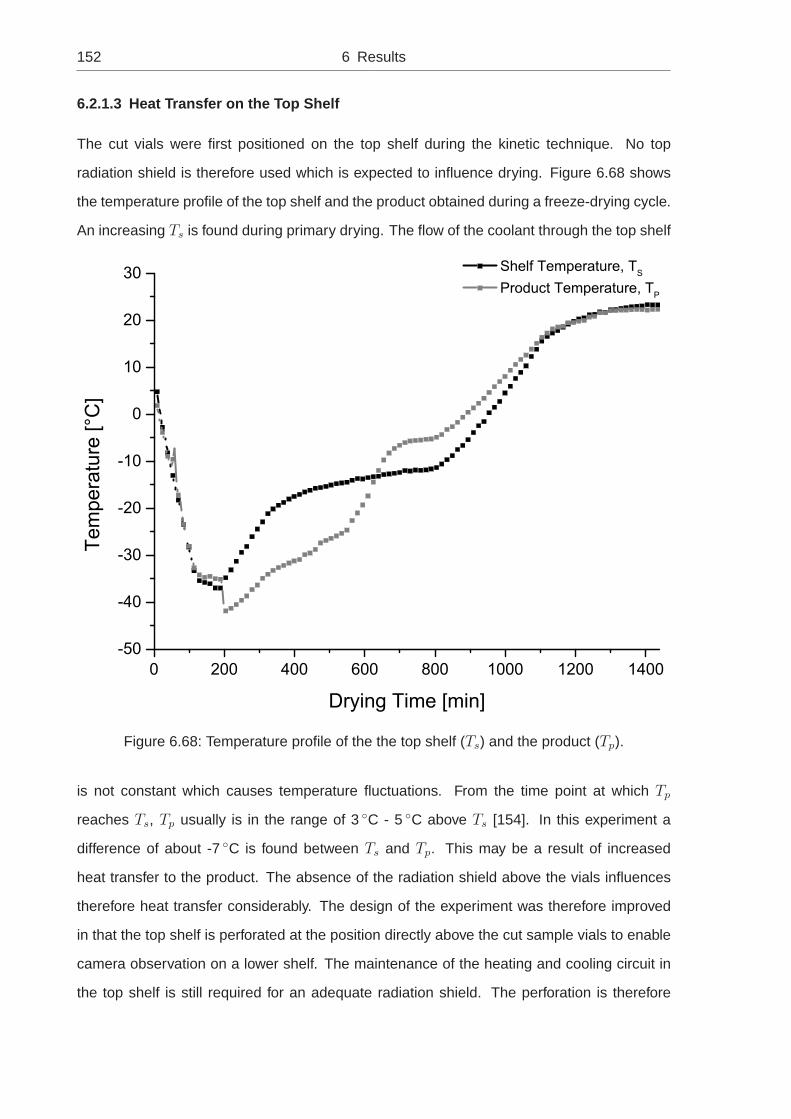
152 6 Results
6.2.1.3 Heat Transfer on the Top Shelf
The cut vials were first positioned on the top shelf during the kinetic technique. No top
radiation shield is therefore used which is expected to influence drying. Figure 6.68 shows
the temperature profile of the top shelf and the product obtained during a freeze-drying cycle.
An increasing Ts is found during primary drying. The flow of the coolant through the top shelf
0 200 400 600 800 1000 1200 1400-50
-40
-30
-20
-10
0
10
20
30 Shelf Temperature, TS
Product Temperature, TP
Drying Time [min]
Tem
pera
ture
[°C
]
Figure 6.68: Temperature profile of the the top shelf (Ts) and the product (Tp).
is not constant which causes temperature fluctuations. From the time point at which Tp
reaches Ts, Tp usually is in the range of 3 C - 5 C above Ts [154]. In this experiment a
difference of about -7 C is found between Ts and Tp. This may be a result of increased
heat transfer to the product. The absence of the radiation shield above the vials influences
therefore heat transfer considerably. The design of the experiment was therefore improved
in that the top shelf is perforated at the position directly above the cut sample vials to enable
camera observation on a lower shelf. The maintenance of the heating and cooling circuit in
the top shelf is still required for an adequate radiation shield. The perforation is therefore

6.2 Kinetic Method 153
carried out on a position of the shelf where only one coil of the heating and cooling circuit is
affected. This coil is then bypassed by a metal ring sealed in the perforation, as illustrated
above in Figure 5.9 to enable an intact circuit.
A further reason for the elevated heat transfer may be a high emissivity of the unit’s cover.
Acrylic glass shows a higher emissivity (0.86) compared to polished stainless steel (0.59) or
aluminum (0.77) [155]. The interior lateral walls of the cover were therefore masked with an
adhesive aluminum tape. The effects of these changes on Tp are depicted in Figure 6.69.
The usage of a regular shelf instead of the top shelf brings a constant shelf temperature
200 400 600 800 1000 1200 1400-50
-40
-30
-20
-10
0
10
20
30 Shelf Temperature, TS
Product Temperature, TP
Drying Time [min]
Tem
pera
ture
[°C
]
Figure 6.69: Temperature profile of the product (Tp) and the shelf (Ts) with the perforated topshelf as radiation shield and the masking of the cover by an adhesive aluminumtape.
during primary drying. The ramp to secondary drying is also more accurate. The difference
between Tp and Ts at the end of primary drying is reduced to only 4 C and is now in the
typical range of 3 C-5 C [154].

154 6 Results
6.2.1.4 Influence of Vial Cutting on Shrinkage and Cracking
An influence of the cut of the vial or the presence of a stopper on shrinkage and cracking
cannot be excluded [35]. A group of 7 cut vials (2R) as well as a group of seven vials
without a stopper (2R) were therefore positioned between dummy vials and freeze-dried
with cycle 2 (see chapter 5.2.3). The values of cracking and shrinkage obtained by the
endpoint evaluation method after lyophilization are illustrated in Figures 6.70 and 6.71. The
0 10 20 30
0
2
4
6
8
Cra
ckin
g [%
]
Trehalose concentration [%]
Cracking [%] Cracking without a stopper [%] Cracking cut vial [%]
Figure 6.70: Cracking values of freeze-dried trehalose solutions with 10% (w/v) trehaloseconcentration, a fill height of 2.5 mm in 2R vials with stopper (black square),2R vials without a stopper (white diamond), and cut 2R vials (black star). Thecoordinates for cracking are the mean average ± standard error of all valuesobtained (n=7) for the cut or unstoppered vials, n=20 for the stoppered vials.
absence of the stopper has no influence on the extent of cracking and shrinkage. The stopper
resistance to mass transfer is negligible in comparison to the resistance of the dried product,
since the area for vapor flow through the stopper is large in comparison to that of the pores
[22, 36, 38]. A change in the mass transfer rate is therefore unlikely and an influence of the
mass transfer rate on cracking or shrinkage is not observed.
Figure 6.71 shows smaller shrinkage for all concentrations in cut 2R vials compared to

6.2 Kinetic Method 155
0 10 20 300
5
10
15
20
25
Shr
inka
ge [%
]
Trehalose concentration [%]
Shrinkage [%] Shrinkage without a stopper [%] Shrinkage cut vial [%]
Figure 6.71: Shrinkage values of freeze-dried trehalose solutions with 10% (w/v) trehaloseconcentration, a fill height of 2.5 mm in 2R vials with stopper (black square),2R vials without a stopper (white diamond), and cut 2R vials (black star). Thecoordinates for shrinkage are the mean average ± standard error of all valuesobtained (n=7) for the cut or unstoppered vials, n=20 for the stoppered vials.
intact 2R vials either with or without a stopper. The vapor flow though the dried product is
the determinative quantity for mass transfer as the area for vapor flow through the stopper
openings (0.2-0.4 cm) or through the vial neck (diameter = 0.7 cm) is large compared to that
of the cake pores (15-60µm) [38, 144]. The resistances of the neck of the vial and the
stopper openings are therefore negligible in comparison to the pore resistance.
Within the lyophilizate, the drying rate near the vial wall is higher because of greater heat
transfer near the vial edge than in the middle of the vial [9]. When shrinkage occurs, the
mass transfer in these regions occurs in the gap now present between the product and the
vial wall. The resistance to mass transfer near the vial wall is therefore reduced [9, 156]. The
product resistance in these regions is therefore not determinative for mass transfer and the
absence of the vial neck or a stopper may now play a role. Faster drying near the vial wall
may increase the compressive resistance of the cake since the plasticizing effect of water is

156 6 Results
reduced [157, 158, 159]. As a result a lower amount of shrinkage may occur.
The vial cut leads to a lower amount of cracking for concentrations > 10% trehalose com-
pared to samples in intact vials with or without a stopper. Again, the faster drying at the edge
of the cake may result in increased compressive resistance of samples having a reduced
plasticizing effect of water [157, 158, 159]. The cake can therefore withstand the drying ten-
sions in a greater extent and less cracking occurs at trehalose concentrations >10%. As
cracking is not pronounced at lower trehalose concentrations, preferential drying at the edge
would be less pronounced. This would explain why no differences ≤10% trehalose are found
for cracking.
6.2.2 Development of a Kinetic Image Evaluation Method
6.2.2.1 Semi Automatic Picture Evaluation
Several demands are placed on a semi-automatic image evaluation. It needs to have high
accuracy to register small distinctions between successive images taken during drying, as
illustrated in Figure 6.72(a)-(c). It must detect the hair-like fissures that appear at the begin-
ning of drying (Figure 6.72(a)). Any method is exacerbated by the poor contrast between the
cracks and the cake structure that appears especially at the edge of the cake since no back-
ground light is used. Figure 6.72(c) compared to (d) shows the differences that appear on the
basis of different lighting conditions. A high contrast is given between the cake structure and
the cracks, and even hair-like fissures can clearly be seen in the right region of (d) (marked
with black rectangles in (e)). These hairless fissures are not found in (c). The wide crack at
the bottom of the image in (d) (marked with a black rectangle in (f)) appears white with poor
contrast to the cake structure.
The threshold value needs to be defined anew, since the cracks appear as light regions
in the endpoint evaluation method (d), but as dark regions during the kinetics due to the
absence of background light (f). Figure 6.73(a) shows the result of the endpoint evaluation
method of the image of Figure 6.72(c) with the typical threshold of >1.15 ·mc. Values greater
than the 1.15fold of mc which are assigned to the crack area in the endpoint evaluation
method, are now the bright pixels of the reflections on the cake. The Matlab program assigns
the reflections as cracks (black in Figure 6.73(a)). The cake structure without reflections

6.2 Kinetic Method 157
(a) (b) (c)
(d) (e) (f)
Figure 6.72: Images taken of the same sample containing 10% trehalose (w/v) during freeze-drying after (a) 856 min primary drying, (b) 924 min primary drying, and (c)600 min secondary drying, as well as (d) after 600 min secondary drying in theendpoint evaluation dark cell; (e) image of (d) with marked regions with smallfissures, (e) image of (c) with the marked region of a crack with a poor contrast.
and the cracks are then defined as the cake area (gray in Figure 6.73(a)). A change of
the threshold to <1.15 ·mc will therefore only change the classification of the areas, since
the gray area will appear black, and the black area will appear gray, as illustrated in Figure
6.73(b). Parts of the cracks are now detectable as such, but most of the cake surface is also
captured. A clear distinction of a crack with this threshold is therefore not possible. It does
not separate clearly the brightness values of the crack from the brightness values of the cake
structure. Other threshold values need to be tested.
Figure 6.74 shows the results of the endpoint evaluation method for the image from Figure
6.72(c) with different thresholds. With increasing threshold the crack area (black) increases.
The image shows, however, lower brightness values at the edge of the cake and on its
left compared to the values in the cake’s middle. The increasing threshold values capture

158 6 Results
(a) (b)
Figure 6.73: Result of the endpoint evaluation method for the image from Figure 6.72(c) withthe typical threshold of >1.15 ·mc (a), where black marks the crack area andthe gray area around the black area marks the cake area, and a threshold of>1.15 ·mc (b), where gray marks the crack area and the black area around thegray area marks the cake area.
(a) (b) (c)
Figure 6.74: Results of the endpoint evaluation method for the image of 6.72(c) with a thresh-old of (a) <0.89 ·mc, (b) <0.99 ·mc, and (c) <1.10 ·mc.
therefore more pixels that belong to the cake structure. A correct separation of the crack
area is also not possible. Image processing steps are therefore required.
To cope with the illumination problems in this experimental setup, the HDR technique is
used to enable semi-automatic image evaluation. Figure 6.75 shows the HDR used for the

6.2 Kinetic Method 159
development of an semi-automatic image evaluation and also the results of the image eval-
uation. The use of the HDR technique leads to a more uniform appearance of the cake
(a)
(b) (c) (d)
Figure 6.75: HDR image (a), results of the image evaluation with the endpoint evaluationmethod and a threshold of <0.98 ·mc (b), <0.985 ·mc (c), and <0.99 ·mc(d).
structure in the image shown in Figure 6.75(a), as already observed. A greater portion of
the crack can now be distinguished from the cake structure. However, the elevation of the
threshold from <0.98 ·mc (b) to <0.985 ·mc (c), and further to <0.99 ·mc (d) causes worse
separation of the crack area, since a greater portion of the area belonging to the cake struc-
ture is included to the crack area. A threshold that captures the correct crack area without
inclusion of the cake structure area can therefore not be defined. A clear improvement of the
image evaluation method is not given by the HDR technique.
Similar image-processing problems have been found to occur during the automatic vi-
sual rating of the surface conditions of pavements. Segmentation of surface cracks in a
pavement involves an image neutralization before segmentation [160]. During this process
the images are normalized to remove non-uniformity in background brightness (Kaseko and

160 6 Results
Ritchie [160], here the cake structure brightness) across the image and to increase the gray
level contrast between the background and the cracks. Kaseko and Ritchie [160] adjusted
the gray level of each pixel in proportion to the ratio of a standardized background bright-
ness level to the mean background brightness. The latter was obtained from a series of
pixels along the column containing the pixel. This normalization technique is now used in the
current study.
The standardized background brightness level is mc. For the mean background brightness,
Mjs, the mean gray scale value of each column of pixels, MJ is calculated. Across the
columns the values of Mj are smoothed via a moving average and the mean background
brightness value, Mjs, of each column is calculated. The gray level of each pixel in a column
is then adjusted by the ratio mc/Mjs. This procedure is also performed for each line. The
results of this image normalization are shown in Figure 6.76. The comparison between (a)
(a) (b)
(c) (d) (e)
Figure 6.76: Sample image (a), normalized image (b), results of the image evaluation methodand a threshold of <0.85 ·mc (c), <0.95 ·mc (d), and <1.00 ·mc(e).
and (b) shows that the normalization of the image leads to a uniform background and an

6.2 Kinetic Method 161
increased contrast between the cracks and the cake structure. The segmentation of the
cracks, however, is still not possible. An increase in the threshold value captures a greater
part of the crack area, but also a greater part of the cake area in terms of little spots over the
whole cake area (Figures 6.76(c)-(e)). A high accuracy is thereby not achieved for the small
distinctions between successive images taken during drying. This is also the case to detect
the hair-like fissures that appear at the beginning of drying.
To avoid the acquisition of those little spots, the crack area is evaluated by ”region growing”.
By this technique the crack area grows iteratively around a seed point located in the crack
area. All unallocated neighboring pixels of this seed point are compared to a threshold value.
As a constant threshold is used, this method leads to strong fluctuations between successive
images of each run based on different intensity values. The threshold value is therefore
automatically adapted to the intensity values of each image by their intensity distribution. As
an almost bimodal intensity distribution is obtained for each image, its minimum was used for
the threshold value. This, however, brings no further improvement.
By another attempt the crack area obtained for each image is transferred to the proximate
image. Hence, only the boundaries around the prior crack area are tested by region growing.
This, however, leads to an oversized crack area, since errors in the counting process are
transferred to the next image and accumulate.
It is therefore not possible to develop a semi-automatic evaluation method for the evalua-
tion of the crack area in each image. The contrast between the crack area and the area of
the cake structure is not strong enough to detect the small changes that occur in successive
images.
6.2.2.2 Image Evaluation with Axio Vision
The images obtained by the kinetic method were evaluated in Axio Vision with the Auto-
Measure module, as described for the endpoint evaluation method. For satisfactory crack
detection several image processing steps are necessary. A sample image is given in Figure
6.77(a) taken at the end of the freeze-drying process. The crack area captured without
any image processing is given in Figure 6.77(b). The captured areas outside the cake are
deleted, as described for the endpoint evaluation method. Large areas located in the cake
structure are wrongly assigned to the crack area. This necessitates image processing steps.

162 6 Results
(a) (b) (c)
Figure 6.77: Sample image (a), image evaluation of (a) without image processing (b), imageevaluation of (a) with image processing (c).
For this image processing the brightness (≈ -0.5), the contrast (≈ 1.0), and the gamma
value (≈ 1.0) are adapted for each image and a Gaussian filter with σ = 1927 is used. A
satisfactory shading correction to balance the uneven brightness gradient is given by 6866.
With these corrections a correct segmentation of the crack area is possible, as illustrated in
Figure 6.77(c).
Only small changes are found between successive images and the hair-like cracks at the
beginning of the process are barely detectable. The crack pattern of each sample must
therefore be defined before processing. The last image of each run is therefore evaluated
first to define all fine cracks that appear during drying, as shown in Figure 6.78(a). This
(a) (b) (c)
Figure 6.78: Evaluated image at the end of the freeze-drying run (a), evaluated image of thetime point at the end of primary drying (b), evaluated image at the time pointafter 795 min primary drying (c).
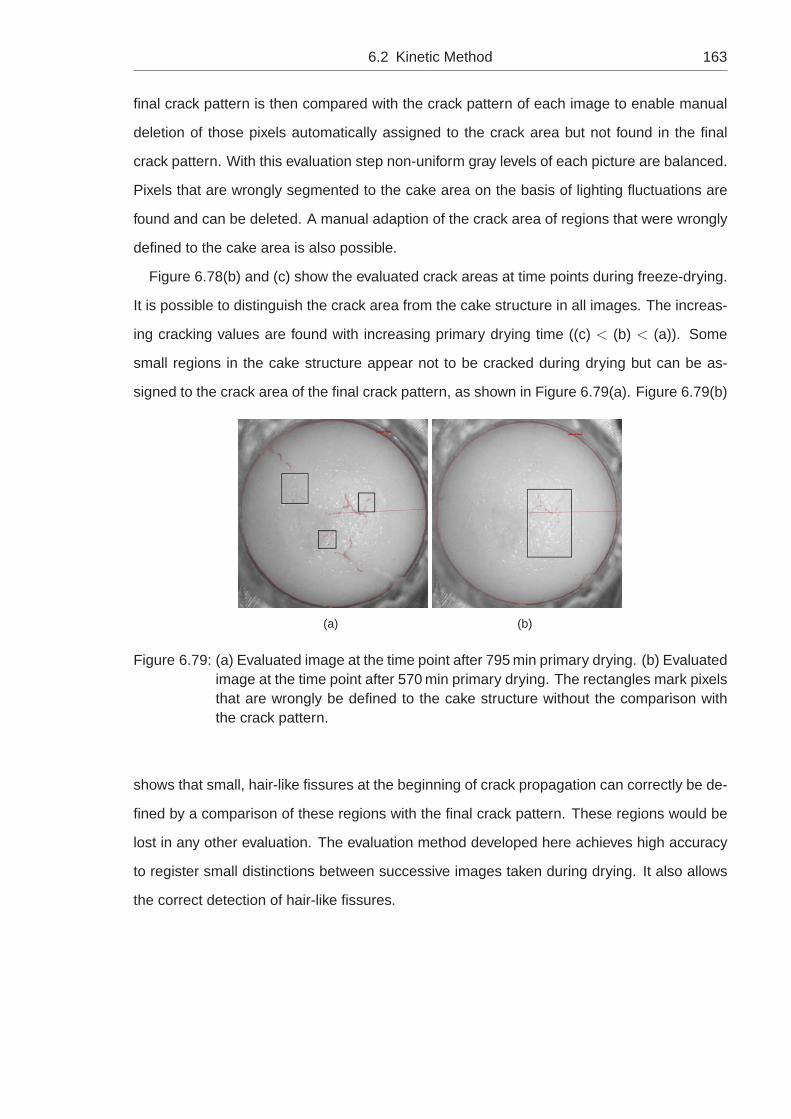
6.2 Kinetic Method 163
final crack pattern is then compared with the crack pattern of each image to enable manual
deletion of those pixels automatically assigned to the crack area but not found in the final
crack pattern. With this evaluation step non-uniform gray levels of each picture are balanced.
Pixels that are wrongly segmented to the cake area on the basis of lighting fluctuations are
found and can be deleted. A manual adaption of the crack area of regions that were wrongly
defined to the cake area is also possible.
Figure 6.78(b) and (c) show the evaluated crack areas at time points during freeze-drying.
It is possible to distinguish the crack area from the cake structure in all images. The increas-
ing cracking values are found with increasing primary drying time ((c) < (b) < (a)). Some
small regions in the cake structure appear not to be cracked during drying but can be as-
signed to the crack area of the final crack pattern, as shown in Figure 6.79(a). Figure 6.79(b)
(a) (b)
Figure 6.79: (a) Evaluated image at the time point after 795 min primary drying. (b) Evaluatedimage at the time point after 570 min primary drying. The rectangles mark pixelsthat are wrongly be defined to the cake structure without the comparison withthe crack pattern.
shows that small, hair-like fissures at the beginning of crack propagation can correctly be de-
fined by a comparison of these regions with the final crack pattern. These regions would be
lost in any other evaluation. The evaluation method developed here achieves high accuracy
to register small distinctions between successive images taken during drying. It also allows
the correct detection of hair-like fissures.

164 6 Results
6.2.3 Kinetics of Shrinkage and Cracking of a 10% Trehalose Solution
Figure 6.80 shows the kinetics of shrinkage and cracking in % of a 10% trehalose solution
(w/v) freeze-dried with cycle 2 (see chapter 5.2.3). Also shown are the temperatures of the
product (Tp) and of the shelf (Ts) obtained by the TC measurements, as well as the cumulative
water loss measured with the microbalance and the drying rate. The process time is given in
% of the total primary or secondary drying times.
The development of shrinkage and cracking during primary drying can be divided into three
periods. The first proceeds during 15% and 55%, the second during 55% - 75% and the third
during 75% - 100% of primary drying. The first period is characterized by the initiation of
shrinkage and cracking. Cracking occurs first at about 15% and shrinkage at about 20% of
primary drying. A slight increase in both can be observed during this period which is more
pronounced with cracking. Shrinkage reaches a plateau at about 1% after 35% of primary
drying. From the temperature and drying profile it is apparent that in this phase Tp rises and
Ts has reached the set temperature. The sublimation process has started and cumulative
water loss has reached nearly its first maximum at the start of this period. The sublimation
process is almost finished at the end of this period.
In the second period (55% - 75% of primary drying) a further rise in shrinkage and cracking
is observed. This is more pronounced with cracking and proceeds faster than during the first
period. Tp rises sharply. At the beginning of this phase the cumulative water loss has reached
a constant value and the drying rate drops (≈ 60% primary drying). Tp also meets and
exceeds Ts (≈ 75% primary drying). This indicates the completion of sublimation. During
the third period cracking and shrinkage increase further, but to a lesser extent compared
to the previous period. At the end of primary drying 2.41% shrinkage and 3.37% cracking
has developed. During secondary drying the further increase in shrinkage and cracking run
parallel until the end of lyophilization. Here, 4.30% cracking and 3.25% shrinkage are finally
found.
The increase in shrinkage and cracking is gradual. This is in particular the case during
primary drying. This progression can be clarified by the first derivatives of shrinkage and
cracking (Figure 6.81). The phases of high shrinkage and cracking are evident in this figure.
There are three during primary drying and two during secondary drying. This maximum
extent of shrinkage is reached at the middle point of secondary drying (Figure 6.80). The

6.2 Kinetic Method 165
20 40 60 80
0
2
4
6
8
10
20 40 60 80
0
2
4
6
8
10
20 40 60 80
0
2
4
6
8
10
20 40 60 80
0
2
4
6
8
10
Cra
ckin
g [%
]
Shr
inka
ge [%
]
20 40 60 80-50
-40
-30
-20
-10
0
10
20
Pro
duct
Tem
pera
ture
[°C
]
20 40 60 80-50
-40
-30
-20
-10
0
10
20
She
lf Te
mpe
ratu
re [°
C]
20 40 60 80
0
200
400
600
800
Primary Drying Time [%]
Cum
ulat
ive
Wat
er L
oss
[mg]
20 40 60 80
Secondary Drying Time [%]
0
2
4
6
8
10
12
14
Dry
ing
Rat
e [m
g/%
]
Figure 6.80: Kinetics of cracking and shrinkage in % in correlation to Tp (solid line), Ts
(dashed line), the drying rate (solid line), and the cumulative water loss (dashedline) during primary and secondary drying. The coordinates for cracking andshrinkage are the mean average ± standard errors of all values obtained (n=3).Total duration of primary drying = 17 h, total duration of secondary drying = 5 h.

166 6 Results
0 20 40 60 80
0,0
0,5
1,0
1,5
2,0
2,5
3,0
3,5
0 20 40 60 80 100
1st D
eriv
ativ
e [%
/%]
1st Derivative of Cracking 1st Derivative of Shrinkage
Secondary Drying Time [%]
Primary Drying Time [%]
Figure 6.81: First derivatives of cracking (black) and shrinkage (gray).
maximum extent for cracking is not as pronounced at this time point. Those maxima may
result from the approach of Ts and Tp to the secondary drying temperature.
Figure 6.81 also shows the connection between shrinkage and cracking, as the maxima
proceed nearly simultaneously. In the first period (15%-55% primary drying time) cracking
starts first and then shrinkage follows. Thereafter shrinkage and cracking continue simulta-
neously. The increase in shrinkage lasts longer than the increase in cracking. Furthermore
it can be seen that in the first period (15%-55% primary drying time) and in the last two peri-
ods (secondary drying time) shrinkage better releases drying tensions, as greater values are
found. In the last two periods of primary drying (55%-100% primary drying time), however,
the first derivative of cracking is greater than that of shrinkage.
The highest values of the first derivatives are observed for cracking. This indicates that
the release of drying tensions by cracking is a fast process. This can be explained by the
mechanism of cracking. To induce a fracture, high drying stress is necessary. If this stress
exceeds the strength of the lyophilizate (i.e. KIc) the bonds within the lyophilizate in the
region of the stress concentration break. This results in high stress release. With shrinkage

6.2 Kinetic Method 167
the bonds remain and only a contraction of the lyophilizate mass takes place. No threshold
value such as KIc is necessary for stress release and therefore the highest maxima for the
first derivative are smaller than with cracking. Hence, relaxation by shrinkage takes longer
and its duration is greater.
The drying stress may be caused by the sharp increase in Tp observed in the second
period where cracking relaxes the drying tensions. This suggests that the slow relaxation by
shrinkage is not enough, and the drying tensions caused by the sharp increase in Tp exceed
the tensile fracture limit of the system and cause cracking.
In the periods between the maxima both shrinkage and cracking proceed at a relative con-
stant extent (plateau in the first derivative). Figure 6.81 shows that a more consistent increase
in shrinkage takes place during the whole lyophilization process compared to cracking. That
indicates, as already suggested during the endpoint evaluation method, that shrinkage is the
basic process to release drying tensions. Figure 6.82 shows representative sample images
of a lyophilizate at different time points. The images are obtained by a freeze-drying run
where finally 2.47% cracking and 2.02% shrinkage are found. Figure 6.82(a) shows the cake
at 15% primary drying time (at the start of the first period). A first crack is observed (0.0009%
cracking, Figure 6.82(b)), but no shrinkage. Magnification (black rectangle) is shown in Fig-
ure 6.82(b). A very thin crack can be seen which runs from the lower left of the cake to its
upper right. The first maximum in the first derivative of cracking can therefore be related to
the first crack initiation (see Figure 6.81).
This crack propagates and elongates within the next 25% of primary drying (see Figure
6.82(c)). In addition hairlike cracks appear that run nearly perpendicular to the original crack
in the cake regions located upper and lower to the original crack. Not only crack propagation
but also the development of new cracks takes place during the first period. This increase
in cracking is related to the slight increase in the first derivative of cracking in the period
between 20% and 40% of primary drying. The complete extent of cracking is evaluated as
0.03% at this time point. Shrinkage now starts at the upper and the left edge of the cake,
as a gap between the cake and the vial is observed. This is displayed in the first maximum
of the first derivative of shrinkage in the first period. The momentary amount of shrinkage is
0.21%.
Figure 6.82(d) shows the cake after 70% of primary drying when the maxima in the first

168 6 Results
(a) (b) (c)
(d) (e) (f)
(g) (h) (i)
Figure 6.82: Sample images of a lyophilizate at 10% trehalose at (a): 15%, (b): Enlargementand of image (a) of the region marked with an rectangle in image (a) with imageprocessing, (c): 40%, (d): 70%, (e): 75%, (f): 100% primary drying and (g):40%, (h): 85% and (i): 100% secondary drying.
derivative of cracking and shrinkage have been reached. This is the time point at which about
50% of the final extent of cracking is developed and the previous sharp increase in cracking
is finished. A value of cracking of 1.90% is found, with additional cracks found to (c) being
evident. These run perpendicular to the vertical crack in the upper cake region. Hence, a

6.2 Kinetic Method 169
maximum of the first derivative of cracking indicates again the formation of new cracks (see
Figure 6.81). Additional shrinkage is observed in the upper region of the cake and displays
the maximum in the first derivative of shrinkage. It accounts overall for 0.64%. The other
cake regions either adhere to the inside wall of the glass vial or no further detachment is
observed.
Figures 6.82 (e)-(i) illustrate that the final crack pattern is achieved after 70% of primary
drying. From now on only crack expansion takes place. The elongation of the cracks as well
as the development of new cracks is finished. A comparison of (e) with (i) shows that the
increase in cracking is developed by a crack expansion of the wide crack that proceeds from
left to right of the cake. This crack expansion is pronounced between (e) and (f) (75%-100%
or primary drying) as well as between (g) and (h) (40-85% of secondary drying). This is where
the maxima in the first derivative of cracking are found (see Figure 6.81). The maximum of
the first derivative of cracking indicates therefore also a crack expansion.
From (c) to (d) shrinkage proceeds only at the upper region of the cake. The further de-
tachment of the cake in the left region starts at (e). In this time interval (70%-75% of primary
drying) the second maximum in shrinkage is observed. Shrinkage proceeds thereafter from
these initial points to left and right (c)-(i), being more pronounced in the upper region of the
cake. No further initiation points are observed. After 10% of secondary drying (g)-(i) the first
derivative of shrinkage is always higher compared to that of cracking. Hence, shrinkage is
from now on the dominant mechanism to relax the drying tensions.
In the subjacent and adjacent regions around the initial points of shrinkage tensions occur
which may be caused by cake detachment and promote further shrinkage. As drying pro-
ceeds from the top of the cake to its bottom, a gradual development of shrinkage in the same
direction is likely.
Mujat et. al. [2] found that changes in cake structure due to a rise of temperature proceed
from the top of the product to its bottom in the direction of the movement of the drying front.
Figure 6.83 illustrates these cake structure changes obtained at different Tp with proceeding
drying time. The rectangles mark the regions of cake detachment from the vial. A gradual
detachment of the cake from the wall of the vial in the same direction is observed. This
confirms the suggestion in the current work of a development of shrinkage in the direction of
the drying front. Tensions in the subjacent regions of the initial point caused by shrinkage are

170 6 Results
(a) (b) (c)
Figure 6.83: Structural collapse of a 5% sucrose solution obtained by optical coherence to-mography at a Tp of (a):-29.3 C, (b): -27.7 C, and (c): -25.7 C; adapted from[2].
therefore likely. This can be seen in the lower regions of each rectangle, where a changeover
between detached and not detached product layer is observed. Whereas a wide gap is
observed in the upper regions, this gap becomes more narrow in the direction to the bottom
of the cake. The cake shrinkage has therefore an impact on subjacent regions and may favor
further cake shrinkage. Since shrinkage proceeds from the top to the bottom of the cake,
this process may be delayed by the movement of the sublimation front. Shrinkage is likely
caused by desorption processes after completed sublimation [5, 8, 9].
These tensions may not only act on subjacent regions (y-direction), but also on the regions
adjacent to the initial point in the same product layer (x-direction). Further detachment that
starts from an initial point and moves in x-direction to the left and the right of this initial point,
as it occurs between 6.82(c) and (d) in the upper region and (e)-(i) in the left region, is then
the result. A further detachment in the area of the initial shrinkage is therefore more likely
than an initiation in other cake regions, as found in this experiment.
In Figure 6.82(d) the original crack runs nearly to the edge of the cake and then moves
upwards until it reaches the vial wall in the region where no further detachment from the
glass is observed. It has already been suggested that shrinkage and cracking are closely
interlinked and interact. This can be confirmed by the observation of this cake region, since
no shrinkage to the right beyond this point is observed. The drying tensions in the region are
therefore likely released by cracking instead of shrinkage, and no further shrinkage appears.
At this intersection incomplete detachment of the cake from the glass is observed. This

6.2 Kinetic Method 171
may promote the development of the horizontal crack in this region and confirms the relation
between strong adhesion of the product to the glass and cracking. This is also observed in
the lower and upper left region of the cake. A strong adhesion is also observed in this areas.
This explains the development of the horizontal crack and its initiation in the lower region, as
well as the development of the horizontal crack in the upper left region of the cake. At these
regions shrinkage is also disrupted.
A relation between shrinkage and cracking is also observed in the upper cake region. On
the basis of the large shrinkage in this area a relaxation of the cake structure occurs and an
initiation of cracking is unlikely. This results in the more intact cake structure in the upper
region of the cake and may have stopped the elongation of the vertical crack. Cracks are
initiated by an adhesion of the product to the inside wall of the vial, as already found during
the endpoint evaluation method. Shrinkage and cracking proceed simultaneously as in some
regions shrinkage is pronounced and more or less no cracking occurs. In other regions
cracking is pronounced due to the adhesion of the product the the glass and no shrinkage
occurs.
The initiation of cracking depends therefore on the extent of adhesion of the product to
the inside wall of the vial, as suggested during the endpoint evaluation method. This state
of stress produced by adhesion or detachment of the cake to the glass is developed during
the sublimation process. The crack pattern and the initial points of shrinkage are produced
during the first ≈ 70% of primary drying where sublimation takes place (see Figures 6.80 and
6.82). In this period the drying of the cake takes place from the top to its bottom and further
shrinkage and cracking is caused by movement of the sublimation front. The state of stress
is therefore transferred to subjacent and adjacent regions as drying proceeds. A detachment
of the cake in the region of the initial points is therefore favored. Any crack development,
elongation or expansion is also transferred to the dried regions above the drying layer and
are therefore visible at the surface of the product.
Further crack expansion may occur after the sublimation process is finished and the drying
front has reached the base of the vial. This is due to the continuing adhesion of the cake to
the wall and tensions that occur due to secondary drying processes. It has to be pointed out
that a contraction of the lyophilizate mass may also occur in the regions where the bonds
within the cake are broken. The crack expansion that is caused by this contraction is then

172 6 Results
falsely assigned to the amount of cracking, although it is caused by shrinkage. As shrinkage
better releases drying tensions, this is likely and the maxima of the first derivative of cracking
found after the sublimation process is finished may be caused by this process. In this period
only secondary drying processes occur and shrinkage is related to secondary drying effects,
so this is likely.
6.2.4 Kinetics of Different Trehalose Concentrations
Figure 6.84 shows the results obtained for different trehalose concentrations. Table 6.13
gives a summary of the final extents of shrinkage and cracking. It is apparent that cracking is
Trehalose concentration Cracking Shrinkage
5% 0.00% 12.4%10% 4.30% 3.25%30% 6.91% 1.97%
Table 6.13: Values of shrinkage and cracking at different trehalose concentrations found bythe kinetic method.
not observed at 5% trehalose, where only shrinkage occurs. The extent of cracking increases
in the order 5% < 10% < 30%. Shrinkage decreases in the order 5% > 10% > 30% and
behaves therefore in the opposite direction to cracking. This concentration dependence of
shrinkage and cracking was already observed with the endpoint evaluation method for all
shelf-frozen samples.
A gradual kinetic increase in shrinkage and, if present, cracking for 5% and 30% trehalose
similar to that of 10% trehalose (see chapter 6.2.3) is seen. With 5% trehalose shrinkage
is initiated at 48% of primary drying. A sharp increase in shrinkage is observed, faster than
for 10% trehalose, that proceeds until 92% of primary drying. With 30% trehalose cracking
occurs simultaneously with shrinkage at 45% of primary drying. Cracking increases slower
compared to 10% trehalose until 82% of primary drying. Thereafter it increases faster until at
93% of primary drying a plateau phase is reached. With 30% trehalose shrinkage reaches
a plateau at 52% of primary drying with 0.13% shrinkage. This plateau remains until at 62%
primary drying two small rises in shrinkage are seen. At the end of primary drying cracking
decreases in the order: 10% trehalose > 30% trehalose > 5% trehalose and shrinkage
decreases in the order: 5% trehalose > 10% trehalose >30% trehalose.

6.2 Kinetic Method 173
20 40 60 80
0
2
4
6
8
10
12
14
20 40 60 80
0
2
4
6
8
10
12
14
20 40 60 80
0
2
4
6
8
10
12
14
0
2
4
6
8
10
12
14
Cra
ckin
g [%
]
Shr
inka
ge [%
]
20 40 60 80-50-45-40-35-30-25-20-15-10-505
1015202530
Pro
duct
Tem
pera
ture
[°C
]
20 40 60 80
20 40 60 80
-50-45-40-35-30-25-20-15-10-5051015202530
She
lf Te
mpe
ratu
re [°
C]
20 40 60 80
0
200
400
600
800
Primary Drying Time [%]
Cum
ulat
ive
Wat
er L
oss
[mg]
20 40 60 80
Secondary Drying Time [%]
-101234567891011121314
Dry
ing
Rat
e [m
g/%
]
Figure 6.84: Kinetics of cracking and shrinkage in % at 5% (red), 10% (black) and 30% (blue)trehalose in correlation to Tp (solid line), Ts (dashed line), the drying rate (solidline), and the cumulative water loss (dashed line) during primary and secondarydrying. The coordinates for cracking and shrinkage are the mean average ±standard errors of all values obtained. Total duration of primary drying = 17 h,total duration of secondary drying = 5 h.

174 6 Results
During secondary drying cracking increases at 30% trehalose faster than at 10% trehalose.
This is more pronounced between 50% and 70% of secondary drying, where the extent of
cracking with 30% trehalose exceeds that with 10% trehalose. At the end of secondary
drying an increase in cracking similar to that with 10% trehalose is observed. Shrinkage with
30% trehalose proceeds similar to 10% trehalose as the curves are coincident due to the
large mean average ± standard errors of 10% trehalose. It reaches its final extent at 91%
of secondary drying. Shrinkage increases with 5% trehalose rapidly during the first half of
secondary drying, but not as fast as during the second period of primary drying. The rise
in shrinkage slows down at about 50% of secondary drying and shrinkage increases until at
85% of secondary drying its final extent is reached.
The kinetic progress of shrinkage and cracking with 30% trehalose is illustrated in Figure
6.85 by their first derivatives. The simultaneous periods of large increase in shrinkage and
0 20 40 60 80 100
0
2
4
6
8
10
0 20 40 60 80 100
1st D
eriv
ativ
e [%
/%]
Primary Drying Time [%] Secondary Drying Time [%]
1st Derivative of Cracking 1st Derivative of Shrinkage
Figure 6.85: First derivative of cracking (black) and shrinkage (gray) at 30% trehalose (w/v).
cracking found with 10% trehalose (see Figure 6.81) are not seen here for 30% trehalose.
Cracking and shrinkage now occur more or less alternately. Two periods of cracking are
found, the first between 60% - 90% of primary drying and the second during the whole of

6.2 Kinetic Method 175
secondary drying. The first period can be correlated to the rise in cracking during primary
drying after the sublimation process is finished and Tp rises (≥ 60% primary drying). As
already observed for 10% trehalose, there is an increase in cracking correlated with a rapid
increase in Tp. The second is flat and long and fluctuates about a value of 0.7%/%. It is
caused by the relatively constant increase in cracking during secondary drying. The slight
maximum between 50% and 70% of secondary drying is the reflection of the faster increase
in cracking observed during this time interval.
Two periods of shrinkage are found. One at 40% - 55% of primary drying and the second
between 80% - 100% of primary and 0% - 30% of secondary drying. The first period can
be related to the initiation of shrinkage and is less pronounced. In the second period two
maxima are seen. These can be related to the two step-rises in shrinkage in the second
half of primary drying. The reduction in the second maxima is related to the slow-down in
the development of shrinkage at the end of primary drying. The subsequent constant level
of the first derivative of shrinkage at 2% - 20% secondary drying time is related to the linear
increase in shrinkage during the first period of secondary drying.
The profiles of the first derivatives are opposite to those with 10% trehalose (see Figure
6.81). With 10% trehalose shrinkage is the dominant mechanism to release drying tensions,
and cracking occurs auxiliary during the sharp rise in Tp. With 30% trehalose, however,
cracking is the dominant mechanism. This can be seen by the long periods where the first
derivative of shrinkage has the value of 0 (55% - 80% primary, 30% - 100% secondary drying
time). Shrinkage occurs mainly at the end of primary drying and when Tp rises at the start of
secondary drying. This is also evident in the final extents of shrinkage and cracking, as higher
cracking values and lower shrinkage values are obtained with 30% trehalose compared to
10% trehalose.
Figure 6.86 shows representative sample images of 30% trehalose obtained at different
time points of drying. After 15% of primary drying time (Figure 6.86(a)) neither shrinkage nor
cracking are seen. Figure 6.86(b) depicts the image of the cake at the time point of the first
occurrence of cracking. The first hair-like crack in the cake is shown in the magnification of
Figure 6.86(b) marked with the black rectangle (Figure 6.86(c), 60% of primary drying)). A
narrow crack can be seen that runs from the left of the image to its right. This crack initiation
is reflected in the onset of the first maximum of the first derivative of cracking with 30%

176 6 Results
(a) (b) (c)
(d) (e) (f)
Figure 6.86: Sample images of a lyophilizate at 30% trehalose at (a): 15%, (b): 60%, (c)Enlargement and of image (b) of the region marked with an rectangle in im-age (b) with image processing, (d): 90%, (e): 100% primary drying, (f): 100%secondary drying.
trehalose (see Figure 6.85). In Figure 6.86(b) also two initial points of shrinkage are found in
the upper left and lower right cake regions (better visible in (d)), which were initiated at 45%
of primary drying. This is also reflected in the first period of the first derivative of shrinkage
(40% - 55% of primary drying time, Figure 6.85).
After ≈ 90% of primary drying the final crack pattern is reached (d). The development
of this crack pattern is reflected in the maximum of the first derivative of cracking between
60% and 90% of primary drying. Between 90% and 100% of primary drying ((d) compared
to (e)) the largest portion of shrinkage is developed. This is related to the second phase of
the first derivative of shrinkage shown in Figure 6.85 and the sharp increase in shrinkage at
the end of primary drying (Figure 6.84). During secondary drying (e) compared to (f)) crack
expansion takes place. This is reflected in the second period of the first derivative of cracking.

6.2 Kinetic Method 177
A small rise in shrinkage is seen in the upper and lower regions of the cake. These occurred
during the early phase of secondary drying (see Figure 6.84).
A more or less intact cake structure in the lower right region of the cake is observed (see
Figure 6.86). Here, shrinkage is pronounced and drying tensions are released by this. The
tensile fracture limit is therefore not exceeded and no cracking occurs in this cake region.
In the left and right regions of the cake, however, shrinkage is not observed. This may
possibly be caused by adhesion of the cake to the inside wall of the vial at this high trehalose
concentration. In the outer cake regions small, hair-like cracks can be seen. These cracks
may be a result of the adhesive forces between the cake and the inside wall of the vial being
greater than the cohesive forces within the cake. These tensions cause tensile fracture limit to
be exceeded and lead to a fracture of the lyophilizate in the outer cake regions. This process
can be seen by the comparison of the regions concerned in Figures 6.86(b) and (d). Further
expansion of the cracks in the middle of the cake may now be enabled by this fracture in the
outer regions near the glass. Contraction of the lyophilizate mass is possible, as no counter
force in terms of adhesion acts. This is in particular the case at the lower left cake fragment.
It has visibly no contact either to the inside wall of the vial. This is due to shrinkage in its
lower region or to the cake/glass because of the small, hairlike cracks in its edge region, as
well as the cracks that separate the fragment from the cake in the upper and left regions. This
contraction of the lyophilizate mass is then falsely assigned to cracking instead of shrinkage.
The crack expansion appears predominantly during secondary drying. Pikal [9] suggested
that shrinkage is developed during primary drying due to desorption of the unfrozen water.
MacKenzie [8] also correlated the development of shrinkage to molecular rearrangements
caused by the desorption of externally bound water and a reduction in internally bound water.
Shrinkage is therefore likely caused by desorption of unfrozen water that occurs both during
primary and secondary drying. An expansion of the cracks during secondary drying by the
mechanism of shrinkage is therefore likely.
As observed with 10% trehalose, shrinkage proceeds from its initial points in the upper
left and lower right cake regions. No further initial points are observed. This confirms the
suggestion that tensions caused by the movement of the sublimation front are transferred to
subjacent and adjacent regions and cause the progress of shrinkage from the initial points to
their left and right.

178 6 Results
Figure 6.87 shows the first derivatives of shrinkage and cracking obtained with 5% tre-
halose. Two periods of an increase in the first derivative of shrinkage are observed, the first
0 20 40 60 80
0,0
0,5
1,0
1,5
2,0
2,5
0 20 40 60 80 100
1st D
eriv
ativ
e [%
/%]
Primary Drying time [%] Secondary Drying Time [%]
1st derivative of Cracking 1st derivative of Shrinkage
Figure 6.87: First derivative of cracking (black) and shrinkage (gray) at 5% trehalose (w/v).
between 45% and 95% of the primary and the second between 0% and 90% of the sec-
ondary drying time. In the first period four maxima are seen that represent the step-changes
of shrinkage during primary drying. These are not that visible in Figure 6.84. From the tem-
perature and drying profile (see Figure 6.84) it is apparent that after 50% of primary drying
Tp and shrinkage rises fast with 5% trehalose. A correlation between shrinkage and the in-
crease in Tp at the end of sublimation is therefore likely. The absence of cracking with 5%
trehalose explains the greater increase in shrinkage compared to 10% and 30% trehalose,
as drying tensions that occur by the rise of Tp are released this way. The sublimation process
is almost finished at the time point of the rise in Tp, as the cumulative water loss has nearly
reached its maximum and the drying rate decreases sharply (see Figure 6.84). Only 3.13%
of shrinkage is developed with 5% trehalose during primary drying when the sublimation
takes place (≈ 60% of primary drying). Most of shrinkage is therefore developed after the
completion of sublimation (this is discussed later). The plateau phase of the second period

6.2 Kinetic Method 179
of the first derivative of shrinkage (see Figure 6.87) shows the linear increase in shrinkage
during the first half of secondary drying.
Figure 6.88 shows that no cracking occurs at samples with 5% trehalose during all of
freeze-drying. The initiation of shrinkage is observed after 48% of primary drying, as il-
(a) (b) (c)
(d) (e) (f)
Figure 6.88: Sample images of a lyophilizate at 5% trehalose at (a): 40%, (b): 48%, (c) 64%,(d): 88%, (e): 100% primary drying, (f): 100% secondary drying.
lustrated in Figure 6.88(a) compared to (b). It can be seen that already a complete cake
detachment from the inside wall of the vial is developed, whereas with 10% trehalose and
30% trehalose only a partial detachment is observed even at the end of lyophilization (see
Figures 6.82 and 6.86). This may be caused by low adhesion between the cake and the
inside wall of the vial that enables an easy detachment simultaneously at all cake edges from
the inside wall of the vial. This initiation of shrinkage and the complete detachment is evident
in the sharp onset of the first maximum of the first derivative of shrinkage in Figure 6.87. Fig-
ures 6.88(c) - (f) show the further increase in shrinkage. A consistent contraction of the lyo
mass on all sides of the cake takes place. This also supports the suggestion that no (further)

180 6 Results
cracking occurs when no counter force in terms of adhesion of the cake to the inside wall of
the glass is present. A free contraction of the lyophilizate mass is then possible and drying
tensions are released by this mechanism instead of cracking.
Only 25% of the final extent of shrinkage is developed during the sublimation phase. This
confirms the relation between shrinkage and secondary drying and is supported by the ob-
servation that shrinkage occurs first after 20% of primary drying. From the cumulative water
loss and the drying rate it is apparent that sublimation is already in progress and the upper
product layers must be almost dry. If shrinkage were related to primary drying processes, its
initiation would proceed parallel with sublimation and an earlier initiation would be the result.
The delayed first occurrence of shrinkage indicates therefore that shrinkage is related to sec-
ondary drying processes that already occur in the dried product layer during primary drying.
This is also observed with 10% and 30% trehalose, as most of the shrinkage (60.38% and
93.40%) is developed after sublimation is finished.
6.2.5 Impact of Ramp Rate to Secondary Drying
The slow ramp rate (0.15 C/min) to secondary drying of cycle 2 (see chapter 5.2.3) was
varied to a fast ramp rate (0.73 C/min, cycle 3) and an intermediate ramp rate (0.24 C/min,
cycle 4). Solutions containing 10% trehalose were lyophilized with each cycle. Figure 6.89
shows the kinetics of shrinkage and cracking in % obtained by the different ramp rates to
secondary drying, as well as Tp, Ts, the drying rate, and the cumulative water loss. The
kinetics for cracking during primary drying are similar and the curves are coincident at all
ramp rates. Only the tendency to a slower increase in cracking is seen for the fast ramp rate
compared to the slow ramp rate. The curves for shrinkage during primary drying coincide for
the fast and the intermediate ramp rate. The curve of the slow ramp rate increases slower
and at a lower extent.
During secondary drying also no differences in cracking can be observed. Only the ten-
dency to lower cracking values can be seen for the fast ramp rate compared to the slow
ramp rate. In the first 5% of secondary drying the curve for shrinkage for the fast ramp rate
rises rapidly to values more similar to those obtained for the intermediate ramp rate. Then
the curves for shrinkage during secondary drying of the fast and the intermediate ramp rate
are coincident. They run during secondary drying always at higher values compared to the

6.2 Kinetic Method 181
20 40 60 80
0
2
4
6
8
10
12
14
20 40 60 80
0
2
4
6
8
10
12
14
20 40 60 80
0
2
4
6
8
10
12
14
20 40 60 80
0
2
4
6
8
10
12
14
Cra
ckin
g [%
]
Shr
inka
ge [%
]
20 40 60 80-50
-40
-30
-20
-10
0
10
20
Pro
duct
Tem
pera
ture
[°C
]
20 40 60 80-50
-40
-30
-20
-10
0
10
20
She
lf Te
mpe
ratu
re [°
C]
20 40 60 80
0
200
400
600
800
Primary Drying Time [%]
Cum
ulat
ive
Wat
er L
oss
[mg]
20 40 60 80
Secondary Drying Time [%]
0
2
4
6
8
10
12
14
Dry
ing
Rat
e [m
g/%
]
Figure 6.89: Kinetics of cracking and shrinkage in % at a slow (black, 0.15 C/min), an inter-mediate (blue, 0.24 C/min) and a fast (red, 0.73 C/min) ramp rate in correlationto Tp (solid line), Ts (dashed line), the drying rate (solid line), and the cumulativewater loss (dashed line) during primary and secondary drying. The coordinatesfor cracking and shrinkage are the mean average ± standard errors of all valuesobtained (n=3). Total duration of primary drying for all conditions = 17 h, totalduration of secondary drying: 10 h for the slow, 8 h for the intermediate, 6 h forthe fast ramp rate.

182 6 Results
slow ramp rate. Figure 6.90 shows the first derivatives of shrinkage and cracking of all sam-
ples. The same phases of a rise in shrinkage and cracking are observed. For cracking these
0 20 40 60 80
0
1
2
3
4
5
0 20 40 60 80 100
1st D
eriv
ativ
e [%
/%]
Primary Drying time [%]
1st Derivative of Cracking (fast RR) 1st Derivative of Cracking (slow RR) 1st Derivative of Cracking (intermediate RR)
Secondary Drying time [%]
(a)
0 20 40 60 80 100
0
1
2
3
4
5
0 20 40 60 80 100
1st D
eriv
ativ
e [%
/%]
Primary Drying time [%] Secondary Drying time [%]
1st Derivative of Shrinkage (fast RR) 1st Derivative of Shrinkage (slow RR) 1st Derivative of Shrinkage (intermediate RR)
(b)
Figure 6.90: First derivative of cracking (a) and shrinkage (b) at a slow (black, 0.15 C/min),an intermediate (blue, 0.24 C/min) and a fast (red, 0.73 C/min) ramp rate (RR)to secondary drying.
phases are seen at 10% - 30% and 40% - 90% of primary drying. Cracking increases at a

6.2 Kinetic Method 183
similar extent for all samples during primary drying. For shrinkage the phases are found at
20% - 40%, 45% - 90%, and 90% - 100% of primary drying. Shrinkage increases at a higher
extent at the intermediate and the fast ramp rate compared to the slow ramp rate. During
secondary drying cracking is developed in all samples during the first 60% of secondary dry-
ing. The maxima of the first derivative of shrinkage for the fast/intermediate ramp rate are
reached at earlier time points at the very beginning of secondary drying and reach higher
values compared to the slow ramp rate. This is not as pronounced in the comparison of the
slow and the intermediate ramp rate. The decline in the last period of the first derivative of
shrinkage during primary drying is also found at the beginning of secondary drying.
Table 6.14 gives a summary of the final extents of shrinkage and cracking. The large mean
Ramp Rate Cracking Shrinkage
slow (0.15 C/min) 4.30% (2.41) 3.25% (2.31)intermediate (0.24 C/min) 3.11% (2.14) 8,72% (2.28)fast (0.73 C/min) 1.73% (0.16) 8.30% (1.01)
Table 6.14: Values of shrinkage and cracking and their mean average ± standard errors of allvalues obtained (n=3) given in brackets found by the kinetic method at differentramp rates.
average ± standard error indicate that no influence of the ramp rate on the extent of crack-
ing is observed. Only a slight tendency to a decrease in cracking with a larger duration of
the ramp rate to secondary drying is observed, which is caused by the greater amount of
shrinkage. The differences found in the kinetics of shrinkage between the fast/intermediate
and the slow ramp rate are also found in the final amounts of shrinkage. This is seen de-
spite the mean average ± standard error, as the values for shrinkage are greater for the
fast/intermediate ramp rate compared to the slow ramp rate. As Figure 6.91(a) shows,
shrinkage at the slow ramp rate is only found at some points after primary drying. At the
intermediate (d) and fast (g) ramp rates, however, shrinkage is found to a greater extent and
an almost complete cake detachment is observed. During the first 40% of primary drying
the lyo mass contracts to a greater extent at the intermediate and fast ramp rate as shown in
Figures 6.91(e), (h), compared to (b). The greater amount of shrinkage and the lower amount
of cracking for the fast/intermediate ramp rate compared to the slow ramp rate found at the
end of secondary drying can be seen in the comparison of Figures 6.91(c), (f), (i).
A ramp rate to secondary drying greater than 0.15 C/min promotes therefore shrink-
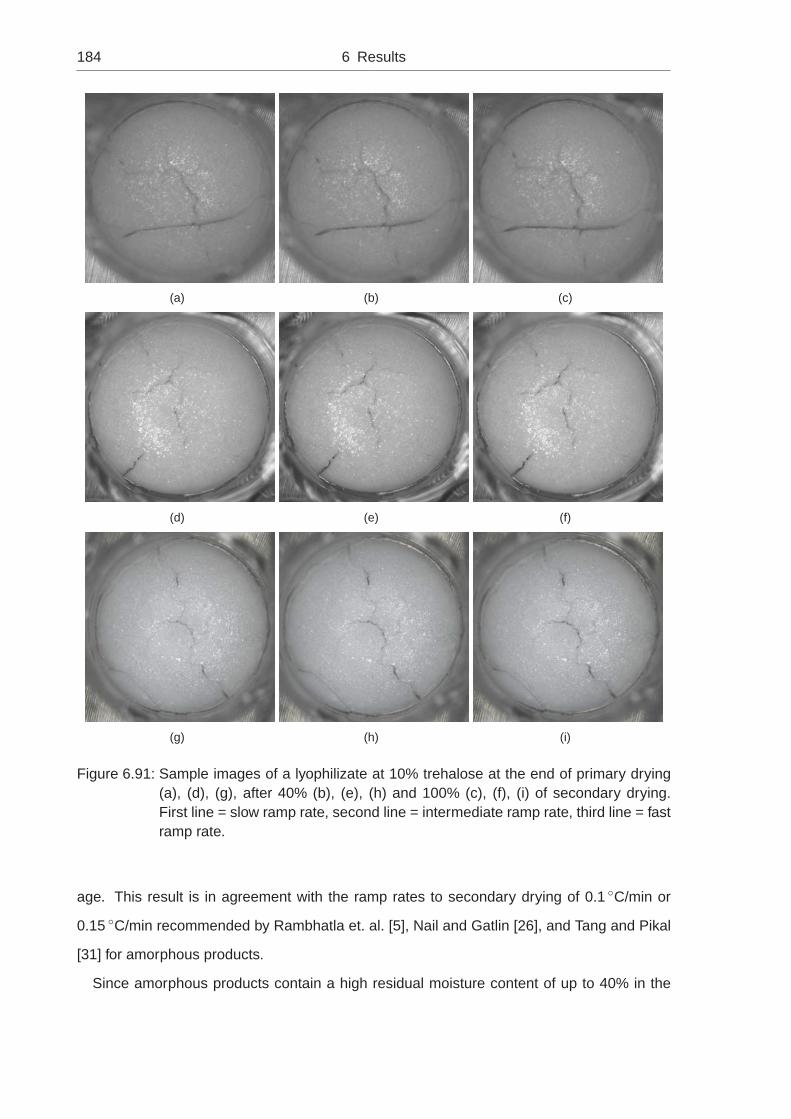
184 6 Results
(a) (b) (c)
(d) (e) (f)
(g) (h) (i)
Figure 6.91: Sample images of a lyophilizate at 10% trehalose at the end of primary drying(a), (d), (g), after 40% (b), (e), (h) and 100% (c), (f), (i) of secondary drying.First line = slow ramp rate, second line = intermediate ramp rate, third line = fastramp rate.
age. This result is in agreement with the ramp rates to secondary drying of 0.1 C/min or
0.15 C/min recommended by Rambhatla et. al. [5], Nail and Gatlin [26], and Tang and Pikal
[31] for amorphous products.
Since amorphous products contain a high residual moisture content of up to 40% in the

6.2 Kinetic Method 185
early stage of secondary drying and thus a low Tg, a great potential for collapse exists at this
stage. A slow ramp rate to secondary drying, however, does not run that close to Tg during
secondary drying and prevents therefore a collapse of the lyophilizate [5, 26, 31]. Rambhatla
et. al. [5] suggested based on the work of Liapis et. al. [161] that shrinkage may be a result
of approaching to Tp in early secondary drying.
As Figure 6.89 shows, Tp of the samples freeze-dried with the intermediate/fast ramp rate
rises more rapidly compared to Tp of the slow ramp rate. An approach to or even exceeding
of Tg is therefore more likely during secondary drying at the intermediate/fast ramp rate.
Especially at the beginning of secondary drying the difference between Tp and Tg might be
smaller at the fast/intermediate ramp rate compared to the slow ramp rate. If the difference
between Tp and Tg is decreased, the mechanical strength of the amorphous glass is weaker.
A compression of the lyophilizate mass is therefore more likely causing a higher amount of
shrinkage. The fast approaching of Tp and Tg during the early stage of secondary drying
causes therefore the sharp increase in shrinkage observed for the fast/intermediate ramp
rate. This relation between a greater shrinkage and a smaller difference between Tg and Tp
was already observed at Rambhatla et. al. [5].
However, Figure 6.91 shows that a more complete cake detachment is already developed
during primary drying. Hence, tensions caused by adhesion of the cake to the inside wall of
the vial are lower at samples freeze-dried with a fast/intermediate ramp rate. Shrinkage is
then favored and promotes the differences found between the slow and the intermediate/fast
ramp rate. From the comparison of Figures 6.91(a) - (c), however, it can be seen that crack
expansion likely caused by shrinkage is not as pronounced as the cake shrinkage at the
intermediate (d) - (f) and the fast (g) - (i) ramp rates. The influence caused by the different
adhesion behavior developed during primary drying must therefore be low.
6.2.6 Impact of a Lower Primary Drying Temperature
The primary drying temperature, PDT, of cycle 2 (-20 C, see chapter 5.2.3) was varied to
-25 C (cycle 5). Solutions containing 10% trehalose were lyophilized with each cycle. A
lower PDT leads to a lower end amount of cracking and to a higher end amount of shrinkage,
see Table 6.15. The kinetics of shrinkage and cracking obtained by a different PDT are shown
in Figure 6.92. Cracking is initiated at the lower PDT at 41% of primary drying, whereas at the

186 6 Results
Ramp Rate Cracking Shrinkage
-20 C PDT 4.30% (2.41) 3.25% (2.31)-25 C PDT 0.77% (0.13) 12.0% (0.42)
Table 6.15: Values of shrinkage and cracking and their mean average ± standard errors of allvalues obtained (n=3), given in brackets, found by the kinetic method at differentprimary drying temperatures (PDT).
standard PDT cracking is initiated earlier (20% of primary drying). The curves for cracking
during primary and secondary drying have similar shapes. The greatest increase in cracking
is observed with both between 40% and 70% of primary drying. But the amounts of cracking
developed during primary drying differ strongly, as after 25% of primary drying the amount of
cracking is always smaller at the lower PDT.
The curves for shrinkage during the first 45% of primary drying are similar at the different
PDTs. After 45% of primary drying sublimation slows down. The curves of the drying rate
drop and the curves of the cumulative water loss approach their maximum. Shrinkage in-
creases to a higher extent at the lower PDT and has always higher values. After ≈ 60% of
primary drying, when sublimation is finished, Tp rises in both samples more sharply than at
prior time points. The differences in shrinkage are more pronounced after 60% of primary
drying as a further acceleration of the increase in shrinkage for the lower PDT is observed.
The rapid increase in shrinkage for the lower PDT is decelerated after 68% of primary drying.
The curves for shrinkage during secondary drying have the same shape, but run at higher
values for the lower PDT. These differences in shrinkage are developed during primary dry-
ing and are therefore related to the lower PDT.
Figure 6.93 shows the first derivatives of shrinkage at both PDTs. The development of
shrinkage rises fast between 40% and 70% of primary drying at the low PDT. The values
of the first derivative of shrinkage are more than 4-fold higher at the maxima compared to
the standard PDT in this phase. The highest increase in shrinkage is observed during 60% -
70% of primary drying when the sublimation is completed.
According to Figures 6.92 and 6.93 a lower PDT promotes detachment of the product from
the inside wall of the vial. The drying tensions are then released by shrinkage and the tensile
fracture limit is not exceeded. Hence, a lower amount of cracking results. This process is
observed during the whole of primary drying: the reduction in cracking is first caused by a

6.2 Kinetic Method 187
20 40 60 80
0
2
4
6
8
10
12
14
20 40 60 80
0
2
4
6
8
10
12
14
20 40 60 80
0
2
4
6
8
10
12
14
20 40 60 80
0
2
4
6
8
10
12
14
Cra
ckin
g [%
]
Shr
inka
ge [%
]
20 40 60 80-50
-40
-30
-20
-10
0
10
20
Pro
duct
Tem
pera
ture
[°C
]
20 40 60 80-50
-40
-30
-20
-10
0
10
20
She
lf Te
mpe
ratu
re [°
C]
20 40 60 80
0
200
400
600
800
Primary Drying Time [%]
Cum
ulat
ive
Wat
er L
oss
[mg]
20 40 60 80
Secondary Drying Time [%]
0
2
4
6
8
10
12
14
Dry
ing
Rat
e [m
g/%
]
Figure 6.92: Kinetics of cracking and shrinkage (in % to their final amounts) at -20 C (black)and -25 C (gray) primary drying temperature (PDT) in correlation to Tp (solidline), Ts (dashed line), the drying rate (solid line), and the cumulative water loss(dashed line) during primary and secondary drying. The coordinates for crackingand shrinkage are the mean average ± standard errors of all values obtained(n=3). Total duration of primary drying: 17 h for the PDT of -20 C and 24 h forthe PDT of -25 C , total duration of secondary drying = 10 h for all conditions.

188 6 Results
0 20 40 60 80 100
0
1
2
3
4
5
0 20 40 60 80 100
1st D
eriv
ativ
e [%
/%]
Primary Drying time [%] Secondary Drying time [%]
1st Derivative of Shrinkage (standard PDT) 1st Derivative of Shrinkage (low PDT)
Figure 6.93: First derivative of shrinkage at the standard (black, -20 C) and the lower (gray,-25 C) PDT.
prior initiation of shrinkage. With increasing values of shrinkage caused by the lower PDT a
reduction in cracking is observed. During 20% - 75% of primary drying cracking increases
from 0.1% up to 2.75% at the standard PDT. At the lower PDT an increase from 0% up
to only 0.26% is observed. Shrinkage, however, increases in this time interval at the lower
PDT from 0.50% up to 9.16% and at the standard PDT from 0% only up to 1.90%. This
development is also visible in the cake appearance shown in Figure 6.94 and confirms that a
high amount of shrinkage causes a low amount of cracking, as already found at the endpoint
evaluation method. Figure 6.94(b) compared to (d) shows that at the lower PDT a complete
detachment of the cake from the inside wall of the glass occurs. This is not observed at the
standard PDT ((a) compared to (c)), where only initial points of shrinkage are observed. With
both samples the final crack pattern is achieved after 70% of primary drying. As observed in
the kinetics, nearly no further cracking is developed thereafter. This is also visible in Figure
6.94(f) compared to (h).
Easier detachment of the cake from the inside walls of the vial at a lower PDT may be
a result of the slower drying process caused by the lower PDT. This slower process is not
visible in Figure 6.92, as the durations of primary and secondary drying are normalized for
comparison. The time point at which Tp reaches Ts is reached after ≈ 1150 min with the lower

6.2 Kinetic Method 189
(a) (b)
(c) (d)
(e) (f)
(g) (h)
Figure 6.94: Sample images of a lyophilizate at 10% trehalose at 15% (a): standard PDT,(b): low PDT, 40% (c): standard PDT, (d): low PDT; 70% (e): standard PDT, (f):low PDT and 100% primary drying (g): standard PDT, (h): low PDT.

190 6 Results
PDT and after ≈ 925 min with the standard PDT. The increase in Tp after the sublimation
process is finished is therefore slower at a lower PDT and the rise in drying tensions related
to this temperature rise is reduced. The lyophilizate has more time for release of drying
tensions. As already observed with 10% trehalose (see chapter 6.2.3) shrinkage is a slow
process compared to cracking. As sufficient time is available at a lower PDT for relaxation
of the cake by shrinkage, shrinkage occurs. The tensile fracture limit is then not exceeded
as drying tensions are released by shrinkage and no cracking occurs. At the standard PDT,
however, the increase in Tp proceeds faster and also the increase in drying tensions. The
increase in drying tensions is then too fast for sufficient shrinkage. The tensile fracture limit
is exceeded and cracking occurs.
6.2.7 Impact of Tween 80 or Glycerol
Tween and glycerol were added to a 10% aqueous trehalose solution. For tween a concen-
tration of 0.03% was chosen, which is higher than the critical micelle concentration, CMC,
(= 0.0014 g/100 ml) [162]. Glycerol has a very low glass transition temperature (-92 C) and
the lowering of T ′g needed to be investigated to define suitable drying conditions [123]. DSC
measurements were performed with different amounts of glycerol in a 10% aqueous tre-
halose solution to determine the T ′g of each formulation (see Table 6.16). With increasing
Glycerol [%] T ′g
1% -37.6C2.5% -44.6C5%% -54.6C
Table 6.16: Overview of values of T ′g of aqueous solutions with 10% trehalose and different
portions of glycerol obtained by DSC measurements.
glycerol concentration T ′g is decreased and glycerol acts as a plasticizer, as already found
for example at Buera et. al. [163] and Gontard et. al. [164]. A decrease in T ′g of trehalose
by glycerol was already noted by Cicerone and Soles [165]. Since formulations containing
2.5% and 5% glycerol show low values of T ′g which are not suitable for freeze-drying, a glyc-
erol concentration of 1% was chosen. Solutions were prepared and freeze-dried with cycle 2
(see chapter 5.2.3). The primary drying temperature was adapted for the samples containing
glycerol to -30 C (instead of -20 C) to assure a similar difference between Tp and T ′g for all

6.2 Kinetic Method 191
formulations. The effect of the different additives on the kinetics of shrinkage and cracking is
shown in Figure 6.95 and Table 6.17.
Pure trehalose Trehalose/tween Trehalose/glycerol
Cracking 1D 3.37% 0.00% 0.00%Cracking 2D 4.30% 0.00% 0.00%Shrinkage 1D 2.41% 11.19% 8.85%Shrinkage 2D 3.25% 12.83% 13.48%
Table 6.17: Values of shrinkage and cracking for samples with pure trehalose, and with amixture of trehalose and tween or trehalose and glycerol, respectively at the endof primary (1D) and secondary drying (2D).
With both additives no cracking is observed and the curves are coincident. Shrinkage is
first developed after about 20% of primary drying in all formulations and increases gradually
during primary drying. For trehalose/tween three steps are seen, the first at 20% - 40%, the
second at 40% - 80%, and the last at 80% - 100% of primary drying. For trehalose/glycerol
also three steps are observed, the first at 20% - 35%, the second at 35% - 65%, and the
last at 65% - 100%. After 25% of primary drying the curve of shrinkage during primary
drying runs always at higher values for trehalose/tween compared to trehalose/glycerol and
pure trehalose. After 40% of primary drying also shrinkage of trehalose/glycerol increases
faster than pure trehalose. Shrinkage develops therefore in the order: pure trehalose <
trehalose/glycerol < trehalose/tween. After 80% of primary drying a stagnation of shrink-
age is observed with both additives, whereas an increase in shrinkage is still found for pure
trehalose. At the end of primary drying the values of shrinkage increase in the order pure
trehalose < trehalose/glycerol < trehalose/tween.
During secondary drying of all formulations an increase in shrinkage during the ramp to
secondary drying is found (≤ 50% of secondary drying). This is more pronounced with
trehalose/glycerol. At 50% of secondary drying the curves for trehalose/glycerol and tre-
halose/tween cross and trehalose/glycerol increases faster and to higher values compared
to trehalose/tween. For trehalose/tween the final amount of shrinkage (12.83%) is reached
after 64% and for trehalose/glycerol (13.48%) at ≈ 68% of secondary drying. The curves
for trehalose/tween and trehalose/glycerol run always at higher values compared to pure
trehalose.
From the drying and temperature profile (sharp rise in Tp, decline of the drying rate and

192 6 Results
20 40 60 80
0
2
4
6
8
10
12
14
20 40 60 80
0
2
4
6
8
10
12
14
20 40 60 80
0
2
4
6
8
10
12
14
20 40 60 80
0
2
4
6
8
10
12
14
Cra
ckin
g [%
]
Shr
inka
ge [%
]
20 40 60 80-50
-40
-30
-20
-10
0
10
20
Pro
duct
Tem
pera
ture
[°C
]
20 40 60 80-50
-40
-30
-20
-10
0
10
20
She
lf Te
mpe
ratu
re [°
C]
20 40 60 80
0
200
400
600
800
Primary Drying Time [%]
Cum
ulat
ive
Wat
er L
oss
[mg]
20 40 60 80
Secondary Drying Time [%]
0
2
4
6
8
10
12
14
Dry
ing
Rat
e [m
g/%
]
Figure 6.95: Kinetics of cracking and shrinkage in % of samples with 10% trehalose freeze-dried without any additive (black), with the additive of tween (blue) and the addi-tive of glycerol (red) in correlation to Tp (solid line), Ts (dashed line), the dryingrate (solid line), and the cumulative water loss (dashed line) during primary andsecondary drying. The coordinates for cracking and shrinkage are the mean av-erage ± standard errors of all values obtained (n=3). Total duration of primarydrying: 18 h for trehalose/tween and 23 h for trehalose/glycerol, total duration ofsecondary drying = 10 h for all formulations.

6.2 Kinetic Method 193
constant value of the cumulative water loss) it can be seen that sublimation is finished af-
ter 48% of primary drying at trehalose/tween, and after 58% at pure trehalose and tre-
halose/glycerol. Only < 40% of the final amount of shrinkage is developed during the subli-
mation process. This confirms that shrinkage is caused by secondary drying processes. An
influence of the rise in Tp caused by the completion of sublimation on the increase in drying
tensions and shrinkage is likely. According to the time point of the rise in Tp, the time points
of a rise in shrinkage should proceed in the order: trehalose/tween < trehalose/glycerol <
pure trehalose. This is observed in this experiment. The distinct delay of the rise in shrinkage
of pure trehalose may be caused by the simultaneously rise in cracking. For trehalose/tween
and trehalose/glycerol no cracking is observed and the drying tensions are released only by
shrinkage.
The addition of tween or glycerol to a 10% aqueous trehalose solution favors detachment
of the cake from the inside wall of the vial. Tween is a surfactant and will be positively
adsorbed at the air/water interface and decreases the adhesion of the product to the inside
wall of the vial. Should Γ at the liquid/solid interface be positive for trehalose, then the
adhesive effect of the solid trehalose cake to the inner vial wall will be reduced by the tween.
A detachment of the cake from the inside wall of the vial and a release of drying tensions by
shrinkage is then more likely. Glycerol is commonly used as an additive for an improvement
of protein stabilization during lyophilization [166, 167]. It is a non-volatile and is left within the
lyophilizate during freeze-drying [167]. It may therefore also decrease the adhesion of the
cake to the inside wall of the vial and promotes detachment of the cake as it remains liquid.
The tensile fracture limit is not exceeded and no cracking occurs.
Figure 6.96(a), (d), (g) shows that no shrinkage and no cracking is observed at the start of
primary drying. Figures 6.96 (b), (e), and (h) show that shrinkage at the end of primary drying
decreases in the order: trehalose/tween (e) > trehalose/glycerol (h) > pure trehalose (b). A
complete detachment of the cake from the inside wall of the vial is caused by the additives
during primary drying (Figure 6.96(a), (d), (g) compared to (b), (e), (h)). The influence of
the additives on adhesion is more pronounced with tween compared to glycerol, as a larger
amount of shrinkage is observed for tween/trehalose. The positive adsorption of tween to
the inside glass lowers therefore the adhesion of the product to the inside wall of the vial to a
greater extent than the liquid glycerol.

194 6 Results
(a) (b) (c)
(d) (e) (f)
(g) (h) (i)
Figure 6.96: Sample images of the lyophilizates with 10% trehalose without additive at (a):0% , (b) 100% primary drying, (c) 100% secondary drying; with 10% trehaloseand 0.03% tween at (d): 0%, (e): 100% primary drying, (f) 100% secondarydrying; with 10% trehalose and 1% glycerol at (g) 0%, (h): 100% primary drying,(i) 100% secondary drying.
Cracking is observed only with samples of pure trehalose at the end of primary and sec-
ondary drying, whereas no cracking appears at samples with an additive ((a) - (c) compared
to (d) - (i)). This is caused by the adhesion of the pure trehalose to the inside wall of the

6.2 Kinetic Method 195
vial. Based of this adhesion the drying tensions cannot be released by a contraction of the
lyophilizate mass. The stress rises until the tensile fracture limit is exceeded. As a result
fracture occurs and a lower amount of shrinkage is observed as drying tensions are released
by cracking.
At the end of secondary drying (right column of Figure 6.96) shrinkage increases in the
order: pure trehalose < trehalose/tween < trehalose/glycerol. The lyophilizates with an
additive show an intact cake structure with no cake fragments left on the inside wall of the
cake. This results from easy detachment during primary drying. After primary drying the
freeze-drier shelf is visible in the gap between cake and inside wall of the vial. Complete
lateral detachment of the product from the glass has therefore developed. Any influence of
the adhesion of the product to the inside wall of the glass is therefore not relevant during
secondary drying. Only adhesion of the product to the vial base may play a role. As the
images of Figures 6.96(f), (i) show, an enlargement of the gap between cake and glass is
observed and the influence of adhesion of the product to the base of the vial should be less
pronounced.
An influence of Tp on the drying tensions during secondary drying is likely, as the in-
crease in shrinkage stops during secondary drying when Tp reaches Ts. The increase in
Tp, however, is similar for all formulations. The drying tensions and an increase in shrink-
age related to this temperature rise must be similar. Shrinkage, however, increases faster
with trehalose/glycerol than with pure trehalose or trehalose/tween. With trehalose this lower
increase may be explained by the increase in cracking that releases the drying tensions.
Shrinkage, however, increases to a different extent with the formulations containing an addi-
tive and no cracking is observed. The contraction of the lyophilizate mass during secondary
drying is therefore related to the strength of the lyophilizate to withstand the drying tensions.
This strength must be stronger with trehalose/tween. As glycerol acts as an plasticizer the dif-
ference between Tp and Tg should be smaller at the same Tp for trehalose/glycerol compared
to pure trehalose or trehalose/tween [163, 164, 165]. As already observed at Rambhatla et.
al. [5] and at the current study with different ramp rates (see chapter 6.2.5), a relation be-
tween a smaller difference (Tp - Tg) causes a higher amount of shrinkage due to a weaker
amorphous glass. A compression of the lyophilizate is therefore easier, as is evident in a
higher amount of shrinkage.

196 6 Results
6.2.8 Impact of a Protein
Solutions with 10% trehalose either with or without BSA (1/3 BSA, 2/3 trehalose) in a buffer
solution containing tris (pH = 7.4) were freeze-dried with cycle 7 (see chapter 5.2.3). The
kinetics of shrinkage and cracking obtained and their values after primary and secondary dry-
ing are shown in Figure 6.97 and Table 6.18. No cracking is observed in both samples. The
absence of cracking caused by the 2stepA cycle is therefore not influenced by the addition of
BSA. Shrinkage occurs earlier with samples containing BSA (36% of primary drying) com-
End of 1D End of 2D
Cracking BSA 0.00% 0.00%Shrinkage BSA 4.54% 7.53%Cracking without BSA 0.00% 0.00%Shrinkage without BSA 7.12% 9,46%
Table 6.18: Values of shrinkage and cracking for samples with BSA and without BSA at theend of primary (1D) and secondary drying (2D).
pared to the formulations without the protein (47% of primary drying). In the period of 47% -
62% of primary drying the curves for shrinkage overlap because of the large mean average ±
standard errors found for the sample containing BSA. However, shrinkage rises more rapidly
for the formulation without BSA. The values of shrinkage are thereafter always higher during
primary drying than those obtained with BSA. This sharp increase in shrinkage is in particu-
lar the case between 55% - 80% of primary drying. In this period shrinkage increases from
1.05% up to 6.25%. This increase accounts for almost three-quarters of the shrinkage devel-
oped during primary drying. In the same period shrinkage increases with samples containing
BSA from 1.55% up to 3.40% (only 41% of the shrinkage developed during primary drying).
For the samples with BSA, the rise in shrinkage proceeds more gradually and consistently
as 3-4 similar steps are observed. These occur between the initiation of shrinkage at 36%
of primary drying until 89% where a plateau phase is reached that remains until the end of
primary drying. No plateau phase is observed with samples without BSA, but a deceleration
of shrinkage is observed after 70% of primary drying.
During the first half of secondary drying shrinkage increases with both formulations. After
50% of secondary drying both reach their final extents of 7.12% with, and 9.46% without
BSA. Figure 6.98 shows the lower amount of shrinkage developed during primary drying in

6.2 Kinetic Method 197
20 40 60 80
0
2
4
6
8
10
20 40 60 80
0
2
4
6
8
10
20 40 60 80
0
2
4
6
8
10
20 40 60 80
0
2
4
6
8
10
Cra
ckin
g [%
]
Shr
inka
ge [%
]
20 40 60 80-50
-40
-30
-20
-10
0
10
20
Pro
duct
Tem
pera
ture
[°C
]
20 40 60 80-50
-40
-30
-20
-10
0
10
20
She
lf Te
mpe
ratu
re [°
C]
20 40 60 80
0
200
400
600
800
Primary Drying Time [%]
Cum
ulat
ive
Wat
er L
oss
[mg]
20 40 60 80
Secondary Drying Time [%]
0
2
4
6
8
10
12
14
Dry
ing
Rat
e [m
g/%
]
Figure 6.97: Kinetics of cracking and shrinkage in % of samples with 10% trehalose freeze-dried with a two-step freezing and included annealing step (2stepA) without theaddition of BSA (black) and with the addition of BSA (gray) in correlation to Tp
(solid line), Ts (dashed line), the drying rate (solid line), and the cumulative wa-ter loss (dashed line) during primary and secondary drying. The coordinatesfor cracking and shrinkage are the mean average ± standard errors of all val-ues obtained (n=3). Total duration of primary drying = 17 h, total duration ofsecondary drying = 10 h.

198 6 Results
samples with BSA (a), (b) compared to samples without BSA (d), (e). With both samples
(a) (b) (c)
(d) (e) (f)
Figure 6.98: Sample images of the lyophilizates with 10% trehalose with BSA (a): 0% , (b)100% primary drying, (c) 100% secondary drying and without BSA at (d): 0%,(e): 100% primary drying, (f) 100% secondary drying.
incomplete detachment of the cake from the inside wall of the vial is found. With samples
containing BSA this is found in the upper region, and with samples without BSA in the right
region of the image. During secondary drying a higher amount of shrinkage occurs with the
samples having no BSA ((c) compared to (f)). With both samples no cracking occurs.
The drying rate drops at 45% of primary drying for samples without BSA and at 58% of
primary drying for samples with BSA, and the cumulative water loss reaches a constant
value. This indicates the completion of sublimation (see Figure 6.97). Thereafter a sharp
rise in Tp is observed. The sharp rise in shrinkage is therefore caused by secondary drying
processes. The initiation of shrinkage can be related to the first rise in Tp, as a prior rise
in Tp and a prior initiation of shrinkage is observed for samples containing BSA compared
to samples without BSA. Two step-rises in Tp are observed with BSA, causing the more
gradual increases in shrinkage. The higher solid content in samples with BSA caused by the

6.2 Kinetic Method 199
protein itself and the buffer salts may influence the compressibility of the lyophilizate and less
shrinkage is therefore observed.
Since during secondary drying no cracking is observed, cracking cannot be the reason
for the differences in shrinkage. These are developed during the ramp to secondary drying
(< 50% of secondary drying). During this phase Tp rises more rapidly with samples not
containing BSA and the difference (Tp - Tg) should be smaller. The weakness of the cake is
therefore increased and a higher amount of shrinkage is observed.
6.2.9 Kinetics of Different Disaccharides
The kinetics for 10% trehalose, D-(+)-sucrose and D-(+)-maltose obtained with cycle 2 (see
chapter 5.2.3) are shown in Figure 6.99. A summary of the final extents of shrinkage and
cracking is given in Table 6.19. Shrinkage decreases in the order: D-(+)-sucrose > D-
Trehalose D-(+)-sucrose D-(+)-maltose
Cracking 1D 3.37% 0.00% 0.00%Cracking 2D 4.30% 0.00% 0.00%Shrinkage 1D 2.41% 7.71% 7.30%Shrinkage 2D 3.25% 10.09% 8.35%
Table 6.19: Values of shrinkage and cracking for samples with trehalose, D-(+)-sucrose andD-(+)-maltose at the end of primary (1D) and secondary drying (2D).
(+)-maltose > trehalose. The same order was already found with the endpoint evaluation
method. The causal correlation between shrinkage and w′ is seen again (see chapter 6.1.4).
The values of shrinkage obtained by the endpoint method are higher (14.37% for trehalose,
20.37% for D-(+)-sucrose and 17.58% for D-(+)-maltose). No cracking is observed for D-
(+)-sucrose and D-(+)-maltose with the kinetic method. With the endpoint evaluation method
also no cracking occurs for D-(+)-maltose and only 0.12% for D-(+)-sucrose. The differences
may be caused by the vial cutting (see chapter 6.2.1.4).
As Figure 6.99 also shows, no cracking is observed for D-(+)-sucrose and D-(+)-maltose.
Shrinkage starts for all disaccharides after ≈ 20% of primary drying and increases until 55%
of primary drying. After this time point D-(+)-maltose and D-(+)-sucrose rise faster compared
to trehalose. This is initiated earlier at D-(+)-maltose (55% of primary drying) compared to
D-(+)-sucrose (≈ 60% of primary drying). Both reach after 90% of primary drying a plateau

200 6 Results
20 40 60 80
0
2
4
6
8
10
12
20 40 60 80
0
2
4
6
8
10
12
20 40 60 80
0
2
4
6
8
10
12
20 40 60 80
0
2
4
6
8
10
12
Cra
ckin
g [%
]
Shr
inka
ge [%
]
20 40 60 80
-50-45-40-35-30-25-20-15-10-505
1015202530
Pro
duct
Tem
pera
ture
[°C
]
20 40 60 80-50-45-40-35-30-25-20-15-10-5051015202530
She
lf Te
mpe
ratu
re [°
C]
20 40 60 80
0
200
400
600
800
Primary Drying Time [%]
Cum
ulat
ive
Wat
er L
oss
[mg]
0 20 40 60 80 100
Secondary Drying Time [%]
-101234567891011121314
Dry
ing
Rat
e [m
g/%
]
Figure 6.99: Kinetics of cracking and shrinkage in % of samples with 10% trehalose (black),10% D-(+)-sucrose (blue) and 10% D-(+)-maltose (red) freeze-dried without thestandard cycle in correlation to Ts, Tp, the drying rate and the cumulative waterloss during primary and secondary drying. The coordinates for cracking andshrinkage are the mean average ± standard errors of all values obtained (n=3).Total duration of primary drying = 17 h, total duration of secondary drying = 10 h.

6.2 Kinetic Method 201
with a similar amount of shrinkage of about 7-8%.
Most of the shrinkage for all disaccharide (≈ 60%) is developed between 50% - 75% of
primary drying. This rapid curve progression can be correlated to the rise in Tp after the
completion of sublimation, as already found. This indicates again a greater influence of sec-
ondary drying processes on shrinkage. During the first 60% of secondary drying shrinkage is
developed faster in the order D-(+)-sucrose > D-(+)-maltose > trehalose. The rise in shrink-
age is not as pronounced with trehalose and the curves for D-(+)-maltose and D-(+)-sucrose
are always at higher values during secondary drying. Figure 6.100 shows representative
sample images of lyophilizates with trehalose (a)-(c), D-(+)-maltose (d)-(f), or D-(+)-sucrose
(g)-(i) at different time points. As (a), (d), and (g) show, no shrinkage and no cracking is
observed at the start of primary drying. According to Table 6.19 it can be seen that similar
values are obtained at the end of primary drying for D-(+)-maltose (e) and D-(+)-sucrose (h).
For trehalose less shrinkage is observed (b). The lyophilizate of trehalose also shows incom-
plete cake detachment (b), whereas D-(+)-maltose (e) and D-(+)-sucrose (h) show complete
cake detachment from the inside wall of the vial. At the end of secondary drying shrinkage
increases in the order: trehalose (c) < D-(+)-maltose (f) < D-(+)-sucrose (i). It is further
apparent that cracking is only observed for lyophilizates containing trehalose.
The differences in shrinkage between D-(+)-sucrose, D-(+)-maltose and trehalose are
caused, as already discussed in 6.1.4, by the different contents of non-frozen water in the
maximum freeze-concentrated state, w′. This correlation was already suggested by Ramb-
hatla et. al. [5]. These authors suggested that additional free volume in the cake is generated
as a result of the desorption of w′ during secondary drying. This additional free volume
can then be transformed to shrinkage. As w′ decreases in the order: D-(+)-sucrose > D-
(+)-maltose > trehalose, additional free volume is generated in the cake during secondary
drying in the same order. More shrinkage occurs therefore with D-(+)-sucrose followed by
D-(+)-maltose and trehalose.
The differences in shrinkage should be more pronounced when sublimation is finished and
desorption processes occur. This is observed in the current study, as > 52% of shrinkage is
developed when the sublimation process is finished. As the desorption of w′ takes place in
the dried layer (simultaneously to sublimation processes in lower product layers) this extent is
likely underestimated and may explain the differences in shrinkage that occur during primary

202 6 Results
(a) (b) (c)
(d) (e) (f)
(g) (h) (i)
Figure 6.100: Sample images of the lyophilizates with 10% trehalose (a): 0% , (b) 100%primary drying, (c) 100% secondary drying; with 10% D-(+)-maltose at (d): 0%,(e): 100% primary drying, (f) 100% secondary drying; with 10% D-(+)-sucroseat (g) 0%, (h): 100% primary drying, (i) 100% secondary drying.
drying. Most of the desorption of w′ takes place during secondary drying, especially when
Tp rises (< 50% of secondary drying). According to Figure 6.99 shrinkage increases in this
phase in the order: D-(+)-sucrose > D-(+)-maltose > trehalose. During this phase propor-
tionally a higher extent of w′ can be desorbed from D-(+)-sucrose followed by D-(+)-maltose

6.3 µ-CT Analysis 203
and trehalose, according to their values of w′. The free volume generated by the desorption
process increases in the same order and explains the different extents of shrinkage found.
The lower extent of shrinkage with trehalose is a result of cracking, as drying tensions are
released by fracture. This reduces the increase in shrinkage during secondary drying.
6.3 µ-CT Analysis
6.3.1 Sample Selection
The length of a sample has no impact on µ-CT, but its diameter influences the achievable
resolution - smaller diameter enables higher resolution. The sample has to be smaller than
10-20 mm in order to fit into the measurement angle of the of the X-ray beam [168]. Samples
prepared in a 2R vial were therefore selected for the µ-CT scans to assure a high resolution
and to allow an analysis of the whole cake.
Even with this small sample diameter, brightness artifacts appear in the µ-CT images
caused by ”beam hardening”. The low X-ray energy photons are most strongly absorbed in
the sample material and removed from the beam (the beam becomes harder [168]). Only
the remaining higher energy photons penetrate the inner part of the object. These photons
are then less strongly absorbed in the sample depth than were the lower energy photons
in the surface layer (absorption coefficient is photon energy dependent and decreases with
increasing energy). This causes the outer layer to show an apparently higher absorption
efficiency than the inner layers of the sample. Since CT images show absorption coefficient
values coded as pixel brightness, the outer regions of a sample seem brighter (absorb more
efficiently) than the inner parts (which appear darker). This effect is further impaired by the
use of the glass vial, as glass possesses a high ability to weaken the X-ray beam. As the
beam must first penetrate the glass, most of the photons with lower energy are absorbed by
the glass and removed from the beam. The sample itself is then penetrated by fewer photons
and image noise is high. The absorption process of the photons by the sample is a statistical
process, so scanning the same region several times leads not to exactly the same absorption
result. This is further impaired by the removal of high number of low-energy photons caused
by beam hardening of the glass. Fluctuations in photon absorption occur therefore, which in
turn shows up as statistical noise (brightness variations) in in reconstructed images. It was

204 6 Results
clearly necessary to leave the cake in the glass vial during the µ-CT analysis to evaluate
shrinkage.
6.3.2 Development of Adequate Measuring Conditions
The samples were initially analyzed at a measuring duration of 1 h and 1440 projections.
One slice out of the stack of slices obtained is illustrated in Figure 6.101(a). Due to the short
(a) (b)
(c)
Figure 6.101: Sample images of a freeze-dried cake of 30% trehalose (w/v) obtained by µ-CT at a scanning time of (a): 1 h and (b): 2 h; (c): enlargement of the middleregion of (b), where ”ring artifacts” are well recognizable. Only one slice ofeach sample is shown.
scanning time, high noise appears in the images which makes the contrast between gas
phase and cake structure barely visible. An evaluation of shrinkage and cracking is therefore
not possible in this case.
6.3 µ-CT Analysis 205
A longer scanning time of 2 h and an increase in the number of projections to 2880 im-
proves photon statistics. A decrease in tube high-voltage or an increase in power are not
possible due to the specifications of the scanner. One slice of the stack of slices obtained by
the longer scanning time is illustrated in Figure 6.101(b). A reduced noise is obtained. Even
at the lower edge region of the cake a slight shrinkage is visible. The contrast between cake
structure and gas phase is improved and sharper crack edges are seen.
Artifacts termed ”ring artifacts” (see Figure 6.101c) now appear in the images [168]. At
a long scanning time instabilities such as heating of the detector or the tube occur. These
lead to fluctuations in the scanning results between earlier and later projections. During the
tomographic reconstruction process from these projections the fluctuations become apparent
and ring artifacts occur. An even longer scanning time for further image improvement (noise
reduction), although possible, would lead to stronger artifacts, so the scanning time of 2 h
was used for the µ-CT-analysis as a compromise.
6.3.3 Image Evaluation of the µ-CT-Reconstructions
The 3D images obtained by the µCT-scanner (Vorbild; Institute of Medical Physics, Erlangen)
were evaluated with MIAF software (Institute of Medical Physics, Erlangen). The basis for
the evaluation is the differences in the intensity values of the voxels. Initially, the volume
of the glass vial was segmented. Since the intensity values of the glass differ significantly
from those of the lyophilizate or the cracks, this segmentation step was performed by simple
”volume growing”. In this process the regional connectivity among neighboring voxels in the
x-, y-, and z-directions of the sample is used [169]. A range of intensity values for the glass
(minimal and maximal value) was evaluated from the histogram, and a seed location in the
region of the glass was defined. The neighbors of this seed location were assigned to the
glass volume if their intensity values were within the defined intensity range. The further
voxels belonging to the glass volume were then iteratively assigned. On each iteration, the
voxels located in proximity to voxels previously assigned to the glass volume were tested.
They were added to the glass volume, if their intensity value is within the defined intensity
range, making the volume grow. This operation is therefore termed ”volume growing”. The
captured glass volume of an image of a sample cake (Figure 6.102(a)) is shown in red in
Figure 6.102(b). In a second step, the complete cake volume was evaluated. Note, however,
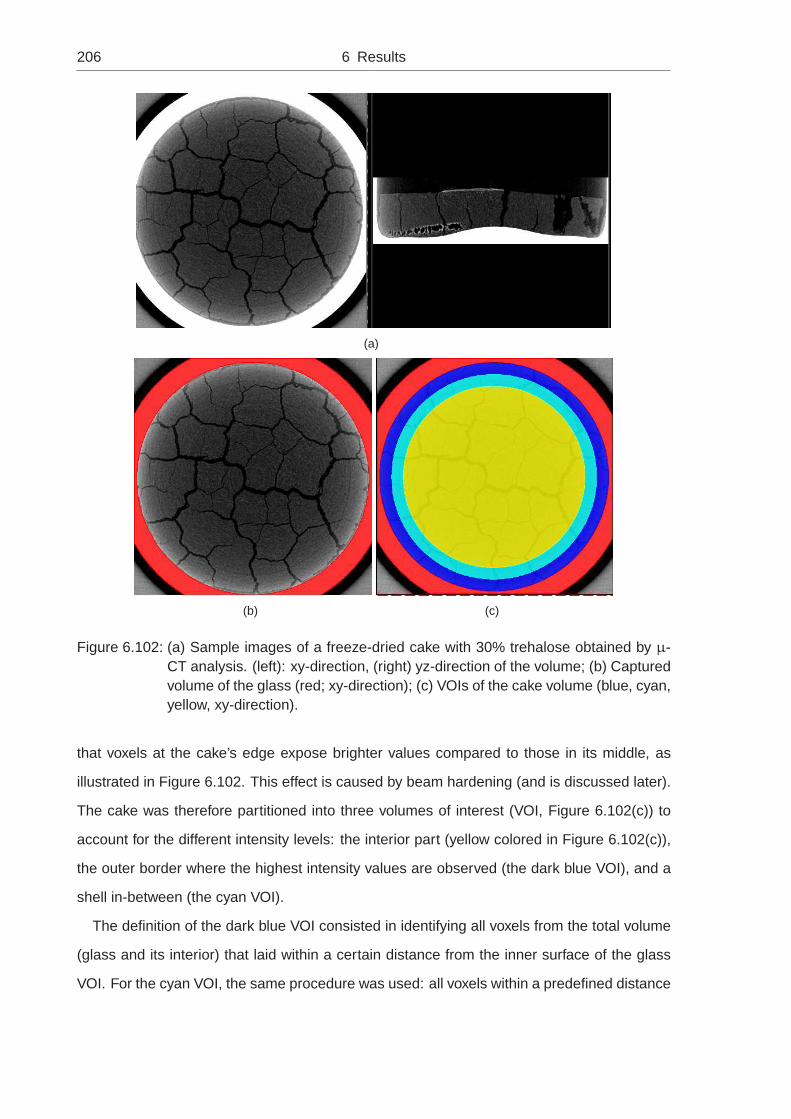
206 6 Results
(a)
(b) (c)
Figure 6.102: (a) Sample images of a freeze-dried cake with 30% trehalose obtained by µ-CT analysis. (left): xy-direction, (right) yz-direction of the volume; (b) Capturedvolume of the glass (red; xy-direction); (c) VOIs of the cake volume (blue, cyan,yellow, xy-direction).
that voxels at the cake’s edge expose brighter values compared to those in its middle, as
illustrated in Figure 6.102. This effect is caused by beam hardening (and is discussed later).
The cake was therefore partitioned into three volumes of interest (VOI, Figure 6.102(c)) to
account for the different intensity levels: the interior part (yellow colored in Figure 6.102(c)),
the outer border where the highest intensity values are observed (the dark blue VOI), and a
shell in-between (the cyan VOI).
The definition of the dark blue VOI consisted in identifying all voxels from the total volume
(glass and its interior) that laid within a certain distance from the inner surface of the glass
VOI. For the cyan VOI, the same procedure was used: all voxels within a predefined distance

6.3 µ-CT Analysis 207
from the inner boundary surface of the previously computed blue VOI formed the cyan VOI.
The rest of the glass interior defined the yellow VOI. The certain distance for the definition of
the three VOIs was defined empirically. The cake volume in each VOI was then segmented
by comparing the intensities of every voxels in it with a predefined value (this global threshold
was chosen empirically and individually for each of three VOIs). The cake volume was then
calculated by the sum of the cake volumes obtained in each VOI.
By this point, segmentation of the cake volume did not include the part of the volume
contained in the cracks. To obtain the cake volume that includes the volume of the cracks,
the following procedure was applied. First, a new segmentation volume was constructed by
combining all voxels of the previously segmented cake with all voxels that laid within a certain
small distance from the interior and exterior cake surface (boundary between cake volume
and vapor). The distance was chosen to be slightly larger than the empirically estimated
width of the largest crack to ensure an ascertainment of the whole crack volume. By this step
all cracks were ”filled” with intensity values of the cake. Note that this operation is known as
”morphological dilatation” [170]. However, beside the voxels that belong to the crack volume,
also voxels that laid within the small distance from the top of the cake surface were captured.
The cake volume with all cracks filled is falsely ”swollen” with regard to its height.
The converse operation, termed ”morphological erosion” was therefore performed to ac-
count for the ”swollen” part: all voxels of the segmented ‘swollen cake’ volume within a certain
distance from its boundary (between cake and vapor) were removed [170]. As result, the cake
will loose its ‘swollen’ part, but the cracks remain filled. The cracks are not concerned by this
operation, as boundaries between cake surface and vapor are no longer present within the
cake (as the cracks are ”filled” with the intensity values of the cake). This sequence of mor-
phological operations (dilatation and erosion) applied is known as ”morphological closing”,
since it closes gaps or fills holes. The complete cake volume (cake volume with filled cracks)
obtained is shown in Figure 6.103(a). The crack volume (Figure 6.103(b)) is then obtained
by subtracting the original cake volume (without the ”filled” cracks) from that obtained by
morphological closing (with filled cracks and without swollen part).
Several problems occurred during this image evaluation. At samples with 7.5% or 10%
trehalose the cake segmentation was difficult due to a very low contrast caused by the low
densities of the samples and a manual improvement was necessary. Evaluation of shrinkage

208 6 Results
(a) (b)
Figure 6.103: (a) Segmentation of the cake volume (green), (b) Segmentation of the crackvolume.
by analysis of µCT-images was furthermore not possible. The difference in intensity values
between vapor and cake at the edge of the cake nearby the glass wall were too small due to
beam hardening and the influence of the high intensity values of the glass (discussed later).
Only cracking is therefore considered in the following.
6.3.4 Comparison between 2D-Analysis (Endpoint Evaluation Method)
and 3D-Analysis (µ-CT)
Lyophilizates were already analyzed by µ-CT in order to investigate the total pore volume of
sucrose or mannitol lyophilizates [171] or the porosity and the pore size distribution, for in-
stance, of porous gelatin hydrogels obtained by freeze-drying [172]. In this work a resolution
of 10µm was achieved and the size of one voxel was 10x10x10µm3. This resolution is in
agreement with the spatial resolution of 9µm or 10µm found at Stange et. al. [171] and Van
Vlierberghe et. al. [172]. In this work µ-CT was used to investigate differences in the amount
of cracking on the top surface only (endpoint evaluation method, 2-dimensional picture) and
in the inside of a lyophilizate (µ-CT, 3D-analysis). The two analysis lead to different images
of the samples, as shown in Figure 6.104(a) - (c) (2D-analysis) compared to (d) - (f) (3D-
analysis). Figures 6.104(d)-(f) show the first slice of the cake (counted from top to bottom).

6.3 µ-CT Analysis 209
(a) 2D-analysis (7.5%) (b) 2D-analysis (10%) (c) 2D-analysis (20%)
(d) 3D-analysis, slice 156, (7.5%) (e) 3D-analysis, slice 156, (10%) (f) 3D-analysis, slice 118, (20%)
Figure 6.104: Images of samples with 7.5%, 10% and 20% trehalose obtained by 2D-analysisand 3D-analysis.
As horizontal slices of the sample are obtained by the µ-CT analysis, the slices in the up-
per and lower regions of the cake show ring-like structures. A white interior appears (glass)
caused by the curvature of the vial base (6.105a). On the top of the cake a black interior
(vapor) can be seen that arises from the curved top surface of the lyophilizate (caused by the
meniscus of the formulation, Figure 6.105b). Hence, an interior slice of the sample volume
is used to enable a comparison of the complete crack patterns. The image of a cake con-
taining 7.5% trehalose obtained by the 2D-analysis (Figure 6.104(a)) shows a wide crack in
its upper region, while the image of the 3D-analysis (6.104(d)) exhibits a more narrow crack
in this area. The cracks in the left and lower area found in the image of the 2D-analysis (a)
are not visible in the 3D-analysis (d). This shows that the background light of the 2D-analysis
causes the cracks to appear larger and wider than they actually are. The background light
is scattered and more diffuse light hits the lens of the camera. This causes blurred crack
edges and different crack patterns. The background light furthermore increases the contrast
between the cracks and the cake structure. This can be seen in the fine cracks found in the

210 6 Results
(a) Lower region of the sample,cross-section in the region of theglass vault of the vial (white),slice 45
(b) Upper region of the sample,cross section in the region of themeniscus of the sample (black),slice 251
Figure 6.105: Pictures of the 7.5% trehalose sample by 3D-analysis in the lower region of thesample (a) and the upper region of the sample (b).
left and lower regions of Figure 6.104(a), which cannot be seen in (d) by the 3D-analysis.
In Figure 6.104(d) no cracks are visible in the border area between cake and glass. This
effect arises in the edge region by a strong weakening-material (e.g. metal, glass) and is
well known as metal artifacts in medicine [168]. The intensity values are strongly distorted in
the transition area by beam hardening and the intensity values get blurred. The cracks are
therefore barely visible in this region.
The images of 10% and 20% trehalose (Figure 6.104(b), (c) compared to (d), (f)) show
similar crack patterns. Only the fine cracks in the border region between cake and glass
wall cannot be seen in the image of the 3D analysis. This is also caused by beam hardening.
Another reason for the differences between both methods may be the trehalose concentration
of the sample. Cracks with similar width that are not visible with 7.5% trehalose (left and lower
region of (d)) are visible at 10% (left region in (e)) or 20% trehalose. With increasing trehalose
concentration the density of the samples increases and more photons are absorbed by the
cake structure. This results in a lower statistical noise and the contrast between the cake
structure and cracks is higher. Even fine cracks in the middle of the cake can therefore be
distinguished from the cake structure at 20% trehalose.
The differences caused by the usage of different methods of analysis are reflected in
the lower cracking values found for the 3D analysis at each trehalose concentration (Fig-
ure 6.106). The major reason for the differences is the use of background light for the 2D

6.3 µ-CT Analysis 211
5 10 15 20 25 300
2
4
6
8
10
12
14
16
18 2D: Axio Vision 3D: Micro-CT
Cra
ckin
g [%
]
Trehalose concentration [%]
Figure 6.106: Cracking of samples obtained by cycle 1 (see chapter 5.2.3) for 7.5%, 10% and20% trehalose (w/v). The results obtained by the 2D analysis (black square)and the 3D analysis (white circle) are shown.
analysis, as discussed above. With the 2D-analysis the cracks appear smaller and more nar-
row as the contrast between the cracks and the cake structure is low. Cracks at the border
region between cake and glass wall are not detectable. This causes a lower amount and a
underestimation of cracking.
With the 2D analysis only the cracks on the cake’s surface are captured and evaluated.
With the 3D analysis all cracks within the sample are considered. Figure 6.107 shows the
xz- and yz -directions of the volume of the samples with 7.5%, 10% and 20% trehalose. It
can be seen that for 7.5% and 10% trehalose (Figure 6.107(a) - (d)) the cracks run vertical.
As Figure 6.107(c) shows, not all cracks run from the top to the base of the vial. Some
cracks run also funnel shaped (d) with a wider diameter at the surface. Both cases cause the
overestimation in cracking in the 2D-analysis (see Figure 6.106).
Figure 6.107(e) - (g) illustrates that the cracks run diagonal for 20% and 30% trehalose.
Some cracks are wider in the middle of the cake than at its bottom or surface. Some run
together or start in the middle of the cake (e), (g). These crack patterns cause an underesti-
mation of cracking with the 2D-analysis. As Figure 6.106 shows, higher cracking values are
found with the 2D analysis for 20% and 30% trehalose. The overestimation of cracking by
the use of background light may therefore outweigh the underestimation of cracking caused
by the different crack patterns within the sample compared to its surface.

212 6 Results
(a) yz-view of the volume, 7.5% trehalose (b) xz-view of the volume, 7.5% trehalose
(c) yz-view of the volume, 10% trehalose (d) xz-view of the volume, 10% trehalose
(e) yz-view of the volume, 20% trehalose (f) xz-view of the volume, 20% trehalose
(g) yz-view of the volume, 30% trehalose (h) xz-view of the volume, 30% trehalose
Figure 6.107: Volumes of the samples with 7.5%, 10%, 20% and 30% trehalose by 3D-analysis in yz-direction and xz-direction, respectively.
With all samples the surface curvature is not considered in the 2D analysis. Because of the
concave surface, cracks are captured in a diagonal position. This causes an optical enlarge-
ment of the cracks. From Figure 6.107 it is apparent that this curvature is more pronounced
at higher trehalose concentrations. This optical enlargement causes higher cracking values
in the 2D analysis. It explains further the higher cracking values obtained by the 2D-analysis
although the crack patterns indicate an underestimation of cracking by the 3D-analysis.
Despite the differences in the methods of analysis, a consistently higher amount of crack-
ing is obtained with increasing trehalose concentration (see Figure 6.106). This confirms the

6.3 µ-CT Analysis 213
concentration dependency of cracking already found at the endpoint evaluation method. A
2D-analysis of the surface of the lyophilizate is therefore sufficient for the endpoint evaluation
of cracking.
6.3.5 Comparison between the 3D-Structure of Samples obtained in a
Regular and a Toplyo R© Vial
Figure 6.108 compares the lyophilizates obtained by the 2stepA cycle in a regular vial (a) or
by the standard cycle in a Toplyo R© vial (b) with 30% trehalose. It exemplifies the different
surface curvature developed in a Toplyo R© vial and a regular vial. Whereas a flat lyophilizate
with a relative constant thickness is obtained in a Toplyo R© vial (a), the curved surface which
is already observed above (see chapter 6.3.4) is obtained in a regular vial (b). This different
surface geometry is produced by the hydrophobic vial coating and the greater contact angles
between the formulation and this layer in a Toplyo R© vial compared to a regular vial. As the
volume and the shape of the fill volume is preserved in the freezing step, the lyophilizate gives
the same surface shape as before lyophilization. The different structure of the lyophilizate in
a Toplyo R© vial can also be seen in the cake volume of the lyophilizate in (c) compared to a
regular vial (d). A sharper increase in cake volume at the top (slice 0-100) and a sharper
decrease at the bottom of the lyophilizate (slices > 270) is observed in a Toplyo R© vial. The
optimized container geometry of the Toplyo R© vial is reflected in this sharper decrease in cake
volume at the bottom of the cake. The constant value of the cake volume found in the middle
of the cake is more pronounced, as a more even distribution of the fill volume in the vial is
developed in a Toplyo R© vial.
From Figure 6.108(e) and (f) it is apparent that a homogeneous distribution of cracking is
found in the lyophilizate of a Toplyo R© vial (constant value of cracking in slices 160-270, (e)).
This is not observed with a lyophilizate in a regular vial obtained by the 2stepA cycle (f).
Figure 6.109 and 6.110 show the volumes of a 7.5% or 10% trehalose, respectively in a
Toplyo R© vial (standard cycle) and a regular vial (2stepA cycle). For 7.5% and 10% only
0.34% and 0.65% cracking, respectively, is found and the cracks are barely visible in the
images. A comparison of the crack patterns is therefore not possible. The flat cake geometry
found in a Toplyo R© vial and the curved cake geometry obtained in a regular vial, however, is
also visible.

214 6 Results
(a) (b)
100 200 300 4000
200
400
600
800
1000
1200
1400
1600
Cak
e V
olum
e [V
oxel
]
Slice
30% Toplyo
(c)
100 200 300 4000
200
400
600
800
1000
1200
1400
1600
Cak
e V
olum
e [V
oxel
]
Slice
30% 2step A
(d)
0 200 4000
1
2
3
4
5
6
7
8
9
10
Cra
ckin
g [%
]
Slice
30% Toplyo vial 30% Cylindrical Part Toplyo
(e)
0 200 4000
1
2
3
4
5
6
7
8
9
10
Crack
ing
Slice
30% Zylindrical Part 2stepA 30% regular vial
(f)
Figure 6.108: xz-view of the µ-CT volumes of the sample in (a) a Toplyo R© vial (standardcycle) and (b) in a regular vial (2stepA). Cake volume [Voxel] in a Toplyo vial(standard cycle) (c) and in a regular vial (2stepA cycle) (d). Cracking in % in aToplyo vial (standard cycle, (e)) and in a regular vial (2stepA cycle, (f)) as themean value of every 10 image slices of the µ-CT stack for 30% trehalose; lightgray: top and bottom area of the cake, dark gray: cylindrical part of the cake.
Figure 6.111 illustrates the values of cracking obtained by the 2D and the 3D analysis
under different conditions. As already found in the endpoint evaluation method, the usage of
Toplyo R© vials (see chapter 6.1.8) or the application of a two-step freezing phase with included
annealing (see chapter 6.1.10) leads to a strong reduction in cracking. This can be confirmed

6.3 µ-CT Analysis 215
(a) xz-view of the volume, 7.5% trehalose Toplyo (b) yz-view of the volume, 7.5% trehalose Toplyo
(c) xz-view of the volume, 7.5% trehalose 2stepA (d) yz-view of the volume, 7.5% trehalose 2stepA
Figure 6.109: Volumes of the samples with 7.5% trehalose by 3D-analysis in yz-direction andxz-direction.
(a) xz-view of the volume, 10% trehalose Toplyo (b) yz-view of the volume, 10% trehalose Toplyo
(c) xz-view of the volume, 10% trehalose 2stepA (d) yz-view of the volume, 10% trehalose 2stepA
Figure 6.110: Volumes of the samples with 10% trehalose by 3D-analysis in yz-direction andxz-direction.
by the 3D analysis as similar values for each condition are found with both methods. These
are smaller than those obtained with the standard cycle in a regular vial. The comparison of
Figures 6.107 - 6.110 also shows the reduction in cracking for all trehalose concentrations.
This is in particular pronounced for 7.5% and 10% trehalose in a Toplyo R© vial or by the
application of 2stepA in a regular vial and this confirms the strong reduction in cracking even
within the whole cake by these methods. The similar values of cracking for the 2D and the 3D
analysis for the lyophilizates obtained in Toplyo R© vials and by the 2stepA cycle (see Figure
6.111) indicate that the crack patterns of the cake surfaces are more similar to these within
the cake compared to samples obtained in regular vials with the standard cycle. This is also
seen in the images in Figure 6.107 - 6.110. The diameter of the cracks is similar within the

216 6 Results
0 10 20 30-2
0
2
4
6
8
10
12
14
16
18
20
3D: Micro-CT 3D: Micro-CT Toplyo 2D: Cracking Toplyo [%] 3D: Micro-CT 2stepA 2D: Cracking 2stepA [%]
Cra
ckin
g [%
]
Trehalose concentration [%]
(a)
Figure 6.111: Comparison of the cracking values [%] obtained by a 2D analysis (endpointevaluation, circle) with the 3D analysis of lyophilizates obtained in a Toplyo R©
vial with the standard cycle (black) , or in a regular vial with the standard cycle(white), as well as with the 2stepA cycle (gray). The coordinates for crackingare the mean average ± standard error of all values obtained by the endpointevaluation method (n=20).
cake from the surface to the base of the vial and only some hair-like cracks start in the middle
of the cake to its bottom. This indicates a more homogeneous stress distribution inside the
sample. Possible causes may be easier and more homogeneous detachment of the cake
from the inside wall of the vial in a Toplyo R© vial or the higher mechanical strength caused
by the homogeneous cake structure obtained by 2stepA. The usage of Toplyo R© vials or the
application of 2stepA is therefore the method of choice to optimize cake appearance.

7 Conclusions
In this thesis the influence of the formulation or the process on shrinkage and cracking was
studied. Methods were developed to quantify the amount of both at the end of the lyophiliza-
tion process (”endpoint evaluation method”) as well as in situ during drying (”kinetic method”).
The endpoint evaluation method was used to investigate an apparent correlation between
the content of non-frozen water in the maximum freeze-concentrated state, w′, of an amor-
phous cake and shrinkage, as has been suggested by Rambhatla et. al. [5]. Model disac-
charides were D-(+)-trehalose dihydrate, D-(+)- maltose and D-(+)-sucrose having different
amounts of w′. The results obtained confirm the assumption of a causal correlation between
shrinkage and w′. No influence on cracking was observed. A direct correlation between the
value of w′ and the amount of shrinkage which was also suggested by Rambhatla et. al. [5]
could not be shown.
The extents of shrinkage and cracking at different trehalose concentration were investi-
gated. A concentration dependency was found. With increasing trehalose concentration the
amount of cracking increases and the amount of shrinkage decreases. This concentration
dependency was found with all shelf-frozen lyophilizates, also with the kinetic method. Mea-
surements with a texture analyzer show decreasing brittleness and increasing hardness of
the lyophilizate with increase trehalose concentration. SEM-pictures and the results of mer-
cury porosimetry gave increasing cell sizes (pore sizes) with increasing trehalose concen-
tration. More cracking is developed at higher trehalose concentrations because the tensile
fracture toughness decreases with increasing cell sizes.
The surface tension and wetting results obtained based on Young’s equation indicate a
positive adsorption of trehalose to the surface of the glass, despite its negative Γ at the
water/air interface. An adhesive effect of the trehalose cake produced during primary drying
to the inner vial wall is therefore possible. If this adhesion is high, then shrinkage of the

218 7 Conclusions
lyophilizate mass to relax drying tensions in the cake will be hindered and lead to cracking.
The extents of shrinkage and cracking determine each other. Increasing shrinkage re-
leases drying tensions and as a result the amount of cracking is reduced. The tensile fracture
toughness is then not exceeded. This is shown with the endpoint evaluation method devel-
oped in this work. It was used with different disaccharides, varying trehalose concentration,
change in vial diameter and the use of Toplyo R© vials. Additionally the effects of slow cooling
rate, as well as by the usage of a two step freezing step in combination with annealing were
examined.
A kinetic method was also developed to illustrate quantitatively the development of shrink-
age and cracking during freeze-drying. The first occurrence of shrinkage was after 20% of
primary drying, at that time point when the primary drying shelf temperature was reached.
The highest extent of shrinkage and cracking was developed after the completion of sublima-
tion. The development of shrinkage and cracking was then pronounced during the first half
of secondary drying, where the rise in product temperature takes place. The extent of shrink-
age is predominantly determined by processes of secondary drying, as has been suggested
before by Pikal [9] and MacKenzie [8]. The current work gives the first quantitative evidence.
The results obtained by the kinetic method show that if shrinkage is possible, then this is
the dominant mechanism to relax drying tensions. Cracking then predominantly occurs in the
phase after the completion of local sublimation when local Tp rises during primary drying and
drying tensions are high. Inadequate relaxation of drying tensions by shrinkage is the cause,
resulting in exceeding of the tensile fracture toughness and fracture of the lyophilizate. If
complete detachment of the cake from the vial wall takes place, then relaxation of the drying
tensions by cracking does not occur. With a higher adhesion of the product to the inside
wall of the vial (for instance at 30% trehalose w/v), cracking is the dominant mechanism to
release drying tensions. After completion of local sublimation, when Tp rises during primary
drying, partial shrinkage is possible.
Detachment of the cake from the inside wall of the vial proceeds from initial loci that then
proceed. Initiated cracking may also be transferred to subjacent regions. The images showed
that during secondary drying only crack expansion takes place. The crack patterns indicate
that this expansion is caused by shrinkage of island cake regions.
Based on µ-CT (3D analysis) slightly lower values are found for cracking compared with

219
the endpoint evaluation method (2D analysis). These differences result from the usage of
background light that visually enlarged the cracks and blurred the crack edges by cracks lo-
cated in deeper product layers. The curvature of the cake is furthermore not considered at the
endpoint evaluation method, which also causes enlargement of the cracks. Both methods,
however, led to similar results and a 2D-analysis of cracking at the endpoint of lyophilization
seems therefore to be sufficient. It could be confirmed by the 3D analysis that the usage
of Toplyo R© vials of the inclusion of a two step freezing with additional annealing leads to a
strong reduction in cracking. These methods should therefore be used for an optimization of
cake appearance.
Further work should be done in particular regarding a quantification of drying tensions
within the cake. A resistance strain gauge would have to be wetted by the freeze-drying
formulation and the frozen or dried cake must adhere to it. The use of a special coated strain
gauge, which enables evaluation of drying tensions could be one approach. For correct
embedding it should be considered that the drying tensions mainly occur in the direction of
the diameter of the sample based on whether shrinkage occurs or the cake adheres to the
inside wall of the vial. Another idea could be to spray a fine grid with ice color on the top
surface of the cake at the end of freezing to measure the strain quantitatively in analogy with
the ”Optical Full-Field Strain Measurement” well known in the field of mechanics. With this
method a quantitative measurement of shrinkage with regard to the height of the sample
would also be possible.


8 Zusammenfassung
Im Rahmen dieser Arbeit wurde der Einfluss von verschiedenen Formulierungen und und
Prozesseigenschaften auf den Rissanteil einer amorphen Lyophilisatmatrix (”Cracking “) oder
deren Schrumpfen (”Shrinkage “) untersucht. Es wurden Quantifizierungsmethoden einer-
seits in situ wahrend der Trocknung (”Kinetik-Methode “), und andererseits im Endprodukt
(”Endprodukt-Methode “) entwickelt.
Die Endprodukt-Methode fand Verwendung fur die Untersuchung einer von Rambhatla
et. al. [5] postulierten Korrelation zwischen dem Anteil an unausfrierbarem Wasser eines
amorphen Lyophilisates, der am Glasubergang vorliegt (”unfrozen water “, w′), und dem
Ausmaß an Shrinkage. Als Modelldisaccharide wurden D-(+)-Maltose und D-(+)-Saccharose
neben D-(+)-Trehalose-Dihydrat verwendet, welche unterschiedliche Anteile an w′ enthalten.
Die Ergebnisse zeigen, dass mit zunehmendem Anteil an w′ auch das Ausmaß an Shrinkage
zunimmt. Bezuglich Cracking ist kein erkennbarer Einfluss beobachtbar. Eine Korrelation
zwischen den absoluten Werten des Schrumpfens und dem Anteil an w′, die Rambhatla et.
al. [5] zudem vorschlug, konnte nicht gezeigt werden.
Außerdem wurden der Rissanteil und der geschrumpfte Anteil in Lyophilisaten ver-
schiedener Trehalose-Konzentrationen untersucht. Eine Konzentrationsabhangigkeit kon-
nte nachgewießen werden, bei der mit zunehmender Trehalose-Konzentration ein großerer
Rissanteil und ein geringeres Schrumpfen der Lyophilisatmasse auftrat. Diese Konzentra-
tionsabhangigkeit zeigt sich bei allen Gefriertrocknungskuchen, die mittels Stellflachen im
Gefriertrockner eingefroren werden (auch unter der Verwendung der Kinetik-Methode). Mes-
sungen mit einem Texturprufgerat zeigten, dass die Sprodigkeit des Lyophilisates mit steigen-
der Konzentration abnimmt und die Harte zunimmt. Aufnahmen mit dem Rasterelektro-
nenmikroskop und Messungen mittels Quecksilber-Porosimetrie ergaben, dass mit steigen-
der Trehalose-Konzentration die Zellgroße (Porengroße) wachst. Bei Lyophilisaten hoherer

222 8 Zusammenfassung
Trehalose-Konzentrationen kommt es unter geringeren Trocknungsspannungen zu Rissen,
da die Zugzahigkeit eines Lyophilisates mit steigender Porengroße sinkt.
Des Weiteren wurde der Einfluss der Oberflachenchemie des Vials auf das Schrumpfen
der Kuchenmatrix und deren Rissanteil erforscht. Die Ergebnisse lassen anhand der
Young’schen Gleichung vermuten, dass Trehalose positiv an der Glasoberflache adsor-
biert wird, obwohl Trehalose einen negativen Oberflachenexzess an der Grenzflache
zwischen Wasser und Luft besitzt. Daraus lasst sich eine mogliche Adhasion des
Trehalose-Lyophilisates an der Vial-Innenwand wahrend der Trocknung annehmen. Ist diese
Adhasionkraft stark, wird das Schrumpfen der Lyophilisatmasse wahrend des Trocknens
beeintrachtigt und es kommt zu einer Rissbildung.
Das Ausmaß an Shrinkage und Cracking beeinflussen sich gegenseitig. Bei einem ver-
mehrten Auftreten von Shrinkage werden Spannungen abgebaut und es tritt weniger Crack-
ing auf. Die Zugzahigkeit des Lyophilisatzes wird dann nicht uberschritten. Dieser Zusam-
menhang wurde bei der Endprodukt-Methode gezeigt, die im Rahmen dieser Arbeit entwick-
elt wurde. Mit dieser Methode wurden verschiedene Disaccharide, Trehalose-Losungen ver-
schiedener Konzentrationen, Veranderungen des Vialdurchmessers und Toplyo R©-Vials un-
tersucht. Außerdem wurden der Einfluß einer geringere Kuhlrate wahrend des Einfrierens
und die Verwendung eines zweistufigen Einfrierschritts mit zusatzlichem Annealing ermittelt.
Es konnte eine Kinetik-Methode entwickelt werden, um die Entwicklung des Schrumpfens
der Kuchenmatrix und der Rissbildung wahrend der Gefriertrocknung quantitativ zu verfol-
gen. Ein Schrumpfen der Kuchenmatrix tritt zuerst nach 20% der Primartrocknungszeit auf,
an dem Zeitpunkt, an dem die Stellflache die Primartrocknungstemperatur erreicht hat. Der
großte Anteil an Shrinkage und Cracking wahrend der Primartrocknung entsteht nach Ab-
schluss der Sublimation. In der ersten Halfte der Sekundartrocknung, in der die Temper-
aturanhebung stattfindet, wird der großte Anteil an Kuchenveranderungen in dieser Phase
gebildet. Vorwiegend bestimmen Sekundartrocknungsvorgange das Ausmaß an Shrinkage.
Dies wurde bereits bei Pikal [9] und MacKenzie [8] vorgeschlagen. Die vorliegende Arbeit
gibt den ersten quantitativen Nachweise dafur.
Es konnte gezeigt werden, dass, wenn ein Schrumpfen der Lyophilisatmatrix moglich
ist, dies der dominante Mechanismus ist, um Spannungen innerhalb des Lyophilisates
abzubauen. Eine Rissbildung tritt dann vorwiegend auf, wenn lokal die Sublimation

223
abgeschlossen ist und dort die Produkttemperatur zunimmt. Ursache hierfur konnte sein,
dass eine Relaxation der Trocknungsspannungen durch ein Schrumpfen der Lyophilisatma-
trix in dieser Phase nicht ausreicht und die Zugzahigkeit des Kuchens uberschritten wird. Als
Folge kommt es zum Reißen der Produktmatrix. Hat zu diesem Zeitpunkt bereits eine kom-
plette Ablosung des Kuchens von der Vialinnenwand stattgefunden, dann ist eine Relaxation
der Trocknungsspannungen durch Rissbildung nicht moglich. Die Ergebnisse zeigen weit-
erhin, dass erst bei starkerer Adhasion des Kuchens an der Vialinnenwand (30% Trehalose
w/v) die Rissbildung der dominante Mechanismus ist, um Spannungen abzubauen. Eine
partielles Schrumpfen der Lyophilisatmasse ist ebenfalls dann moglich, wenn lokal die Subli-
mation abgeschlossen ist und die Produkttemperatur wahrend der Primartrocknung ansteigt.
Die Ablosung des Kuchens von der Vialinnenwand geht von Startpunkten aus und breitet
sich von diesen weiter nach rechts und links aus. Begonnenes Risswachstum wird ebenso
auf angrenzende Regionen ubertragen. Die Bildaufnahmen der Lyophilisate wahrend der
Trocknung zeigen, dass es wahrend der Sekundartrocknung nur zu einer Rissausweitung
kommt. Das Rissmuster lasst allerdings vermuten, dass dieser Vorgang an Stellen, an denen
Kuchenstucke kontaktlos vorliegen, einem Schrumpfen der Kuchenmatrix zuzuordnen ist.
Bei einer Micro-CT Analyse (3D-Analyse) der Lyophilisate wurden etwas niedrigere Werte
fur den Rissanteil gefunden als bei der 2D-Analyse (Endprodukt-Methode). Dieser Unter-
schied kommt von der Verwendung von Gegenlicht, welches die Risse optisch vergroßert
und Rissrander aufgrund von tiefer liegenden Rissen undeutlich macht. Bei der 2D-Analyse
wurde außerdem die Krummung der Oberflache des Kuchens nicht berucksichtigt, die eben-
falls zu einer Vergroßerung der Risse fuhrt. Dennoch liefern beide Methoden vergleichbare
Ergebnisse und eine 2D-Quantifizierung des Rissanteils scheint im Endprodukt ausreichend
zu sein. Mit Hilfe der 3D-Analyse kann bestatigt werden, dass die Verwendung von Toplyo R©-
Vials bzw. eines zweistufigen Einfrierschritts mit integriertem Annealing zu einer starken Re-
duktion des Rissanteils fuhrt. Zu Optimierung des Produktaußeren sind daher beide Metho-
den heranzuziehen.
Zukunftige Untersuchungen sollten eine Quantifizierung der Trocknungsspannungen
ermoglichen. Ein Dehnungsmesstreifen musste von der flussigen Formulierung ausre-
ichend benetzt werden, und der gefrorene Kuchen bzw. das Lyophilisat musste an diesem
haften. Ein moglicher Losungsansatz konnte die Verwendung von speziell beschichteten

224 8 Zusammenfassung
Dehnungsmessstreifen sein. Fur eine korrekte Einbettung des Dehnungsmessstreifens sollte
allerdings beachtet werden, dass die Trocknungsspannungen vorwiegend in y-Richtung der
Probe auftreten, basierend auf einem Schrumpfen oder einem Anhaften des Lyophilisates
an der Vialinnenwand. Ein andere Ansatz ware das Aufspuhen eines feinen Netzes auf die
Oberflache des Lyophilisates nach Abschluß des Einfriervorgangs mit Eisfarbe. Damit konnte
die Deformation des Kuchens quantitativ in Analogie zur Optischen Dehnungsmessung der
technischen Mechanik bestimmt werden. Eine quantitative Messung der Hohenanderung
des Lyophilisates ware so ebenfalls moglich.

9 Appendix
Conc. Row s1 s2 σ1 σ2 F Fc
7.5% 1+2 1.85 0.78 0.6084 3.4225 0.18 6.372+3 1.85 1.70 3.4225 2.9800 1.18 8.473+4 3.91 1.70 2.8900 15.288 0.19 13.744+5 3.91 1.36 15.2881 1.8496 8.27 13.745+6/7 2.08 1.36 1.8496 4.3264 0.43 8.106/7+8/9/10 2.08 1.50 4.3264 2.2500 1.92 8.02
10% 1+2 2.30 1.57 5.2900 2.4649 2.15 6.622+3 2.48 1.57 2.4649 6.1504 0.40 7.853+4 2.48 0.96 6.1504 0.9216 6.67 11.394+5 1.17 0.96 0.9216 1.3689 0.67 12.065+6/7 2.20 1.17 1.3689 4.8400 0.28 28.716/7+8/9/10 3.09 2.20 4.8400 9.5481 0.51 21.20
20% 1+2 1.07 0.97 1.1449 0.9409 1.22 4.632+3 1.14 0.97 1.2996 0.9409 1.38 5.473+4 1.59 1.14 2.5281 1.2996 1.95 6.634+5 1.59 1.24 2.5281 1.5376 1.64 10.975+6/7 1.24 0.65 1.5376 0.4225 3.64 8.756/7+8/9/10 0.77 0.65 0.5929 0.4225 1.40 9.15
30% 1+2 1.04 1.01 1.0816 1.0201 1.06 5.732+3 1.01 0.55 1.0201 0.3025 3.37 6.033+4 0.65 0.55 0.4225 0.3025 1.40 6.034+5 1.46 0.65 2.1316 0.4225 5.05 6.635+6/7 1.46 0.83 2.1316 0.6889 3.09 7.466/7+8/9/10 0.83 0.74 0.6889 0.5476 1.26 5.20
Table 9.1: Results of the F-test for the cracking values of 7.5% trehalose (w/v), 10% trehalose(w/v), 20% trehalose (w/v), 30% trehalose (w/v). Conc.= trehalose concentration(w/v). F-values that indicate rows with inhomogeneous variances are printed inbold text.
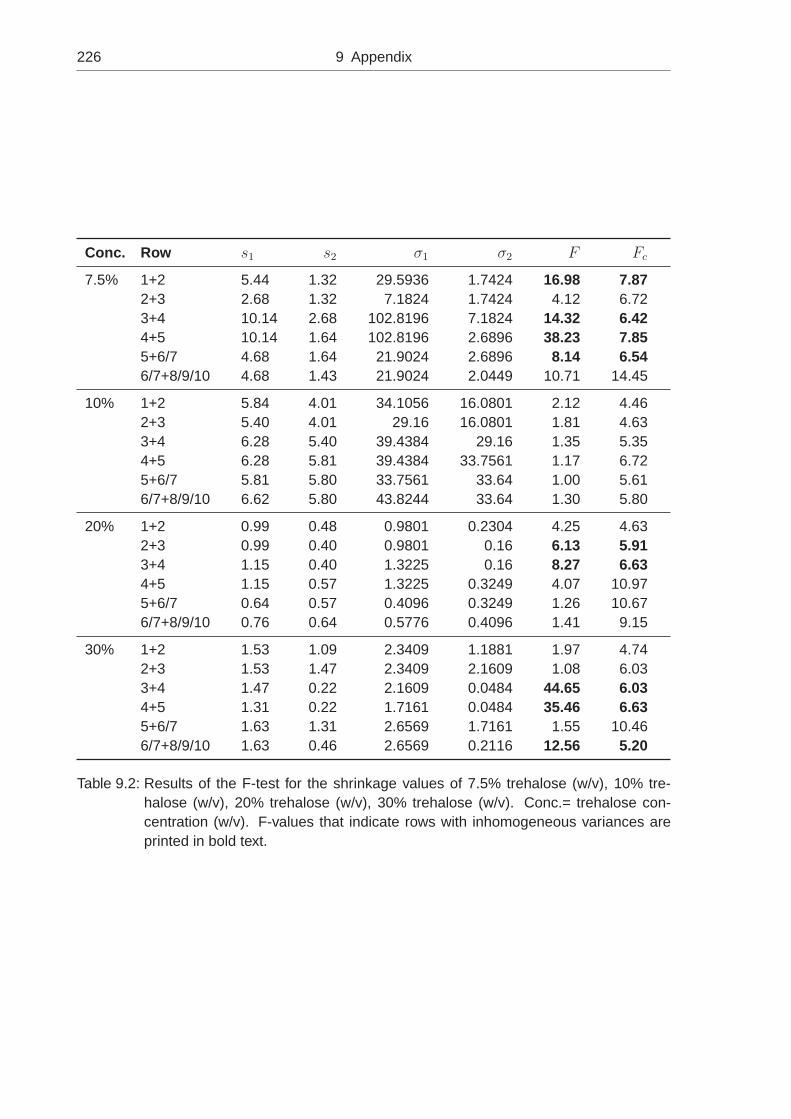
226 9 Appendix
Conc. Row s1 s2 σ1 σ2 F Fc
7.5% 1+2 5.44 1.32 29.5936 1.7424 16.98 7.872+3 2.68 1.32 7.1824 1.7424 4.12 6.723+4 10.14 2.68 102.8196 7.1824 14.32 6.424+5 10.14 1.64 102.8196 2.6896 38.23 7.855+6/7 4.68 1.64 21.9024 2.6896 8.14 6.546/7+8/9/10 4.68 1.43 21.9024 2.0449 10.71 14.45
10% 1+2 5.84 4.01 34.1056 16.0801 2.12 4.462+3 5.40 4.01 29.16 16.0801 1.81 4.633+4 6.28 5.40 39.4384 29.16 1.35 5.354+5 6.28 5.81 39.4384 33.7561 1.17 6.725+6/7 5.81 5.80 33.7561 33.64 1.00 5.616/7+8/9/10 6.62 5.80 43.8244 33.64 1.30 5.80
20% 1+2 0.99 0.48 0.9801 0.2304 4.25 4.632+3 0.99 0.40 0.9801 0.16 6.13 5.913+4 1.15 0.40 1.3225 0.16 8.27 6.634+5 1.15 0.57 1.3225 0.3249 4.07 10.975+6/7 0.64 0.57 0.4096 0.3249 1.26 10.676/7+8/9/10 0.76 0.64 0.5776 0.4096 1.41 9.15
30% 1+2 1.53 1.09 2.3409 1.1881 1.97 4.742+3 1.53 1.47 2.3409 2.1609 1.08 6.033+4 1.47 0.22 2.1609 0.0484 44.65 6.034+5 1.31 0.22 1.7161 0.0484 35.46 6.635+6/7 1.63 1.31 2.6569 1.7161 1.55 10.466/7+8/9/10 1.63 0.46 2.6569 0.2116 12.56 5.20
Table 9.2: Results of the F-test for the shrinkage values of 7.5% trehalose (w/v), 10% tre-halose (w/v), 20% trehalose (w/v), 30% trehalose (w/v). Conc.= trehalose con-centration (w/v). F-values that indicate rows with inhomogeneous variances areprinted in bold text.

227
Conc. Row s1 s2 sm−m µ1 µ2 t df tc
7.5% 1+2 0.78 1.85 0.7460 1.49 3.22 4.60 14 2.982+3 1.85 1.70 0.9496 3.22 3.31 0.18 12 3.053+4 1.70 3.91 2.8385 3.31 4.74 0.63 7 3.504+5 3.91 1.36 2.8122 4.74 2.23 1.11 7 3.505+6/7 1.36 2.08 0.8631 2.23 2.95 1.66 14 2.986/7+8/9/10 2.08 0.77 0.8236 2.95 2.72 0.42 10 3.17
10% 1+2 2.30 1.57 0.8883 6.10 5.01 2.64 17 2.902+3 1.57 2.48 1.2402 5.01 7.05 2.89 11 3.113+4 2.48 0.96 1.1763 7.05 7.05 0.00 9 3.254+5 0.96 1.17 0.7042 7.05 5.51 3.39 8 3.365+6/7 1.17 2.20 1.1447 5.51 6.20 0.90 7 3.506/7+8/9/10 2.20 3.09 2.3962 6.20 7.87 0.83 5 4.03
20% 1+2 0.97 1.07 0.4392 11.47 12.32 4.52 20 2.852+3 1.07 1.14 0.5088 12.32 11.34 4.19 17 2.903+4 1.14 1.59 0.7522 11.34 11.76 1.06 13 3.014+5 1.59 1.24 0.8232 11.76 11.43 0.69 10 3.505+6/7 1.24 0.65 0.5627 11.43 11.87 1.41 11 3.116/7+8/9/10 0.65 0.77 0.4230 11.87 11.02 3.43 10 3.50
30% 1+2 1.04 1.01 0.4511 12.79 12.02 3.87 19 2.862+3 1.01 0.55 0.3833 12.02 12.07 0.28 16 2.923+4 0.55 0.65 0.2838 12.07 11.40 5.01 16 2.924+5 0.65 1.46 0.6342 11.40 12.40 2.99 13 3.015+6/7 1.46 0.83 0.6644 12.40 12.48 0.22 12 3.056/7+8/9/10 0.83 0.74 0.3686 12.48 12.11 2.16 17 2.90
Table 9.3: Results of the t-test for the cracking values of 7.5% trehalose (w/v), 10% trehalose(w/v), 20% trehalose (w/v), 30% trehalose (w/v) with homogeneous variances.Conc.= trehalose concentration (w/v). Rows with differences in the mean valuesare printed in bold text.

228 9 Appendix
Conc. Row s1 s2 sm−m µ1 µ2 t df tc
7.5% 2+3 1.32 2.68 0.9834 11.26 12.35 2.25 15 2.956/7+8/9/10 4.68 1.43 1.4947 12.98 11.51 1.85 15 2.95
10% 1+2 5.84 4.01 2.0450 16.48 18.24 2.11 22 2.822+3 4.01 5.40 2.0630 18.24 17.36 1.00 20 2.853+4 5.40 6.28 2.6191 17.36 15.65 1.46 18 2.884+5 6.28 5.81 2.8571 15.65 17.49 1.36 16 2.925+6/7 5.81 5.80 2.7538 17.49 15.81 1.29 16 2.926/7+8/9/10 5.80 6.62 3.1024 15.81 18.84 1.98 15 2.95
20% 1+2 0.48 0.99 0.3424 7.29 7.91 4.23 20 2.854+5 1.15 0.57 0.5240 7.27 7.14 0.43 10 3.175+6/7 0.57 0.64 0.3357 7.14 6.78 1.93 11 3.116/7+8/9/10 0.64 0.76 0.4172 6.78 7.04 1.06 10 3.17
30% 1+2 1.09 1.53 0.5992 7.51 8.34 3.14 19 2.862+3 1.53 1.47 0.7072 8.34 7.63 2.13 16 2.925+6/7 1.31 1.63 0.7862 7.62 8.07 1.06 12 3.05
Table 9.4: Results of the t-test for the shrinkage values of 7.5% trehalose (w/v), 10% tre-halose (w/v), 20% trehalose (w/v), 30% trehalose (w/v) with homogeneous vari-ances. Conc.= trehalose concentration (w/v). Rows with differences in the meanvalues are printed in bold text.
Conc. Row s1 s2 sm−m c µ1 µ2 t df tc
7.5% 1+2 5,44 1,32 1,7144 0,92 14,82 11,26 2,08 12 3,653+4 2,68 10,14 4,6133 0,03 12,35 18,60 1,35 4 4,604+5 10,14 1,64 4,5717 0,98 18,60 12,86 1,26 4 4,605+6/7 1,64 4,68 1,4701 0,16 12,86 12,98 0,08 15 2,95
20% 2+3 0,99 0,40 0,3403 0,85 7,91 7,09 2,41 12 3,053+4 0,40 1,15 0,4881 0,07 7,09 7,27 0,37 6 3,71
30% 3+4 1,47 0,22 0,4955 0,98 7,63 6,87 1,54 8 3,364+5 0,22 1,31 0,5398 0,02 6,87 7,62 1,39 5 4,036/7+8/9/10 1,31 0,46 0,5525 0,94 7,62 7,01 1,10 6 3,71
Table 9.5: Results of the t-test for the shrinkage values of 7.5% trehalose (w/v), 10% tre-halose (w/v), 20% trehalose (w/v), 30% trehalose (w/v) with inhomogeneous vari-ances. Conc.= trehalose concentration (w/v). Rows with differences in the meanvalues are printed in bold text.

229
Conc. Row Shrinkage Cracking
7.5% 1+2 homogeneous inhomogeneous2+3 homogeneous homogeneous3+4 homogeneous homogeneous4+5 homogeneous homogeneous5+6/7 homogeneous homogeneous6/7+8/9/10 homogeneous homogeneous
10% 1+2 homogeneous homogeneous2+3 homogeneous homogeneous3+4 homogeneous homogeneous4+5 homogeneous inhomogeneous5+6/7 homogeneous homogeneous6/7+8/9/10 homogeneous homogeneous
20% 1+2 inhomogeneous inhomogeneous2+3 homogeneous inhomogeneous3+4 homogeneous homogeneous4+5 homogeneous homogeneous5+6/7 homogeneous homogeneous6/7+8/9/10 homogeneous homogeneous
30% 1+2 inhomogeneous inhomogeneous2+3 homogeneous homogeneous3+4 homogeneous inhomogeneous4+5 homogeneous homogeneous5+6/7 homogeneous homogeneous6/7+8/9/10 homogeneous homogeneous
Table 9.6: Overview of the uniformity of shrinkage and cracking with regard to the position ofthe vials.

230 9 Appendix
Values obtained for
2R 2.5 mm, regular vial 5%: n=4, 7.5%: n=32, 10%: n=3315%: n=19, 20%: n=30, 30%: n=26
10R 2.5 mm, regular vial 5%: n=4, 7.5%: n=12, 10%: n=1415%: n=7, 20%: n=14, 30%: n=12
2R 5 mm, regular vial 5%: n=11, 7.5%: n=24, 10%: n=3015%: n=25, 20%: n=25, 30%: n=21
10R 5 mm, regular vial 5%: n=4, 7.5%: n=12, 10%: n=1415%: n=6, 20%: n=14, 30%: n=11
2R 2.5 mm, Toplyo vial 5%: n=5, 7.5%: n=30, 10%: n=2015%: n=5, 20%: n=21, 30%: n=22
10R 2.5 mm, Toplyo vial 5%: n=2, 7.5%: n=13, 10%: n=1315%: n=2, 20%: n=14, 30%: n=10
2R 5 mm, Toplyo vial 5%: n=5, 7.5%: n=13, 10%: n=1415%: n=5, 20%: n=10, 30%: n=11
10R 5 mm, Toplyo vial 5%: n=2, 7.5%: n=27, 10%: n=2315%: n=2, 20%: n=21, 30%: n=20
2R 2.5 mm slow FR 5%: n=8, 7.5%: n=8, 10%: n=915%: n=10, 20%: n=9, 30%: n=10
10R 2.5 mm slow FR 5%: n=4, 7.5%: n=4, 10%: n=415%: n=4, 20%: n=2, 30%: n=2
2R 5 mm slow FR 5%: n=10, 7.5%: n=10, 10%: n=1015%: n=8, 20%: n=8, 30%: n=8
10R 5 mm slow FR 5%: n=5, 7.5%: n=4, 10%: n=415%: n=4, 20%: n=3, 30%: n=4
2R 2.5 mm shock freezing FR 5%: n=6, 7.5%: n=8, 10%: n=815%: n=8, 20%: n=9, 30%: n=8
10R 2.5 mm shock freezing FR 5%: n=5, 7.5%: n=5, 10%: n=515%: n=5, 20%: n=5, 30%: n=5
2R 5 mm shock freezing FR 5%: n=5, 7.5%: n=9, 10%: n=715%: n=10, 20%: n=10, 30%: n=9
10R 5 mm shock freezing FR 5%: n=4, 7.5%: n=4, 10%: n=415%: n=5, 20%: n=5, 30%: n=5
2R 2.5 mm 2stepA 5%: n=9, 7.5%: n=12, 10%: n=915%: n=10, 20%: n=10, 30%: n=10
10R 2.5 mm 2stepA 5%: n=9, 7.5%: n=10, 10%: n=1015%: n=10, 20%: n=10, 30%: n=10
2R 5 mm 2stepA 5%: n=15, 7.5%: n=15, 10%: n=1515%: n=12, 20%: n=14, 30%: n=9
10R 5 mm 2stepA 5%: n=, 7.5%: n=, 10%: n=1015%: n=10, 20%: n=10, 30%: n=10
2R 2.5 mm Toplyo 2stepA 5%: n=8, 7.5%: n=9, 10%: n=815%: n=8, 20%: n=8, 30%: n=8
10R 2.5 mm Toplyo 2stepA 5%: n=4, 7.5%: n=4, 10%: n=415%: n=4, 20%: n=4, 30%: n=3
2R 5 mm Toplyo 2stepA 5%: n=10, 7.5%: n=10, 10%: n=915%: n=10, 20%: n=9, 30%: n=9
10R 5 mm Toplyo 2stepA 5%: n=4, 7.5%: n=4, 10%: n=415%: n=4, 20%: n=4, 30%: n=3

References
[1] J. F. Carpenter, M. J. Pikal, B. S. Chang, and T. W. Randolph, “Rational design of stable
lyophilized protein formulations: Some practical advice,” Pharmaceutical Research,
vol. 14, no. 8, pp. 969–975, 1997.
[2] M. Mujat, K. Greco, K. L. Galbally-Kinney, D. X. Hammer, R. D. Ferguson, N. Iftimia,
P. Mulhall, P. Sharma, M. J. Pikal, and W. J. Kessler, “Optical coherence tomography-
based freeze-drying microscopy,” vol. 3, pp. 55–63, 2012.
[3] P. M. Costantino HR, Lyophilization of biopharmaceuticals. Arlington: American Asso-
ciation of Pharmaceutical Scientists, 2004.
[4] W. Wang, “Lyophilization and development of solid protein pharmaceuticals,” Interna-
tional Journal of Pharmaceutics, vol. 203, no. 1-2, pp. 1–60, 2000. Times Cited: 256.
[5] S. Rambhatla, J. P. Obert, S. Luthra, C. Bhugra, and M. J. Pikal, “Cake shrinkage
during freeze drying: A combined experimental and theoretical study,” Pharmaceutical
Development and Technology, vol. 10, no. 1, pp. 33–40, 2005. ISI Document Delivery
No.: 902VB Times Cited: 4 Cited Reference Count: 13.
[6] P. T. W. Overcashier, D. E. and C. C. Hsu, “Lyophilization of protein formulations in
vials: Investigation of the relationship between resistance to vapor flow during primary
drying and small-scale product collapse,” Journal of Pharmaceutical Sciences, vol. 88,
no. 7, pp. 688–695, 1999.
[7] M. J. Pikal, S. Shah, D. Senior, and J. E. Lang, “Physical chemistry of freeze-drying:
Measurement of sublimation rates for frozen aqueous solutions by a microbalance
technique,” Journal of Pharmaceutical Sciences, vol. 72, no. 6, pp. 635–650, 1983.
1520-6017.

232 References
[8] A. P. MacKenzie, “Factors affecting the mechanism of transformation of ice into water
vapor in the freeze-drying process,” Annals of the New York Academy of Sciences,
vol. 125, no. 2, pp. 522–547, 1965. 1749-6632.
[9] M. J. Pikal and S. Shah, “Intravial distribution of moisture during the secondary drying
stage of freeze drying,” PDA J Pharm Sci Technol, vol. 51, no. 1, pp. 17–24, 1997.
[10] D. Q. Wang, J. M. Hey, and S. L. Nail, “Effect of collapse on the stability of freeze-dried
recombinant factor viii and α-amylase,” Journal of Pharmaceutical Sciences, vol. 93,
no. 5, pp. 1253–1263, 2004.
[11] T. W. G. Rowe, “The theory and practice of freeze-drying,” Annals of the New York
Academy of Sciences, vol. 85, no. 2, pp. 641–681, 1960. 1749-6632.
[12] E. Meister and H. Gieseler, “Freeze-dry microscopy of protein/sugar mixtures: Drying
behavior, interpretation of collapse temperatures and a comparison to corresponding
glass transition data,” Journal of Pharmaceutical Sciences, vol. 98, no. 9, pp. 3072–
3087, 2009.
[13] FDA, “Guide to Inspections of Lyophilization of Parenterals (7/93). Finished product
inspection. Last update 2009,” 2009.
[14] R. E. Johnson, C. F. Kirchhoff, and H. T. Gaud, “Mannitol-sucrose mixtures-versatile
formulations for protein lyophilization,” Journal of Pharmaceutical Sciences, vol. 91,
no. 4, pp. 914–922, 2002.
[15] S. D. Webb, J. L. Cleland, J. F. Carpenter, and T. W. Randolph, “Effects of anneal-
ing lyophilized and spray-lyophilized formulations of recombinant human interferon-γ,”
Journal of Pharmaceutical Sciences, vol. 92, no. 4, pp. 715–729, 2003.
[16] A. MacKenzie, Collpase during freeze-drying, qualitative and quantitative aspects.
London: Academic Press, 1975.
[17] M. J. Pikal, Mechanisms of Protein Stabilization During Freeze-Drying and Storage:
The Relative Importance of Thermodynamic Stabilization and Glassy State Relaxion
Dynamics. New York, Basel: Marcel Dekker, 2004.

References 233
[18] P. Cameron, Good Pharmaceutical Freeze-Drying Practice. Buffalo Grove: Interpharm
Ptrdd, Inc, 1997.
[19] T. Jennings, Lyophilization: Introduction and Basic Principles. Interpharm/CRC, 1999.
[20] Bauer, Fromming, Fuhrer, Lehrbuch der Pharmazeutischen Technologie. Stuttgart:
Wissenschaftliche Verlagsgesellschaft mbH, 8. auflage ed., 2006.
[21] H. P. Oetjen GW, Freeze-Drying. Weinheim: Wiley-VCH, second, completely revised
and extended edition ed., 2004.
[22] M. J. Pikal, Freeze Drying, pp. 1299–1326. New York: Marcel Dekker, 2002.
[23] J. A. Searles, J. F. Carpenter, and T. W. Randolph, “The ice nucleation temperature de-
termines the primary drying rate of lyophilization for samples frozen on a temperature-
controlled shelf,” Journal of Pharmaceutical Sciences, vol. 90, no. 7, pp. 860–871,
2001.
[24] J. C. Kasper and W. Friess, “The freezing step in lyophilization: Physico-chemical fun-
damentals, freezing methods and consequences on process performance and quality
attributes of biopharmaceuticals,” European Journal of Pharmaceutics and Biophar-
maceutics, vol. 78, no. 2, pp. 248–263, 2011.
[25] J. Liu, T. Viverette, M. Virgin, M. Anderson, and P. Dalal, “A study of the impact of
freezing on the lyophilization of a concentrated formulation with a high fill depth,” Phar-
maceutical Development and Technology, vol. 10, no. 2, pp. 261–272, 2005.
[26] S. Nail and L. Gatlin, Freeze Drying: Principles and practice, vol. Volume 2, ch. 166-
333. New York: Marcel Dekker, 1993.
[27] A. Hottot, S. Vessot, and J. Andrieu, “Freeze drying of pharmaceuticals in vials: Influ-
ence of freezing protocol and sample configuration on ice morphology and freeze-dried
cake texture,” Chemical Engineering and Processing, vol. 46, no. 7, pp. 666–674, 2007.
ISI Document Delivery No.: 162AS Times Cited: 11 Cited Reference Count: 18 Hottot,
Aurelie Vessot, Severine Andrieu, Julien Elsevier science sa Lausanne.
234 References
[28] X. Tang, S. L. Nail, and M. J. Pikal, “Freeze-drying process design by manometric tem-
perature measurement: Design of a smart freeze-dryer,” Pharmaceutical Research,
vol. 22, no. 4, pp. 685–700, 2005.
[29] M. Pikal, Heat and Mass Transfer in Low Pressure Gases: Applications to Freeze-
Drying. New York: Marcel Dekker Inc., 2000.
[30] G. Levi and M. Karel, “Volumetric shrinkage (collapse) in freeze-dried carbohydrates
above their glass-transition temperature,” Food Research International, vol. 28, no. 2,
pp. 145–151, 1995. ISI Document Delivery No.: QX125 Times Cited: 53 Cited Refer-
ence Count: 22.
[31] X. Tang and M. Pikal, “Design of freeze-drying processes for pharmaceuticals: Prac-
tical advice,” Pharmaceutical Research, vol. 21, no. 2, pp. 191–200, 2004. (Charlie)
0724-8741.
[32] M. J. Pikal, S. Shah, M. L. Roy, and R. Putman, “The secondary drying stage of freeze
drying: drying kinetics as a function of temperature and chamber pressure,” Interna-
tional Journal of Pharmaceutics, vol. 60, no. 3, pp. 203–207, 1990.
[33] T. Chen, A. Fowler, and M. Toner, “Literature review: Supplemented phase diagram of
the trehalose-water binary mixture,” Cryobiology, vol. 40, no. 3, pp. 277–282, 2000.
[34] M. Hageman, “The role of moisture in protein stability,” Drug Development and Indus-
trial Pharmacy, vol. 14, no. 14, pp. 2047–2070, 1988.
[35] M. Pikal, “Use of laboratory data in freeze drying process design: heat and mass
transfer coefficients and the computer simulation of freeze drying,” PDA Journal of
Pharmaceutical Science and Technology, vol. 39, no. 3, pp. 115–139, 1985.
[36] M. J. Pikal, M. L. Roy, and S. Shah, “Mass and heat transfer in vial freeze-drying of
pharmaceuticals: Role of the vial,” Journal of Pharmaceutical Sciences, vol. 73, no. 9,
pp. 1224–1237, 1984.
[37] S. Rambhatla, R. Ramot, C. Bhugra, and M. J. Pikal, “Heat and mass transfer scale-up
issues during freeze drying: Ii. control and characterization of the degree of supercool-
ing,” Aaps Pharmscitech, vol. 5, no. 4, pp. 54–62, 2004.

References 235
[38] R. S. Pikal MJ, Heat and Mass Transfer Issues in Freeze-drying Process Development.
Arlington: American Association of Pharmaceutical Scientists, 2004.
[39] P. MJ, Freeze-Drying of Proteins, vol. 567 of ACS Symposium Series, ch. 8, pp. 120–
133. American Chemical Society, 1994. doi:10.1021/bk-1994-0567.ch008.
[40] S. Hibler, C. Wagner, and H. Gieseler, “Vial freeze-drying, part 1: New insights into
heat transfer characteristics of tubing and molded vials,” Journal of Pharmaceutical
Sciences, vol. 101, no. 3, pp. 1189–1201, 2012.
[41] W. Y. Kuu, L. M. Hardwick, and M. J. Akers, “Correlation of laboratory and production
freeze drying cycles,” International Journal of Pharmaceutics, vol. 302, no. 1-2, pp. 56–
67, 2005.
[42] W. Y. Kuu, S. L. Nail, and G. Sacha, “Rapid determination of vial heat transfer
parameters using tunable diode laser absorption spectroscopy (tdlas) in response
to step-changes in pressure set-point during freeze-drying,” J Pharm Sci, vol. 98,
no. 3, pp. 1136–54, 2009. Kuu, Wei Y Nail, Steven L Sacha, Gregory Comparative
Study Validation Studies United States J Pharm Sci. 2009 Mar;98(3):1136-54. doi:
10.1002/jps.21478.
[43] Brulls, M. and Rasmuson, A., “Heat transfer in vial lyophilization,” International Journal
of Pharmaceutics, vol. 246, no. 1-2, pp. 1–16, 2002.
[44] O. R. Essig D., Lyophilization. Mainz: APV, 2000.
[45] “Emissivity Table [online]; Available from: http://www.thermoworks.com/
emissivity_table.html; Accessed on September 12, 2013.”
[46] S. Rambhatla and M. Pikal, “Heat and mass transfer scale-up issues during freeze-
drying, i: Atypical radiation and the edge vial effect,” AAPS PharmSciTech, vol. 4,
no. 2, pp. 22–31, 2003.
[47] H. Gieseler and G. Lee, “Effects of vial packing density on drying rate during freeze-
drying of carbohydrates or a model protein measured using a vial-weighing technique,”
Pharmaceutical Research, vol. 25, no. 2, pp. 302–312, 2008.

236 References
[48] S. M. Patel and M. Pikal, “Process analytical technologies (pat) in freeze-drying of
parenteral products,” Pharm Dev Technol, vol. 14, no. 6, pp. 567–87, 2009. Patel,
Sajal Manubhai Pikal, Michael Review England Pharm Dev Technol. 2009;14(6):567-
87. doi: 10.3109/10837450903295116.
[49] “Thermoelement Typ T Referenztabelle [online]; Available from: http://www.omega.
de/pdf/tc/z207iec.pdf.; Accessed on September 23, 2013.”
[50] E. Trappler, Lyophilization Equipment, pp. 3–41. Arlington: American Association of
Pharmaceutical Scientists, 2004.
[51] A. C. E. o. T. Measurement, Manual on the Use of Thermocouples in Temperature
Measurement. ASTM, fourth edition ed., 1993.
[52] “Messen mit Thermoelementen [online]; Available from: http://www.omega.com; Ac-
cessed on September 25, 2013.”
[53] S. Patel, T. Doen, and M. Pikal, “Determination of end point of primary drying in freeze-
drying process control,” AAPS PharmSciTech, vol. 11, no. 1, pp. 73–84, 2010.
[54] J. C. Kasper, M. Wiggenhorn, M. Resch, and W. Friess, “Implementation and evalua-
tion of an optical fiber system as novel process monitoring tool during lyophilization,”
European Journal of Pharmaceutics and Biopharmaceutics, vol. 83, no. 3, pp. 449–
459, 2013.
[55] S. Schneid and H. Gieseler, “Evaluation of a new wireless temperature remote interro-
gation system (tempris) to measure product temperature during freeze drying,” AAPS
PharmSciTech, vol. 9, no. 3, pp. 729–739, 2008.
[56] C. Roth, G. Winter, and G. Lee, “Continuous measurement of drying rate of crystalline
and amorphous systems during freeze-drying using an in situ microbalance technique,”
Journal of Pharmaceutical Sciences, vol. 90, no. 9, pp. 1345–1355, 2001.
[57] H. Gieseler and G. Lee, “Effect of freeze-dryer design on drying rate of an amorphous
protein-formulation determined with a gravimetric technique,” Pharmaceutical Devel-
opment and Technology, vol. 13, no. 6, pp. 463–472, 2008.

References 237
[58] H. Gieseler and G. Lee, “Gravimetric measurement of momentary drying rate of spray
freeze-dried powders in vials,” Journal of Pharmaceutical Sciences, vol. 98, no. 9,
pp. 3447–3455, 2009.
[59] “Christ micro balance for online determination of residual moisture inside the product
[online]; Available from: http://www.martinchrist.de/index.php?id=117&L=1;
Accessed on October 3, 2013.”
[60] I. Presser, Innovative Online Messverfahren zur Optimierung von Gefriertrock-
nungsprozessen. Ph.d. thesis, 2003.
[61] “High Pressure & Vacuum [online]; Available from: http://www.omega.com/
literature/transactions/volume3/high3.html; Accessed on October 3, 2013.”
[62] “Special measuring devices for low pressure [online]; Avail-
able from: http://www.bestinnovativesource.com/2013/01/07/
special-measuring-devices-for-low-pressure/; Accessed on October 3,
2013.”
[63] M. L. Roy and M. J. Pikal, “Process control in freeze drying: determination of the end
point of sublimation drying by an electronic moisture sensor,” PDA Journal of Pharma-
ceutical Science and Technology, vol. 43, no. 2, pp. 60–66, 1989.
[64] N. Milton, M. J. Pikal, M. L. Roy, and S. L. Nail, “Evaluation of manometric temperature
measurement as a method of monitoring product temperature during lyophilization,”
PDA J Pharm Sci Technol, vol. 51, no. 1, pp. 7–16, 1997. Milton, N Pikal, M J Roy,
M L Nail, S L Research Support, Non-U.S. Gov’t UNITED STATES PDA J Pharm Sci
Technol. 1997 Jan-Feb;51(1):7-16.
[65] X. Tang, S. Nail, and M. Pikal, “Evaluation of manometric temperature measurement, a
process analytical technology tool for freeze-drying: Part i, product temperature mea-
surement,” AAPS PharmSciTech, vol. 7, no. 1, pp. E95–E103, 2006.
[66] X. Tang, S. Nail, and M. Pikal, “Evaluation of manometric temperature measurement
(mtm), a process analytical technology tool in freeze drying, part iii: Heat and mass
transfer measurement,” AAPS PharmSciTech, vol. 7, no. 4, pp. E105–E111, 2006.

238 References
[67] A. A. Barresi, R. Pisano, D. Fissore, V. Rasetto, S. A. Velardi, A. Vallan, M. Parvis,
and M. Galan, “Monitoring of the primary drying of a lyophilization process in vials,”
Chemical Engineering and Processing: Process Intensification, vol. 48, no. 1, pp. 408
– 423, 2009.
[68] L. Yu, “Amorphous pharmaceutical solids: preparation, characterization and stabiliza-
tion,” Advanced Drug Delivery Reviews, vol. 48, no. 1, pp. 27–42, 2001.
[69] B. C. Hancock and G. Zografi, “Characteristics and significance of the amorphous
state in pharmaceutical systems,” Journal of Pharmaceutical Sciences, vol. 86, no. 1,
pp. 1–12, 1997.
[70] B. Hancock, S. Shamblin, and G. Zografi, “Molecular mobility of amorphous pharma-
ceutical solids below their glass transition temperatures,” Pharmaceutical Research,
vol. 12, no. 6, pp. 799–806, 1995.
[71] D. Q. M. Craig, P. G. Royall, V. L. Kett, and M. L. Hopton, “The relevance of the amor-
phous state to pharmaceutical dosage forms: glassy drugs and freeze dried systems,”
International Journal of Pharmaceutics, vol. 179, no. 2, pp. 179–207, 1999.
[72] T. Fox and P. Flory, “Second order transition temperatures and related properties of
polystyrene. i. influence of molecular weight,” Journal of Applied Physics, vol. 21, no. 6,
pp. 581–591, 1950.
[73] T. Fox and P. Flory, “The glass temperature and related properties of polystyrene. in-
fluence of molecular weight,” Journal of Polymer Science, vol. 14, no. 75, pp. 315–319,
1954.
[74] D. Turnbull and M. H. Cohen, “Free volume model of the amorphous phase: glass
transition,” The Journal of Chemical Physics, vol. 34, p. 120, 1961.
[75] S. Singh, P. Kolhe, A. Mehta, S. Chico, A. Lary, and M. Huang, “Frozen state storage in-
stability of a monoclonal antibody: Aggregation as a consequence of trehalose crystal-
lization and protein unfolding,” Pharmaceutical Research, vol. 28, no. 4, pp. 873–885,
2011.

References 239
[76] C. A. Angell, “Formation of glasses from liquids and biopolymers,” Science, vol. 267,
no. 5206, pp. 1924–1935, 1995.
[77] C. Roland, S. Capaccioli, M. Lucchesi, and R. Casalini, “Adam-gibbs model for the
supercooled dynamics in the ortho-terphenyl ortho-phenylphenol mixture,” The Journal
of chemical physics, vol. 120, p. 10640, 2004.
[78] D. Lechuga-Ballesteros, D. P. Miller, and S. P. Duddu, “Thermal analysis of lyophilized
pharmaceutical peptide and protein formulations,” Lyophilization of biopharmaceuti-
cals. Arlington: AAPS, pp. 271–335, 2004.
[79] R. H. Hatley, “Glass fragility and the stability of pharmaceutical preparations-excipient
selection,” Pharmaceutical Development and Technology, vol. 2, no. 3, pp. 257–264,
1997.
[80] M. Gordon and J. Taylor, “Ideal copolymers and the second-order transitions of syn-
thetic rubbers. i. non-crystalline copolymers,” Journal of Applied Chemistry, vol. 2,
no. 9, pp. 493–500, 1952.
[81] B. Hancock and G. Zografi, “The relationship between the glass transition tempera-
ture and the water content of amorphous pharmaceutical solids,” Pharmaceutical Re-
search, vol. 11, no. 4, pp. 471–477, 1994.
[82] Y. Roos and M. Karel, “Amorphous state and delayed ice formation in sucrose solu-
tions,” International Journal of Food Science & Technology, vol. 26, no. 6, pp. 553–566,
1991.
[83] L. Slade and H. Levine, “Beyond water activity: recent advances based on an alter-
native approach to the assessment of food quality and safety,” Critical reviews in food
science and nutrition, vol. 30, no. 2-3, pp. 115–360, 1991. Review.
[84] E. J. Shalaev, D. Malakhov, A. Kanev, V. Kosyakov, F. Tuzikov, N. Varaksin, and V. Vav-
ilin, “Study of the phase diagram water fraction of the system water-glycine-sucrose by
dta and x-ray diffraction methods,” Thermochimica acta, vol. 196, no. 1, pp. 213–220,
1992.

240 References
[85] V. P. Heljo, A. Nordberg, M. Tenho, T. Virtanen, K. Jouppila, J. Salonen, S. L. Maunu,
and A. M. Juppo, “The effect of water plasticization on the molecular mobility and crys-
tallization tendency of amorphous disaccharides,” Pharmaceutical research, vol. 29,
no. 10, pp. 2684–2697, 2012.
[86] G. P. Johari, A. Hallbrucker, and E. Mayer, “The glass-liquid transition of hyper-
quenched water,” Nature, vol. 330, no. 6148, pp. 552–553, 1987. 10.1038/330552a0.
[87] T. Arakawa, S. J. Prestrelski, W. C. Kenney, and J. F. Carpenter, “Factors affecting
short-term and long-term stabilities of proteins,” Adv Drug Deliv Rev, vol. 46, no. 1-3,
pp. 307–26, 2001. Arakawa, T Prestrelski, S J Kenney, W C Carpenter, J F Review
Netherlands Adv Drug Deliv Rev. 2001 Mar 1;46(1-3):307-26.
[88] R. Tanaka, T. Takeda, and R. Miyajima, “Cryoprotective effect of saccharides on de-
naturation of catalase by freeze-drying,” Chemical & pharmaceutical bulletin, vol. 39,
no. 5, pp. 1091–1094, 1991.
[89] J. F. Carpenter, J. H. Crowe, and T. Arakawa, “Comparison of solute-induced protein
stabilization in aqueous solution and in the frozen and dried states,” Journal of Dairy
Science, vol. 73, no. 12, pp. 3627–3636, 1990.
[90] S. D. Allison, T. W. Randolph, M. C. Manning, K. Middleton, A. Davis, and J. F. Car-
penter, “Effects of drying methods and additives on structure and function of actin:
mechanisms of dehydration-induced damage and its inhibition,” Archives of biochem-
istry and biophysics, vol. 358, no. 1, pp. 171–181, 1998.
[91] S. J. Hagen, J. Hofrichter, and W. A. Eaton, “Geminate rebinding and conformational
dynamics of myoglobin embedded in a glass at room temperature,” The Journal of
Physical Chemistry, vol. 100, no. 29, pp. 12008–12021, 1996.
[92] F. Franks, “Freeze-drying of bioproducts: putting principles into practice,” European
Journal of Pharmaceutics and Biopharmaceutics, vol. 45, no. 3, pp. 221–229, 1998.
[93] X. Lu and M. J. Pikal, “Freeze-drying of mannitol-trehalose-sodium chloride-based for-
mulations: The impact of annealing on dry layer resistance to mass transfer and cake
structure,” Pharmaceutical development and technology, vol. 9, no. 1, pp. 85–95, 2004.

References 241
[94] W. Callister and D. Rethwisch, ISV Fundamentals of Materials Science and Engineer-
ing: An Integrated Approach, 3E, International Student Version. John Wiley & Sons,
Incorporated, 2008.
[95] W. Hosford, Mechanical Behavior of Materials. Cambridge University Press, 2005.
[96] W. Bergmann, Werkstofftechnik 1. No. Bd. 1 in Hanser-Studien-Bucher, Hanser, 2008.
[97] I. Zimmermann, Pharmazeutische Technologie: Industrielle Herstellung und Entwick-
lung von Arzneimitteln ; mit 150 Abbildungen und 37 Tabellen. Springer-Verlag GmbH,
1998.
[98] H. Bargel, P. Cardinal, H. Hilbrans, G. Schulze, and G. Wurzel, Werkstoffkunde, vol. 7.
Springer-Verlag GmbH, 2000.
[99] C. Inglus, “Stresses in a plate due to the presence of cracks and sharp corners,” Trans.
R. Inst. Naval Arch., vol. 60, pp. 219–230, 1913.
[100] K.-H. Schwalbe, Bruchmechanik metallischer Werkstoffe. Hanser Munchen, 1980.
[101] J. A. Collins, Failure of materials in mechanical design: analysis, prediction, prevention.
John Wiley & Sons, 1993.
[102] K.-H. Grote and J. Feldhusen, Taschenbuch fur den Maschinenbau. Springer Verlag,
twenty-first, completely revised and extended edition ed., 2004.
[103] R. W. Hertzberg, Deformation and fracture mechanics of engineering materials, vol. 89.
Wiley New York, 4th edition ed., 1996.
[104] “ASTM E399-09 Standard Test Method for Linear-Elastic Plane-Strain Fracture Tough-
ness K Ic of Metallic Materials [online]; Available from: http://www.astm.org/
DATABASE.CART/HISTORICAL/E399-09.htm; Accessed on November 7, 2013.”
[105] ASM, “Asm handbook,” ASM Intenational, vol. 19, 2004.
[106] “Trehalose: a review of properties, history of use and human tolerance, and results of
multiple safety studies,” Food and Chemical Toxicology, vol. 40, no. 7, pp. 871 – 898,
2002.

242 References
[107] E. Arzneibuch, “7. ausgabe, 7. nachtrag,” 2013.
[108] “Trehalose-Compund Summary [online]; Available from: http://pubchem.ncbi.
nlm.nih.gov/summary/summary.cgi?cid=7427; Accessed on December 12,
2013.”
[109] “D-(+)-trehalose dihydrate [online]; Available from: http://www.chemicalbook.
com/ChemicalProductProperty_DE_CB4454890.htm; Accessed on December 12,
2013.”
[110] R. Hatley and F. Franks, “Applications of dsc in the development of improved freeze-
drying processes for labile biologicals,” Journal of Thermal Analysis and Calorimetry,
vol. 37, no. 8, pp. 1905–1914, 1991.
[111] “Sucrose-Compund Summary [online]; Available from: http://pubchem.ncbi.nlm.
nih.gov/summary/summary.cgi?cid=5988&loc=ec_rcs; Accessed on December
13, 2013.”
[112] “D-(+)-Sucrose [online]; Available from: http://www.chemicalbook.com/
ChemicalProductProperty_EN_CB4337508.htm; Accessed on December 12,
2013.”
[113] “Maltose-Compund Summary [online]; Available from: http://pubchem.ncbi.nlm.
nih.gov/summary/summary.cgi?cid=6255&loc=ec_rcs; Accessed on December
13, 2013.”
[114] “D-(+)-Maltose monohydrate [online]; Available from: http://www.sigmaaldrich.
com/catalog/product/sial/m5885?lang=de®ion=DE; Accessed on Decem-
ber 12, 2013.”
[115] “D-(+)-Maltose monohydrate [online]; Available from: http://www.chemicalbook.
com/ChemicalProductProperty_EN_CB5748602.htm; Accessed on December 12,
2013.”
[116] “Bovine Serum Albumins [online]; Available from: http://www.sigmaaldrich.
com/life-science/biochemicals/biochemical-products.html?
TablePage=103994915; Accessed on December 12, 2013.”

References 243
[117] E. Mutschler, G. Geisslinger, H. Kroemer, and M. Schafer-Korting, “Mutschler
arzneimittelwirkungen, lehrbuch der pharmakologie und toxikologie. 8., vollig neu bear-
beitete und erweiterte auflage,” Wissenschaftliche Verlagsgesellschaft mbH Stuttgart,
vol. 1, no. 7, p. 10, 2001.
[118] “Crystal Structure of Bovine Serum Albumin [online]; Available from: http://www.
pdb.org; Accessed on December 13, 2013.”
[119] W. Kalender, Computed Tomography: Fundamentals, System Technology, Image
Quality, Applications. Wiley, third edition ed., 2011.
[120] H. Zhou, J. Wu, and J. Zhang, Digital Image Processing: Part I. Ventus Publishing
ApS, 2010.
[121] D. A. B. Kesel, M. M. Junge, and P. D. W. Nachtigall, “Einfuhrung in die angewandte
statistik fur biowissenschaftler,” 1999.
[122] W. Hackbuch, H. Schwarz, and E. Zeidler. Vieweg+Teubner, 2 ed., 2003.
[123] L. Slade, H. Levine, et al., “Non-equilibrium behavior of small carbohydrate-water sys-
tems,” Pure Appl. Chem, vol. 60, no. 12, pp. 1841–1864, 1988.
[124] D. Miller, J. de Pablo, and H. Corti, “Thermophysical properties of trehalose and its
concentrated aqueous solutions,” Pharmaceutical Research, vol. 14, no. 5, pp. 578–
590, 1997.
[125] Y. Roos, “Melting and glass transitions of low molecular weight carbohydrates,” Carbo-
hydrate Research, vol. 238, no. 0, pp. 39–48, 1993.
[126] Y. Roos and M. Karel, “Water and molecular weight effects on glass transitions in amor-
phous carbohydrates and carbohydrate solutions,” Journal of Food Science, vol. 56,
no. 6, pp. 1676–1681, 1991.
[127] G. Blond, D. Simatos, M. CattA c©, C. G. Dussap, and J. B. Gros, “Modeling of the
water-sucrose state diagram below 0 Ac,” Carbohydrate Research, vol. 298, no. 3,
pp. 139–145, 1997.

244 References
[128] S. Ablett, M. J. Izzard, and P. J. Lillford, “Differential scanning calorimetric study of
frozen sucrose and glycerol solutions,” Journal of the Chemical Society, Faraday Trans-
actions, vol. 88, no. 6, pp. 789–794, 1992.
[129] M. Peleg, “Review: Mechanical properties of dry cellular solid foods,” Food Science
and Technology International, vol. 3, no. 4, pp. 227–240, 1997.
[130] N. Harnkarnsujarit, S. Charoenrein, and Y. H. Roos, “Microstructure formation of mal-
todextrin and sugar matrices in freeze-dried systems,” Carbohydrate Polymers, vol. 88,
no. 2, pp. 734–742, 2012.
[131] S. Devi and D. Williams, “Morphological and compressional mechanical properties of
freeze-dried mannitol, sucrose, and trehalose cakes,” J Pharm Sci, vol. 102, no. 12,
pp. 4246–55, 2013.
[132] M. F. Ashby and R. F. M. Medalist, “The mechanical properties of cellular solids,” Met-
allurgical Transactions A, vol. 14, no. 9, pp. 1755–1769, 1983.
[133] U.-J. Kim, J. Park, C. Li, H.-J. Jin, R. Valluzzi, and D. L. Kaplan, “Structure and proper-
ties of silk hydrogels,” Biomacromolecules, vol. 5, no. 3, pp. 786–792, 2004.
[134] O. V. Kazmina and B. S. Semukhin, Foam-Glass-Crystal Materials, ch. 6, pp. 143–164.
Engineering Materials, Springer Berlin Heidelberg, 2013.
[135] D. P. H. Hasselman and R. M. Fulrath, “Micromechanical stress concentrations in two-
phase brittle-matrix ceramic composites,” Journal of the American Ceramic Society,
vol. 50, no. 8, pp. 399–404, 1967.
[136] R. L. Bertolotti and R. M. Fulrath, “Effect of micromechanical stress cocentrations on
strength of porous glass,” Journal of the American Ceramic Society, vol. 50, no. 11,
pp. 558–562, 1967.
[137] “Objekttrager [online]; Available from: http://www.menzel.de/Produkte.655.0.
html; Accessed on February 17, 2014.”
[138] “Injektionsflaschen [online]; Available from: http://www.pharmaglas.de/injekt.
html; Accessed on February 17, 2014.”

References 245
[139] “Fiolax [online]; Available from: http://www.schott.com/tubing/media/
selector/brochures/german/schott-tubing_brochure_fiolax_german.
pdf; Accessed on February 17, 2014.”
[140] J. K. Kaushik and R. Bhat, “Why is trehalose an exceptional protein stabilizer? an
analysis of the thermal stability of proteins in the presence of the compatible osmolyte
trehalose,” Journal of Biological Chemistry, vol. 278, no. 29, pp. 26458–26465, 2003.
[141] “D-(+)-trehalose dihydrate [online]; Available from: http://www.chemicalbook.com/
ChemicalProductProperty_DE_CB4454890.htm; Accessed on February 19, 2014.”
[142] G. W. Scherer, “Theory of drying,” Journal of the American Ceramic Society, vol. 73,
no. 1, pp. 3–14, 1990.
[143] “SCHOTT ToplyoTM Vials [online]; Available from: http://www.adelphi-hp.
com/en/products/containers/glass-vials/schott-toplyo.html; Accessed
on January 9, 2014.”
[144] “SCHOTT Vials [online]; Available from: http://www.schott.com/
pharmaceutical_packaging/german/download/brochure_vials_row.pdf;
Accessed on January 9, 2014.”
[145] C. Dietrich, F. Maurer, H. Roehl, and W. Friess, Pharmaceutical packaging for
lyophilization applications. London: Informa Healthcare, third edition ed., 2010.
[146] W. Yan and N. Li, “Pore-size distribution and strength of porous mullite ceramics,” Am.
Ceram. Soc. Bull, vol. 85, p. 9401, 2006.
[147] J. T. Wen Yan, Hao Luo and N. Li, “Effects of sintering temperature on pore character-
ization and strength of cordierite-mullite ceramics by a pore-forming in-situ technique,”
International Journal of Materials Research, vol. 103, no. 10, pp. 1239–1243, 2012.
[148] R. S., Mechanische Eigenschaften metallischer und polymerer Schaumstoffe, p. 164.
Prof. Dr.-Ing. Michael Schlimmer, 2005.
[149] J. A. Searles, J. F. Carpenter, and T. W. Randolph, “Annealing to optimize the pri-
mary drying rate, reduce freezing-induced drying rate heterogeneity, and determine tg

246 References
’ in pharmaceutical lyophilization,” Journal of Pharmaceutical Sciences, vol. 90, no. 7,
pp. 872–887, 2001.
[150] P. J. Dawson and D. J. Hockley, “Scanning electron microscopy of freeze-dried prepa-
rations: relationship of morphology to freeze-drying parameters,” Developments in bi-
ological standardization, vol. 74, pp. 185–192, 1992.
[151] S. Deville, “Freeze-casting of porous biomaterials: structure, properties and opportu-
nities,” Materials, vol. 3, no. 3, pp. 1913–1927, 2010.
[152] T. W. Patapoff and D. E. Overcashier, “The importance of freezing on lyophilization
cycle development,” Biopharm, vol. 15, no. 3, pp. 16–21, 2002.
[153] J. A. Searles, Freezing and annealing phenomena in lyophilization, vol. 206, pp. 52–81.
New York: Marcel Dekker, Inc., 2010.
[154] “Alpha 1-2LDplus operating manual.”
[155] “Emissivity Table [online]; Available from: http://www.thermoworks.com/
emissivity_table.html; Accessed on January 21, 2014.”
[156] H. Sadikoglu, A. Liapis, O. Crasser, and R. Bruttini, “Estimation of the effect of product
shrinkage on the drying times, heat input and condenser load of the primary and sec-
ondary drying stages of the lyophilization process in vials,” Drying technology, vol. 17,
no. 10, pp. 2013–2035, 1999.
[157] A. Barrett, G. KaletunA§, S. Rosenburg, and K. Breslauer, “Effect of sucrose on the
structure, mechanical strength and thermal properties of corn extrudates,” Carbohy-
drate Polymers, vol. 26, no. 4, pp. 261–269, 1995.
[158] M. Peleg, “A model of mechanical changes in biomaterials at and around their glass
transition,” Biotechnology progress, vol. 10, no. 4, pp. 385–388, 1994.
[159] E. Teixeira, A. Da Roz, A. Carvalho, and A. Curvelo, “The effect of glycerol/sugar/water
and sugar/water mixtures on the plasticization of thermoplastic cassava starch,” Car-
bohydrate Polymers, vol. 69, no. 4, pp. 619–624, 2007.

References 247
[160] M. S. Kaseko and S. G. Ritchie, “A neural network-based methodology for pavement
crack detection and classification,” Transportation Research Part C: Emerging Tech-
nologies, vol. 1, no. 4, pp. 275–291, 1993.
[161] A. Liapis, M. Pim, and R. Bruttini, “Research and development needs and opportunities
in freeze drying,” Drying Technology, vol. 14, no. 6, pp. 1265–1300, 1996.
[162] L. S. C. Wan and P. F. S. Lee, “Cmc of polysorbates,” Journal of Pharmaceutical Sci-
ences, vol. 63, no. 1, pp. 136–137, 1974.
[163] M. P. Buera, S. Rossi, S. Moreno, and J. Chirife, “Dsc confirmation that vitrification is
not necessary for stabilization of the restriction enzyme ecori dried with saccharides,”
Biotechnology Progress, vol. 15, no. 3, pp. 577–579, 1999.
[164] N. Gontard, S. Guilbert, and J.-L. Cuq, “Water and glycerol as plasticizers affect me-
chanical and water vapor barrier properties of an edible wheat gluten film,” Journal of
Food Science, vol. 58, no. 1, pp. 206–211, 1993.
[165] M. T. Cicerone and C. L. Soles, “Fast dynamics and stabilization of proteins: Binary
glasses of trehalose and glycerol,” Biophysical Journal, vol. 86, no. 6, pp. 3836–3845,
2004.
[166] K. Gekko and S. N. Timasheff, “Mechanism of protein stabilization by glycerol: pref-
erential hydration in glycerol-water mixtures,” Biochemistry, vol. 20, no. 16, pp. 4667–
4676, 1981.
[167] A. Schiller and R. Taugner, “Freeze-fracturing and deep-etching with the volatile cry-
oprotectant ethanol reveals true membrane surfaces of kidney structures,” Cell and
Tissue Research, vol. 210, no. 1, pp. 57–69, 1980.
[168] K. Engelke, M. Karolczak, A. Lutz, U. Seibert, S. Schaller, and W. Kalender, “Mikro-ct
technologie und applikationen zur erfassung von knochenarchitektur,” Der Radiologe,
vol. 39, no. 3, pp. 203–212, 1999.
[169] D. Zhu, R. W. Conners, and P. A. Araman, “Three-dimensional ct image segmentation
by volume growing,” Proc. SPIE, vol. 1606, pp. 685–696, 1991.

248 References
[170] P. Soille, Morphological Image Analysis: Principles and Applications. Berlin: Springer-
Verlag, 2003.
[171] U. Stange, M. Scherf-Clavel, and H. Gieseler, “Application of gas pycnometry for
the density measurement of freeze-dried products,” J Pharm Sci, vol. 102, no. 11,
pp. 4087–99, 2013. Stange, Ulrike Scherf-Clavel, Maike Gieseler, Henning United
States J Pharm Sci. 2013 Nov;102(11):4087-99. doi: 10.1002/jps.23723. Epub 2013
Sep 9.
[172] S. Van Vlierberghe, V. Cnudde, P. Dubruel, B. Masschaele, A. Cosijns, I. De Paepe,
P. J. S. Jacobs, L. Van Hoorebeke, J. P. Remon, and E. Schacht, “Porous gelatin hydro-
gels: 1. cryogenic formation and structure analysis,” Biomacromolecules, vol. 8, no. 2,
pp. 331–337, 2007.