Augmented rod bipolar cell function in partial receptor loss: an ERG study in P23H rhodopsin...
19
Vision Research 41 (2001) 2779 – 2797 Augmented rod bipolar cell function in partial receptor loss: an ERG study in P23H rhodopsin transgenic and aging normal rats Tomas S. Aleman a , Matthew M. LaVail b , Rodrigo Montemayor a , Gui-shuang Ying a , Maureen M. Maguire a , Alan M. Laties a , Samuel G. Jacobson a , Artur V. Cideciyan a, * a Department of Ophthalmology, Scheie Eye Institute, Uniersity of Pennsylania, 51 North 39th Street, Philadelphia, PA 19104, USA b Departments of Anatomy and Ophthalmology, Beckman Vision Center, Uniersity of California, San Francisco, CA, USA Received 30 October 2000; received in revised form 16 March 2001 Abstract Physiological consequences of early stages of photoreceptor degeneration were examined in heterozygous P23H rhodopsin transgenic (Tg) and in aging normal Sprague – Dawley rats. Rod photoreceptor and rod bipolar (RB) cell function were estimated with maximum value and sensitivity parameters of P3 and P2 components of the electroretinogram. In both Tg and aging normal rats, the age-related rate of decline of P3 amplitude was steeper than that of the P2 amplitude. Tg rats showed greater than normal sensitivity of the rods. A new model of distal RB pathway connectivity suggested photoreceptor loss could not be the sole cause of physiological abnormalities; there was an additional increase of post-receptoral sensitivity. We propose that changes at rod-RB synapses compensate for the partial loss of rod photoreceptors in senescence and in early stages of retinal degeneration. © 2001 Elsevier Science Ltd. All rights reserved. Keywords: Aging; Autosomal dominant retinitis pigmentosa; Electroretinogram; Reactive synaptogenesis; Rhodopsin; Rod photoreceptors; Rod bipolar cells; Sprague – Dawley albino rat www.elsevier.com/locate/visres 1. Introduction Human retinopathies within the diagnostic spectrum of retinitis pigmentosa (RP) are caused by mutations in genes primarily expressed in rod photoreceptors or retinal pigment epithelial (RPE) cells (Rattner, Sun & Nathans, 1999; Clarke, Heon & McInnes, 2000a; Phe- lan & Bok, 2000). One of the best-studied forms of RP is caused by mutations in the rhodopsin (RHO ) gene, which is expressed in rods (Dryja et al., 1990; Gal, Apfelstedt-Sylla, Janecke, & Zenner, 1997). Even though the key function of rhodopsin in phototrans- duction is well understood, the detailed pathophysiol- ogy of RHO -associated autosomal dominant RP (RHO -ADRP) is not known. Studies of eye-donors with RHO -ADRP have helped define the histopatho- logic characteristics of the degenerating retina (Kolb & Gouras, 1974; Tucker & Jacobson, 1988; Li, Jacobson, & Milam, 1994; Milam, Li, Cideciyan, & Jacobson, 1996; Cideciyan et al., 1998a). The end stage of disease is typified by large retinal regions devoid of photorecep- tors; as expected, there is no perception of light in the corresponding areas of the patients’ visual field. The earliest stages of some forms of RHO -ADRP, on the other hand, can have normal appearing retinal mor- phology; corresponding areas in the visual field are characterized by near-normal sensitivity to light and abnormally slow resensitization of rods following bright adapting lights (Jacobson, Kemp, Sung, & Nathans, 1991; Kemp, Jacobson, Roman, Sung, & Nathans, 1992; Birch, Hood, Nusinowitz, & Pepperberg, 1995; Cideciyan et al., 1998a). What are the physiological consequences of partial loss of rods on the surviving photoreceptors and their post-synaptic targets? If one assumes retention of nor- mal retinal circuitry among surviving neurons, an or- derly relationship between number of surviving photoreceptors and overall visual dysfunction would be * Corresponding author. Tel.: +1-215-662-9986; fax: 1-215-662- 9388. E-mail address: [email protected] (A.V. Cideciyan). 0042-6989/01/$ - see front matter © 2001 Elsevier Science Ltd. All rights reserved. PII: S0042-6989(01)00157-2
Transcript of Augmented rod bipolar cell function in partial receptor loss: an ERG study in P23H rhodopsin...

Vision Research 41 (2001) 2779–2797
Augmented rod bipolar cell function in partial receptor loss: anERG study in P23H rhodopsin transgenic and aging normal rats
Tomas S. Aleman a, Matthew M. LaVail b, Rodrigo Montemayor a, Gui-shuang Ying a,Maureen M. Maguire a, Alan M. Laties a, Samuel G. Jacobson a, Artur V. Cideciyan a,*
a Department of Ophthalmology, Scheie Eye Institute, Uni�ersity of Pennsyl�ania, 51 North 39th Street, Philadelphia, PA 19104, USAb Departments of Anatomy and Ophthalmology, Beckman Vision Center, Uni�ersity of California, San Francisco, CA, USA
Received 30 October 2000; received in revised form 16 March 2001
Abstract
Physiological consequences of early stages of photoreceptor degeneration were examined in heterozygous P23H rhodopsintransgenic (Tg) and in aging normal Sprague–Dawley rats. Rod photoreceptor and rod bipolar (RB) cell function were estimatedwith maximum value and sensitivity parameters of P3 and P2 components of the electroretinogram. In both Tg and aging normalrats, the age-related rate of decline of P3 amplitude was steeper than that of the P2 amplitude. Tg rats showed greater than normalsensitivity of the rods. A new model of distal RB pathway connectivity suggested photoreceptor loss could not be the sole causeof physiological abnormalities; there was an additional increase of post-receptoral sensitivity. We propose that changes at rod-RBsynapses compensate for the partial loss of rod photoreceptors in senescence and in early stages of retinal degeneration. © 2001Elsevier Science Ltd. All rights reserved.
Keywords: Aging; Autosomal dominant retinitis pigmentosa; Electroretinogram; Reactive synaptogenesis; Rhodopsin; Rod photoreceptors; Rodbipolar cells; Sprague–Dawley albino rat
www.elsevier.com/locate/visres
1. Introduction
Human retinopathies within the diagnostic spectrumof retinitis pigmentosa (RP) are caused by mutations ingenes primarily expressed in rod photoreceptors orretinal pigment epithelial (RPE) cells (Rattner, Sun &Nathans, 1999; Clarke, Heon & McInnes, 2000a; Phe-lan & Bok, 2000). One of the best-studied forms of RPis caused by mutations in the rhodopsin (RHO) gene,which is expressed in rods (Dryja et al., 1990; Gal,Apfelstedt-Sylla, Janecke, & Zenner, 1997). Eventhough the key function of rhodopsin in phototrans-duction is well understood, the detailed pathophysiol-ogy of RHO-associated autosomal dominant RP(RHO-ADRP) is not known. Studies of eye-donorswith RHO-ADRP have helped define the histopatho-logic characteristics of the degenerating retina (Kolb &
Gouras, 1974; Tucker & Jacobson, 1988; Li, Jacobson,& Milam, 1994; Milam, Li, Cideciyan, & Jacobson,1996; Cideciyan et al., 1998a). The end stage of diseaseis typified by large retinal regions devoid of photorecep-tors; as expected, there is no perception of light in thecorresponding areas of the patients’ visual field. Theearliest stages of some forms of RHO-ADRP, on theother hand, can have normal appearing retinal mor-phology; corresponding areas in the visual field arecharacterized by near-normal sensitivity to light andabnormally slow resensitization of rods following brightadapting lights (Jacobson, Kemp, Sung, & Nathans,1991; Kemp, Jacobson, Roman, Sung, & Nathans,1992; Birch, Hood, Nusinowitz, & Pepperberg, 1995;Cideciyan et al., 1998a).
What are the physiological consequences of partialloss of rods on the surviving photoreceptors and theirpost-synaptic targets? If one assumes retention of nor-mal retinal circuitry among surviving neurons, an or-derly relationship between number of survivingphotoreceptors and overall visual dysfunction would be
* Corresponding author. Tel.: +1-215-662-9986; fax: 1-215-662-9388.
E-mail address: [email protected] (A.V. Cideciyan).
0042-6989/01/$ - see front matter © 2001 Elsevier Science Ltd. All rights reserved.PII: S0042-6989(01)00157-2

T.S. Aleman et al. / Vision Research 41 (2001) 2779–27972780
expected. However, there have been hints of changes incircuitry; if retinal circuitry is modified overall visualdysfunction may not necessarily correlate directly withphotoreceptor loss. Histopathological studies in retinalregions with partial rod loss in RHO-ADRP havedemonstrated the existence of abnormal neurites ex-tending from surviving rod synapses into the innerretina (Li, Kljavin, & Milam, 1995; Milam et al., 1996;Fariss, Li, & Milam, 2000). These findings are notunlike reactive synaptic changes observed in the neu-rodegenerative diseases of the central nervous system,where partially deafferentated neurons can modify theirconnectivity to pre-synaptic neurons (Cotman & Nieto-Sampedro, 1984). Theoretically, reactive synapticchanges can either compensate for the primary pathol-ogy or exacerbate it (Cowan, 1970; Weller & Kaas,1989; Sherrard & Bower, 1998). In the retina for exam-ple, observation of a disproportionate loss of innerretinal function in some patients with presumed pri-mary photoreceptor degeneration (Hood & Greenstein,1990; Cideciyan & Jacobson, 1993) could be taken asevidence of remodeling at surviving photoreceptorsynapses amplifying the dysfunction due to the primarydisease. To the knowledge of the authors, there havenot been examples of compensatory reactive synapticchanges in hereditary human retinal degenerations.
Animal models of human disease help elucidatepathophysiological mechanisms and allow attempts ofvarious experimental therapies. Naturally occurring an-imal models of RHO-ADRP do not exist, but rodentand porcine models of RHO-ADRP have been geneti-cally engineered (for example, Olsson et al., 1992;Naash, Hollyfield, al-Ubaidi, & Baehr, 1993; Chang,Hao, & Wong, 1993; Portera-Cailliau, Sung, Nathans,& Adler, 1994; Chen, Makino, Peachey, Baylor, &Simon, 1995; Li, Snyder, Olsson, & Dryja, 1996; Stein-berg et al., 1996; Petters et al., 1997; Humphries et al.,1997; Li et al., 1998a). Most of the animal studies haveconcentrated on different aspects of the primary pathol-ogy of the photoreceptors; however, there has also beenevidence for synaptic abnormalities. For example, sur-viving rods in Pro347Leu RHO transgenic pigs lacksynaptic vesicles and ribbons (Li et al., 1998b; Black-mon et al., 2000). Electrophysiological studies in thesepigs have shown a lack of transmission of rod photore-ceptor signals to rod bipolar (RB) cells and provided apossible physiological correlate to this histopathologicobservation (Banin et al., 1999). The same transgenicpigs also show plasticity of rod photoreceptor synapsesas documented by neurite sprouting (Li et al., 1998b)and ectopic synaptogenesis between cones and RB cells(Peng, Hao, Petters, & Wong, 2000). The observedabnormalities in cone-driven post-receptoral function(Banin et al., 1999) may be associated with these coneretinal circuitry abnormalities but further studies arenecessary.
Another animal model of RHO-ADRP is the trans-genic (Tg) rat with a proline-23 to histidine (Pro23His)RHO mutation (Steinberg et al., 1996; Lewin et al.,1998; LaVail et al., 2000; Machida et al., 2000). Electro-physiological results in these animals point to a relativeretention of signals originating from the post-receptoralcells driven by rods (Cideciyan et al., 1999a; Machida etal. 2000). The basis of this phenomenon is not knownbut two possible explanations, buffering by wide recep-tive fields of bipolar cells and modification of synapses,have been suggested (Machida et al., 2000). In order tobetter understand the pathophysiology, we investigatedthe natural history of receptoral and postreceptoralfunction in the Tg rats. We also studied the maturationand normal aging of retinal function in control ratsconsidering very little is known about receptoral andpostreceptoral function between the age of 1 month andadulthood (Fulton, Hansen, & Findl, 1995). There wasa progressive reduction of receptoral and postreceptoralsignal amplitude both in Tg and control rats with age;the reduction in Tg rats was more extensive than thenormal rats. Both in Tg and aging normal rats, theamplitude of signals originating from rod bipolar (RB)cells were better preserved than signals originating fromrod photoreceptors. To test the hypothesis that buffer-ing by wide receptive fields was the basis of the retainedRB cell function in Tg and aging normal rats, wedeveloped a model of connectivity and signaling at thedistal portion of the RB cell pathway. The modelresults were not consistent with this hypothesis.
We propose that increased sensitivity of RB cells dueto synaptic remodeling following partial loss of rodphotoreceptors forms the basis of the observed patho-physiology in Tg and aging normal rats. So-calledreactive synaptogenesis, if confirmed by other experi-ments, could form an effective functional reserve at thefirst synapse of the visual system and play an importantrole in hereditary retinal degenerations and aging bydelaying symptoms and maintaining visual functionthat would otherwise decline more rapidly. Acatastrophic loss of function would be predicted tooccur at the end stages of photoreceptor degenerationwhen compensation is no longer possible.
2. Methods
2.1. Animals
Normal albino Sprague–Dawley (SD) rats (n=12)and heterozygous transgenic (Tg) rats (n=10), whichwere the progeny of matings between SD rats andhomozygous transgenic rats with P23H mutation (lineTgN(P23H)3, also on SD background), were used inthe current work. Transgenic rats were produced byChrysalis DNX Transgenic Sciences, Princeton, NJ and
T.S. Aleman et al. / Vision Research 41 (2001) 2779–2797 2781
developed in the laboratory of one of us (MML). All ratswere raised from birth in 12-h-on-12-h-off cycles of dim(�3 lux) incandescent light. Recordings were made atages of 1, 2, 3, 4, 5, 7, 13, and 18 months; both groupsof animals were investigated during the same period andwith the same equipment. The number of rats used ateach age varied from 3 to 7 with two exceptions: onenormal rat was available at 7 months and two normalrats were available at 18 months. The studies wereconducted in accordance with the ARVO Statement forthe Use of Animals in Ophthalmic and Vision Researchand Institutional Guidelines.
2.2. Electroretinogram (ERG)
Full field ERGs were recorded from one dilated eye ofeach animal using a custom-built ganzfeld, a computer-based system (EPIC-XL, LKC Technologies, Gaithers-burg, MD) and specially-made contact lens electrodes(Hansen Ophthalmics, Iowa City, IA). The signals wereamplified (band-pass; −3 dB cutoff at 0.3 and 1500 Hz)and digitized with an 12-bit analog-to-digital converterat 2 or 3.33 kHz (depending on stimulus strength). Lightlevels were measured with a calibrated photometer(IL1700, International Light, Newburyport, MA). Ani-mals were anesthetized with intramuscular injection of amixture of ketamine HCl (75 mg kg−1) and xylazine (5mg kg−1) under dim red lights. All ERG responses wereobtained within 30 min of the anesthetic injection inorder to avoid reduction in retinal illuminance secondaryto anesthesia-induced cataracts (Calderone, Grimes, &Shalev, 1986; Nusinowitz, Azimi, & Heckenlively, 2000).Corneas were anesthetized with proparacaine (HCl) andpupils dilated with tropicamide (1%) and phenylephrine(2.5%).
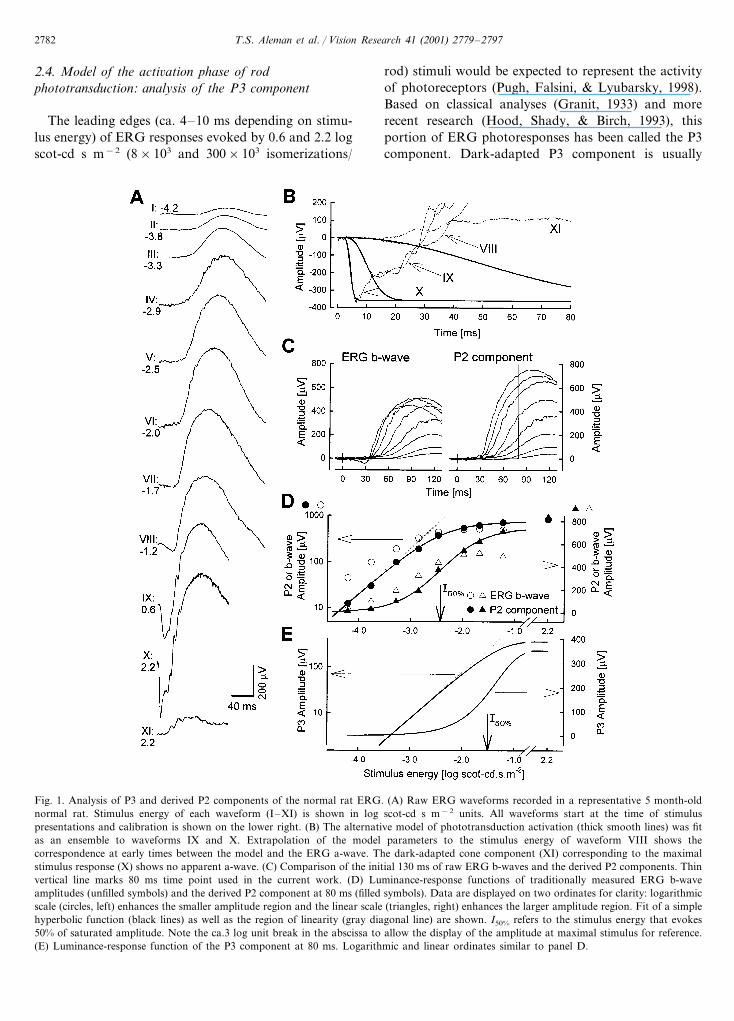
Medium energy (10 �s duration) and high energy (1 msduration) flash stimulators with unattenuated lumi-nances of 0.8 and 3.6 log scot-cd s m−2, respectively, wereused in the current work (Cideciyan & Jacobson, 1996;Banin et al., 1999). Neutral density (Wratten 96, Kodak,Rochester, NY) and blue (Wratten 47A) filters attenu-ated and spectrally shaped the flashes to produce tenstandard blue stimuli in the range of −4.2 to +2.2 logscot-cd s m−2. Dark-adapted (�12 h) ERGs wereobtained with blue stimuli increasing from −4.2 to−1.2 log scot-cd s m−2 (see waveforms labeled I–VIIIin Fig. 1A) in 0.3–0.5 log unit steps; 2–8 responses wereaveraged with interstimulus intervals increasing from 2to 30 s. After a 1 min wait, a single flash (non-averaged)response was evoked with a +0.6 log scot-cd s m−2 bluestimulus (Fig. 1A, waveform IX). After an additional ca.5 min wait, a single flash response was evoked with a+2.2 log scot-cd s m−2 blue stimulus (Fig. 1A, wave-form X).
In order to estimate the cone contribution in thedark-adapted ERG waveforms, pilot studies were per-
formed under light-adapted (30 cd m−2, white) condi-tions (not illustrated in the current work). The +2.2 logscot-cd s m−2 blue stimulus evoked ERG b-waves of�100 �V amplitude but −1.2 log scot-cd s m−2 bluestimulus did not evoke detectable responses under lightadapted conditions. This finding was consistent withpublished cone ERG thresholds of approximately −1log cd s m−2 in rats (Sugawara, Sieving, & Bush, 2000)and mice (Toda, Bush, Humphries, & Sieving, 1999);light-adapted ERGs were not further pursued. Cone-derived component of the +0.6 log scot-cd s m−2 bluestimulus was ignored since only the leading edge of thisresponse was used in the current work and the dominant(�95%, see below) contributor to the leading edge wasrod-derived. Cone-derived ERG component of the max-imal stimulus (+2.2 log scot-cd s m−2 blue) wasdetermined, however, in each experiment with a paired-flash procedure (Birch et al., 1995; Pepperberg, Birch,Hofmann, & Hood, 1996; Cideciyan et al., 1998b;Pepperberg, Birch, & Hood, 2000). Our procedure wasan abbreviated version consisting of a single conditioningflash strength (white 3.6 log scot-cd s m−2) and a singleinterflash interval (30 s). This interval was chosen to belonger than the expected time for full recovery of the conecomponent (Lyubarsky, Falsini, Pennesi, Valentini, &Pugh, 1999; Lyubarsky, Chen, Simon, & Pugh, 2000) andshorter than the initiation of rod recovery (�180 s)determined in pilot studies (data not shown).
2.3. Estimated retinal illuminance
An estimate of retinal illuminance resulting fromviewing a homogenous ganzfeld allows comparison be-tween non-invasive ERG results and single cell record-ings. For the current work, we will assume a flash of 1scot-cd s m−2 produces ca. 2000 isomerizations per rodin normal adult albino rats raised under dim cyclic lightconditions. This estimate is similar to some previousestimates in pigmented (Bush, Hawks, & Sieving, 1995)and albino (Naarendorp & Williams, 1999) rats. Similardark-adapted thresholds in albino and pigmented rats(Green, Herreros de Tejada, & Glover, 1991) suggest thatat least under pupillary dilation, ocular pigmentationdoes not significantly affect retinal illuminance. In adultmice, retinal illuminance resulting from a 1 scot-cd s m−2
luminance has been estimated (using different sets ofassumptions) at ca. 100 (Hetling & Pepperberg, 1999), ca.1500 (Pennesi, Lyubarsky, & Pugh, 1998) and ca. 5000(Goto et al., 1996) isomerizations per rod. Based ongeometric considerations (illuminance is proportional topupillary area and inversely proportional to ocular axiallength), retinal illuminance of the adult rat should be ca.20% larger than the mouse when viewing the samehomogeneous extended light source. Thus, our estimatein the rat falls near the middle of the range of estimatesin the mouse.
T.S. Aleman et al. / Vision Research 41 (2001) 2779–27972782
2.4. Model of the acti�ation phase of rodphototransduction: analysis of the P3 component
The leading edges (ca. 4–10 ms depending on stimu-lus energy) of ERG responses evoked by 0.6 and 2.2 logscot-cd s m−2 (8×10³ and 300×103 isomerizations/
rod) stimuli would be expected to represent the activityof photoreceptors (Pugh, Falsini, & Lyubarsky, 1998).Based on classical analyses (Granit, 1933) and morerecent research (Hood, Shady, & Birch, 1993), thisportion of ERG photoresponses has been called the P3component. Dark-adapted P3 component is usually
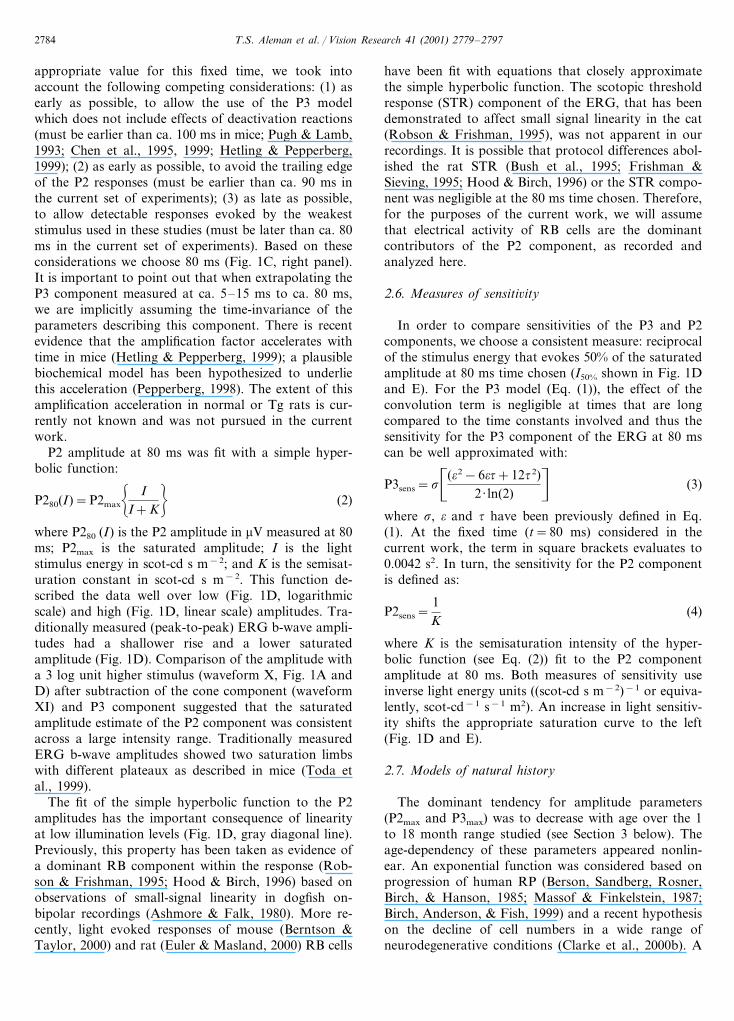
Fig. 1. Analysis of P3 and derived P2 components of the normal rat ERG. (A) Raw ERG waveforms recorded in a representative 5 month-oldnormal rat. Stimulus energy of each waveform (I–XI) is shown in log scot-cd s m−2 units. All waveforms start at the time of stimuluspresentations and calibration is shown on the lower right. (B) The alternative model of phototransduction activation (thick smooth lines) was fitas an ensemble to waveforms IX and X. Extrapolation of the model parameters to the stimulus energy of waveform VIII shows thecorrespondence at early times between the model and the ERG a-wave. The dark-adapted cone component (XI) corresponding to the maximalstimulus response (X) shows no apparent a-wave. (C) Comparison of the initial 130 ms of raw ERG b-waves and the derived P2 components. Thinvertical line marks 80 ms time point used in the current work. (D) Luminance-response functions of traditionally measured ERG b-waveamplitudes (unfilled symbols) and the derived P2 component at 80 ms (filled symbols). Data are displayed on two ordinates for clarity: logarithmicscale (circles, left) enhances the smaller amplitude region and the linear scale (triangles, right) enhances the larger amplitude region. Fit of a simplehyperbolic function (black lines) as well as the region of linearity (gray diagonal line) are shown. I50% refers to the stimulus energy that evokes50% of saturated amplitude. Note the ca.3 log unit break in the abscissa to allow the display of the amplitude at maximal stimulus for reference.(E) Luminance-response function of the P3 component at 80 ms. Logarithmic and linear ordinates similar to panel D.

T.S. Aleman et al. / Vision Research 41 (2001) 2779–2797 2783
dominated by the rod photoreceptor activity butvarying amounts of cone activity can contribute de-pending on the species under consideration (Cideciyanet al., 1999b). In mice, cone contribution to the P3component is minuscule (Lyubarsky et al., 1999) andrats would be expected to have even smaller conecontribution (Deegan & Jacobs, 1993; Williams, Web-bers, Giordano, & Henderson, 1998). Analysis of theleading edges of the dark-adapted cone component inthe rat showed that cones contribute less than 5% ofthe amplitude of the rod P3 component at 1 monthof age (data not shown); at later ages, a distinct conecomponent could not be unequivocally demonstratedwithin the noise of the recordings (waveform XI, Fig.1A and B).
The rat P3 component was analyzed using an alter-native model of rod phototransduction activationdefined as:
P3(I,t)=P3max�
1−exp�
−12
I��
(�2−6��+12�2)
−e−�
� (�2−6��+12�2)n��
� e−�
�m (1)
where P3(I, t) is the leading edge of the corneallymeasured potential in �V; I is the retinal illuminanceof the stimulus in scot-td s; t is the time after stimu-lus onset in seconds; P3max is the maximum amplitudein �V; � is the sensitivity in scot-cd−1 m2 s−3; � istime, t, delayed by a constant (�= t−�); � is thetime constant of three first-order decays presumed tocorrespond to three dominant photoactivation reac-tions; �m is the capacitive time constant of the pho-toreceptor membrane; and, * represents theconvolution operation (Cideciyan & Jacobson, 1996;Cideciyan, 2000). This alternative model considers theearliest stages of biochemical reactions as a cascadeof three dominant first-order reactions instead of asimple time delay used in the delayed Gaussian model(Lamb & Pugh, 1992; Pugh & Lamb, 1993). The al-ternative model has been shown to describe photore-sponse activation kinetics simultaneously over a largerange of stimulus intensities in several mammalianspecies including man, monkey, pig and rat (Cide-ciyan et al., 1999b) and in retinal degenerative dis-eases of man (Cideciyan et al., 1998a; Cideciyan,2000), pig (Banin et al., 1999) and mice (Van Hooseret al., 2000). The alternative model of rod photo-transduction was fit simultaneously to the P3 compo-nents evoked with +0.6 and +2.2 log scot-cd s m−2
stimuli (Fig. 1B). Only the two variables of themodel, saturated amplitude (P3max) and sensitivity(�), were allowed to vary; other parameters (�, �, �m)were unchanged from the original description of themodel in man (Cideciyan & Jacobson, 1996) under
the assumption of stereotypy of phototransduction ac-tivation in mammalian rods (Pugh & Lamb, 1993).
P3max is believed to be proportional to the totalnumber of cyclic nucleotide gated (CNG) channels onrod outer segment (ROS) plasma membranes open inthe dark across the retina (Breton, Schueller, Lamb,& Pugh, 1994; Hood & Birch, 1994). Assuming CNGchannel density does not change secondary to theouter retinal degeneration, the fraction of Tg ratP3max compared to the age-matched normal rat valueprovides a quantitative and non-invasive measure ofthe total extent of photoreceptor degeneration acrossthe retina. Assuming that all functioning rods activatestereotypically with light in normal and Tg rats, the �
parameter provides a quantitative (and absolute) mea-sure of phototransduction amplification gain (Pugh &Lamb, 1993).
2.5. Deri�ation and analysis of the P2 component
During the last decade, there has been increasingevidence that the leading edge of the ERG b-waveoriginates primarily from the activity of RB cells (e.g.Gurevich & Slaughter, 1993; Xu & Karwoski, 1994;Robson & Frishman, 1995; Hood & Birch, 1996;Karwoski & Xu, 1999; Lei & Perlman, 1999; Shiells& Falk, 1999; Kofuji et al., 2000). When isolatedfrom potentials believed to originate in more distal ormore proximal retinal cells, the ERG b-wave is calledthe P2 component (Hood & Birch, 1992). We derivedthe P2 component of the rat ERG at low illumina-tion (−4.2 to −1.2 log scot-cd s m−2; ca. 0.1–100isomerization/rod) by subtracting the P3 componentestimated from ERG data at higher illumination andextrapolated to lower illumination. In the currentwork, we will use the term ‘P2’ to refer to the com-putationally derived P2 component of the ERG. Fig.1B shows a representative example where the P3 com-ponent is estimated from the leading edges of re-sponses evoked by high illumination (waveforms IXand X) and applied to a response evoked by lowillumination (waveform VIII). The extrapolated P3component appears to describe the a-wave componentof this low intensity response.
Comparison of the traditionally-measured ERG b-waves and the P2 component (Fig. 1C) shows thelarger amplitudes achieved in the latter. ERG b-waveamplitudes as a function of luminance have beenparameterized with models to describe their sensitivityto light in rodents (e.g. Cone, 1963; Green et al.,1991; Pugh et al., 1998). Based on recent studies onpharmacologically isolated bipolar cell responses(Robson & Frishman, 1995, 1999), we determinedthe light dependence of the P2 component bymodeling the amplitude as a function of luminanceat a fixed time. In order to choose an
T.S. Aleman et al. / Vision Research 41 (2001) 2779–27972784
appropriate value for this fixed time, we took intoaccount the following competing considerations: (1) asearly as possible, to allow the use of the P3 modelwhich does not include effects of deactivation reactions(must be earlier than ca. 100 ms in mice; Pugh & Lamb,1993; Chen et al., 1995, 1999; Hetling & Pepperberg,1999); (2) as early as possible, to avoid the trailing edgeof the P2 responses (must be earlier than ca. 90 ms inthe current set of experiments); (3) as late as possible,to allow detectable responses evoked by the weakeststimulus used in these studies (must be later than ca. 80ms in the current set of experiments). Based on theseconsiderations we choose 80 ms (Fig. 1C, right panel).It is important to point out that when extrapolating theP3 component measured at ca. 5–15 ms to ca. 80 ms,we are implicitly assuming the time-invariance of theparameters describing this component. There is recentevidence that the amplification factor accelerates withtime in mice (Hetling & Pepperberg, 1999); a plausiblebiochemical model has been hypothesized to underliethis acceleration (Pepperberg, 1998). The extent of thisamplification acceleration in normal or Tg rats is cur-rently not known and was not pursued in the currentwork.
P2 amplitude at 80 ms was fit with a simple hyper-bolic function:
P280(I)=P2max� I
I+K�
(2)
where P280 (I) is the P2 amplitude in �V measured at 80ms; P2max is the saturated amplitude; I is the lightstimulus energy in scot-cd s m−2; and K is the semisat-uration constant in scot-cd s m−2. This function de-scribed the data well over low (Fig. 1D, logarithmicscale) and high (Fig. 1D, linear scale) amplitudes. Tra-ditionally measured (peak-to-peak) ERG b-wave ampli-tudes had a shallower rise and a lower saturatedamplitude (Fig. 1D). Comparison of the amplitude witha 3 log unit higher stimulus (waveform X, Fig. 1A andD) after subtraction of the cone component (waveformXI) and P3 component suggested that the saturatedamplitude estimate of the P2 component was consistentacross a large intensity range. Traditionally measuredERG b-wave amplitudes showed two saturation limbswith different plateaux as described in mice (Toda etal., 1999).
The fit of the simple hyperbolic function to the P2amplitudes has the important consequence of linearityat low illumination levels (Fig. 1D, gray diagonal line).Previously, this property has been taken as evidence ofa dominant RB component within the response (Rob-son & Frishman, 1995; Hood & Birch, 1996) based onobservations of small-signal linearity in dogfish on-bipolar recordings (Ashmore & Falk, 1980). More re-cently, light evoked responses of mouse (Berntson &Taylor, 2000) and rat (Euler & Masland, 2000) RB cells
have been fit with equations that closely approximatethe simple hyperbolic function. The scotopic thresholdresponse (STR) component of the ERG, that has beendemonstrated to affect small signal linearity in the cat(Robson & Frishman, 1995), was not apparent in ourrecordings. It is possible that protocol differences abol-ished the rat STR (Bush et al., 1995; Frishman &Sieving, 1995; Hood & Birch, 1996) or the STR compo-nent was negligible at the 80 ms time chosen. Therefore,for the purposes of the current work, we will assumethat electrical activity of RB cells are the dominantcontributors of the P2 component, as recorded andanalyzed here.
2.6. Measures of sensiti�ity
In order to compare sensitivities of the P3 and P2components, we choose a consistent measure: reciprocalof the stimulus energy that evokes 50% of the saturatedamplitude at 80 ms time chosen (I50% shown in Fig. 1Dand E). For the P3 model (Eq. (1)), the effect of theconvolution term is negligible at times that are longcompared to the time constants involved and thus thesensitivity for the P3 component of the ERG at 80 mscan be well approximated with:
P3sens=��(�2−6��+12�2)
2 · ln(2)n
(3)
where �, � and � have been previously defined in Eq.(1). At the fixed time (t=80 ms) considered in thecurrent work, the term in square brackets evaluates to0.0042 s2. In turn, the sensitivity for the P2 componentis defined as:
P2sens=1K
(4)
where K is the semisaturation intensity of the hyper-bolic function (see Eq. (2)) fit to the P2 componentamplitude at 80 ms. Both measures of sensitivity useinverse light energy units ((scot-cd s m−2)−1 or equiva-lently, scot-cd−1 s−1 m2). An increase in light sensitiv-ity shifts the appropriate saturation curve to the left(Fig. 1D and E).
2.7. Models of natural history
The dominant tendency for amplitude parameters(P2max and P3max) was to decrease with age over the 1to 18 month range studied (see Section 3 below). Theage-dependency of these parameters appeared nonlin-ear. An exponential function was considered based onprogression of human RP (Berson, Sandberg, Rosner,Birch, & Hanson, 1985; Massof & Finkelstein, 1987;Birch, Anderson, & Fish, 1999) and a recent hypothesison the decline of cell numbers in a wide range ofneurodegenerative conditions (Clarke et al., 2000b). A
T.S. Aleman et al. / Vision Research 41 (2001) 2779–2797 2785
single exponential did not account for the apparentfaster rate of change at early ages and slower rate ofchange at later ages. Therefore, we used a doubleexponential to describe the age-dependence of the am-plitude parameters. The specific equation chosen was:
P2/3max(age)=A�
2e−age
�1 +e−age
�2�
(5a)
where P2/3max refers to P2max or P3max; age is inmonths; A is a scaling parameter in �V; and, �1 and �2
are the time constants in months for the hypothesizedfast/early and slow/late components, respectively.
The sensitivity parameters (P2sens and P3sens) showeda tendency to increase with age (see Section 3 below).Under the parsimonious assumption that the age-de-pendency of semisaturation constants (I50%) have thesame functional form as Eq. (5a), we chose the recipro-cal of Eq. (5a) to describe the natural history of sensi-tivity parameters. The equation was:
P2/3sens(age)=S�
2e−age
�1 +e−age
�2� (5b)
where P2/3sens refers to P2sens or P3sens; age is inmonths; S is a scaling parameter in scot-cd−1 s−1 m2;and, �1 and �2 are the time constants in months for thehypothesized fast/early and slow/late components, re-spectively. Models of natural history were fit to the rawdata by minimizing the sum of squared error termsusing a simplex algorithm (Matlab Version 4.2; TheMathworks, Natick, MA).
2.8. Statistical analyses
Variation of the four measured parameters (P3max,P2max, P3sens, and P2sens) was studied as a function ofanimal group (Tg or normal) and age using a mixedlinear model with repeated measurements (Littell, Mil-liken, Stroup, & Wolfinger, 1996). To avoid the as-sumption of a linear effect of age on the measuredparameter, age was initially treated as a categoricalvariable. Results are presented only for a main effectsmodel with group and age as covariates since no statis-tically significant interactions were found for any of theparameters between group and age (not shown).
In an effort to quantify the statistical significance ofthe rate of retinal functional loss due to degeneration,data determined to have significant age effects wereanalyzed post-hoc with linear regression using age as acontinuous covariate. For this analysis, parameter val-ues were logarithmically transformed and values origi-nating at ages of 1 and 2 months were disregarded(under the assumption that eye growth is a dominantfactor at these early times). The slope coefficients of theregression line and their 95% confidence intervals wereestimated for each of the four parameters with age.
Confidence intervals were used to determine differenceof slopes from zero. The differences of slope coefficientsbetween normal and Tg rats were tested based on theinteraction between age and group from the mixedlinear model. The differences in slope coefficients be-tween P2max and P3max, between P2sens and P3sens for agiven group were tested based on the interaction be-tween age and parameter indicator. Slope coefficients oflogarithmically transformed data are presented as timeconstants for easier comparison with the results ofnon-linear regression analysis.
The magnitude of the derived parameters (the ratioof measured to predicted sensitivity in normal or Tgrats) was compared to the theoretically expected valueof 1. This overall comparison was achieved by t-testtaking into account repeated measurements. All analy-ses were performed with PC SAS (ver. 8.01, SAS Insti-tute, Cary, NC). Data are presented with mean valueand �95% confidence intervals.
3. Results
3.1. Maturation and aging of retinal function in normalrats
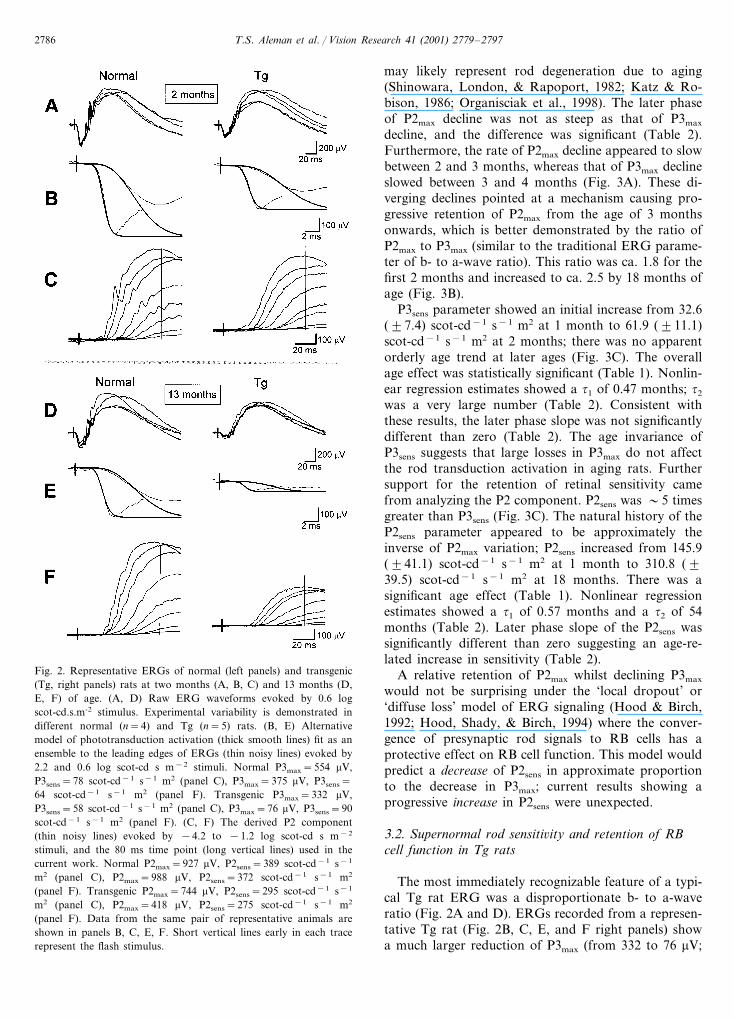
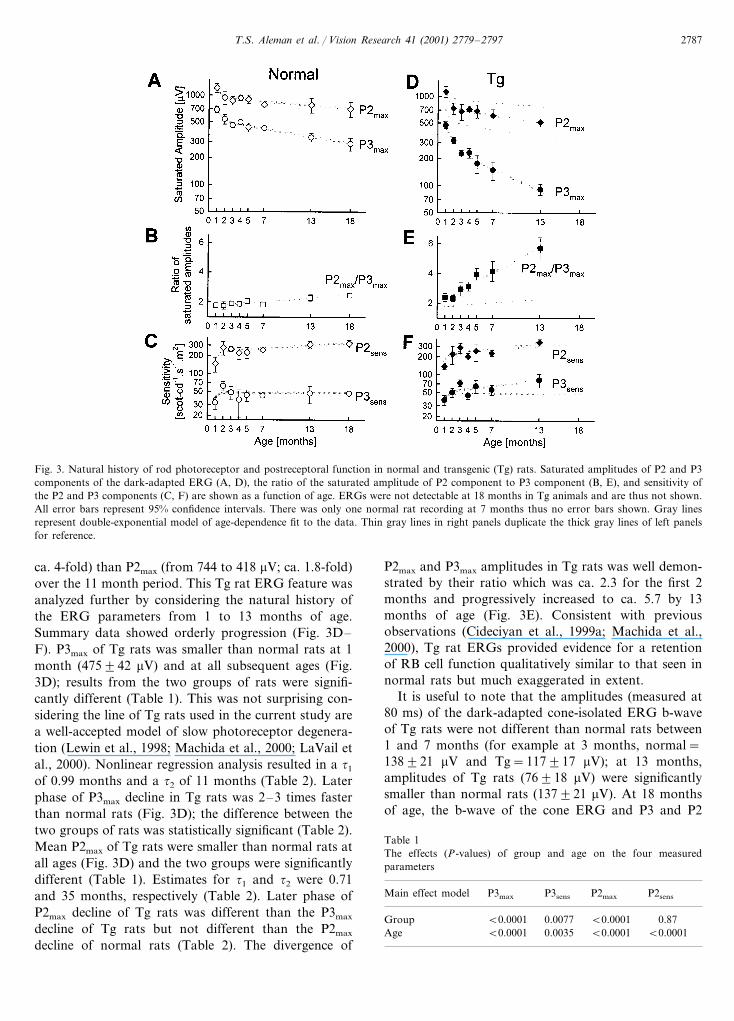
We studied normal rats from 1 to 18 months of ageto establish ERG parameters as a function of normalmaturation and aging, and used these parameters com-paratively to interpret the functional consequences ofretinal degeneration in Tg rats. Representative ERGresults are presented at the ages of 2 and 13 months(Fig. 2). ERGs recorded from the same normal rat 11months apart showed a large reduction of P3max (Fig.2B and E left panels) but little change in P2max (Fig. 2Cand F left panels). Summary data were orderly andconfirmed this difference between natural histories ofP3max and P2max parameters (Fig. 3A). The P3max
parameter at 13 months (338�38 �V) was reduced to63% of the value at 2 months (538�66 �V); the P2max
parameter at 13 months (779�145 �V), on the otherhand, was 83% of the value at 2 months (937�154�V). Both parameters appeared to decline initially fastand in parallel, and later slow and diverging (Fig. 3A).Both parameters showed statistically significant age ef-fects (Table 1). Nonlinear regression analysis resulted in�1 of ca. 0.5 months for both parameters, and �2 of 29and 67 months for P3max and P2max, respectively (Table2).
Similarity of the faster rate of decline of P2max andP3max most likely represents early changes of the electri-cal properties of the globe as the rat eye grows (forexample, Katz & Robison, 1986); developmental apop-tosis has mostly ended by the third post-natal week inrodents (for example, Young, 1984) and thus is notexpected to contribute. The slower phase of decline
T.S. Aleman et al. / Vision Research 41 (2001) 2779–27972786
Fig. 2. Representative ERGs of normal (left panels) and transgenic(Tg, right panels) rats at two months (A, B, C) and 13 months (D,E, F) of age. (A, D) Raw ERG waveforms evoked by 0.6 logscot-cd.s.m-2 stimulus. Experimental variability is demonstrated indifferent normal (n=4) and Tg (n=5) rats. (B, E) Alternativemodel of phototransduction activation (thick smooth lines) fit as anensemble to the leading edges of ERGs (thin noisy lines) evoked by2.2 and 0.6 log scot-cd s m−2 stimuli. Normal P3max=554 �V,P3sens=78 scot-cd−1 s−1 m2 (panel C), P3max=375 �V, P3sens=64 scot-cd−1 s−1 m2 (panel F). Transgenic P3max=332 �V,P3sens=58 scot-cd−1 s−1 m2 (panel C), P3max=76 �V, P3sens=90scot-cd−1 s−1 m2 (panel F). (C, F) The derived P2 component(thin noisy lines) evoked by −4.2 to −1.2 log scot-cd s m−2
stimuli, and the 80 ms time point (long vertical lines) used in thecurrent work. Normal P2max=927 �V, P2sens=389 scot-cd−1 s−1
m2 (panel C), P2max=988 �V, P2sens=372 scot-cd−1 s−1 m2
(panel F). Transgenic P2max=744 �V, P2sens=295 scot-cd−1 s−1
m2 (panel C), P2max=418 �V, P2sens=275 scot-cd−1 s−1 m2
(panel F). Data from the same pair of representative animals areshown in panels B, C, E, F. Short vertical lines early in each tracerepresent the flash stimulus.
may likely represent rod degeneration due to aging(Shinowara, London, & Rapoport, 1982; Katz & Ro-bison, 1986; Organisciak et al., 1998). The later phaseof P2max decline was not as steep as that of P3max
decline, and the difference was significant (Table 2).Furthermore, the rate of P2max decline appeared to slowbetween 2 and 3 months, whereas that of P3max declineslowed between 3 and 4 months (Fig. 3A). These di-verging declines pointed at a mechanism causing pro-gressive retention of P2max from the age of 3 monthsonwards, which is better demonstrated by the ratio ofP2max to P3max (similar to the traditional ERG parame-ter of b- to a-wave ratio). This ratio was ca. 1.8 for thefirst 2 months and increased to ca. 2.5 by 18 months ofage (Fig. 3B).
P3sens parameter showed an initial increase from 32.6(�7.4) scot-cd−1 s−1 m2 at 1 month to 61.9 (�11.1)scot-cd−1 s−1 m2 at 2 months; there was no apparentorderly age trend at later ages (Fig. 3C). The overallage effect was statistically significant (Table 1). Nonlin-ear regression estimates showed a �1 of 0.47 months; �2
was a very large number (Table 2). Consistent withthese results, the later phase slope was not significantlydifferent than zero (Table 2). The age invariance ofP3sens suggests that large losses in P3max do not affectthe rod transduction activation in aging rats. Furthersupport for the retention of retinal sensitivity camefrom analyzing the P2 component. P2sens was �5 timesgreater than P3sens (Fig. 3C). The natural history of theP2sens parameter appeared to be approximately theinverse of P2max variation; P2sens increased from 145.9(�41.1) scot-cd−1 s−1 m2 at 1 month to 310.8 (�39.5) scot-cd−1 s−1 m2 at 18 months. There was asignificant age effect (Table 1). Nonlinear regressionestimates showed a �1 of 0.57 months and a �2 of 54months (Table 2). Later phase slope of the P2sens wassignificantly different than zero suggesting an age-re-lated increase in sensitivity (Table 2).
A relative retention of P2max whilst declining P3max
would not be surprising under the ‘local dropout’ or‘diffuse loss’ model of ERG signaling (Hood & Birch,1992; Hood, Shady, & Birch, 1994) where the conver-gence of presynaptic rod signals to RB cells has aprotective effect on RB cell function. This model wouldpredict a decrease of P2sens in approximate proportionto the decrease in P3max; current results showing aprogressive increase in P2sens were unexpected.
3.2. Supernormal rod sensiti�ity and retention of RBcell function in Tg rats
The most immediately recognizable feature of a typi-cal Tg rat ERG was a disproportionate b- to a-waveratio (Fig. 2A and D). ERGs recorded from a represen-tative Tg rat (Fig. 2B, C, E, and F right panels) showa much larger reduction of P3max (from 332 to 76 �V;
T.S. Aleman et al. / Vision Research 41 (2001) 2779–2797 2787
Fig. 3. Natural history of rod photoreceptor and postreceptoral function in normal and transgenic (Tg) rats. Saturated amplitudes of P2 and P3components of the dark-adapted ERG (A, D), the ratio of the saturated amplitude of P2 component to P3 component (B, E), and sensitivity ofthe P2 and P3 components (C, F) are shown as a function of age. ERGs were not detectable at 18 months in Tg animals and are thus not shown.All error bars represent 95% confidence intervals. There was only one normal rat recording at 7 months thus no error bars shown. Gray linesrepresent double-exponential model of age-dependence fit to the data. Thin gray lines in right panels duplicate the thick gray lines of left panelsfor reference.
ca. 4-fold) than P2max (from 744 to 418 �V; ca. 1.8-fold)over the 11 month period. This Tg rat ERG feature wasanalyzed further by considering the natural history ofthe ERG parameters from 1 to 13 months of age.Summary data showed orderly progression (Fig. 3D–F). P3max of Tg rats was smaller than normal rats at 1month (475�42 �V) and at all subsequent ages (Fig.3D); results from the two groups of rats were signifi-cantly different (Table 1). This was not surprising con-sidering the line of Tg rats used in the current study area well-accepted model of slow photoreceptor degenera-tion (Lewin et al., 1998; Machida et al., 2000; LaVail etal., 2000). Nonlinear regression analysis resulted in a �1
of 0.99 months and a �2 of 11 months (Table 2). Laterphase of P3max decline in Tg rats was 2–3 times fasterthan normal rats (Fig. 3D); the difference between thetwo groups of rats was statistically significant (Table 2).Mean P2max of Tg rats were smaller than normal rats atall ages (Fig. 3D) and the two groups were significantlydifferent (Table 1). Estimates for �1 and �2 were 0.71and 35 months, respectively (Table 2). Later phase ofP2max decline of Tg rats was different than the P3max
decline of Tg rats but not different than the P2max
decline of normal rats (Table 2). The divergence of
P2max and P3max amplitudes in Tg rats was well demon-strated by their ratio which was ca. 2.3 for the first 2months and progressively increased to ca. 5.7 by 13months of age (Fig. 3E). Consistent with previousobservations (Cideciyan et al., 1999a; Machida et al.,2000), Tg rat ERGs provided evidence for a retentionof RB cell function qualitatively similar to that seen innormal rats but much exaggerated in extent.
It is useful to note that the amplitudes (measured at80 ms) of the dark-adapted cone-isolated ERG b-waveof Tg rats were not different than normal rats between1 and 7 months (for example at 3 months, normal=138�21 �V and Tg=117�17 �V); at 13 months,amplitudes of Tg rats (76�18 �V) were significantlysmaller than normal rats (137�21 �V). At 18 monthsof age, the b-wave of the cone ERG and P3 and P2
Table 1The effects (P-values) of group and age on the four measuredparameters
P3max P3sens P2maxMain effect model P2sens
�0.0001Group 0.0077 �0.0001 0.87�0.00010.0035�0.0001 �0.0001Age

T.S. Aleman et al. / Vision Research 41 (2001) 2779–27972788
Table 2Estimates of natural history
Normal Tg P-valuec
A or Sa �1a �2
a �2�b A or Sa �1
a �2a �2�
b
0.53 67 59** 748P2max 0.71938 35 31** 0.16534P3max 0.55 29 29** 287 0.99 11 11** �0.0001
P=0.04d P�0.001d
0.57 54 41** 203P2sens 0.57234 25 26** 0.340.47 1012 128 5048 0.56P3sens 28 34 0.34
P=0.35e P=0.63e
a Non-linear regression estimates from data at all ages using Eq. (5a) for P2max and P3max and Eq. (5b) for P2sens and P3sens.b Linear regression estimates from logarithmically transformed data at ages �3 months. Slopes have been transformed into time constants (�2�)
for comparability to non-linear regression estimate (�2).c P-value for the test of �2’ difference between normal and Tg groups.d P-value for the test of �2’ difference between P2max and P3max.e P-value for the test of �2’ difference between P2sens and P3sens.** Slope significantly (P=0.05) different than zero (i.e. �2’ significantly different than ��).
components of the rod ERG were not detectable in Tgrats (data not shown). This suggested a relative acceler-ation of photoreceptor degeneration at later diseasestages, which was not further explored in the currentwork.
The mean P3sens values of Tg rats were greater thanthose of normal rats for 6 of 7 time points tested (Fig.3F); the difference between groups of rats was statisti-cally significant (Table 1). Nonlinear regression analysisresulted in �1 of 0.56 months and �1 of 28 months(Table 2) but the later phase slope was not significantlydifferent than zero (Table 2). Greater than normalsensitivity originating at the level of rods was unex-pected as it has not been previously demonstrated inany form of outer retinal degeneration.
P2sens values of Tg rats overlapped with those ofnormal rats across the tested age range (Fig. 3F); twogroups were not significantly different (Table 1). Natu-ral history of this parameter could be described with a�1 of 0.57 months and �2 of 25 months (Table 2). Laterphase slope was not significantly different than thenormal slope (Table 2). We also determined P2thresholds using a criterion of 35 �V at 80 ms (whichapproximates the 50 �V criterion for peak amplitudeused by others; Green et al., 1991; Machida et al.,2000). Mean normal rat thresholds were −3.68 (�0.18) log scot-cd s m−2 at 1 month of age and fluctu-ated between −3.74 and −3.83 log scot-cd s m−2 overthe age range 2–18 months. Mean Tg thresholds werehigher than normal thresholds at all ages but the differ-ences did not reach statistical significance (not shown).
Assuming observed age-related decrease of P3max rep-resents rod photoreceptor degeneration, and assumingP2 component originates from activity of RB cells, therelative retention of P2max and P2sens is generally incom-patible with the current understanding of retinal signal-ing and hypothetical consequences of photoreceptor
loss (Hood & Birch, 1992). We derived a model ofretinal circuitry in order to quantitatively estimate theextent of RB function retention in rat ERGs.
3.3. Estimate of RB sensiti�ity based on a model ofdistal RB-pathway connecti�ity and signaling
RB-pathway is a stereotypical circuit used by mostmammals to convey rod signals to ganglion cells atscotopic (�1 isomerization per rod per integrationtime) light levels (Smith, Freed, & Sterling, 1986). Thedistal components of the RB-pathway include rods,RBs and horizontal cells; the more proximal compo-nents include amacrine cells, cone bipolars and gan-glion cells. For the current model, we consider theactivity of the rods and RB cells and the synapticconnections between them. RBs sum the signals fromrods within their dendritic fields along both convergentand divergent pathways. We consider only patches ofretina (wider than the dendritic field extent) where rodsand RBs are homogeneously distributed on squaregrids of two parallel planes to simplify schematics.Plausible values for convergence (18:1), divergence(1:2), rod (202,500 mm−2) and RB (22,500 mm−2)densities are used for schematics (Fig. 4) based on rator mouse data (for example, Cone, 1963; Boycott &Dowling, 1969; Grunert & Martin, 1991; Euler &Wassle, 1995; Jansen, Hawkins, & Sanyal, 1997; Jeon,Strettoi, & Masland, 1998; Strettoi & Pignatelli, 2000).Dendritic fields of this model have diameters of ca. 15�m, which is somewhat smaller than anatomical esti-mates in the rat (Euler & Wassle, 1995).
The model assumes that pooled activities of func-tional rods and RBs are tracked by the P3 and P2components of the ERG, respectively (Hood & Birch,1992; Pugh & Lamb, 1993; Hood & Birch, 1994; Hoodet al., 1994; Hood & Birch, 1996; Cideciyan et al.,

T.S. Aleman et al. / Vision Research 41 (2001) 2779–2797 2789
1998a; Pugh et al., 1998). The explicit purpose of themodel is to estimate the expected change in the sensitiv-ity of the functional RBs (�RBsens; prefix � is used torefer to variables specified as a fraction of an appropri-ate control condition) given a set of experimental find-ings (�P3max, �P3sens, and �P2max), and a set ofassumptions on the type of underlying degeneration.
Spatial distribution of hypothetical photoreceptor de-generations may be delimited by two extremes: ‘diffuse’loss of rods may occur due to the action of cell-au-tonomous mechanisms where loss of each cell is inde-pendent of the state of neighboring cells; ‘patchy’ lossof rods may result from non-cell-autonomous mecha-nisms. We assume that a realistic representation of roddegeneration may be more intermediate in distributionwith both diffuse and patchy components (Cideciyan etal., 1998a). A schematic example of such an intermedi-ate degeneration distribution (Fig. 4B) is provided tosupplement the theoretical analysis that will follow.
The expected change in the sensitivity of remainingfunctional RBs due to partial degeneration of rods thatwere presynaptic to these cells can be formally definedunder several simplifying assumptions. First we assumeRBs sum their inputs at the rod synapses and thus theirsensitivity is proportional to the number of functionaldendrites. RB sensitivity would also be proportional tothe dark current of each rod, which in turn, would beexpected to vary with the outer segment plasma mem-brane area. We also assume that the signal at eachsynapse is proportional to the amplification factorachieved in the corresponding ROS. Thus the RB sensi-tivity, �RBsens, as a fraction of control can be definedas:
�RBsens=�DEND ·�CNG ·�RODsens (6)
where �DEND is the fraction of control dendrites stillproviding input to functional RBs, �CNG is the frac-tion of control CNG channels on rods open in thedark, and �RODsens is the fraction of control amplifica-tion factor achieved during activation of functionalrods. �DEND can be estimated from:
�DEND=cRODF ·divergencecRBF ·convergence
(7)
where cRODF and cRBF are the numbers of func-tional rods and RBs, respectively. The ratio of conver-gence to divergence is by definition equal to the ratio ofthe number of rods to RBs in control retinas. Makingthe appropriate substitutions, we obtain:
�RBsens=�RODF ·�CNG
�RBF
·�RODsens (8)
Assuming use of appropriately saturating light energiesand stereotypy of phototransduction activation in allfunctioning rods, the right-hand side of Eq. (8) can beestimated from experimental parameters as:
�RBsens=�P3max
�P2max
·�P3sens (9)
Note that �P2max must always be equal to or greaterthan �P3max since we assume pure photoreceptor de-generation (i.e. RB cells do not independently degener-ate; they stop functioning only when all of theirpresynaptic rods degenerate). Furthermore, regionaldifferences in rod OS length is accounted for in themodel, as long as �P3max correctly represents totalfunctional CNG channels remaining in any givenregion.
3.4. Supersensiti�ity of the P2 component
In normal rats, the observed age-related decline ofP3max can be parsimoniously explained by eye growthand loss of rods accompanying senescence (for exam-ple, Lai, Jacoby, & Jonas, 1978; Katz & Robison, 1986;
Fig. 4. Schematic diagram of the model of the distal RB cell pathway.(A) Enlarged view of RB cells (larger gray empty circles) makingdendritic contact to neighboring rods (smaller gray filled circles)shown as top (left panel) and cross-sectional (right panel) views. RBcells and rods are distributed on aligned square grids of two parallelplanes. Each RB cell contacts 18 rods (convergence) and each rodreceives contact from two RB cells (divergence). (B) A representativeretinal region with pure photoreceptor degeneration. ‘Patchy’ areasare characterized by non-functional RB cells (black empty circles) dueto degeneration of all rods (black filled circles) within their dendriticfield. ‘Diffuse’ degeneration is characterized by functional RB cellslacking some of their presynaptic rods. Reduction of OS length isschematized in the crosssectional view shown below.

T.S. Aleman et al. / Vision Research 41 (2001) 2779–27972790
Fig. 5. Ratio of the measured P2 component sensitivity to thatpredicted by the model of the distal RB pathway in normal (A) andTg (B) rats as a function of age. Gray lines represent derived valuesusing the double-exponential model of natural history fit to data inFig. 3. Error bars are 95% confidence intervals.
4. Discussion
Functional consequences of senescence and degenera-tion of the rat retina were investigated with ERGs andinterpreted with a model of distal RB pathway signal-ing. Older normal rats showed two-fold greater P2sensitivity than that predicted by age-related rod loss(Fig. 5A). Tg rats could have an additional 3-foldincrease of P2 sensitivity compared to that predicted byprogressive rod degeneration; this supersensitivity origi-nated partly at the rod OS (Fig. 3F) and partly at orproximal to the rod-RB synapse (Fig. 5B). Our currentunderstanding of the cellular physiology underlyingERG components combined with previous morphologi-cal studies allows the speculation that reactive mecha-nisms at the rod-RB synapse may be providingaugmented RB cell function to compensate for partialloss of photoreceptors in rats.
4.1. Origins of P3 and P2 components of the rat ERG
Two major assumptions are made to interpret theERG results of the current work. First, we assume thatthe leading edge of the rat ERG evoked by high-energystimuli under dark-adapted conditions tracks the sup-pression of the rod circulating current summed acrossthe retina. Specifically, the saturated P3 amplitude isexpected to be proportional to the total number ofCNG channels open in the dark and the kinetics of theP3 expected to be defined by amplification achieved bythe phototransduction cascade. Theoretical and experi-mental evidence supports this first major assumption(Penn & Hagins, 1972; Breton et al., 1994; Hood &Birch, 1994; Reiser, Williams, & Pugh, 1996; Pugh etal., 1998; Robson & Frishman, 1999; Machida et al.,2000).
The second major assumption relates the P2 compo-nent of the ERG to the activity of RB cells. In thecurrent work, P2 component is defined as the differencebetween the ERG amplitude and the estimated P3amplitude at a fixed time of 80 ms following flashstimulus. The saturated P2 amplitude is expected to beproportional to the total number of functional RB cellsand the sensitivity of the P2 expected to define thesensitivity of each functional RB cell. The second majorassumption is more tenuous than the first assumptionbut considerable support is provided by recent studies(Gurevich & Slaughter, 1993; Xu & Karwoski, 1994;Robson & Frishman, 1995; Hood & Birch, 1996; Pughet al., 1998; Lei & Perlman, 1999; Shiells & Falk, 1999;Karwoski & Xu, 1999; Berntson & Taylor, 2000; Euler& Masland, 2000; Kofuji et al., 2000). It may beargued, however, that signaling by more proximal neu-rons (for example, STR-generators) contaminate thelow-intensity region of the P2 component in the rat(Bush et al., 1995; Robson & Frishman, 1995). Tell-tale
DiLoreto, Ison, Bowen, Cox, & del Cerro, 1995;Weisse, 1995; Obin et al., 2000); age-related decline ofP2max would be consequent to loss of rod input to RBcells. Were the sensitivity parameters of the ERG con-sistent with this simple hypothesis? We used the meanvalues of the relevant parameters in 1 month old nor-mal rats as ‘control’ (in Eq. (9)) to estimate the ex-pected change in RB sensitivity in older normal ratsand compared this estimate to the measured P2sens
values (Fig. 5A). Measured P2 sensitivities were mostlylarger than predicted values; the mean ratio grew from1.36 (�0.45) at 3 months to 2.13 (�0.35) at 18months. Statistical analysis showed a significant (P=0.004) difference from the theoretical value of 1.
We next determined the ratio of �P2sens to �RBsens inTg rats. For each age, the mean value of ERG parame-ters in age-matched normal rats was used as ‘control’(in Eq. (9)) with one exception; mean values of 5month-old normal rats were used as control for 7month-old Tg rat results. On the average, Tg rats hadgreater �P2sens than that predicted by the model at allages (Fig. 5B); the mean ratio grew from 1.12 (�0.13)at 3 months to 1.71 (�0.47) at 13 months. Statisticalanalysis showed a significant (P=0.0005) differencefrom the theoretical value of 1.

T.S. Aleman et al. / Vision Research 41 (2001) 2779–2797 2791
signs of STR (negative responses below the b-wavethreshold) were not observed in our experiments; thiswas probably due to protocol difference (Bush et al.,1995; Frishman & Sieving, 1995; Hood & Birch, 1996)and the longer latency of the STR component com-pared to the 80 ms time chosen for P2 analysis. Fur-thermore, we did not observe major deviations of P2amplitude from linearity. Linearity has been taken asevidence of a dominant RB component within the P2response (Robson & Frishman, 1995; Hood & Birch,1996) since signals originating at neurons proximal toRB cells have been shown to disturb this linearity(Robson & Frishman, 1995, 1999). Our results showinga high correlation (intercept= −11.5 �V, slope=0.999, r2=0.89) between saturated P2 amplitudes esti-mated at two intensities (−1.2 and +2.2 log scot-cd sm−2) would provide further support to our assumptionthat a single neuronal signal, RB cell activity, was thedominant contributor to the P2 component in the rat.Nevertheless, future studies involving direct measure-ment of RB activity are of course needed to confirm theindirect ERG findings of the current work.
4.2. Normal aging of the rat retina
Saturated P3 amplitudes of older (18 months) ratswere ca. 60% of the value of younger adult (3 months)rats. Age-related loss of rod photoreceptors in the ratretina could be a likely explanation for this reduction(Lai et al., 1978; Katz & Robison, 1986; DiLoreto etal., 1995; Weisse, 1995; Obin et al., 2000). The extent ofthis loss, especially in albino rats, is strongly related tothe light-rearing history of the animals (for example,Lai et al., 1978); the relatively small age-related loss ofP3 amplitude observed in the current work is consistentwith the relatively dim-light rearing environment used.The sensitivity of the rat P3 component was invariantwith age and translated to an amplification factor of ca.5 s−2 similar to that reported in other mammals (Pugh& Lamb, 1993). P2 component function in albino ratsdid not follow the age-related decline of P3 functionand showed a relative retention; P2 saturated amplitudeat 18 months was ca. 80% of the value of 3 months andP2 sensitivity increased significantly over this period.We questioned whether a certain spatial distribution ofrod loss could account for this combination of physio-logical results. Our model of distal RB pathway con-nectivity was not consistent with this hypothesis. Analternative hypothesis involving age-related loss of RBcells (in addition to rods) would also not explain theERG results since it would predict a further increase inthe magnitude of the unaccounted post-receptoral sen-sitivity. Age-related growth of the globe would be ex-pected to affect P3 and P2 components equally andthus does not explain the relative retention of the P2function. Differential changes of interstitial conductiv-
ity at the photoreceptor versus bipolar layer with agecould conceivably account for the apparent retention ofP2 function but experimental results supporting such ahypothesis are currently lacking. Another possibility isthe existence of an active mechanism that compensatesfor partial rod loss in aging normal rats by increasingthe sensitivity of ERG P2 component. If this hypothesisis valid, it could also apply to degenerative rod loss inthe Tg rats.
4.3. Pathophysiology of Tg rats
The most unexpected ERG finding in Tg rats was thesupersensitivity of the P3 component. Previously, rod-isolated P3 component sensitivity has been reported tobe normal or subnormal in hereditary retinal degenera-tions of humans (Hood & Birch, 1994; Jacobson et al.,1994; Birch et al., 1995; Jacobson, Cideciyan, Kemp,Sheffield, & Stone, 1996; Cideciyan et al., 1998a; Cide-ciyan, 2000; Jacobson et al., 2000), mice (Goto et al.,1996; Cheng et al., 1997; Kedzierski, Lloyd, Birch, Bok,& Travis, 1997) and rats (Machida et al., 2000). Anormal P3 sensitivity with shortened rod OS lengthwould have been consistent with theoretical consider-ations that predict an increase in the amplificationconstant (Pugh & Lamb, 1993) and a decrease in num-ber of photoisomerizations produced for a given levelof retinal illuminance (Breton et al., 1994). Experimen-tal results in isolated rat retinas with differing OSlengths have not conflicted with such theoretical consid-erations (Reiser et al., 1996) although these two factorsmay not necessarily be balanced. A subnormal P3sensitivity would have suggested dysfunction of activa-tion mechanisms within rod OS.
Greater than normal P3 sensitivity observed in Tgrats would be consistent with an apparent accelerationof phototransduction activation. This is especially sur-prising since it is well established that the Tg rat rodshave abnormally shortened OS length (Lewin et al.,1998; LaVail et al., 2000; Machida et al., 2000). Severalhypotheses can be raised for the apparent accelerationof activation within these short OS. Gradient of lightresponsiveness has been demonstrated to exist along thelength of amphibian OS (for example, Schnapf, 1983;Bandarchi & Leibovic, 1997). If such gradients exist inmammalian rods, shorter rod OS of Tg rats may havebiochemical properties more similar to basal end ofnormal rod OS. The basis of this gradient may involvethe age of disks; abnormalities in renewal mechanisms(Liu et al., 1997) could hypothetically change the agegradient of disks along the rod OS of Tg rats. Alterna-tively, the supersensitivity could involve increased pho-toisomerizations produced for a given level ofilluminance. Overexpression of rhodopsin in these Tganimals could theoretically account for greater photonabsorption as long as the mutant rhodopsin is effi-

T.S. Aleman et al. / Vision Research 41 (2001) 2779–27972792
ciently activated by light; consistent with this hypothe-sis are transgenic mice that have previously shown asmall but significant supersensitivity at the single celllevel (Sung, Makino, Bayler, & Nathans, 1994). On theother hand, transgenic VPP mice (carrying a P23Hrhodopsin mutation and thus closely approximating theTg rats in the current study) have shown no evidence ofrod photoreceptor supersensitivity (Goto et al., 1996;Wu et al., 1998). Although overexpression of normalbovine opsin has been shown to cause photoreceptordegeneration in transgenic mice, sensitivity measureshave not been reported (Tan et al., 2001). Interestingly,a reduction in rhodopsin expression can reduce pho-toisomerizations but speed up phototransduction acti-vation (Calvert et al., 2001). Effects of self-screening(Baylor & Lamb, 1982; Alpern, Fulton, & Baker, 1987;Makino, Howard, & Williams, 1987) could also con-ceivably account for the supersensitivity in shortenedrod OS. Our preliminary results set the stage for furtherexperiments that can eliminate some of these manyalternatives.
The most immediately recognizable feature (that didnot require special analyses) of a typical Tg rat ERGwas a small a-wave and a large b-wave (Fig. 2). Quan-titative analyses showed normal or near-normal P2amplitude and sensitivity associated with large reduc-tions with P3 amplitudes. The ratio of P2 to P3 ampli-tude was ca. three times greater than normal.Application of a model of distal RB pathway signalingshowed that the supersensitivity of the P3 componentonly partially accounted for the observed P2 results andsuggested the existence of an additional compensatorymechanism acting to augment post-receptoral functionin Tg rats; parsimony would dictate this mechanism tobe similar to that seen in aging normal rats.
4.4. Interpretation of ERG results with models ofretinal connecti�ity and signaling
To our knowledge, three models have been previ-ously used to interpret experimentally measuredchanges in P3 and P2 components of the rod-isolatedERG in terms of the underlying pathophysiology(Hood & Birch, 1992; Hood et al., 1994; Cideciyan etal., 1998a); all three models have been applied only tohuman ERG data from normal subjects and patientswith hereditary retinal degenerations. The model devel-oped in the current work follows the theoretical frame-work provided by Hood and Birch, i.e. rod-isolatedERG consists of the linear summation of P3 and P2components. A significant difference between the cur-rent model and that of Hood and Birch is the range oftemporal validity. Hood and Birch use a dynamicmodel of the P2 component that attempts to describethe full ERG waveform and is specifically optimized todescribe trough-to-peak (time-variant) P2 component
amplitude and timing data from human ERGs. Thecorrespondence between the model and measured datamay not be close at any given fixed time. Current modeluses a simpler static model of the P2 component thatdescribes the measured amplitude data very well at thefixed time chosen. Our choice of the static model wasbased on recent results suggesting easier interpretationof amplitudes measured at a fixed time on the leadingedge of the ERG b-wave (Robson & Frishman, 1995,1999).
It has been previously shown that when there arelarge regional variations of photoreceptor sensitivityand appropriately saturating stimulus intensities cannotbe used due to technical limitations, assumption of ahomogeneous degenerative process across the retinacan lead to wrong inferences about the underlyingpathophysiology (Hood et al., 1993, 1994). In the cur-rent work, both P3 and P2 components did not showevidence of lack of saturation. Specifically for example,the implicit time of the maximal a-wave in Tg rats wasequal or shorter than that in normal rats. If we canassume that P3 component of normal rats was satu-rated, then we have to assume that Tg rat results werealso saturated. The close correspondence of saturatedP2 amplitudes across a 3 log unit stimulus range allowsa similar argument for the P2 component.
The model of distal RB pathway connectivity andsignaling developed in the current work provides asimple analytical expression (Eq. (9)) for the expectedchange of RB cell sensitivity as a function of changes inreceptor sensitivity, receptor CNG channels and RBnumber estimated from appropriately recorded ERGparameters. The model is independent from the specificspatial pattern of photoreceptor degeneration based onrecent work suggesting the existence of both ‘patchy’and ‘diffuse’ components to some rhodopsin-associatedhuman retinal degenerations (Cideciyan et al., 1998a).Previous simulations have considered the relationshipbetween P2 and P3 amplitudes in humans but the effectof P2 and P3 sensitivities have not been evaluated(Cideciyan et al., 1998a).
4.5. The basis of the post-receptoral compensatorymechanism
Augmented post-receptoral function may not be spe-cific to the aging normal and Tg rats considered in thecurrent study. ERG analyses of mice with slow retinaldegeneration caused by rds mutations (Kedzierski et al.,1997), rats with mild and moderate light damage(Noell, 1980; Sugawara et al., 2000) and two lines oftransgenic rats (Machida et al., 2000) have also shownrelative preservation of post-receptoral function.Anatomical studies (performed independently) in someof these animal models of partial photoreceptor losshave provided clues to the basis of this presumably
T.S. Aleman et al. / Vision Research 41 (2001) 2779–2797 2793
common compensatory mechanism. Specifically, dra-matic increases have been observed in the number ofrod terminals showing multiple synaptic ribbons innormal aging of mice, rds homozygous and het-erozygous mutant mice, chimaeric mice of rd and wild-type combination and albino mice exposed to constantlight (Jansen & Sanyal, 1987, 1992; Sanyal, Hawkins,Jansen, & Zeilmaker, 1992; Jansen et al., 1997). Three-dimensional reconstruction has shown that this prolifer-ation of synaptic sites occurs through sprouting fromthe processes already present within the terminals(Jansen et al., 1997). The existence of similar synapticchanges in Tg rats remains to be proven in futurestudies.
What would be the physiological consequences ofreactive changes occurring at the rod synapses? It iswell established that a tonically active inward current isshut off by light and glutamate, in rods and RB cells,respectively (Nawy & Jahr, 1990; Robson & Frishman,1995). In darkness, glutamate levels in the rod-RBsynapse are high and cation channels of RB cells areclosed. Light-induced shut-off of rod photoreceptorcation channels decreases glutamate release at thesynapse and opens the cation channels of RB cells. Asimple analysis would argue that two synaptic ribbonsat each dendrite would effectively double the synapticgain within the linear range. More elaborate analyses(see for example, van Rossum & Smith, 1998) arebeyond the scope of the current work.
If one accepts the view that mammalian retina doespossess structural plasticity at the first synapse of thevisual system, it is not unreasonable to hypothesize thatsimilar changes may also occur at more proximalsynapses. It has been reported, for example, that eleva-tion of b-wave thresholds can be significantly greaterthan the elevations in STR threshold in RCS (Bush etal., 1995) and light damaged rats (Sugawara et al.,2000). Similarly, young Labrador retriever dogs ho-mozygous and heterozygous for late onset rod-conedegeneration can show normal STR signals at a timewhen they have dramatically abnormal ERG b-waves(Kommonen, Kylma, Karhunen, Dawson, & Penn,1997). These results could represent functional corre-lates of reactive changes occurring at the inner plexi-form layer under the assumption that STR generatorsare more proximal to the P2 generators.
It is well accepted that cell-cell interactions are re-quired for the viability of neurons in the retina, and asa consequence, a primary insult to a specific photore-ceptor population can induce secondary changes inneighboring or connected neurons. There have beenseveral examples where degeneration of rods causessynaptic abnormalities (for example, Blanks, Adinolfi,& Lolley, 1974; Nomura et al., 1994; Li et al., 1998b;Strettoi & Pignatelli, 2000) and exaggerates the visualdeficit from the primary pathology. The current study
focused on the opposite effect: compensatory synapto-genesis in reaction to partial loss of rods. The degree ofvisual benefit resulting from this presumably self-pro-tective mechanism may be expected to depend on thespecies, the synapse, the trophic interactions of the cellsinvolved, as well as the type, extent and natural historyof the primary insult. If reactive synaptogenesis is alsooccurring in human retinal degenerations, currentmethods of monitoring natural history of disease andplanned therapies may require careful reconsideration.
Acknowledgements
We thank Robert G. Smith for helpful commentsand discussions. Mequi Jiang, Jiancheng Huang andErica Dale provided valuable help with the studies.Supported by the Foundation Fighting Blindness, In-corporated, National Institutes of Health (EY-05627,-13203, -01919, -06842, -01583), The F.M. Kirby Foun-dation and the Mackall Trust. MML and SGJ areResearch to Prevent Blindness Senior Scientific Investi-gators. AVC is a Research to Prevent BlindnessWilliam and Mary Greve Scholar.
References
Alpern, M., Fulton, A. B., & Baker, B. N. (1987). ’Self-screening’ ofrhodopsin in rod outer segments. Vision Research, 27, 1459–1470.
Ashmore, J. F., & Falk, G. (1980). Responses of rod bipolar cells inthe dark-adapted retina of the dogfish, Scyliorhinus canicula.Journal of Physiology, 300, 115–150.
Bandarchi, J., & Leibovic, K. N. (1997). Effects of animal age on theresponses along the outer segment of retinal rod photoreceptors.Neuroreport, 8, 581–585.
Banin, E., Cideciyan, A. V., Aleman, T. S., Petters, R. M., Wong, F.,Milam, A. H., & Jacobson, S. G. (1999). Retinal rod photorecep-tor-specific gene mutation perturbs cone pathway development.Neuron, 23, 549–557.
Baylor, D. A., & Lamb, T. D. (1982). Local effects of bleaching inretinal rods of the toad. Journal of Physiology, 328, 49–71.
Berntson, A., & Taylor, W. R. (2000). Response characteristics andreceptive field widths of on-bipolar cells in the mouse retina.Journal of Physiology, 524, 879–889.
Berson, E. L., Sandberg, M. A., Rosner, B., Birch, D. G., & Hanson,A. H. (1985). Natural course of retinitis pigmentosa over athree-year interval. American Journal of Ophthalmology, 99, 240–251.
Birch, D. G., Hood, D. C., Nusinowitz, S., & Pepperberg, D. R.(1995). Abnormal activation and inactivation mechanisms of rodtransduction in patients with autosomal dominant retinitis pig-mentosa and the pro-23-his mutation. In�estigati�e Ophthalmologyand Visual Science, 36, 1603–1614.
Birch, D. G., Anderson, J. L., & Fish, G. E. (1999). Yearly rates ofrod and cone functional loss in retinitis pigmentosa and cone-roddystrophy. Ophthalmology, 106, 258–268.
Blanks, J. C., Adinolfi, A. M., & Lolley, R. N. (1974). Photoreceptordegeneration and synaptogenesis in retinal-degenerative (rd) mice.Journal of Comparati�e Neurology, 156, 95–106.

T.S. Aleman et al. / Vision Research 41 (2001) 2779–27972794
Blackmon, S. M., Peng, Y.-W., Hao, Y., Moon, S. J., Oliveira, L. B.,Tatebayashi, M., Petters, R. M., & Wong, F. (2000). Early loss ofsynaptic protein PSD-95 from rod terminals of rhodopsin P347Ltransgenic porcine retina. Brain Research, 885, 53–61.
Boycott, B. B., & Dowling, J. E. (1969). Organization of the primateretina: light microscopy. Philosophical Transactions of the RoyalSociety London B, 799, 109–194.
Breton, M. E., Schueller, A. W., Lamb, T. D., & Pugh, E. N. Jr(1994). Analysis of ERG a-wave amplification and kinetics interms of the G-protein cascade of phototransduction. In�estigati�eOphthalmology and Visual Science, 35, 295–309.
Bush, R. A., Hawks, K. W., & Sieving, P. A. (1995). Preservation ofinner retinal responses in the aged Royal College of Surgeons rat.Evidence against glutamate excitotoxicity in photoreceptor degen-eration. In�estigati�e Ophthalmology and Visual Science, 36, 2054–2062.
Calderone, L., Grimes, P., & Shalev, M. (1986). Acute reversiblecataract induced by xylazine and by ketamine–xylazine anesthesiain rats and mice. Experimental Eye Research, 42, 331–337.
Calvert, P. D., Govardovskii, V. I., Krasnoperova, N., Anderson, R.E., Lem, J., & Makino, C. L. (2001). Membrane protein diffusionsets the speed of rod phototransduction. Nature, 411, 90–94.
Chang, G. Q., Hao, Y., & Wong, F. (1993). Apoptosis: final commonpathway of photoreceptor death in rd, rds, and rhodopsin mutantmice. Neuron, 11, 595–605.
Chen, C. K., Burns, M. E., Spencer, M., Niemi, G. A., Chen, J.,Hurley, J. B., Baylor, D. A., & Simon, M. I. (1999). Abnormalphotoresponses and light-induced apoptosis in rods lackingrhodopsin kinase. Proceedings of the National Academy of Sci-ences USA, 96, 3718–3722.
Chen, J., Makino, C. L., Peachey, N. S., Baylor, D. A., & Simon, M.I. (1995). Mechanisms of rhodopsin inactivation in vivo as re-vealed by a COOH-terminal truncation mutant. Science, 267,374–377.
Cheng, T., Peachey, N. S., Li, S., Goto, Y., Cao, Y., & Naash, M. I.(1997). The effect of peripherin/rds haploinsufficiency on rod andcone photoreceptors. Journal of Neuroscience, 17, 8118–8128.
Cideciyan, A. V. (2000). In vivo assessment of photoreceptor functionin human diseases caused by photoreceptor-specific gene muta-tions. Methods in Enzymology, 316, 611–626.
Cideciyan, A. V., & Jacobson, S. G. (1993). Negative electroretino-grams in retinitis pigmentosa. In�estigati�e Ophthalmology andVisual Science, 34, 3253–3263.
Cideciyan, A. V., & Jacobson, S. G. (1996). An alternative photo-transduction model for human rod and cone ERG a-waves:normal parameters and variation with age. Vision Research, 36,2609–2621.
Cideciyan, A. V., Hood, D. C., Huang, Y., Banin, E., Li, Z. Y.,Stone, E. M., Milam, A. H., & Jacobson, S. G. (1998a). Diseasesequence from mutant rhodopsin allele to rod and cone photore-ceptor degeneration in man. Proceedings of the National Academyof Sciences USA, 95, 7103–7108.
Cideciyan, A. V., Zhao, X., Nielsen, L., Khani, S. C., Jacobson, S.G., & Palczewski, K. (1998b). Null mutation in the rhodopsinkinase gene slows recovery kinetics of rod and cone phototrans-duction in man. Proceedings of the National Academy of SciencesUSA, 95, 328–333.
Cideciyan, A. V., Aleman, T. S., Jiang, M., Montemayor, R., Wen,R., Laties, A. M., LaVail, M. M., & Jacobson, S. G. (1999a).Early mechanism of rod dysfunction in the rhodopsin P23Htransgenic rat model of retinitis pigmentosa. In�estigati�e Oph-thalmology and Visual Science (Supplement), 40, S24 (Abstract).
Cideciyan, A. V., Aleman, T. S., Bennett, J., & Banin, E. (1999b).Comparative study of mammalian phototransduction in vivo: aprelude to preclinical treatment trials in retinal degenerations. InVision science and its applications (pp. 60–63). Washington, DC:OSA Technical Digest, Optical Society of America.
Clarke, G., Heon, E., & McInnes, R. R. (2000a). Recent advances inthe molecular basis of inherited photoreceptor degeneration. Clin-ical Genetics, 57, 313–329.
Clarke, G., Collins, R. A., Leavitt, B. R., Andrews, D. F., Hayden,M. R., Lumsden, C. J., & McInnes, R. R. (2000b). A one-hitmodel of cell death in inherited neuronal degenerations. Nature,406, 195–199.
Cone, R. A. (1963). Quantum relations of the rat electroretinogram.Journal of General Physiology, 46, 1267–1286.
Cotman, C. W., & Nieto-Sampedro, M. (1984). Cell biology ofsynaptic plasticity. Science, 225, 1287–1294.
Cowan, W. M. (1970). Anterograde and retrograde transneuronaldegeneration in the central and peripheral nervous system. In W.J. Nauta, & S. O. E. Ebbesson, Contemporary research methods inneuroanatomy (pp. 217–251). New York: Springer.
Deegan, J. F. II, & Jacobs, G. H. (1993). On the identity of the conetypes of the rat retina. Experimental Eye Research, 56, 375–377.
DiLoreto, D. Jr, Ison, J. R., Bowen, G. P., Cox, C., & del Cerro, M.(1995). A functional analysis of the age-related degeneration inthe Fischer 344 rat. Current Eye Research, 14, 303–310.
Dryja, T. P., McGee, T. L., Reichel, E., Hahn, L. B., Cowley, G. S.,Yandell, D. W., Sandberg, M. A., & Berson, E. L. (1990). A pointmutation of the rhodopsin gene in one form of retinitis pigmen-tosa. Nature, 343, 364–366.
Euler, T., & Masland, R. H. (2000). Light-evoked responses ofbipolar cells in a mammalian retina. Journal of Neurophysiology,83, 1817–1829.
Euler, T., & Wassle, H. (1995). Immunocytochemical identification ofcone bipolar cells in the rat retina. Journal of Comparati�e Neurol-ogy, 361, 461–478.
Fariss, R. N., Li, Z. Y., & Milam, A. H. (2000). Abnormalities in rodphotoreceptors, amacrine cells, and horizontal cells in humanretinas with retinitis pigmentosa. American Journal of Ophthal-mology, 129, 215–223.
Frishman, L. J., & Sieving, P. A. (1995). Evidence for two sites ofadaptation affecting the dark-adapted ERG of cats and primates.Vision Research, 35, 435–442.
Fulton, A. B., Hansen, R. M., & Findl, O. (1995). The developmentof the rod photoresponse from dark-adapted rats. In�estigati�eOphthalmology and Visual Science, 36, 1038–1045.
Gal, A., Apfelstedt-Sylla, E., Janecke, A. R., & Zrenner, E. (1997).Rhodopsin mutations in inherited retinal dystrophies and dys-functions. Progress in Retinal and Eye Research, 16, 51–79.
Goto, Y., Peachey, N. S., Ziroli, N. E., Seiple, W. H., Gryczan, C.,Pepperberg, D. R., & Naash, M. I. (1996). Rod phototransduc-tion in transgenic mice expressing a mutant opsin gene. Journal ofthe Optical Society of America A, 13, 577–585.
Granit, R. (1933). The components of the retinal action potential inmammals and their relation to the discharge in the optic nerve.Journal of Physiology, 77, 207–239.
Green, D. G., Herreros de Tejada, P., & Glover, M. J. (1991). Arealbino rats night blind? In�estigati�e Ophthalmology and VisualScience, 32, 2366–2371.
Grunert, U., & Martin, P. R. (1991). Rod bipolar cells in themacaque monkey retina: immunoreactivity and connectivity.Journal of Neuroscience, 11, 2742–2758.
Gurevich, L., & Slaughter, M. M. (1993). Comparison of the wave-forms of the ON bipolar neuron and the b-wave of the elec-troretinogram. Vision Research, 33, 2431–2435.
Hetling, J. R., & Pepperberg, D. R. (1999). Sensitivity and kinetics ofmouse rod flash responses determined in vivo from paired-flashelectroretinograms. Journal of Physiology, 516, 593–609.
Hood, D. C., & Birch, D. G. (1992). A computational model of theamplitude and implicit time of the b-wave of the human ERG.Visual Neuroscience, 8, 107–126.
Hood, D. C., & Birch, D. G. (1994). Rod phototransduction inretinitis pigmentosa: estimation and interpretation of parameters
T.S. Aleman et al. / Vision Research 41 (2001) 2779–2797 2795
derived from the rod a-wave. In�estigati�e Ophthalmology andVisual Science, 35, 2948–2961.
Hood, D. C., & Birch, D. G. (1996). B-wave of the scotopic (rod)electroretinogram as a measure of the activity of human on-bipo-lar cells. Journal of the Optical Society of America A, 13, 623–633.
Hood, D. C., & Greenstein, V. (1990). Models of the normal andabnormal rod system. Vision Research, 30, 51–68.
Hood, D. C., Shady, S., & Birch, D. G. (1993). Heterogeneity inretinal disease and the computational model of the human-rodresponse. Journal of the Optical Society of America A, 10, 1624–1630.
Hood, D. C., Shady, S., & Birch, D. G. (1994). Understandingchanges in the b-wave of the ERG caused by heterogeneousreceptor damage. In�estigati�e Ophthalmology and Visual Science,35, 2477–2488.
Humphries, M. M., Rancourt, D., Farrar, G. J., Kenna, P., Hazel,M., Bush, R. A., Sieving, P. A., Sheils, D. M., McNally, N.,Creighton, P., Erven, A., Boros, A., Gulya, K., Capecchi, M. R.,& Humphries, P. (1997). Retinopathy induced in mice by targeteddisruption of the rhodopsin gene. Nature Genetics, 15, 216–219.
Jacobson, S. G., Kemp, C. M., Sung, C. H., & Nathans, J. (1991).Retinal function and rhodopsin levels in autosomal dominantretinitis pigmentosa with rhodopsin mutations. American Journalof Ophthalmology, 112, 256–271.
Jacobson, S. G., Kemp, C. M., Cideciyan, A. V., Macke, J. P., Sung,C. H., & Nathans, J. (1994). Phenotypes of stop codon and splicesite rhodopsin mutations causing retinitis pigmentosa. In�estiga-ti�e Ophthalmology and Visual Science, 35, 2521–2534.
Jacobson, S. G., Cideciyan, A. V., Kemp, C. M., Sheffield, V. C., &Stone, E. M. (1996). Photoreceptor function in heterozygotes withinsertion or deletion mutations in the RDS gene. In�estigati�eOphthalmology and Visual Science, 37, 1662–1674.
Jacobson, S. G., Cideciyan, A. V., Iannaccone, A., Weleber, R. G.,Fishman, G. A., Maguire, A. M., Affatigato, L. M., Bennett, J.,Pierce, E. A., Danciger, M., Farber, D. B., & Stone, E. M. (2000).Disease expression of RP1 mutations causing autosomal domi-nant retinitis pigmentosa. In�estigati�e Ophthalmology and VisualScience, 41, 1898–1908.
Jansen, H. G., & Sanyal, S. (1987). Synaptic changes in the terminalsof rod photoreceptors of albino mice after partial visual cell lossinduced by brief exposure to constant light. Cell and TissueResearch, 250, 43–52.
Jansen, H. G., & Sanyal, S. (1992). Synaptic plasticity in the rodterminals after partial photoreceptor cell loss in the heterozygousrds mutant mouse. Journal of Comparati�e Neurology, 316, 117–125.
Jansen, H. G., Hawkins, R. K., & Sanyal, S. (1997). Synaptic growthin the rod terminals of mice after partial photoreceptor cell loss:a three-dimensional ultrastructural study. Microscopy Researchand Technique, 36, 96–105.
Jeon, C. J., Strettoi, E., & Masland, R. H. (1998). The major cellpopulations of the mouse retina. Journal of Neuroscience, 18,8936–8946.
Karwoski, C. J., & Xu, X. (1999). Current source-density analysis oflight-evoked field potentials in rabbit retina. Visual Neuroscience,16, 369–377.
Katz, M. L., & Robison, W. G. Jr (1986). Evidence of cell loss fromthe rat retina during senescence. Experimental Eye Research, 42,293–304.
Kedzierski, W., Lloyd, M., Birch, D. G., Bok, D., & Travis, G. H.(1997). Generation and analysis of transgenic mice expressingP216L-substituted rds/peripherin in rod photoreceptors. In�estiga-ti�e Ophthalmology and Visual Science, 38, 498–509.
Kemp, C. M., Jacobson, S. G., Roman, A. J., Sung, C. H., &Nathans, J. (1992). Abnormal rod dark adaptation in autosomaldominant retinitis pigmentosa with proline-23-histidine rhodopsinmutation. American Journal of Ophthalmology, 113, 165–174.
Kofuji, P., Ceelen, P., Zahs, K. R., Surbeck, L. W., Lester, H. A., &Newman, E. A. (2000). Genetic inactivation of an inwardlyrectifying potassium channel (Kir4.1 subunit) in mice: phenotypicimpact in retina. Journal of Neuroscience, 20, 5733–5740.
Kolb, H., & Gouras, P. (1974). Electron microscopic observations ofhuman retinitis pigmentosa, dominantly inherited. In�estigati�eOphthalmology, 13, 487–498.
Kommonen, B., Kylma, T., Karhunen, U., Dawson, W. W., & Penn,J. S. (1997). Impaired retinal function in young labrador retrieverdogs heterozygous for late onset rod–cone degeneration. VisionResearch, 37, 365–370.
Lai, Y. L., Jacoby, R. O., & Jonas, A. M. (1978). Age-related andlight-associated retinal changes in Fischer rats. In�estigati�e Oph-thalmology and Visual Science, 17, 634–638.
Lamb, T. D., & Pugh, E. N. Jr (1992). A quantitative account of theactivation steps involved in phototransduction in amphibian pho-toreceptors. Journal of Physiology, 449, 719–758.
Lei, B., & Perlman, I. (1999). The contributions of voltage- andtime-dependent potassium conductances to the electroretinogramin rabbits. Visual Neuroscience, 16, 743–754.
LaVail, M. M., Yasumura, D., Matthes, M. T., Drenser, K. A.,Flannery, J. G., Lewin, A. S., & Hauswirth, W. W. (2000).Ribozyme rescue of photoreceptor cells in P23H transgenic rats:long-term survival and late-stage therapy. Proceedings of theNational Academy of Sciences USA, 97, 11488–11493.
Lewin, A. S., Drenser, K. A., Hauswirth, W. W., Nishikawa, S.,Yasumura, D., Flannery, J. G., & LaVail, M. M. (1998). Ri-bozyme rescue of photoreceptor cells in a transgenic rat model ofautosomal dominant retinitis pigmentosa. Nature Medicine, 4,967–971.
Li, T., Snyder, W. K., Olsson, J. E., & Dryja, T. P. (1996). Trans-genic mice carrying the dominant rhodopsin mutation P347S:evidence for defective vectorial transport of rhodopsin to theouter segments. Proceedings of the National Academy of SciencesUSA, 93, 14176–14181.
Li, T., Sandberg, M. A., Pawlyk, B. S., Rosner, B., Hayes, K. C.,Dryja, T. P., & Berson, E. L. (1998a). Effect of vitamin Asupplementation on rhodopsin mutants threonine-17 �methionine and proline-347 � serine in transgenic mice and in
cell cultures. Proceedings of the National Academy of SciencesUSA, 95, 11933–11938.
Li, Z. Y., Jacobson, S. G., & Milam, A. H. (1994). Autosomaldominant retinitis pigmentosa caused by the threonine-17-me-thionine rhodopsin mutation: retinal histopathology and immuno-cytochemistry. Experimental Eye Research, 58, 397–408.
Li, Z. Y., Kljavin, I. J., & Milam, A. H. (1995). Rod photoreceptorneurite sprouting in retinitis pigmentosa. Journal of Neuroscience,15, 5429–5438.
Li, Z. Y., Wong, F., Chang, J. H., Possin, D. E., Hao, Y., Petters, R.M., & Milam, A. H. (1998b). Rhodopsin transgenic pigs as amodel for human retinitis pigmentosa. In�estigati�e Ophthalmol-ogy and Visual Science, 39, 808–819.
Littell, R. C., Milliken, G. A., Stroup, W. W., & Wolfinger, R. D.(1996). SAS system for mixed models. Cary, NC: SAS InstituteIncorporated.
Liu, X., Wu, T. H., Stowe, S., Matsushita, A., Arikawa, K., Naash,M. I., & Williams, D. S. (1997). Defective phototransductive diskmembrane morphogenesis in transgenic mice expressing opsinwith a mutated N-terminal domain. Journal of Cell Science, 110,2589–2597.
Lyubarsky, A. L., Falsini, B., Pennesi, M. E., Valentini, P., & Pugh,E. N. Jr (1999). UV- and midwave-sensitive cone-driven retinalresponses of the mouse: a possible phenotype for coexpression ofcone photopigments. Journal of Neuroscience, 19, 442–455.
Lyubarsky, A. L., Chen, C., Simon, M. I., & Pugh, E. N. (2000).Mice lacking G-protein receptor kinase 1 have profoundly slowedrecovery of cone-driven retinal responses. Journal of Neuroscience,20, 2209–2217.

T.S. Aleman et al. / Vision Research 41 (2001) 2779–27972796
Machida, S., Kondo, M., Jamison, J. A., Khan, N. W., Kononen, L.T., Sugawara, T., Bush, R. A., & Sieving, P. A. (2000). P23HRhodopsin transgenic rat: correlation of retinal function withhistopathology. In�estigati�e Ophthalmology and Visual Science, 41,3200–3209.
Makino, C. L., Howard, L. N., & Williams, T. P. (1987). Intracellulartopography of rhodopsin bleaching. Science, 238, 1716–1717.
Massof, R. W., & Finkelstein, D. (1987). A two-stage hypothesis forthe natural course of retinitis pigmentosa. In E. Zrenner, H. Krastel,& H.-H. Goebel, Research in retinitis pigmentosa (pp. 29–58).Oxford: Pergamon Press.
Milam, A. H., Li, Z. Y., Cideciyan, A. V., & Jacobson, S. G. (1996).Clinicopathologic effects of the Q64ter rhodopsin mutation inretinitis pigmentosa. In�estigati�e Ophthalmology and Visual Sci-ence, 37, 753–765.
Naarendorp, F., & Williams, G. E. (1999). The d-wave of the rodelectroretinogram of rat originates in the cone pathway. VisualNeuroscience, 16, 91–105.
Naash, M. I., Hollyfield, J. G., al-Ubaidi, M. R., & Baehr, W. (1993).Simulation of human autosomal dominant retinitis pigmentosa intransgenic mice expressing a mutated murine opsin gene. Proceed-ings of the National Academy of Sciences USA, 90, 5499–5503.
Nawy, S., & Jahr, C. E. (1990). Suppression by glutamate of cGMP-ac-tivated conductance in retinal bipolar cells. Nature, 346, 269–271.
Noell, W. K. (1980). There are different kinds of retinal light damagein the rat. In T. P. Williams, & B. N. Baker, The effect of constantlight on �isual processes (pp. 3–28). New York: Plenum.
Nomura, A., Shigemoto, R., Nakamura, Y., Okamoto, N., Mizuno,N., & Nakanishi, S. (1994). Developmentally regulated postsynap-tic localization of a metabotropic glutamate receptor in rat rodbipolar cells. Cell, 77, 361–369.
Nusinowitz, S., Azimi, A., & Heckenlively, J. R. (2000). Adaptation,body temperature, pupil size, and anesthetic effects on the elec-troretinogram (ERG) in mice. In�estigati�e Ophthalmology andVisual Science (Supplement), 41, S495 (Abstract).
Obin, M., Pike, A., Halbleib, M., Lipman, R., Taylor, A., & Bronson,R. (2000). Calorie restriction modulates age-dependent changes inthe retinas of Brown Norway rats. Mechamisms of Ageing andDe�elopment, 114, 133–147.
Olsson, J. E., Gordon, J. W., Pawlyk, B. S., Roof, D., Hayes, A.,Molday, R. S., Mukai, S., Cowley, G. S., Berson, E. L., & Dryja,T. P. (1992). Transgenic mice with a rhodopsin mutation(Pro23His): a mouse model of autosomal dominant retinitis pig-mentosa. Neuron, 9, 815–830.
Organisciak, D. T., Darrow, R. M., Barsalou, L., Darrow, R. A.,Kutty, R. K., Kutty, G., & Wiggert, B. (1998). Light history andage-related changes in retinal light damage. In�estigati�e Ophthal-mology and Visual Science, 39, 1107–1116.
Peng, Y. W., Hao, Y., Petters, R. M., & Wong, F. (2000). Ectopicsynaptogenesis in the mammalian retina caused by rod photorecep-tor-specific mutations. Nature Neuroscience, 3, 1121–1127.
Penn, R. D., & Hagins, W. A. (1972). Kinetics of the photocurrent ofretinal rods. Biophysical Journal, 12, 1073–1094.
Pennesi, M. E., Lyubarsky, A. L., & Pugh, E. N. Jr (1998). Extremeresponsiveness of the pupil of the dark-adapted mouse to steadyretinal illumination. In�estigati�e Ophthalmology and Visual Sci-ence, 39, 2148–2156.
Pepperberg, D. R. (1998). Does rod phototransduction involve thedelayed transition of activated rhodopsin to a second, more activecatalytic state? Visual Neuroscience, 15, 1067–1078.
Pepperberg, D. R., Birch, D. G., Hofmann, K. P., & Hood, D. C.(1996). Recovery kinetics of human rod phototransduction inferredfrom the two-branched �-wave saturation function. Journal of theOptical Society of America A, 13, 586–600.
Pepperberg, D. R., Birch, D. G., & Hood, D. C. (2000). Electroretino-graphic determination of human rod flash response in vivo.Methods in Enzymology, 316, 202–223.
Petters, R. M., Alexander, C. A., Wells, K. D., Collins, E. B., Sommer,J. R., Blanton, M. R., Rojas, G., Hao, Y., Flowers, W. L., Banin,E., Cideciyan, A. V., Jacobson, S. G., & Wong, F. (1997).Genetically engineered large animal model for studying conephotoreceptor survival and degeneration in retinitis pigmentosa.Natural Biotechnology, 15, 965–970.
Phelan, J. K., & Bok, D. (2000). A brief review of retinitis pigmentosaand the identified retinitis pigmentosa genes. Molecular Vision, 6,116–124.
Portera-Cailliau, C., Sung, C. H., Nathans, J., & Adler, R. (1994).Apoptotic photoreceptor cell death in mouse models of retinitispigmentosa. Proceedings of the National Academy of Sciences USA,91, 974–978.
Pugh, E. N. Jr, & Lamb, T. D. (1993). Amplification and kinetics ofthe activation steps in phototransduction. Biochimica et BiophysicaActa, 1141, 111–149.
Pugh, E. N. Jr, Falsini, B., & Lyubarsky, A. L. (1998). The origin ofthe major rod- and cone-driven components of the rodent elec-troretinogram and the effect of age and light-rearing history on themagnitude of these components. In T. P. Williams, & A. B. Thistle,Photostasis and related phenomena (pp. 93–128). New York:Plenum.
Rattner, A., Sun, H., & Nathans, J. (1999). Molecular genetics ofhuman retinal disease. Annual Re�iew of Genetics, 33, 89–131.
Reiser, M. A., Williams, T. P., & Pugh, E. N. Jr (1996). The effect oflight history on the aspartate-isolated fast-PIII responses of thealbino rat retina. In�estigati�e Ophthalmology and Visual Science,37, 221–229.
Robson, J. G., & Frishman, L. J. (1995). Response linearity and kineticsof the cat retina: the bipolar cell component of the dark-adaptedelectroretinogram. Visual Neuroscience, 12, 837–850.
Robson, J. G., & Frishman, L. J. (1999). Dissecting the dark-adaptedelectroretinogram. Documenta Ophthalmologica, 95, 187–215.
van Rossum, M. C., & Smith, R. G. (1998). Noise removal at the rodsynapse of mammalian retina. Visual Neuroscience, 15, 809–821.
Sanyal, S., Hawkins, R. K., Jansen, H. G., & Zeilmaker, G. H. (1992).Compensatory synaptic growth in the rod terminals as a sequel topartial photoreceptor cell loss in the retina of chimaeric mice.De�elopment, 114, 797–803.
Schnapf, J. L. (1983). Dependence of the single photon response onlongitudinal position of absorption in toad rod outer segments.Journal of Physiology, 343, 147–159.
Sherrard, R. M., & Bower, A. J. (1998). Role of afferents in thedevelopment and cell survival of the vertebrate nervous system.Clinical and Experimental Pharmacology and Physiology, 25, 487–495.
Shiells, R. A., & Falk, G. (1999). Contribution of rod, on-bipolar, andhorizontal cell light responses to the ERG of dogfish retina. VisualNeuroscience, 16, 503–511.
Shinowara, N. L., London, E. D., & Rapoport, S. I. (1982). Changesin retinal morphology and glucose utilization in aging albino rats.Experimental Eye Research, 34, 517–530.
Smith, R. G., Freed, M. A., & Sterling, P. (1986). Microcircuitry ofthe dark-adapted cat retina: functional architecture of the rod–conenetwork. Journal of Neuroscience, 6, 3505–3517.
Steinberg, R. H., Flannery, J. G., Naash, M., Oh, P., Matthes, M. T.,Yasumura, D., Lau-Villacorta, C., Chen, J., & LaVail, M. M.(1996). Transgenic rat models of inherited retinal degenerationcaused by mutant opsin genes. In�estigati�e Ophthalmology andVisual Science (Supplment), 37, S698 (Abstract).
Strettoi, E., & Pignatelli, V. (2000). Modifications of retinal neuronsin a mouse model of retinitis pigmentosa. Proceedings of theNational Academy of Sciences USA, 97, 11020–11025.
Sugawara, T., Sieving, P. A., & Bush, R. A. (2000). Quantitativerelationship of the scotopic and photopic ERG to photoreceptorcell loss in light damaged rats. Experimental Eye Research, 70,693–705.
T.S. Aleman et al. / Vision Research 41 (2001) 2779–2797 2797
Sung, C. H., Makino, C., Baylor, D., & Nathans, J. (1994). A rhodopsingene mutation responsible for autosomal dominant retinitis pig-mentosa results in a protein that is defective in localization to thephotoreceptor outer segment. Journal of Neuroscience, 14, 5818–5833.
Tan, E., Wang, Q., Quiamboa, A. B., Xu, X., Qtaishat, N. M., Peachey,N. S., Lem, J., Fliesler, S. J., Pepperberg, D. R., Naash, M. I., &Al-Ubaidi, M. R. (2001). The relationship between opsin overex-pression and photoreceptor degeneration. In�estigati�e Ophthal-mology and Visual Science, 42, 589–600.
Toda, K., Bush, R. A., Humphries, P., & Sieving, P. A. (1999). Theelectroretinogram of the rhodopsin knockout mouse. Visual Neuro-science, 16, 391–398.
Tucker, G. S., & Jacobson, S. G. (1988). Morphological findings inretinitis pigmentosa with early diffuse rod dysfunction. Retina, 8,30–41.
Van Hooser, J. P., Aleman, T. S., He, Y. G., Cideciyan, A. V., Kuksa,V., Pittler, S. J., Stone, E. M., Jacobson, S. G., & Palczewski, K.(2000). Rapid restoration of visual pigment and function with oral
retinoid in a mouse model of childhood blindness. Proceedings ofthe National Academy of Sciences USA, 97, 8623–8628.
Weisse, I. (1995). Changes in the aging rat retina. Ophthalmic Research,27, 154–163.
Weller, R. E., & Kaas, J. H. (1989). Parameters affecting the loss ofganglion cells of the retina following ablations of striate cortex inprimates. Visual Neuroscience, 3, 327–349.
Williams, T. P., Webbers, J. P., Giordano, L., & Henderson, R. P.(1998). Distribution of photon absorption rates across the ratretina. Journal of Physiology, 508, 515–522.
Wu, T. H., Ting, T. D., Okajima, T. I., Pepperberg, D. R., Ho, Y. K.,Ripps, H., & Naash, M. I. (1998). Opsin localization and rhodopsinphotochemistry in a transgenic mouse model of retinitis pigmen-tosa. Neuroscience, 87, 709–717.
Xu, X., & Karwoski, C. J. (1994). Current source density analysis ofretinal field potentials. II. Pharmacological analysis of the b-waveand M-wave. Journal of Neurophysiology, 72, 96–105.
Young, R. W. (1984). Cell death during differentiation of the retinain the mouse. Journal of Comparati�e Neurology, 229, 362–373.