To see in different seas: spatial variation in the rhodopsin gene of the sand goby (Pomatoschistus...
13
To see in different seas: spatial variation in the rhodopsin gene of the sand goby (Pomatoschistus minutus) MAARTEN H. D. LARMUSEAU,* JOOST A. M. RAEYMAEKERS,* KEVIN G. RUDDICK,† JEROEN K. J. VAN HOUDT‡ and FILIP A. M. VOLCKAERT* *Laboratory of Animal Diversity and Systematics, Katholieke Universiteit Leuven (K.U. Leuven), Ch. Deberiotstraat 32, B-3000 Leuven, Belgium, †Management Unit of the North Sea Mathematical Models (MUMM), Royal Belgian Institute for Natural Sciences (RBINS), 100 Gulledelle, B-1200 Brussels, Belgium, ‡Royal Museum for Central Africa, Leuvensesteenweg 12, B-3080 Tervuren, Belgium Abstract Aquatic organisms living in a range of photic environments require specific mechanisms to tune their visual pigments. Maximum absorbance (k max ) of retinal rods in populations of the marine demersal sand goby, (Pomatoschistus minutus; Gobiidae, Teleostei) correlates with the local optic environment. It has been shown that this is not regulated through a physiological response by exchanging the rhodopsin chromophore. To test for evolutionary adaptation, the sequence of the rhodopsin (RH1) gene was analysed in 165 Pomatoschistus minutus individuals from seven populations across its distribution range. Analysis showed a high level of intraspecific polymorphism at the RH1 gene, including nonsynonymous mutations on amino acids, known as spectral tuning sites. Population differentiation at these sites was in agreement with the observed differen- tiation in k max values. Analyses of d N ⁄ d S substitution rate ratios and likelihood ratio tests under site-specific models detected a significant signal of positive Darwinian selection on the RH1 gene. A strong discrepancy in differentiation was noticed between RH1 gene variation and the presumably neutral microsatellites and mitochondrial data. Samples did not cluster according to geographical or historical proximity with regards to RH1, but according to the general photic conditions of the habitat environment of the sand goby. This study highlights the usefulness of sensory genes, like rhodopsin, for studying the characteristics of local adaptation in marine nonmodel organisms. Keywords: adaptive evolution, candidate gene, Gobiidae, marine fish, photoreceptor, remote sensing, vision Received 29 July 2008; revision received 26 March 2009; accepted 18 April 2009 Introduction For too long, the genetic structure of marine organisms has been thought to be homogeneous because of the lack of obvious barriers to gene flow in the environ- ment. As gene flow is expected to hamper adaptive population divergence, the traditional idea was that local adaptation may be rare or absent in marine fishes (Hemmer-Hansen et al. 2007). Lately, however, an increasing number of population genetic studies have described complex genetic structures in several marine species (Knutsen et al. 2003; Pampoulie et al. 2008). One major factor responsible for the present genetic struc- ture of marine species is the geological and climatologi- cal history during the Pleistocene glaciations (Debes et al. 2008; Luttikhuizen et al. 2008). Also contemporary factors maintain and promote genetic differentiation among marine populations on various geographical scales. The marine environment shows heterogeneity in response to climate, hydrodynamics and topography (Cowen et al. 2000), and biological traits, such as Correspondence: Maarten H. D. Larmuseau, Fax: +32 16324575; E-mail: [email protected] ȑ 2009 Blackwell Publishing Ltd Molecular Ecology (2009) 18, 4227–4239 doi: 10.1111/j.1365-294X.2009.04331.x
Transcript of To see in different seas: spatial variation in the rhodopsin gene of the sand goby (Pomatoschistus...
Molecular Ecology (2009) 18, 4227–4239 doi: 10.1111/j.1365-294X.2009.04331.x
To see in different seas: spatial variation in therhodopsin gene of the sand goby (Pomatoschistusminutus)
MAARTEN H. D. LARMUSEAU,* JOOST A. M. RAEYMAEKERS,* KEVIN G. RUDDICK,†
JEROEN K. J . VAN HOUDT‡ and FILIP A. M. VOLCKAERT*
*Laboratory of Animal Diversity and Systematics, Katholieke Universiteit Leuven (K.U. Leuven), Ch. Deberiotstraat 32, B-3000
Leuven, Belgium, †Management Unit of the North Sea Mathematical Models (MUMM), Royal Belgian Institute for Natural
Sciences (RBINS), 100 Gulledelle, B-1200 Brussels, Belgium, ‡Royal Museum for Central Africa, Leuvensesteenweg 12, B-3080
Tervuren, Belgium
Corresponde
Fax: +32 163
� 2009 Black
Abstract
Aquatic organisms living in a range of photic environments require specific mechanisms
to tune their visual pigments. Maximum absorbance (kmax) of retinal rods in populations
of the marine demersal sand goby, (Pomatoschistus minutus; Gobiidae, Teleostei)
correlates with the local optic environment. It has been shown that this is not regulated
through a physiological response by exchanging the rhodopsin chromophore. To test for
evolutionary adaptation, the sequence of the rhodopsin (RH1) gene was analysed in 165
Pomatoschistus minutus individuals from seven populations across its distribution
range. Analysis showed a high level of intraspecific polymorphism at the RH1 gene,
including nonsynonymous mutations on amino acids, known as spectral tuning sites.
Population differentiation at these sites was in agreement with the observed differen-
tiation in kmax values. Analyses of dN ⁄ dS substitution rate ratios and likelihood ratio tests
under site-specific models detected a significant signal of positive Darwinian selection
on the RH1 gene. A strong discrepancy in differentiation was noticed between RH1 gene
variation and the presumably neutral microsatellites and mitochondrial data. Samples
did not cluster according to geographical or historical proximity with regards to RH1, but
according to the general photic conditions of the habitat environment of the sand goby.
This study highlights the usefulness of sensory genes, like rhodopsin, for studying the
characteristics of local adaptation in marine nonmodel organisms.
Keywords: adaptive evolution, candidate gene, Gobiidae, marine fish, photoreceptor, remote
sensing, vision
Received 29 July 2008; revision received 26 March 2009; accepted 18 April 2009
Introduction
For too long, the genetic structure of marine organisms
has been thought to be homogeneous because of the
lack of obvious barriers to gene flow in the environ-
ment. As gene flow is expected to hamper adaptive
population divergence, the traditional idea was that
local adaptation may be rare or absent in marine fishes
(Hemmer-Hansen et al. 2007). Lately, however, an
nce: Maarten H. D. Larmuseau,
24575; E-mail: [email protected]
well Publishing Ltd
increasing number of population genetic studies have
described complex genetic structures in several marine
species (Knutsen et al. 2003; Pampoulie et al. 2008). One
major factor responsible for the present genetic struc-
ture of marine species is the geological and climatologi-
cal history during the Pleistocene glaciations (Debes
et al. 2008; Luttikhuizen et al. 2008). Also contemporary
factors maintain and promote genetic differentiation
among marine populations on various geographical
scales. The marine environment shows heterogeneity in
response to climate, hydrodynamics and topography
(Cowen et al. 2000), and biological traits, such as
4228 M. H. D. LARMUSEAU ET AL.
sex-dependent migration, site philopatry and assortative
mating enhance genetic structuring (Ruzzante et al.
1998). Stable neutral genetic structuring among popula-
tions may indicate that local selection is overriding the
effects of drift and gene flow, resulting in adaptive
divergence. Local adaptation in marine organisms has
become increasingly documented, indicating that selec-
tion is also a potent evolutionary force in the marine
environment (Canino et al. 2005; Hemmer-Hansen et al.
2007; Zane 2007; Sherman & Ayre 2008). Nevertheless,
knowledge of the spatial and temporal scale of adaptive
genetic variation in marine systems remains scant, yet
crucial to improve our understanding of how evolution
operates in the ocean (Conover et al. 2006).
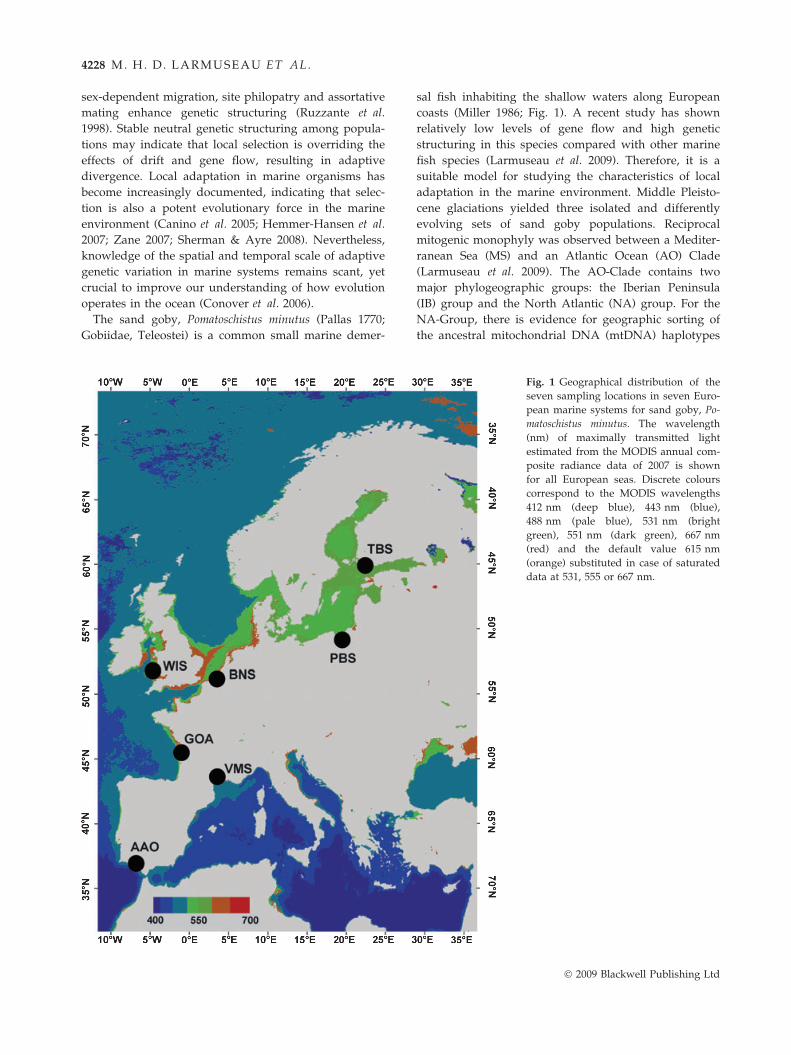
The sand goby, Pomatoschistus minutus (Pallas 1770;
Gobiidae, Teleostei) is a common small marine demer-
sal fish inhabiting the shallow waters along European
coasts (Miller 1986; Fig. 1). A recent study has shown
relatively low levels of gene flow and high genetic
structuring in this species compared with other marine
fish species (Larmuseau et al. 2009). Therefore, it is a
suitable model for studying the characteristics of local
adaptation in the marine environment. Middle Pleisto-
cene glaciations yielded three isolated and differently
evolving sets of sand goby populations. Reciprocal
mitogenic monophyly was observed between a Mediter-
ranean Sea (MS) and an Atlantic Ocean (AO) Clade
(Larmuseau et al. 2009). The AO-Clade contains two
major phylogeographic groups: the Iberian Peninsula
(IB) group and the North Atlantic (NA) group. For the
NA-Group, there is evidence for geographic sorting of
the ancestral mitochondrial DNA (mtDNA) haplotypes
Fig. 1 Geographical distribution of the
seven sampling locations in seven Euro-
pean marine systems for sand goby, Po-
matoschistus minutus. The wavelength
(nm) of maximally transmitted light
estimated from the MODIS annual com-
posite radiance data of 2007 is shown
for all European seas. Discrete colours
correspond to the MODIS wavelengths
412 nm (deep blue), 443 nm (blue),
488 nm (pale blue), 531 nm (bright
green), 551 nm (dark green), 667 nm
(red) and the default value 615 nm
(orange) substituted in case of saturated
data at 531, 555 or 667 nm.
� 2009 Blackwell Publishing Ltd

RH ODOPSIN G ENE VA RI ATI ON IN SAND GOBY 4 22 9
with recent radiations in the Baltic Sea, Irish Sea, North
Sea and Bay of Biscay. Northern Baltic Sea sand gobies
are considered to belong to an isolated population with
clear evidence for founder effects (Larmuseau et al.
2009). Allozyme and microsatellite analyses largely cor-
roborated this phylogeographic pattern (Stefanni et al.
2003; M. H. D. Larmuseau, unpublished data).
Sand gobies are visual feeders (Healey 1971; Aarnio
& Bonsdorff 1993) and mostly nocturnal. Patterns of
activity are largely influenced by tides and light inten-
sity (Ehrenberg & Ejdung 2008). For P. minutus, noctur-
nal foraging is advantageous in approaching prey and
in avoiding predators (Thetmeyer 1997). Relative to
body size, the protruding eyes are large and might be
capable of detecting prey organisms in very dim light
(Thetmeyer 1997). The geographical distribution of the
sand goby includes a wide range of photic environ-
ments, varying in turbidity, colour and brightness.
Therefore, adaptation to the local spectral environment
may be crucial. Vertebrates have visual pigment (VP)
molecules bound in dense membrane stacks in retinal
photoreceptors to mediate vision. The VP protein moi-
ety is opsin, which is a G protein-linked receptor,
bound to a light-sensitive chromophore, 11-cis retinal
(A1) or 11-cis 3, 4-dehydroretinal (A2) (Park et al. 2008).
Each pigment shows a characteristic peak of maximal
absorbance (kmax), its precise location depending on the
interactions between the chromophore and the opsin
protein. The pigment that mediates vision in dim light
and absorbs light with kmax of about 500 nm, is rhodop-
sin; It is located in rod cells.
Vertebrates have various possibilities to modify their
visual system to cope with the photic environment. The
spectral tuning of the VP proteins can be assessed on a
physiologically time scale through exchange of the chro-
mophore (A1 or A2), consistent with an anticipated
change in photic environment (Bowmaker 1995). Tuning
can also be achieved at the DNA level on an evolution-
ary time scale through amino acid (AA) substitutions in
the protein part (the opsin) (Yokoyama 2000). The first
possibility seems unlikely in sand gobies. Jokela et al.
(2003) measured the absorbance spectra microspecto-
photometrically in retinal rods of various sand goby
populations. They found considerable variation in kmax
values within and between populations. The shapes of
the absorbance spectra-indicated polymorphism at the
rhodopsin gene rather than admixture of A1 and A2
chromophores, suggesting that the variation in kmax val-
ues is genetic. Therefore, evolutionary adaptation,
rather than physiological change, is presumed to be
responsible for spectral tuning.
The tuning mechanism of VPs should be a suitable
candidate to understand the opportunities and charac-
teristics of local adaptation in the marine environment.
� 2009 Blackwell Publishing Ltd
The aim of this study was to assess if sand gobies are
evolutionary adapted to local photic environments on
the rhodopsin gene (RH1). Our strategy to demonstrate
local adaptation on RH1 consists of three steps: first, we
demonstrate differentiation in the functional variation
of the RH1 gene between sand goby populations. Next,
we demonstrate that the population differentiation of
RH1 is the result of selection. Finally, we establish a
link between the functional variation of RH1 and selec-
tion regimes.
Materials and methods
Sampling and species identification
A total of 165 Pomatoschistus minutus individuals were
caught at seven locations along the European coast
between January 2006 and February 2007 (Table 1,
Fig. 1). Samples were taken either by fyke, hand net or
beam trawling. The sand gobies were distinguished
from other cryptic Pomatoschistus species morphologi-
cally, based on the dermal head papillae (Miller 1986)
and pigmentation pattern (Hamerlynck 1990), and
genetically, based on a polymerase chain reaction
(PCR)-restriction fragment length polymorphism species
identification protocol developed by Larmuseau et al.
(2008).
Gene amplification and sequencing
Genomic DNA was extracted from fin clips, stored in
100% ethanol, using the NucleoSplin Extraction Kit
(Machery-Nagel GmBH). An 868 bp fragment of the
RH1 gene was amplified in PCR with the forward pri-
mer PminRh1F GCGCCTACATGTTCTTCCTT and the
reverse primer Rh1039r TGCTTGTTCATGCAGATGT-
AGA (Chen et al. 2003). The forward primer was
designed using the Primer 3 program (Rozen & Skalet-
sky 1998) on conserved regions of the alignment of RH1
gene sequences from P. minutus (Acc no. X62405), Gobi-
us niger (Y18675), Zeus faber (Y14484), Sargocentron dia-
dema (U57537) and Sargocentron microstoma (U57542).
Developing new primers to amplify a larger fragment
of the RH1 gene was not successful because of co-
amplification of other opsin genes. PCR reactions were
carried out on a GeneAmp PCR System 2700 thermocy-
cler (Applied Biosystems) in a total volume of 25 lL,
containing 1 lL of genomic DNA, 1X PCR buffer,
0.2 mM dNTPs, 0.8 lM of each primer, 2.0 mM MgCl2,
0.5 U of Taq DNA polymerase (Silverstar; Eurogentec)
and mQ-H2O. The PCR profile was: 4 min at 94 �C fol-
lowed by 35 cycles of 30 s at 96 �C, 30 s at 54 �C and
1 min at 72 �C; with a final 10-min extension at 72 �C.
To avoid contamination, different pipettes, aerosol
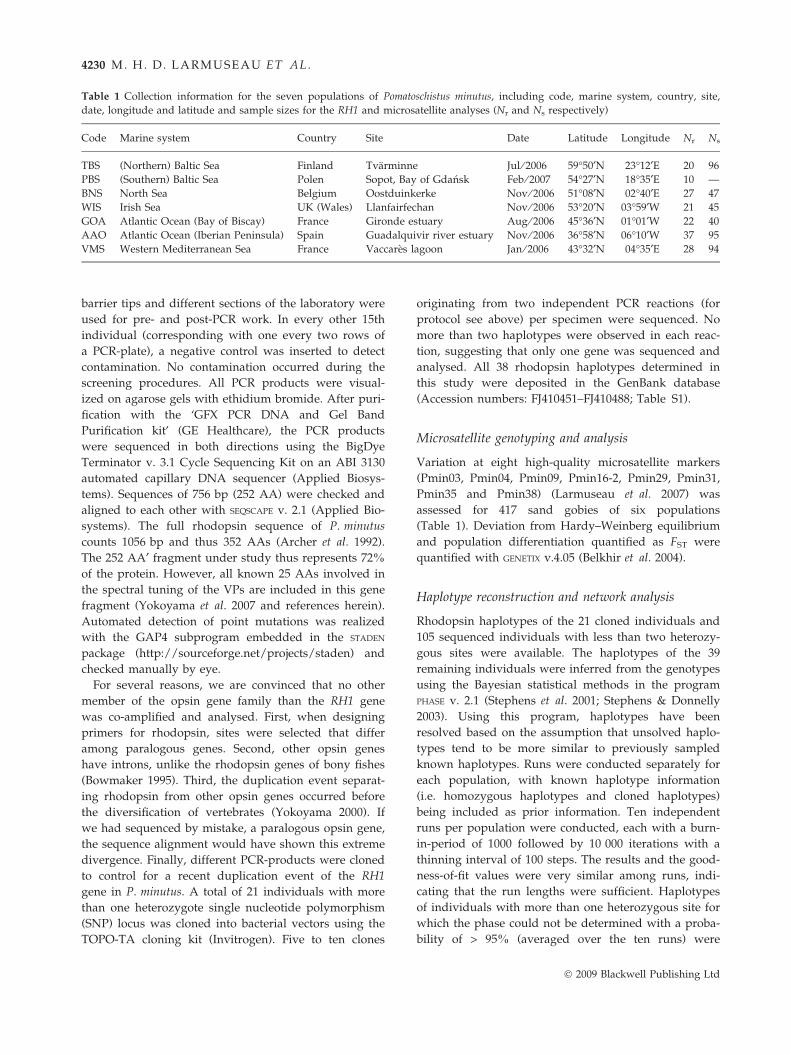
Table 1 Collection information for the seven populations of Pomatoschistus minutus, including code, marine system, country, site,
date, longitude and latitude and sample sizes for the RH1 and microsatellite analyses (Nr and Ns respectively)
Code Marine system Country Site Date Latitude Longitude Nr Ns
TBS (Northern) Baltic Sea Finland Tvarminne Jul ⁄ 2006 59�50¢N 23�12¢E 20 96
PBS (Southern) Baltic Sea Polen Sopot, Bay of Gdansk Feb ⁄ 2007 54�27¢N 18�35¢E 10 —
BNS North Sea Belgium Oostduinkerke Nov ⁄ 2006 51�08¢N 02�40¢E 27 47
WIS Irish Sea UK (Wales) Llanfairfechan Nov ⁄ 2006 53�20¢N 03�59¢W 21 45
GOA Atlantic Ocean (Bay of Biscay) France Gironde estuary Aug ⁄ 2006 45�36¢N 01�01¢W 22 40
AAO Atlantic Ocean (Iberian Peninsula) Spain Guadalquivir river estuary Nov ⁄ 2006 36�58¢N 06�10¢W 37 95
VMS Western Mediterranean Sea France Vaccares lagoon Jan ⁄ 2006 43�32¢N 04�35¢E 28 94
4230 M. H. D. LARMUSEAU ET AL.
barrier tips and different sections of the laboratory were
used for pre- and post-PCR work. In every other 15th
individual (corresponding with one every two rows of
a PCR-plate), a negative control was inserted to detect
contamination. No contamination occurred during the
screening procedures. All PCR products were visual-
ized on agarose gels with ethidium bromide. After puri-
fication with the ‘GFX PCR DNA and Gel Band
Purification kit’ (GE Healthcare), the PCR products
were sequenced in both directions using the BigDye
Terminator v. 3.1 Cycle Sequencing Kit on an ABI 3130
automated capillary DNA sequencer (Applied Biosys-
tems). Sequences of 756 bp (252 AA) were checked and
aligned to each other with SEQSCAPE v. 2.1 (Applied Bio-
systems). The full rhodopsin sequence of P. minutus
counts 1056 bp and thus 352 AAs (Archer et al. 1992).
The 252 AA¢ fragment under study thus represents 72%
of the protein. However, all known 25 AAs involved in
the spectral tuning of the VPs are included in this gene
fragment (Yokoyama et al. 2007 and references herein).
Automated detection of point mutations was realized
with the GAP4 subprogram embedded in the STADEN
package (http://sourceforge.net/projects/staden) and
checked manually by eye.
For several reasons, we are convinced that no other
member of the opsin gene family than the RH1 gene
was co-amplified and analysed. First, when designing
primers for rhodopsin, sites were selected that differ
among paralogous genes. Second, other opsin genes
have introns, unlike the rhodopsin genes of bony fishes
(Bowmaker 1995). Third, the duplication event separat-
ing rhodopsin from other opsin genes occurred before
the diversification of vertebrates (Yokoyama 2000). If
we had sequenced by mistake, a paralogous opsin gene,
the sequence alignment would have shown this extreme
divergence. Finally, different PCR-products were cloned
to control for a recent duplication event of the RH1
gene in P. minutus. A total of 21 individuals with more
than one heterozygote single nucleotide polymorphism
(SNP) locus was cloned into bacterial vectors using the
TOPO-TA cloning kit (Invitrogen). Five to ten clones
originating from two independent PCR reactions (for
protocol see above) per specimen were sequenced. No
more than two haplotypes were observed in each reac-
tion, suggesting that only one gene was sequenced and
analysed. All 38 rhodopsin haplotypes determined in
this study were deposited in the GenBank database
(Accession numbers: FJ410451–FJ410488; Table S1).
Microsatellite genotyping and analysis
Variation at eight high-quality microsatellite markers
(Pmin03, Pmin04, Pmin09, Pmin16-2, Pmin29, Pmin31,
Pmin35 and Pmin38) (Larmuseau et al. 2007) was
assessed for 417 sand gobies of six populations
(Table 1). Deviation from Hardy–Weinberg equilibrium
and population differentiation quantified as FST were
quantified with GENETIX v.4.05 (Belkhir et al. 2004).
Haplotype reconstruction and network analysis
Rhodopsin haplotypes of the 21 cloned individuals and
105 sequenced individuals with less than two heterozy-
gous sites were available. The haplotypes of the 39
remaining individuals were inferred from the genotypes
using the Bayesian statistical methods in the program
PHASE v. 2.1 (Stephens et al. 2001; Stephens & Donnelly
2003). Using this program, haplotypes have been
resolved based on the assumption that unsolved haplo-
types tend to be more similar to previously sampled
known haplotypes. Runs were conducted separately for
each population, with known haplotype information
(i.e. homozygous haplotypes and cloned haplotypes)
being included as prior information. Ten independent
runs per population were conducted, each with a burn-
in-period of 1000 followed by 10 000 iterations with a
thinning interval of 100 steps. The results and the good-
ness-of-fit values were very similar among runs, indi-
cating that the run lengths were sufficient. Haplotypes
of individuals with more than one heterozygous site for
which the phase could not be determined with a proba-
bility of > 95% (averaged over the ten runs) were
� 2009 Blackwell Publishing Ltd

RH ODOPSIN G ENE VA RI ATI ON IN SAND GOBY 4 23 1
excluded from the haplotype network (19 out of 165
analysed individuals). A haplotype network of the rho-
dopsin haplotypes was constructed using the statistical
parsimony method implemented in the program TCS v.
1.21 (Clement et al. 2000). Interpopulation relationships
were assessed by estimating pairwise FST-values based
on the haplotype distributions with Arlequin v. 3.11
(Excoffier et al. 2005). These values were then used for
a classical multidimensional scaling (CMDS) analysis in
the VEGAN package in R (Oksanen et al. 2007) for detect-
ing group structure. CMDS plots having a stress value
<0.20 provide interpretable information concerning in-
tersite relationships (Clarke 1993).
Genetic diversity and neutrality tests
The number of segregating sites (S), the mean number
of pairwise differences (k) and estimates of nucleotide
polymorphism (p, h) were calculated using DnaSP v.
4.10.9 (Rozas et al. 2003).
Several analyses were performed to determine if posi-
tive selection was involved in the evolution of RH1 in
P. minutus. The number of synonymous substitutions
per synonymous site (dS) and the number of nonsynony-
mous substitutions per nonsynonymous site (dN) were
estimated using the Z-test implemented in MEGA v. 4.0
(Tamura et al. 2007) according to Nei & Gojobori (1986)
with the correction of Jukes & Cantor (1969) for multiple
substitutions. The variances of dS and dN were computed
by bootstrap (10 000 replicates). With this information,
the null hypothesis of neutral evolution (H0: dN = dS) vs.
the hypothesis of positive selection (H1: dN > dS) was
tested using a Z-test: Z = (dN ) dS) ⁄ Sqrt(Var(dS) +
Var(dN)). The maximum-likelihood method (Yang et al.
2000) implemented in the program CODEML of the PAML
4.1 software package (Yang 2007) was used to test
whether codon sites on the RH1 gene were affected by
positive selection (Yang et al. 2005). The models were
M7 (beta) and M8 (beta and x; Yang et al. 2000). While
recombination can potentially generate false-positives in
the detection of positive selection, these models are more
robust against the occurrence of recombination than the
other models implemented in CODEML (Anisimova et al.
2003). The models M7 and M8 are compared pairwise
using the likelihood-ratio test (LRT; Nielsen & Yang
1998). To provide phylogenetic information for the anal-
ysis, the best tree for RH1 sequences was identified with
the maximum likelihood method under the one-ratio
model (M0) in CODEML. Positively selected codons
(x > 1 with P > 95%) were identified through an empiri-
cal Bayesian approach implemented in CODEML (Yang
et al. 2005).
Another method used to test for the effects of differ-
ential selection among populations is to compare the
� 2009 Blackwell Publishing Ltd
distribution of the variation on RH1 and neutral nuclear
markers. If SNPs of the RH1 gene code for adaptive
variation, the RH1 gene is expected to reveal aberrant
population structures in comparison to nuclear markers
(such as microsatellite markers), which may be behav-
ing neutral (Bamshad & Wooding 2003). To compare
the degree of population differentiation between the
RH1 and the microsatellite markers, several methods
were applied. First, correlations between pairwise FST-
values of the two markers were calculated and tested
using simple Mantel procedures (Mantel 1967) in the
VEGAN package in R (Oksanen et al. 2007). Because the
number of Mantel test permutations is limited for small
sample sizes (n = 6) (Legendre 2000), complete enumer-
ation of all possible 6! = 720 permutations was carried
out for all tests. Second, two-dimensional CMDS ordi-
nations of pairwise FST-values of different marker types
were compared by a Procrustes Analysis (PA) (Gower
1975) with the VEGAN package. PA searches for the best
match between two configurations of points in a multi-
variate Euclidean space using rotation, translation,
reflection and dilation of one configuration. The crite-
rion used to assess the best fit is the minimization of
the sum of squares between the differences for each
observation (m2). The significance of the result, an opti-
mal superposition of one configuration on the other
(reference) configuration, is obtained through a permu-
tation test (PROTEST, Jackson 1995). PROTEST uses
R = sqrt(1 ) m2) as a test statistic, which can be inter-
preted as a correlation. Finally, a selection detection
workbench LOSITAN (Antao et al. 2008) based on the
FDIST FST outlier methods of Beaumont & Nichols
(1996) was used to evaluate the neutrality of the micro-
satellites and the presumed outlier status of RH1. Dif-
ferent runs were assessed: one run with only
microsatellite data, 14 different runs with all microsatel-
lites and a polymorphic SNP of the RH1 gene, and a
final run with all microsatellites and all polymorphic
SNPs of the RH1 gene. For all runs 30 000 simulations
were generated with ‘neutral mean FST’ and ‘force mean
FST’, to increase the reliability of the mean FST.
Environmental light measurements
To correlate the differences in the rhodopsin gene varia-
tion between P. minutus populations with the light
transmittance of the respective waters, the spectral dis-
tribution of environmental ambient light was measured
in the northeastern Atlantic Ocean, Mediterranean Sea
and adjacent seas. Lindstrom (2000) introduced the con-
cept of ‘wavelength of maximally transmitted light’
(WMTL) to characterize the spectral content and depth
variation of the underwater light climate by a single
parameter for comparison with the spectral sensitivity

4232 M. H. D. LARMUSEAU ET AL.
of the eyes of marine animals. Whereas a combination
of underwater light measurements and optical model-
ling is used by Audzijonyte et al. (2005) to estimate the
WMTL at various locations, a new method is described
in Appendix S1 to estimate this parameter from satel-
lite remote sensing data. The method has the advantage
of providing information at almost any location on
earth without the need for in situ measurements or a
priori knowledge, and of relying on a more uniform
methodology. Water-leaving radiance data as measured
by the MODIS-AQUA satellite sensor was downloaded
on 19th November 2008 from the NASA ‘Ocean Color’
web site (http://oceancolor.gsfc.nasa.gov/) as the
annual composite for 2007 (4-km standard map image
file) for each of the available spectral bands (412, 443,
488, 531, 551 and 667 nm).
Fig. 2 Two-dimensional model of the seven transmembrane
a-helices of the bovine rhodopsin (RH1) as in Hargrave &
McDowell’s (1992). The seven transmembrane helices (TM) are
numbered, as well as the three loops at the cytoplasmic side
(C) and the extracellular side (E) of the cell membrane. The
different nonsynonymous mutations found in Pomatoschistus
minutus are shown in filled circles. (1) AA151 (SNP4); (2)
AA214 (SNP9_10_11); (3) AA217 (SNP12); (4) AA261 (SNP14);
(5) AA299 (SNP19).
Results
Nucleotide diversity of the RH1 gene
Sequences matched the general properties of the Po-
matoschistus minutus RH1 gene (X62405, Archer et al.
1992). In total, 19 segregating sites or SNPs were
noticed across all genotypes (Table S2). Five SNPs (SNP
2, 3, 5, 8 and 18) were not polymorphic according to the
99% criterion; three polymorphic SNPs were part of the
same codon and were merged (written further as
SNP_9_10_11). The alignment in AA shows five non-
synonymous AA substitutions; four are located in the
transmembrane helices and one in the C-II loop
(Fig. 2). The sequencing and cloning reactions revealed
38 confidently resolved haplotypes (Table S1). Nucleo-
tide diversity (p) of the RH1 gene fragment was esti-
mated to be 0.0074 in total. The within-population RH1
nucleotide diversity values were highest in populations
BNS, WIS and GOA (southern North Sea, Irish Sea and
Bay of Biscay, respectively); the lowest value was found
in PBS (southern Baltic Sea; Table 2).
Population differentiation on the RH1 gene
A maximum parsimony network of confidently
resolved haplotypes revealed that three haplotypes are
common in at least four populations (Fig. 3). Haplotype
RhP7 is shared among all populations. Haplotypes clus-
tered roughly into two groups, one containing the
majority of haplotypes observed in the Iberian Penin-
sula, North Sea and Irish Sea, and another group con-
taining haplotypes occurring mainly in the
Mediterranean and Baltic Sea (Fig. 3). Accordingly,
pairwise FST-values (Table 3) showed a clustering of
Mediterranean and northern Baltic Sea (VMS and TBS)
samples; the Atlantic samples (GOA, WIS and AAO)
clustered together. Finally, the frequency of nonsynony-
mous SNPs and polymorphic AA differed between the
populations (Table 4).
Neutrality tests
The null hypothesis of evolution according to the neu-
tral model could not be rejected with a general Z-test
for all samples combined as well as for the samples
from the Baltic Sea, North Sea and Mediterranean Sea
separately. The dS-values were significantly larger than
the dN-values only for the Z-tests with the Atlantic sam-
ples WIS, GOA and AAO. However, the LRT of the
maximum-likelihood analysis demonstrated that M8,
the model that accounts for sites under positive selec-
tion, showed a significantly better fit than model M7,
which does not allow for positive selection. The x ratio
is more than 1 (Table 5), indicating positive selection in
the RH1 sequences of P. minutus. Bayes identification
showed that sites AA151, 214 and 299 of the RH1 gene
were significantly under positive selection.
Overall population differentiation was considerably
higher for the full fragment of the RH1 gene
(FST = 0.4549) than at the nuclear microsatellite markers
(FST = 0.0126). Exact tests showed that no locus or
sample exhibited consistent deviations from Hardy–
Weinberg equilibrium with respect to microsatellites.
The pairwise FST-values of the RH1 gene and the
� 2009 Blackwell Publishing Ltd
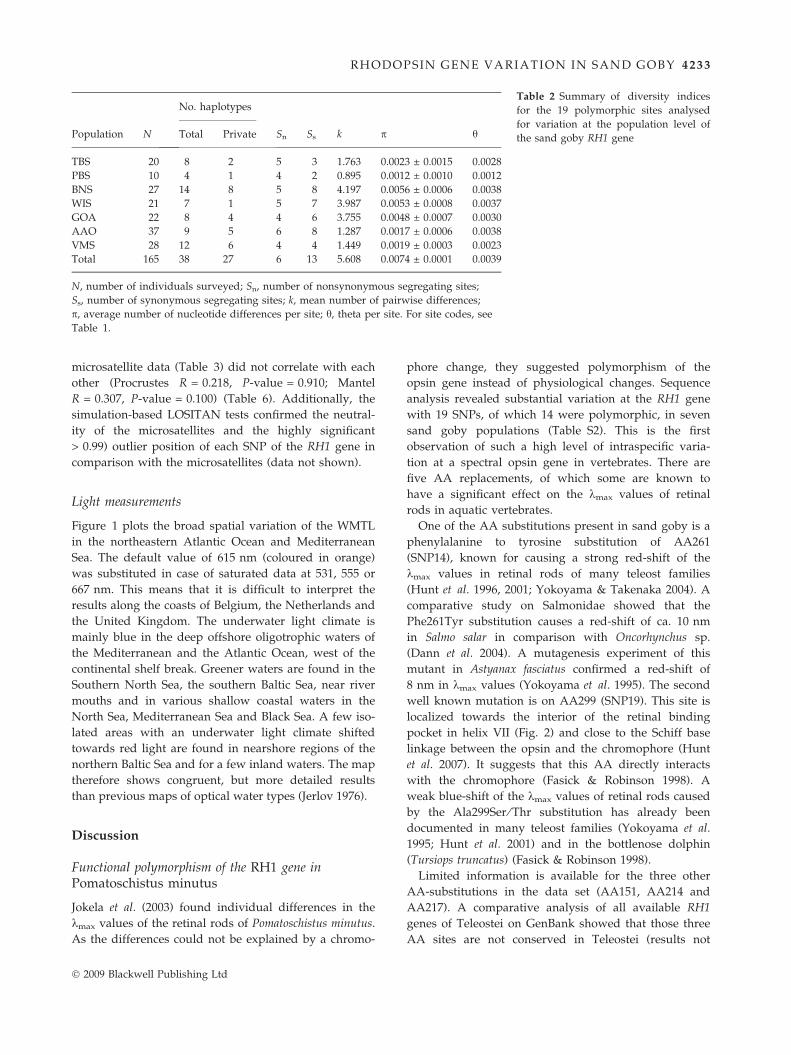
Table 2 Summary of diversity indices
for the 19 polymorphic sites analysed
for variation at the population level of
the sand goby RH1 genePopulation N
No. haplotypes
Sn Ss k p hTotal Private
TBS 20 8 2 5 3 1.763 0.0023 ± 0.0015 0.0028
PBS 10 4 1 4 2 0.895 0.0012 ± 0.0010 0.0012
BNS 27 14 8 5 8 4.197 0.0056 ± 0.0006 0.0038
WIS 21 7 1 5 7 3.987 0.0053 ± 0.0008 0.0037
GOA 22 8 4 4 6 3.755 0.0048 ± 0.0007 0.0030
AAO 37 9 5 6 8 1.287 0.0017 ± 0.0006 0.0038
VMS 28 12 6 4 4 1.449 0.0019 ± 0.0003 0.0023
Total 165 38 27 6 13 5.608 0.0074 ± 0.0001 0.0039
N, number of individuals surveyed; Sn, number of nonsynonymous segregating sites;
Ss, number of synonymous segregating sites; k, mean number of pairwise differences;
p, average number of nucleotide differences per site; h, theta per site. For site codes, see
Table 1.
RH ODOPSIN G ENE VA RI ATI ON IN SAND GOBY 4 23 3
microsatellite data (Table 3) did not correlate with each
other (Procrustes R = 0.218, P-value = 0.910; Mantel
R = 0.307, P-value = 0.100) (Table 6). Additionally, the
simulation-based LOSITAN tests confirmed the neutral-
ity of the microsatellites and the highly significant
> 0.99) outlier position of each SNP of the RH1 gene in
comparison with the microsatellites (data not shown).
Light measurements
Figure 1 plots the broad spatial variation of the WMTL
in the northeastern Atlantic Ocean and Mediterranean
Sea. The default value of 615 nm (coloured in orange)
was substituted in case of saturated data at 531, 555 or
667 nm. This means that it is difficult to interpret the
results along the coasts of Belgium, the Netherlands and
the United Kingdom. The underwater light climate is
mainly blue in the deep offshore oligotrophic waters of
the Mediterranean and the Atlantic Ocean, west of the
continental shelf break. Greener waters are found in the
Southern North Sea, the southern Baltic Sea, near river
mouths and in various shallow coastal waters in the
North Sea, Mediterranean Sea and Black Sea. A few iso-
lated areas with an underwater light climate shifted
towards red light are found in nearshore regions of the
northern Baltic Sea and for a few inland waters. The map
therefore shows congruent, but more detailed results
than previous maps of optical water types (Jerlov 1976).
Discussion
Functional polymorphism of the RH1 gene inPomatoschistus minutus
Jokela et al. (2003) found individual differences in the
kmax values of the retinal rods of Pomatoschistus minutus.
As the differences could not be explained by a chromo-
� 2009 Blackwell Publishing Ltd
phore change, they suggested polymorphism of the
opsin gene instead of physiological changes. Sequence
analysis revealed substantial variation at the RH1 gene
with 19 SNPs, of which 14 were polymorphic, in seven
sand goby populations (Table S2). This is the first
observation of such a high level of intraspecific varia-
tion at a spectral opsin gene in vertebrates. There are
five AA replacements, of which some are known to
have a significant effect on the kmax values of retinal
rods in aquatic vertebrates.
One of the AA substitutions present in sand goby is a
phenylalanine to tyrosine substitution of AA261
(SNP14), known for causing a strong red-shift of the
kmax values in retinal rods of many teleost families
(Hunt et al. 1996, 2001; Yokoyama & Takenaka 2004). A
comparative study on Salmonidae showed that the
Phe261Tyr substitution causes a red-shift of ca. 10 nm
in Salmo salar in comparison with Oncorhynchus sp.
(Dann et al. 2004). A mutagenesis experiment of this
mutant in Astyanax fasciatus confirmed a red-shift of
8 nm in kmax values (Yokoyama et al. 1995). The second
well known mutation is on AA299 (SNP19). This site is
localized towards the interior of the retinal binding
pocket in helix VII (Fig. 2) and close to the Schiff base
linkage between the opsin and the chromophore (Hunt
et al. 2007). It suggests that this AA directly interacts
with the chromophore (Fasick & Robinson 1998). A
weak blue-shift of the kmax values of retinal rods caused
by the Ala299Ser ⁄ Thr substitution has already been
documented in many teleost families (Yokoyama et al.
1995; Hunt et al. 2001) and in the bottlenose dolphin
(Tursiops truncatus) (Fasick & Robinson 1998).
Limited information is available for the three other
AA-substitutions in the data set (AA151, AA214 and
AA217). A comparative analysis of all available RH1
genes of Teleostei on GenBank showed that those three
AA sites are not conserved in Teleostei (results not
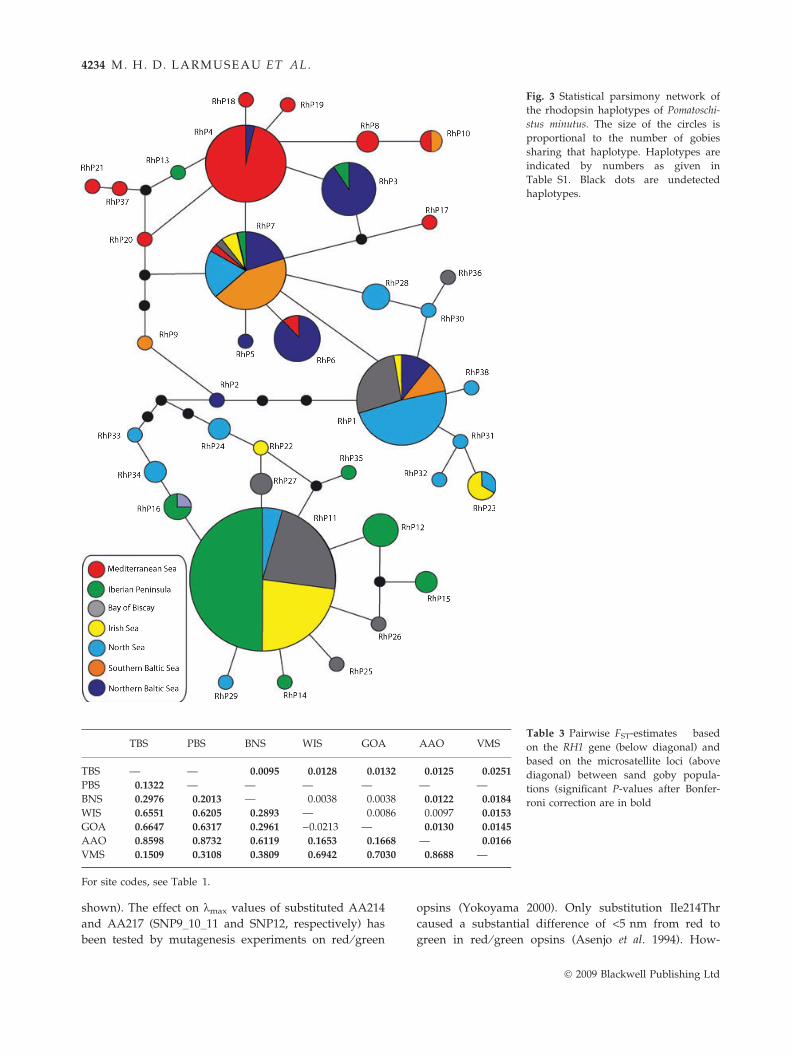
Fig. 3 Statistical parsimony network of
the rhodopsin haplotypes of Pomatoschi-
stus minutus. The size of the circles is
proportional to the number of gobies
sharing that haplotype. Haplotypes are
indicated by numbers as given in
Table S1. Black dots are undetected
haplotypes.
Table 3 Pairwise FST-estimates based
on the RH1 gene (below diagonal) and
based on the microsatellite loci (above
diagonal) between sand goby popula-
tions (significant P-values after Bonfer-
roni correction are in bold
TBS PBS BNS WIS GOA AAO VMS
TBS — — 0.0095 0.0128 0.0132 0.0125 0.0251
PBS 0.1322 — — — — — —
BNS 0.2976 0.2013 — 0.0038 0.0038 0.0122 0.0184
WIS 0.6551 0.6205 0.2893 — 0.0086 0.0097 0.0153
GOA 0.6647 0.6317 0.2961 )0.0213 — 0.0130 0.0145
AAO 0.8598 0.8732 0.6119 0.1653 0.1668 — 0.0166
VMS 0.1509 0.3108 0.3809 0.6942 0.7030 0.8688 —
For site codes, see Table 1.
4234 M. H. D. LARMUSEAU ET AL.
shown). The effect on kmax values of substituted AA214
and AA217 (SNP9_10_11 and SNP12, respectively) has
been tested by mutagenesis experiments on red ⁄ green
opsins (Yokoyama 2000). Only substitution Ile214Thr
caused a substantial difference of <5 nm from red to
green in red ⁄ green opsins (Asenjo et al. 1994). How-
� 2009 Blackwell Publishing Ltd
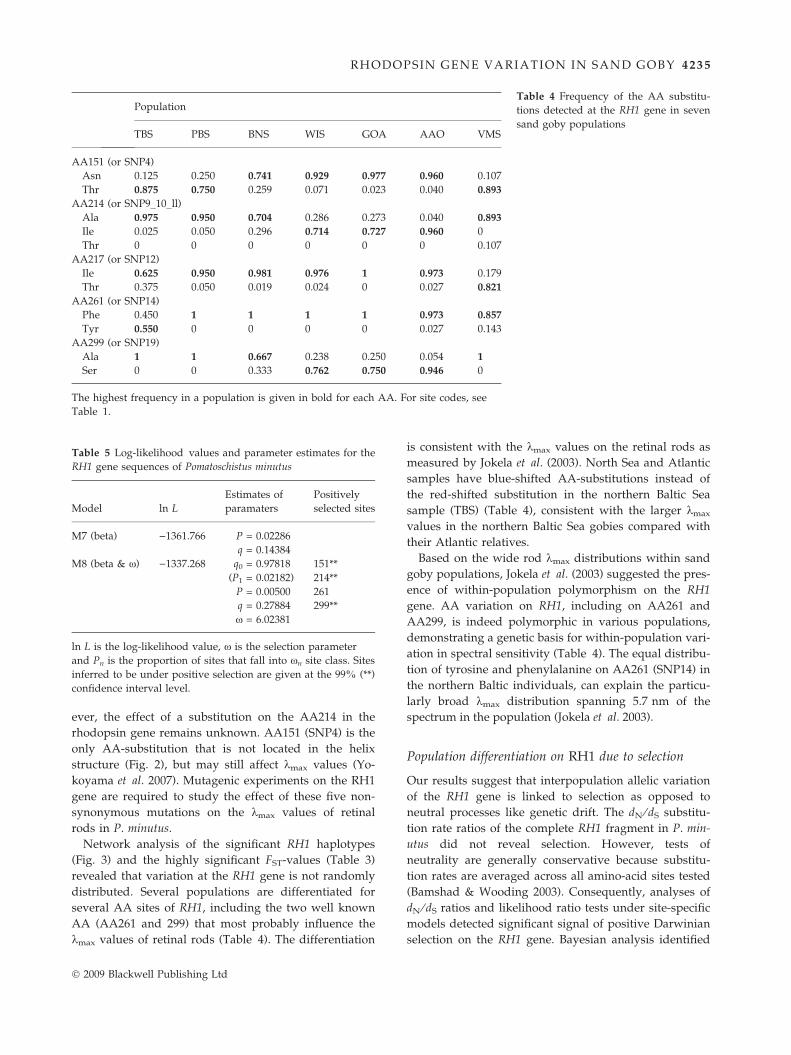
Table 4 Frequency of the AA substitu-
tions detected at the RH1 gene in seven
sand goby populations
Population
TBS PBS BNS WIS GOA AAO VMS
AA151 (or SNP4)
Asn 0.125 0.250 0.741 0.929 0.977 0.960 0.107
Thr 0.875 0.750 0.259 0.071 0.023 0.040 0.893
AA214 (or SNP9_10_ll)
Ala 0.975 0.950 0.704 0.286 0.273 0.040 0.893
Ile 0.025 0.050 0.296 0.714 0.727 0.960 0
Thr 0 0 0 0 0 0 0.107
AA217 (or SNP12)
Ile 0.625 0.950 0.981 0.976 1 0.973 0.179
Thr 0.375 0.050 0.019 0.024 0 0.027 0.821
AA261 (or SNP14)
Phe 0.450 1 1 1 1 0.973 0.857
Tyr 0.550 0 0 0 0 0.027 0.143
AA299 (or SNP19)
Ala 1 1 0.667 0.238 0.250 0.054 1
Ser 0 0 0.333 0.762 0.750 0.946 0
The highest frequency in a population is given in bold for each AA. For site codes, see
Table 1.
Table 5 Log-likelihood values and parameter estimates for the
RH1 gene sequences of Pomatoschistus minutus
Model ln L
Estimates of
paramaters
Positively
selected sites
M7 (beta) )1361.766 P = 0.02286
q = 0.14384
M8 (beta & x) )1337.268 q0 = 0.97818 151**
(P1 = 0.02182) 214**
P = 0.00500 261
q = 0.27884 299**
x = 6.02381
ln L is the log-likelihood value, x is the selection parameter
and Pn is the proportion of sites that fall into xn site class. Sites
inferred to be under positive selection are given at the 99% (**)
confidence interval level.
RH ODOPSIN G ENE VA RI ATI ON IN SAND GOBY 4 23 5
ever, the effect of a substitution on the AA214 in the
rhodopsin gene remains unknown. AA151 (SNP4) is the
only AA-substitution that is not located in the helix
structure (Fig. 2), but may still affect kmax values (Yo-
koyama et al. 2007). Mutagenic experiments on the RH1
gene are required to study the effect of these five non-
synonymous mutations on the kmax values of retinal
rods in P. minutus.
Network analysis of the significant RH1 haplotypes
(Fig. 3) and the highly significant FST-values (Table 3)
revealed that variation at the RH1 gene is not randomly
distributed. Several populations are differentiated for
several AA sites of RH1, including the two well known
AA (AA261 and 299) that most probably influence the
kmax values of retinal rods (Table 4). The differentiation
� 2009 Blackwell Publishing Ltd
is consistent with the kmax values on the retinal rods as
measured by Jokela et al. (2003). North Sea and Atlantic
samples have blue-shifted AA-substitutions instead of
the red-shifted substitution in the northern Baltic Sea
sample (TBS) (Table 4), consistent with the larger kmax
values in the northern Baltic Sea gobies compared with
their Atlantic relatives.
Based on the wide rod kmax distributions within sand
goby populations, Jokela et al. (2003) suggested the pres-
ence of within-population polymorphism on the RH1
gene. AA variation on RH1, including on AA261 and
AA299, is indeed polymorphic in various populations,
demonstrating a genetic basis for within-population vari-
ation in spectral sensitivity (Table 4). The equal distribu-
tion of tyrosine and phenylalanine on AA261 (SNP14) in
the northern Baltic individuals, can explain the particu-
larly broad kmax distribution spanning 5.7 nm of the
spectrum in the population (Jokela et al. 2003).
Population differentiation on RH1 due to selection
Our results suggest that interpopulation allelic variation
of the RH1 gene is linked to selection as opposed to
neutral processes like genetic drift. The dN ⁄ dS substitu-
tion rate ratios of the complete RH1 fragment in P. min-
utus did not reveal selection. However, tests of
neutrality are generally conservative because substitu-
tion rates are averaged across all amino-acid sites tested
(Bamshad & Wooding 2003). Consequently, analyses of
dN ⁄ dS ratios and likelihood ratio tests under site-specific
models detected significant signal of positive Darwinian
selection on the RH1 gene. Bayesian analysis identified
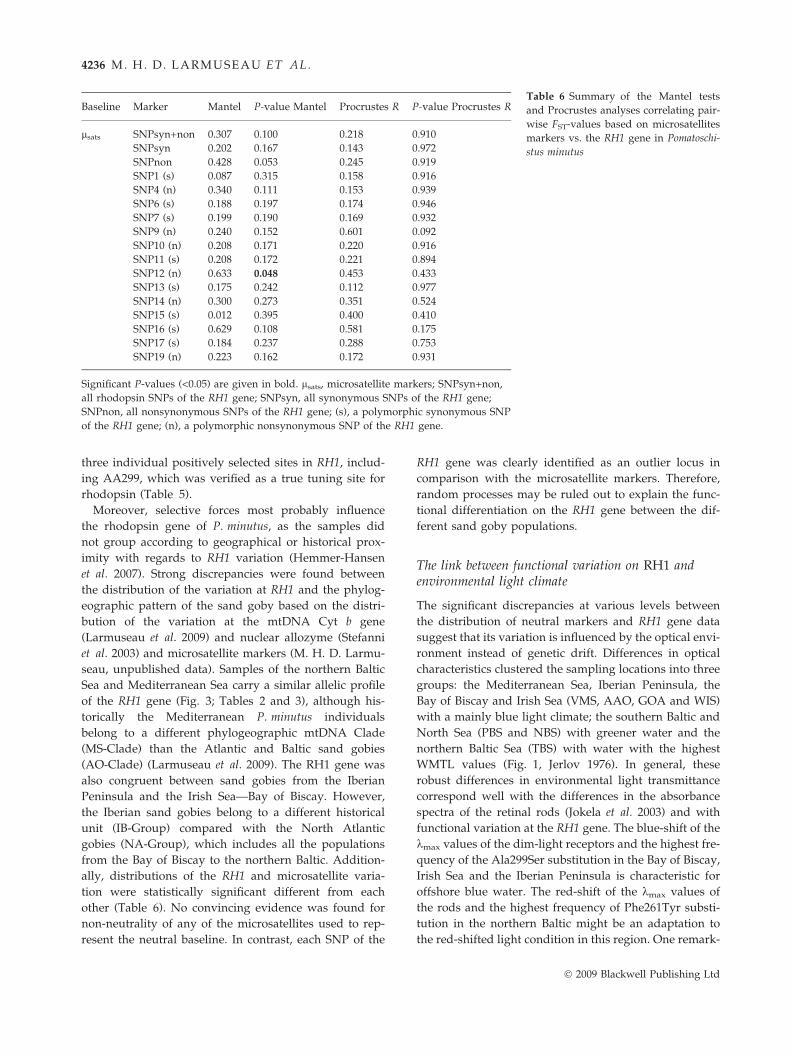
Table 6 Summary of the Mantel tests
and Procrustes analyses correlating pair-
wise FST-values based on microsatellites
markers vs. the RH1 gene in Pomatoschi-
stus minutus
Baseline Marker Mantel P-value Mantel Procrustes R P-value Procrustes R
lsats SNPsyn+non 0.307 0.100 0.218 0.910
SNPsyn 0.202 0.167 0.143 0.972
SNPnon 0.428 0.053 0.245 0.919
SNP1 (s) 0.087 0.315 0.158 0.916
SNP4 (n) 0.340 0.111 0.153 0.939
SNP6 (s) 0.188 0.197 0.174 0.946
SNP7 (s) 0.199 0.190 0.169 0.932
SNP9 (n) 0.240 0.152 0.601 0.092
SNP10 (n) 0.208 0.171 0.220 0.916
SNP11 (s) 0.208 0.172 0.221 0.894
SNP12 (n) 0.633 0.048 0.453 0.433
SNP13 (s) 0.175 0.242 0.112 0.977
SNP14 (n) 0.300 0.273 0.351 0.524
SNP15 (s) 0.012 0.395 0.400 0.410
SNP16 (s) 0.629 0.108 0.581 0.175
SNP17 (s) 0.184 0.237 0.288 0.753
SNP19 (n) 0.223 0.162 0.172 0.931
Significant P-values (<0.05) are given in bold. lsats, microsatellite markers; SNPsyn+non,
all rhodopsin SNPs of the RH1 gene; SNPsyn, all synonymous SNPs of the RH1 gene;
SNPnon, all nonsynonymous SNPs of the RH1 gene; (s), a polymorphic synonymous SNP
of the RH1 gene; (n), a polymorphic nonsynonymous SNP of the RH1 gene.
4236 M. H. D. LARMUSEAU ET AL.
three individual positively selected sites in RH1, includ-
ing AA299, which was verified as a true tuning site for
rhodopsin (Table 5).
Moreover, selective forces most probably influence
the rhodopsin gene of P. minutus, as the samples did
not group according to geographical or historical prox-
imity with regards to RH1 variation (Hemmer-Hansen
et al. 2007). Strong discrepancies were found between
the distribution of the variation at RH1 and the phylog-
eographic pattern of the sand goby based on the distri-
bution of the variation at the mtDNA Cyt b gene
(Larmuseau et al. 2009) and nuclear allozyme (Stefanni
et al. 2003) and microsatellite markers (M. H. D. Larmu-
seau, unpublished data). Samples of the northern Baltic
Sea and Mediterranean Sea carry a similar allelic profile
of the RH1 gene (Fig. 3; Tables 2 and 3), although his-
torically the Mediterranean P. minutus individuals
belong to a different phylogeographic mtDNA Clade
(MS-Clade) than the Atlantic and Baltic sand gobies
(AO-Clade) (Larmuseau et al. 2009). The RH1 gene was
also congruent between sand gobies from the Iberian
Peninsula and the Irish Sea—Bay of Biscay. However,
the Iberian sand gobies belong to a different historical
unit (IB-Group) compared with the North Atlantic
gobies (NA-Group), which includes all the populations
from the Bay of Biscay to the northern Baltic. Addition-
ally, distributions of the RH1 and microsatellite varia-
tion were statistically significant different from each
other (Table 6). No convincing evidence was found for
non-neutrality of any of the microsatellites used to rep-
resent the neutral baseline. In contrast, each SNP of the
RH1 gene was clearly identified as an outlier locus in
comparison with the microsatellite markers. Therefore,
random processes may be ruled out to explain the func-
tional differentiation on the RH1 gene between the dif-
ferent sand goby populations.
The link between functional variation on RH1 andenvironmental light climate
The significant discrepancies at various levels between
the distribution of neutral markers and RH1 gene data
suggest that its variation is influenced by the optical envi-
ronment instead of genetic drift. Differences in optical
characteristics clustered the sampling locations into three
groups: the Mediterranean Sea, Iberian Peninsula, the
Bay of Biscay and Irish Sea (VMS, AAO, GOA and WIS)
with a mainly blue light climate; the southern Baltic and
North Sea (PBS and NBS) with greener water and the
northern Baltic Sea (TBS) with water with the highest
WMTL values (Fig. 1, Jerlov 1976). In general, these
robust differences in environmental light transmittance
correspond well with the differences in the absorbance
spectra of the retinal rods (Jokela et al. 2003) and with
functional variation at the RH1 gene. The blue-shift of the
kmax values of the dim-light receptors and the highest fre-
quency of the Ala299Ser substitution in the Bay of Biscay,
Irish Sea and the Iberian Peninsula is characteristic for
offshore blue water. The red-shift of the kmax values of
the rods and the highest frequency of Phe261Tyr substi-
tution in the northern Baltic might be an adaptation to
the red-shifted light condition in this region. One remark-
� 2009 Blackwell Publishing Ltd
RH ODOPSIN G ENE VA RI ATI ON IN SAND GOBY 4 23 7
able observation is that the individuals of the Mediterra-
nean Sea clustered with the northern Baltic samples
based on the RH1 variation. In the Mediterranean Sea,
coastal lagoons play an important role in the life cycle of
sand gobies as nurseries and feeding sites (Bouchereau &
Guelorget 1998), whereas this is not the case for Atlantic
sand gobies (Guelinckx et al. 2008). These lagoons, which
are not included in Fig. 1, are characterized by a much
higher turbidity than offshore (Poizat et al. 2004). Such
conditions are thought to require spectral adaptations
similar to those in the Northern Baltic.
Conclusion
The three conditions to demonstrate local adaptation at
the rhodopsin gene of the sand goby are fulfilled. First,
functional polymorphism was observed in the RH1
gene. Then, it was demonstrated that population differ-
entiation at the RH1 gene was because of selection.
Finally, a correlation was found between RH1 variation
and the specific spectral characteristics of the habitat
environment of the sand goby. Therefore, there are
good indicators for local adaptation of the rhodopsin
gene in Pomatoschistus minutus. Further molecular
research with a higher sampling resolution in space and
time is required to disentangle the temporal variability
of the RH1 polymorphism and the small-scale differen-
tiation on the RH1 gene for P. minutus inside the vari-
ous marine systems.
The hypothesis that sand gobies are evolutionary
adapted to their optical environment implies that rapid
changes in optical habitat characteristics may have neg-
ative consequences. For example, increased water tur-
bidity by algal blooms in the highly polluted Baltic Sea
negatively influenced sexual behaviour of fishes with a
visual mating system. Cases have been documented for
sand goby (Jarvenpaa & Lindstrom 2004) and three-
spined stickleback (Gasterosteus aculeatus) (Engstrom-Ost
& Candolin 2007; Candolin et al. 2008). Water quality of
lagoonal and coastal waters can be influenced by
anthropogenic changes in the nutrient load and by cli-
matic factors. Therefore, if temperature continues to
rise, spectral transmission of the water may shift with
temperature (Archer et al. 2001). A marine monitoring
program for water clarity and optical properties is
therefore recommended, not only to consider their
effect on primary productivity but also because of their
direct influence on the visual capacity of the fish com-
munity (Aksnes 2007) and other organisms.
Acknowledgements
We thank the following persons who generous provided sam-
ples: Pilar Drake (CSIC, Spain), Maria Jarvi-Laturi (University
� 2009 Blackwell Publishing Ltd
of Helsinki, Finland), Kai Lindstrom (Abo Akademi University,
Finland), Katarzyna Waligora-Borek (University of Gdansk,
Poland), Ian McCarthy (University of Wales, Bangor, UK),
Mario Lepage (Ifremer, France), Jef Guelinckx (Flemish Goby
Consortium, Belgium) & Alain Crivelli (Station Biologique de
la Tour du Valat, France). We also thank the ‘Marine Genomics
Europe’ Network of excellence, subject editor Michael Hansen,
five anonymous referees and Anne Christine Utne-Palm, Luisa
Orsini, Gregory Maes, Hendrik Larmuseau, Bart Hellemans &
Erika Souche for useful discussions and technical assistance.
The first author received a PhD-fellowship of the Institute for
the Promotion of Innovation through Science and Technology
in Flanders (IWT-Vlaanderen). The second author received a
postdoctoral fellowship of Fund for Scientific Research—Flan-
ders (FWO-Vlaanderen). This study was part of the WEST-
BANKS project financed by the Belgian Federal Office for
Scientific, Technical and Cultural Affairs (contract nr
SD ⁄ BN ⁄ 01A).
References
Aarnio K, Bonsdorff E (1993) Seasonal-variation in abundance
and diet of the sand goby Pomatoschistus minutus (Pallas) in
a northern Baltic archipelago. Ophelia, 37, 19–30.
Aksnes DL (2007) Evidence for visual constraints in large
marine fish stocks. Limnology and Oceanography, 52, 198–203.
Anisimova M, Nielsen R, Yang ZH (2003) Effect of
recombination on the accuracy of the likelihood method for
detecting positive selection at amino acid sites. Genetics, 164,
1229–1236.
Antao T, Lopes A, Lopes RJ, Beja-Pereira A, Luikart G (2008)
LOSITAN: a workbench to detect molecular adaptation
based on a FST outlier method. BMC Bioinformatics, 9, 323.
Archer SN, Lythgoe JN, Hall L (1992) Rod opsin cDNA
sequence from the sand goby (Pomatoschistus minutus)
compared with those of other vertebrates. Proceedings of the
Royal Society of London. Series B: Biological Sciences, 248, 19–25.
Archer S, Hirano J, Vallerga S (2001) The effects of variability
of marine ecosystems on the visual sensitivity of fish. Archo
Oceanography Limnology, 22, 119–126.
Asenjo AB, Rim J, Oprian DD (1994) Molecular determinants
of human red ⁄ green color discrimination. Neuron, 12, 1131–
1138.
Audzijonyte A, Pahlberg J, Vainola R, Lindstrom M (2005)
Spectral sensitivity differences in two Mysis sibling species
(Crustacea, Mysida): adaptation or phylogenetic constraints?
Journal of Experimental Marine Biology and Ecology, 325, 228–
239.
Bamshad M, Wooding SP (2003) Signatures of natural selection
in the human genome. Nature Reviews Genetics, 4, 99–111A.
Beaumont MA, Nichols RA (1996) Evaluating loci for use in
the genetic analysis of population structure. Proceedings of the
Royal Society of London. Series B: Biological Sciences, 263, 1619–
1626.
Belkhir K, Borsa P, Chikhi L, Raufaste N, Bonhomme F (2004)
GENETIX 4.05, Logiciel Sous WindowsTM pour la Genetique Des
Populations. Universite de Montpellier II, Montpellier, France.
Bouchereau JL, Guelorget O (1998) Comparison of three
Gobiidae (Teleostei) life history strategies over their
geographical range. Oceanologica Acta, 21, 503–517.
4238 M. H. D. LARMUSEAU ET AL.
Bowmaker JK (1995) The visual pigments of fish. Progress in
Retinal and Eye Research, 15, 1–31.
Candolin U, Engstrom-Ost J, Salesto T (2008) Human-induced
eutrophication enhances reproductive success through effects
on parenting ability in sticklebacks. Oikos, 117, 459–465.
Canino MF, O’Reilly PT, Hauser L, Bentzen P (2005) Genetic
differentiation in walleye pollock (Theragra chalcogramma) in
response to selection at the pantophysin (Pan I) locus.
Canadian Journal of Fisheries and Aquatic Sciences, 62, 2519–
2529.
Chen WJ, Bonillo C, Lecointre G (2003) Repeatability of clades
as a criterion of reliability: a case study for molecular
phylogeny of Acanthomorpha (Teleostei) with larger number
of taxa. Molecular Phylogenetics and Evolution, 26, 262–288.
Clarke KR (1993) Nonparametric multivariate analyses of
changes in community structure. Australian Journal of
Ecology, 18, 117–143.
Clement M, Posada D, Crandall KA (2000) TCS: a computer
program to estimate gene genealogies. Molecular Ecology, 9,
1657–1659.
Conover DO, Clarke LM, Munch SB, Wagner GN (2006)
Spatial and temporal scales of adaptive divergence in marine
fishes and the implications for conservation. Journal of Fish
Biology, 69, 21–47.
Cowen RK, Lwiza KMM, Sponaugle S, Paris CB, Olson DB
(2000) Connectivity of marine populations: open or closed?
Science, 287, 857–859.
Dann SG, Allison WT, Levin DB, Taylor JS, Hawryshyn CW
(2004) Salmonid opsin sequences undergo positive selection
and indicate an alternate evolutionary relationship in
Oncorhynchus. Journal of Molecular Evolution, 58, 400–412.
Debes PV, Zachos FE, Hanel R (2008) Mitochondrial
phylogeography of the European sprat (Sprattus sprattus L.,
Clupeidae) reveals isolated climatically vulnerable
populations in the Mediterranean Sea and range expansion
in the northeast Atlantic. Molecular Ecology, 17, 3873–3888.
Ehrenberg SZ, Ejdung G (2008) Daily activity pattern of the
sand goby, Pomatoschistus minutus (Pisces), at low light
intensity. Hydrobiologia, 603, 129–137.
Engstrom-Ost J, Candolin U (2007) Human-induced water
turbidity alters selection on sexual displays in sticklebacks.
Behavioral Ecology, 18, 393–398.
Excoffier L, Laval G, Schneider S (2005) ARLEQUIN ver.3.0: an
integrated software package for population genetics data
analysis. Evolutionary Bioinformatics Online, 1, 47–50.
Fasick JI, Robinson PR (1998) Mechanism of spectral tuning in
the dolphin visual pigments. Biochemistry, 37, 433–438.
Gower JC (1975) Generalized Procrustes analysis.
Psychometrika, 40, 33–51.
Guelinckx J, Maes J, Geysen B, Ollevier F (2008) Estuarine
recruitment of a marine goby reconstructed with an isotopic
clock. Oecologia, 157, 41–52.
Hamerlynck O (1990) The identification of Pomatoschistus
minutus (Pallas) and Pomatoschistus lozanoi (de Buen) (Pisces,
Gobiidae). Journal of Fish Biology, 37, 723–728.
Hargrave PA, McDowell JH (1992) Rhodopsin and
phototransduction—a model system for G-protein-linked
receptors. FASEB Journal, 6, 2323–2331.
Healey MC (1971) Distribution and abundance of sand gobies,
Gobius minutus, in Ythan estuary. Journal of Zoology, 163, 177–
229.
Hemmer-Hansen J, Nielsen EE, Frydenberg J, Loeschcke V
(2007) Adaptive divergence in a high gene flow
environment: Hsc70 variation in the European flounder
(Platichthys flesus L.). Heredity, 99, 592–600.
Hunt DM, Fitzgibbon J, Slobodyanyuk SJ, Bowmaker JK (1996)
Spectral tuning and molecular evolution of rod visual
pigments in the species flock of cottoid fish in Lake Baikal.
Vision Research, 36, 1217–1224.
Hunt DM, Dulai KS, Partridge JC, Cottrill P, Bowmaker JK
(2001) The molecular basis for spectral tuning of rod visual
pigments in deep-sea fish. Journal of Experimental Biology,
204, 3333–3344.
Hunt DM, Carvalho LS, Cowing JA et al. (2007) Spectral
tuning of shortwave-sensitive visual pigments in vertebrates.
Photochemistry and Photobiology, 83, 303–310.
Jackson DA (1995) Protest—a Procrustean randomization test
of community environment concordance. Ecoscience, 2, 297–
303.
Jarvenpaa M, Lindstrom K (2004) Water turbidity by algal
blooms causes mating system breakdown in a shallow-water
fish, the sand goby Pomatoschistus minutus. Proceedings of the
Royal Society of London. Series B: Biological Sciences, 271, 2361–
2365.
Jerlov N (1976) Marine Optics. Elsevier, Amsterdam, 231 pp.
Jokela M, Vartio A, Paulin L, Fyhrquist-Vanni N, Donner K
(2003) Polymorphism of the rod visual pigment between
allopatric populations of the sand goby (Pomatoschistus
minutus): a microspectrophotometric study. Journal of
Experimental Biology, 206, 2611–2617.
Jukes TH, Cantor CR (1969) Evolution of protein molecules. In:
Mammalian Protein Metabolis (ed. Munro HN), pp. 21–132.
Academic Press, New York.
Knutsen H, Jorge PE, Andre C, Stenseth NC (2003) Fine-scaled
geographical population structuring in a highly mobile marine
species: the Atlantic cod. Molecular Ecology, 12, 385–394.
Larmuseau MHD, Hellemans B, Van Houdt JKJ, Volckaert FAM
(2007) Development and characterization of nine polymorphic
microsatellite markers in the sand goby Pomatoschistus
minutus (Gobiidae). Molecular Ecology Notes, 7, 147–149.
Larmuseau MHD, Guelinckx J, Hellemans B, Van Houdt JKJ,
Volckaert FAM (2008) Fast PCR-RFLP method facilitates
identification of Pomatoschistus species in the North Atlantic.
Journal of Applied Ichthyology, 24, 342–344.
Larmuseau MHD, Van Houdt JKJ, Guelinckx J, Hellemans B,
Volckaert FAM (2009) Distributional and demographic
consequences of Pleistocene climate fluctuations for a marine
demersal fish in the NE Atlantic. Journal of Biogeography, 36,
1138–1151.
Legendre P (2000) Comparison of permutation methods for the
partial correlation and partial Mantel tests. Journal of
Statistical Computation and Simulation, 67, 37–73.
Lindstrom M (2000) Eye function of Mysidacea (Crustacea) in
the northern Baltic Sea. Journal of Experimental Marine Biology
and Ecology, 246, 85–101.
Luttikhuizen PC, Campos J, Van Bleijswijk J, Peijnenburg
KTCA, van der Veer HW (2008) Phylogeography of the
common shrimp, Crangon crangon (L.) across its distribution
range. Molecular Phylogenetics and Evolution, 46, 1015–1030.
Mantel N (1967) The detection of disease clustering and
generalised regression approach. Cancer Research, 27, 209–
220.
� 2009 Blackwell Publishing Ltd

RH ODOPSIN G ENE VA RI ATI ON IN SAND GOBY 4 23 9
Miller PJ (1986) Gobiidae. In: Fishes of the North-Eastern Atlantic
and Mediterranea (eds Whitehead PJP, Bauchot M-L, Hureau
JC, Nielsen J, Tortononese E), pp. 1019–1085. UNESCO, Paris.
Nei M, Gojobori T (1986) Simple methods for estimating the
numbers of synonymous and nonsynonymous nucleotide
substitutions. Molecular Biology and Evolution, 3, 418–426.
Nielsen R, Yang Z (1998) Likelihood models for detecting
positively selected amino acid sites and applications to the
HIV-1 envelope gene. Genetics, 148, 929–936.
Oksanen J, Kindt R, Legendre P, O’Hara RB (2007) VEGAN:
Community ecology package, version 1.8-5. Available from:
http://cran.r-project.org/.
Pampoulie C, Stefansson MO, Jorundsdottir TD, Danilowicz
BS, Danielsdottir AK (2008) Recolonization history and large-
scale dispersal in the open sea: the case study of the North
Atlantic cod, Gadus morhua L. Biological Journal of the Linnean
Society, 94, 315–329.
Park JH, Scheerer P, Hofmann KP, Choe H-W, Ernst OP (2008)
Crystal structure of the ligand-free G-protein-coupled
receptor opsin. Nature, 454, 183–187.
Poizat G, Rosecchi E, Chauvelon P, Contournet P, Crivelli AJ
(2004) Long-term fish and macro-crustacean community
variation in a Mediterranean lagoon. Estuarine Coastal and
Shelf Science, 59, 615–624.
Rozas J, Sanchez-DelBarrio JC, Messeguer X, Rozas R (2003)
DnaSP, DNA polymorphism analyses by the coalescent and
other methods. Bioinformatics, 19, 2496–2497.
Rozen S, Skaletsky HJ (1998) Primer 3. Available from: http://
frodo.wi.mit.edu/primer3/
Ruzzante DE, Taggart CT, Cook D (1998) A nuclear DNA basis
for shelf- and bank-scale population structure in northwest
Atlantic cod (Gadus morhua): Labrador to Georges Bank.
Molecular Ecology, 7, 1663–1680.
Sherman CDH, Ayre DJ (2008) Fine-scale adaptation in a clonal
sea anemone. Evolution, 62, 1373–1380.
Stefanni S, Gysels ES, Volckaert FAM, Miller PJ (2003)
Allozyme variation and genetic divergence in the sand goby,
Pomatoschistus minutus (Teleostei: Gobiidae). Journal of the
Marine Biological Association of the United Kingdom, 83, 1143–
1149.
Stephens M, Donnelly P (2003) A comparison of Bayesian
methods for haplotype reconstruction from population
genotype data. American Journal of Human Genetics, 73, 1162–
1169.
Stephens M, Smith NJ, Donnelly P (2001) A new statistical
method for haplotype reconstruction from population data.
American Journal of Human Genetics, 68, 978–989.
Tamura K, Dudley J, Nei M, Kumar S (2007) MEGA4: molecular
evolutionary genetics analysis (MEGA) software version 4.0.
Molecular Biology and Evolution, 24, 1596–1599.
Thetmeyer H (1997) Diel rhythms of swimming activity and
oxygen consumption in Gobiusculus flavescens (Fabricius) and
Pomatoschistus minutus (Pallas) (Teleostei: Gobiidae). Journal
of Experimental Marine Biology and Ecology, 218, 187–198.
Yang ZH, Wong WSW, Nielsen R (2005) Bayes emirical Bayes
inference of amino acid sites under positive selection.
Molecular Biology and Ecology, 22, 1107–1118.
� 2009 Blackwell Publishing Ltd
Yang Z (2007) PAML4: phylogenetic analysis by maximum
likelihood. Molecular Biology and Evolution, 24, 1586–1591.
Yang Z, Nielsen R, Goldman N, Pedersen A-MK (2000) Codon-
substitution models for heterogeneous selection pressure at
amino acid sites. Genetics, 155, 431–449.
Yokoyama S (2000) Molecular evolution of vertebrate visual
pigments. Progress in Retinal and Eye Research, 19, 385–419.
Yokoyama S, Takenaka N (2004) The molecular basis of
adaptive evolution of squirrelfish rhodopsins. Molecular
Biology and Evolution, 21, 2071–2078.
Yokoyama R, Knox BE, Yokoyama S (1995) Rhodopsin from
the fish, Astyanax—role of tyrosine-261 in the red shift.
Investigative Ophthalmology & Visual Science, 36, 939–945.
Yokoyama S, Tada T, Yamato T (2007) Modulation of the
absorption maximum of rhodopsin by amino acids in the C-
terminus. Photochemistry and Photobiology, 83, 236–241.
Zane L (2007) Adaptive divergence overcoming gene flow.
Heredity, 99, 565–566.
M.H.D.L. defended his PhD on the relationship between
phylogeography and local adaptation in marine fish. J.A.M.R.
studies the ecology and evolution of three-spined stickleback.
K.R.’s research interests are in marine optics and optical
remote sensing. J.K.J.V.H. is interested in conservation genetics
and genomic approaches. F.A.M.V.’s research comprises the
population genetics and evolutionary biology of marine and
freshwater fishes and their parasites.
Supporting information
Additional supporting information may be found in the online
version of this article.
Table S1 Rhodopsin haplotypes and their geographical distri-
bution in Pomatoschistus minutus. The numbers of haplotypes
reconstructed with a probability ‡95% (estimated using PHASE
2.0.2) are listed in bold. The numbers of haplotypes that were
nonsignificantly reconstructed are given in italic and between
brackets. Dots indicate homology with haplotype RhP1. For
site abbreviations, see Table 1
Table S2 Nucleotide polymorphisms at the RH1 gene in seven
sand goby populations. Dots indicate homology with the refer-
ence sequence (Accession no. X62405 or haplotype RhP1). AA
numbers are listed for the nonsynonymous mutations, which
are listed in bold. For site codes, see Table 1
Appendix S1 Estimates of wavelengths of maximally trans-
mitted light for European seas: theory and description of
method.
Please note: Wiley-Blackwell is not responsible for the content
or functionality of any supporting information supplied by the
authors. Any queries (other than missing material) should be
directed to the corresponding author for the article.