Attenuation of coda waves in the Northeastern Region of India
20
J Seismol (2009) 13:141–160 DOI 10.1007/s10950-008-9132-0 ORIGINAL ARTICLE Attenuation of coda waves in the Northeastern Region of India Devajit Hazarika · Saurabh Baruah · Naba Kumar Gogoi Received: 27 December 2006 / Accepted: 4 August 2008 / Published online: 5 September 2008 © Springer Science + Business Media B.V. 2008 Abstract Coda wave attenuation quality factor Qc is estimated in the northeastern region of India using 45 local earthquakes recorded by regional seismic network. The quality factor Qc was esti- mated using the single backscattering model mod- ified by Sato (J Phys Earth 25:27–41, 1977), in the frequency range 1–18 Hz. The attenuation and frequency dependence for different paths and the correlation of the results with geotectonics of the region are described in this paper. A total of 3,890 Qc measurements covering 187 varying paths are made for different lapse time window of 20, 30, 40, 50, 60, 70, 80, and 90 s in coda wave. The magni- tudes of the analyzed events range from 1.2 to 3.9 and focal depths range between 7 and 38 km. The source–receiver distances of the selected events range between 16 and 270 km. For 30-s duration, the mean values of the estimated Qc vary from 50 ± 12 (at 1 Hz) to 2,078 ± 211(at 18 Hz) for D. Hazarika · S. Baruah (B ) Geoscience Division, Regional Research Laboratory (CSIR), Jorhat 785 006, Assam, India e-mail: [email protected] N. K. Gogoi Seismological Observatory, National Geophysical Research Institute (CSIR) Uppal Road, Hyderabad 500 007, India the Arunachal Himalaya, 49 ± 14 (at 1 Hz) to 2,466 ± 197 (at 18 Hz) for the Indo-Burman, and 45 ± 13 (at 1 Hz) to 2,069 ± 198 (at 18 Hz) for Shillong group of earthquakes. It is observed that Qc increases with frequency portraying an average attenuation relation Qc = 52.315 ± 1.07 f (1.32 ± 0.036) for the region. Moreover, the pat- tern of Qc −1 with frequency is analogous to the estimates obtained in other tectonic areas in the world, except with the observation that the Qc −1 is much higher at 1 Hz for the northeastern region. The Qc −1 is about 10 −1.8 at 1 Hz and decreases to about 10 −3.6 at 18 Hz indicating clear frequency dependence. Pertaining to the spatial distribu- tion of Qc values, Mikir Hills and western part of Shillong Plateau are characterized by lower attenuation. Keywords Qc · Coda waves · Single backscattering · Frequency dependence · Northeastern India 1 Introduction Northeast region (NER) of India, bounded by latitude (22–30 ◦ N) and longitude (89–98 ◦ E), is seismically one of the most active zones in the world where 16 large ( M ≥ 7.0) and two great earthquakes of June 12, 1897 ( M ≥ 8.5; Oldham 1899) and August 15, 1950 ( M = 8.7; Poddar 1950; Richter 1958) occurred during the last hundred
Transcript of Attenuation of coda waves in the Northeastern Region of India
J Seismol (2009) 13:141–160DOI 10.1007/s10950-008-9132-0
ORIGINAL ARTICLE
Attenuation of coda waves in the Northeastern Regionof India
Devajit Hazarika · Saurabh Baruah ·Naba Kumar Gogoi
Received: 27 December 2006 / Accepted: 4 August 2008 / Published online: 5 September 2008© Springer Science + Business Media B.V. 2008
Abstract Coda wave attenuation quality factorQc is estimated in the northeastern region of Indiausing 45 local earthquakes recorded by regionalseismic network. The quality factor Qc was esti-mated using the single backscattering model mod-ified by Sato (J Phys Earth 25:27–41, 1977), inthe frequency range 1–18 Hz. The attenuation andfrequency dependence for different paths and thecorrelation of the results with geotectonics of theregion are described in this paper. A total of 3,890Qc measurements covering 187 varying paths aremade for different lapse time window of 20, 30, 40,50, 60, 70, 80, and 90 s in coda wave. The magni-tudes of the analyzed events range from 1.2 to 3.9and focal depths range between 7 and 38 km. Thesource–receiver distances of the selected eventsrange between 16 and 270 km. For 30-s duration,the mean values of the estimated Qc vary from50 ± 12 (at 1 Hz) to 2,078 ± 211(at 18 Hz) for
D. Hazarika · S. Baruah (B)Geoscience Division,Regional Research Laboratory (CSIR),Jorhat 785 006, Assam, Indiae-mail: [email protected]
N. K. GogoiSeismological Observatory,National Geophysical Research Institute (CSIR)Uppal Road, Hyderabad 500 007, India
the Arunachal Himalaya, 49 ± 14 (at 1 Hz) to2,466 ± 197 (at 18 Hz) for the Indo-Burman, and45 ± 13 (at 1 Hz) to 2,069 ± 198 (at 18 Hz) forShillong group of earthquakes. It is observedthat Qc increases with frequency portrayingan average attenuation relation Qc = 52.315 ±1.07 f (1.32 ± 0.036) for the region. Moreover, the pat-tern of Qc−1 with frequency is analogous to theestimates obtained in other tectonic areas in theworld, except with the observation that the Qc−1
is much higher at 1 Hz for the northeastern region.The Qc−1 is about 10−1.8 at 1 Hz and decreases toabout 10−3.6 at 18 Hz indicating clear frequencydependence. Pertaining to the spatial distribu-tion of Qc values, Mikir Hills and western partof Shillong Plateau are characterized by lowerattenuation.
Keywords Qc · Coda waves ·Single backscattering · Frequency dependence ·Northeastern India
1 Introduction
Northeast region (NER) of India, bounded bylatitude (22–30◦ N) and longitude (89–98◦ E), isseismically one of the most active zones in theworld where 16 large (M ≥ 7.0) and two greatearthquakes of June 12, 1897 (M ≥ 8.5; Oldham1899) and August 15, 1950 (M = 8.7; Poddar 1950;Richter 1958) occurred during the last hundred

142 J Seismol (2009) 13:141–160
years. These two great earthquakes have causedextensive destruction in the region killing a to-tal of 3,042 lives and a total loss of $30 million(Tillottson 1953). Consequently, the NER Indialies in the seismic zone V of India (BMTPC 2003).The zone V is the maximum rating of zone in theNational Seismicity Zoning Map of India. Mainlythree major stress fields govern the geodynamicsof NER, India. There are several tectonic faultsand lineaments (Nandy 2001). The active seismo-tectonics of the region has been the subject of sev-eral studies (e.g., Tapponier et al. 1982; Le Dainet al. 1984; Mitchel 1986; Gupta and Singh 1986;Chen and Molnar 1990; Kayal 1996; Saikia andSomerville 1998). Several hundred of earthquakes(M > 4.0) are recorded during the past decade inthe region. In view of this high seismic activityand with an intension to upgrade the improveddetection capabilities, Regional Research Labo-ratory, Jorhat (RRL-J) in collaboration with Na-tional Geophysical Research Institute, Hyderabad(NGRI-H) established progressively 14 verticalcomponent and two three-component seismic sta-tions equipped with short-period instrumentationin the year 1982. These stations are now up-graded to broadband digital stations with globalpositioning system (GPS) timing since 2001. Thehypocentral parameters are regularly published inthe form of seismic bulletins. The complex geotec-tonic setup of the NER needs better understand-ing of the measure of elastic wave attenuation andscattering in the crust. This region is not repre-sented by any proper attenuation relationship ofthe seismic waves based on digital seismic data-base. The variation of coda Q was reported byBaruah (2001) using four earthquakes recorded bythe Digital Telemetered Seismic Network of theRRL-J, a dependence of Qc on frequency varyingfrom 86 at 1.5 Hz to 960 at 12 Hz under the rela-tionship Qc = 121 f0.86 was observed for a lapsetime window of 30-s duration in coda wave. Basedon strong motion records of a single earthquake of6 August, 1988 originated in Indo-Burmese sub-duction zone (Lat = 25.14◦ N, Long = 95.12◦ E,mb = 6.8 and h = 91 km), Gupta and Kumar(2002) suggested a frequency-dependent Qc re-lationship, Qc = (86 ± 4.04) f (1.01±0.026) for theShillong–Mikir plateau and North of Halflong–
Disang thrust. Not much study on the attenuationproperty of the crust is made in the region. In thepresent study, we have used the broadband seis-mic waveform data to establish a suitable attenua-tion relation in NER India. One of the promisingmeans to study seismic wave attenuation in thecrust and lithosphere is the analysis of the codawave of local earthquakes (Aki 1969; Aki andChouet 1975; Sato 1977). Coda waves, the laterpart of the seismogram, are assumed to consist ofbackscattered S wave, which represent the hetero-geneities in the propagating media and providethe information about the average attenuationproperties of the medium. The rate of decay ofcoda wave amplitude gives an idea about the at-tenuation. Aki (1969) and Sato (1977) proposedthat the rate of decay could be quantified by aquality factor Qc or coda Q, characterized byseismic wave scattering, with higher values of Qcrepresenting slower decay. Several authors (e.g.,Aki and Chouet 1975; Sato 1977; Rautian andKhalturin 1978; Herrmann 1980; Roecker et al.1982; Ibanez et al. 1990; Herak 1991; Novelo-Casanova and Lee 1991; Woodgold 1992; Guptaet al. 1998; Giampiccolo et al. 2004; Biescas et al.2007) observed that the use of coda wave is theeasiest way to estimate the attenuation, backscat-tering, and source spectrum. Generally, the at-traction of using coda is the isolation of scatteredenergy from the other phases. Qc estimates theattenuation per travel distance on the basis ofspatially uniform distribution of coda-energy at along lapse time.
In this study, a single backscattering modelproposed by Aki and Chouet (1975) and modifiedby Sato (1977) has been used to estimate qualityfactor Qc for three tectonic blocks in NER, India,namely Eastern Himalaya and suture zone,Shillong Plateau and Mikir Hills, and Indo-Burmese region. The results of this study are high-lighted here.
2 Tectonic setup and seismicity
The area of present study, delimited by latitude22◦ to 30◦ N and longitude 89◦ to 98◦ E, coversthe NER, India and the adjoining areas (Fig. 1).
J Seismol (2009) 13:141–160 143
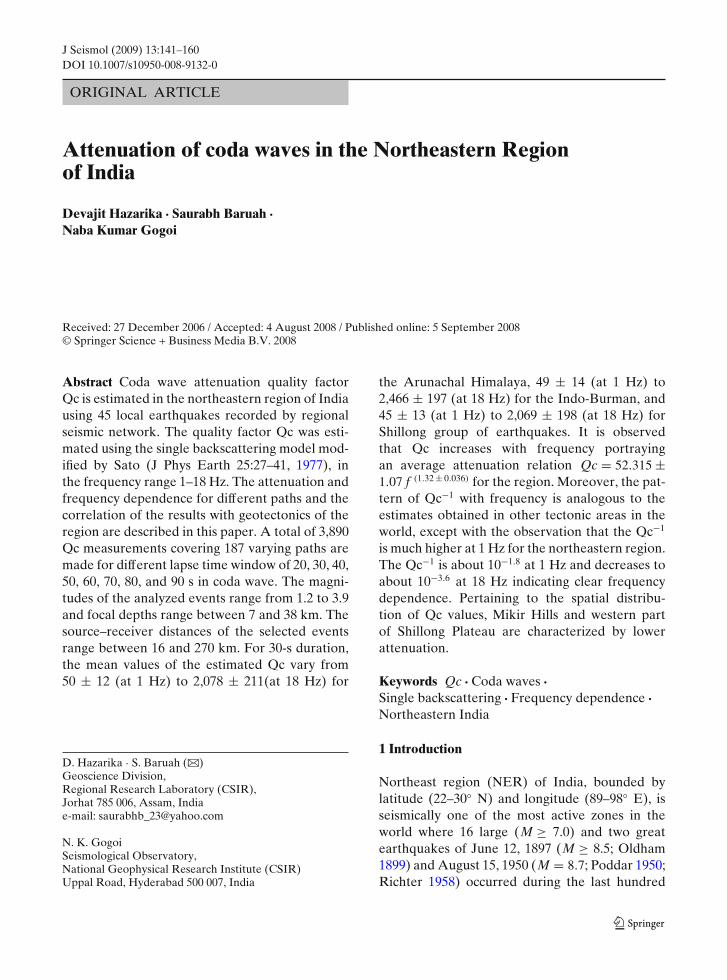
Fig. 1 Tectonic map ofNorth Eastern Region ofIndia showing epicentraldistribution of the eventsused in this study and theRRL-J–NGRI-Hbroadband recordingstations supplemented bystations operated byManipur University andGauhati University
The region under study can be divided into thefollowing tectonic domains (Nandy 2001):
1. The eastern Himalaya collision belt to thenorth, which includes the trans-HimalayanTethyan zone and the Andean type gran-odiorite margin comprising the main bound-ary thrust (MBT) and main central thrust(MCT). The Eastern syntaxis zone where theHimalayan arc and the Burmese arc meetsthe Mishimi block. This zone is folded andthrusted by the Lohit and Mishimi thrusts(MT). This zone was the source area for the1950 great earthquake.
2. The Indo-Burma subduction zone to theeast where the Indian lithosphere is believedto be subducting below Indo-Burma ranges.(Satyabala 1998)
3. The Shillong Plateau, the Mikir Hills, and theAssam valley jawed between the Himalayanarc and Burma arc (Mazumder 1976; Curray
et al. 1982). The major tectonic features arethe Dauki fault and Kopili fault. The E–Wtrending Dauki fault separates the ShillongPlateau to the north and the Bengal basin tothe south, and the NW trending Kopili faultseparates the Shillong Plateau and the MikirHills (Fig. 1).
Among the other tectonic features, the N–Strending Dhubri fault and the Brahmaputra linea-ment are prominent. Dhubri fault demarcates thewestern margin of the Shillong Plateau.
The seismic activity in NER is mostly asso-ciated with these major tectonic elements. Sev-eral authors (e.g., Fitch 1970; Chen and Molnar1990; Nandy and Das Gupta 1991; Kayal 1996;Sitaram et al. 2001) discussed the seismicity andseismotectonics of the region. The major faultsystems, i.e., MBT, MCT in the north, and MTtowards northeast, show activity with shallowearthquakes. There are numbers of seismic events

144 J Seismol (2009) 13:141–160
concentrating near Tezpur (south of the MBT)and Kaziranga (in Mikir Hills) and extendingalong the Brahmaputra lineament. The upperBrahmaputra (Assam) valley seems to be broadlyaseismic (Khattri 1987).
In the Indo-Burma tectogene, based on CMTcatalog data, Ravikumar et al. (1996) suggestedright lateral strike-slip faulting mostly in the upperpart of the zone and thrust faulting below 90-kmdepth. Satyabala (1998), based on the stress fieldstudy, argued that there is an active subduction ofthe Indian plate below the Indo-Burma ranges.
Shillong plateau covering Chedrang fault,Dhubri fault, and Dauki fault system shows sig-nificant activity; the trend of P-axis of the focalmechanism solutions has been dominantly NNW.This indicates that contemporary tectonics of thistectonic domain have been governed by NNW-directed stress field (Baruah et al. 1997). Theseismic activities in the Shillong Plateau are foundnotably high at a depth range of 10–20 kmwith an average seismogenic zone up to 30 km(Baruah 2004). Mostly thrust faulting earthquakesare predominant in the Shillong Plateau. Theplateau had been the source area for the 1897great Assam earthquake. Pop-up tectonics is ad-vocated for the plateau seismicity (Bilham andEngland 2001).
3 Data source
In this study, we selected 45 earthquakes (seeTable 1) recorded by regional seismic network(RRL-J and NGRI-H) during 2000–2003. Theseevents are recorded with higher signal-to-noiseratio and having clear coda waves. One hundredeighty-seven seismograms were used for the se-lected 45 events. The epicentral distribution of theselected earthquakes is shown in Fig. 1.
The precision of hypocenter determinationdepends not only on the distribution of therecording stations but also on velocity structurebetween source and station, particularly in areawhere lateral heterogeneities are extreme (Okadaet al. 1970). The epicenters are determined usingthe HYPOCENTER location program of Lienertet al. (1986) based on the crustal velocity model ofGupta et al. (1984). To the present database, the
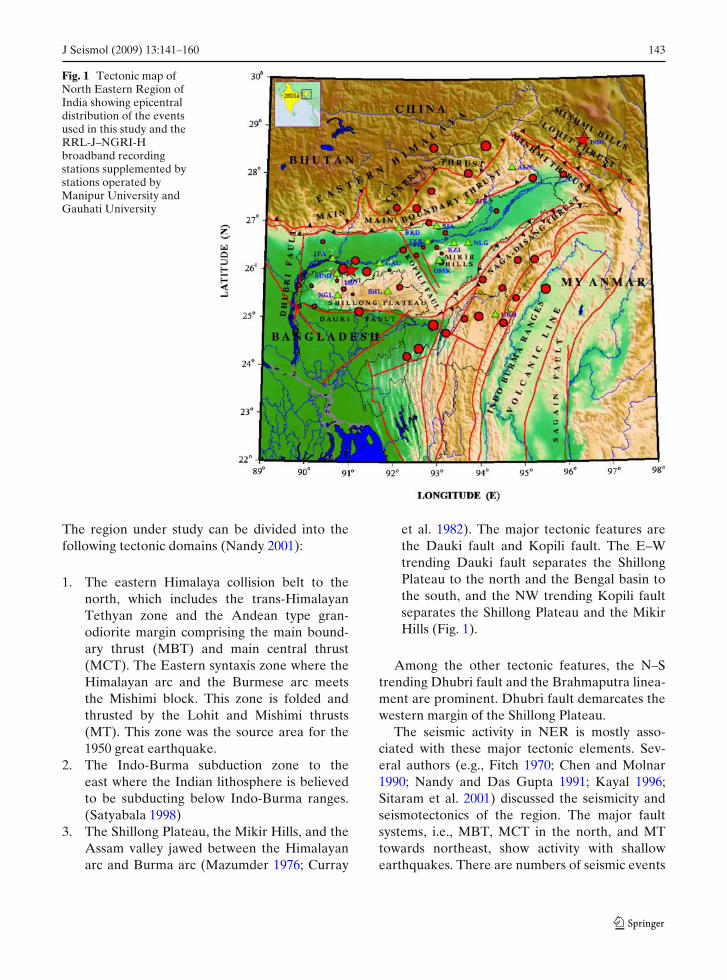
uncertainties involved in the estimates of epicen-ters and origin times are of the order 0–2 km and0–0.5 s, respectively. The uncertainties involvedin the estimates of focal depths are 0–1 km for85% and 1–2 km for 15% of total number ofearthquakes located. We believe that the depthcontrol is reasonably good. Besides the RRL-J–NGRI-H network data, the arrival time dataalso used are reported by the seismic stationsmaintained by the India Meteorological Depart-ment at SHL, Gauhati University, Manipur Uni-versity, and Mizoram University. This providedbetter azimuthal control for the determinationof hypocentral parameters. Incidentally, some ofthese digital seismic stations are also equippedwith broadband seismometers as depicted inTable 2. Waveforms obtained from these stationsare also used in this study. GPS time synchroniza-tion was maintained with the records. The stationsare operated both in continuous and event-triggermode and recorded at a rate of 100 samples persecond. To avoid aliasing effects, low pass filterswith corner frequencies of 50 Hz were applied.The recorded seismograms have been correctedby using an instrument response based on theelectrodynamic constant, critical damping, nat-ural frequency of seismometer, and bit weightof unit gain of each recording unit for all sta-tions. Figure 2 shows an example for the sta-tion Mendipather (MND) in East Garo Hills,Meghalaya, that contains a typical estimate of(a) frequency response to the ground velocity withknown pole-zero distribution and (b) the plot ofthe system noise power as noncoherent powerfor vertical (Z = red) and horizontal sensors(N = green and E = blue) up to 10-s period band.The power spectral estimates have been correctedfor the system response and gain representing thesensor input. The station MND is instrumentalin the low-noise model (LNM; Peterson 1993);however, the highest power levels (red, green, andblue) are not significantly higher (<26%) thanthe LNM. The three lines approach the LNMindicating that the station minimum reflects ac-tual ambient noise conditions across the wholespectrum.
The source–receiver distances of the selectedevent range from 16 to 270 km. Duration mag-nitude (MD) of the events are estimated in the

J Seismol (2009) 13:141–160 145
Table 1 Hypocentral parameters of the events used in this study
Sl. no. Date Origin time Location Focal depth Magnitude
Hr. Mn. Sec. Lat.◦N Long.◦E (km) (MDA)
1 20000813 12 16 20.53 27.99 96.00 21 3.22 20011118 18 15 47.85 25.82 94.07 20 3.33 20011118 19 37 26.30 26.18 93.11 36 2.84 20011118 20 18 44.89 27.93 95.27 32 3.45 20011118 22 32 48.57 26.33 92.52 35 2.76 20011119 12 16 43.43 26.03 90.82 27 3.87 20011120 19 06 50.38 25.00 93.64 28 3.28 20011120 21 35 04.12 26.80 93.20 10 2.79 20011121 04 51 50.85 26.22 94.89 21 3.310 20011121 11 52 28.64 27.01 92.82 24 3.011 20011121 12 31 44.47 26.50 92.68 37 2.412 20011122 11 53 55.98 26.37 93.11 10 2.113 20011122 12 48 24.73 24.70 93.21 20 3.514 20011123 13 11 36.25 26.49 93.00 30 2.515 20011123 15 41 19.19 27.31 92.53 22 3.416 20011123 18 58 02.67 24.91 94.54 30 3.417 20011124 22 10 42.65 28.04 93.75 20 3.518 20011125 12 53 39.36 26.44 92.22 38 3.119 20011125 18 03 55.08 25.98 91.37 12 3.620 20011126 22 55 01.04 25.64 94.52 28 3.221 20011127 01 30 49.26 25.43 94.84 35 3.122 20011127 11 15 43.86 25.05 93.97 32 3.623 20011127 13 47 05.13 28.61 94.17 30 3.624 20011127 13 47 07.97 28.57 92.93 7 3.525 20011128 01 34 01.67 26.23 95.28 38 3.426 20011129 12 19 57.68 25.66 92.14 17 3.027 20011129 19 42 27.16 24.21 92.31 20 3.528 20011129 21 12 11.01 27.32 92.06 13 3.229 20011207 16 16 27.80 24.37 92.58 20 3.830 20011208 22 08 57.99 26.21 91.10 12 3.431 20011211 18 22 09.19 27.67 92.87 22 3.232 20011211 19 09 49.82 24.87 92.92 24 3.933 20011212 23 06 08.21 25.14 91.20 14 3.634 20011214 21 42 42.99 25.61 95.53 17 3.835 20011216 22 25 27.82 27.25 94.40 21 2.736 20030820 11 52 26.00 25.67 89.80 11 2.537 20030820 19 28 22.20 25.50 91.05 9 1.838 20030823 00 57 47.20 25.61 90.84 14 2.739 20030823 11 35 33.70 26.28 90.54 9 2.040 20030929 18 45 15.08 26.02 91.90 13 1.541 20030930 12 36 40.30 25.66 90.09 12 2.142 20030930 18 14 18.24 25.24 90.17 20 2.743 20031001 18 51 24.20 26.59 90.33 23 2.544 20031004 15 18 15.60 25.23 89.82 22 2.345 20031005 21 02 55.00 25.78 90.68 16 1.2
range 1.2–3.9 and the depth 7–38 km. The eventsare selected so that these are recorded locallyby at least three stations in the respective tec-tonic block, supplemented by two more stations
in the neighboring tectonic block so that there isconformity of source–receiver path among threeselected tectonic blocks. Figure 3 presents thecorresponding epicenter–station trajectories.

146 J Seismol (2009) 13:141–160
Table 2 Parameters ofseismological stations(e.g., name, code, andtheir location)
SL. no. Station name Station code Latitude (◦N) Longitude (◦E)
1 Along ALN 28.15 94.792 Bhairabkunda BKD 26.89 92.123 Dokmok DMK 26.22 93.064 Gauhati GAU 26.15 91.675 Jogighopa JPA 26.24 90.576 Kaziranga KZI 26.58 93.417 Mendipather MND 25.92 90.688 Nangalbibra NGL 25.47 90.709 Numaligarh NLG 26.58 93.7310 Shillong SHL 25.57 91.8611 Seijusa SJA 26.94 93.0012 Tezpur TZR 26.62 92.7813 Ukhrul UKH 25.08 94.3514 Ziro ZIR 27.54 93.80
4 Data analysis
Two backscattering models explain the coda waveamplitude on a seismogram. The first is the singlescattering model, which assumes that the scat-tering wave field is weak and does not producesecondary scattering when it encounters anotherscatterer (Aki and Chouet 1975). The secondmodel is the multiple scattering model (Gao et al.1983), which assumes secondary scattering andconsider the seismic energy transfer as a diffusionprocess. In this study, the attenuation of codawaves is measured as a function of frequencyusing the data from local earthquakes with thehelp of single scattering model. We assumed thatthe source and the receiver are located at thesame point in an infinite medium. This is a validassumption for coda waves, which arrive at thereceiver long after the passage of the primary P,and S waves after twice the S-wave lapse time,having a common envelope shape at most stationsnear the epicenter (Rautian and Khalturin 1978).
In order to establish a suitable attenuation re-lation, the entire NER has been segregated intothree tectonic groups as per distribution of epi-central location in conformity with tectonic fea-tures in the region. The events located on theEastern Himalaya and suture zone are referred toas the Arunachal (AR) group. The central groupconsists of events located in Shillong Plateau andMikir Hills designated as SHL (Shillong) groupand the events located along Naga–Disang thrustand Indo-Myanmar zone are included in Indo-
Burmese region (IBR) group. The attenuation ofcoda waves is measured as a function of frequencyto measure the total scattering coefficient andcoda attenuation, which characterize coda excita-tion and coda amplitude decay. The studies areconducted at short and intermediate epicentraldistance of 16–270 km. The decay of coda waveamplitudes is analyzed at different lapse time win-dows. Finally, attenuation relationship for eachtectonic block is deduced leading to an averageattenuation relationship for the NER. Figure 4shows an example of seismogram (event no. 14 inTable 1) from a local earthquake recorded by theDokmok (DMK) station.
The time dependence of root mean square(RMS) coda wave amplitude, A(ω, t), on a band-pass-filtered seismogram can be written as
A (ω, t) = C (ω) . t−1 exp (−ω t/2Qc) (1)
where Qc is the attenuation quality factor as afunction of frequency, t−1 is a correction factor forthe geometrical spreading, and C(ω) takes into ac-count these terms of source and site amplification.
Sato (1977) developed the model where RMScoda wave amplitude at lapse time t may bewritten as
A (r, ω, t) = C (ω) [K (r, x)] exp (−ωt/2Qc) (2)
where, t/ts = x (ts is the travel time of S wave).K(r , x) is a function of station–source distance,and r defined as
K (r, x) = 1/r × 1/x × ln[(x + 1)/(x − 1)
](3)
J Seismol (2009) 13:141–160 147
Fig. 2 The figures givenabove are an example forstationMND-Mendipather, EastGaro Hills, Meghalayacontain a typical estimateof a frequency responseto the ground velocitywith known pole-zerodistribution and b thesystem noise powerplotted as noncoherentpower for vertical (Z =red) and horizontalsensors (N = green andE = blue)
a
b
By taking the natural logarithms of Eq. 2and rearranging terms, we obtain the followingequation:
ln[A(r, ω, t)/K (r, x)
]= ln[C (ω)
]−(ω t/2Qc) (4)
For narrow band-pass-filtered seismograms, C(ω)is constant. Therefore, by using a linear regressionof terms on the left side of Eq. 4 vs t, Qc can be
determined from the slope of the fit, which is equalto −ω/2Qc.
In order to study the frequency and lapse timedependence of Qc, we use following scheme toanalyze the data
(a) The seismograms are filtered for narrow fre-quency bands centered at fc = 1, 1.5, 2, 3, 4, 6,8, 12, 16, and 18 Hz, respectively, using eight-
148 J Seismol (2009) 13:141–160
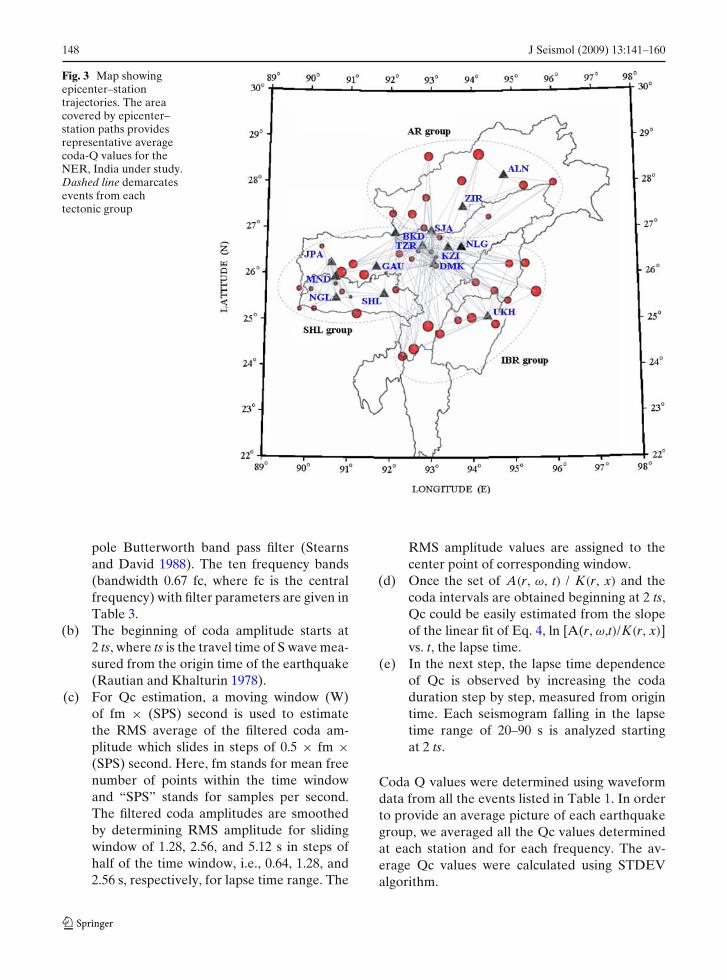
Fig. 3 Map showingepicenter–stationtrajectories. The areacovered by epicenter–station paths providesrepresentative averagecoda-Q values for theNER, India under study.Dashed line demarcatesevents from eachtectonic group
pole Butterworth band pass filter (Stearnsand David 1988). The ten frequency bands(bandwidth 0.67 fc, where fc is the centralfrequency) with filter parameters are given inTable 3.
(b) The beginning of coda amplitude starts at2 ts, where ts is the travel time of S wave mea-sured from the origin time of the earthquake(Rautian and Khalturin 1978).
(c) For Qc estimation, a moving window (W)of fm × (SPS) second is used to estimatethe RMS average of the filtered coda am-plitude which slides in steps of 0.5 × fm ×(SPS) second. Here, fm stands for mean freenumber of points within the time windowand “SPS” stands for samples per second.The filtered coda amplitudes are smoothedby determining RMS amplitude for slidingwindow of 1.28, 2.56, and 5.12 s in steps ofhalf of the time window, i.e., 0.64, 1.28, and2.56 s, respectively, for lapse time range. The
RMS amplitude values are assigned to thecenter point of corresponding window.
(d) Once the set of A(r, ω, t) / K(r, x) and thecoda intervals are obtained beginning at 2 ts,Qc could be easily estimated from the slopeof the linear fit of Eq. 4, ln [A(r, ω,t)/K(r, x)]vs. t, the lapse time.
(e) In the next step, the lapse time dependenceof Qc is observed by increasing the codaduration step by step, measured from origintime. Each seismogram falling in the lapsetime range of 20–90 s is analyzed startingat 2 ts.
Coda Q values were determined using waveformdata from all the events listed in Table 1. In orderto provide an average picture of each earthquakegroup, we averaged all the Qc values determinedat each station and for each frequency. The av-erage Qc values were calculated using STDEValgorithm.

J Seismol (2009) 13:141–160 149
Fig. 4 a An example oforiginal and band-pass-filtered seismograms fromstation DMK recorded on23 November 2001 (eventno. 14 in Table 1). Thecoda wave portion of 30-swindow length indicatedby arrows. b Plot oflogarithmic ofgeometrical spreadingcorrected and smoothedcoda amplitudes as afunction of lapse time forthe window selected in a
There is a clear effect of increase of lapse timewindow on Qc values. As the lapse time windowbecome longer after 2 ts, the Qc values exhibittwo distinguished uniqueness: the scatter reducesnoticeably and the value of Qc increases. Thehigher the lapse time window, the higher the Qcvalues. Measuring Qc from different lapse time
windows can cause its value to change signifi-cantly. The events with lower magnitude possesssmaller duration while a larger magnitude eventwill produce a longer recording. Hence, for lowermagnitude event, Qc can be measured for lessnumbers of lapse time window than that of largermagnitude event. Variation in amplitude in a lapse

150 J Seismol (2009) 13:141–160
Table 3 Parameters of band pass filters showing centralfrequencies with respective low and high cutoff frequencies
Low cutoff Central frequency High cutoff(Hz) (Hz) (Hz)
0.67 1.0 1.331.00 1.5 2.001.33 2.0 2.672.00 3.0 4.002.67 4.0 5.334.00 6.0 8.005.33 8.0 10.678.00 12.0 16.0010.67 16.0 21.3312.00 18.0 24.00
time window contributes significantly to the es-timation of Qc values with an event of highersignal-to-noise ratio. Averaging is done separatelyon filtered waveform at different frequency bandsfor varying lapse time window. While doing so,it is observed that the envelope of coda waveis perfectly smoothed for 5.12- and 2.56-s slidingwindow in lower- and higher-frequency bands, re-spectively. Sliding window of 1.28 s shows scatterin RMS amplitudes of the coda envelope. That iswhy finally we have sliding window of 5.12 s (for1 and 1.5 Hz) and 2.56 s (for 3, 4, 6, 8, 12, 16,and 18 Hz) for obtaining the average values. TheRMS values obtained by this approach constitutea smoother envelope of the coda, which is multi-plied by the lapse time (t) for applying geometricalspreading correction. Figure 4a shows all the fil-tered seismograms with the smoothed logarithmicamplitude of the coda part of the seismogram asshown in Fig. 4b. In this example, respective Qcvalues were calculated from the slope over thewhole lapse time range.
5 Results
To systematically study the attenuation of codawave, a total of 3,890 Qc values are estimated from
�Fig. 5 Figure showing the estimated average coda Qcvalues plotted as a function of frequency for AR, SHL, andIBR regions using 30-s coda window length. Different sym-bols are used to represent Qc values estimated at differentstations. The average attenuation relation for each groupis indicated at the top while attenuation relation separatelyobtained for TZR station is indicated at the bottom ofeach plot
J Seismol (2009) 13:141–160 151
the analysis of 20–90-s lapse time windows in thefrequency range 1–18 Hz, covering 187 varyingstation–source paths (Fig. 3).
5.1 Attenuation characterization
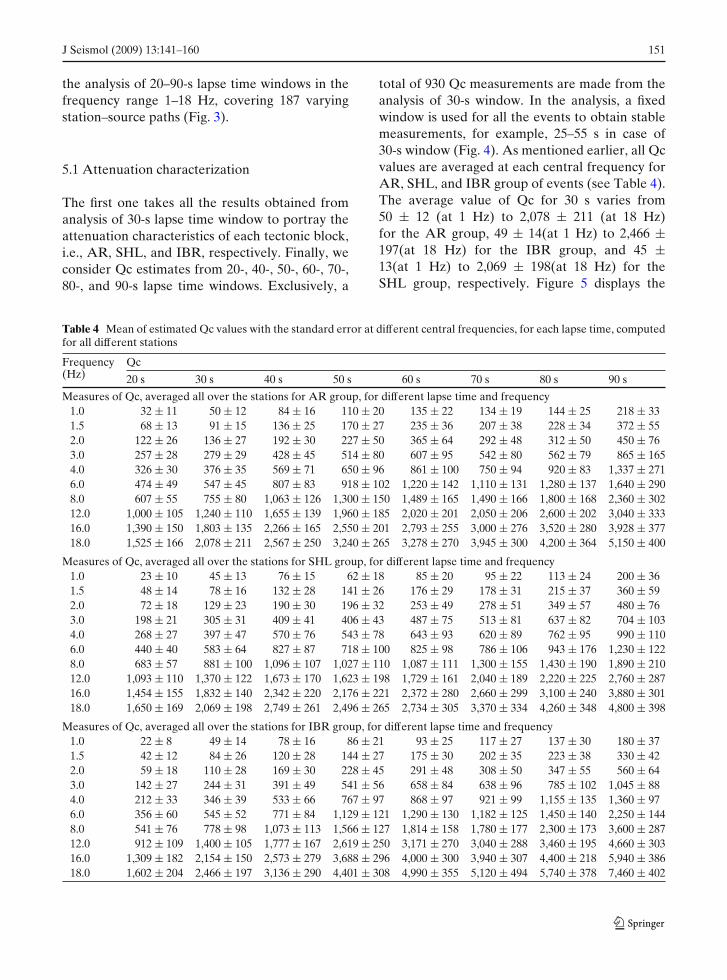
The first one takes all the results obtained fromanalysis of 30-s lapse time window to portray theattenuation characteristics of each tectonic block,i.e., AR, SHL, and IBR, respectively. Finally, weconsider Qc estimates from 20-, 40-, 50-, 60-, 70-,80-, and 90-s lapse time windows. Exclusively, a
total of 930 Qc measurements are made from theanalysis of 30-s window. In the analysis, a fixedwindow is used for all the events to obtain stablemeasurements, for example, 25–55 s in case of30-s window (Fig. 4). As mentioned earlier, all Qcvalues are averaged at each central frequency forAR, SHL, and IBR group of events (see Table 4).The average value of Qc for 30 s varies from50 ± 12 (at 1 Hz) to 2,078 ± 211 (at 18 Hz)for the AR group, 49 ± 14(at 1 Hz) to 2,466 ±197(at 18 Hz) for the IBR group, and 45 ±13(at 1 Hz) to 2,069 ± 198(at 18 Hz) for theSHL group, respectively. Figure 5 displays the
Table 4 Mean of estimated Qc values with the standard error at different central frequencies, for each lapse time, computedfor all different stations
Frequency Qc(Hz) 20 s 30 s 40 s 50 s 60 s 70 s 80 s 90 s
Measures of Qc, averaged all over the stations for AR group, for different lapse time and frequency1.0 32 ± 11 50 ± 12 84 ± 16 110 ± 20 135 ± 22 134 ± 19 144 ± 25 218 ± 331.5 68 ± 13 91 ± 15 136 ± 25 170 ± 27 235 ± 36 207 ± 38 228 ± 34 372 ± 552.0 122 ± 26 136 ± 27 192 ± 30 227 ± 50 365 ± 64 292 ± 48 312 ± 50 450 ± 763.0 257 ± 28 279 ± 29 428 ± 45 514 ± 80 607 ± 95 542 ± 80 562 ± 79 865 ± 1654.0 326 ± 30 376 ± 35 569 ± 71 650 ± 96 861 ± 100 750 ± 94 920 ± 83 1,337 ± 2716.0 474 ± 49 547 ± 45 807 ± 83 918 ± 102 1,220 ± 142 1,110 ± 131 1,280 ± 137 1,640 ± 2908.0 607 ± 55 755 ± 80 1,063 ± 126 1,300 ± 150 1,489 ± 165 1,490 ± 166 1,800 ± 168 2,360 ± 30212.0 1,000 ± 105 1,240 ± 110 1,655 ± 139 1,960 ± 185 2,020 ± 201 2,050 ± 206 2,600 ± 202 3,040 ± 33316.0 1,390 ± 150 1,803 ± 135 2,266 ± 165 2,550 ± 201 2,793 ± 255 3,000 ± 276 3,520 ± 280 3,928 ± 37718.0 1,525 ± 166 2,078 ± 211 2,567 ± 250 3,240 ± 265 3,278 ± 270 3,945 ± 300 4,200 ± 364 5,150 ± 400
Measures of Qc, averaged all over the stations for SHL group, for different lapse time and frequency1.0 23 ± 10 45 ± 13 76 ± 15 62 ± 18 85 ± 20 95 ± 22 113 ± 24 200 ± 361.5 48 ± 14 78 ± 16 132 ± 28 141 ± 26 176 ± 29 178 ± 31 215 ± 37 360 ± 592.0 72 ± 18 129 ± 23 190 ± 30 196 ± 32 253 ± 49 278 ± 51 349 ± 57 480 ± 763.0 198 ± 21 305 ± 31 409 ± 41 406 ± 43 487 ± 75 513 ± 81 637 ± 82 704 ± 1034.0 268 ± 27 397 ± 47 570 ± 76 543 ± 78 643 ± 93 620 ± 89 762 ± 95 990 ± 1106.0 440 ± 40 583 ± 64 827 ± 87 718 ± 100 825 ± 98 786 ± 106 943 ± 176 1,230 ± 1228.0 683 ± 57 881 ± 100 1,096 ± 107 1,027 ± 110 1,087 ± 111 1,300 ± 155 1,430 ± 190 1,890 ± 21012.0 1,093 ± 110 1,370 ± 122 1,673 ± 170 1,623 ± 198 1,729 ± 161 2,040 ± 189 2,220 ± 225 2,760 ± 28716.0 1,454 ± 155 1,832 ± 140 2,342 ± 220 2,176 ± 221 2,372 ± 280 2,660 ± 299 3,100 ± 240 3,880 ± 30118.0 1,650 ± 169 2,069 ± 198 2,749 ± 261 2,496 ± 265 2,734 ± 305 3,370 ± 334 4,260 ± 348 4,800 ± 398
Measures of Qc, averaged all over the stations for IBR group, for different lapse time and frequency1.0 22 ± 8 49 ± 14 78 ± 16 86 ± 21 93 ± 25 117 ± 27 137 ± 30 180 ± 371.5 42 ± 12 84 ± 26 120 ± 28 144 ± 27 175 ± 30 202 ± 35 223 ± 38 330 ± 422.0 59 ± 18 110 ± 28 169 ± 30 228 ± 45 291 ± 48 308 ± 50 347 ± 55 560 ± 643.0 142 ± 27 244 ± 31 391 ± 49 541 ± 56 658 ± 84 638 ± 96 785 ± 102 1,045 ± 884.0 212 ± 33 346 ± 39 533 ± 66 767 ± 97 868 ± 97 921 ± 99 1,155 ± 135 1,360 ± 976.0 356 ± 60 545 ± 52 771 ± 84 1,129 ± 121 1,290 ± 130 1,182 ± 125 1,450 ± 140 2,250 ± 1448.0 541 ± 76 778 ± 98 1,073 ± 113 1,566 ± 127 1,814 ± 158 1,780 ± 177 2,300 ± 173 3,600 ± 28712.0 912 ± 109 1,400 ± 105 1,777 ± 167 2,619 ± 250 3,171 ± 270 3,040 ± 288 3,460 ± 195 4,660 ± 30316.0 1,309 ± 182 2,154 ± 150 2,573 ± 279 3,688 ± 296 4,000 ± 300 3,940 ± 307 4,400 ± 218 5,940 ± 38618.0 1,602 ± 204 2,466 ± 197 3,136 ± 290 4,401 ± 308 4,990 ± 355 5,120 ± 494 5,740 ± 378 7,460 ± 402
152 J Seismol (2009) 13:141–160
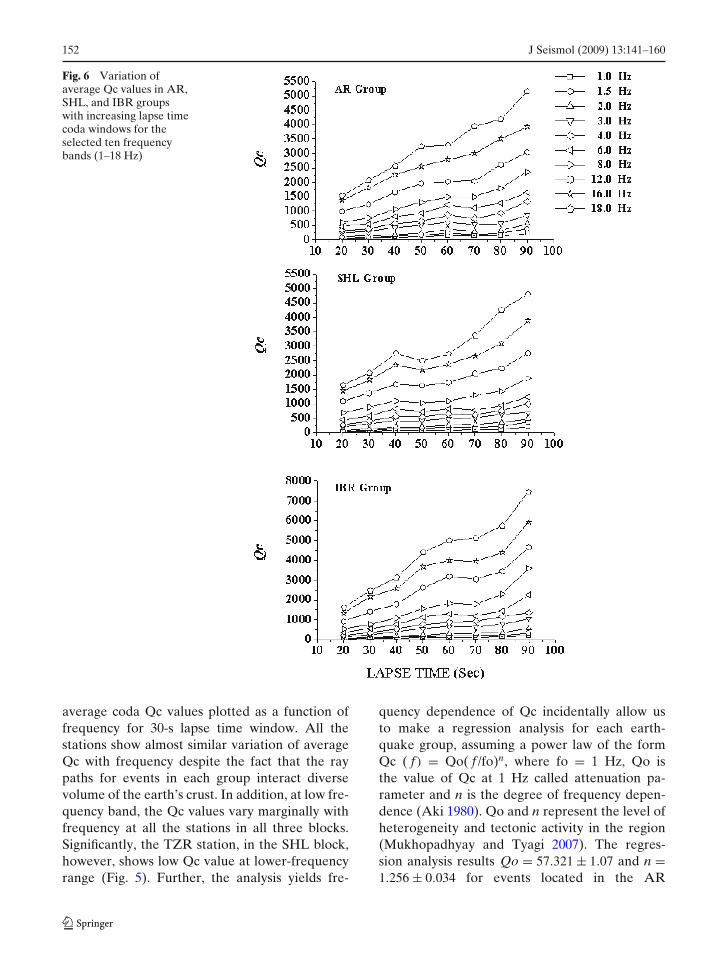
Fig. 6 Variation ofaverage Qc values in AR,SHL, and IBR groupswith increasing lapse timecoda windows for theselected ten frequencybands (1–18 Hz)
average coda Qc values plotted as a function offrequency for 30-s lapse time window. All thestations show almost similar variation of averageQc with frequency despite the fact that the raypaths for events in each group interact diversevolume of the earth’s crust. In addition, at low fre-quency band, the Qc values vary marginally withfrequency at all the stations in all three blocks.Significantly, the TZR station, in the SHL block,however, shows low Qc value at lower-frequencyrange (Fig. 5). Further, the analysis yields fre-
quency dependence of Qc incidentally allow usto make a regression analysis for each earth-quake group, assuming a power law of the formQc ( f ) = Qo( f /fo)n, where fo = 1 Hz, Qo isthe value of Qc at 1 Hz called attenuation pa-rameter and n is the degree of frequency depen-dence (Aki 1980). Qo and n represent the level ofheterogeneity and tectonic activity in the region(Mukhopadhyay and Tyagi 2007). The regres-sion analysis results Qo = 57.321 ± 1.07 and n =1.256 ± 0.034 for events located in the AR
J Seismol (2009) 13:141–160 153
group. Similarly, Qo = 48.574 ± 1.04 and n =1.36 ± 0.023 are determined for the IBR groupof events while SHL group of events correspondsto Qo = 53.156 ± 1.10 and n = 1.315 ± 0.054. Theempirical attenuation relations for all the groupsare shown in the top of Fig. 5 whereas attenuationrelation particularly obtained for TZR station isshown in the bottom for each group. Compar-atively low Qo value estimated at TZR stationin each group indicate that the structure beneathTZR station is more heterogeneous compared toother station. To summarize, averaging all Qcvalues irrespective of tectonic block, we obtain theattenuation relation for the entire NER India asQc = 52.315 ± 1.07 f (1.32 ± 0.036).
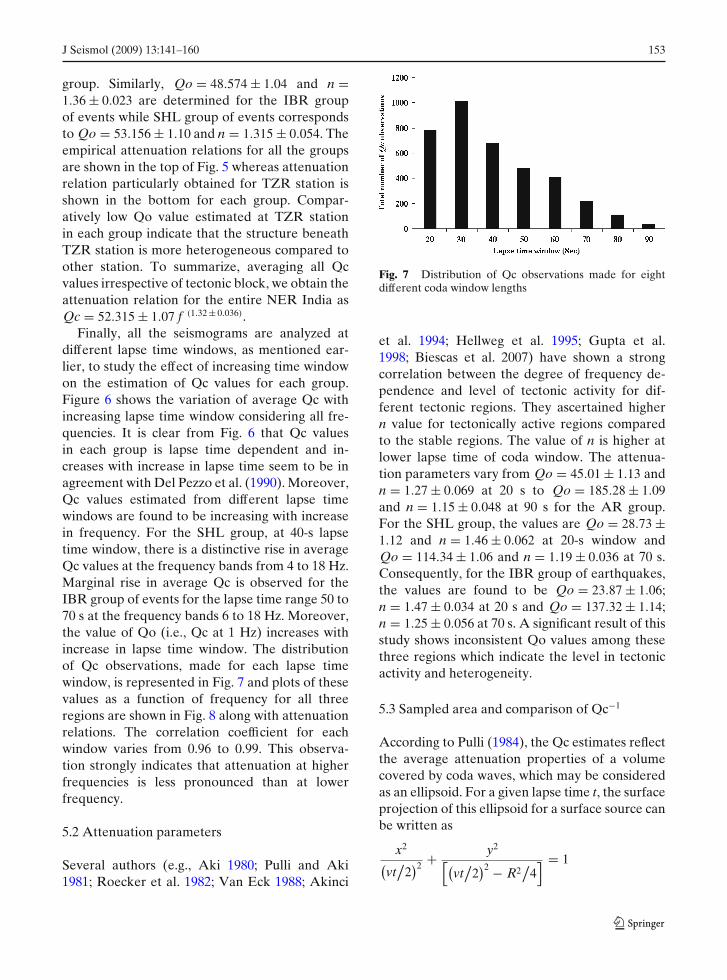
Finally, all the seismograms are analyzed atdifferent lapse time windows, as mentioned ear-lier, to study the effect of increasing time windowon the estimation of Qc values for each group.Figure 6 shows the variation of average Qc withincreasing lapse time window considering all fre-quencies. It is clear from Fig. 6 that Qc valuesin each group is lapse time dependent and in-creases with increase in lapse time seem to be inagreement with Del Pezzo et al. (1990). Moreover,Qc values estimated from different lapse timewindows are found to be increasing with increasein frequency. For the SHL group, at 40-s lapsetime window, there is a distinctive rise in averageQc values at the frequency bands from 4 to 18 Hz.Marginal rise in average Qc is observed for theIBR group of events for the lapse time range 50 to70 s at the frequency bands 6 to 18 Hz. Moreover,the value of Qo (i.e., Qc at 1 Hz) increases withincrease in lapse time window. The distributionof Qc observations, made for each lapse timewindow, is represented in Fig. 7 and plots of thesevalues as a function of frequency for all threeregions are shown in Fig. 8 along with attenuationrelations. The correlation coefficient for eachwindow varies from 0.96 to 0.99. This observa-tion strongly indicates that attenuation at higherfrequencies is less pronounced than at lowerfrequency.
5.2 Attenuation parameters
Several authors (e.g., Aki 1980; Pulli and Aki1981; Roecker et al. 1982; Van Eck 1988; Akinci
Fig. 7 Distribution of Qc observations made for eightdifferent coda window lengths
et al. 1994; Hellweg et al. 1995; Gupta et al.1998; Biescas et al. 2007) have shown a strongcorrelation between the degree of frequency de-pendence and level of tectonic activity for dif-ferent tectonic regions. They ascertained highern value for tectonically active regions comparedto the stable regions. The value of n is higher atlower lapse time of coda window. The attenua-tion parameters vary from Qo = 45.01 ± 1.13 andn = 1.27 ± 0.069 at 20 s to Qo = 185.28 ± 1.09and n = 1.15 ± 0.048 at 90 s for the AR group.For the SHL group, the values are Qo = 28.73 ±1.12 and n = 1.46 ± 0.062 at 20-s window andQo = 114.34 ± 1.06 and n = 1.19 ± 0.036 at 70 s.Consequently, for the IBR group of earthquakes,the values are found to be Qo = 23.87 ± 1.06;n = 1.47 ± 0.034 at 20 s and Qo = 137.32 ± 1.14;n = 1.25 ± 0.056 at 70 s. A significant result of thisstudy shows inconsistent Qo values among thesethree regions which indicate the level in tectonicactivity and heterogeneity.
5.3 Sampled area and comparison of Qc−1
According to Pulli (1984), the Qc estimates reflectthe average attenuation properties of a volumecovered by coda waves, which may be consideredas an ellipsoid. For a given lapse time t, the surfaceprojection of this ellipsoid for a surface source canbe written as
x2
(vt
/2)2 + y2
[(vt
/2)2 − R2
/4] = 1

154 J Seismol (2009) 13:141–160
Fig. 8 Comparison of mean of Qc as a function of frequency obtained at eight different coda window lengths for AR, SHL,and IBR group of events
where R is the source-to-station distance, v is theS-wave velocity (3.5 km/s) and x and y is the sur-face coordinates. In this study, the longest event–station distance 217 km for the AR region, 228 kmfor the SHL, and 270 km for the IBR are consid-ered to calculate the surface area projection forlapse time window of 70, 80, and 90 s. Sometimes,
for lapse time greater than 90 s, the duration of theevent ceases and in some cases the signal-to-noiseratio becomes extremely lower. In rationale as inFig. 3, for the AR group, the coda wave wouldsample a surface area of 21,874 km2 inside a spher-ical shell. Likewise, the coda wave would samplea surface area of 35,742 km2 and 40,088 km2 for
Fig. 9 A comparison ofQc−1 as a function offrequency obtained forNorth Eastern Region ofIndia with the Qc−1
observations of othertectonic regions inthe world

J Seismol (2009) 13:141–160 155
156 J Seismol (2009) 13:141–160
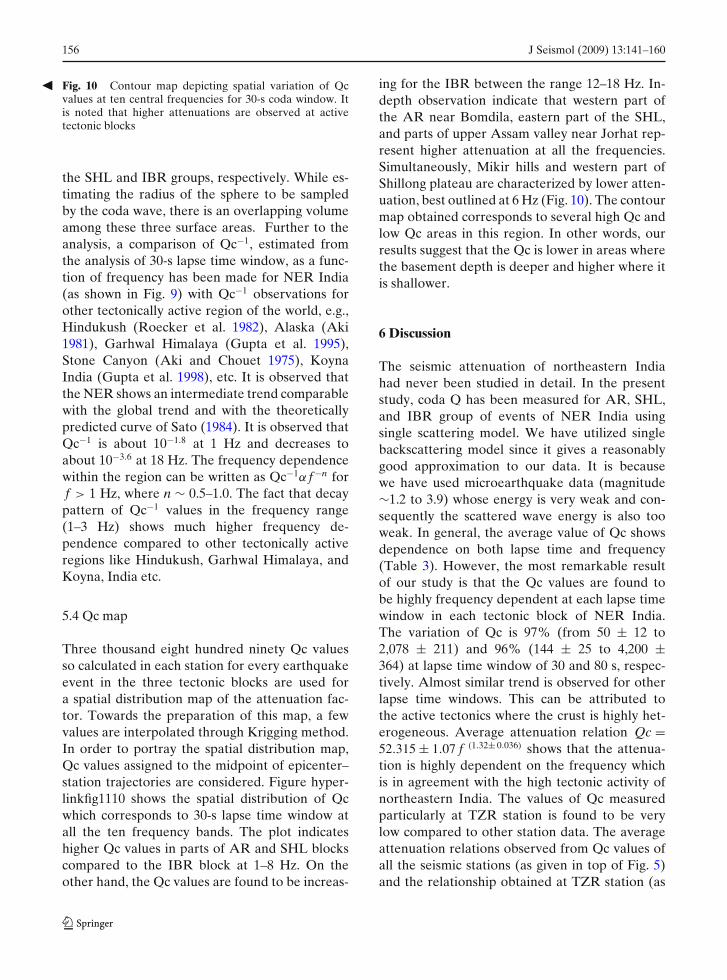
� Fig. 10 Contour map depicting spatial variation of Qcvalues at ten central frequencies for 30-s coda window. Itis noted that higher attenuations are observed at activetectonic blocks
the SHL and IBR groups, respectively. While es-timating the radius of the sphere to be sampledby the coda wave, there is an overlapping volumeamong these three surface areas. Further to theanalysis, a comparison of Qc−1, estimated fromthe analysis of 30-s lapse time window, as a func-tion of frequency has been made for NER India(as shown in Fig. 9) with Qc−1 observations forother tectonically active region of the world, e.g.,Hindukush (Roecker et al. 1982), Alaska (Aki1981), Garhwal Himalaya (Gupta et al. 1995),Stone Canyon (Aki and Chouet 1975), KoynaIndia (Gupta et al. 1998), etc. It is observed thatthe NER shows an intermediate trend comparablewith the global trend and with the theoreticallypredicted curve of Sato (1984). It is observed thatQc−1 is about 10−1.8 at 1 Hz and decreases toabout 10−3.6 at 18 Hz. The frequency dependencewithin the region can be written as Qc−1α f −n forf > 1 Hz, where n ∼ 0.5–1.0. The fact that decaypattern of Qc−1 values in the frequency range(1–3 Hz) shows much higher frequency de-pendence compared to other tectonically activeregions like Hindukush, Garhwal Himalaya, andKoyna, India etc.
5.4 Qc map
Three thousand eight hundred ninety Qc valuesso calculated in each station for every earthquakeevent in the three tectonic blocks are used fora spatial distribution map of the attenuation fac-tor. Towards the preparation of this map, a fewvalues are interpolated through Krigging method.In order to portray the spatial distribution map,Qc values assigned to the midpoint of epicenter–station trajectories are considered. Figure hyper-linkfig1110 shows the spatial distribution of Qcwhich corresponds to 30-s lapse time window atall the ten frequency bands. The plot indicateshigher Qc values in parts of AR and SHL blockscompared to the IBR block at 1–8 Hz. On theother hand, the Qc values are found to be increas-
ing for the IBR between the range 12–18 Hz. In-depth observation indicate that western part ofthe AR near Bomdila, eastern part of the SHL,and parts of upper Assam valley near Jorhat rep-resent higher attenuation at all the frequencies.Simultaneously, Mikir hills and western part ofShillong plateau are characterized by lower atten-uation, best outlined at 6 Hz (Fig. 10). The contourmap obtained corresponds to several high Qc andlow Qc areas in this region. In other words, ourresults suggest that the Qc is lower in areas wherethe basement depth is deeper and higher where itis shallower.
6 Discussion
The seismic attenuation of northeastern Indiahad never been studied in detail. In the presentstudy, coda Q has been measured for AR, SHL,and IBR group of events of NER India usingsingle scattering model. We have utilized singlebackscattering model since it gives a reasonablygood approximation to our data. It is becausewe have used microearthquake data (magnitude∼1.2 to 3.9) whose energy is very weak and con-sequently the scattered wave energy is also tooweak. In general, the average value of Qc showsdependence on both lapse time and frequency(Table 3). However, the most remarkable resultof our study is that the Qc values are found tobe highly frequency dependent at each lapse timewindow in each tectonic block of NER India.The variation of Qc is 97% (from 50 ± 12 to2,078 ± 211) and 96% (144 ± 25 to 4,200 ±364) at lapse time window of 30 and 80 s, respec-tively. Almost similar trend is observed for otherlapse time windows. This can be attributed tothe active tectonics where the crust is highly het-erogeneous. Average attenuation relation Qc =52.315 ± 1.07 f (1.32± 0.036) shows that the attenua-tion is highly dependent on the frequency whichis in agreement with the high tectonic activity ofnortheastern India. The values of Qc measuredparticularly at TZR station is found to be verylow compared to other station data. The averageattenuation relations observed from Qc values ofall the seismic stations (as given in top of Fig. 5)and the relationship obtained at TZR station (as

J Seismol (2009) 13:141–160 157
in bottom of Fig. 5) shows that Qo value at TZRis almost 50% less compared to average Qo valueobtained from all the stations. However, high fre-quency dependence is reflected in all the attenua-tion relations. The low value of Qc at TZR stationindicates a more heterogeneous structure beneaththe TZR station. The calculation of Qc functionsgives an idea of spatial variation of attenuationamong the three tectonic blocks and can be at-tributed to geological characteristics of the block.This may indicate that the structure of the upperpart of the crust is much more heterogeneous thanthe deeper part of crust. It is known that Shillong–Mikir plateau is characterized by oceanic crustcomposed of deposition by heavy high-densityminerals while the other two blocks which are apart of continental crust composed of low-densitymaterial. As we know, loss of energy is less inhigh-density material, so the oceanic crust haslower attenuation than continental crust. Hence,most of the Shillong–Mikir hills are characterizedby lower attenuation while Arunachal Himalayaand Indo-Burmese region are characterized byhigher attenuation. Our result as observed in Qcmap agree with this argument. In general, Qcvalues even at similar epicentral distance indicatesome dependency with focal depth. But this isnot always true. Our study find that compati-ble Qc are estimated for a shallow event depthh = 10 km, MD = 2.7, � = 64 km (Ev. No. 8)and for deeper event h = 35 km, MD = 2.7, � =58 km (Ev. No. 5) with equivalent epicentral dis-tances at the same recording station (DMK) in allfrequency bands. The Qc values indicate negligi-ble focal depth dependence which does not extendto a large epicentral distance beyond 70 km as afunction of lapse time. It implies that the behav-ior could be due to more or less homogeneousmedium in shorter epicentral distance althoughsome studies suggest that velocity contrast in alayered structure produce differences in the Qc(Hoshiba 1997; Margerin et al. 1998).
Simultaneously, when we compare the atten-uation parameters among three tectonic groups,Qo value for IBR group is the lowest (Fig. 8).Basically, this estimate is the average estimateof various stations at the respective group. Thelower Qo value at IBR group indicates the prob-able region for occurrence of large earthquakes
as observed for the Tangsheng region by Jin andAki (1986). The lower Qo value may also indi-cate the presence of lateral heterogeneities in thestructure. Present seismicity rate shows that IBRregion is tectonically very active compared to theother two regions. The relatively low Qo valuereflects the strong scattering effects of the highlydense faulted structure in the region. The degreeof frequency dependence n is a little bit higher forTZR station in AR, SHL, and IBR groups which isin agreement with dense fracturing and crisscross-ing of faults and lineaments that characterize theparticular site. If the standard deviation of Qo isconsidered, there are no major differences fromone region to another. However, if we look atresults of individual Qo value of IBR and SHLgroup, the distinction between higher Qo valuesfor SHL and lower Qo values indicate that theNaga–Disang fault is a kind of boundary betweentwo different attenuation zones. Thus, the north-ern part of Naga–Disang fault has less attenuationthan the southern part of the fault.
Looking at the comparison of Qc−1 measure-ments with other regions for the similar lapse timeand frequency range, we observe that NER ac-quires an intermediate trend among other tecton-ically active regions of the world and, therefore,the studied parameters show a good consistency.
Qc is an important parameter for comparisonof different tectonic regions of the world. How-ever, complexity of the region can be well inferredthrough estimation of scattering and intrinsic at-tenuation and their relative contribution towardsthe total attenuation quality factor of coda wave,which is a scope for further study.
7 Conclusion
In the present study, the Qc values have beenestimated for the NER of India using the singlescattering model. The coda waves of 187 seismo-grams from 45 local earthquakes recorded digi-tally in the NER are analyzed for eight differentlapse time window durations (e.g., 20, 30, 40, 50,60, 70, 80, and 90 s) at ten frequency bands witha central frequency in the range of 1.0 to 18 Hz.The epicentral distance and focal depths of these
158 J Seismol (2009) 13:141–160
events vary from 16 to 270 km and from 7 to38 km, respectively, having the magnitude lessthan 4.0.
The mean Qc for 30-s lapse time window variesfrom 50 ± 12 (at 1 Hz) to 2,078 ± 211(at 18 Hz)in AR, from 49 ± 14 (at 1 Hz) to 2,466 ±197 (at 18 Hz) in IBR, and from 45 ± 13 (at1 Hz) to 2,069 ± 198 (at 18 Hz) in SHL. Thestudy indicates that Qc is a function of frequency.A frequency-dependent relationship for the ARis Qc = 57.321 ± 1.07 f (1.256±0.034), for the IBRQc = 48.574 ± 1.04 f (1.36±0.023), and for the SHLQc = 53.156 ± 1.10 f (1.315±0.054). An average at-tenuation relation Qc = 52.315 ± 1.07 f (1.32±0.036)
portrays the average attenuation relation fornortheastern India. The average Qc values at eachstation for the three tectonic blocks show that atlow-frequency band they vary marginally. Exceptfor a strong local site effect at the station TZR,the Qc at the other stations is fairly similar, eventhough the coda waves sample slightly differentvolumes. Low Qc values estimated at the TZRstation may be due to difference in structure thatexists beneath this station.
Towards the estimation of Qc, the effectof increasing frequency bands is observed. Athigher-frequency bands, the Qc values increasemoderately while marginal increments are ob-served at lower-frequency bands.
An analysis of coda waves at eight differentlapse time windows indicates that Qc is lapse timedependent in the region. The Qc values increasesas lapse time window increases (Fig. 8). The valueof degree of frequency dependence n is found tobe higher at lower lapse time. The decrease inthe value of n for longer lapse time window foreach of the three tectonic blocks indicates a strongcorrelation with tectonic activity. The attenuationat higher frequencies is less pronounced than atlower frequency. The frequency-dependent aver-age attenuation parameter for the IBR is foundto be lowest. The lowest Qo value at IBR indi-cates the probable region for occurrence of largeearthquake. The low Qo value reflects the strongscattering effects of the highly dense faulted struc-ture in the region. The study also indicates that theNaga–Disang fault is a kind of boundary betweentwo different attenuation zones and the northern
part of Naga–Disang fault has less attenuationthan the southern part of the fault.
The patterns of Qc−1 with frequency are analo-gous to the estimates obtained in other tectonicareas in the world, except with the observationthat the Qc−1 is much higher at 1 Hz for thestudy region. The Qc−1 is about 10−1.8 at 1 Hz anddecreases to about 10−3.6 at 18 Hz indicating clearfrequency dependence.
Attenuation pattern shows that the westernpart of the Arunachal Himalaya near Bomdila,eastern part of the Shillong Plateau, and parts ofupper Assam valley near Jorhat represent higherattenuation at all the frequencies. The Mikir hills,Arunachal Himalaya, and western part of the Shil-long plateau are characterized by lower attenua-tion best outlined at 6 Hz.
Acknowledgements The author (SB) thank Dr. P. G.Rao, Director, RRL, Jorhat for giving permission to pub-lish the work and render special thanks to Prof. H. K.Gupta, Rammana Fellow, NGRI-Hyderabad, for neces-sary suggestion to improve the quality of the work andDr. B. K. Bansal, Director, DST, New Delhi for his kindsupport to the project. Many thanks are due to Prof. S. S.Arifiev, Schmidt United Institute of Physics of the Earth,Moscow for helping in deriving the response and noisecurve of the seismic stations. We are thankful to Dr. J. R.Kayal, Geological Survey of India, Kolkata and Prof. H.Sato, Tohuku Univerity and Dr. S. C. Gupta, IIT-Roorkee,for their critical comments towards the enhancement ofthe project. Constructive comments from two anonymousreviewers have helped us to improve the paper. The DSTprovides financial supports for this work vide reference no.DST/23(229)/ESS/2000.
References
Aki K (1969) Analysis of the seismic coda of local earth-quakes as scattered waves. J Geophys Res 74:615–631
Aki K (1980) Attenuation of shear-waves in the lithos-phere for frequencies from 0.05 to 25 Hz. Phys EarthPlanet Inter 21:50–60
Aki K (1981) Source and scattering effects on the spec-tra of small local earthquakes. Bull Seismol Soc Am71:1687–1700
Aki K, Chouet B (1975) Origin of coda waves: source,attenuation, and scattering effects. J Geophys Res75:3322–3342
Akinci A, Taktak AG, Ergintav S (1994) Attenuation ofcoda waves in Western Anatolia. Phys Earth PlanetInter 87:55–165
Baruah S (2001) Attenuation of coda waves of few localevents in NER, India. In: International conference on

J Seismol (2009) 13:141–160 159
seismic hazard with particular reference to Bhuj earth-quake of January 26, 2001, vol 1, pp 261–262
Baruah S (2004) Interim progress report submitted toDepartment of Science and Technology DST, NewDelhi, vol 2, pp 1–10
Baruah S, Duarah R, Yadav DK (1997) Pattern of seis-micity in Shillong Mikir plateau and the orientation ofprincipal compressive axis. J Geol Soc Ind 49:533–538
Biescas B, Rivera J, Zapata AJ (2007) Seismic attenuationof coda waves in the eastern region of Cuba. Tectono-physics 429:99–109
Bilham R, England P (2001) Plateau pop-up during the1897 Assam earthquake. Nature 410:806–809
BMTPC (2003) Vulnerability atlas—2nd edn; peer groupMoH & UPA; seismic zones of India IS: 1983–2002,BIS, GOI, Seismotectonic atlas of India and its envi-rons, GSI, GOI
Chen WP, Molnar P (1990) Source parameters ofearthquakes and intraplate deformation beneath theShillong Plateau and the Northern Indoburmanranges. J Geophys Res 95:12527–12552
Curray JR, Emmel FJ, Moore DG, Raitt RW (1982) Struc-ture, tectonics, and geological history of the northeast-ern Indian Ocean. In: Nairu AEM, Stehli FG (eds)The ocean basins and margins, vol 6. Plenum, NewYork, pp 399–450
Del Pezzo E, Allotta R, Patane D (1990) Dependence ofQc(coda-Q) on coda duration time interval: model ordepth effect? Bull Seism Soc Am 80:1028–1033
Fitch TJ (1970) Earthquake mechanism in the Himalayan,Burmese and Andaman regions and continental tec-tonics in Central Asia. J Geophys Res 75:2699–2709
Gao LS, Lee LC, Biswas NN, Aki K (1983) Comparisonof the effects between single and multiple scatteringon coda waves for local earthquakes. Bull Seismol SocAm 73:377–389
Giampiccolo E, Gresta S, Rascona F (2004) Intrinsic andscattering attenuation from observed seismic codas inSoutheastern Sicily (Italy). Phys Earth Planet Inter145:55–66
Gupta HK, Singh HN (1986) Seismicity of the North-EastIndia region, part II: earthquake swarms precursory tomoderate magnitude to great earthquake. J Geol SocInd 28:367–406
Gupta SC, Kumar A (2002) Seismic wave attenuationcharacteristics of three Indian regions: a comparativestudy. Curr Sci 82:407–413
Gupta HK, Singh SC, Dutta TK, Saikia MM (1984) Re-cent investigations of North East India seismicity. In:Gongxu G, Xing-Yuan M (eds) Proc. international.symp. continental seismicity and earthquake predic-tion. Seismological Press, Beijing, pp 63–71
Gupta SC, Singh VN, Kumar A (1995) Attenuation of codawaves in the Garhwal Himalaya, India. Phys EarthPlanet Inter 87:247–253
Gupta SC, Teotia SS, Rai SS, Gautom N (1998) Coda Qestimates in the Koyna Region, India. Pure Appl Geo-phys 153:713–731
Hellweg M, Spudich P, Fletcher JB, Baker LM (1995) Sta-bility of coda Q in the region of Parkfield, California:
view from the U.S. geological survey parkfield denseseismograph array. J Geophys Res 100:2089–2102
Herak M (1991) Lapse-time dependence Qc-spectra ob-served in the Dinarides region (Yugoslavia). PhysEarth Planet Inter 67:303–312
Herrmann RB (1980) Q estimates using the coda of localearthquakes. Bull Seismol Soc Am 70:447–468
Hoshiba M (1997) Seismic coda wave envelope in depth de-pendent S wave velocity structure. Phys Earth PlanetInter 104:15–22
Ibanez JM, Pezzo ED, De Miguel F, Herraiz M, AlguacilG, Morales J (1990) Depth-dependent seismic atten-uation in the Granada Zone (Southern Spain). BullSeismol Soc Am 80:1232–1244
Jin A, Aki K (1986) Temporal change in coda Q beforethe Tangshen earthquake of 1976 and the Haichengearthquake of 1975. J Geophys Res 91:665–673
Kayal JR (1996) Earthquake source process in NortheastIndia: a review. J Himalayan Geol 17:63–69
Khattri KN (1987) Great earthquakes, seismicity gaps andpotential for earthquake disaster along the Himalayanplate boundary. Tectonophysics 138:79–92
Le Dain AY, Tapponnier P, Molnar P (1984) Active fault-ing and tectonics of Burma and surrounding regions. JGeophy Res 89:453–472
Lienert BR, Berg BE, Frazer LN (1986) Hypocenter: anearthquake location method using centered, scaledand adaptively damped least squares. Bull Seismol SocAm 76:771–783
Margerin L, Campillo M, Tiggelen BV (1998) Radiativetransfer and diffusion of waves in a layered medium:new insight into coda Q. Geophys J Int 134:247–258
Mazumder SK (1976) A summary of the Precambrian ge-ology of Khasi Hills, Meghalaya. Misc Publ Geol SurvInd 23:311–334
Mitchel AHG (1986) Ophiolits and associated rocks infour settings: relationship to subduction and collision.Tectonophysics 125:251–269
Mukhopadhyay S, Tyagi C (2007) Lapse time andfrequency—dependent attenuation characteristics ofcoda waves in Northwestern Himalayas. J Seismol11(2):149–158(10) April
Nandy DR (2001) Geodynamics of Northeastern Indiaand the adjoining region. ABC Publications, Calcutta,pp 209
Nandy DR, Das Gupta S (1991) Seismotectonics domainsof Northeastern India and adjacent areas: geologyand geodynamics of Himalayan collision zone, pt. 2:physics and chemistry of earth, no. 1–11, vol 18.Pergamon Press, PLC., Oxford, pp 371–384
Novelo-Casanova DA, Lee WHK (1991) Comparison oftechniques that use the single scattering model to com-pute the quality factor Q from coda waves. Pure ApplGeophys 135:77–89
Okada H, Suzuki S, Asano S (1970) Anomalous under-ground structure in the Matsushiro earthquake swarmarea as derived from a fan shooting technique. BullEarthq Res Inst Tokyo Univ 48:811–833
Oldham RD (1899) Report of the great earthquake of 12thJune 1897. Mem Geol Surv Ind 29:1–379

160 J Seismol (2009) 13:141–160
Peterson J (1993) Observation and modeling of seis-mic background noise. US Geol Surv Tech Rept 93:1–95
Poddar MC (1950) The Assam earthquake of 15th August1950. Indian Minerals 4:167–176
Pulli JJ (1984) Attenuation of coda waves in New England.Bull Seismol Soc Am 74:1149–1166
Pulli JJ, Aki K (1981) Attenuation of seismic waves inthe lithosphere: comparison of active and stable ar-eas. In: Beavers JE (ed) Earthquakes and earthquakeengineering: the Eastern United States. Ann ArborScience Publishers Inc., Ann Arbor, pp 129–141
Rautian TG, Khalturin VI (1978) The use of coda for de-termination of the earthquake source spectrum. BullSeismol Soc Am 68:923–948
Ravikumar M, Purnachandra Rao N, Chalam SV (1996) Aseismotectonic study of the Burma and Andaman arcregions using centroid moment tensor data. Tectono-physics 253:155–165
Richter CF (1958) Elementary seismology. Freeman, SanFrancisco, pp 768
Roecker SW, Tucker B, King J, Hatzfeld D (1982) Estima-tion of Q in Central Asia as a function of frequencyand depth using the coda of locally recorded earth-quakes. Bull Seismol Soc Am 72:129–149
Saikia CK, Somerville PG (1998) Ground motion estima-tion criteria for large earthquakes in the urban areasof northeast India. J Geophys 19:35–52
Sato H (1977) Energy propagation including scattering ef-fects: single isotropic scattering. J Phys Earth 25: 27–41
Sato H (1984) Attenuation and envelope formation ofthree-component seismograms of small local earth-quakes in randomly inhomogeneous lithosphere. JGeophys Res 89:1221–1241
Satyabala SP (1998) Subduction in the Indo-Burman re-gion. Is it still active? Geophys Res Lett 25:3189–3192
Sitaram MVD, Yadav DK, Goswami K (2001) Study oncrustal structure beneath Arunachal Himalaya andAssam. J Geol Soc Ind 58:285–301
Stearns DS, David RA (1988) Signal processing algorithms.Prentice-Hall, Englewood Cliffs, 07632
Tapponier P, Peltzer G, Le Dain AY, Armiju R, CobboldP (1982) Propagating extrusion tectonics in Asia, Newinsight from simple experiments with Plasticine. Geol-ogy 10:611–616
Tillottson E (1953) The great Assam earthquake of 1950,the completion of papers on the Assam Earthquake ofAugust 15, 1950, Compiled by M.B. Ramchandra Rao,pp 94–96
Van Eck T (1988) Attenuation of coda wave in the DeadSea Region. Bull Seismol Soc Am 78:770–779
Woodgold CRD (1992) Coda Q in the Charlevoix,Quebec Region dependence on lapse time, compari-son to typical eastern Canadian values, and possiblelong-term change abstract. Eos Trans. AGU, Springmeeting suppl., 200, pp 73–76