2018 Safety and Security Information Report - Northeastern ...

JOURNAL OF GEOPHYSICAL RESEARCH, VOL. 91, NO. B7, PAGES 7359-7382, JUNE 10, 1986
Crustal Structure of Northeastern California
JOHN J. ZUCCA, 1'2 GARY S. FUIS, • BERND MILKEREIT, 3'4 WALTER D. MOONEY, • AND RUFUS D. CATCHINGS 5
In 1981, the U.S. Geological Survey conducted a seismic refraction survey of northeastern California designed to characterize the structure in four geologic provinces: the Klamath Mountains, Cascade Range, Modoc Plateau, and Basin and Range provinces. The survey consisted of north-south lines in the Klamath Mountains and Modoc Plateau provinces, northwest-southeast lines centered on Mount Shasta and Medicine Lake volcano, and an east-west line linking all the profiles. All lines except the east-west line ranged in length from 125 to 140 km, contained three shot points, and were recorded by 100 instruments. The east-west line was 260 km long, contained six shot points, and was recorded by 200 instruments. The Klamath and Modoc lines yielded the simplest models. The Klamath model is finely layered from the surface to at least 14-km depth, consisting of a series of high-velocity layers (6.1-6.7 km/s), ranging in thickness from 1 to 4 km, with alternating positive and negative velocity gradients. A layer with a unreversed velocity of 7.0 km/s extends from 14 km downward to an unknown depth. The Modoc model, in contrast, is thickly layered and has lower velocity at all depths down to 25 km. The uppermost layer, 4.5 km thick, consists of low-velocity material (2-4.5 km/s). Velocity beneath this layer is much higher (6.2 km/s) and increases slowly with depth. A small velocity step (to 6.4 km/s) is seen at 11 km, and a larger step (to 7.0 km/s) is seen at 25 km depth. Moho is probably 38-45 km deep under the Modoc Plateau, but its depth is unknown under the Klamath Mountains. Models for the Shasta and Medicine Lake lines show special features including low velocity (less than 3.5 km/s) in the edifice of Mount Shasta but high velocity (5.6 km/s) at shallow depth (1-2 km) under the summit of Medicine Lake volcano. The model for the east-west line consists of a western part similar to the Klamath model, an eastern part similar to the Modoc model, and laterally changing velocity structure in between, underlying the Cascade Range. This model was converted to a density model, and observed Bouguer gravity data were matched. A general decrease in Bouguer gravity values eastward may be explained by a general decrease in the density of crustal layers and does not require a change in crustal thickness. Beneath the 4.5-km-thick surficial layer, the velocity model for the Modoc Plateau is similar to that determined by other researchers for a refraction line in the Sierra Nevada. It is unlike velocity models for rift areas, to which the Modoc Plateau has been likened by some authors. We theorize that beneath its surficial volcanic and sedimentary rocks, the Modoc Plateau is underlain by a basement of granitic and metamor- phic rocks that are the roots of ancient magmatic arc(s). The fine layering in the Klamath model is consistent with the imbricate structure of the Klamath Mountains. Independent modeling of aero- magnetic data indicates that the base of the Trinity ultramafic sheet corresponds to a velocity step from 6.5 to 6.7 km/s at 7-km depth in our model. The 6.7 km/s layer beneath the Trinity ultramafic sheet apparently corresponds to rocks of the central metamorphic belt, mostly amphibole schists, which crop out west of the Trinity ultramafic sheet. Deeper velocity layers can likewise be correlated to terranes that crop out farther west. In our geologic cross section of northeastern California, derived from our velocity- density model for the east-west line, the Klamath Mountains are underlain by folded and thrust-faulted slices of oceanic crust. The Modoc Plateau and westernmost Basin and Range province are underlain by a section of volcanic and sedimentary rocks overlying granitic and metamorphic rocks, all tilted west- ward between an inferred fault under Medicine Lake volcano and the Surprise Valley fault. In the Cascade Range, geologic units appear to be discontinuous, and structures include horsts, grabens, and a 10-km step downward to the east in the 7 km/s layer. The latter step may represent a fault, fold, intrusion, or a combination of any of the three. Apparently, the Cascade Range, a modern magmatic arc, is developed across the suture region between the stack of oceanic rock layers underlying the Klamath Mountains and the inferred roots of magmatic arc(s) underlying the Modoc Plateau.
l. INTRODUCTION
In 1981, the U.S. Geological Survey conducted a seismic refraction survey of northeastern California designed both to characterize the structure in four of the geologic provinces of that region (Klamath Mountains, Cascade Range, Modoc Pla- teau, and Basin and Range provinces, Figure 1) and to es- tablish the geologic relations between these provinces. It was
• U.S. Geological Survey, Menlo Park, California. 2 Now at Lawrence Livermore National Laboratory, Livermore,
California.
3 Institute for Geophysics, University of Kiel, Federal Republic of Germany.
'[ Now at Earth Physics Branch, Energy, Mines and Resources Canada, Ottawa, Ontario.
5 Department of Geophysics, Stanford University, Stanford, Cali- fornia.
Copyright 1986 by the American Geophysical Union.
Paper number 5B5720. 0148-0227/86/005 B- 5720505.00
also intended to define the structural setting of the two large Cascade Range volcanoes in the area, Mount Shasta and Me- dicine Lake volcano. One 135-km-long north-south seismic refraction line was laid out parallel, or nearly parallel, to the strike of geologic structures in the Klamath Mountains (Figure 1); a second 140-km-long north-south line crossed structure on the Modoc Plateau at angles ranging from 0 ø to 45 ø. Two northwest-southeast lines (125-135 km long) were centered on Mount Shasta and Medicine Lake volcano to
coincide with lines of a teleseismic P delay experiment [Evans, 1982; Stauber and Berge, 1985]. An east-west line (260 km long) links all the profiles together.
Each seismic refraction line consisted of 100 portable seis- mographs with station spacing ranging from 0.5 km near shot points to 1.75 km farther away. Most lines also had widely spaced (5 km) stations near one end for reconnaissance re- cording of arrivals from deeper layers. The instruments are portable cassette (analog) tape recorders with 2-Hz seismome- ters, capable of rapid deployment, programmable turn-on, and rapid playback in the field or laboratory. A detailed descrip-
7359
7360 ZUCCA ET AL.' CRUSTAL STRUCTURE OF NE CALIFORNIA
41 ø
123 o Oregon 12 2 o ifornia oDorri s Clear lake
BUTTE • /Te ser Zø• VALLEY
9,14
121 ø
lO
Medicin; 11 Lk
ß ',,Shas
*, BIG"
_• ",•A LLEY / CASCA
i
120 ø 42 ø
Goose/oke • ' •
'09
Cedarville
EXPLANATION
KLAMATH MOUNTAINS PROVINCE
uras • ".•
BASIN AND •
RANGE
M O C'•X. 4• o PLAT AU • •
o,
0 MI 30
0 K M 50
120 ø
SYMBOLS
'-.•T•,-! INTRUSIVE ROCKS (CRETACEOUS AND JURASSIC)-- [•'-•:-•2{! Chiefly granll•c rocks, lesser gabbro
F7_•7_____- 1 EASTERN KLAMATH BELT (JURASSIC TO ORDOVICIAN)-- Sedimentary and volcamc rocks
FORK TERRANE OF ANDO AND OTHERS (1983) (JURASSIC
TO UPPER PALEOZOIC)-- Metamorphosed and unmetamorphosed
sedimentary and volcamc rocks
Geologic prov•nce boundary
Contact
Faults h•gh angle and thrust (teeth on upper
plate), dotted where buried.
Abbreviations GBF- GiIlem Bluff Fault
LF- Likely Fault
ST-Sisklyou Thrust Fault
SVF- Surprise Valley Fault
TFZ- fault zone near Tennant
•:•4.•.?•:•'_•_,• LOWER PART OF NORTH FORK TERRANE (UPPER ?""•'• PALEOZOIC) - - Ophlohte
UNDIVIDED (DEVONIAN METAMORPHIC AGE)
Shot po•nt
& Seismograph
Town
Fig. 1. Index map for seismic refraction survey of northeastern California. Four geologic provinces covered by survey are Klamath Mountains, Cascade Range, Modoc Plateau, and Basin and Range provinces. Geologic units within Klamath Mountains province are shown to aid discussion in text. Units are generalized from Jennings [1977], Davis et al. [1965], Potter et al. [1977], Hotz [1977], and Ando et al. [1983]. Geologic units exposed in Cascade Range, Modoc Plateau, and Basin and Range provinces in Figure 1 are chiefly Cenozoic volcanic and sedimentary rocks.
tion of the instruments and field procedures is found in the work by Healy et al. [-1982]. Most lines recorded at least three shots, one at either end and one in the middle. The east-west
line was recorded in two halves with each half recording three to four local shots plus a distant shot (at shot points 2 and 13) to provide coverage of deeper layers.
2. GEOLOGIC SETTING
The Klamath Mountains province is characterized within the survey area by rugged mountains and narrow valleys. The
province is underlain by several north trending lithotectonic belts, or subprovinces, that are arcuate and convex to the west (Figure 1). Within the region of our experiment, these include, from east to west, the eastern Klamath belt, the Trinity ultra- mafic sheet of Irwin [-1977], the central metamorphic belt, and the western Paleozoic and Triassic belt, the last of which is further subdivided into several terranes [-Irwin, 1966, 1972, 1977]. All contacts except that between the first two belts are clearly thrust faults. The eastern Klamath belt consists of sedi- mentary and volcanic rocks of forearc or arc affinity with a

ZUCCA ET AL..' CRUSTAL STRUCTURE OF NE CALIFORNIA 7361
probable aggregate thickness of more than 13 km and ages ranging from Middle Jurassic to Ordovician [Irwin, 1966, 1977, 1981]. The Trinity ultramafic sheet of Irwin [1977] con- sists mostly of serpentinized ultramafic rocks with lesser intru- sive bodies of gabbro that are Ordovician in age [Lanphere et al., 1968; Martinson and Hopson, 1972].
The central metamorphic belt consists of the Salmon Horn- blende Schist and Abrams Mica Schist [Davis et al., 1965; Irwin, 1966]. These rocks are isoclinally folded, and their structural thickness ranges from less than a kilometer to sev- eral kilometers [Irwin, 1977, 1981; Davis et al., 1980]. The western Paleozoic and Triassic belt comprises at least two terranes within the region of our survey, the Stuart Fork For- mation, which is greenschist-facies metasedimentary and me- tavolcanic rocks of oceanic affinity [Davis and Lipman, 1962; Davis et al., 1965], and the North Fork terrane of Ando et al. [1983], composed of similar but unmetamorphosed rocks in its upper part and late Paleozoic ophiolite in its lower part.
All of the lithotectonic belts of the Klamath Mountains are
intruded by Upper Jurassic and Lower Cretaceous plutons that are dominantly quartz diorite [Irwin, 1966, also oral com- munication, 1985; Hotz, 1971] (Figure 1). Recent work by Barnes et al. [1982] has shown that thrust faulting continued at least along the west boundary and base of the rock body comprising the western Paleozoic and Triassic belt after em- placement of some of these plutons. These lithotectonic belts and the plutons are overlain by Lower and Upper Cretaceous strata of the Great Valley sequence.
The Cascade Range in northern California is a south- eastward trending chain of shield and small composite vol- canoes. This chain is flanked on the southwest by Mount Shasta, a stratovolcano, and on the northeast by Medicine Lake volcano, a shield volcano (Figure 1). Both volcanoes are much larger and longer lived than other individual volcanoes of the Cascade chain [Christiansen, 1982; Donnelly-Nolan, 1983]. Broad valleys also flank the Cascade chain. Rocks ex- posed in this province include Upper Cretaceous and Eocene sedimentary rocks and volcanic rocks divisible into the West- ern Cascade sequence (Eocene to Miocene) and the High Cas- cade sequence (Pliocene to Holocene) [Peck et al., 1964; Mac- donald, 1966]. Both sequences consist of lava flows and vol- caniclastic deposits that are chiefly pyroxene andesite. Rocks of the older sequence are faulted and tilted northeastward and are unconformably overlain by rocks of the younger sequence.
The boundaries between the Cascade Range, Modoc Pla- teau, and Basin and Range provinces are not distinct because block faulting and similar rocks characterize all three prov- inces. The Modoc Plateau province south of latitude of 41ø30 ' is characterized chiefly by northwest trending ranges and north of that latitude by a plateau. The part of the Basin and Range province in our study area includes Surprise Valley and the Warner Mountains, which are the westernmost basin and range, respectively, of the province. The Modoc Plateau prov- ince and the Warner Mountains are underlain by a section of rocks that includes at its base volcaniclastic deposits of early Tertiary age overlain by interbedded Miocene tuffaceous con- tinental and lake deposits and flood basalt flows [Macdonald, 1966; Duffield and Weldin, 1976]. The basal volcaniclastic de- posits are largely andesitic in composition, the overlying tuffa- ceous deposits are largely rhyolitic, and the lava flows are largely high-alumina basalt similar to that erupted at mid- ocean ridges or back arc basins [McKee et al., 1983]. Rocks of the Modoc Plateau are cut by northwest to north trending normal faults, but major right-lateral strike slip is reported for
the Likely fault [Macdonald, 1966] (Figure 1). In the Basin and Range province the Warner Mountains are tilted gently westward, and the Surprise Valley block is dropped down- ward by more than a kilometer along the Surprise Valley fault (Figure 1) and covered by thick Quaternary alluvium and lake deposits.
3. PREVIOUS GEOPHYSICAL WORK
The Klamath Mountains and the Cascade Range have been the subjects of many geophysical studies in the last two dec- ades. The earliest work revealed an eastward decrease in the
Bouguer grvity across the Cascades that suggested an east- ward thickening of the crust [LaFehr, 1965, 1966]. In addi- tion, the gravity work provided evidence of a large volume of low-density material beneath an area including Mount Shasta and the Cascade chain of Shield volcanoes. Gravity work by [Pakiser, 1964] indicated a similar low-density body beneath the Lassen Peak region. Pakiser suggested that this low- density material could be due to, among other things, a volcano-tectonic depression filled with volcanic material of low average density. In contrast to the gravity low associated with Mount Shasta and the Cascade chain, a gravity high is seen over Medicine Lake volcano. This high is more pro- nounced when a Bouguer reduction density more appropriate for extrusive rocks is used (2.2 Mg/m 3 [Finn and Williams, 1982]). Finn and Williams [1982] modeled the gravity data over Medicine Lake volcano with a shallow intrusive complex in the upper crust that is 0.4 Mg/m 3 denser than surrounding rocks. This interpretation is supported by the electromagnetic sounding work of Stanley [1982].
Seismic refraction data were recorded in 1962 along a line from Lake Shasta (10 km north of Redding, California; not shown in Figure 1) southeastward through the southern Cas- cade Range and Sierra Nevada provinces to Mono Lake, on the east edge of the Sierra Nevada [Roller and Gibbs, 1964; Roller et al, 1963]. The interpretations of these data by Eaton [1966] and Prodehl [1979] differ to a large degree at the north end of the line. Eaton indicates the shoaling of an intermediate-velocity layer northward under the Cascade Range province (a 6.8 km/s layer rising to less than 10-km depth), whereas Prodehl's results indicate a similar shoaling of an intermediate-velocity layer (6.4-6.5 km/s layer rising to less than 10-km depth) coupled with an underlying low-velocity zone (as low as 6.0 km/s between 10- and 20-km depth). The interpretations are in closer agreement on velocity structure in the northern Sierra Nevada (a 6.4 km/s layer beginning at 10-20 km; crustal thickness of 4147 km).
Leavet et al. [1984] used a combination of earthquakes and artificial sources recorded at permanent and portable seismo- graph stations to model a north-south profile along the axis of the Oregon Cascades. Their velocity-depth model is quite similar to the model for the northern Sierra Nevada obtained
by Eaton [1966] and Prodehl [1979], including a crustal thick- ness of 42 km, but an intermediate crustal velocity of 6.4 km/s is encountered everywhere at shallower depths (less than 10 km).
4. RECORD SECTIONS AND MODELS
The data collection and analysis are described below for our six seismic refraction lines, hereafter referred to as the Kla- math, Modoc, Shasta, Medicine Lake, and east-west lines (Figure 1). The east-west line is split into two lines, for con- venience, at Medicine Lake.
The data were analyzed for compressional wave velocity
7362 ZUCCA ET AL.' CRUSTAL STRUCTURE OF NE CALIFORNIA
{Yreka)
NORTH ..cP1
1-
-1
-2
e 0
(Callahan) Trinity Reservoir
SP2 SP$
'11 ]11 Ifil I1 II, III I1,11 IIIIllllllllfllillllll !111 ]l/It I,I Iilllfllll I 20 40 60 80 I00
I i i I y I
i I J I *
2O 40 i
TRUE AMPLITUDE SPi • till I111 f LI.L ll_Jl LLJ [It I 20 40
6O 8O
60 80
I00
I00
I
-2-
D 1• ....
SYN
0
SOUTH
-0
120 140 I
16
20 I•0
2
-1
-0
-1
-2
20 140
20 40 60 80 I00 12_0
DI STANCE (KM)
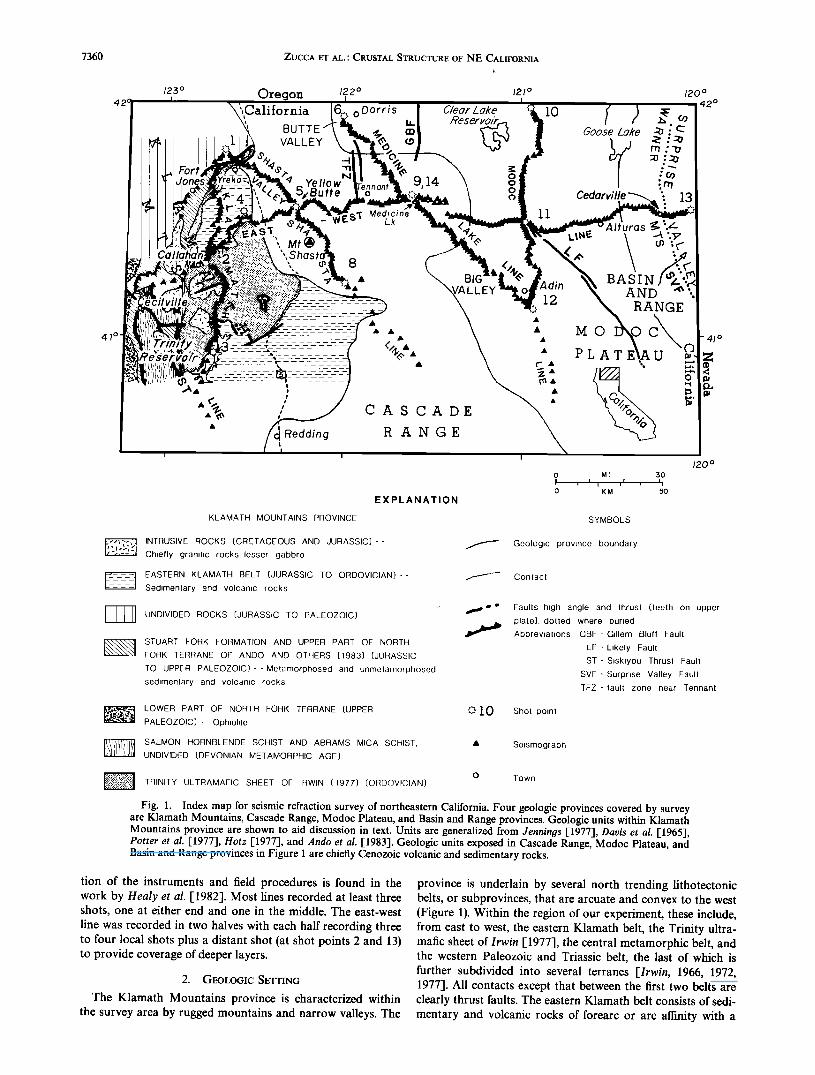
Fig. 2. Data from shot point 1 on the Klamath line and preferred model. (a) Trace-normalized record section. Geographic locations in parentheses are slightly off line. Numbered curves are calculated travel time curves for preferred model (Figure 6a). Numbers are velocities (in kilometers per second) of model layers in or on which rays bottom. Parentheses indicate that velocity was inferred from secondary arrivals (reflections). (b) Preferred model (same as Figure 6a with no vertical exaggeration) showing ray paths from shot point 1. Note that model is only well controlled in areas penetrated by rays. (c) True relative amplitude record section. Distance scaling exponent is 1.5 (d) Synthetic record section. Distance scaling exponent is 1.0.
structure by trial-and-error forward modeling of travel times using ray tracing. Theoretical travel times were calculated for trial models by an interactive computer program based on ray-theoretical methods developed by (•erven)• et al. [1977]. In this program, the compressional wave velocity of a model is described by linear velocity gradients between boundaries that can vary laterally in depth. Topography can be modeled di-
rectly, eliminating the need to correct the data for elevation. For two lines we present alternate models. We do this because the geologic structure is very complex throughout the survey area, and it is therefore difficult for one model to explain perfectly all the features observed in the data.
In this paper we present primarily a travel time interpreta- tion of the data. However, we did calculate amplitudes where
ZUCCA ET AL.' CRUSTAL STRUCTURE OF NE CALIFORNIA 7363
[Yreka]
NORTH 1 sP]
A 2
, [7.0]
I--1 1 -2
B ioc) •: 0
ß .t- 8
u.i IG
80 6o
ioo 80 6o
[Callahan]
SP2
ß
40
Trinity Reservoir
sP3
20 0
ORMiL I ZED
I 20
SOUTH
-1
-0
--1
SP3
zO
40 20 0 20 40
D ,oo 8o 60 40 20 o 20 40
• 1 ,..•. ........................ • ........... V 1
-• 0 0 x
•L SYNTH C P3 -I ........................ I.I, I. I ,I ,I, I .....
•oo 8o 60 40 2o o
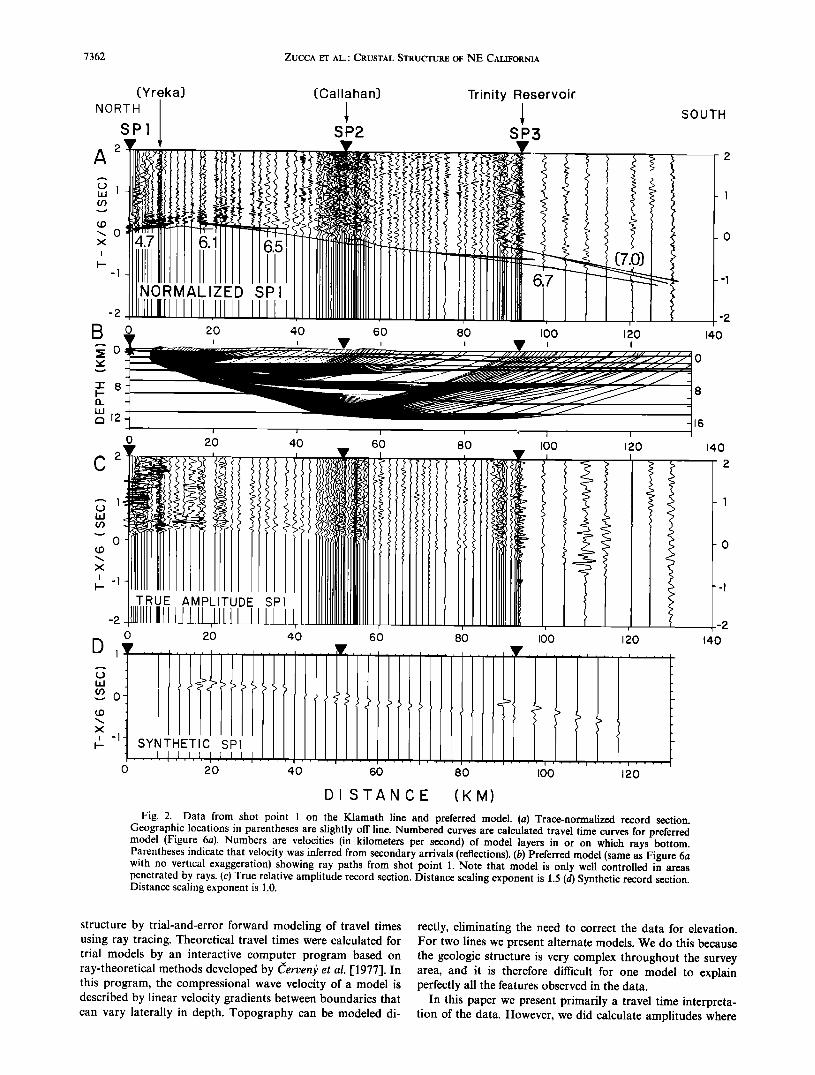
DISTANCE (KM) Fig. 3. Data from shot point 3 on the Klamath line and preferred model. (a) Trace-normalized record section with
preferred model travel time curves. (b) Preferred model (same as Figure 6a with no vertical exaggeration) showing ray paths from shot point 3. (c) True relative amplitude record section. Distance scaling exponent is 1.5. (d) Synthetic record section. Distance scaling exponent is 1.0. For more detail, see caption for Figure 2.
the structure did not vary too much laterally. To model ampli- tudes, we relied on the method of McMechan and Mooney [1980] for calculating ray-theoretical synthetic seismograms in laterally varying media. Our purpose was to try to model relative amplitude maxima and minima. In one-dimensional media this means modeling amplitude maxima at critical points and the disappearance of phases due to low-velocity layers. However, in two-dimensional media, amplitude max- ima and minima also result from lateral variations in velocity.
Klamath Line
The Klamath line is 135 km long, extending from shot point 1, 10 km north of Yreka, California, through shot points 2 and
3, and beyond shot point 3 at increased instrument spacing (Figure 1). The terrain traversed is quite rugged and has a total relief of 760 m. Between shot points 1 and 2 the profile lies primarily on the sedimentary and volcanic rocks of the eastern Klamath belt, but near its north end it crosses obliquely several underlying thin lithotectonic belts. Between shot points 2 and 3 the profile traverses the Trinity ultramafic sheet of Irwin [1977] and ends in eastern Klamath rocks at shot point 3.
The data from the Klamath line (Figures 2 and 3) are characterized by a pattern in which one branch dies out and is replaced by another branch that is delayed in time and has slightly higher apparent velocity. The data from shot point 1
7364 ZUCCA ET AL.' CRUSTAL STRUCTURE OF NE CALIFORNIA
NORTH
1.0
-1.o •0.0 30.0 20.0
OISTRNCE lO.O o
(Callahan)
•' SOUTH SP2
' i.o
- 0.0
0
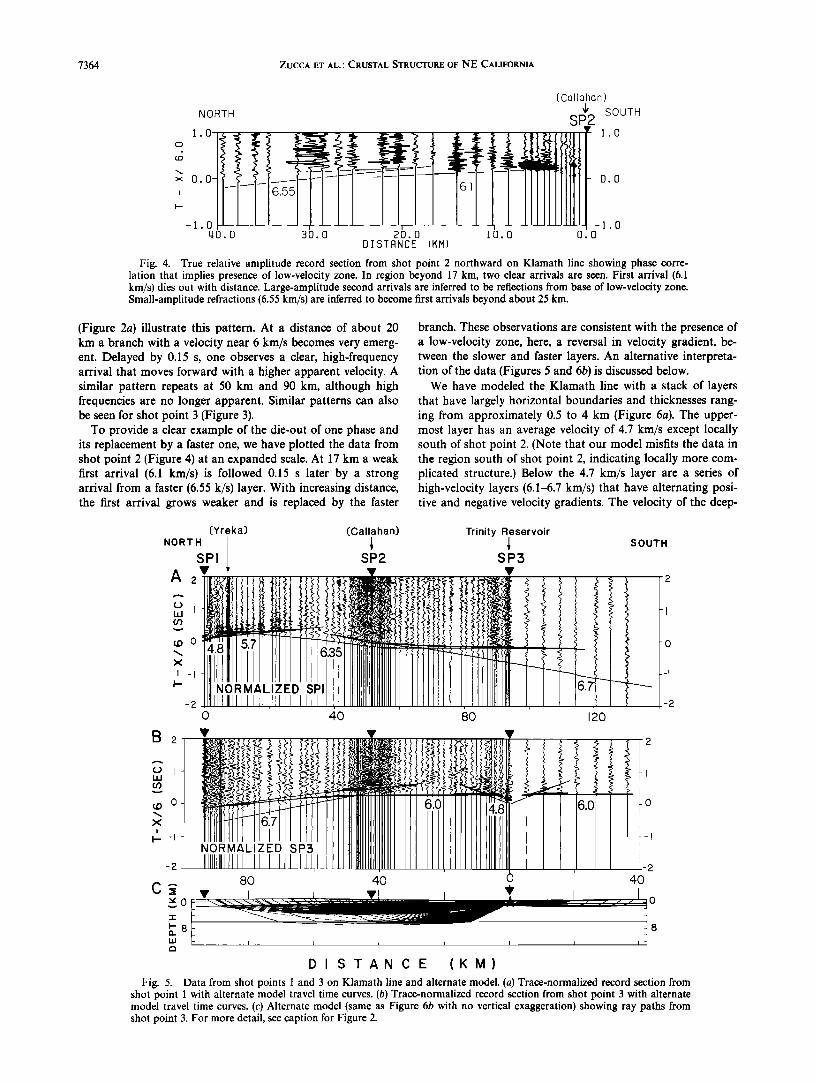
Fig. 4. True relative amplitude record section from shot point 2 northward on Klamath line showing phase corre- lation that implies presence of low-velocity zone. In region beyond 17 km, two clear arrivals are seen. First arrival (6.1 km/s) dies out with distance. Large-amplitude second arrivals are inferred to be reflections from base of low-velocity zone. Small-amplitude refractions (6.55 km/s) are inferred to become first arrivals beyond about 25 km.
(Figure 2a) illustrate this pattern. At a distance of about 20 km a branch with a velocity near 6 km/s becomes very emerg- ent. Delayed by 0.15 s, one observes a clear, high-frequency arrival that moves forward with a higher apparent velocity. A similar pattern repeats at 50 km and 90 km, although high frequencies are no longer apparent. Similar patterns can also be seen for shot point 3 (Figure 3).
To provide a clear example of the die-out of one phase and its replacement by a faster one, we have plotted the data from shot point 2 (Figure 4) at an expanded scale. At 17 km a weak first arrival (6.1 km/s) is followed 0.15 s later by a strong arrival from a faster (6.55 k/s) layer. With increasing distance, the first arrival grows weaker and is replaced by the faster
branch. These observations are consistent with the presence of a low-velocity zone, here, a reversal in velocity gradient, be- tween the slower and faster layers. An alternative interpreta- tion of the data (Figures 5 and 6b) is discussed below.
We have modeled the Klamath line with a stack of layers that have largely horizontal boundaries and thicknesses rang- ing from approximately 0.5 to 4 km (Figure 6a). The upper- most layer has an average velocity of 4.7 km/s except locally south of shot point 2. (Note that our model misfits the data in the region south of shot point 2, indicating locally more com- plicated structure.) Below the 4.7 km/s layer are a series of high-velocity layers (6.1-6.7 km/s) that have alternating posi- tive and negative velocity gradients. The velocity of the deep-
[Yreka) NORTH
SP1
-2
(Callahan)
SP2
,x I-- -I
_l__[11illl , 11 I 11/ 80
v
80
Trinity Reservoir
SP3
SOUTH
2
I
o
-I
-2
DIS TAN C E (KM)
Fig. 5. Data from shot points 1 and 3 on Klamath line and alternate model. (a) Trace-normalized record section from shot point 1 with alternate model travel time curves. (b) Trace-normalized record section from shot point 3 with alternate model travel time curves. (c) Alternate model (same as Figure 6b with no vertical exaggeration) showing ray paths from shot point 3. For more detail, see caption for Figure 2.

ZUCCA ET AL.' CRUSTAL STRUCTURE OF NE CALIFORNIA 7365
A KLAMATH MTS [Yreka] CCallahan] Trinity Reservoir
NORTH I • / SOUTH
• 0 - '• , ' :•' •: •o 4.7 • 0 •' i • •(60J/• • - ' - • • •5
6.55 6.55 •::::: • - ' '••5• 8', 6.7 6.7 6.65 6 65
• •6 (7.0) (ZO)* (7.0) (7.0) •S 0 0 80 120
DI STANC E (KM)
D I S TAN C E (K M)
c t _l I I
, 0
I
• 6 8 4 6 8
t •.._. I I
SP$ i ! ! !
4 6
VELOCITY (KM/SEC)
Fig. 6. Velocity models for Klamath line: (a) Preferred model. (b) Alternate model. (c) Velocity-depth sections through preferred (solid) and alternate (dashed) models. Numbers are average velocities (in kilometer per second) for layers. Parentheses indicate that velocity was inferred from secondary arrivals (reflections). Asterisk indicates that velocity is supported by data on cross line. Layers with no velocity gradient or reversal in velocity gradient are indicated by diagonal lines. Strong lateral velocity changes are indicated by dotted areas. Inverted solid triangles indicate shot points and/or velocity-depth section locations. Layer boundaries are dashed where no ray coverage. Vertical exaggeration is 2 x.
est layer, 7.0? km/s (an unreversed velocity), at 14-km depth, is poorly constrained since phases beyond the critical point are poorly observed. (On the perpendicular east-west line only the reflection from this layer is clearly observed; see below).
An alternate model (Figures 5 and 6b) is very similar to the preferred model above 14-km depth except that it does not have velocity reversals and cannot reproduce the subtle arrival appearances and disappearances as can the preferred model. Secondary arrivals between 60 and 100 km are treated as a postcritical reflection from the 6.7 km/s layer rather than a combination of postcritical reflections from that layer and critical and postcritical reflections from a deeper (7.0? km/s) layer.
Modoc Line
The M odoc line is 140 km in length, extending from shot point 10, near the Oregon border, through shot point 11 to
shot point 12, near the town of Adin, California, and beyond with increased station spacing (Figure 1). Relief along the line is only 210 m, which is not large enough to include in the model. The line lies entirely within the Modoc Plateau prov- ince. Between shot points 10 and 11 the profile crosses a pla- teau that consists mainly of flood basalt flows. South of shot point 11, the profile crosses a series of horsts, grabens, and tilted blocks exposing interbedded flood basalt flows, lake de- posits, pyroclastic beds, and the basal andesitic volcaniclastic series of this province. Faults bounding these blocks strike northwest parallel to the Likely fault, a major-slip fault pass- ing approximately beneath shot point 11.
The first arrivals outline travel time curves that are slightly asymmetrical about shot point 12 (Figure 7a). The crossover times of the basement branch (6.2 km/s) are larger south of shot point 12 than north; however, the apparent velocities are similar. There is considerable structure on the basement

7366 ZUCCA ET AL.' CRUSTAL STRUCTURE OF NE CALIFORNIA
Calif / Ore border
NORTH
4
x (6.45)
, t.-. I
o , IOO
B
P!O
80 60 i
• 24
LF Adin
SP12 " '
NORMAL
2O
SOUTH
ZED SP 12
40
5.2
24
IOO
4 '
,.-. 3
2
I
o
D 4
..-.. 3
80 60 ' 4•) ' Z•) '
2
I
I00, v' 80 60 ,-- ..... • , .... i , , , '•-i , , ,
i .... i , , , -, i .... i .... [ .... / .... / , , ,
I00 80 60 40
2o ! l'l'l'l'i'l'l'l'i'l'l'' SYNTHETIC SP12
20 0
20 40
DISTANCE (KM)
Fig. 7. Data from shot point 12 on Modoc line and model. (a) Trace-normalized record section with model travel time curves. (b) Model (same as Figure 9a with no vertical exaggeration) showing ray paths from shot point 12. (c) True relative amplitude record section. Distance scaling exponent is 2.0. (d) Synthetic record section. Distance scaling exponent is 1.0. For more detail, see caption for Figure 2.
branch north of shot point 12 with travel time advances and delays of up to 0.2 s. Beyond 85 km, a high-amplitude second- ary phase arrives at about 1.2 s. Arrivals that are later yet (2-3 s) are suggested by coherent bands of energy in the distance range 50-95 km. The travel time curve from shot point 10 (Figure 8a) is quite similar to that for shot point 12, and the triplication at the crossover to the 6.2 km/s branch is clearer.
The data from shot point 11 (Figure 8c) are different from those of the other two shot points. To the south, a 2.1 km/s branch is crossed over by a 5.5 km/s branch that dies out within a few kilometers. A low-amplitude arrival appears after an 0.8-s delay (4.4 km/s branch in Figure 8c) that becomes stronger at larger distances and increases in apparent velocity to 6.2 km/s. A similar pattern of arrivals is seen north of sho t

ZUCCA ET AL.' CRUSTAL STRUCTURE OF NE CALIFORNIA 7367
Calif / Ore border
NORTH• SPIO
A
0 , I I I I
B
C 4
20 40
o
LF Adin
I SOUTH S12
ORMALI • 4 3
2
- ) I
I I I I C) 80 I00 120 140
I I I I I I
o 60
D
i i i i i i
DI STANCE (KM)
410 29 20 60 8,0
16
24
32
16
24
• 2
D I STAN C E (K M)
Fig. 8. Data from shot points l0 and 22 on Modoc line and model. (a) Trace-normalized record section from shot point 10 with model travel time curves. (b) Model (same as Figure 9a with no vertical exaggeration) showing ray paths from shot point 10. (c) Trace-normalized record section from shot point 11 with model travel time curves. Dots on branches labeled 5.5 km/s, near shot point 11, indicate arrivals difficult to see on this plot. (d) Model (same as Figure 8b) showing ray paths from shot point 11. For more detail, see caption for Figure 2.
point 11, but the basement branch is delayed more. North of the shot point an apparent multiple refraction or reflection follows the first arrival by about 0.7 s (Figure 8c, arrows).
Our model for the Modoc line consists of a sequence of largely horizontal layers with some lateral velocity change and some interface relief that is mostly localized between shot points 11 and 12 (Figure 9). Low-velocity near-surface rocks at shot points 10 and 12 are modeled with three layers having velocities ranging from 2.1 to 4.4 km/s. A marked disconti- nuity at the top of the basement refractor (6.2 km/s) is sup-
ported by the strong triplication observed at shot point 10 (Figure 8a). Centered at about 10-km depth beneath shot points 10 and 11 is a 2-km-thick low-velocity zone that at- tenuates amplitudes on the 6.2 km/s branch and moves the apparent critical point for the 6.45 km/s layer back to its observed distance of approximately 85 km. The 6.45 km/s branch is indicated by reflections only on the Modoc line but is documented by refractions on the east-west line, as dis- cussed below. We have modeled a 7.0 km/s layer beneath the 6.45 km/s layer to produce the diffuse band of energy observed

7368 ZUCCA ET AL.: CRUSTAL STRUCTURE OF NE CALIFORNIA
CA/OR border
North •
A
MODOC PLATEAU
s.]o ß Adin, SP]2_. , 2.5 , ' .___2...•' ' 2.1' '-- ' •/ -'• ' 2.5 • - 4.4 •.• / • x ':•:•:' 3.8 - '•', 5.2
- 6.2 6.2 6.2
-
South
(6.45) (6.45)* (6.45)
(7.0) (7.0)* (7.0)
20 40 0 80 I00 120
DISTANCE (KM)
16
24
Fig. 9.
v io
a. 20
SPIO
, I I
VELOCITY
SPI2
8 8 (KM/SEC)
(a) Velocity model for Modoc line. (b) Velocity-depth sections. For detail, see caption for Figure 6.
between 2 and 3 s at 70-95 km from shot point 12 (Figure 7a). This layer is documented by clear refractions on the east-west line.
At shot point 11 the upper part of the model is quite com- plicated. A high-velocity layer (5.5 km/s) and an underlying low-velocity layer (2.5 km/s) reproduce the features seen in the data (Figures 8c). The buried 2.5 km/s body also reproduces the travel time delays seen at shot point 11 from all distant shots.
Shasta Line
The Shasta line is 135 km long. It extends from shot point 1, 10 km north of Yreka, through shot points 5 and 8 and beyond shot point 8 for another 50 km with sparse station spacing (Figure 1). The line crosses the east flank of Mount Shasta, within 5 km of the summit (as near to the summit as roads allowed). The maximum relief along the profile is 1330 m; the maximum altitude is 2100 m on the flank of Mount Shasta. Between shot points 1 and 5, the line crosses the boundary between the Klamath Mountains and the Cascade Range provinces. Within the Cascade Range province the line crosses Tertiary and younger volcanic rocks except at shot point 5, at Yellow Butte, where a horst has brought Klamath province rocks to the surface [Williams, 1949]. South of shot point 8 the line crosses eastern Klamath sedimentary and vol- canic rocks and ends in Cascade volcanic rocks.
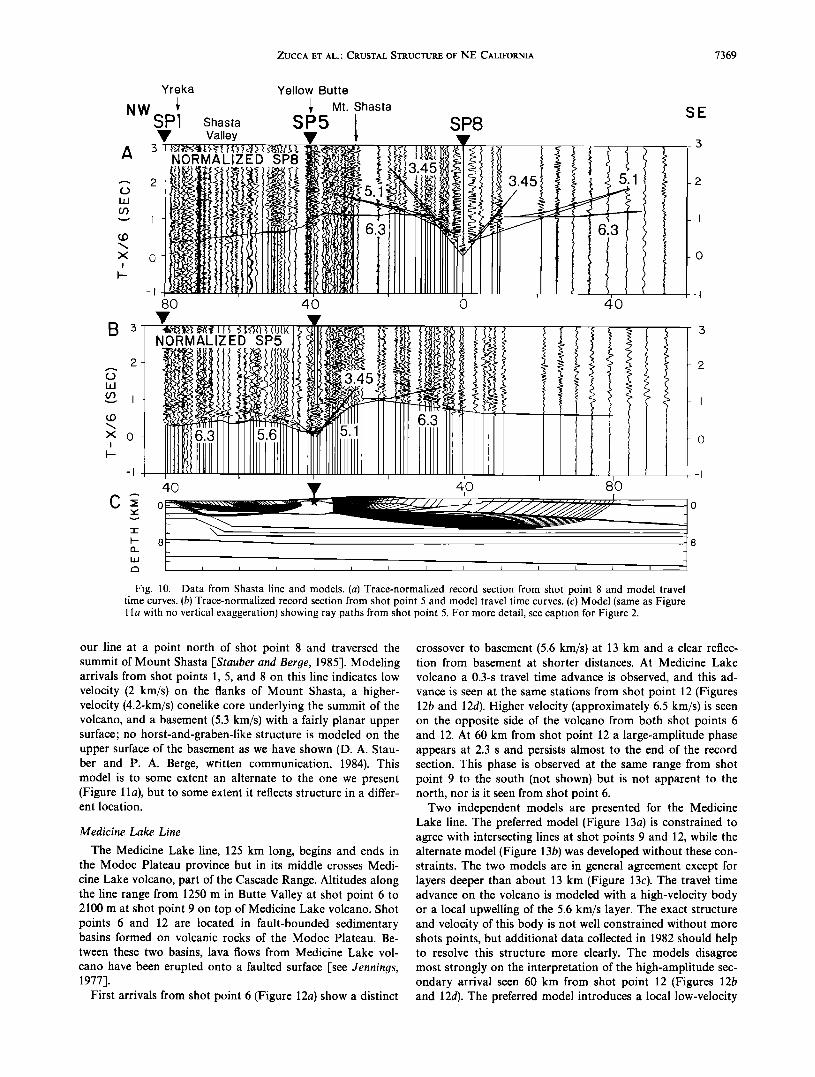
The travel time curves for the Shasta line (Figure 10) are dominated by the effects of velocity structures under Mount
Shasta and Yellow Butte, which produce large travel time delays and advances, respectively, on all record sections. These effects are best seen in record sections from shot point 5 (Figure 10b), where arrivals define a spectacularly asymmetric travel time curve with a relatively large delay (about 1 s) on Mount Shasta and much lesser delays in the Shasta Valley. First arrivals from shot point 8 are delayed over the edifice of Mount Shasta and advanced at Yellow Butte.
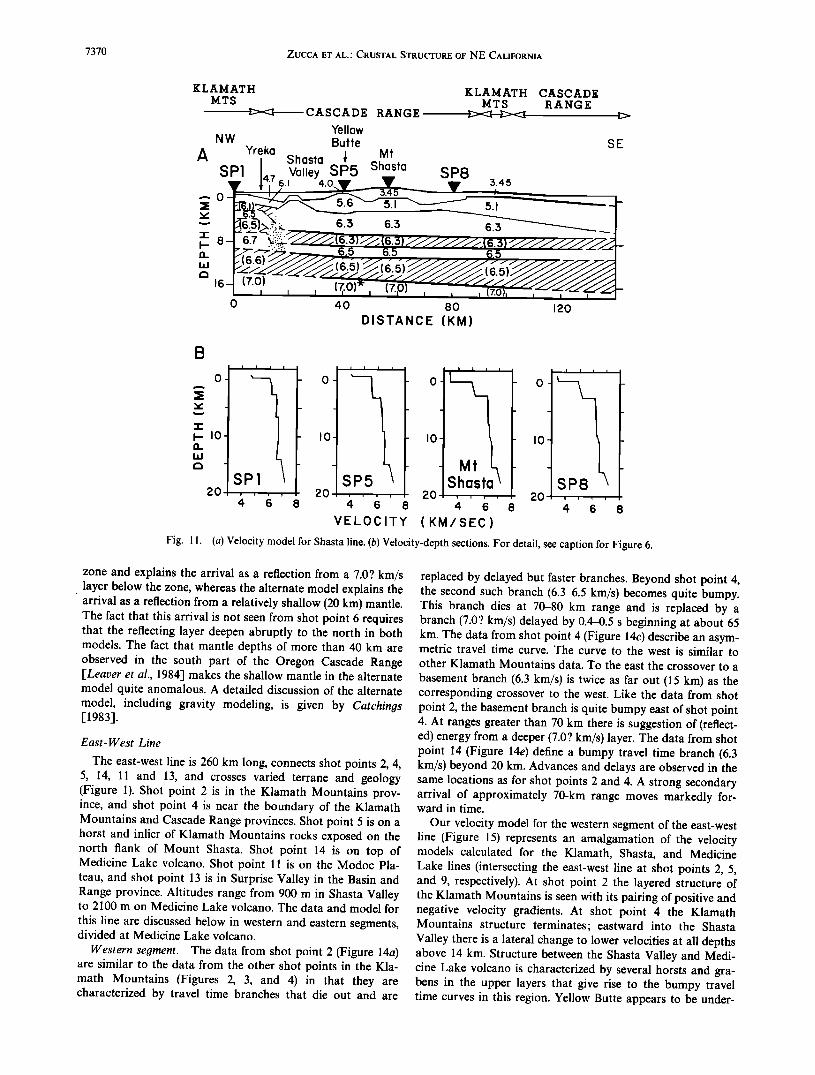
Our model for the Shasta line (Figure 11) is constrained to agree with the Klamath model at shot point 1 and the east- west model at shot point 5. The apparent velocities observed from shot points 1 (not shown) and 5 require a basement refractor in the Shasta Valley with a velocity of 5.6 km/s. Travel time offsets in the Shasta Valley are modeled by ho;st- and-graben-like structure (Figure 11). The low apparent veloc- ities observed on the edifice of Mount Shasta are modeled by a layer with an average velocity of 3.45 km/s. Although a horst under Yellow Butte is required by the data, the horst- and-graben-like structure under Mount Shasta is poorly con- strained, as is the basement velocity of 5.1 km/s. A seismic refraction experiment in 1982, in which the Shasta line was reoccupied and a shot point added on Mount Shasta, indi- cates lower velocities (2-2.5 km/s) on the edifice of Shasta than in our model. These data have not yet been modeled.
A teleseismic P delay experiment conducted in 1981 in con- junction with the seismic refraction experiment consisted of about 16 instruments in the vicinity of Mount Shasta laid out along a northwest trending line that diverged westward from
ZUCCA ET AL.: CRUSTAL STRUCTURE OF NE CALIFORNIA 7369
Yreka Yellow Butte
NW Mt. Shasta SE SP1 Shasta SP5 I S :•8 • Valley • • r 3
NORMALIZED SP8 ,; ! I•l . 5.1 2
,x o -I 80 ' 40 0 4-0
NORMALIZED SP5 c
•' 2- 2_
X 0 0 I
40 8'0 4O
o
• I I I • I I I I I I I I I
Fig. 10. Data from Shasta line and models. (a) Trace-normalized record section from shot point 8 and model travel time curves. (b) Trace-normalized record section from shot point 5 and model travel time curves. (c) Model (same as Figure 1 l a with no vertical exaggeration) showing ray paths from shot point 5. For more detail, see caption for Figure 2.
our line at a point north of shot point 8 and traversed the summit of Mount Shasta [Stauber and Berge, 1985]. Modeling arrivals from shot points 1, 5, and 8 on this line indicates low velocity (2 km/s) on the flanks of Mount Shasta, a higher- velocity (4.2-km/s) conelike core underlying the summit of the volcano, and a basement (5.3 km/s) with a fairly planar upper surface; no horst-and-graben-like structure is modeled on the upper surface of the basement as we have shown (D. A. Stau- ber and P. A. Berge, written communication, 1984). This model is to some extent an alternate to the one we present (Figure 11a), but to some extent it reflects structure in a differ- ent location.
Medicine Lake Line
The Medicine Lake line, 125 km long, begins and ends in the Modoc Plateau province but in its middle crosses Medi- cine Lake volcano, part of the Cascade Range. Altitudes along the line range from 1250 m in Butte Valley at shot point 6 to 2100 m at shot point 9 on top of Medicine Lake volcano. Shot points 6 and 12 are located in fault-bounded sedimentary basins formed on volcanic rocks of the Modoc Plateau. Be-
tween these two basins, lava flows from Medicine Lake vol- cano have been erupted onto a faulted surface [see dennings, 1977].
First arrivals from shot point 6 (Figure 12a) show a distinct
crossover to basement (5.6 km/s) at 13 km and a clear reflec- tion from basement at shorter distances. At Medicine Lake
volcano a 0.3-s travel time advance is observed, and this ad- vance is seen at the same stations from shot point 12 (Figures 12b and 12d). Higher velocity (approximately 6.5 km/s) is seen on the opposite side of the volcano from both shot points 6 and 12. At 60 km from shot point 12 a large-amplitude phase appears at 2.3 s and persists almost to the end of the record section. This phase is observed at the same range from shot point 9 to the south (not shown) but is not apparent to the north, nor is it seen from shot point 6.
Two independent models are presented for the Medicine Lake line. The preferred model (Figure 13a) is constrained to agree with intersecting lines at shot points 9 and 12, while the alternate model (Figure 13b) was developed without these con- straints. The two models are in general agreement except for layers deeper than about 13 km (Figure 13c). The travel time advance on the volcano is modeled with a high-velocity body or a local upwelling of the 5.6 km/s layer. The exact structure and velocity of this body is not well constrained without more shots points, but additional data collected in 1982 should help to resolve this structure more clearly. The models disagree most strongly on the interpretation of the high-amplitude sec- ondary arrival seen 60 km from shot point 12 (Figures 12b and 12d). The preferred model introduces a local low-velocity
7370 ZUCCA ET AL.' CRUSTAL STRUCTURE OF NE CALIFORNIA
KLAMATH MTS
CASCADE RANGE
NW
A SP1
•o
Yreka
Yellow Butte
Shasta • Mt Valley $P5 Shasta
6.1 4.0
6.3 6.3
SP8
KLAMATH CASCADE MTS RANGE
:5.45
5.1
6.3
6.5 6.5
(7.0) ( I I ' I
0 4o 8o DISTANCE (KM)
120
SE
i i I i L I I I i i , I i
• 0 0 ( 0 - L I0 I0 I{ I0
Mt
p , , , , , .... 8 8 8 ;, 6 8
VELOCITY (KM/SEC)
Fig. 11. (a) Velocity model for Shasta line. (b) Velocity-depth sections. For detail, see caption for Figure 6.
zone and explains the arrival as a reflection from a 7.02 km/s layer below the zone, whereas the alternate model explains the arrival as a reflection from a relatively shallow (20 km) mantle. The fact that this arrival is not seen from shot point 6 requires that the reflecting layer deepen abruptly to the north in both models. The fact that mantle depths of more than 40 km are observed in the south part of the Oregon Cascade Range [Leaver et al., !984] makes the shallow mantle in the alternate model quite anomalous. A detailed discussion of the alternate model, including gravity modeling, is given by Catchings [1983].
East- West Line
The east-west line is 260 km long, connects shot points 2, 4, 5, 14, 1! and 13, and crosses varied terrane and geology (Figure 1). Shot point 2 is in the Klamath Mountains prov- ince, and shot point 4 is near the boundary of the Klamath Mountains and Cascade Range provinces. Shot point 5 is on a horst and inlier of Klamath Mountains rocks exposed on the north flank of Mount Shasta. Shot point 14 is on top of Medicine Lake volcano. Shot point !! is on the Modoc Pla- teau, and shot point 13 is in Surprise Valley in the Basin and Range province. Altitudes range from 900 m in Shasta Valley to 2 !00 m on Medicine Lake volcano. The data and model for this line are discussed below in western and eastern segments, divided at Medicine Lake volcano.
Western segment. The data from shot point 2 (Figure 14a) are similar to the data from the other shot points in the Kla- math Mountains (Figures 2, 3, and 4) in that they are characterized by travel time branches that die out and are
replaced by delayed but faster branches. Beyond shot point 4, the second such branch (6.3-6.5 km/s) becomes quite bumpy. This branch dies at 70-80 km range and is replaced by a branch (7.0? km/s) delayed by 0.4-0.5 s beginning at about 65 km. The data from shot point 4 (Figure !4c) describe an asym- metric travel time curve. The curve to the west is similar to other Klamath Mountains data. To the east the crossover to a basement branch (6.3 km/s) is twice as far out (15 km) as the corresponding crossover to the west. Like the data from shot point 2, the basement branch is quite bumpy east of shot point 4. At ranges greater than 70 km there is suggestion of (reflect- ed) energy from a deeper (7.0? km/s) layer. The data from shot point 14 (Figure 14e) define a bumpy travel time branch (6.3 km/s) beyond 20 km. Advances and delays are observed in the same locations as for shot points 2 and 4. A strong secondary arrival of approximately 70-km range moves markedly for- ward in time.
Our velocity model for the western segment of the east-west line (Figure 15) represents an amalgamation of the velocity models calculated for the Klamath, Shasta, and Medicine Lake lines (intersecting the east-west line at shot points 2, 5, and 9, respectively). At shot point 2 the layered structure of the Klamath Mountains is seen with its pairing of positive and negative velocity gradients. At shot point 4 the Klamath Mountains structure terminates; eastward into the Shasta Valley there is a lateral change to lower velocities at all depths above 14 km. Structure between the Shasta Valley and Medi- cine Lake volcano is characterized by several horsts and gra- bens in the upper layers that give rise to the bumpy travel time curves in this region. Yellow Butte appears to be under-

ZUCCA ET AL.: CRUSTAL STRUCTURE OF NE CALIFORNIA 7371
[Dorris] Medicine Lake NW
SP6 SP9
Ill TRUE AMPLITUDE ;,SP6
• .
0 ,
o 40
Adin
I SP12 .
120
SE
c
-l- F- 16 Q_
• 24
i
120 80 ß
4O
6. T
I24
• I I
0 0
I 8'0 40 0 E v
• 24 • 24
32 • : : L : : 52
DIS TANCF
Fig. 12. Data from Medicine Lake line and models. (a) True relative amplitude record section for shot point 6 with preferred model travel time curves. Distance scaling exponent is 2.0. (b) True relative amplitude record section for shot point 12 with preferred model travel time curves. Distance scaling exponent is 2.0. (c) Preferred model (same as Figure 13a with no vertical exaggeration) showing ray paths from shot point 12. (d) Trace-normalized record section for shot point 12 with alternate model travel time curves. (e) Alternate model (same as Figure 13b with no vertical exaggeration) showing ray paths from shot point 12. For more detail, see caption for Figure 2.
lain by a horst with a relief of 1-2 km in east-west as well as northwest-southeast directions (see also Figure 11a). At Medi- cine Lake volcano a horstlike or pluglike structure is required, similar to that in the model for the Medicine Lake line (Fig-
ures 13a and 13b). A 7.0? km/s layer is modeled below a slight velocity inversion at a depth of 14 km. The velocity is not well determined, since the only clear phase from this layer is a secondary arrival (reflection?).

7372 ZUCCA ET AL.' CRUSTAL STRUCTURE OF NE CALIFORNIA
I
iaJ
NW
A
PLATEAU
•(Dorris] SP6
1.8---
0-
_ •
I0-
0
1.6-?
B -
I0-
30-
0
c
3.5
5.6
--MODOC-]•<•--CASCADE RANGE--t><::•--- MODOC PLATEAU Medicine Lake
SP9
6.1
6.4
6.1
(7.0)
f (7.01 /
(7.0)*
40 8o
56 63
66 67
Adin
I sPI2 SE ./2.4 •' :5.5 _
" 4.,3__
6.2
6.4
--
(7. o) i
120
46 48 ,
61 6.2
(7.9)
//(7.7) i i i
4O
D ISTANC E
67 6,7
(7.9) (7.9)
i i i i i
80 120 (KM)
o
-r
•- 20 L•
SPS 2 4
,
L
SP9 80 km
2 ' •' g' 8 •' '•' • '8 VELOCITY (KM/SEC)
o
io
20
3o
SPI2
2 4 6 8
Fig. 13. Velocity models for Medicine Lake line. (a) Preferred model. (b) Alternate model. (c) Velocity-depth sections. For detail, see caption for Figure 6.
A problem in the interpretation of the western segment of the east-west line is the fact that the shot points are not colin- ear. Distance on the model (Figure 15a) is an average between distance measured along straight-line segments connecting shot points and distance measured along a "least squares" line drawn through the shot points. Therefore distances on the model are a bit short compared to distances on record sec- tions. The maximum discrepancy is about 4 km and is seen in distances between shot points 2 and 4. The effect of this non- linearity is to shift features predicted by the model compared to features on the record sections. For example, the 7.0? km/s branch in the record section from shot point 2 (Figure 14a) is a bit early compared to the data between 90 and 100 km, but if the model were "stretched" to match the record section, this
branch would be shifted to the right a couple of kilometers and the match would be somewhat better. Perhaps a more serious problem with the model is that it is two-dimensional, whereas the record sections clearly sample a three-dimensional region.
The fact that the predicted 7.0? km/s refraction is early for both shot points 2 and 14 leads us to query the velocity in this layer. The sharp step downward in this layer under the Cas- cade Range is required by data in the eastern segment of the east-west line, where a 7.0 km/s layer is clearly seen at about 25-km depth. The step is also supported by gravity modeling (see below).
Eastern segment. Major features in the record section from shot point 13 (Figure 16a) include (1) a 0.4-s travel time ad-

WEST EAST
Cec•lv•lle Callahan Yellow Butte Medicine Lake
_ _
::30 i • I I I i I I I i I I I ::30
V ß V. t •. < •
NORMALIZED SP4
I -6O
3O
E 3--- ß ß
NORMALIZED SP14 •
o •
8 6' r..½ I
y 6.3
o 14-O -IœO -IOO -80 -60 -4-0 -2_.0
F o '
•o
uJ 2_.0 •-
SO L
DISTANCE (KM)
ß 3
2
I
0
-I 0
I0
20
30
Fig. 14. Data from western segment of east-west line and model. (a) Trace-normalized record section for shot point 2 with model travel time curves. (b) Model (same as Figure 15a with no vertical exaggeration) showing ray paths from shot point 2. (c) Trace-normalized record section from shot point 4 with model travel time curves. (d) Model (same as Figure 14b) showing ray paths from shot point 4. (e) Trace-normalized record section for shot point 14 with model travel time curves. (f) Model (same as Figure 14b) showing ray paths from shot point 14. For more detail, see caption for Figure 2.

7374 ZUCCA ET AL.' CRUSTAL STRUCTURE OF NE CALIFORNIA
KLAMATH MTS• CASCADE RANGE
West
A
Cecilville
Collohon
SP2
Yellow Butte
S p4 Svhaa s ta • Iley SP5 TFZ
Medicine Loke
• East SP14
6.5
6.7
7.0?
6.3
....
::i!.: 6.4
7.09
6.3
6.5
.
6.4
7. O'X'
32 • , • • o 40
_
I0-
20-
30- SP2
I
;• 4 6 8
i I i i
DISTANCE (KM)
i I I I
2 4 6 8
VELOCITY
! Near oJ TFZ
i i
2 4 6
(KM/SEC)
Fig. 15. (a) Velocity model for western segment of east-west line. (b) Velocity-depth sections. For detail, see caption for Figure 6.
vance just beyond the basement crossover, where the line crosses the Surprise Valley fault, (2) a bumpy basement branch that includes travel time delays near Alturas and shot point 11 and a travel time advance near shot point 14, (3) strong sec- ondary arrivals beginning at about 105 km and moving for- ward to become first arrivals at ranges beyond 140 km, and (4) other late phases (labeled 1, 2, and 3 in Figure 16a) that seem to parallel first or second arrivals with about 0.6-s delay. The record section for shot point 11 (Figure 16c) is similar to the shot point 11 record section for the Modoc line (Figure 8c) in that it shows near-source dying branches (5.5 km/s) replaced by delayed basement branches at distances less than 10 km. The basement branches from both shot points 11 and 14 show advances and delays in the same locations as from shot point 13. Average apparent velocities for all three shot points are higher toward the east than toward the west.
Our model for this part of the east-west line (Figure 17) incorporates models for intersecting lines at shot points 9 and 11 (Figures 9a and 13a; shot point 9 is 3 km west of shot point 14). The model resembles most closely the model for the Modoc line (Figure 9a) with the basement surface and inter-
faces bounding the regional low-velocity zone (6.0 km/s) dip- ping 3 ø west on average. The near-surface layers are characterized by very low velocities in Surprise Valley (1.8-3.0 km/s) and a local low-velocity zone (2.5 km/s) at shot point 11, as on the Modoc line. The basement surface is bumpy, with a trough between shot points 11 and 14 and one under Alturas; basement velocity is 6.2 km/s. The presence of a regional low- velocity zone (6.0 km/s) and an intermediate-velocity layer below it (6.4 km/s) is consistent with the data. The eastward dip of the 6.2, 6.0, and 6.4 km/s layers changes between shot points 11 and 14, and velocity boundaries rise abruptly under Medicine Lake volcano to produce the travel time advance seen there. A 7.0 km/s layer is clearly observed from shot point 13 (Figure 16a) at about 25-km depth, but without a clear reversal from shot point 14 (Figure 16e) its velocity and attitude remain somewhat uncertain. Late phases labeled 2 and 3 (Figure 16a) may indicate mantle at depths of 36 or 45 km, respectively, but we are uncertain whether to interpret these phases as primary or multiple arrivals. A 45-km mantle depth would agree with the results of Leaver et al. [1984] for the Oregon Cascades, about 200 km north of our study area.

ZUCCA ET AL.' CRUSTAL STRUCTURE OF NE CALIFORNIA 7375
Medicine Lake
ST Yellow Butte • SPI4 A I li v
{ NORMALIZED SP13 ••{ •g 3
2
0 --
-200
e o
2o •- 30
surprise Valley -I Cedarville , SVF -] •
LF Warner•f •[ Alturas Mtns E A S T
SP11 / / SPI
I llll tl 1111tl}•5 If! I(111111ll IIIIIII III II11• I I I • I I • I
-180 -160 -140 -120 -I00 -80 -60 -40 -20 0 i , i i , V i i i i IVI , i i i , i V
: ................... -'• ................... .:•:x ................... • ':•' ' _'•=•--•L•--%' .- • 0
IO
30
D 60 -4b 2'0 ' ' - - 0 20 40 60 80
, , , , , •, , , , , • , , , , , _, , v,
D IS TANCE (KM)
Fig. 16. Data from the eastern segment of the east-west line. (a) Trace-normalized record section for shot point 13 with model travel time curves. For discussion of dashed curves 1, 2, and 3, see text. (b) Model (same as Figure 17a with no vertical exaggeration) showing ray paths from shot point 13. (c) Trace-normalized record section for shot point 11 with model travel time curves. Dashed curves reproduced from Figure 8c. Dots along branches labeled 5.5 km/s indicate arrivals difficult to see on this plot. (d) Model (same as Figure 16b) showing ray paths from shot point 11;no rays shown for dashed phases in Figure 16c. (e) Trace-normalized record section for shot point 14 with model travel time curves. (f) Model (same as Figure 16b) showing ray paths from shot point 14. For more detail, see caption for Figure 2.

7376 ZUCCA ET AL.; CRUSTAL STRUCTURE OF NE CALIFORNIA
BASIN AND RANGE
--CASCADE RANGE •> • - MODOC PLATEAU• West Eost
,-,,,,, Medicine Lake LF Ced(]rville,SVF-1 Surprise i7•' • ; Warner Mtns- 1 • ;Valley
SP5 T,F SP14 SPll Altu. ros SP15
•, I•/• •. O) I • I 0 - 6.5 :.'.:?..':..:.. ' ' •
/::':" 6.4 I-- • '& 6.4 6.4
bJ ' •/J!:::
:50- 7.0 ZO 7.0 _ • I I I
I00 150 200 250
DISTANCE (KM)
30 ,S 30- 2 4 6 8
i i i
0-
15-
$o-
sP, II, 2 4 6 8
VELOCITY (KM/SEC)
ß I i
sP 51 I I -
2 4 6 8
Fig. 17. (a) Velocity model for eastern segment of the east-west line. (b) Velocity-depth sections. For detail, see caption for Figure 6.
5. DENSITY MODEL
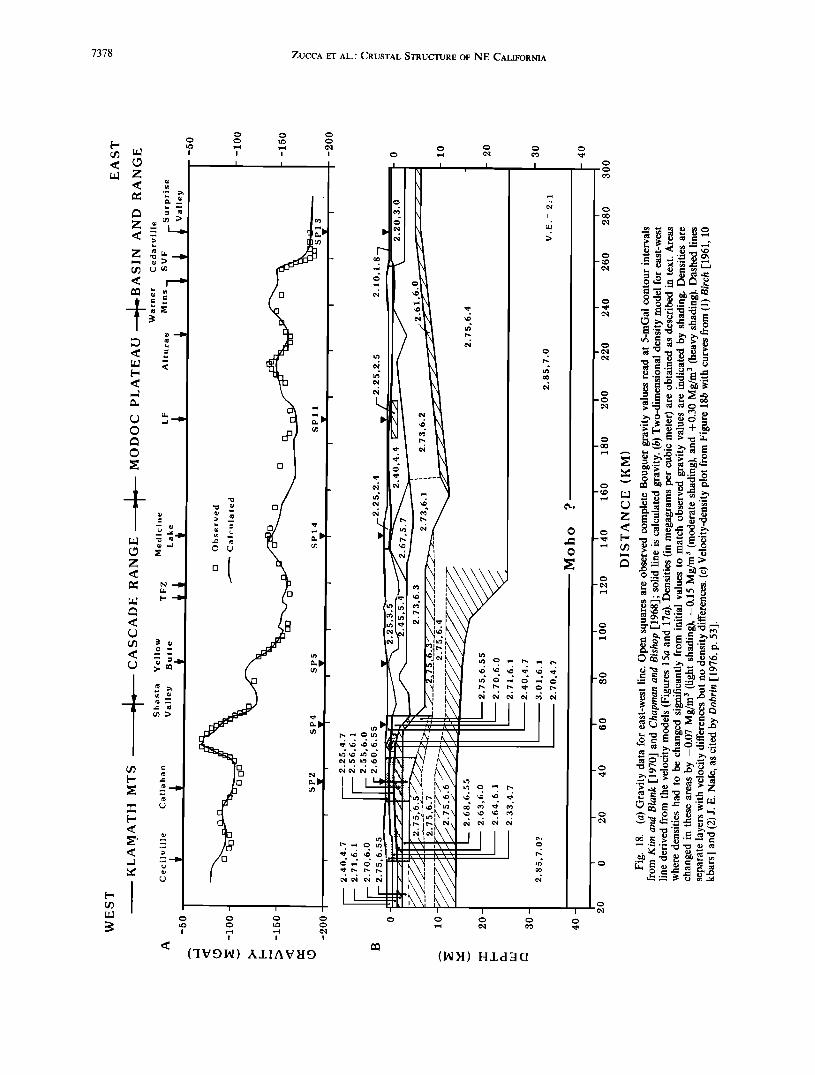
We converted the east-west velocity model to a density model to allow comparison with the observed Bouguer gravity (Figure 18). The velocity-density relationships of Birch [1961] and J. E. Nafe as cited by Dobrin [1976, p. 53] were used approximately for much of the upper crust and that of Birch [1961] for all of the lower crust (Figure 18c). Densities cited by LaFehr [1965] were used for the "basement" layer (second layer down) near Mount Shasta (2.45 Mg/m 3) and in the Kla- math Mountains (2.71 Mg/m3). The complete Bouguer gravity values are from Kim and Blank [1970] and Chapman and Bishop [1968] and are calculated using a reduction density of 2.67 Mg/m 3. A two-dimensional gravity calculation along the east-west line is a reasonable approximation to much of the geologic structure because most features, including province boundaries, geologic contacts, and faults, have a nearly north- south strike (Figure 1). Some features such as Medicine Lake volcano and plutons in the Klamath Mountains clearly are not well approximated by a two-dimensional calculation, and adjustments were made after the initial velocity-density assign- ments to improve the fit to the observed data (Figure 18b, shaded boxes). Finn and Williams [1982] discuss the gravity modeling of Medicine Lake volcano in detail.
Important features of the density model include (1) a slight- ly higher upper crustal density in the Klamath Mountains compared to regions to the east, (2) a fair correlation between upper crustal structural highs and lows and gravity highs and lows (e.g., Yellow Butte, Medicine Lake volcano, and flanking basins), (3) a 10-km step downward to the east in an intermediate-density layer (2.85 Mg/m3), and (4) a horizontal Moho.
6. DISCUSSION
Our experiment was laid out so that at least two lines, the Modoc line and the Klamath line, would lie within single geologic provinces and would hopefully lead to relatively straightforward interpretation. The velocity models for those two lines are indeed the simplest of the experiment, showing the least lateral velocity variation. In the following discussion we use surface geology, laboratory velocity data, independent modeling of aeromagnetic data, and comparisons with velocity-depth curves in other areas in our efforts to relate rock type to our velocity layers. An extended discussion of our geologic interpretation is given elsewhere [Fuis et al., 1986].
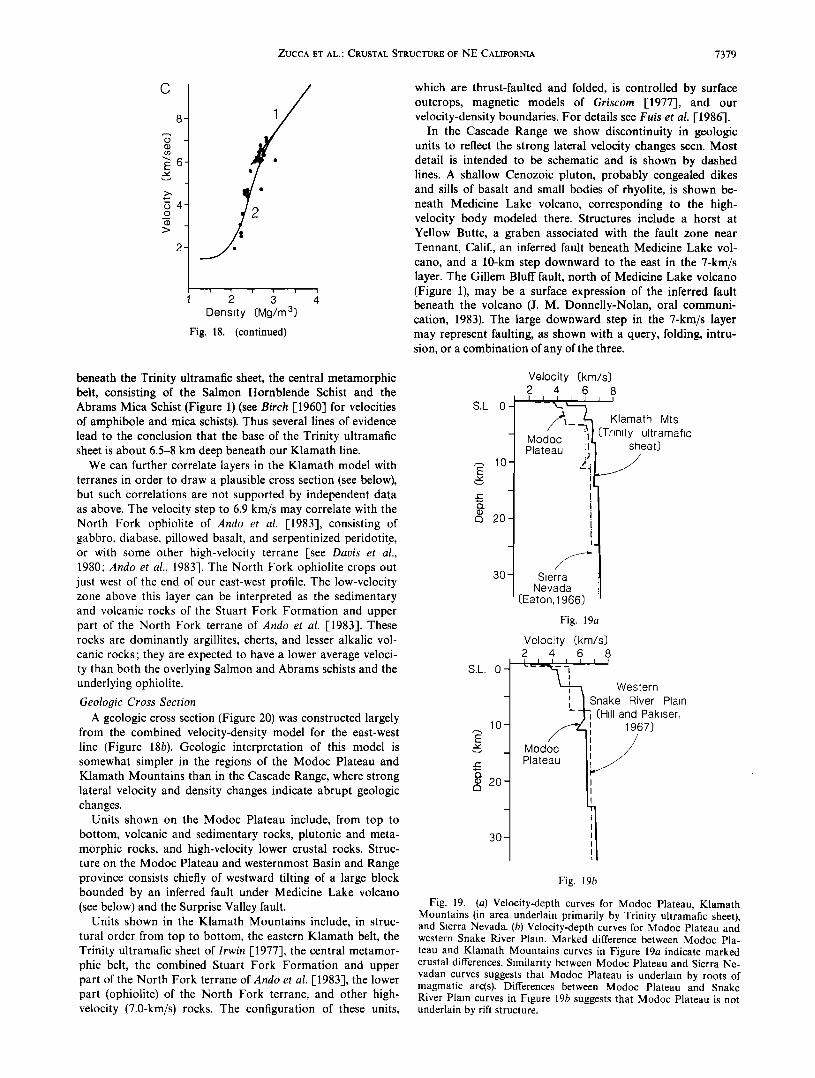
Characteristic velocity-depth curves for the Modoc and Klamath lines are reproduced on the same graph (Figure 19a)

ZUCCA ET AL.: CRUSTAL STRUCTURE OF NE CALIFORNIA 7377
for comparison. The curve for the Modoc Plateau line (at shot point 10) shows thick layering below the marked velocity step to basement (6.2 km/s) and a relatively slow increase of veloci- ty with depth. The Klamath curve is quite different. Higher velocities are seen at all depths from the surface downward. The intercalation of low-velocity zones gives this curve a dis- tinct layered appearance, which is generally consistent with the imbricate geologic structure in the Klamath Mountains. A velocity of 6.9 km/s is reached at a depth of only 14 km (the average velocity of this layer is 7.0 km/s; Figure 6a), compared to 7.0 km/s at 25-km depth on the Modoc curve. Thus these velocity-depth curves clearly indicate different types of crust beneath the Modoc Plateau and the Klamath Mountains.
Modoc Plateau
The layers above basement on the Modoc Plateau, with dominant velocities between 2 and 4.5 km/s, are probably mostly volcanic and sedimentary rocks of Cenozoic age, based on the deepest exposures, in the Warner Range [-see Duffield and Weldin, 1976]. However, older sedimentary and (or) vol- canic rocks, such as the Upper Cretaceous Hornbrook For- mation or the Jurassic to Ordovician rocks of the eastern
Klamath belt, can not be ruled out on the basis of velocity. Below the surficial layers the velocity-depth curve for the
Modoc Plateau lends itself to a relatively simple geologic in- terpretation by comparison to a curve for the Sierra Nevada [Eaton, 1966]. Eaton's curve (minus a surficial layer corre- sponding to weathered granitic rocks) is reproduced for com- parison with the Modoc curve (Figure 19a). The basement velocity of 6.0 km/s is close to our basement velocity of 6.2 km/s; the velocity step to 6.4 km/s occurs at a similar depth, 10 km; and a velocity step to 6.9 km/s at 27 km corresponds to our step to 7.0 km/s at 25 km. The only significant differ- ence is the lack of a low-velocity zone in the Sierra Nevadan curve above the velocity step to 6.4 km/s. Prodehl's [1979] reanalysis of the data from which Eaton derived his model does indeed indicate a low-velocity zone below 10-km depth extending about 100 km southeastward from Lake Shasta, beneath the Cascade Range province. The zone is not present in the Sierra Nevada near Mono Lake. Our model thus ap- pears consistent with Prodehl's results for the southeast Cas- cade Range.
Based on the similarity of the Modoc and Sierra Nevadan velocity-depth curves and also on the proximity of the Sierra Nevada province to our study area (60 km south of shot point 12), we theorize that the Modoc Plateau, beneath a volcanic and sedimentary cover, is underlain by rocks similar to the Sierra Nevada, namely rocks generated in the roots of a mag- matic arc environment. In the Sierra Nevada a basement ve-
locity of 6.0 km/s corresponds to granitic rocks, mostly grano- diorite, with pendants and (or) septa of metamorphic rocks. The somewhat higher basement velocity on the Modoc Pla- teau (6.2 km/s) may indicate a somewhat higher fraction of metamorphic rocks that, in the foothills of the Sierra Nevada, range in velocity from 6.0 to 6.3 km/s [Spieth et al., 1981]. Additional evidence favoring a granitic and metamorphic basement for the Modoc Plateau is the occurrence of granitic cobbles in the lowest sedimentary deposits exposed in the Warner Range [Duffield and Weldin, 1976]. Evidence contra- dicting this hypothesis and favoring a rift filled with new crust underlying the Modoc Plateau are the chemical and isotopic affinities of the basalts exposed; the basalts are primitive and
have been little contaminated by sialic crust [McKee et al., 1983].
The velocity step to 6.4 km/s at 10-km depth in both the Sierra Nevada and Modoc Plateau may represent a compo- sition or metamorphic facies change. Possible rocks include plutonic rocks of intermediate composition, such as tonalite or diorite, metamorphic rocks of amphibolite to granulite facies, or migmatites [see Smithson and Brown, 1977; Kay and Kay, 1980]. The velocity step to 7.0 km/s in both curves may be caused by a composition change to mafic plutonic rocks such as gabbro and anorthosite (see discussion by Hildreth [1981] of deep magmatic arc processes) or a metamorphic change to granulite facies.
The Modoc Plateau may be a composite of the roots of several magmatic arcs. The oldest magmatic arc(s) for which there is any evidence in this region persisted from the Silurian through the Middle Jurassic in an area east of the present Klamath Mountains [Irwin, 1966; Condie and Snansieng, 1971; Potter et al., 1977]. The eastern Klamath sedimentary and volcanic rocks were laid down in forearc basins. It is, of course, not known where rocks generated in this (these) arc(s) are to be found today, but the Modoc Plateau must be al- lowed as a possibility. Magmatism continued in the Late Ju- rassic and Early Cretaceous at the site of the present Klamath Mountains. In a number of episodes from Triassic to Late Cretaceous, magmatism occurred at the site of the present Sierra Nevada [Evernden and Kistler, 1970], and in the Late Cretaceous it also extended northeastward into Nevada and
Idaho [Smith et al., 1971]. During any of these periods, mag- matism may also have occurred in the Modoc Plateau. The only epochs for which there is clear evidence for magmatism in the Modoc Plateau are the Oligocene and Miocene (see section 2).
The Modoc Plateau is apparently not underlain, as pro- posed by Hamilton [1978] and Blake and dories [1977], by a rift structure, at least not north of Adin, California, where we have reversed seismic refraction coverage. For example, a velocity-depth curve for the western Snake River Plain, an inferred rift, shows a velocity step to 6.7 km/s at 7.5 km depth and velocities less than 6.0 km/s above this step [Hill and Pakiser, 1967] (Figure 19b). Curves for other rift areas show similar differences from the Modoc and Sierra Nevadan curves
[see Fuis et al., 1982; Braile et al., 1982].
Klamath Mountains
In the Klamath Mountains we are able to relate velocity- depth structure to geologic structure with the aid of indepen- dent modeling of aeromagnetic data. Griscom [1977] modeled aeromagnetic data from the vicinity of the Trinity ultramafic sheet of Irwin [1977]. He noted that the strongest anomalies correspond well with outcrops of the ultramafic sheet and the weakest anomalies appear to correspond to the ultramafic sheet projected eastward and northward beneath sedimentary and volcanic rocks of the eastern Klamath belt and the Cas-
cade Range (see Figure 1). The base of the magnetic body is calculated to be 6-8 km deep (referring to depth below sea level) over most of the outcrop area of the Trinity ultramafic sheet and over most of the area inferred to be underlain by the body. Along our Klamath line between shot points 2 and 3 the calculated base of the magnetic body is about 8 km deep. This depth corresponds (within about 1.5 km) to our velocity step to 6.7 km/s (see Figure 6). A velocity of 6.7 km/s is, in turn, a reasonable velocity for the body or rock that lies structurally
7378 ZUCCA ET AL.' CRUSTAL STRUCTURE OF NE CALIFORNIA
z _•
<.•
¸
¸
z
--
I i
("I ¾9 hi) ,,•,L I ̂ ¾ I•I 9
o ,.• o
I i I
(I• •I) H,Ld •I (I
_•o
-•o
ZUCCA ET AL.' CRUSTAL STRUCTURE OF NE CALIFORNIA 7379
c
_
_
Density (Mg/m 3}
Fig. 18. (continued)
beneath the Trinity ultramafic sheet, the central metamorphic belt, consisting of the Salmon Hornblende Schist and the Abrams Mica Schist (Figure 1) (see Birch [1960] for velocities of amphibole and mica schists). Thus several lines of evidence lead to the conclusion that the base of the Trinity ultramafic sheet is about 6.5-8 km deep beneath our Klamath line.
We can further correlate layers in the Klamath model with terranes in order to draw a plausible cross section (see below), but such correlations are not supported by independent data as above. The velocity step to 6.9 km/s may correlate with the North Fork ophiolite of Ando et al. [1983], consisting of gabbro, diabase, pillowed basalt, and serpentinized peridotit,e, or with some other high-velocity terrane [-see Davis et al., 1980; Ando et al., 1983]. The North Fork ophiolite crops out just west of the end of our east-west profile. The low-velocity zone above this layer can be interpreted as the sedimentary and volcanic rocks of the Stuart Fork Formation and upper part of the North Fork terrane of Ando et al. [-1983]. These rocks are dominantly argillites, cherts, and lesser alkalic vol- canic rocks; they are expected to have a lower average veloci- ty than both the overlying Salmon and Abrams schists and the underlying ophiolite.
Geologic Cross Section A geologic cross section (Figure 20) was constructed largely
from the combined velocity-density model for the east-west line (Figure 18b). Geologic interpretation of this model is somewhat simpler in the regions of the Modoc Plateau and Klamath Mountains than in the Cascade Range, where strong lateral velocity and density changes indicate abrupt geologic changes.
Units shown on the Modoc Plateau include, from top to bottom, volcanic and sedimentary rocks, plutonic and meta- morphic rocks, and high-velocity lower crustal rocks. Struc- ture on the Modoc Plateau and westernmost Basin and Range province consists chiefly of westward tilting of a large block bounded by an inferred fault under Medicine Lake volcano (see below) and the Surprise Valley fault.
Units shown in the Klamath Mountains include, in struc- tural order from top to bottom, the eastern Klamath belt, the Trinity ultramafic sheet of Irwin [1977], the central metamor- phic belt, the combined Stuart Fork Formation and upper part of the North Fork terrane of Ando et al. [1983], the lower part (ophiolite) of the North Fork terrane, and other high- velocity (7.0-kin/s) rocks. The configuration of these units,
which are thrust-faulted and folded, is controlled by surface outcrops, magnetic models of Griscom [1977], and our velocity-density boundaries. For details see Fuis et al. [1986].
In the Cascade Range we show discontinuity in geologic units to reflect the strong lateral velocity changes seen. Most detail is intended to be schematic and is shown by dashed lines. A shallow Cenozoic pluton, probably congealed dikes and sills of basalt and small bodies of rhyolite, is shown be- neath Medicine Lake volcano, corresponding to the high- velocity body modeled there. Structures include a horst at Yellow Butte, a graben associated with the fault zone near Tennant, Califi, an inferred fault beneath Medicine Lake vol- cano, and a 10-km step downward to the east in the 7-km/s layer. The Gillem Bluff fault, north of Medicine Lake volcano (Figure 1), may be a surface expression of the inferred fault beneath the volcano (J. M. Donnelly-Nolan, oral communi- cation, 1983). The large downward step in the 7-km/s layer may represent faulting, as shown with a query, folding, intru- sion, or a combination of any of the three.
S.L. 0-
10-
20-
30-
Velocity (km/s) 2 4 6 8 I ,._1 .xl I I I 1
•% Klamath Mts Modoc }l (Trinity ultramafic
i• sheet)
Plateau i• • Z' i I
i
i_
Sierra Nevada
(Eaton, 1966)
Fig. 19a
Velocity (km/s) 2 4 6 8
[ I I
• Western • •Snake River Plain --•q ((Hill and Pakiser,
••1 1967) Modoc t /
Plateau
10-
a) 20-
30-
Fig. 19b
Fig. 19. (a) Velocity-depth curves for Modoc Plateau, Klamath Mountains (in area underlain primarily by Trinity ultramafic sheet), and Sierra Nevada. (b) Velocity-depth curves for Modoc Plateau and western Snake River Plain. Marked difference between Modoc Pla- teau and Klamath Mountains curves in Figure 19a indicate marked crustal differences. Similarity between Modoc Plateau and Sierra Ne- vadan curves suggests that Modoc Plateau is underlain by roots of magmatic arc(s). Differences between Modoc Plateau and Snake River Plain curves in Figure 19b suggests that Modoc Plateau is not underlain by rift structure.

7380 ZUCCA ET AL..' CRUSTAL STRUCTURE OF NE CALIFORNIA
! I I I I
z <
t
ii ii x\ #
(m•) qldaG
6M 0 0 uJ 0 --
CD • T
• 0
o 8•o 5o • -- "•:3- I--Z CM -iD <D z
_o,,, _o,,, TO LO
¸._, ._,
o --0
O4
0 --0
_0
_0
--0

ZUCCA ET AL.: CRUSTAL STRUCTURE OF NE CALIFORNIA 7381
A few features in the velocity-density model (Figure 18b) have no clear geologic interpretation in the cross section (Figure 20), including the internal low-velocity zone and re- flector in the Trinity ultramafic sheet at 1-2 km depth and the regional low-velocity zone and reflector in the Modoc Plateau at 5-11 km depth. (In addition, the reflector southeast of Me- dicine Lake volcano in the preferred model for the Medicine Lake line (Figure 13a) remains a mystery). For a discussion of these and other features see Fuis et al. [1986].
7. CONCLUSION
Our seismic-refraction survey indicates the existence of at least two different types of crust in northeastern California: (1) An igneous and metamorphic crust similar to that of the Sierra Nevada lies beneath the volcanic and sedimentary cover of the Modoc Plateau. This crust may represent the superposition or accretion of the deeper parts of a number of magmatic arcs in this region, possibly as old as Paleozoic. (2) An imbricated stack of oceanic rock layers underlies the Kla- math Mountains. This stack represents the accretion of nu- merous terranes to the North American Continent. The com-
plex suture region between the Modoc and Klamath crusts occurs beneath the Cascade Range. Apparently this suture region is an avenue for magmas of the most recent magmatic arc in the region, the Cascade Range.
Acknowledgments. This report is the culmination of the efforts of a large number of people besides the authors. E. E. Criley coordinated all field operations. J. M. Bonomolo, S. K. Gallanthine, K. E. Har- rington, L. R. Hoffman, J. N. Roloif, V. D. Sutton, and A. W. Walter deployed the instruments, and R. M. Kaderabek and Robert Mc- Clearn maintained them in the field. C. J. Criley, Bruce Echols, R. P. Myer, Jr., and G. A. Molina assisted with drilling, loading shot holes, and shooting. L. M. Baker contributed computer expertise. C. A. Finn provided a starting model for the east-west line and helped in the field. Sheryl Johnson, Donna Barton, Robin Rebello, and Marty San- ders provided assistance in the office, and S. D. Cranswick and R. R. Eis drafted the illustrations. A number of persons with the U.S. Forest Service expedited the permitting process, including Gene Grossman, Tom Farmer, and John Nelson. We are also indebted to numerous land owners and managers who permitted us access to their land. D. P. Hill provided valuable advice and encouragement throughout the project. The geophysical interpretation has benefited from reviews by P. A. Spudich and D. A. Stauber. The geologic interpretation of our results was improved by a field trip conducted for us by R. L. Christiansen and by discussions at a workshop in December 1982 attended by J.P. Albers, M. C. Blake, Jr., R. L. Christiansen, Peter Coney, J. M. Donnelly-Nolan, R. J. Blakely, R. C. Jachens, D. L. Jones, N.J. Silberling, and R. C. Speed. In addition, discussions with W. P. Irwin and Andrew Griscom were crucial in
developing our geologic interpretation.
REFERENCES
Ando, C. J., W. P. Irwin, D. L. Jones, and J. B. Saleeby, The ophiolitic North Fork terrane in the Salmon River region, cental Klamath Mountains, California, Geol. Soc. Am. Bull., 94, 236-252, 1983.
Barnes, C. G., R. C. Jachens, and M. Donato, Evidence for basal detachment of the western Paleozoic and Triassic belt, northern Klamath Mountains, California, Geol. Soc. Am. Abstr. Programs, 14, 147, 1982.
Birch, F., The velocity of compressional waves in rocks to 10 kilobars, 1, d. Geophys. Res., 65, 1083-1102, 1960.
Birch, F., The velocity of compressional waves in rocks to 10 kilobars, 2, d. Geophys. Res., 66, 2199-2224, 1961.
Blake, M. C., and D. L. Jones, Plate tectonic history of the Yolla Bolly junction, northern California, paper presented at the 73rd Annual Meeting, Cordilleran Sect., Geol. Soc. of Am., Los Angeles, Calif., 1977.
Braile, L. W., R. B. Smith, J. Ansorge, M. R. Baker, M. A. Spadin, C. Prodehl, M. M. Schilly, J. H. Healy, S. Mueller, and K. H. Olsen, The Yellowstone-Snake River Plain seismic profiling experiment:
Crustal structure of the eastern Snake River Plain, J. Geophys. Res., 87, 2597-2609, 1982.
Catchings, R. D., Crustal structure from seismic refraction in the Medicine Lake area of the Cascade Range and Modoc Plateau, northern California, M.S. thesis, 97 pp., Univ. of Wis.-Madison, Madison, 1983.
0•erven•,, V., I. A. Molotkov, and I. P•en•ik, Ray Method in Seismol- ogy, 213 pp., Karlova University, Prague, 1977.
Chapman, R. H., and C. C. Bishop, Bouguer gravity map of Califor- nia, Alturas sheet, scale 1:250,000, Calif. Div. of Mines and Geol., San Francisco, 1968.
Christiansen, R L., Volcanic hazard potential in the California Cas- cades, in Status of Volcanic Prediction and Emergency Response Capabilities in Volcanic Hazard Zones of California, Spec. Publ. 63, edited by R. C. Martin and J. F. Davis, pp. 41-59, California Divi- sion of Mines and Geology, San Francisco, 1982.
Condie, K. C., and S. Snansieng, Petrology and geochemistry of the Duzel (Ordovician) and Gazelle (Silurian) Formation, northern California, J. Sediment. Petrol., 41, 741-751, 1971.
Davis, G. A., and P. W. Lipman, Revised structural sequence of pre- Cretaceous metamorphic rocks in the southern Klamath Moun- tains, California, Geol. Soc. Am. Bull., 73, 1547-1552, 1962.
Davis, G. A., M. J. Holdaway, P. W. Lipman, and W. D. Romey, Structure, metamorphism, and plutonism in the south-central Kla- math Mountains, California, Geol. Soc. Am. Bull., 76, 933-966, 1965.
Davis, G. A., C. J. Ando, P. H. Cashman, and L. Goulland, Geologic cross section of the central Klamath Mountains, California: Sum- mary, part 1, Geol. Soc Am. Bull., 91, 139-142, 1980.
Dobrin, M. B., Introduction to Geophysical Propecting, 3rd ed., 630 pp., Mcgraw-Hill, New York, 1976.
Donnelly-Nolan, J. M., Two ash-flow tuffs and the stratigraphy of Medicine Lake volcano, northern California Cascades, Geol. $oc. Am. Abstr. Programs, 15, 330, 1983.
Duffield, W. A., and R. D. Weldin, Mineral resources of the South Warner Wilderness, Modoc County, California, U.S. Geol. Surv. Bull., 1385-D, 31 pp., 1976.
Eaton, J.P., Crustal structure in northern and central California from seismic evidence, Geology of Northern California, edited by E. 1t. Bailey, Bull. Cali/i Dir. Mines Geol., 190• 419-426, 1966.
Evans, J. R., Compressional-wave velocity stucture of the Medicine Lake volcano and vicinity from teleseismic relative travel-time re- siduals, paper presented at the 52nd Annual International Meeting, Soc. of Explor. Geophys., Dallas, Tex., 1982.
Evernden, J. F, and R. W. Kistler, Chronology of emplacement of Mesozoic batholithic complexes in California and western Nevada, U.S. Geol. Surv. ProWl Pap., 623, 67 pp., 1970.
Finn, C., and D. L. Williams, Gravity evidence for a shallow intrusion under the Medicine Lake volcano, California: Preliminary results, Geology, 10, 503-507, 1982.
Fuis, G. S., W. D. Mooney, J. H. Healy, G. A. McMechan, and W. J. Lutter, Crustal structure of the Imperial Valley region, The Im- perial Valley, California, Earthquake of October 15, 1979, U.S. Geol. Surt,. Prof Pap., 1254, 25-49, 1982.
Fuis, G. S., J. J. Zucca, W. D. Mooney, and B. Milkereit, A geologic interpretation of seismic-refraction results in northeastern Califor- nia, Geol. $oc. Am. Bull., in press, 1986.
Griscom, A., Aeromagnetic and gravity interpretation of the Trinity ophiolite complex, northern California, Geol. Soc. Am. Abstr. Pro- grams, 9, 426•27, 1977.
Hamilton, W., Mesozoic tectonics of the western United States, in Mesozoic Paleogeography of the Western United States, Pac. Coast Paleo,qeogr. Symp. 2, edited by D. G. Howell and K. McDougall, pp. 33-70, Society of Economic Paleontologists and Mineralogists, Pacific Coast Section, Bakersfield, Calif., 1978.
Healy, J. H., W. D. Mooney, H. R. Blank, M. E. Gettings, W. M. Kohler• R. Lamson, and L. E. Leone, Saudi Arabian seismic deep- refraction profile, final project report, Open File Rep. 02-37, 429 pp., U.S. Geol. Surv. Saudi Arabia Mission, Jeddah, 1982.
Hildreth, W., Gradients in silicic magma chambers: Implications for lithospheric magmatism, d. Geophys. Res., 86, 10,153-10,192, 1981.
Hill, D. P., and L. C. Pakiser, Seismic refraction study of crustal structure between the Nevada Test Site and Boise, Idaho, Geol. Soc. Am. Bull., 78, 685-704, 1967.
Hotz, P. E., Plutonic rocks of the Klamath Mountains, California and Oregon, U.S. Geol. Surt,. Prof Pap. 684-B, 20 pp., 1971.

7382 ZUCCA ET AL.: CRUSTAL STRUCTURE OF NE CALIFORNIA
Hotz, P. E., Geology of the Yreka Quadrangle, Siskiyou County Cali- fornia, U.S. Geol. Surv. Bull., 1430, 72 pp., 1977.
Irwin, W. P., Geology of the Klamath Mountains province, Geology of Northern California, edited by E. H. Bailey, Bull. Calif. Div. Mines Geol., 190, 19-38, 1966.
Irwin, W. P., Terranes of the western Paleozoic and Triassic belt in the southern Klamath Mountains, California, U.S. Geol. Surv. Prof. Pap., 800-C, C103-C111, 1972.
Irwin, W. P., Review of Paleozoic rocks of the Klamath Mountains in Paleozoic Paleogeography of the Western United States, Pac. Coast Paleogeogr. Syrup. 1, edited by J. H. Stewart, C. H. Stevens, and A. E. Fritsche, pp. 441-454, Society of Economic Paleontologists and Mineralogists, Pacific Coast Section, Bakersfield, Calif., 1977.
Irwin, W. P., Tectonic accretion of the Klamath Mountains, in The Geotectonic Development of California, Rubey Volume 1, edited by W. G. Ernst, pp. 30-49, Prentice-Hall, Englewood Cliffs, N.J., 1981.
Jennings, C. W., Geologic map of California, scale 1:750,000, Geol. Data Map, 2, Calif. Div. of Mines and Geol., San Francisco, 1977.
Kay, R. W., and S. M. Kay, Chemistry of the lower crust: Inferences from magmas and xenoliths, in Continental Tectonics, pp. 139-150, National Academy of Sciences, Washington, D.C., 1980.
Kim, C. K., and H. R. Blank, Bouguer gravity map of California, Weed sheet, 1:250,000, Calif. Div. of Mines and Geol., San Fran- cisco, 1970.
LaFehr, T. R., Gravity, isostasy, and crustal structure in the southern Cascade Range, d. Geophys. Res., 70, 5581-5597, 1965.
LaFehr, T. R., Gravity in the eastern Klamath Mountains, California, Geol. Soc. Am. Bull., 77, 1177-1190, 1966.
Lanphere, M. A., W. P. Irwin, and P. E. Hotz, Isotopic age of the Nevadan orogeny and older plutonic and metamorphic events in the Klamath Mountains, California, Geol. Soc. Am. Bull., 79, 1027- 1052, 1968.
Leaver, D. S., W. D. Mooney, and W. M. Kohler, A refraction study of the Oregon Cascades, d. Geophys. Res., 89, 3121-3134, 1984.
Macdonald, G. A. Geology of the Cascade Range and Modoc Pla- teau, Geology of Northern California, edited by E. H. Bailey, Bull. Calif. Div. Mines Geol., 190, 65-96, 1966.
Mattinson, J. M., and C. A. Hopson, Paleozoic ophiolitic complexes in Washington and northern California, Year Book Carnegie Inst. Washington, 71, 578-583, 1972.
McKee, E. H., W. A. Duffield, and R. F. Stern, Late Miocene and early Pliocene basaltic rocks and their implications for crustal structure, northeastern California and south-central Oregon, Geol. Soc. Am. Bull., 94, 292-304, 1983.
McMechan, G. A., and W. D. Mooney, Asymptotic ray theory and synthetic seismograms for laterally varying structures: Theory and application to the Imperial Valley, California, Bull. Seismol. Soc. Am., 70, 2021-2035, 1980.
Pakiser, L. C., Gravity, volcanism, and crustal structure in the south Cascade Range, California, Geol. Soc. Am. Bull., 75, 611-620, 1964.
Peck, D. L., A. B. Griggs, H. G. Schlicker, F. G. Wells, and H. M.
Dole, Geology of the central and northern parts of the western Cascade Range in Oregon, U.S. Geol. Suv. Prof. Pap., 449, 56 pp., 1964.
Potter, A. W., P. E. Hotz, and D. M. Rohr, Stratigraphy and inferred tectonic framework of lower Paleozoic rocks in the eastern Kla-
math Mountains, northern California, in Paleozoic Paleogeography of the Western United States, Pac. Coast Paleogeogr. Syrup. 1, edited by J. H. Stewart, C. H. Stevens, and A. E. Fritsche, pp. 421-440, Society of Economic Paleontologists and Mineralogists, Pacific Coast Section, Bakersfield, Calif., 1977.
Prodehl, C., Crustal Structure of the western United States, U.S. Geol. Surv. Prof Pap., 1034, 74 pp., 1979.
Roller, J. C., and J. F. Gibbs, Chemical explosions detonated by the U.S. Geological Survey from July 1961 to July 1864, CS [Crustal Stud.] Tech. Lett. 24, 13 pp., U.S. Geol. Surv., Denver, Colo., 1964.
Roller, J. C., W. H. Jackson, J. F. Cooper, and B. A. Martina, Crustal structure in the western United States: Study of seismic propaga- tion paths and regional travel times in the California-Nevada region, CS [Crustal Stud.] Tech. Lett. 9, 57 pp., U.S. Geol. Surv., Denver, Colo., 1963.
Smith, J. G, E. H. McKee, D. B. Tatlock, and R. F. Marvin, Mesozoic granitic rocks in northwestern Nevada--A link between the Sierra Nevada and Idaho batholiths, Geol. Soc. Am. Bull., 82, 2933-2944, 1971.
Smithson, S. B., and S. K. Brown, A model for lower continental crust, Earth Planet. Sci. Lett., 35, 135-144, 1977.
Spieth, M. A., D. P. Hill, and R. J. Geller, Crustal structure in the northwestern foothills of the Sierra Nevada from seismic refraction
experiments, Bull. Seismol. Soc. Am., 71, 1075-1087, 1981. Stanley, W. D., A regional magnetotelluric survey of the Cascade
Mountains region, U.S. Geol. Surv. Open File Rep., 82-126, 198 pp., 1982.
Stauber, D. A., and P. A. Berge, Comparison of P-velocity structures of Mt. Shasta, California, and Newberry volcano, Oregon (ab- stract), Eos Trans. AGU, 66, 25, 1985.
Williams, H., Geology of the Macdoel quadrangle [California], Bull. Calif. Div. Mines and Geol., 151, 7-60, 1949.
R. D. Catchings, Department of Geophysics, Stanford University, Stanford, CA 94305.
G. S. Fuis and Walter D. Mooney, U.S. Geological Survey, 345 Middlefield Road, MS/977, Menlo Park, CA 94205.
B. Milkereit, Earth Physics Branch, Energy, Mines, and Resources, 1 Observatory Crescent, Ottawa, Ontario, Canada K18 0Y3.
J. J. Zucca, Lawrence Livermore National Laboratory, L-205, P. O. Box 808, Livermore, CA 94550.
(Received July 11, 1985; revised February 18, 1986; accepted March 6, 1986.)
Copyright © 2022 FDOKUMEN