symmetrical and asymmetrical scaffolding in english reading ...

Empirical synthesis of time-asymmetrical Green
functions from the correlation of coda waves
Anne Paul, Michel Campillo,1 Ludovic Margerin, and Eric LaroseLaboratoire de Geophysique Interne et Tectonophysique, Observatoire de Grenoble, Universite Joseph Fourier and CNRS,Grenoble, France
Arnaud DerodeLaboratoire Ondes et Acoustique, Universite Paris 7 and CNRS, Paris, France
Received 4 November 2004; revised 21 March 2005; accepted 13 April 2005; published 5 August 2005.
[1] We demonstrate the existence of long-range field correlations in the seismic coda ofregional records in Alaska. The cross correlations between the different components ofcoda records at two points are measured for a set of distant earthquakes. Remarkably,while individual correlations have a random character, the correlations averaged oversource and time exhibit deterministic arrivals that obey the same symmetry rules as theGreen tensor between the two points. In addition, the arrival times of these waves coincidewith propagating surface waves between the two stations. Thus we propose to identify theaveraged correlation signals with the surface wave part of the Green tensor. We observethe causal and anticausal parts of the Green function. However, we find experimentallythat amplitudes at positive and negative times are not equal. We explain this observationby the long-lasting anisotropy of the diffuse field. We show that the flux of energy comingfrom the source can still dominate the late coda and result in nonsymmetric crosscorrelations when the distribution of earthquakes is not isotropic around the stations. Theextraction of Green functions from coda waves allows new types of measurements withseismic waves along paths between stations that could not be obtained with the wavesproduced by earthquakes.
Citation: Paul, A., M. Campillo, L. Margerin, E. Larose, and A. Derode (2005), Empirical synthesis of time-asymmetrical Green
functions from the correlation of coda waves, J. Geophys. Res., 110, B08302, doi:10.1029/2004JB003521.
1. Introduction
[2] Recent studies [Lobkis and Weaver, 2001; Weaverand Lobkis, 2001a, 2002] showed from laboratory experi-ments with ultrasonic and thermal noise that the Greenfunction can be extracted from the correlation propertiesof random fields. In seismology, two kinds of fields areusually considered as random: the seismic noise and thescattered waves of the coda. The idea of using randomnoise to extract deterministic signals had already beenproposed and had found spectacular applications in helio-seismology [Duvall et al., 1993; Rickett and Claerbout,2000]. Seismic noise has the advantage to be easy torecord and to exist even in regions without earthquakes.Shapiro and Campillo [2004] have shown that coherentbroadband dispersive wave trains emerge from the crosscorrelation of ambient seismic noise records betweenstations many hundred kilometers apart and that disper-sion curves can be measured in the absence of earthquake
records. However, the question of the origin of seismicnoise is still open. Without a clear understanding of thesource of the seismic noise, the relevant propagationregime (ballistic, diffusive.) remains unknown. It is thusdifficult to better understand the properties of the emer-gence of the Green function from diffuse wave fieldsusing only noise records.[3] In this paper, we concentrate on coda waves since
they are produced by a known source, with preciselocation and origin time, and they have been shown toresult from multiple scattering in the Earth lithosphere.Campillo and Paul [2003] showed that extracting theGreen function from field-to-field correlation of scatteredwaves is a valid approach not only in the controlled andfavorable conditions of the laboratory, but also withnatural signals such as actual seismograms produced byearthquakes. They used coda waves produced by moder-ate earthquakes in Mexico. The part played by multiplescattering and diffusion in the coda of the seismogramshas been a subject of discussion since the pioneeringpapers of Aki [1969] and Aki and Chouet [1975]. Theimportance of multiple scattering for the seismic coda isattested by the success of the use of radiative transfertheory to explain the observation of energy decay[Abubakirov and Gusev, 1990; Hoshiba, 1991; Margerin
JOURNAL OF GEOPHYSICAL RESEARCH, VOL. 110, B08302, doi:10.1029/2004JB003521, 2005
1Also at Laboratoire de Physique et Modelisation des MilieuxCondenses, Universite Joseph Fourier and CNRS, Grenoble, France.
Copyright 2005 by the American Geophysical Union.0148-0227/05/2004JB003521$09.00
B08302 1 of 13
et al., 1998, 1999]. Furthermore, the diffuse character ofcoda waves has been demonstrated by the observation ofthe stabilization of different energy ratios [Campillo etal., 1999; Shapiro et al., 2000; Hennino et al., 2001], aphenomenon associated with the principle of equipartitionin the phase space of a random field [e.g., Weaver, 1982].Equipartition means that all the possible modes areexcited at the same level of energy. In the presentcontext, the word modes refers to all body waves ornormal modes of surface waves that are potentiallyexcited in the region probed by the diffuse field andcan be coupled by local scattering. Equipartition is aproperty of diffuse elastic waves. It implies a stabilizationof the ratio of S to P wave energy with time, indepen-dently of the source. It is an important point in thecontext of the present paper since it indicates that themodes which make up the Green function are representedin the diffuse field. In the following, we first summarizetheoretical and experimental arguments that clarify theconditions for the emergence of the Green function fromfield correlations. We then present an application withdata from a temporary broadband network in Alaska.Finally we discuss the role played by the source distri-bution and the time evolution of the wave field structuretoward complete randomness.
2. Emergence of the Green Function and MultipleScattering
[4] Contrary to ballistic waves, fully diffuse wave fieldsare expected to contain all possible modes and propagationdirections following an equipartition principle. As explainedabove, this has been observed for coda waves through thestabilization of P to S energy ratio. Formally, an implicationof the presence of all modes is that the information aboutany possible path is represented in the coda records.Mathematically, a wave field inside a finite elastic bodycan be expressed in modal form:
u x; tð Þ ¼Xn
anfn xð Þeiwnt ð1Þ
where x is position, t is time, fn is a convenient set ofeigenfunctions, wn are eigenfrequencies, and an are modalexcitation functions that depend only on the source. Whendisorder is added inside the body, after a sufficiently longtime, the field becomes diffuse and an become randomfunctions of time. Equipartition means that the modalamplitudes are uncorrelated random variables:
anam*h i ¼ dnmF wnð Þ ð2Þ
where F(w) is the spectral energy density of the source inthe frequency band [w � dw, w + dw]. An implication ofequation (2) is that all modes in a narrow frequency rangeare excited at the same energy level. The brackets inequation (2) mean either an ensemble average over thedisorder or a time/frequency average of a single realization.Another type of average can be performed by considering adistribution of sources inside the body. In this case, an is afunction of the location of the source and the bracket in (2)denotes a volume integral over source positions. The
average correlation between the fields at locations x and ysimply becomes
C x; y; tð Þh i ¼Xn
F wnð Þfn xð Þfn yð Þe�iwnt ð3Þ
since the cross terms disappear on average owing to (2).[5] Expression (3) differs only by an amplitude factor F
from an actual Green function between points x and y. Avery important implication of this result is that the Greenfunction between two locations (or at least, the arrival timesof the different wave trains) can be extracted from thediffuse field with a simple field-to-field correlation averagedeither over a sufficiently long time or an extended enoughsource distribution.[6] Weaver and Lobkis [2001a] exposed the above argu-
ments and showed in laboratory experiments that theappropriately filtered average cross correlation of the fieldsat two positions is the Green function between the twopoints. The same arguments hold for an open medium aswell [Weaver and Lobkis, 2004]. Under the assumption ofcomplete randomness of the wave field, Snieder [2004]gave a ray geometrical interpretation of the reconstruction.[7] Arguments such as those above which depend on
assumptions of well developed diffuse fields are perhapsproblematic for application to seismology because thedistribution of earthquakes is discrete and uneven. Further-more, the duration of available time series is limited bydissipation and ambient noise. Field fluctuations areexpected that appear in the correlation function as a noisesuperimposed onto the expected deterministic signal. Smallenergy arrivals will emerge only after a very long averaging.In practical applications with the type of data available, wetherefore expect to reconstruct only the more energetic partsof the Green function.[8] Laboratory experiments with ultrasound and numeri-
cal simulations help to investigate the possibility of recon-structing the Green function in conditions close to thoseencountered in seismology. Derode et al. [2003a, 2003b]proposed an interpretation of the emergence of the exactGreen function from the cross correlation of the fieldsreceived by two passive sensors in a heterogeneous medium.Their argument is based on an analogy of the averaging of across-correlation function over a series of sources with aphysical operation of time reversal that can be performed inthe laboratory [Fink, 1992;Wu et al., 1992]. The operation ofcross correlation of the signal produced by a source in S atreceivers in A and B is formally equivalent to having a sourcein A producing waves recorded in S, time-reversed andreemitted from S to be recorded in B [Derode et al., 2003a].This last operation is exactly what is realized in a time-reversal mirror. This analogy shows how cross correlationis related to the physical wave propagation.[9] We illustrate this point with numerical simulations
conducted in a two-dimensional (2-D) acoustic medium.This configuration is chosen because it is a simple way todescribe wave propagation at the surface of the Earth. Wesolve the wave equation using a finite difference code[Tanter, 1999; Derode et al., 2001]. The field producedby each of several sources S is computed at each point of themedium. We consider a weakly scattering medium, wherethe distance of propagation is smaller than the transport
B08302 PAUL ET AL.: EMPIRICAL SYNTHESIS OF GREEN FUNCTIONS
2 of 13
B08302

mean free path of the waves. We recall that the transportmean free path l* is the typical distance after which thescattered energy of a wave in a particular direction is spreadover all directions. The scattering is caused by a distributionof small rigid scatterers with radius a. The backgroundvelocity is 3.3 km.s�1. The product of the wave number kby the radius a equals 1. Following the time-reversalanalogy developed by Derode et al. [2003a], we chooseto place the sources S all around A (the reference point at thecenter of the grid marked with a cross in Figure 1a) in orderto form an equivalent of a perfect time reversal mirror. Thisconfiguration is depicted in Figure 1a. Each source S sendsa broadband pulse with 0.1 Hz central frequency. Thecorrelations are computed between the field hSA(t) at thereference point A and the field hSR(t) at any other point R(x,y) of the grid. The correlation is averaged over the entire setof sources S. The wave field reconstructed by correlations isdisplayed in Figure 1 for correlation times �30, 0, and 30 s.Time t = 0 is the central time of the correlations, when allthe energy is focused in A as if Awas a source. At negativetimes, we observe a converging wave front, and a divergingwave front at positive times. These wave fronts correspondto the causal (positive times) and anticausal (negative times)parts of the Green function between A and any point R in themedium. The nearly perfect reconstruction of the Green
function (including the converging and diverging wavefronts) is due to the quasi-ideal distribution of sourcesaround A, the length of the coda (as long as allowed bythe numerical schemes: 200 oscillations) and the absence ofabsorption. This numerical experiment shows that crosscorrelation corresponds to a physical process and is not anartifice of signal processing.[10] Derode et al. [2003b] and Larose et al. [2004]
showed the role of multiple scattering in enhancing theefficiency of the reconstruction of the Green function with alimited number of sources and finite durations of recording,in conditions closer to seismology. Since in seismology, theduration of records is limited by the presence of noise andby absorption, averaging over a set of different sources isrequired to expect the emergence of the Green function. Thelimitations of the reconstruction will be discussed in section3 after an application of this simple principle to a data set ofactual seismograms.
3. Application to Coda Records
3.1. Data Processing
[11] Temporary networks of seismic stations installed inregions with a high level of seismicity provide useful datasets to study the properties of the emergence of Green
Figure 1. Numerical simulation of the reconstruction of the causal and anticausal parts of the Greenfunction from cross correlations. (a) Configuration of the numerical experiment. One thousand sources S(�) are surrounding the reference point A (pluses). Dots indicate the point scatterers. (b) Snapshot of thecross correlation between the field in Awith the field at location (x, y) after averaging over the sources Sfor correlation time �30 s. The weakly diffusive medium is characterized by the transport mean free pathl* = 640 km, which is larger than the distance between the points where the correlations are computed. Aconverging wave front is well defined and constitutes the anticausal part of the Green function.(c) Snapshot for correlation time t = 0 s. The wave front is focused on A. (d) Snapshot for t = 30 s. Thediverging wave front corresponds to the causal part of the Green function.
B08302 PAUL ET AL.: EMPIRICAL SYNTHESIS OF GREEN FUNCTIONS
3 of 13
B08302

functions from the correlations of coda waves. They includenumerous stations with identical instrument characteristicsthat make it possible to compute cross correlations betweenmany station couples separated by a large range of distancesand with different orientations. Time-distance seismic sec-tions can be constructed from the correlation signals wherethe propagating waves can be easily identified even with apoor signal-to-noise ratio. Actually, only limited averagingcan be performed with coda records, and the deterministicsignal is mixed with the remnant random fluctuations of thediffuse field.[12] We present here an application of the extraction of
Green functions from coda waves to the data of a temporarynetwork in Alaska. During the Broadband ExperimentAcross the Alaska Range (BEAAR), a network of 36broadband seismographs was operated during 2.5 yearsending in August 2001 [Ferris et al., 2003]. Most stationsrecorded simultaneously about 100 regional earthquakeswith magnitude larger than 3.3. Locations of stations andepicenters are shown in Figure 2.[13] Note that the distribution of earthquakes is not
even and that they are mostly concentrated to the south-east of the network. The broadband seismograms werefirst band-pass filtered. For each couple of stations, thehorizontal components of the seismograms were rotatedassuming the interstation great circle path to be the radialdirection. We used coda records starting 20 s after the
arrival of the S wave and ending when the signal-to-noiseratio was smaller than 4. An example of record is shownin Figure 3. Because of the exponential decrease of codaamplitude with time, we cannot perform a simple crosscorrelation between the coda signals recorded at the twostations without strongly overweighing the earliest part ofthe coda.[14] To avoid this problem, we followed Derode et al.
[1999] by disregarding the amplitudes completely andconsidering only one-bit signals. Campillo and Paul[2003] checked that this procedure leads to the sameresults as compensating for amplitude attenuation withtime in successive time windows. For each couple ofstations, the cross correlation of one-bit signals wascomputed for each earthquake, normalized to a maximumamplitude of one, and averaged over the entire set ofevents. This processing was performed for all combina-tions of components, such as vertical to vertical (Z/Z),vertical to transverse (Z/T), radial to radial (R/R), etc.The results of Campillo and Paul [2003] suggest thatthese different field-to-field correlations contain the dif-ferent terms of the elastic Green tensor. Wapenaar [2004]demonstrated the retrieval of the elastic Green tensorfrom surface displacement fields produced by a distribu-tion of sources on a closed surface in the medium. Evenif the source distribution does not fulfill such a conditionin actual experiments, he gives a firm theoretical argu-
Figure 2. Map of stations and earthquakes. The paths between couples of stations for which averagecross correlations have been computed are shown in inset.
B08302 PAUL ET AL.: EMPIRICAL SYNTHESIS OF GREEN FUNCTIONS
4 of 13
B08302

ment for the reconstruction of the polarized elasticresponse.
3.2. Results
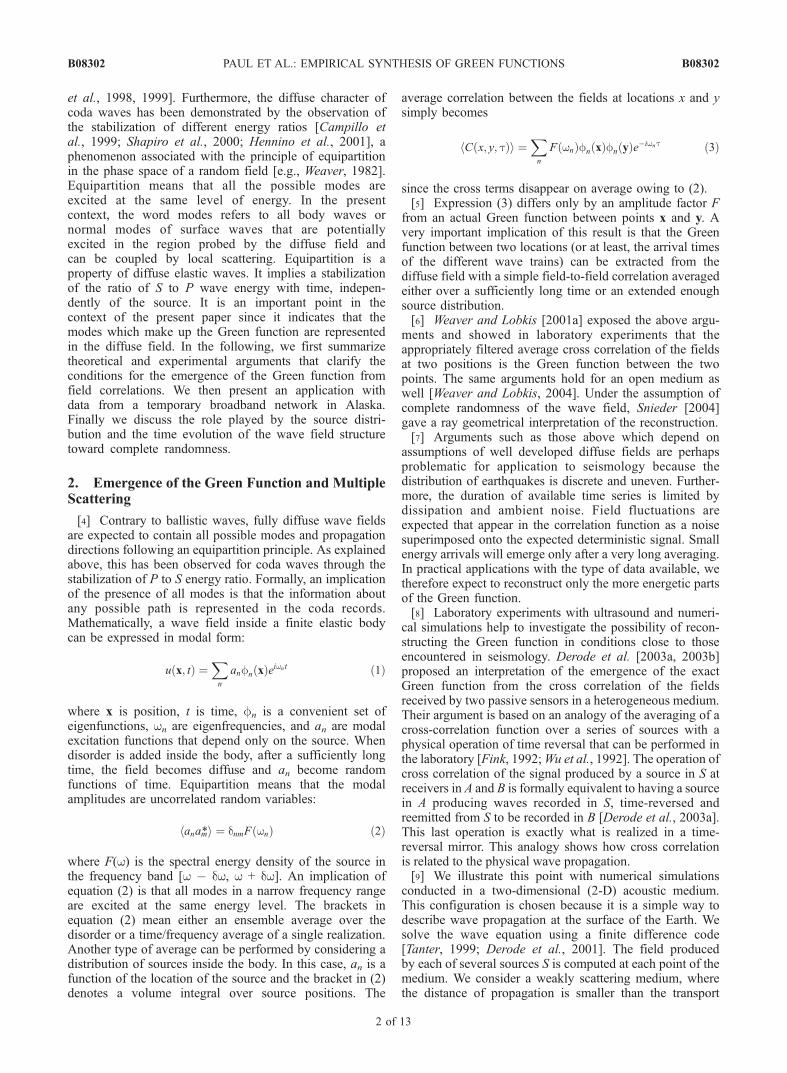
[15] Figure 4 shows the results of the processing in thefrequency band 0.08–0.3 Hz. The nine polarization combi-nations correspond to the terms of the Green tensor, that isfor example the R/Z correlation corresponds to the verticaldisplacement produced by a force in the radial direction.Since we disregard the amplitudes of the coda waves byusing one-bit signals, the relative amplitude of the recon-structed signals between the components is lost. Traces witha maximum amplitude at negative time have been timereversed to concentrate the large-amplitude pulses at posi-tive times and have a better view of the presence, or theabsence, of symmetry in time. Note that the location of themaximum amplitude pulse at positive or negative times onlydepends on the order of the signals in the cross correlation,which is arbitrary. Clear propagating wave trains can beobserved on the Z/Z, Z/R, R/Z, R/R, and T/T components.The Z/T, R/T, T/Z, and T/R components only contain noise,as expected from the symmetries of the Green tensor.Figure 4 confirms the conclusions of Campillo and Paul[2003] for numerous paths with different azimuths. When apropagating branch can be seen at positive times, a sym-metric one is more or less clearly visible, depending on thecomponent, at negative times. This symmetric wave train isparticularly clear on the Z/Z and T/T components at shortoffsets. We discuss the question of the time symmetry inmore details in section 4.[16] To test the reliability of the extraction of the Green
function from the data, we computed synthetic Greenfunctions in a 1-D velocity model derived from the seismicprofiles recorded by Beaudoin et al. [1992] in the neighborTanana terrane. The computations are performed for a
vertical point source acting at the free surface. The receiversare also at the free surface in a configuration similar to ourstation-to-station measurements. The synthetic section inthe frequency band 0.08–0.3 Hz is shown in Figure 5 in thesame distance range as in Figure 4. It is dominated by low-frequency surface waves (Rayleigh waves in this case), asthe cross-correlation records. As expected for a point forcesource at the free surface, the body wave contributions tothe Green functions are negligible. We performed the samecomputation in a frequency band centered on 1 Hz(Figure 5). The surface waves still dominate. This argumentbased on a flat-layered structure must be moderated by thefact that surface waves at these frequencies are stronglydiffracted by topography and shallow structures which areneglected in the 1-D model. It is nevertheless a goodindication that the assumption that the prominent arrivalsin the actual surface/surface Green function are surfacewaves is reasonable for the frequency and distance rangesconsidered here.[17] The reconstructed arrivals can be observed at dis-
tances as large as 200 km, confirming the existence ofstrong long-range correlations in coda waves. As alreadyobserved by Campillo and Paul [2003], and demonstratedby the comparison with synthetics, the dominant signalscorrespond to the fundamental Love and Rayleigh waves. Asimple phase velocity measurement on the Z/Z and T/Tcomponents of Figure 4 confirms that the velocities of theprominent wave trains are in a good agreement with theexpected dispersion curves of Rayleigh and Love waves inthe simple model derived from Beaudoin et al. [1992]. Thesignal-to-noise ratio decreases with increasing distance.This is a natural consequence of the spatial decay of theGreen function. The deterministic signal decreases rapidlywhile the physical fluctuations of the diffuse fields remain-ing after partial averaging are independent of the epicentraldistance. We assume here that the fluctuations are propor-tional to the square of the amplitude of the diffuse field.This amplitude is known to vary weakly with distance in thediffuse regime. It has been shown to be almost independentof distance for the late coda [e.g., Lacombe et al., 2003,Figure 3]. These observations suggest that even amplitudecharacteristics could be reconstructed from field correla-tions. However, a reliable measurement of the amplitudedecay with distance would require that the same set ofearthquake records and time windows are used for all thecouples of stations. It is not the case here since all stationswere not operating exactly at the same time.[18] We are only able to reconstruct the surface waves
because the Green function is expected to be dominated bysurface waves. A high level of noise remains after thelimited averaging we performed. It prevents an unambigu-ous identification of body waves. The reconstruction of thehigh frequencies is difficult because absorption limits thedurations of the available coda records. These limitationscould be overcome with a larger data set.
4. Time Symmetry and Isotropy of DiffuseWave Fields
4.1. Observations
[19] In Figure 4, we have arbitrarily chosen the directionof time so that the maximum amplitude of the average cross
Figure 3. Example of broadband record from a regionalearthquake. Note that the signal remains well above thenoise level for several hundreds of seconds after the S wavearrival.
B08302 PAUL ET AL.: EMPIRICAL SYNTHESIS OF GREEN FUNCTIONS
5 of 13
B08302
Figure 4
B08302 PAUL ET AL.: EMPIRICAL SYNTHESIS OF GREEN FUNCTIONS
6 of 13
B08302

correlation is at a positive time. Swapping the two stationsin the cross correlations gives a time series which is exactlythe time reversed of the original by definition of crosscorrelation. Since the identification of the waves only reliesupon the variations of the travel time with distance, thischoice has no consequence. On the other hand, Figure 4exhibits a strong asymmetry of the cross-correlation timefunctions. One must remember that theoretically we expectto see both causal (retarded) and anticausal (advanced) partsof the Green function. Nevertheless we observe that formost station couples, a single direction of time is favored. Asimilar observation was made by Campillo and Paul [2003]in Mexico. They used earthquakes along the subduction andfound that the cross-correlation functions are asymmetricalfor stations inland with an orientation perpendicular to thecoast and symmetrical for stations located along the coastwithin the earthquake source region. They suggested thattime asymmetry indicates a preferential direction of flow ofthe energy of coda waves, a property that could appear asparadoxical in the context of random fields. In the follow-ing, we will discuss this issue in relation with multiplescattering and the uneven distribution of epicenters whichare mostly located to the southeast of the network in Alaska.[20] Let us consider the Z/Z correlation profile of Figure 4.
Using different bandpass filters, we attempted to see whether
the level of asymmetry varies with frequency or not.However, the signal-to-noise ratio does not allow anyconvincing visual comparison. To achieve a more quantita-tive analysis, we performed a slant stack of the crosscorrelations. For each trace, the arrival time of the Rayleighwave was measured in the positive times, where by con-struction the largest amplitude is found. We then shifted thetraces of the time of the maximum and stacked all thearrivals in the positive times. We stacked the signals inthe negative times in the same way using time shiftsopposite to the ones measured in the positive times. Thisoperation enhances the coherent arrivals and takes intoaccount the variations of wave velocity among the differentpaths. Finally we computed the ratio between the maximumamplitude of the stacked Rayleigh pulses in the positivetime to the maximum amplitude of the stack in the nega-tive time. The stacks were performed for all tracescorresponding to interstation distances between 20 and120 km which have the best signal-to-noise ratio. Thisprocessing was applied to the sections of the Z/Z correlationprofile of Figure 4 after band-pass filtering. We obtained anamplitude ratio of 3.8 in the band 0.12–0.3 Hz and 4.0 inthe band 0.08–0.15 Hz indicating that the symmetry isslightly stronger for high frequency. However, we alsoexpect the late coda to behave differently from the early
Figure 4. Average cross correlations as a function of interstation distance. The correlations have been computed for everycombination of components of motion, vertical (Z), radial (R), and transverse (T).
Figure 5. Synthetic vertical seismograms for source and receivers at the free surface in a flat-layeredcrust. The source is a vertical force. Two different frequency bands are considered. Note the prominenceof the Rayleigh waves.
B08302 PAUL ET AL.: EMPIRICAL SYNTHESIS OF GREEN FUNCTIONS
7 of 13
B08302
coda. Because of anelastic absorption, the early codaincludes more high frequencies. As a consequence, theinfluences of both lapse time and frequency on the symme-try are mixed up in this analysis when we consider crosscorrelations computed on the whole coda length.[21] To clarify this point, we studied the dependence of
the causal to anticausal amplitude ratio with the lapsetime in the coda window. We formulate as a first-orderhypothesis that the larger the lapse time, the moreisotropic the coda. According to this argument, we expectthe correlations computed in later time windows to bemore symmetric in time since the corresponding diffusewave field is more isotropic and all directions of prop-agation are closer to be equally represented. To verify thereality of this effect, we compared the amplitude ratio ofpositive and negative times for correlations computed fordifferent lapse times and the same two frequency bandsas before. We considered first the correlations computedfrom the first 300 s of coda (early coda) filtered in thelow frequency band (0.08–0.15 Hz). We found a ratio ofstacked amplitudes of 5.6. We repeated the measurementfor correlations computed from record windows starting300 s after the beginning of the coda (late coda). Theamplitude ratio between the causal and anticausal signalsis 3.9. This indicates that the correlations are moresymmetrical when measured from the late coda than fromthe early coda. In other words, the longer time thescattered waves propagate, the more isotropic they are.We performed the same analysis in the band 0.12–0.3 Hz.For the early coda the amplitude ratio is 4.3, while it is3.1 in the late coda. This confirms that the pulsesemerging from the cross correlations of the late codaare more symmetric in time than those computed fromthe early coda. Comparing ratios obtained in the twofrequency bands, we find that the values are smaller forthe band 0.12–0.3 Hz than for 0.08–0.15 Hz. Thisindicates that the high-frequency waves are evolvingfaster toward isotropy. In the following, we investigatetheoretically and from numerical simulations what is theexpected evolution of the net flux of energy with timealong a seismogram and if this evolution accounts for theobservations.
4.2. Multiple Scattering and Isotropy
[22] In this section, we discuss quantitatively the impactof the anisotropy of energy flux on the time asymmetry ofthe Green function recovered by cross correlations. For sakeof simplicity, we consider the theory for scalar waves. Theresults are not expected to be different for the energy ofelastic waves as it will be discussed later. The angulardistribution of energy at position R and time t is describedby a specific intensity IR(p, t) defined as the energy flux inspace direction p per unit solid angle. The specific intensityis the solution of a radiative transfer equation, which can bederived from an ensemble average of the wave equation[Weaver, 1990; Ryzhik et al., 1996]. The radiative transferequation is a local detailed energy balance which describesthe transport of energy through a multiple scatteringmedium. In general, it is an integrodifferential equation thatcan only be solved numerically. However, after manyscattering events, the initial distribution of energy in phasespace tends to be homogenized, which implies that the
angular dependence of the specific intensity departs onlyslightly from isotropy. When this assumption is valid, I canbe expanded as follows:
IR p; tð Þ ¼ 1
4pr R; tð Þ þ 3J R; tð Þ pþ ½ � ð4Þ
where r denotes the energy density, and J is the energycurrent vector which points in the direction of maximumenergy flow. The dots denote higher-order multipoles thatare neglected. Equation (4) forms the basis of the diffusionapproximation, which should apply at t � t?, where t?
denotes the transport mean free time. We introduce the‘‘ideal’’ field-to-field correlation function C between twostations located at R + r/2 and R � r/2:
CR r; tð Þ ¼Zþ1
�1
u R þ r=2; t þ t=2ð Þu? R � r=2; t � t=2ð Þdt ð5Þ
where R represents the mean distance between source andstations and r the interstation distance. The diffusionapproximation can be used to derive an asymptotic (t !1) relation between C and the ensemble average Greenfunction of the medium [van Tiggelen, 2003]:
CR r; tð Þ ¼ r R; tð Þ @
@thGB r; tð Þi � hGB r;�tð Þi½ � � 3J R; tð Þ
r hGB r; tð Þi � hGB r;�tð Þi½ � ð6Þ
[23] In (6) brackets hi denote an ensemble average, andGB is the retarded causal Green function filtered in frequencyband B. Equation (6) applies to ensemble averaged quanti-ties only, and is therefore not expected to apply strictly inthe seismological case. However, it establishes a relativelysimple relation between the field-to-field correlation func-tion from a single source and partial derivatives of the (time-symmetric) Green function. It can be inferred that the partialderivatives @t and @r acting on the brackets [] yield evenand odd functions of time, respectively. Thus, as long as thedipolar (J) and isotropic (r) terms are of the same order, atime asymmetry is expected to persist.[24] In the diffusive regime, the energy density is the
solution of a simple diffusion equation:
@tr R; tð Þ � Dr2r R; tð Þ ¼ d tð Þd Rð Þ ð7Þ
and is related to the energy current by Fourier’s law:
J R; tð Þ ¼ �Drr R; tð Þ ð8Þ
D is the diffusion constant of the waves and is related to thetransport mean free time t? as follows:
D ¼ v2t?=3 ð9Þ
In equation (7) the delta functions represent idealized sourceterms for small earthquakes. Note that equations (7) and (8)are valid for coupled elastic waves. In that case, r must beinterpreted as the sum of P and S energy densities andrelation (9) takes a more complex form [Turner, 1998]. For
B08302 PAUL ET AL.: EMPIRICAL SYNTHESIS OF GREEN FUNCTIONS
8 of 13
B08302
scalar waves in a simple infinite scattering medium withhomogeneous background, the diffusion equation is easilysolved, and the ratio G between the causal and anticausalparts of the correlation function can be written as [Malcolmet al., 2004]:
G R; tð Þ ¼ 1þ 3R=2vt
1� 3R=2vtð10Þ
This relation is easily obtained by noting that J/r = R/2t and@r = v@t for a propagating wave of the general form h(t �R/v). Equation (10) shows that for a single source theconvergence of the ideal correlation function toward timesymmetry is algebraic, of order t�1 only. This result has tobe used with some caution since it relies on the assumptionthat the angular dependence of the specific intensity can bedescribed by equation (4).[25] To assess the range of validity of this expansion, we
solved numerically the full elastic radiative transfer equa-tion using the Monte Carlo method of Margerin et al.[2000]. Our analysis is limited to elastic body waves in aninfinite space. The code previously developed to evaluateenergy densities has been adapted to calculate the angulardistribution of flux. Numerical solutions of the transportequations and analytical results of the diffusion approxima-tion are shown in Figure 6. The medium is composed ofspherical inclusions with slight (5%) deviations of density,and P and S velocities from the homogeneous background.The product of shear wave number and sphere radius iskSa � 2. The scattering mean free time of shear waves isroughly 8 s and the detector is located 80 km away from apoint-like shear source. Figure 6a demonstrates the rapidmixing of P and S modes. After about 50 s (six mean freetimes), the P to S energy ratio has stabilized. However,Figure 6b shows that the energy flux is strongly anisotropicat the same lapse time: the ratio between forward andbackward fluxes is still larger than 4. It is thereforeimportant to carefully make the distinction between thestabilization of the P to S energy ratio, the validity of thediffusion approximation, and equipartition.[26] In the equipartition regime, all directions of propa-
gation and all polarizations are supposed to be equallyrepresented. Under these condition, the theoretical valueof energy ratio b3/2a3 (where b and a denote the shear andcompression velocities) can be obtained from a simplemode counting argument [Weaver, 1982]. Note that thisresult is only valid for a full homogeneous open space andcan be generalized to the case of the half-space [Weaver,1985; Hennino et al., 2001]. Figure 6 shows that theanisotropy of the field remains at very large times andtherefore that equipartition occurs asymptotically (t ! 1).On the contrary, the P to S energy ratio stabilizes at thetheoretical value b3/2a3 for a finite time. At this stabiliza-tion time, the diffusion approximation wrongly predictsboth energy density and flux anisotropy. After about 100 s,radiative transfer and diffusion theory agree extremely wellbut the residual anisotropy of intensity is still of the order of2 and decays algebraically as predicted by equation (10).The total energy density is correctly predicted by thediffusion approximation only when the dipolar termdescribes with sufficient accuracy the anisotropy of thespecific intensity. The calculations prove: (1) that the
stabilization of the P to S energy ratio is a rapid phenom-enon; (2) that it does not imply isotropy of the wave field;(3) that the diffusion approximation may largely underesti-mate the anisotropy of the energy flux, even in the multiplescattering regime. It is important to notice here that formalequipartition would imply perfect isotropy (all modes, i.e.,directions, equally represented). The stabilization of the P toS ratio occurs before the equipartition which is the asymp-totic behavior of diffuse waves for large times. Thereforeone may expect large time asymmetries of the field-to-fieldcorrelation functions as shown by equation (10), providedthe sources are located in the same distant region. Theasymmetry is expected to disappear both in the averagecross correlations of late coda signals, or with an isotropicdistribution of sources around the seismic network. In thelatter case, each source produces an asymmetric correlationfunction but the antisymmetric terms from many sources areexpected to average out.[27] We return to the numerical experiments with the
wave equation to illustrate the effect of a nonhomogeneousdistribution of sources. The conditions of computation aresimilar to those used to produce Figure 1, but we nowconsider a configuration which mimics a set of earthquakesalong a fault. 40 sources S are aligned in the x axis directionalong a 400-km-long segment located 450 km away fromthe receivers as depicted in Figure 7. We use the sameweakly scattering medium as in Figure 1. Snapshots of thecorrelation function are presented in Figure 7b for time t =�30 s, Figure 7c for t = 0 s, and Figure 7d for t = 30 s. Fort < 0, the wave front is only reconstructed in the direction ofthe sources S, corresponding to the anticausal part of theGreen function. For t > 0, only the causal part of the Greenfunction is reconstructed in the region opposite to thesources.[28] This numerical experiment confirms that the spatial
distribution of the sources controls the time symmetry of thecorrelations. If the source distribution is asymmetric, thetime symmetry of the correlations can be broken. This isparticularly true in weakly scattering (or homogeneous)media. This can be understood as well in terms of thetime-reversal analogy. The uneven distribution of earth-quakes in a limited region has a similar effect as a limitedaperture of a time-reversal mirror.[29] At long lapse time, the field becomes diffuse and
the argument given above (equation (10)) holds. Wetherefore expect that even with a inhomogeneous distri-bution of sources, scattering restores the broken timesymmetry of the correlations. We checked this expectationwith the same numerical experiment as before, but wecorrelated only the waves of the late coda. Late times inthe coda are defined as t > t*, where t* is the mean freetime, that is the mean free path divided by the velocity.After t*, the waves have traveled more than l* and thefield is evolving toward isotropy. The result is shown inFigure 8a and proves that the time symmetry of thecorrelations is restored by using large enough lapse times.As a consequence of the discussion above on the iso-tropization of the field, we expect stronger scattering toimprove the reconstruction of the Green function even foran inhomogeneous distribution of sources. This effect wasalready confirmed by laboratory experiments [Derode etal., 2003b]. We performed numerical simulations in a
B08302 PAUL ET AL.: EMPIRICAL SYNTHESIS OF GREEN FUNCTIONS
9 of 13
B08302

strongly scattering medium (Figure 8b) and processed thecomplete coda window. Again, the converging wave frontis clearly symmetric despite the uneven distribution ofsources, unlike what we observed in the same conditionsof computation with a weakly scattering medium(Figure 7).
[30] In our experiments on real earthquake records inAlaska, we observed a clear temporal asymmetry of thecross-correlation functions (Figure 4). It shows that theforward flux dominates and that the excitation ofthe propagation modes that make up the diffuse field isanisotropic. Indeed the earthquakes we used are concentrated
Figure 6. Comparison between numerical (Monte Carlo) solutions of the radiative transfer equation,and analytical solutions of the diffusion equation. (a) (top) Energy density and (bottom) P to S energyratio. (b) Angular distribution of elastic energy flux. The dashed and solid lines show the results of thediffusion approximation and radiative transfer equation, respectively. The energy flux decreasesmonotonically from q = 0 (forward direction) to q = p (backward direction), where q denotes the anglebetween the propagation direction and the source-observer vector. The results for q = p/4, p/2 and 3p/4are also plotted.
B08302 PAUL ET AL.: EMPIRICAL SYNTHESIS OF GREEN FUNCTIONS
10 of 13
B08302

Figure 7. Numerical simulation of the asymmetry of the reconstructed Green function. (a) Forty sourcesS aligned along the x axis (crosses). The reference point is at the center of the plot, indicated by a plus.(b) Snapshot of the cross correlation between the field in Awith the one at location (x, y) after averagingover the sources S for correlation time �30 s. The converging wave front is only partially reconstructed inthe direction of the sources. (c) Snapshot for correlation time t = 0 s. The wave front is focused on A. Notethe high level of remaining fluctuations. (d) Snapshot for t = 30 s. The diverging wave front is definedonly in the direction opposite to the source region.
Figure 8. (a) Same experiment as in Figure 7 for time t = �30 s in the weakly diffusive medium. Onlythe late coda was processed, corresponding to lapse times larger than the mean free time. This part of theacoustic signal is made of multiply scattered waves propagating in all directions. The wave frontconverges to A. Once again diffusion has restored the wave front isotropy and the time symmetry of theGreen function. (b) Same experiment as in Figure 7 for time t = �30 s for a strongly scattering mediumwith mean free path l* = 120 km. The converging wave front is isotropic, and therefore the timesymmetry of the Green function is restored.
B08302 PAUL ET AL.: EMPIRICAL SYNTHESIS OF GREEN FUNCTIONS
11 of 13
B08302

in the southeast of the center of the network as shown byFigure 2. Because of absorption and noise, the coda recordsare not long enough to reach the isotropy of the diffuse field.The resulting average flux of energy is responsible for theobserved time asymmetry of the cross correlation.[31] Besides the question of the source distribution, the
distribution of scatterers can be a source of time asymmetryas well. In the case of an inhomogeneous distribution ofscatterers, one may expect preferential directions of arrivalof scattered waves. As discussed above, and whatever itsorigin, such an anisotropy of the energy flow results in atemporal asymmetry of the correlations.
5. Conclusion
[32] The stacked cross correlations between coda recordsof regional earthquakes in Alaska display propagatingdeterministic wave trains. We showed numerical simula-tions of wave propagation to illustrate the principles of thereconstruction of the Green function from field-to-fieldcorrelations. An analogy with a time reversal experimentmakes more intuitive the interpretation of the reconstructionin terms of physical propagation of the waves. The prom-inent arrivals that can be identified from the data setcorrespond to Love and Rayleigh waves as expected forthe Green function between two points at the free surface.The emergence of the Green function is clearer at lowfrequency (0.1–0.3 Hz) than at higher frequency. Thereconstructed signals can be observed for positive andnegative correlation times which correspond to the causal(retarded) and anticausal (advanced) Green functionsexpected theoretically. The analysis of correlation functionsis thus a proper way to observe the anticausal Greenfunction, usually absent in experiments. However, thecorrelations exhibit a clear time asymmetry. We proposethat it is a consequence of the nonisotropic nature ofdiffusive wave fields at finite lapse times. To prove thisassertion, we studied the relation between the transitiontoward diffusion and the apparition of stabilization of P to Senergy ratio. The numerical experiments with the elasticradiative transfer equation show that the P to S energy ratiostabilizes rapidly, much before the field becomes isotropic.It is nevertheless a good indicator that the field energy isgoverned by a diffusion equation. The formal state ofequipartition is reached only for asymptotically large lapsetimes when isotropy of the field is achieved. Numericalexperiments also show that at finite times, the rupture oftime symmetry is related to the uncomplete azimuthaldistribution of sources. The relative amplitude of causaland anticausal waves, and its evolution with time, can beused to measure scattering properties of the medium suchas transport mean free path. The extraction of Greenfunctions from coda waves makes new types of measure-ments with seismic waves possible. They can be per-formed along paths between stations that could not beobtained with the ballistic waves from earthquakes. There-fore they could contribute to improve significantly theresolution of seismic images.
[33] Acknowledgments. We are indebted to G. Abers for helping usto access the data of the BEAAR experiment and to all participants in theexperiment. R. Weaver made helpful suggestions and stimulating com-ments. Thanks to B. van Tiggelen, M. Fink, and N. Shapiro for numerous
discussions. We acknowledge the constructive remarks of two anonymousreviewers and of the Associate Editor.
ReferencesAbubakirov, I. R., and A. A. Gusev (1990), Estimation of scattering proper-ties of lithosphere of Kamchatka based on Monte-Carlo simulations ofrecord envelope of a near earthquake, Phys. Earth Planet. Inter., 64, 52–67.
Aki, K. (1969), Analysis of the seismic coda of local earthquakes as scat-tered waves, J. Geophys. Res., 74, 615–618.
Aki, K., and B. Chouet (1975), Origin of coda waves: Source, attenuation,and scattering effects, J. Geophys. Res., 80, 3322–3342.
Beaudoin, B. C., G. S. Fuis, W. D. Mooney, W. Nokleberg, and N. I.Christensen (1992), Thin, low-velocity crust beneath the southern YukonTanana terrane, east central Alaska: Results from Trans-Alaska CrustalTransect refraction/wide-angle reflection data, J. Geophys. Res., 97,1921–1942.
Campillo, M., and A. Paul (2003), Long-range correlations in the diffuseseismic coda, Science, 299, 547–549.
Campillo, M., L. Margerin, and N. M. Shapiro (1999), Seismic wave diffu-sion in the Earth lithosphere, in Diffuse Waves in Complex Media, NATOASI Ser., Ser. C, vol. 531, edited by J. P. Fouque, pp. 383–404, Springer,New York.
Derode, A., A. Tourin, and M. Fink (1999), Ultrasonic pulse compressionwith one-bit time reversal through multiple scattering, J. Appl. Phys., 85,6343–6352.
Derode, A., M. Tanter, L. Sandrin, A. Tourin, and M. Fink (2001), Numer-ical and experimental time-reversal of acoustic waves in random media,J. Comput. Acoust., 9(3), 991–998.
Derode, A., E. Larose, M. Tanter, J. de Rosny, A. Tourin, M. Campillo, andM. Fink (2003a), Recovering the Green’s function from field-field corre-lations in an open scattering medium (L), J. Acoust. Soc. Am., 113,2973–2976.
Derode, A., E. Larose, M. Campillo, and M. Fink (2003b), How to estimatethe Green’s function of a heterogeneous medium between two passivesensors? Application to acoustic waves, Appl. Phys. Lett., 83, 3054–3056.
Duvall, T. L., S. M. Jefferies, J. W. Harvey, and M. A. Pomerantz (1993),Time distance helioseismology, Nature, 362, 430–432.
Ferris, A., G. A. Abers, D. H. Christensen, and E. Veenstra (2003), Highresolution image of the subducted Pacific(?) plate beneath central Alaska,50–150 km depth, Earth Planet. Sci. Lett., 214, 575–588.
Fink, M. (1992), Time reversal of ultrasonic fields-Part I: Basic princi-ples, IEEE Trans. Ultrason. Ferroelectr. Frequation Control, 39(5),555–566.
Hennino, R., N. Tregoures, N. M. Shapiro, L. Margerin, M. Campillo, B. A.van Tiggelen, and R. L. Weaver (2001), Observation of equipartition ofseismic waves, Phys. Rev. Lett., 86, 3447–3450.
Hoshiba, M. (1991), Simulation of multiple scattered coda wave excitationbased on the energy conservation law, Phys. Earth Planet. Inter., 67,123–136.
Lacombe, C., M. Campillo, A. Paul, and L. Margerin (2003), Separation ofintrinsic absorption and scattering attenuation from Lg coda decay incentral France, Geophys. J. Int., 154, 417–425.
Larose, E., A. Derode, M. Campillo, and M. Fink (2004), Imaging fromone-bit correlations of wideband diffuse wave fields, J. Appl. Phys., 95,8393–8399.
Lobkis, O. I., and R. L. Weaver (2001), On the emergence of the Green’sfunction in the correlations of a diffuse field, J. Acoust. Soc. Am., 110,3011–3017.
Malcolm, A. E., J. Scales, and B. A. van Tiggelen (2004), Extracting theGreen function from diffuse, equipartitioned waves, Phys. Rev. E, 70,015601.
Margerin, L., M. Campillo, and B. van Tiggelen (1998), Radiative transferand diffusion of waves in a layered medium: New insight on coda Q,Geophys. J. Int., 134, 596–612.
Margerin, L., M. Campillo, N. M. Shapiro, and B. van Tiggelen (1999),Residence time of diffuse waves in the crust as a physical interpretationof coda Q: Application to seismograms recorded in Mexico, Geophys. J.Int., 138, 343–352.
Margerin, L., M. Campillo, and B. van Tiggelen (2000), Multiple scatteringof elastic waves, J. Geophys. Res., 105, 7873–7892.
Rickett, J. E., and J. F. Claerbout (2000), Calculation of the Sun’s impulseresponse by multi-dimensional spectral factorization, Sol. Phys., 192,203–210.
Ryzhik, L., G. Papanicolaou, and J. B. Keller (1996), Transport equationsfor elastic and other waves in random media,Wave Motion, 24, 327–370.
Shapiro, N. M., and M. Campillo (2004), Emergence of broadband Ray-leigh waves from correlations of the ambient seismic noise, Geophys.Res. Lett., 31, L07614, doi:10.1029/2004GL019491.
B08302 PAUL ET AL.: EMPIRICAL SYNTHESIS OF GREEN FUNCTIONS
12 of 13
B08302
Shapiro, N. M., M. Campillo, L. Margerin, S. K. Singh, V. Kostoglodov,and J. Pacheco (2000), The energy partitioning and the diffusive characterof the seismic coda, Bull. Seismol. Soc. Am., 90, 655–665.
Snieder, R. (2004), Extracting the Green’s function from the correlation ofcoda waves: A derivation based on stationary phase, Phys. Rev. E, 69,046610.
Tanter, M. (1999), Application of time reversal to brain hyperthermia, Ph.Dthesis, Univ. Paris VII, Paris.
Turner, J. A. (1998), Scattering and diffusion of seismic waves, Bull. Seis-mol. Soc. Am., 88, 276–283.
van Tiggelen, B. A. (2003), Green function retrieval and time reversal in asisordered world, Phys. Rev. Lett., 91, 243904.
Wapenaar, K. (2004), Retrieving the elastodynamic Green’s function of anarbitrary inhomogeneous medium by cross correlation, Phys. Rev. Lett.,93, 254301.
Weaver, R. L. (1982), On diffuse waves in solid media, J. Acoust. Soc. Am.,71, 1608–1609.
Weaver, R. L. (1985), Diffuse elastic waves at a free surface, J. Acoust. Soc.Am., 78, 131–136.
Weaver, R. L. (1990), Diffusivity of ultrasound in polycrystals, J. Mech.Phys. Solids, 38, 55–86.
Weaver, R. L., and O. I. Lobkis (2001), Ultrasonics without a source:Thermal fluctuation correlation at MHz frequencies, Phys. Rev. Lett.,87, 134301.
Weaver, R. L., and O. I. Lobkis (2002), On the emergence of the Green’sfunction in the correlations of a diffuse field: Pulse-echo using thermalphonons, Ultrasonics, 40, 435–439.
Weaver, R. L., and O. I. Lobkis (2004), Diffuse fields in open systems andthe emergence of the Green’s function, J. Acoust. Soc. Am., 116, 2731–2734.
Wu, F., J.-L. Thomas, and M. Fink (1992), Time reversal of ultrasonicfields–part II: Experimental results, IEEE Trans. Ultrason. Ferroelectr.Frequation Control, 39(5), 567–578.
�����������������������M. Campillo, E. Larose, L. Margerin, and A. Paul, Laboratoire de
Geophysique Interne et Tectonophysique, Observatoire de Grenoble,Universite Joseph Fourier and CNRS, BP 53, F-38041 Grenoble, France.([email protected])A. Derode, Laboratoire Ondes et Acoustique, Universite Paris 7 and
CNRS, ESPCI, 10 rue Vauquelin, F-75005 Paris, France.
B08302 PAUL ET AL.: EMPIRICAL SYNTHESIS OF GREEN FUNCTIONS
13 of 13
B08302
Copyright © 2022 FDOKUMEN