Biomechanical Configurations of Mandibular Transport Distraction Osteogenesis Devices
Upload
khangminh22Category
view
0download
0
Resistance Prediction for Asymmetrical Configurations of High-Speed
Catamaran Hull Forms
by
Srikanth Asapana
Bachelor of Technology
Naval Architecture and Ocean Engineering
Indian Maritime University 2013
A thesis submitted to the College of Engineering at
Florida Institute of Technology
in partial fulfillment of the requirements
for the degree of
Master of Science
In
Ocean Engineering
Melbourne, Florida
December 2015

COPYRIGHT
In presenting this thesis in partial fulfillment of the requirements for an
advanced degree at the Florida Institute of Technology, I agree that the
library shall make it freely available for reference and study. I further agree
that permission for copying of this thesis for scholarly purposes may be
granted by the Head of my department or by his or her representatives. It is
understood that copying or publication of this thesis for financial gain shall
not be allowed without my written permission.
Srikanth Asapana
Department of Marine and Environmental Systems
Florida Institute of Technology
Melbourne, Florida
Nov 23rd, 2015
© Copyright 2015, Srikanth Asapana
All Rights Reserved
Signature
___________________________________________________________

We the undersigned committee here by approve the attached thesis
Resistance Prediction for Asymmetrical
Configurations of High-Speed Catamaran Hull Forms
by
Srikanth Asapana
________________________ _______________________
Prasanta K. Sahoo, Ph. D. Hamid Hefazi, Ph. D.
Associate Professor Department Head Professor
Ocean Engineering Mechanical and Aerospace Engineering
Committee Chair
________________________ _______________________
Ronnal Reichard, Ph.D. Thomas. D. Waite, Ph. D.
Professor Department Head Professor
Marine and Environmental Systems Marine and Environmental Systems

iii
Resistance Prediction for Asymmetrical Configurations of High-
Speed Catamaran Hull Forms
by
Srikanth Asapana
Academic Advisor: Prasanta K. Sahoo (Ph.D)
ABSTRACT
Predicting the resistance of a high-speed catamaran has been of interest to naval
architects for the last three decades. Even though considerable amount of research
has been carried out in this area, there remains a degree of uncertainty in the
accurate resistance prediction of catamaran hull forms in the early design stage.
Researches carried out so far have generally ignored the resistance characteristics
of unconventional and unsymmetrical catamaran hull forms.
This thesis attempts to undertake a comparative analysis of resistance
characteristics between newly developed unconventional catamaran hull forms of
different configurations derived from existing conventional NPL series of round
bilge catamaran hull forms (Molland et el 1991). For this a set of catamaran hull
forms with the main hull length of 1.6 m, and with a different range of slenderness
ratio (L/1/3), B/T ratio are generated by using standard modelling software. The
resistance analysis had been carried out by using slender body theory and by using
STAR CCM+, a CFD package for Froude numbers 0.25, 0.3, 0.6, 0.8 and 1
respectively and with different separation ratios (s/L) of 0.3 and 0.4.
The main objective was to perform a comparative analysis for a wide parameter
space which would be encompassing different unconventional hull configurations
against conventional hull forms. Literature survey establishes that there is scant
literature in public domain to perform resistance analysis on unconventional
catamaran hull forms.

iv
As this is not feasible due to lack of data in areas that were considered crucial,
separate resistance analysis will be carried out for each hull configuration. The
new resistance analysis is proposed for a broad range of geometrical parameters
especially for asymmetrical hulls so that a designer will be able to make a decision
regarding powering prediction in the design stage. Finally, the compared resistance
results will attempt to conclude whether unconventional and unsymmetrical
catamaran hull forms are more efficient than the conventional hull forms. The
results obtained from this analysis shows that asymmetrical catamaran hull forms
irrespective of the separation ratio outperformed the normal catamaran hull forms
at higher Froude number. But there still lies a conspiracy about the resistance
characteristics among the Froude number ranging between 0.4-0.6 which is
typically a transition range for high-speed. A finer analysis on the range of Froude
number should be carried out in obtaining a closer look over the fluctuation of the
resistance at high-speed transition range.
It is expected that this study would help to provide a foundation in obtaining
greater insight regarding resistance characteristics of unconventional catamaran
hull forms especially with regard to slenderness ratio (L/1/3), separation ratio
(s/L) and interference effects between the demi-hulls. The conclusions would be
beneficial to any early stage designer whose interest lies in advancing the
catamaran studies.

v
Table of Contents
List of Figures………………………………………………………………… vii
List of Tables…………………………………………………………………. x
List of Abbreviations……………………………………………………….... xii
List of Symbols……………………………………………………................. xiii
Acknowledgement……………………………………………………………. xv
Dedication………………………………………………………………….....xvi
CHAPTER 1…………………………………………………………………... 1
1. INTRODUCTION…………………………………………………………. 1
1.1 BACKGROUND…………………...………………………………….. 2
CHAPTER 2…………………………………………………………………. 16
2. THEORY…………………………………………………………………..16
2.1 FLOW ANALYSIS OVER CATAMARAN………………………… 18
2.2 SIDE FORCE………………………………………………………….18
2.3 VISCOUS EFFECTS………………………………………………… 18
2.4 COMPONENTS OF TOTAL RESISTANCE………………………...19
2.5 STAR-CCM+………………………………………………….............22
CHAPTER 3………………………………………………………………….25
3. MODEL DEVELOPMENT……………………………………………….25
3.1 CONFIGURATIONS OF ASYMMETRICAL CATAMARAN
MODELS…………………………………………………...................25
3.2 SLENDER BODY HULL FORMS…………………………………...28
3.3 GEOMETRY………………………………………………………… 31

vi
3.4 MESH GENERATION………………………………………………34
3.5 BOUNDARY CONDITION AND SOLUTION SETUP…………....35
CHAPTER 4…………………………………………………………...........37
4. VALIDATION OF CFD…………………………………………………37
CHAPTER 5………………………………………………………………...42
5. CFD ANALYSIS OF ASYMMETRICAL CATAMARAN…………….42
5.1 CFD SIMULATION…………………………………………………42
5.2 FORM FACTORS OF ASYMMETRICAL CATAMARAN….........47
5.3 TOTAL RESISTANCE OF ASYMMETRICAL CATAMARAN….48
CHAPTER 6……………………………………………………………….. 53
6. CONCLUSION…………………………………………………………. 53
6.1 CONCLUSION……………………………………………………... 53
6.2 FUTURE WORK…………………………………………………… 55
REFERENCES…………………………………………………………….. 56
APPENDIX A: HYDROSTATICS OF CATAMARAN MODEL……… 59
APPENDIX B: DATA ON CFD INVESTIGATION……………………. 61

vii
List of Figures
Figure 1: Wigley catamaran hull……………………………………………… 4
Figure 2: Comparison of CW of catamaran at different separation ratios………. 5
Figure 3: Series of semi displacement catamaran round bilge hull forms…....... 7
Figure 4: Zonal distribution of the flow around the hull…………………….... 8
Figure 5: Comparison of CW for different series……………………………… 9
Figure 6: Comparison of total resistance among different methods-first
model…………………………………………………………………………….10
Figure 7: Comparison of total resistance among different methods-second
model…................................................................................................................ 11
Figure 8: Comparison of total resistance among different methods-third
model…................................................................................................................ 11
Figure 9: Comparison of statistical methods and the model data…………...... 13
Figure 10: Symmetrical catamaran Hull form……………………………......... 13
Figure 11: Asymmetrical catamaran hull form………………………………… 13
Figure 12: Represent the CT values of an asymmetrical catamaran for
corresponding Froude numbers……………………………………………….... 15
Figure 13: Model 3b body plan, Molland (1994)………………………………. 25
Figure 14: Body plan of Outboard Asymmetrical Catamaran (s/L-0.3)……….. 26
Figure 15: Plan view of outboard asymmetrical catamaran (s/L-0.3)…………. 26

viii
Figure 16: Body plan view of an inboard Asymmetrical Catamaran (s/L-0.3)…27
Figure 17: Plan view of an inboard Asymmetrical Catamaran (s/L-0.3)………. 27
Figure 18: S-NPL Lines Planes [Molland et al. (1994)]……………………….. 29
Figure 19: Profile view of a Catamaran model 3b (s/L-0.3)…………………….30
Figure 20: Plan view of a catamaran (s/L-0.3)…………………………………..30
Figure 21: Body plan view of a catamaran (s/L-0.3)…………………………….31
Figure 22: Geometry of Inboard Asymmetrical Catamaran (s/L-0.4)………….. 32
Figure 23: Geometry of Outboard Asymmetrical Catamaran (s/L-0.4)………... 32
Figure 24: The domain of catamaran………………………………………….... 33
Figure 25: Trimmed cell mesh of catamaran CFD domain (Symmetry)……….. 35
Figure 26: Comparison of total resistance coefficients [3b mono-hull]………... 39
Figure 27: Comparison of total resistance coefficients [Catamaran (s/L-0.4)]… 39
Figure 28: Comparison of total resistance coefficients [Catamaran (s/L-0.3)]….40
Figure 29: Free surface wave contours at Fn 0.6 [3b mono-hull model]……….. 40
Figure 30: Free surface wave contours at Fn 0.6 [Catamaran (s/L-0.4)]……….. 41
Figure 31: Two interacting phases [air and water]………………………………42
Figure 32: Contour of pressure layers………………………………………….. 43
Figure 33: Convergence of Residual Scales………………………………......... 43

ix
Figure 34: Free surface wave contours of Inboard Asymmetrical Catamaran (s/L-
0.4) at Fn 0.8…………………………………………………………………… 44
Figure 35: Free surface wave contours of Outboard Asymmetrical Catamaran
(s/L-0.4) at Fn 1………… …………………………………………………... 44
Figure 36: Total resistance coefficients of Asymmetrical catamaran hull
[s/L=0.4]............................................................................................................. 45
Figure 37: Total resistance coefficients of Asymmetrical catamaran hull
[s/L=0.3]………………………………………………………………………..46
Figure 38: Total resistance coefficients of Asymmetrical catamaran hull …….46
Figure 39: Resistance components [Molland et al. (2011)]……………............47
Figure 40: Prohaska plot [Molland et al. (2011)]………………………………48
Figure 41: Comparison of total resistance [Inboard Asymmetrical (s/L-0.3)]....51
Figure 42: Comparison of total resistance [Inboard Asymmetrical (s/L-0.4)]…51
Figure 43: Comparison of total resistance [Outboard Asymmetrical (s/L-
0.3)]…………………………………………………………………………….52
Figure 44: Comparison of total resistance [Outboard Asymmetrical (s/L-
0.4)]…………………………………………………………………………….52

x
List of Tables
Table 1: Parameters of different round bilge models…………………………....... 7
Table 2: Tested separation and stagger conditions……………………………..... 14
Table 3: Viscous form factor for symmetrical and asymmetrical catamarans for
different separation ratios………………………………………………………... 14
Table 4: Hydrostatics of 3b Asymmetric Catamaran Model [S/L 0.3]………….. 27
Table 5: Systematic series of round bilge S-NPL models [Molland et al.
(1994)]…………………………………………………………………………... 28
Table 6: Particulars of Catamaran Models…………………………………….... 30
Table 7: Trimmed cell mesh details for asymmetrical catamaran model………..34
Table 8: Fluid properties of fresh water………………………………………… 35
Table 9: Boundary condition and solution method………………………………36
Table 10: Total resistance coefficients [3b mono-hull]………………………….38
Table 11: Total resistance coefficients [3b Catamaran (s/L-0.3)]……………… 38
Table 12: Total resistance coefficients [3b Catamaran (s/L-0.4)]……………….38
xi
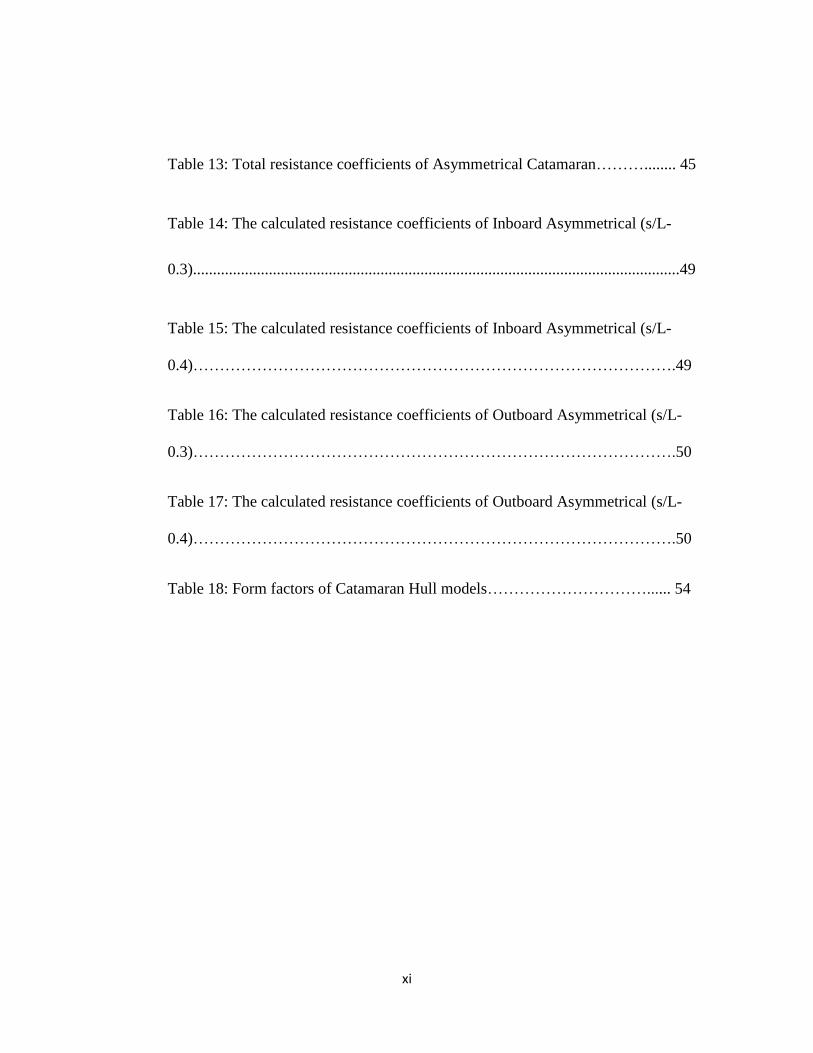
Table 13: Total resistance coefficients of Asymmetrical Catamaran………........ 45
Table 14: The calculated resistance coefficients of Inboard Asymmetrical (s/L-
0.3)..........................................................................................................................49
Table 15: The calculated resistance coefficients of Inboard Asymmetrical (s/L-
0.4)……………………………………………………………………………….49
Table 16: The calculated resistance coefficients of Outboard Asymmetrical (s/L-
0.3)……………………………………………………………………………….50
Table 17: The calculated resistance coefficients of Outboard Asymmetrical (s/L-
0.4)……………………………………………………………………………….50
Table 18: Form factors of Catamaran Hull models…………………………...... 54

xii
List of Abbreviations
CAD Computer-Aided Designing
CFD Computational Fluid Dynamics
IGES Initial Graphics Exchange Specification
ITTC International Towing Tank Convention
NPL National Physics Laboratory
NURBS Non-Uniform Rational B-Splines
RANS Reynold’s Averaged Navier-Stokes
VOF Volume of Fluid
WSA Wetted Surface Area

xiii
List of Symbols
A Area
B/T Breadth to Draft ratio
C Critical coefficient of model
CA Incremental Resistance Coefficient
CAA Air Resistance Coefficient
CB Block Coefficient
CF ITTC ship-model correlation line
CM Mid-ship Coefficient
CP Total Pressure Coefficient
CT Total Resistance Coefficient
CTcat Coefficient of Total Resistance of Catamaran
CV Total Viscous Resistance Coefficient
CW Total Wave Resistance Coefficient
CWcat Coefficient of Wave Resistance of Catamaran
CWdemi Coefficient of wave resistance for demi hulls
F Force
Fn Froude Number
k Turbulent Kinetic Energy
L Length
L/1/3 Slenderness Ratio
L/B Length to Breadth ratio

xiv
LCB Longitudinal Center of Buoyancy
m Mass
R/L Stagger Ratio
Rn Reynold’s Number
RT/ Total Resistance to Displacement ratio
RW Total Wave Resistance
S Wetted Surface Area
s/L Separation Ratio
V Velocity
Density
Dissipation Rate
Pressure field change factor
Velocity increment factor
Viscous Resistance Interference Factor
Wave resistance interference factor
(1+K) Form factor for catamaran
(1+k) Form factor for mono hull
t Turbulent Viscosity

xv
Acknowledgement
I would like to express my appreciation to Dr. Prasanta Sahoo who read my
numerous revisions and for his useful critiques, for being constant inspiration
and showing me the lead in this path. He has been so generous and patient
during this process. I would also thank Dr. Waite, Dr. Hefazi and Dr.
Reichard for spending their valuable time.
I would like to extend my sincere thanks to my Naval Architecture laboratory
fellow mates for being with me in all the tough times and helping me out in
achieving this.

xvi
Dedication
To my mother and father

1
Chapter 1
Introduction
Though the maritime industry is setting a broad exposure in ship designing through
advanced technologies and varying simulation software, the research seems to be
never ending in producing finer and optimized design of the vessels. When most of
the vessels in the maritime industry are dominated by the conventional mono hull
design with distinguishing shapes for desired commercial purposes there is always
space available for multi-hull vessels when stability and hydrodynamic
performance are considered as the main criteria.
Due to rapid development of the high-speed ship market in the past decade, multi-
hulls are considered as the best option to be used in naval and recreational
purposes where performance of the vessel could have a profound effect.
Hydrodynamic performance is an important aspect to be taken into consideration
as it has direct impact on the operational costs. So, at an early stage a designer
need to be aware of finding the best possible method which determines or sets a
compromise between vessel shape and operational costs to get the desired
performance. Though the theoretical approach of hull resistance is complex in
nature, it seems economically feasible when compared to model test evaluation.
This justifies the effort involved in studying many different theoretical methods in
order to evaluate hull resistance properly (Moraes et al 2004).
In ship building industry, the catamaran design provide many advantages such as
speed, stability and carrying capacity. In general, catamaran hull forms have
already proved to be good enough in providing double the deck space even after
meeting all the requirements such as stability and performance. Although there is
an increase in frictional resistance due to increased wetted surface (demi hulls)
area, the effect can be negotiated once the design hull reaches sufficient speed.

2
Though interference between the waves hardly affects the resistance of the hull it
can be reduced by the optimized design of hull shape (Bertram, (2002);
Schneekluth and Bertram, (2002); Larsson and Baba, (1996); White, (1991)).
However, finding the resistance and interactive forces between the demi hulls still
remained as significant design challenges. The size and shape of the demi hulls
have an impact on resistance as well as on interference of the vessel.
Whereas all the above points are applicable to all existing catamaran hull forms, in
this research an attempt has been made to figure out a new approach of optimizing
resistance characteristics of a catamaran by making a significant change in the hull
forms which are way different from the existing designs. For example, each demi
hull of the catamaran is sliced into half which makes the whole wetted surface area
of a catamaran to be half of the conventional catamaran hull form. The design
would readily exhibit the decreased viscous resistance that will be experienced by
the hulls. Finally the resistance analysis of these different hull configurations are
compared to the results of conventional catamaran hulls to arrive at a conclusion
that if these configurations are reliable and efficient than the conventional
catamaran hull forms.
1.1 Background
The concept of multi-hull is known to the mankind since the ages of sailing. The
Polynesians are the first to represent the catamaran hull form in 16th century. But it
took two centuries past to have a scientific look over the pros and cons of
catamaran hull design. Speed is the main parameter which resulted in the evolution
of multi-hull from the conventional mono hulls as the mechanical propulsion came
into big picture. In case of mono hulls the high-speed is achieved by a finer hull
which exhibits minimum drag characteristics. A slender hull with high L/B ratio
would serve the purpose.

3
This initiated the need of second hull as a supporting structure which led the
innovation of catamaran hulls without a compromise between speed and stability
of the vessel. As the twin hulls are finer and exhibits stability efficiency as well as
desired speed more than the conventional mono hull design, the researchers have
always been interested in the optimized design of the hull to get the desired
hydrodynamic performance. Hence, by taking speed as the main aspect there is no
doubt that most of the catamarans belongs to the family of high-speed crafts and
ferries rather than commercial vessels.
When good performance is the output needed from a hull design one should have a
great insight in the reduction of resistance characteristics of the hull. Since the
catamaran has twin hulls which represents more wetted surface area would also
experience more drag characteristics. Also the resistance experienced at slow
speeds is much greater when compared to any other conventional mono hulls.
There are many model experiments and researches conducted in evaluating the
resistance characteristics of the catamaran hull forms.
Moraes et al (2003) have investigated on the wave resistance components of the
catamaran at different separation ratios (s/L). The authors have performed this
investigation using two different methods namely slender body method as
postulated by Mitchell 1898 and 3D method based on potential theory used by
SHIPFLOW computational method. In the end results from the above two
methods are compared to the experimental results of Millward (1992) in order to
check the consistency. Wigley hull geometry is used to carry out this investigation.
Wigley hull is a parabolic hull form proposed by Wigley (1942) and is one of the
most widely tested hull form in the ship design. The equation for a non-
dimensional wigley hull form is given as (1) and the hull form is shown in figure 1.
𝑌 = [±1
2𝑏(1 − 4𝑥2) (1 −
𝑧2
𝑑2)] −
1
2≤ 𝑥 ≤
1
2, −𝑑 ≤ 𝑧 ≤ 0 (1)

4
This hull geometry is tested for three different separation ratios values say s/L =
0.2, 0.4 and 1 and the results are plotted. The results show similar trade routes by
every method but by allowing a little inconsistency (higher) in the wave coefficient
(Cw) values by 3-D SHIPFLOW method at Froude number between 0.5-0.7.
Figure 1: Wigley Catamaran Hull [Moraes et al (2003)]
This difference in the values is justified by the fact that ship flow software utilizes
3D method and takes into account of the hull interference in this particular Froude
number range whereas slender body theory and the Millward (1992) case study is
based on 2D methodology, Moraes et al (2004).

5
Figure 2: Comparison of CW of catamaran at different separation ratios
The obtained CW values for other Froude number’s (0.1-0.45 & 0.75 and above)
nearly corresponds to the values given by Millward (1992). Comparison of CW of
catamaran at different separation ratios is shown in the Figure 2.
The shape of a symmetrical catamaran has a negligible effect on the wave
resistance experienced by the catamaran hull (Chengyi 1994). The above plots
show that the coefficient of wave resistance peaks at lower Froude numbers (0.45-
0.55) irrespective of the spacing between the hulls. Also as the separation ratio
increases the difference in the Cw values given by the 3D SHIPFLOW software
and the slender body theory shows a decline in the value which is a phenomena of
interference effect. A catamaran hull exhibits a typical tendency in interference
corresponding to the Froude numbers. The interference becomes almost zero at
lower Froude numbers say below 0.3 and also represents negative interference
above Froude number 0.7 Millward (1992). (Chengyi 1994) also proposed that the
hull interference which is responsible for the reduction in resistance characteristics
occurs at Froude number greater than 0.5 which supports the statement given by
Millward (1992).

6
Another research has been carried out by Sahoo et al (2007) which primarily
focused on the calm water resistance characteristics of a series of semi
displacement catamaran of round bilge hull forms. A regression equation has been
established for evaluating the resistance characteristics for a wide range of
parameters. Though the equation doesn’t comply with some of the experimental
data and also other factors being uncertainties to some extent, the results yielded
provide a considerable promise over using the regression equation (Sahoo et al
2007). This research also includes the discussion over different methods of
estimating the wave resistance characteristics but by having the validation of
results between the models used and Molland et al (1994) as the top priority. The
total resistance of a vessel can be divided into two main components namely
viscous resistance and wave making resistance. Viscous resistance can be readily
found out from ITTC-1957 ship-model correlation line with the help of a form
factor whereas the wave making resistance is an inconceivable factor till date.
With the advent in technology and simulation software’s there is a likelihood of
obtaining the results which are almost accurate but the accurate result is always
unpredictable.
In this paper the authors used a computational package SHIPFLOW for generating
the wave making resistance data for catamaran hull forms and the regression
equation has been generated based on the wave data. Later, the extent of validity of
the equation is carried out by comparing the results with some experimental
methods.
For this resistance analysis the authors used a series of round bilge catamaran hull
forms which are prominently used by the Australian high speed ferry industry. The
analysis has been conducted for a separation ratio (s/L) between 0.2 and 0.4
whereas the speed range is confined to Froude number 0.2-1. The round bilge
models used are represented in Figure 3.

7
Figure 3: Series of semi displacement catamaran round bilge hull forms [Sahoo et al
(2007)]
This software splits the whole flow around the vessel into three different zones
where the appropriate flow equations can be formed and then computes the wave
resistance coefficient by summing up all the equations. The flow around the model
is basically divided into three zones namely potential flow, boundary layer and
turbulent flow. The parameters of the different models are presented in the Table 1.
Table 1: Parameters of different round bilge models [Sahoo, Browne, and Salas
(2004)]
Model 1 2 3 4 5 6 7
L/B 15 15 15 15 12.5 12.5 10
B/T 1.5 1.5 2.5 2.5 1.5 2.5 2.5
CB 0.4 0.45 0.5 0.4 0.45 0.45 0.45
L/1/3 9.45 9.08 10.4 11.20 8.04 9.54 8.22

8
This research has been limited to perform the resistance characteristics to certain
range of Froude number (<1) due to flaws in the computational software being
unable to model wave breaking phenomena when Froude number exceeds 1. As
the wave resistance coefficient is dependent on number of iterations, ensure that
the process runs through decent number of iterations while analyzing. Two types
of solvers Linear and Non-linear exist in the SHIPFLOW for running the analysis
which obtains wave resistance coefficient. If nothing is specified, the software
choses the linear type of solver by default but for achieving accurate results non-
linear type of solver is always recommended. The only drawback with the non-
linear solver is it is unstable particularly at high speeds. Regions based on the flow
around the hull are shown in Figure 4.
Figure 4: Zonal distribution of the flow around the hull
The regression equation of Cw established by the authors for a catamaran demi hull
is follows as equation (1).
𝐶𝑊𝑑𝑒𝑚𝑖 = 𝑒𝑐1 (𝐿
𝐵)
𝐶2
(𝐵
𝑇)
𝐶3
(𝐶𝐵 𝐶4) (
𝐿
13
)𝐶5
(𝑖𝐸𝐶6)()𝐶7(
𝑠
𝐿)𝐶8 (1)
Three models from the series exhibited the results in conjunction with the results
of Molland et al (1994) and it showed a good correlation between the models
especially when the Froude number is above 0.5. The comparison of wave
coefficient CW for different series of round bilge hull forms is shown in Figure 5.

9
Figure 5: Comparison of CW for different series
The authors have extended their research in order to sort out the best results on
wave resistance characteristics and to obtain more promising nature about the
regression equation which is formulated in the first part. A comparative analysis is
made on the resistance characteristics in order to validate the accuracy and efficacy
of different resistance prediction methods that are used in part 1. A relatively old
computational package CATRES which is based on thin ship theory have been
used in this research for comparison of the results. The validation of the regression
equations developed earlier is done by conducting the resistance analysis
experimentally to three most widely used models from the high speed ferry
industry. The results obtained from towing tests were non-dimensionalised so that
these could be presented and compared with the regression models developed in
part 1 of this study (Sahoo et al, 2007). The resistance graphs from different
methods chosen are then plotted against different Froude numbers for all the three
selected models.

10
The Figure 6 below show results of the first model, the computational software
CATRES exhibits appropriate results with the experimental data proving the
accuracy and dependency levels of the software. On the other hand the regression
equation formulated from Ship flow by Sahoo et al (2007) predicts more resistance
than experimental data and method implemented by Pham et al (2001) and Sahoo
et al (2004) complies with the experimental data though it slightly under predicts
the results.
Figure 6: Comparison of total resistance among different methods-first model
The results of the second model are plotted in the Figure 7. The resistance
experienced by this model is higher as can be seen from the values of towing tank
results. From the figure below, the experimental data exhibits an increment in
linear nature to which the values generated from Ship flow by Sahoo et al (2007)
display relatively close results though they are under predicted. CATRES result
does not match the towing tank data for a Froude number up to 2. It failed to
exhibit the similar trend curve just like any other methods applied as it under
predicts the resistance values once crossing the Froude number value 2.4

11
Figure 7: Comparison of total resistance among different methods-second model
The results (Figure 8) from the CATRES exhibit similar results by over predicting
the experimental data. The results from Ship flow by Sahoo et al (2007) produce
relatively close results to that of towing tank tests slightly over predicting.
Although the results from Sahoo et al (2004) and Pham, Kantimahanthi and Sahoo
(2001) seems sufficiently accurate, though it under predicts the experimental data
over the speed range.
Figure 8: Comparison of total resistance among different methods-third model

12
The resistance curves from different methods have exhibited similar trend when
compared to the experimental data. Though there is difference which can be seen
in resistance curves between methods for a particular vessel and also when
compared to different vessels, one must also remember the regression equations
are formulated in part 1 are based on a systematic series of hull forms which are
different from the three random hulls that are analyzed in this study. As the
regression equations tend to show near accuracy in the results, one should also
remember that the hull forms used for the regression equations are different from
the randomly selected hull forms which are used for obtaining the experimental
data and the best results is always expected provided more study and research
involving in refining the regression equations.
Sampson et al (2005) conducted power prediction analysis on a semi displacement
catamaran using a series of comprehensive model tests. The separation ratio of the
model tested in this paper is 0.09 thus taking the venturi effects into consideration.
These unconventional hull forms have good impact in stability and more efficient
while the hull is in planning mode. However, the vessel experiences a lot of
resistance during its semi-displacement and displacement mode due to interference
effects and relatively higher half angle of entrance which creates significant wave
shoulders when compared to conventional catamaran hull forms. An asymmetric
demi hull shows significantly less resistance at Froude number more than 1 when
compared with the symmetrical catamaran, Fry et al (1972). Whereas asymmetric
catamaran exhibits an improved resistance characteristics than demi hull when the
Froude number is over 1.27. At a Froude number range of 0.9, the flow between
the demi hulls is smooth without any disturbance but the flow on the outside is
associated with large waves which indicates dependency on the half angle of
entrance which causes shoulder wave system. Later, the results from the model
tests have been compared with different statistical methods in order to validate the
efficacy.

13
Figure 9 represents the comparison of model data to the statistical methods used
and shows that Savitsky method is under predicting the model test data whereas
VWS is defining the upper region of the graph.
Figure 9: Comparison of statistical methods and the model data (Sampson et al,
2005)
Utama et al (2011) have undertaken rigorous testing over the drag characteristics
and interference effects between laterally separated and longitudinally staggered
catamaran configurations for both symmetrical and asymmetrical hull cross-
sections. Figure 10 and 11 representing the symmetrical and asymmetrical
configuration of catamarans respectively.
Figure 10: Symmetrical catamaran Hull form [Utama et al (2011)]
Figure 11: Asymmetrical catamaran hull form [Utama et al (2011)]

14
The experiments were conducted for Froude number up to 0.7 with three
separation hull distances and four longitudinally hull staggers, including the single
demihull cases for both symmetrical and asymmetrical hull forms. The test
conditions for both hull forms are outlined in Table 2. Also the viscous form factor
(1+k) obtained for symmetrical and asymmetrical catamaran hull forms at
different separation ratios and different stagger positions is represented in table 3.
Table 2: Tested separation and stagger conditions (Utama et al, 2011)
Model Description Separation Ratio (s/L) Stagger (R/L)
Demi Hull - -
Catamaran 0.2 0,0.2,0.3,0.4
Catamaran 0.3 0
Catamaran 0.4 0,0.2,0.3,0.4
Table 3: Viscous form factor for symmetrical and asymmetrical catamarans for
different separation ratios (Utama et al, 2011)
Hull Form Monohull
(1+k)
s/L=0.2 s/L=0.3 s/L=0.4
(1+k) (1+k) (1+k)
Sym. Catamaran 1.277 1.426 1.415 1.410
R/L=0.2 - 1.430 - 1.430
R/L=0.3 - 1.430 - 1.430
R/L=0.4 - 1.430 - 1.429
Asym. Catamaran 1.266 1.324 1.305 1.302
R/L=0.2 - 1.330 - 1.310
R/L=0.3 - 1.330 - 1.310
R/L=0.4 - 1.329 - 1.309
15
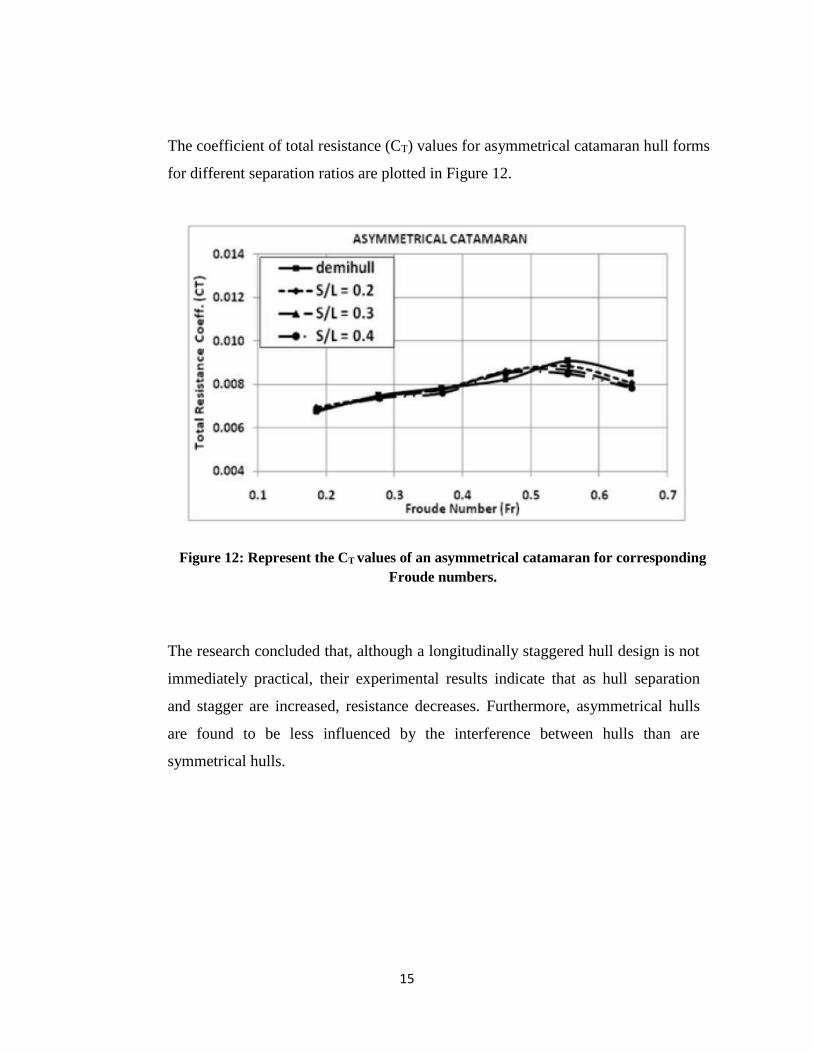
The coefficient of total resistance (CT) values for asymmetrical catamaran hull forms
for different separation ratios are plotted in Figure 12.
Figure 12: Represent the CT values of an asymmetrical catamaran for corresponding
Froude numbers.
The research concluded that, although a longitudinally staggered hull design is not
immediately practical, their experimental results indicate that as hull separation
and stagger are increased, resistance decreases. Furthermore, asymmetrical hulls
are found to be less influenced by the interference between hulls than are
symmetrical hulls.

16
CHAPTER 2
THEORY
For high speed applications the asymmetric catamaran hull form shows promise
(Sampson et al, 2005). Predicting the resistance characteristics of a ship have
always been a difficult task as it is associated with the three prominent factors
namely accuracy, time and the application cost. There are two basic ways of
predicting the wave resistance which the present world follows.
Towing tank test: This method is considered to be the most promising method
which yields the accurate resistance results by using the geometrically similar
models for testing. The objectives of measurement in resistance towing tank tests
are to obtain the relationship between residuary resistance coefficient and Froude
number of a ship model and, if required, the form factor. The direct measurement
of the tests is the total resistance as well as the running attitudes of a ship model at
each speed.
CFD method: This is a numerical simulation of the model which behaves just like
numerical towing tank and predicts the resistance data. The time period for a
completing a simulation is based on the parameters of the model, other attributes
and conditions which would be given as input by the user. Although this seems
economically feasible when compared to the towing tank test.
The prediction of resistance characteristics of an asymmetrical catamaran hull
forms can be done by several ways.
Extrapolation from geometrically similar models
Dedicated model tests
Series data based on systematic model tests

17
Regression based procedures
Computational fluid dynamics
The accuracy levels of the different methods decline in the provided order for well-
established conventional hull forms. Since the availability is so scarce for the
resistance data of asymmetrical catamaran hull forms thus it is recommended to go
for dedicated model tests and then extrapolate the model results to actual size of
the vessel in order to acquire the best possible resistance data.
Resistance is the driving force which is responsible for the uniform rectilinear
motion of the ship with a constant speed in a calm sea. The total resistance is
divided into two components namely viscous resistance which is associated with
the friction experienced by the body with respect to the medium, and the other is
wave making resistance which causes the generation of waves and nonetheless
other associated components. The wave making resistance is the resultant force
caused by the pressure changes due to atmosphere on the free surface, which
causes waves on the surface. As the speed of ship has profound effect on wave
making resistance which eventually increases the total resistance experienced by
the ship it is essential to find out ways in reducing it so that better performance of
any hull form is achieved. Generally, to do this, high values of L/1/3, or increasing
the dynamic lift of the hull, are required. Wave making resistance is also affected
by the interference between the separate hull wakes. Indeed the favorable wave
interference can compensate for the increase of the wetted surface, ensuring the
advantages of very slender hulls over a significant range of Froude numbers
together with good stability characteristics.

18
2.1 Flow analysis over catamaran
The flow about a catamaran is symmetric with respect to the center line but not the
flow around the demi hulls. The flow irregularity is due to a new effect that arises
between the demi hulls widely known as wave interference effect which is also a
factor for the resistance. Although this effect can be calculated accurately with the
help of thin ship theory provided the slenderness of the demi hulls is small. Apart
from this effect, the catamaran also experience a side force and associated induced
drag due to the asymmetric nature of the fluid cross flow between the demi hulls.
This side force can be cancelled out by the catamaran hull symmetry but it doubles
the induced drag force by combining the forces from the demi hulls and generates
more resistance which restricts the forward motion of the vessel. This is one of the
reasons why catamarans don’t respond to the lift force as much as conventional
mono hulls do. The only way to get rid of the induced drag force from the demi
hulls is done by ensuring that the demi hulls have minimum angle of attack.
2.2 Side Force
Side force increase rapidly as the separation ratio between the demi hulls
decreases, Couser et al (1998). As a matter of fact, the side force is directly
proportional to the speed of the vessel. Since the catamaran with less separation
ratio is more susceptible to faster speeds which helps in domination of relative
magnitude of the outward force of the radiated wave system and inward force due
to the venture effect together results in the increased side force.
2.3 Viscous Effects
In general all the viscous forces of a catamaran is a representation of frictional
resistance. But still there lacks an involvement of some other secondary effects
such as eddy making, viscous interference and transom effects which might
crucially affect the total resistance of the catamaran. Insel et al (1992) made an
attempt which considers these effects for a catamaran through modification in the

19
demi hull form factor. He tested the demi hull in isolation as well as in the form of
catamaran through which he derived the difference in the form factor of demi hull
in both isolated and also in conjunction with the catamaran. The difference
between the two cases is attributed as viscous resistance interference effect (β).
This difference when added to the form factor (1+k) of a demi hull introduces a
new format of the form factor as (1+ βk). The viscous resistance interference effect
mainly comprises of two parts. They are pressure field changes around the demi
hulls and the speed increase between the hulls. It depends only on the length to
beam ratio of the demi hull and is completely independent on the speed or the
separation between the demi hulls.
In general, two interference effects contributing to the total resistance effect were
found namely viscous interference caused by asymmetric flow around the demi
hulls which affects the boundary layer formation and the wave interference due to
the interaction of the wave systems produced by each demi hull.
2.4 Components of Total Resistance
The ITTC-57 ship-model correlation line (1978) suggested the total resistance
components of mono-hull should be expressed by equation (2):
CT = (1+k) CF + CW (2)
Where (1+k) is the form factor according to Hughes-Prohaska (2008)
CF is the frictional resistance coefficient which is always calculated according to
the ITTC’57 correlation line and is given by (3):
CF =0.075
(log10 Rn−2)2 (3)
CW is the wave resistance coefficient and is calculated by the formula (4)
CW=𝑅𝑊
1
2𝑆𝑉2
(4)

20
Insel and Molland (1992) proposed the total resistance of catamaran was
practically expressed by equation (5):
CTcat = (1 + k)CF + τCW (5)
Where the factor takes pressure field change around the demi hulls into
consideration and the factor takes account of velocity increment between the
hulls which can be calculated by simple integration of the local frictional
resistance over the wetted surface area.
Where τ is the wave resistance interference factor.
This equation is much more simplified and given as equation (6)
CTcat = (1 + βk)CF + τCW (6)
Where is the viscous interference factor
And (1+k) is the form factor for the catamaran
For a catamaran, can be calculated using the following equation
=Cw cat
Cw demi (7)
A satisfactory fit to the catamaran form factors given by Couser et al (1997).
(1 + βk) = 3.03 (L
∇13
)−0.4
(8)
Also there are other minor components which accounts for the total resistance
experienced by the vessel. They are the air resistance experienced by the
superstructure of the vessel and the appendage resistance due to the roughness and
unevenness of the surface evolved during the construction phase. So, the equation
which involves all these terms is given as
CT=CW+CF+CA+CAA (9)

21
where CA is incremental resistance coefficient taking into account the effect of
roughness of the surface of the ship and CAA is the air resistance coefficient.
Where as in CFD the total viscous drag is measured as a direct physical
measurement of resistance components and is given by equation (10).
CT = CV + CP (10)
Where CV is viscous resistance coefficient and CP is pressure resistance
coefficient.
To calculate the total resistance, the wave resistance coefficient is obtained by
experimental data (Molland, 1994), and the frictional resistance coefficient is
calculated by using the form factor and ITTC’57 correlation line so that the total
resistance coefficient can be expressed as (11):
CTcal = (1 + k) CFITTC + CWexp (11)

22
2.5 STAR CCM+
The three basic principles on which the fluid dynamics is dependent on are
Conservation of Mass
Conversation of Energy
Newton’s Second Law, F=ma
These principles are governed into numerical equations in fluid dynamics and are
represented as the equations of continuity, energy and momentum. These are
generally called as transport equations or conversation equations. The form of
this equations used in CFD is known as Navier-Stokes equations.
STAR-CCM+ (2014), a CFD package provides comprehensive modeling
capabilities for a wide range of incompressible, compressible, laminar and
turbulent fluid flow problems and solves conservation equations of mass an
momentum. In this thesis, incompressible, viscous turbulent and two phase (air-
water) flow is considered. For this flow the governing equations are written as
incompressible Reynolds-averaged Navier-Stokes equation.
The CFD package used takes finite volume method to transform the continuous
governing equations into a form that can be solved numerically by using
segregated solver, where the flow equations are solved one after the other and
linked using a correction equation.
The volume of fluid model is used in this thesis is exceptionally provided for
systems containing two or more unmixable fluid phases, where each phase
constitutes a large structure within the system (such as typical free surface flows).
This approach captures the movement of the interface between the fluid phases,
and is often used for marine applications. A k- turbulence model is a two-equation
model in which transport equations are solved for the turbulent kinetic energy 𝑘
and its dissipation rate

23
The two-layer approach, is an alternative to the low-Reynolds number approach
that allows the k- model to be applied in the viscous sub layer. In this approach,
the computation is divided into two layers. In the layer next to the wall, the
turbulent dissipation rate and turbulent viscosity 𝑡are specified as functions of
wall distance. The values of specified in the near-wall layer are blended
smoothly with the values computed from solving the transport equation far from
the wall. The equation for the turbulent kinetic energy is solved in the entire flow.
This approach generally obtain results that are often good or better.
The turbulence model used in this analysis is the realizable two-layer k- model for
getting better results. This model combines the realizable k- model with the two-
layer approach. This model contains a new transport equation for the turbulent
dissipation rate . Also, a critical coefficient of the model, C is expressed as a
function of mean flow and turbulence properties, rather than assumed to be
constant as in the standard model. The realizable k- model is substantially better
than the standard k- model for many applications, and can generally be relied
upon to give answers that are at least as accurate.
For Eulerian multiphase cases, where more than one phase exists the turbulence
kinetic energy k, and its rate of dissipation, , are given by following transport
equations (12) and (13)
𝑑
𝑑𝑡 ∫ 𝛼𝑖𝜌𝑖𝑘𝑖 𝑑𝑣 +
.
𝑉 ∫ 𝛼𝑖𝜌𝑖𝑘𝑖(𝑣 − 𝑣𝑔). 𝑑𝑎 = ∫ 𝛼𝑖(𝜇 +𝜇𝑖′
𝜎𝑘)∇𝑘𝑖 𝑑𝑎 + ∫ 𝛼𝑖[𝑓1
𝑐𝐺𝑖𝑘 + 𝐺𝑖
𝑏 −.
𝑉
.
𝐴
.
𝐴
𝜌𝑖((𝜀𝑖 − 𝜀0) + 𝑌𝑖𝑀) + 𝑆𝑖
𝑘 + 𝑆𝑖𝑘𝑟] 𝑑𝑣 + ∑ (𝑚𝑖𝑗𝑘𝑗
(𝑖𝑗)− 𝑚𝑗𝑖𝑘𝑖)𝑖=1 (12)
𝑑
𝑑𝑡 ∫ 𝛼𝑖𝜌𝑖𝜀𝑖 𝑑𝑣 +
.
𝑉 ∫ 𝛼𝑖𝜌𝑖𝜀𝑖 (𝑣 − 𝑣𝑔). 𝑑𝑎 = ∫ 𝛼𝑖 (𝜇 +𝜇𝑖′
𝜎)𝑖. 𝑑𝑎 + ∫ 𝛼𝑖 [𝑓1
𝑐𝐶1𝑆 +.
𝑉
.
𝐴
.
𝐴
𝜀𝑖
𝐾𝑖 (𝐶1𝐶3𝐺𝑖
𝑏) −𝜀𝑖
𝑘𝑖+√𝑣𝜀𝑖 𝐶2𝜌𝑖(𝜀𝑖 − 𝜀0) + 𝑆𝑖
+ 𝑆𝑖𝑟] 𝑑𝑣 + ∑ (𝑚𝑖𝑗𝜀𝑗
(𝑖𝑗)− 𝑚𝑗𝑖𝜖𝑖) 𝑖=1 (13)

24
Where V is the cell volume, 𝛼𝑖 is the volume fraction of phase i and being the
density
The turbulent viscosity is computed for two layer approach is given by the
expression (14) and (15)
𝑡
=
0.544 𝑦𝑣∗
1+5.025∗104
1
𝑦𝑣∗1.6 (14)
Where
𝑦𝑣∗ = 𝑅𝑒𝑦√
2
𝑘 (15)
√2
𝑘= 7.19 ∗ 10−3𝑅𝑒𝑦 − 4.33 ∗ 10−5𝑅𝑒𝑦
2 + 8.8 ∗ 10−8𝑅𝑒𝑦3

25
CHAPTER 3
MODEL DEVELOPMENT
A catamaran comprises of two demi hulls usually with each demi hull having the
same waterline length and breadth. They are usually positioned parallel to each
other with a certain distance between the center lines of each hull which is termed
as separation ratio (s/L).
This research deals with the comparison of resistance characteristics between
newly created asymmetrical catamaran hull forms and those with existing S-NPL
series round bilge catamaran hull forms. The mono hull model was initially chosen
from the series of S-NPL round bilge hull forms of Molland et al. (1994). The hull
model 3b is used as parent hull in creating different configurations of asymmetrical
catamarans and is shown in Figure 13.
Figure 13: Model 3b body plan, Molland (1994)
3.1 The Configurations of Asymmetrical Catamaran model
Two models of asymmetrical catamarans namely Inboard Asymmetric and
Outboard Asymmetric catamaran hull forms are created from the existing S-NPL
series mono hull model 3b with two different separation ratio (s/L) between the

26
demi hulls as 0.3 and 0.4. The asymmetrical demi hull is arranged such that the
hull width is a half of the symmetrical hull with the flat sides facing inwards and
outwards. Based on S-NPL systematic series, the models were generated by using
Maxsurf Modeling software, which is a standard modelling software. The hulls are
transformed into closed poly surface, a solid body with the help of Rhinoceros 5, a
CAD software before implementing the resistance analysis.
Figure 14: Body plan view of an Outboard Asymmetrical Catamaran (S/L-0.3)
Figure 15: Plan view of an Outboard Asymmetric Catamaran (s/L-0.3)

27
Figure 16: Body plan view of an inboard Asymmetrical Catamaran (s/L-0.3)
Figure 17: Plan view of an inboard Asymmetrical Catamaran (s/L-0.3)
Table 4: Hydrostatics of 3b Asymmetric Catamaran Model [s/L 0.3]
Parameter Value Units
Displacement 16.7 Kg
Draft 0.107 m
Wetted Surface Area 0.597 m2
CB 0.383 -
L/B 5.501 -
B/T 2.530 -
L/1/3 7.460 -

28
3.2 Slender Body Hull Forms
Resistance data has been established for a systematic series of round bilge
displacement hull forms from the towing tank experiments conducted in the
National physics laboratory by Molland et al (1994). 22 models have been tested
by varying L/B and B/T ratios. Molland et al. (1994) predicted wave making
resistance on the systematic series of 10 round bilge NPL hulls for a Froude
number ranging 0.2-1. The below table represents the models and their non-
dimensional parameters respectively where the Slenderness ratio L/∇1/3, ranging
from 6.27 to 9.50. As the total resistance is obtained from the towing test results,
the residuary resistance is then calculated for every model by subtracting the
frictional resistance which is determined from the ITTC correlation line 1957.
Table 5: Systematic series of round bilge S-NPL models [Molland et al. (1994)]
Model L(m) L/B B/T L/∇1
3 CB CP CM WSA
(m2) LCB (%)
3b 1.6 7.0 2.0 6.27 0.397 0.693 0.565 0.434 -6.4
4a 1.6 10.4 1.5 7.40 0.397 0.693 0.565 0.348 -6.4
4b 1.6 9.0 2.0 7.41 0.397 0.693 0.565 0.348 -6.4
4c 1.6 8.0 2.5 7.39 0.397 0.693 0.565 0.348 -6.4
5a 1.6 12.8 1.5 8.51 0.397 0.693 0.565 0.282 -6.4
5b 1.6 11.0 2.0 8.50 0.397 0.693 0.565 0.282 -6.4
5c 1.6 9.9 2.5 8.49 0.397 0.693 0.565 0.277 -6.4
6a 1.6 15.1 1.5 9.50 0.397 0.693 0.565 0.240 -6.4
6b 1.6 13.1 2.0 9.50 0.397 0.693 0.565 0.233 -6.4
6c 1.6 11.7 2.5 9.50 0.397 0.693 0.565 0.234 -6.4

29
Figure 18: S-NPL Lines Planes [Molland et al. (1994)]

30
Table 6: Particulars of Catamaran Models
Model LWL (m) Wetted Area
(m2) Draft (m) B/T s/L
Model 3b 1.38 0.597 0.107 2.719 0.3, 0.4
Inboard
Asymmetric 1.6 0.597 0.107 2.530 0.3, 0.4
Outboard
Asymmetric 1.6 0.597 0.107 2.530 0.3, 0.4
Figure 19: Profile view of a Catamaran model 3b (s/L-0.3)
Figure 20: Plan view of a catamaran (s/L-0.3)

31
Figure 21: Body plan view of a catamaran (s/L-0.3)
3.3 Geometry
Generating an extensive CFD solution is must when the results are used to
interpret the actual solution for the problem. So, it requires a great attention
in setting up and also in the process of analyzation. CFD analysis of a
problem involves three main steps namely pre-processing, analysis of the
problem and post-processing (Mahmood, 2001). Pre-processing involves
creation and importing the model geometry, domain creation, accurate model
meshing and setting up all the required conditions. Analysis is done by the
CFD program by running the simulations for enormous iterations according to
the conditions given in the input by the user. Post- processing starts once the
simulation gets over and mainly includes the generation of different graphs and
values corresponding to the problem.
The asymmetrical catamaran model was initially created as Non-uniform
rational B-spline (NURBS) curves using Maxsurf modeler. Then the model
is converted to IGES file which can be imported to a CAD software for solid
modeling.

32
The surfaces are created using Rhinoceros, a CAD program and the model is
converted to closed poly surface, a representation of the solid body. The solid
bodies of asymmetrical catamaran hull forms can be seen in the Figure 22 and 23
Figure 22: Geometry of Inboard Asymmetrical Catamaran (s/L-0.4)
Figure 23: Geometry of Outboard Asymmetrical Catamaran (s/L-0.4)

33
Once the model is transformed into a solid body it is imported to the Star
CCM+ geometry and the domain is created. The domain is the boundary within
which the analysis will be made and also acts as a towing tank where the
medium flows for close representation of real world scenario. The domain size
is determined by length of the hull, and is taken as one ship length forward and
five ships length aft of the main hull. The breadth is created one ship length
port and starboard of the main hull. The depth is one ship length in the air and
one ship length in the water. The domain of a catamaran hull is shown in
Figure 24.
Figure 24: The domain of catamaran
Any CFD package takes quit long time for a simulation to complete. So, one
should have insight about ways available for computational time reduction.
Since the model of a catamaran is of symmetric in nature it can be modelled
as a half domain along the central longitudinal axis in order to save the
computational calculation.

34
The domain zones are defined as inlet, outlet, symmetry, top, bottom and side.
Inlet is specified at the front of the domain where the fluid inflow happens and
outlet is named at the rear of the domain.
3.4 Mesh Generation
After the domain is created, Boolean operation is performed to subtract the
model from the domain which represents the whole domain as a single body
rather than two different parts. The next step is to generate a fine meshing over
the created half of the domain. For the accurate mesh the trimmed cell meshing
method was used as it allows for a greater mesh quality and obtaining a good
result of the marine solution as suggested by the STAR CCM+. Trimmed cell
mesh of the half domain for catamaran is shown in Figure 25 and Table 7
representing the meshing details.
Table 7: Trimmed cell mesh details for asymmetrical catamaran model
Cell/Elements 16,76,114
Faces 20,20,196
Minimum size (m) 4×10⁻⁴
Maximum size (m) 8×10⁻¹
Figure 25: Trimmed cell mesh of catamaran CFD domain (Symmetry)

35
3.5 Boundary Condition and Solution Setup
In this study the flow simulation of the model is mainly conducted with the
commercial software of STAR CCM+. The system is considered as three
dimensional steady, incompressible, viscous turbulent flow, and multi-phase
flow. The fluid properties of water are given by Table 8.
Table 8: Fluid properties of fresh water
Kinematic Viscosity, ν 1.005ⅹ10-6 m2/s
Dynamic Viscosity, 8.8871E-4 pa-s
Density, 997.561 kg/m3
The motion of the free surface is governed by gravitational force so does the
gravity effects should be taken into account in the boundary conditions. Since
volume of fluid (VOF) method is suitable for modelling free surface flows
such as ship motion through open water, filling of tank, and sloshing (Jones
and Clarke, 2010), VOF formulation is applied in CFD to solve the multiphase
free surface flows In order to compute the turbulence flow, there are different
turbulence models by default in the CFD package say Standard and Realizable
k-ε models. Those turbulence models based on RANS equation have similar
forms with transport equation of k andε. However the turbulence model of
realizable k-ε two layer method is applied for the computation since it is likely
to provide superior performance compared with standard k-ε two layer model
for flow involving the boundary layers and accurately predicts the spreading
rate of planar. For the real circumstance, multi-phases are chosen for fluid
condition, which are defined as air and water.
36
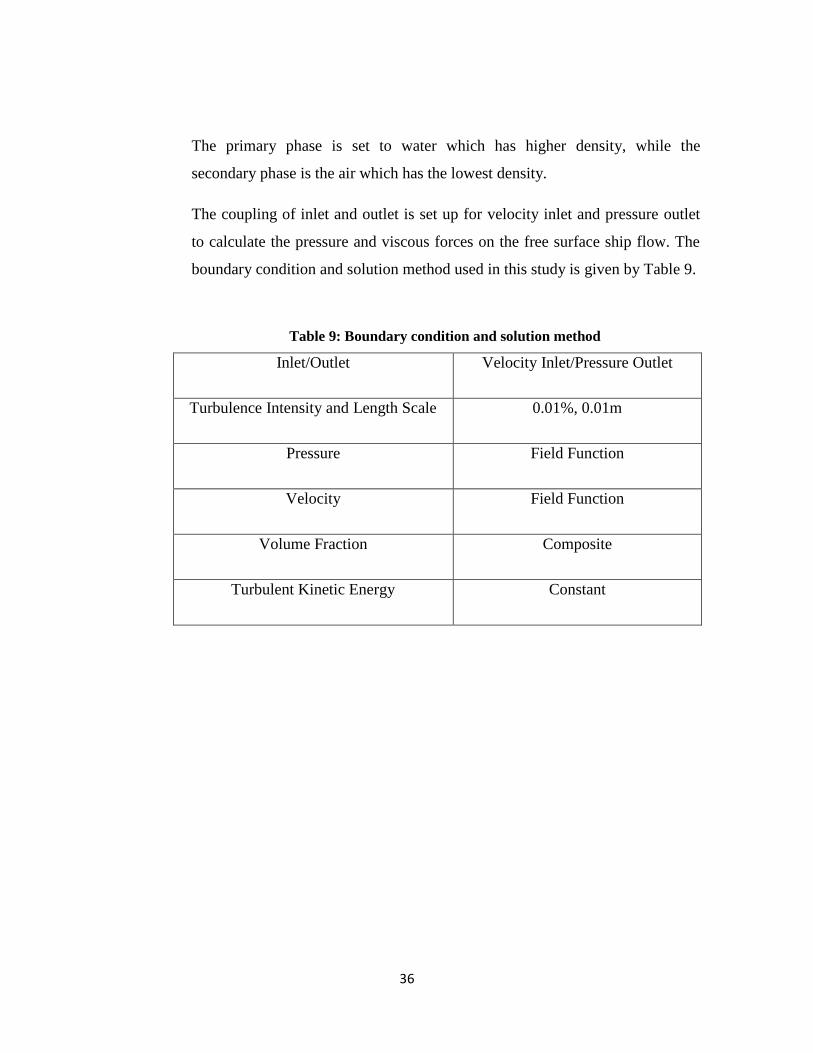
The primary phase is set to water which has higher density, while the
secondary phase is the air which has the lowest density.
The coupling of inlet and outlet is set up for velocity inlet and pressure outlet
to calculate the pressure and viscous forces on the free surface ship flow. The
boundary condition and solution method used in this study is given by Table 9.
Table 9: Boundary condition and solution method
Inlet/Outlet Velocity Inlet/Pressure Outlet
Turbulence Intensity and Length Scale 0.01%, 0.01m
Pressure Field Function
Velocity Field Function
Volume Fraction Composite
Turbulent Kinetic Energy Constant
37
CHAPTER 4
VALIDATION OF CFD
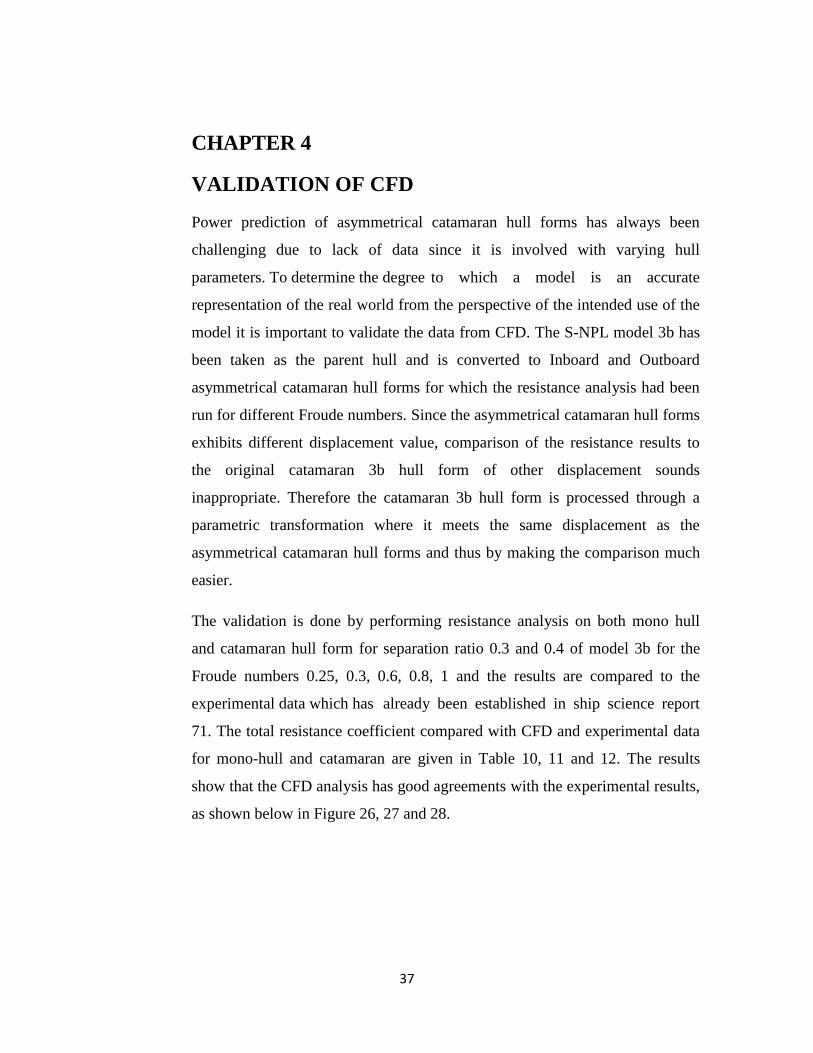
Power prediction of asymmetrical catamaran hull forms has always been
challenging due to lack of data since it is involved with varying hull
parameters. To determine the degree to which a model is an accurate
representation of the real world from the perspective of the intended use of the
model it is important to validate the data from CFD. The S-NPL model 3b has
been taken as the parent hull and is converted to Inboard and Outboard
asymmetrical catamaran hull forms for which the resistance analysis had been
run for different Froude numbers. Since the asymmetrical catamaran hull forms
exhibits different displacement value, comparison of the resistance results to
the original catamaran 3b hull form of other displacement sounds
inappropriate. Therefore the catamaran 3b hull form is processed through a
parametric transformation where it meets the same displacement as the
asymmetrical catamaran hull forms and thus by making the comparison much
easier.
The validation is done by performing resistance analysis on both mono hull
and catamaran hull form for separation ratio 0.3 and 0.4 of model 3b for the
Froude numbers 0.25, 0.3, 0.6, 0.8, 1 and the results are compared to the
experimental data which has already been established in ship science report
71. The total resistance coefficient compared with CFD and experimental data
for mono-hull and catamaran are given in Table 10, 11 and 12. The results
show that the CFD analysis has good agreements with the experimental results,
as shown below in Figure 26, 27 and 28.

38
Table 10: Total resistance coefficients [3b mono-hull]
Fn 103CT (Experimental) 103CT (CFD) Error %
0.25 7.88 7.237 7.0
0.3 8.016 7.322 8.0
0.6 11.292 9.052 19.0
0.8 8.383 6.943 16.0
1 6.91 5.952 13.0
Table 11: Total resistance coefficients [3b Catamaran (s/L-0.3)]
Table 12: Total resistance coefficients [3b Catamaran (s/L-0.4)]
Fn 103CT (Experimental) 103CT (CFD) Error %
0.25 8.432 8.403 0
0.3 8.785 8.800 0
0.6 12.310 9.853 20
0.8 8.316 7.570 9
1 7.391 6.455 13
Fn 103CT (Experimental) 103CT (CFD) Error %
0.25 7.793 8.190 -5
0.3 8.661 8.508 2
0.6 12.480 9.636 23
0.8 8.193 7.476 9
1 6.806 6.109 10

39
0.000
2.000
4.000
6.000
8.000
10.000
12.000
14.000
0.2 0.3 0.4 0.5 0.6 0.7 0.8 0.9 1
10
3C
T
Fn
Catamaran (s/L-0.4)
Experimental CFD
0
2
4
6
8
10
12
0.2 0.3 0.4 0.5 0.6 0.7 0.8 0.9 1
10
3C
T
Fn
Mono hull - 3b
Experimental CFD
Figure 26: Comparison of total resistance coefficients [3b mono-hull]
Figure 27: Comparison of total resistance coefficients [Catamaran (s/L-0.4)]

40
0.000
2.000
4.000
6.000
8.000
10.000
12.000
14.000
0.2 0.3 0.4 0.5 0.6 0.7 0.8 0.9 1
10
3 CT
Fn
Catamaran (s/L-0.3)
Experimental CFD
Figure 28: Comparison of total resistance coefficients [Catamaran (s/L-0.3)]
The wave contours computed by CFD are illuminated by the volume fraction
scheme on the free surface, as shown in Figure 29 and 30
Figure 29: Free surface wave contours at Fn 0.6 [3b mono-hull model]

41
Figure 30: Free surface wave contours at Fn 0.6 [Catamaran (s/L-0.4)]

42
CHAPTER 5
CFD ANALYSIS
5.1 CFD SIMULATION
As a result of good agreement existing between the CFD results and
experimental data for mono hull and catamaran, the asymmetrical catamaran
hull forms are processed in Star CCM+ for computing total resistance values.
The simulations are carried out in the speed range corresponding to Froude
numbers 0.25, 0.3, 0.6, 0.8 and 1 for calculating the total resistance of the
asymmetrical catamaran hull forms. Multiphase boundary condition is set up
which involves the simultaneous flow of two interacting phases and are defined
as air and water as shown in Figure 31.
Figure 31. Two interacting phases [air and water]
Volume of Fluid (VOF) is a simple multiphase model which can be used for
simulating flows of several immiscible fluids possessing a capability of
resolving the interface between the phases of the mixture and thus helping in
no more extra modeling for inter phase interaction. This also should meet the
requirement of each phase taking up large structure of the system itself and
is often used in marine applications.

43
The turbulence model is set up for realizable k-ε two layer method, and the
pressure boundary is chosen for the coupling of inlet and outlet, which
involved the turbulence intensity and length scales setup. Particularly in this
model, the turbulence intensity is set below 1% for external flow, which is a
condition for low turbulence. Figure 32 representing the pressure distribution
in the virtual towing tank that is created in CFD analysis.
Figure 32: Contour of pressure layers
In this study the solver settings are in the pressure-velocity coupling scheme so
that simple scheme applies to the VOF models. When the residuals scale is
converged, the total resistance of asymmetrical catamaran hull configuration
are computed and solved. The residuals scales indicate continuity, k-𝛆, and
velocity scale against iteration, as shown in Figure 33.
Figure 33: Convergence of residual scales

44
The free surface wave counters of Inboard and Outboard asymmetrical
catamaran hull forms for a separation ratio of 0.4 are shown in the Figures 34
and 35 respectively
Fig 34: Free surface wave contours of Inboard Asymmetrical Catamaran (s/L-0.4) at
Fn 0.8
Fig 35: Free surface wave contours of Outboard Asymmetrical Catamaran (s/L-0.4) at Fn 1

45
0
2
4
6
8
10
12
0.2 0.3 0.4 0.5 0.6 0.7 0.8 0.9 1
10
3 CT
Fn
Total Resistance (Asymmetrical, s/L-0.4)
Inboard
Outboard
The results of the total resistance coefficients of the asymmetrical catamaran
model are given by Table 13 and shown in Figure 36, 37 and 38. It indicates
that outboard asymmetrical catamaran exhibits better resistance characteristics
when compared to inboard asymmetrical catamaran for the same separation
ratios at different Froude numbers.
Table 13: Total resistance coefficients of Asymmetrical Catamaran
Fn
Inboard Asymmetrical Outboard Asymmetrical
s/L-0.3 s/L-0.4 s/L-0.3 s/L-0.4
103CT 103CT 103CT 103CT
0.25 7.511 7.9 7.272 7.655
0.3 8.17 8.357 7.89 8.068
0.6 10.211 10.313 9.489 9.603
0.8 7.988 8.022 7.766 7.559
1 6.876 7.042 6.769 6.831
Figure 36: Total resistance coefficients of Asymmetrical catamaran hull [s/L=0.4]

46
0
2
4
6
8
10
12
0.2 0.3 0.4 0.5 0.6 0.7 0.8 0.9 1
10
3 CT
Fn
Total Resistance Comparison
Inboard (s/L-0.3)
Inboard (s/L-0.4)
Outboard (s/L-0.3)
Outboard (s/L-0.4)
0
2
4
6
8
10
12
0.2 0.3 0.4 0.5 0.6 0.7 0.8 0.9 1
10
3 CT
Fn
Total Resistance (Asymmetrical, s/L-0.3)
Inboard
Outboard
Figure 37: Total resistance coefficients of Asymmetrical catamaran hull [s/L=0.3]
Figure 38: Total resistance coefficients of Asymmetrical catamaran hull

47
5.2 Form Factors of Asymmetrical Catamaran
The recommended method for experimental evaluation of the form-factor is
proposed by Prohaska (1966). If the model is tested at very low Froude number
until CT runs parallel with CF as shown in Figure 39. The straight line plot of
CT/CF versus Fr4/CF will intersect Fr=0 at (1+k), making it capable to
determine the form factor, as shown in Figure 40. The wave resistance
coefficient is proportional to Fr4 so that the total resistance is given by equation
(15), and the CT/CF is expressed by equation (16):
CT = (1+k) CF + AFn4 (15)
CT/CF = (1+k) + AFn4/CF (16)
where (1+k) and A are determined from least-square approximation.
Figure 39: Resistance components [Molland et al. (2011)]

48
Figure 40: Prohaska plot [Molland et al. (2011)]
Once we have the values of CT/CF and Fr4/CF and the graphs are plotted a line
tangent to the desired values need to be drawn. The value corresponding to the
ordinate value at x=0 gives the form factor (1+k) value. Unfortunately, this
process of obtaining form factor is only applicable to mono hulls. Couser et al
(1997), has developed an empirical formula which best fits for the round bilge
catamaran hull forms. The expression is given as 17
(1 + βk) = 3.03 (L
∇13
)−0.4
(17)
The Coefficient of frictional resistance is found out by using ITTC 1957 line
and is expressed as 18
CF =0.075
(log10 Rn−2)2 (18)
Therefore the values of form factor (1+k) for round bilge asymmetrical
catamaran hull forms are obtained using the above mentioned formula and
the new frictional coefficient CF values are determined.
5.3 Total resistance of Asymmetrical Catamaran
The total resistance of an Asymmetrical catamaran hull form consists of the
frictional resistance and wave resistance as expressed by equation (19):
As per CFD CT (CFD) = CV+CP
As per calculation CT(cal) = (1 + k)CF + τCW (19)

49
The calculated resistance coefficients with form factor results are given by
Table 14 to 17, and the comparisons are shown in Figure 41 to 44.
Table 14: The calculated resistance coefficients of Inboard Asymmetrical (s/L-0.3)
Fn 1+k 103(1+k)CF 103CP 103CT (CFD) 103CT (Exp)
0.25 1.466 6.238 3.451 9.689 7.792
0.3 1.466 6.009 4.058 10.067 8.661
0.6 1.466 5.245 4.373 9.618 12.479
0.8 1.466 4.970 2.772 7.742 8.193
1 1.466 4.771 1.910 6.681 6.805
Table 15: The calculated resistance coefficients of Inboard Asymmetrical (s/L-0.4)
Fn 1+k 103(1+k)CF 103CP 103CT (CFD) 103CT (Exp)
0.25 1.466 6.238 3.804 10.042 8.432
0.3 1.466 6.009 4.181 10.190 8.785
0.6 1.466 5.245 4.274 9.519 12.309
0.8 1.466 4.970 2.733 7.703 8.316
1 1.466 4.771 1.886 6.657 7.391

50
Table 16: The calculated resistance coefficients of Outboard Asymmetrical (s/L-0.3)
Fn 1+k 103(1+k)CF 103CP 103CT (CFD) 103CT (Exp)
0.25 1.466 6.238 3.812 10.050 7.792
0.3 1.466 6.009 3.795 9.804 8.661
0.6 1.466 5.245 3.912 9.157 12.479
0.8 1.466 4.970 2.685 7.655 8.193
1.0 1.466 4.771 1.871 6.642 6.805
Table 17: The calculated resistance coefficients of Outboard Asymmetrical (s/L-0.4)
Fn 1+k 103(1+k)CF 103CP 103CT (CFD) 103CT (Exp)
0.25 1.466 6.238 3.257 9.496 8.432
0.3 1.466 6.009 3.690 9.700 8.785
0.6 1.466 5.245 3.691 8.936 12.309
0.8 1.466 4.970 2.668 7.639 8.316
1.0 1.466 4.771 1.736 6.507 7.391

51
0.000
2.000
4.000
6.000
8.000
10.000
12.000
14.000
0.2 0.3 0.4 0.5 0.6 0.7 0.8 0.9 1
10
3C
T
Fn
Catamaran (s/L-0.3)
Catamaran Experimental
Catamaran CFD
Inboard Asymmetrical
0.000
2.000
4.000
6.000
8.000
10.000
12.000
14.000
0.2 0.3 0.4 0.5 0.6 0.7 0.8 0.9 1
10
3C
T
Fn
Catamaran (s/L-0.4)
Catamaran Experimental
Catamaran CFD
Inboard Asymmetrical
Figure 41: Comparison of total resistance [Inboard Asymmetrical (s/L-0.3)]
Figure 42: Comparison of total resistance [Inboard Asymmetrical (s/L-0.4)]

52
0.000
2.000
4.000
6.000
8.000
10.000
12.000
14.000
0.2 0.3 0.4 0.5 0.6 0.7 0.8 0.9 1
10
3 CT
Fn
Catamaran (s/L-0.3)
Catamaran Experimental
Catamaran CFD
Outboard Asymmetrical
0.000
2.000
4.000
6.000
8.000
10.000
12.000
14.000
0.2 0.3 0.4 0.5 0.6 0.7 0.8 0.9 1
10
3 CT
Fn
Catamaran (s/L-0.4)
Catamaran Experimental
Catamaran CFD
Outboard Asymmetrical
Figure 43: Comparison of total resistance [Outboard Asymmetrical (s/L-0.3)]
Figure 44: Comparison of total resistance [Outboard Asymmetrical (s/L-0.4)]

53
CHAPTER 6
CONCLUSION
6.1 CONCLUSION
The main objective of this research is to try in drawing out any favorable
results by comparing the resistance values between conventional catamaran
hull forms and modified version in shape and parameters of the same hull
forms. A high-speed and round bilge catamaran hull form, based on the NPL
systematic series, was considered as a parent hull for CFD analysis to
determine the total resistance of the ship while operating at different speeds.
The asymmetrical catamaran models of two different shapes namely
Inboard asymmetrical and Outboard asymmetrical were generated using
Maxsurf modeler and Rhinoceros with two separation ratios (s/L - 0.3 and 0.4).
The analysis purposes can be fulfilled with the existing CFD packages but
there is no assurance over the degree of reliability on the results obtained.
Therefore, analysis for proving the efficacy levels of the CFD is mandatory to
rely on the actual results. So, the analysis has been carried out on the mono hull
and catamaran models with different separation ratios and the results are
compared to the experimental data that has already been established for that
particular models. The CFD package named star CCM+ is used for all the
analysis. Although the results obtained are not as accurate as the experimental
results, still the curve shows the same trend as the experimental values and
hence making a decent reliability degree of the CFD package.
With good agreements between experimental results and CFD investigation
data, the total resistance coefficients of asymmetrical catamaran hull forms
hull forms were computed. The results obtained from this analysis shows that
the total resistances characteristics exhibited by outboard asymmetrical

54
catamaran model is better when compared to the Inboard asymmetrical
catamaran model irrespective of the separation ratio.
In addition, with the obtained total resistance, the form factors of asymmetrical
catamaran models were found using the Couser et al (1997) empirical method.
The results showed reduction of form factor for asymmetrical catamaran hull
forms when compared to the conventional catamaran hull forms. With the
obtained form factor, the total frictional resistance is calculated again and CFD
results were compared with the experimental results.
Table 18: Form factors of Catamaran Hull models
Model
Form factors
(1+k)
Normal Catamaran 1.506
Asymmetrical Catamaran 1.466
In conclusion, the CFD results obtained from this research shows that the
characteristics of total resistance exhibited by asymmetrical catamaran are less
when compared to experimental results of the conventional catamarans at
Froude numbers greater than 0.5 and thus making a significant difference in
performance at high-speeds. Due to ambiguity of the results between Froude
number ranging between 0.4 - 0.6, a finer analysis is recommended to carry out
in obtaining a closer look over the fluctuation of the resistance at high-speed
transition range. Also CFD reveal a significant consistency with the validation
process which involved the experimental data. Therefore, the process of this
study provides the advantages of economy of time and cost consumption in the
relevant fields.

55
6.2 Future Work
This thesis is limited to the investigation of only model 3b of catamaran having
round bilge hull form and transom stern configuration with the separation
ratio between center hull and side hull of 0.3 and 0.4. So, the analysis can be
performed on rest of the existing models of NPL round bilge hull forms by
having more separation ratios which helps in understanding better about the
interference effects. This analysis is made only on two asymmetrical
configurations without any different configurations such as staggered positions
of the demi-hulls. One can perform analysis by having different configurations
as mentioned in the earlier statement. Although the resistance characteristics
has been analyzed by promising a better performance than conventional
catamaran hull forms this thesis didn’t look up in detail about the stability and
structure of the asymmetrical catamarans. Therefore, one got to have an insight
about the stability and structural aspects in detail. If that does work it evolves
as economically feasible by having less material and construction cost of the
vessel. Also these CFD analysis can be performed on other systematic series of
hull forms such as AMECRC hull forms or VWS hard chine hull forms.

56
REFERENCES
Antonio, C., Corrado D., Giuseppe, L., Antonio, M., Gabriele,V.M (2013),
“CFD Study of an Innovative Catamaran with Asymmetrical Hulls.”
Advances in Water Resource and Protection (AWRP), Vol 1, Issue 1.
Chengyi, W., (1994), “Resistance Characteristic of High-speed Catamaran
and its Application.” Marine Design and Research Institute of China.
Couser, P.R., Molland, A.F., Armstrong, N.A. and Utama, I.K.A.P., (1997),
“Calm Water Powering Prediction for High-Speed Catamarans.”
Proceedings of 4th International Conference on Fast Sea Transportation,
FAST’97, Sydney.
Holtrop, J., (1984), “A statistical Re-Analysis of Resistance and Propulsion
Data.” International Shipbuilding Progress, Vol 31, No 363, pp. 166-170.
ITTC. "ITTC Recommended Procedure, Resistance Test." (2008), 7.5-02-
02-01.
Jones, D. A. and Clark, D. B. (2010), "Fluent Code of Flow around Naval
Hull: The DTMB 5415", Defense Science and Technology Organization,
DSTO TR-2465.
Larsson, L. and Baba, E., (1996), “Ship Resistance and Flow
Computations.” Advances in Marine Hydrodynamics, M.Ohkusu (ed.),
Comp.Mech. Publ.
Mahmood, S. (2011), "Resistance Calculations of Trimarna Hull Form
Using Computational Fluid Dynamic", 2011 IEEE, pp. 81-85.
Millward, A., (1992), “The Effect of Hull Separation and Restricted Water
Depth on Catamaran Resistance.” The Royal Institution of Naval Architects.
Molland, A.F., Wellicome, J.F. and Couser, P.R., (1994), "Resistance
Experiments on a Systematic Series of High-Speed Displacement
Catamaran Forms: Variation of Length-Displacement Ratio and Breadth-
Draught Ratio." Ship Science Report 71

57
Molland, A.F., Turnock, S.R. and Hudson, D.A. (2011), "Ship Resistance and
Propulsion: Practical Estimation of Ship Propulsive Power." Cambridge
University Press, New York.
Moraes, H.B., Vasconcellos, J.M., Latorre, R.G., (2004), “Wave Resistance
for High-speed Catamarans.” Ocean Engineering, Vol 31, Issues 17-18, pp.
2253-2282
Pham, X.P., Kantimahanthi, K. and Sahoo, Prasanta, K., (2001), “Wave
Resistance Prediction of Hard-chine Catamarans through Regression
Analysis.” Proceedings of the 2nd International Euro Conference on High
Performance Marine Vehicles (HIPER ’01). Hamburg, Germany, pp. 382-394.
Prohaska, C. (1966), "A simple method for evaluation of form factor and
the low speed wave resistance", Proc. 11th ITTC, pp. 65-66.
Sahoo, Prasanta K., Salas, Marcos and Schwetz, Adam, (2007), “Practical
Evaluation of Resistance of High-speed Catamaran Hull Forms – Part I.”
Ships and Offshore Structures, Vol. 2, No. 4, pp. 307-324
Sahoo, Prasanta K., Mason, S. and Tuite, A., (2008), “Practical Evaluation of
Resistance of High-speed Catamaran Hull Forms – Part II.” Ships and
Offshore Structures, Vol. 3, No. 3, pp. 239-245
Sahoo, Prasanta, K., Browne, N.A. and Salas, M., (2004), “Experimental and
CFD study of Wave Resistance of High-speed Round Bilge Catamaran
Hull Forms.” Proceedings of the 4th International Conference on High-
Performance Marine Vehicles (HIPER ’04). Rome, Italy, pp. 55-67.
Sampson, R., Atlar, M., Mantouvalos, A., Danisman, B., Goren, O., (2005), “A
Practical Power Prediction of an Asymmetric Catamaran Hull Form.”
Maritime Transportation and Exploitation of Ocean and Coastal Resources –
Guedes Soares, Garbatov and Fonseca (eds) © Taylor and Francis Group,
London, ISBN 0 415 39036 2.
Schneekluth. H. and Bertram, V., (2002), “Ship Design for Efficiency and
Economy.” Butterworth-Heinemann, Oxford.
STAR CCM+ 10.02.012, (2014), "STAR CCM+ User Guide." CD-adapco,
U.S.A.

58
White, Frank M., (1991), “Viscous Fluid Flow-Second Edition”, McGraw-
Hill International Editions, Mechanical Engineering Series.
Zips, J.M., (1995), “Numerical Resistance Prediction Based on the Results of
the VWS Hard Chine Catamaran Hull Series’89.” 3rd Fast Sea
Transportation Conference (FAST), Lubeck-Travemunde.

59
Appendix A:
Hydrostatics of catamaran model
Table A.1: Hydrostatics of catamaran 3b Model
Displacement [kg] 33.3
Wetted Surface Area [m2] 0.874
Draft (main) [m] 0.107
Block Coefficient
0.397
Length-Beam Ratio (L/B) 3.495
Beam-Draft Ratio (B/T)
3.981
L/𝛁𝟏
𝟑
4.966
Table A.2: Hydrostatics of Asymmetrical catamaran Model
Displacement [kg] 16.4
Wetted Surface Area [m2] 0.597
Draft (main) [m] 0.107
Block Coefficient
0.383
Length-Beam Ratio (L/B)
8.33
Beam-Draft Ratio (B/T)
1.794
L/𝛁𝟏
𝟑
6.264

60
Appendix A: Hydrostatics of catamaran model
Table A.3: Hydrostatics of catamaran of Equal Displacement Model
Displacement [kg] 16.4
Wetted Surface Area [m2] 0.597
Draft (main) [m] 0.107
Block Coefficient
0.383
Length-Beam Ratio (L/B)
4.743
Beam-Draft Ratio (B/T)
2.719
L/𝛁𝟏
𝟑
5.729
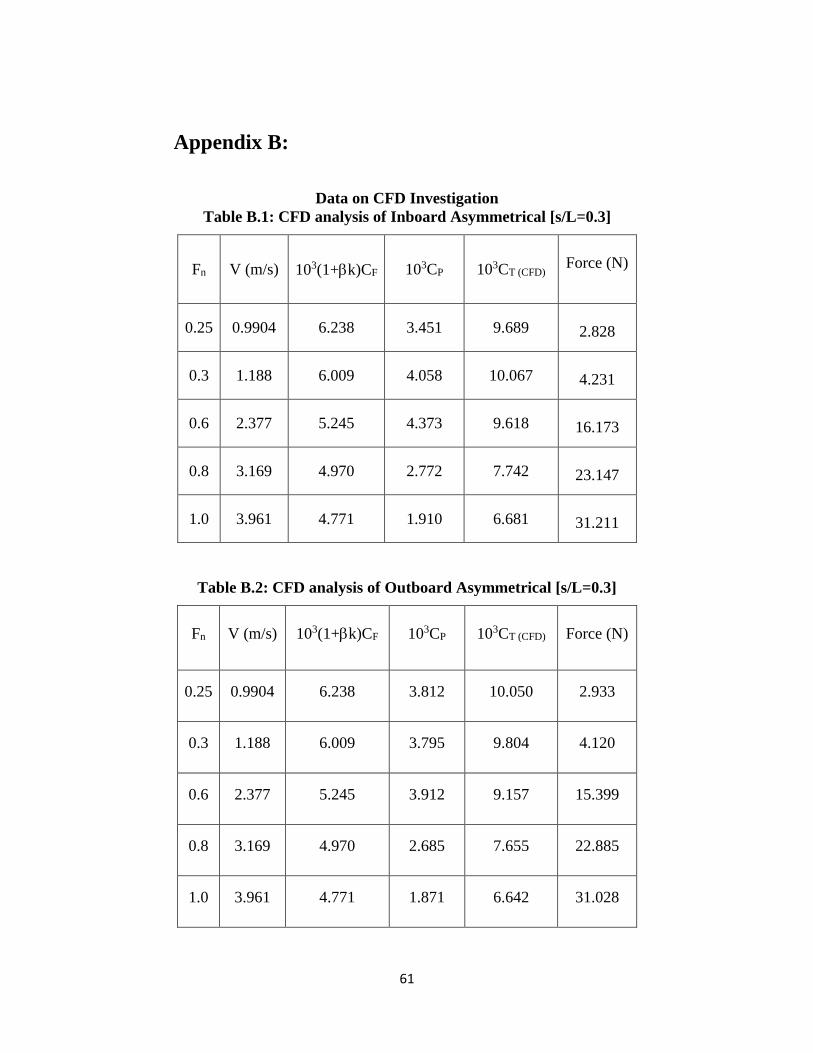
61
Appendix B:
Data on CFD Investigation
Table B.1: CFD analysis of Inboard Asymmetrical [s/L=0.3]
Fn V (m/s) 103(1+k)CF 103CP 103CT (CFD)
Force (N)
0.25 0.9904 6.238 3.451 9.689
2.828
0.3 1.188 6.009 4.058 10.067
4.231
0.6 2.377 5.245 4.373 9.618
16.173
0.8 3.169 4.970 2.772 7.742
23.147
1.0 3.961 4.771 1.910 6.681
31.211
Table B.2: CFD analysis of Outboard Asymmetrical [s/L=0.3]
Fn V (m/s) 103(1+k)CF 103CP 103CT (CFD) Force (N)
0.25 0.9904 6.238 3.812 10.050 2.933
0.3 1.188 6.009 3.795 9.804 4.120
0.6 2.377 5.245 3.912 9.157 15.399
0.8 3.169 4.970 2.685 7.655 22.885
1.0 3.961 4.771 1.871 6.642 31.028

62
Table B.3: CFD analysis of Inboard Asymmetrical [s/L=0.4]
Fn V (m/s) 103(1+k)CF 103CP 103CT (CFD) Force (N)
0.25 0.9904 6.238 3.804 10.042 2.931
0.3 1.188 6.009 4.181 10.190 4.283
0.6 2.377 5.245 4.274 9.519 16.007
0.8 3.169 4.970 2.733 7.703 23.030
1.0 3.961 4.771 1.886 6.657 31.009
Table B.4: CFD analysis of Outboard Asymmetrical [s/L=0.4]
Fn V (m/s) 103(1+k)CF 103CP 103CT (CFD) Force (N)
0.25 0.9904 6.238 3.257 9.496 2.772
0.3 1.188 6.009 3.690 9.700 4.077
0.6 2.377 5.245 3.691 8.936 15.027
0.8 3.169 4.970 2.668 7.639 22.836
1.0 3.961 4.771 1.736 6.507 30.399

63
Table B.5: CFD analysis of mono hull 3b model
Fn V (m/s) 103CT 103CP 103CV Force(N)
0.25 0.9904 7.237 2.981 4.255 1.55
0.3 1.188 7.322 3.223 4.099 2.258
0.6 2.377 9.052 5.474 3.577 11.168
0.8 3.169 6.943 3.552 3.390 15.227
1.0 3.961 5.952 2.697 3.254 20.4
Table B.6: CFD analysis of catamaran 3b model [s/L=0.3]
Fn V (m/s) 103CT 103CP 103CV Force(N)
0.25 0.9904 8.19 3.599 4.671 2.0624
0.3 1.188 8.508 4.020 4.322 3.085
0.6 2.377 9.636 4.800 4.835 13.976
0.8 3.169 7.476 3.048 4.272 19.277
1.0 3.961 6.109 1.785 4.323 24.613

64
Table B.7: CFD analysis of catamaran 3b model [s/L=0.4]
Fn V(m/s) 103CT 103CP 103CV Force(N)
0.25 0.9904 8.403 3.729 4.659 2.116
0.3 1.188 8.800 4.294 4.522 3.191
0.6 2.377 9.853 4.387 5.467 14.292
0.8 3.169 7.570 2.795 4.616 19.52
1.0 3.961 6.455 1.970 4.431 26.010
Copyright © 2022 FDOKUMEN