Numerical Investigation of the Asymmetrical Vortex Combustor ...
Upload
khangminh22Category
view
1download
0
�����������������
Citation: Bulej, V.; Kuric, I.; Sága, M.;
Vaško, M.; Ságová, Z.; Bartoš, M.;
Legutko, S. Analysis of
Symmetrical/Asymmetrical Loading
Influence of the Full-Suspension
Downhill Bicycle’s Frame on the
Crack Failure Formation at a Critical
Point during Different Driving
Scenarios and Design Improvement.
Symmetry 2022, 14, 255. https://
doi.org/10.3390/sym14020255
Academic Editor:
Kateryna Kravchenko
Received: 1 November 2021
Accepted: 8 January 2022
Published: 28 January 2022
Publisher’s Note: MDPI stays neutral
with regard to jurisdictional claims in
published maps and institutional affil-
iations.
Copyright: © 2022 by the authors.
Licensee MDPI, Basel, Switzerland.
This article is an open access article
distributed under the terms and
conditions of the Creative Commons
Attribution (CC BY) license (https://
creativecommons.org/licenses/by/
4.0/).
symmetryS S
Article
Analysis of Symmetrical/Asymmetrical Loading Influence ofthe Full-Suspension Downhill Bicycle’s Frame on the CrackFailure Formation at a Critical Point during Different DrivingScenarios and Design ImprovementVladimír Bulej 1,* , Ivan Kuric 1, Milan Sága 2 , Milan Vaško 2 , Zuzana Ságová 1, Michal Bartoš 1
and Stanislaw Legutko 3
1 Department of Automation and Production Systems, Faculty of Mechanical Engineering, University of Žilina,Univerzitna 8215/1, 010 26 Zilina, Slovakia; [email protected] (I.K.);[email protected] (Z.S.); [email protected] (M.B.)
2 Department of Applied Mechanics, Faculty of Mechanical Engineering, University of Žilina,Univerzitna 8215/1, 010 26 Zilina, Slovakia; [email protected] (M.S.);[email protected] (M.V.)
3 Institute of Mechanical Technology, Faculty of Mechanical Engineering, Poznan University of Technology,3 Piotrowo Street, 60-965 Poznan, Poland; [email protected]
* Correspondence: [email protected]; Tel.: +421-41-513-2811
Abstract: The article deals with the analysis of the existing full-suspension downhill bicycle’s framedamaged while using and the subsequent conceptual improved design of the critical point. Theorigin of symmetrical and asymmetrical bicycle loads in individual riding modes is investigated.Subsequently, their impact on the overall load of the frame and especially the identified critical pointare assessed. An overview of different full-suspension bicycle frames, complemented by a literatureoverview of research related to cycling engineering and sport application is introduced. The firstphase began with a kinematic analysis of the bicycle suspension system and an effect assessment ofthe symmetrical or asymmetrical distribution of forces, respectively, in the individual components.Furthermore, a strength analysis of the main frame was performed, taking into account the staticand dynamic forces. Based on the results of the analyses performed in the ANSYS/Workbench, acritical frame point, as well as the role of individual driving regimes, were identified. The structuraldetail of the pocket under the saddle tube together with the asymmetrical combined load generatedwhile out of saddle pedalling proved to be crucial for frame crack initiation and formation. Differentdesign variants with improved stiffness were proposed for the given place. The chosen variant canbe successfully implemented due to the final reduction of the maximum stress level approximatelytwo times compared to the original pocket (only 50.4% of the original maximum stress) as well as asimple design and repair of the damaged area in terms of technology.
Keywords: full suspension bike frame; case study; conceptual design; static structural analysis; stressanalysis; bicycle frame analysis; critical point improvement
1. Introduction
In recent years, biking has become an increasingly common relaxation activity andsport. Its popularity has increased even more in 2020 due to the difficult conditions ofthe coronavirus pandemic in which the collective sports are subjected to strong restric-tions so individual sports present an alternative. The modern bicycle consists of a frameequipped with other components including handle-bars, brakes, wheels, pedals, and gears,in various configurations for different modes of cycling. Atkinson et al. [1], Bartoš [2],Macdermid et al. [3] and others mentioned that in general there are three main objectivesin cycling science:
Symmetry 2022, 14, 255. https://doi.org/10.3390/sym14020255 https://www.mdpi.com/journal/symmetry

Symmetry 2022, 14, 255 2 of 28
• To optimize the technical equipment (the bicycle itself and its mechanical properties,suspension, frame, material base, kinematics; wearing, ventilation and thermal regula-tion; safety elements, etc.) to reach the highest possible performance, total efficiency,and safety [2–17];
• To identify the various human factors (human body parameters and genetic predic-tions), environmental factors (terrain, temperature, humidity, sunlight, wind), otherexternal factors (for instance cycling nutrition) that have a significant influence oncycling power output or velocity, and, often, complex interrelationships between thesefactors [1,18–21];
• To suggest future directions for research to help clarify how cycling performance canbe optimized, given different race disciplines, environments and riders, application ofprogressive technologies, etc., [22–26].
Nowadays, there is strong research being conducted in areas related to cyclo-engineering, e.g., in designing new frames [4,5], suspension mechanism components [6,7],stiffness analysis [8–11], kinematic and dynamic analysis [12–15], material/technology de-velopment [8,16,17], study the relationship between the bicycle and the cyclist’s body [18,19]as well as safety analysis and improvement [19,20]. These topics are also related to othergeneral areas such as medicine and healthcare, material science, aerodynamics, greenenergies, additive technologies, etc.
The mechanical properties of a final bicycle can be considered as one of the key factorsthat influence sports results for the discipline of mountain-bike design [4–17]. Some designconcepts for bicycle frames can significantly increase fatigue safety and rigid performance.Cheng et al. [4] oriented their study on stress analysis, fatigue testing and simulation,improving the safety factor, as well as the weight of on-road bicycle frame via simulationresults from ANSYS/Workbench software. The main advantage of these simulations is thatfatigue safety and bicycle performance can be predicted and estimated during the designphase which can have a significantly positive influence on cost reduction in the productionphase. Covill et al. [9] determined the static FEM analysis of standard steel bicycle framesunder a range of loads and under different conditions. Outlined in [10] there is an FEMmodel using beam elements to represent a road bicycle frame under two standard loadingconditions to understand the vertical compliance and lateral stiffness characteristics of82 existing bicycle frames from the bicycle’s geometry. Other authors, e.g., Gupta andRao [11], studied the stress distribution and deformations in a mountain bicycle frameunder steady-state pedalling including horizontal and vertical impacts. As Liu et al. [12]mentioned, the total stiffness and final performance were significantly influenced not onlyby the main frame, but also the frontal/rear shock absorber as a quality of the weldedjoints production. Their failure can bring serious injuries to the cyclist. Virgala et al. [13]and Kelemen et al. [14], respectively, address their research on kinematics performanceand the strength analysis of designed mechanisms. Other authors, e.g., Redfield [15], dealwith bond graph modeling of a mountain bike (mainly for hard-tail bikes) and the rider inorder to obtain a baseline prediction for bicycle properties. Computer simulation is a verystrong tool for bicycle designers [16,17]; however, Atkinson [1] and others have pointed outthat the application of different sensors (bicycle-mounted strain gauges) directly on a bikeduring the races is starting to play a significant role as well. This approach can provideverification of the simulation results with real data.
In recent years, several other development trends have been visible that affect themechanical properties, dimensioning, and utility values of bicycles such as using electricbicycles, modern production technologies, and control methods. During the last five years,the popularity of electro-bicycles, also known as e-bikes, has increased dramatically andtheir prevalence among non-professional users has increased as well. This kind of bicyclehas some specific characteristics, e.g., different mass, forces and torques distribution, totalweight. Thus, there is expected to be increasing scientific interest in this area as well.Xiao et al. [5] applied the topology optimization methods to generate robust electric bicyclemain frames by optimizing the material distribution subject to the constraints and dynamic

Symmetry 2022, 14, 255 3 of 28
loads. The role and usage of progressive production technologies and equipment areconstantly increasing every year regarding the cheaper and faster production of new, oftenadvanced shaped parts. In the last few years, many so-called additive techniques havereached the quality and parameters (stiffness, precision, etc.) required for real application invehicle design [22]. Sniehotta [23] deals with the possibility of using 3D printing to producebelt wheels and other parts of bikes. In order to achieve the required strength and othertechnical parameters, it is essential that key structural elements are correctly designed butalso correctly manufactured. This can be verified by a quality check. One of the innovativeapproaches consists of combining robotic arm-based measurements with 3D geometrymathematical models for bicycle frames, a quality check described by Lin 2019 et al. [25].
The dumping of bicycle vibrations excited while driving (mainly in rough terrain)can be considered as the second priority in research focused on bicycle design. A seriesof studies with both numerical simulation and small laboratory experimental models ofbio-inspired features, for instance, dumpers, have been conducted by Yang et al. [26]The results are promising because they improved vibration reduction performance ofsuspension system for cyclo-design over traditional passive systems. Zuraulis et al. [21]investigated the impact of road roughness on the duration of contact between the vehicle(car, motorbike, bike) wheel and a road surface.
Finally, as was mentioned above, the cyclo-design is related not only to the mechanicalproperties of the bicycles but also to human body kinematics and medicine. Researchon the medical aspects of cycling focuses on several goals. Chacon-Murguia et al. [18]proposed a method for human gait and leg motion kinematic analysis via a study of camerarecords. The investigation of the locomotion of multibody moving systems was aimedat by authors like Virgala et al. [13] and Macdermid [3]. Mellion, et al. looked at therelationship between cycling and medicine aspects in a more detailed article [19]. Thework of Liu et al. [6] where they proposed ADAMS/LifeMOD software to establish abicycle-human integrated multibody dynamic model can be mentioned as an exampleof research concerned with investigating the impact of bicycle suspensions on cyclist’sleg muscle forces. Maier et al. [7] focus their research on the design and validation of amulti-body model of a front suspension bicycle and a passive rider for the investigation ofbraking dynamics.
Thus, it can be seen that cycling is a very complex area composed of many aspects.However, in our article, we will further focus on stress analysis and consequent opti-mization of the critical points of the full-suspension mountain bike, concretely the bikeNukeproof Pulse Pro, version 2018 [27].
2. Analysis of the Investigated Bicycle Frame—Condition and Background
The general full-suspension mountain bicycle (Figure 1) differs from the traditionalhardtail mountain bike in that it is equipped with a front suspension fork and a rearsuspension system (composed of damper for shock absorbing and spring for rebounding)as well. The suspension system increases the comfort together with the safety of theride when riding on rough terrain. These systems differ in complexity (due to a highernumber of elements depending on the used suspension system) and the resulting drivingcharacteristics. A common sign of all full suspension bicycles is the independent suspensionof not only the front but also the rear wheel via the front and rear fork (rear triangle) withrespect to the front frame triangle (main frame). The rear triangle is attached to main frameby a suspension system with one degree of freedom consisting of pins, rocker arms, anda shock absorber. It is the structure of the rear triangle, its assembly and geometry, thataffects the ride characteristics the most. The rear triangle moves vertically via dumping theinertia forces (rider’s and bicycle weight) when driving in terrain unevenness and, further,this vertical motion is distributed to the shock absorber by a pivot and rocker system. Theshock absorber is a flexible element in the kinematics of the rear fork designed to absorbany forces and vibrations, slow down the rear triangle motion, dampen the compression,
Symmetry 2022, 14, 255 4 of 28
and regulate the subsequent speed of return to its original position (bounce) and thusincrease comfort.
Symmetry 2022, 14, x FOR PEER REVIEW 4 of 29
the inertia forces (rider’s and bicycle weight) when driving in terrain unevenness and, further, this vertical motion is distributed to the shock absorber by a pivot and rocker system. The shock absorber is a flexible element in the kinematics of the rear fork designed to absorb any forces and vibrations, slow down the rear triangle motion, dampen the com-pression, and regulate the subsequent speed of return to its original position (bounce) and thus increase comfort.
Figure 1 shows the basic features of the general full suspension bike frame as well as introduces the different suspension systems designed by different bicycle manufacturers. Table 1 compares the advantages and disadvantages of the most used suspension systems (some of them shown in Figure 1), as well as the companies using these types of suspen-sion systems.
Figure 1. Basic features of general full suspension bike frame and different suspension systems com-parison: (A)—Split Pivot on bicycle Trek Slash, (B)—Unified Rear Triangle (URT) system on Schwinn Homegrown, (C)—High Pivot on Commencal Supreme bike, (D)—Horst Link “FSR” on Specialized Enduro, (E)—Scott Gambler based on One pivot with levering/floating link system (based on [2]; illustration composed of individual images, sources: www.trek.com (accessed on 10 December 2019), www.scott.com (accessed on 5 May 2019), www.specialized.com (accessed on 8 June 2019), www.commencal.com (accessed on 10 October 2020).
The investigated frame of the Nukeproof Pulse Pro/version 2018 bicycle (Figure 2) consists of four main components shown in Figure 3 connected to each other by pins and bearings. The so-called “one pivot suspension with additional levering system” (see Table 1) is used where the fixed rear triangle rotates around the joint called the main bearing located in the front frame triangle over the crankset bottom bracket or crank spindle (Figure 2). The forces exerting the damper (shock absorber) with a total body length of 250 mm and a working stroke of 75 mm are transmitted from the rear wheel through to the rod and rocker arm. By using such suspension and geometry, the 210 mm rear wheel is able to travel.
Figure 1. Basic features of general full suspension bike frame and different suspension systemscomparison: (A)—Split Pivot on bicycle Trek Slash, (B)—Unified Rear Triangle (URT) system onSchwinn Homegrown, (C)—High Pivot on Commencal Supreme bike, (D)—Horst Link “FSR” onSpecialized Enduro, (E)—Scott Gambler based on One pivot with levering/floating link system(based on [2]; illustration composed of individual images, sources: www.trek.com (accessed on 10December 2019), www.scott.com (accessed on 5 May 2019), www.specialized.com (accessed on 8 June2019), www.commencal.com (accessed on 10 October 2020).
Figure 1 shows the basic features of the general full suspension bike frame as wellas introduces the different suspension systems designed by different bicycle manufactur-ers. Table 1 compares the advantages and disadvantages of the most used suspensionsystems (some of them shown in Figure 1), as well as the companies using these types ofsuspension systems.
The investigated frame of the Nukeproof Pulse Pro/version 2018 bicycle (Figure 2)consists of four main components shown in Figure 3 connected to each other by pins andbearings. The so-called “one pivot suspension with additional levering system” (see Table 1)is used where the fixed rear triangle rotates around the joint called the main bearing locatedin the front frame triangle over the crankset bottom bracket or crank spindle (Figure 2).The forces exerting the damper (shock absorber) with a total body length of 250 mm and aworking stroke of 75 mm are transmitted from the rear wheel through to the rod and rockerarm. By using such suspension and geometry, the 210 mm rear wheel is able to travel.

Symmetry 2022, 14, 255 5 of 28
Table 1. Comparison of suspension systems [2].
SuspensionSystem Advantages Disadvantages Company
One pivot very simple, minimumservice requirements
bad pedalling responsemoving is affecting
by braking
Dewilwork,Morewood, SantaCruz, Canondale
One pivotwith levering
better regulation of theapplied force on
the damper
moving is affecting bybraking, moving of reartringle when pedalling
Merida, Kona, Trek,Transition, Scott
One-pivotHigh Pivot
eliminated impact ofbraking to suspension
long length of chain,higher weight, used just
with downhill bikesCommencal, Scott
Four-pivotHorst Link
simple system, almost nopedalling squat
suspension is sensitive tosmall terrain unevenness,
affected by braking
Canyon, Radon,Specialized, Norco
Four-pivotSplit pivot
the best drivability, asmall drop of the rear
triangle when pedalling,removes brake squat
higher weight,patent litigation
Pivot, Morewood,Trek
Four-pivotTwin link
balanced movement,suspension flexibility,almost no suspension
moving when pedalling
higher weight, highermaintenancerequirements
Santa Cruz,Ibis, Giant
Symmetry 2022, 14, x FOR PEER REVIEW 5 of 29
Table 1. Comparison of suspension systems [2].
Suspension
System Advantages Disadvantages Company
One pivot very simple, minimum ser-
vice requirements
bad pedalling response moving is affecting by
braking
Dewilwork, Morewood, Santa Cruz, Canondale
One pivot with levering
better regulation of the ap-plied force on the damper
moving is affecting by braking, moving of rear tringle when pedalling
Merida, Kona, Trek, Transition,
Scott
One-pivot High Pivot
eliminated impact of brak-ing to suspension
long length of chain, higher weight, used just
with downhill bikes
Commencal, Scott
Four-pivot Horst Link
simple system, almost no pedalling squat
suspension is sensitive to small terrain unevenness,
affected by braking
Canyon, Radon, Specialized,
Norco
Four-pivot Split pivot
the best drivability, a small drop of the rear triangle
when pedalling, removes brake squat
higher weight, patent liti-gation
Pivot, More-wood, Trek
Four-pivot Twin link
balanced movement, sus-pension flexibility, almost
no suspension moving when pedalling
higher weight, higher maintenance requirements
Santa Cruz, Ibis, Giant
Figure 2. 3D model of investigated bicycle frame.
(a) (b) (c) (d)
Figure 3. Original frame and suspension system components: front triangle (a), rear triangle with the main bearing (b), rod (c), and rocker arm (d). The dimensions are shown below (further figures).
Figure 2. 3D model of investigated bicycle frame.
Symmetry 2022, 14, x FOR PEER REVIEW 5 of 29
Table 1. Comparison of suspension systems [2].
Suspension
System Advantages Disadvantages Company
One pivot very simple, minimum ser-
vice requirements
bad pedalling response moving is affecting by
braking
Dewilwork, Morewood, Santa Cruz, Canondale
One pivot with levering
better regulation of the ap-plied force on the damper
moving is affecting by braking, moving of rear tringle when pedalling
Merida, Kona, Trek, Transition,
Scott
One-pivot High Pivot
eliminated impact of brak-ing to suspension
long length of chain, higher weight, used just
with downhill bikes
Commencal, Scott
Four-pivot Horst Link
simple system, almost no pedalling squat
suspension is sensitive to small terrain unevenness,
affected by braking
Canyon, Radon, Specialized,
Norco
Four-pivot Split pivot
the best drivability, a small drop of the rear triangle
when pedalling, removes brake squat
higher weight, patent liti-gation
Pivot, More-wood, Trek
Four-pivot Twin link
balanced movement, sus-pension flexibility, almost
no suspension moving when pedalling
higher weight, higher maintenance requirements
Santa Cruz, Ibis, Giant
Figure 2. 3D model of investigated bicycle frame.
(a) (b) (c) (d)
Figure 3. Original frame and suspension system components: front triangle (a), rear triangle with the main bearing (b), rod (c), and rocker arm (d). The dimensions are shown below (further figures).
Figure 3. Original frame and suspension system components: front triangle (a), rear triangle with themain bearing (b), rod (c), and rocker arm (d). The dimensions are shown below (further figures).
2.1. Investigated Frame Damage
Figure 4a shows the specific location of the front triangular frame where the damageoccurred during use and will therefore be studied. The damaged area is located nearthe “pocket” on the welded part (red box). The pocket is designed as a free space wherethe linkage and rocker arm move during the operation of the suspension system. InFigure 4b–d, there is shown a series of detailed photographs from different angles showing

Symmetry 2022, 14, 255 6 of 28
the exact location of the frame break (arrows). The material is cracked in both ribs andpasses through the entire thickness of the material (4 mm at the investigated point). Thecreated crack has a length of approximately 20 mm.
Symmetry 2022, 14, x FOR PEER REVIEW 6 of 29
2.1. Investigated Frame Damage
Figure 4a shows the specific location of the front triangular frame where the damage occurred during use and will therefore be studied. The damaged area is located near the “pocket” on the welded part (red box). The pocket is designed as a free space where the linkage and rocker arm move during the operation of the suspension system. In Figure 4b–d, there is shown a series of detailed photographs from different angles showing the exact location of the frame break (arrows). The material is cracked in both ribs and passes through the entire thickness of the material (4 mm at the investigated point). The created crack has a length of approximately 20 mm.
(a) (b) (c) (d)
Figure 4. Researched location of damaged place on the front triangle (a) and a detailed view of the damage from different angles (b–d) [2].
2.2. Frame Kinematics and Motion Analysis
The kinematics of a full suspension bicycle frame are usually made up of a system of “tubes” and rocker bars connected by pins. The frame kinematics define how the wheel moves throughout the full stroke, determine the rear wheel response on terrain uneven-ness, and transform this motion into shock absorber compression. In order to understand motion kinematics as a set of properties for different design solutions, it is important to define some general terms (see Figure 5) [28]:
Pivot—rotary connection of two bodies by means of a pin and a bearing, e.g., nodes A, B, C, D.
Link—an imaginary rod—a part connecting two pivots. The bodies 2, 3 and 4. Travel—the maximum vertical wheel motion, whether rear or front one, usually in
millimetres or inches. Mountain bike categories differ in stroke size, typically ranging from 80 mm (XC models) up to 250 mm (downhill specials). Front fork travel ranges from 80 to 200 mm.
Stroke (traveling)—value indicating maximum damper extension/compression in millimetres. For instance, the damper with “215 × 63” has 63 mm of stroke and a total unloaded length of 215 mm.
Figure 5. Simplified structure of rear triangle and suspension—general terms explanation.
Figure 4. Researched location of damaged place on the front triangle (a) and a detailed view of thedamage from different angles (b–d) [2].
2.2. Frame Kinematics and Motion Analysis
The kinematics of a full suspension bicycle frame are usually made up of a system of“tubes” and rocker bars connected by pins. The frame kinematics define how the wheelmoves throughout the full stroke, determine the rear wheel response on terrain unevenness,and transform this motion into shock absorber compression. In order to understand motionkinematics as a set of properties for different design solutions, it is important to definesome general terms (see Figure 5) [28]:
Symmetry 2022, 14, x FOR PEER REVIEW 6 of 29
2.1. Investigated Frame Damage
Figure 4a shows the specific location of the front triangular frame where the damage occurred during use and will therefore be studied. The damaged area is located near the “pocket” on the welded part (red box). The pocket is designed as a free space where the linkage and rocker arm move during the operation of the suspension system. In Figure 4b–d, there is shown a series of detailed photographs from different angles showing the exact location of the frame break (arrows). The material is cracked in both ribs and passes through the entire thickness of the material (4 mm at the investigated point). The created crack has a length of approximately 20 mm.
(a) (b) (c) (d)
Figure 4. Researched location of damaged place on the front triangle (a) and a detailed view of the damage from different angles (b–d) [2].
2.2. Frame Kinematics and Motion Analysis
The kinematics of a full suspension bicycle frame are usually made up of a system of “tubes” and rocker bars connected by pins. The frame kinematics define how the wheel moves throughout the full stroke, determine the rear wheel response on terrain uneven-ness, and transform this motion into shock absorber compression. In order to understand motion kinematics as a set of properties for different design solutions, it is important to define some general terms (see Figure 5) [28]:
Pivot—rotary connection of two bodies by means of a pin and a bearing, e.g., nodes A, B, C, D.
Link—an imaginary rod—a part connecting two pivots. The bodies 2, 3 and 4. Travel—the maximum vertical wheel motion, whether rear or front one, usually in
millimetres or inches. Mountain bike categories differ in stroke size, typically ranging from 80 mm (XC models) up to 250 mm (downhill specials). Front fork travel ranges from 80 to 200 mm.
Stroke (traveling)—value indicating maximum damper extension/compression in millimetres. For instance, the damper with “215 × 63” has 63 mm of stroke and a total unloaded length of 215 mm.
Figure 5. Simplified structure of rear triangle and suspension—general terms explanation. Figure 5. Simplified structure of rear triangle and suspension—general terms explanation.
Pivot—rotary connection of two bodies by means of a pin and a bearing, e.g., nodes A,B, C, D.
Link—an imaginary rod—a part connecting two pivots. The bodies 2, 3 and 4.Travel—the maximum vertical wheel motion, whether rear or front one, usually in
millimetres or inches. Mountain bike categories differ in stroke size, typically ranging from80 mm (XC models) up to 250 mm (downhill specials). Front fork travel ranges from 80 to200 mm.
Stroke (traveling)—value indicating maximum damper extension/compression inmillimetres. For instance, the damper with “215 × 63” has 63 mm of stroke and a totalunloaded length of 215 mm.
Static Sag—relative compression (typically 25–30%) of the damper under a certainrider’s weight.
MR (Motion Ratio)—the kinematic arrangement changes in time, causing the non-linear characteristic of the damper compression, during the stroke of suspension andrear triangle.
LR (Leverage Ratio)—reciprocal parameter to the MR; evaluation of thesuspension behavior.
Rear wheel axis trajectory—trajectory described by rear wheel axis during the stroke.In general, it is a 2D curve (usually circle section) depending on suspension and rear triangle

Symmetry 2022, 14, 255 7 of 28
design. It is the direction and shape of the trajectory that define how the suspension willbehave at the beginning of the stroke and determine the sensitivity of the suspension tosmall terrain unevenness.
A degrees of freedom calculation—the rear structure of the bicycle is multibodymechanism composed of an imaginary set of rods connected by rotary joints (pins) to thebasic body (front triangle) and a two-way sliding linkage (the damper). This system alwayshas one degree of freedom (DOF).
i = iv(n− 1)− Σξi, (1)
iv [-] number of DOF (for 2D case, iv = 3),n [-] number of bodies,Σξi [-] number of DOF taken by constraints.
Calculation in the case of Figure 2 (each link takes 2 DOF):
i = 3·(6− 1)− 14 = 1◦ DOF, (2)
Compression curve—defines the relation/dependence between the wheel stroke andthe compression of the shock absorber regarding the frame and suspension design. How-ever, it is more suitable to describe it via a gradient curve, steepness of the compressioncurve, or its derivation according to the rear wheel stroke.
MR =dYs
dYw[−], (3)
YS [-] shock compression,YW [-] rear wheel stroke.
According to the given shape and course of the compression curve, the suspensionas progressive, linear or degressive can be evaluated. Figure 6 shows the shock absorbercompression curve (blue), as well as the gradient curve (red) for the investigated NukeproofPulse bike, plotted in software Linkage X3 (Racooz Software, Budapest, Hungary, https://www.bikechecker.com/ (accessed on 10 December 2019)). It is obvious that the compressioncurve for the Nukeproof Pulse can be considered as linear in the major range (up to approx.150 mm of stroke), which means that the beginning of suspension is sensitive while the endis more progressive.
Symmetry 2022, 14, x FOR PEER REVIEW 8 of 29
Figure 6. Shock absorber compression curve and MR dependence on researched frame [2].
Using the Linkage X3 software, we determined the boundary conditions of the move-ment of the components while driving (in planar/2D representation). Figure 7a shows an unloaded frame where the trajectories of the movement of the individual axes of the bicy-cle can be seen. Figure 7b shows a frame at 200 mm full-stroke (the bicycle is bottomed out). By comparing both figures, it is obvious that, during the downward movement of the frame (impact suspension), the main dimensions of the frame change, e.g., shortening the distance of the wheel axes, the angle of the front fork, etc.
(a) (b)
Figure 7. Frame geometry at unloaded position at 0 mm of stroke (a), and fully loaded position at 200 mm of stroke (b), (carried out in software Linkage X3) [2].
2.3. Material Characteristics
The investigated frame is made of aluminum alloy AL 6061-T6 belonging to the struc-tural duralumin group, and it is widely used in the production of bicycles [29]. It offers a suitable combination of properties—lightweight on one hand, and sufficient strength, hardness, good machinability, suitability for forming and excellent weldability on the other. The improvement of the mechanical properties of this alloy can be achieved by suit-able heat treatment (assigned as T6). A typical welding method is electric arc welding using Tungsten Inert Gas (TIG) or Metal Inert Gas (MIG) welding method, respectively. Any strength loss (up to 40%, similarly to Al6061-T4) in the heat-affected zone near the welding joints can be eliminated by local reprocessing. It is used in the production of long constant cross-sectional shapes made by pressing it through a mold or hot forging.
Figure 6. Shock absorber compression curve and MR dependence on researched frame [2].
In general, it is not possible to determine which curve type is optimal. However,for long and big jumps, the progressive compression curve can be considered as moresuitable due to higher sensitivity at the beginning of the stroke followed by relatively higherstiffness as well as control and stability of the bike at the end. For downhill or cross-country

Symmetry 2022, 14, 255 8 of 28
style, a linear or degressive curve is more suitable when the force required to compress thedamper increases linearly through the stroke.
Using the Linkage X3 software, we determined the boundary conditions of the move-ment of the components while driving (in planar/2D representation). Figure 7a showsan unloaded frame where the trajectories of the movement of the individual axes of thebicycle can be seen. Figure 7b shows a frame at 200 mm full-stroke (the bicycle is bottomedout). By comparing both figures, it is obvious that, during the downward movement of theframe (impact suspension), the main dimensions of the frame change, e.g., shortening thedistance of the wheel axes, the angle of the front fork, etc.
Symmetry 2022, 14, x FOR PEER REVIEW 8 of 29
Figure 6. Shock absorber compression curve and MR dependence on researched frame [2].
Using the Linkage X3 software, we determined the boundary conditions of the move-ment of the components while driving (in planar/2D representation). Figure 7a shows an unloaded frame where the trajectories of the movement of the individual axes of the bicy-cle can be seen. Figure 7b shows a frame at 200 mm full-stroke (the bicycle is bottomed out). By comparing both figures, it is obvious that, during the downward movement of the frame (impact suspension), the main dimensions of the frame change, e.g., shortening the distance of the wheel axes, the angle of the front fork, etc.
(a) (b)
Figure 7. Frame geometry at unloaded position at 0 mm of stroke (a), and fully loaded position at 200 mm of stroke (b), (carried out in software Linkage X3) [2].
2.3. Material Characteristics
The investigated frame is made of aluminum alloy AL 6061-T6 belonging to the struc-tural duralumin group, and it is widely used in the production of bicycles [29]. It offers a suitable combination of properties—lightweight on one hand, and sufficient strength, hardness, good machinability, suitability for forming and excellent weldability on the other. The improvement of the mechanical properties of this alloy can be achieved by suit-able heat treatment (assigned as T6). A typical welding method is electric arc welding using Tungsten Inert Gas (TIG) or Metal Inert Gas (MIG) welding method, respectively. Any strength loss (up to 40%, similarly to Al6061-T4) in the heat-affected zone near the welding joints can be eliminated by local reprocessing. It is used in the production of long constant cross-sectional shapes made by pressing it through a mold or hot forging.
Figure 7. Frame geometry at unloaded position at 0 mm of stroke (a), and fully loaded position at200 mm of stroke (b), (carried out in software Linkage X3) [2].
2.3. Material Characteristics
The investigated frame is made of aluminum alloy AL 6061-T6 belonging to thestructural duralumin group, and it is widely used in the production of bicycles [29]. It offersa suitable combination of properties—lightweight on one hand, and sufficient strength,hardness, good machinability, suitability for forming and excellent weldability on the other.The improvement of the mechanical properties of this alloy can be achieved by suitableheat treatment (assigned as T6). A typical welding method is electric arc welding usingTungsten Inert Gas (TIG) or Metal Inert Gas (MIG) welding method, respectively. Anystrength loss (up to 40%, similarly to Al6061-T4) in the heat-affected zone near the weldingjoints can be eliminated by local reprocessing. It is used in the production of long constantcross-sectional shapes made by pressing it through a mold or hot forging.
Due to its excellent mechanical and technological properties, this alloy is mainlysuitable for the production of automotive and vehicle parts [30], especially those that areexposed to high mechanical stress. The malleable cast iron AL 6061-T6 has a tensile strengthof at least 290 MPa and yield strength of at least 240 MPa [30,31]. At a thickness of 6.35 mmor less, it has an elongation of 8% or more. With thicker parts, it has an elongation of10% [32]. Selected mechanical properties and the chemical composition of the AL6061-T6alloy can be seen in Table 2.
Symmetry 2022, 14, 255 9 of 28
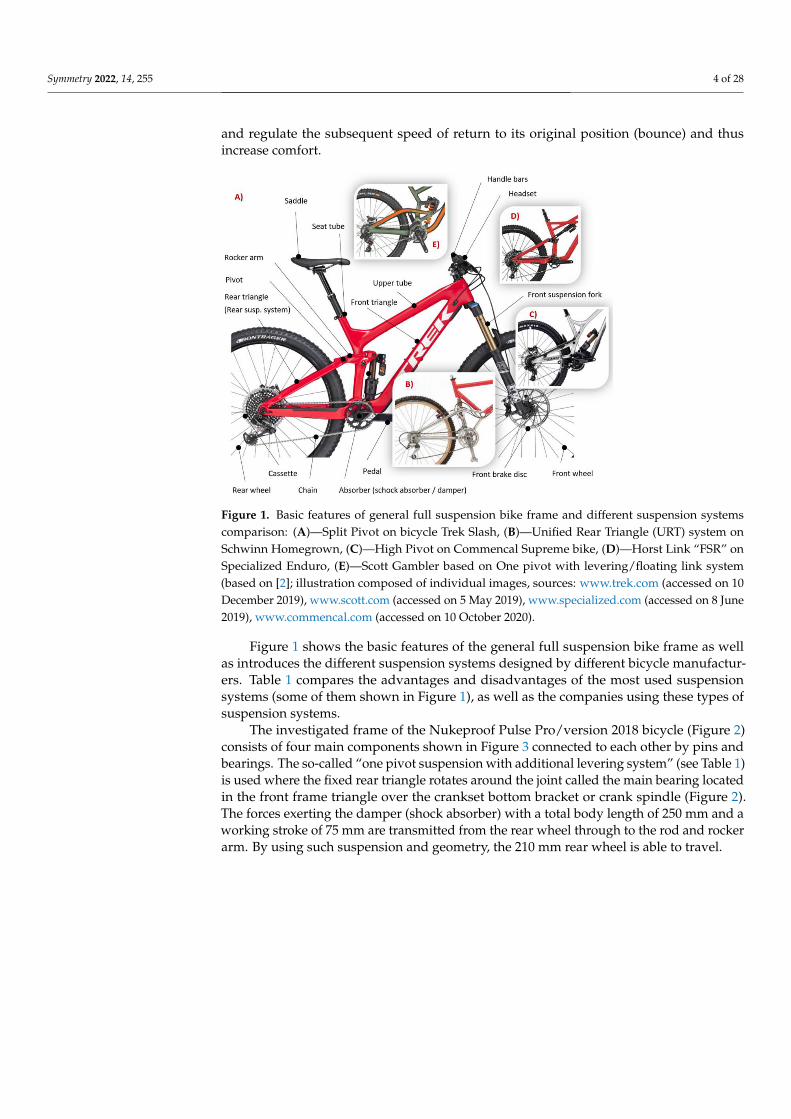
Table 2. Mechanical properties and chemical composition of the AL6061-T6 alloy [2,30].
Type Unit Value Element %
Mechanical Properties Chemical Composition
Hardness, Brinell [-] 95 Al 95.8–98.6Hardness, Knoop [-] 120 Cr 0.04–0.35
Hardness, Rockwell A [-] 40 Cu 0.15–0.4Hardness, Rockwell B [-] 60 Fe Max 0.7
Hardness, Vickers [-] 107 Mg 0.8–1.2Strength limit [MPa] 310 Mn Max 0.15Yield Strength [MPa] 276 Si 0.4–0.8
Tensibility [%] 12–17 Ti Max 0.15Elasticity module [GPa] 68.9 Zn Max 0.25
Notched tensile strength [MPa] 324 other, elements Max 0.05The greatest bearing
strength [MPa] 607 other, overall Max 0.15
Bearing strength [MPa] 386Poisson’s number [-] 0.33
Fatigue force [MPa] 96.5Machinability [%] 50Shear module [GPa] 26Shear strength [MPa] 207
The investigated frame consists of profiled tubes and other components connected inone piece by TIG welding. Parts of the front frame triangle are made by forming (forging,bending, pressing) and machining (turning and milling).
2.4. Riding Scenarios
In the industry focused on the design and development of new bicycle frames, itis very difficult to analyze all possible scenarios and types of loading that may occurduring pedalling, downhill, jumping, curve riding, etc. While designing a bicycle frame,the majority of manufactures use a dynamic coefficient to multiply the expected loadsvia dynamic or other types of coefficients (often determined on the basis of experience).Subsequently, the designers and engineers simulate the bicycle via an FEM analysis. Ifgreater reliability is required, the prototype of the newly designed frame can be tested on atest stand where the specific conditions of the ride are simulated.
Based on the common empirical experience of each cyclist, it is possible to assumea quite strong dependence of the type of bicycle loading as well as loading of its in-dividual structural components (frame, front fork, rear triangle, etc.) on the ridingmode/regime/scenario. Therefore, it is necessary to analyze at least the most importantscenarios, that can occur and can significantly influence the loading.
In our study, we consider these basic scenarios for the beginning:
(a) Downhill when riding out of the saddle with shifted rider’s centre of gravity back-wards (the stomach is approximately above the bicycle seat. Any elevation dropsrequire a rearward shift of their centre of gravity to avoid the endo);
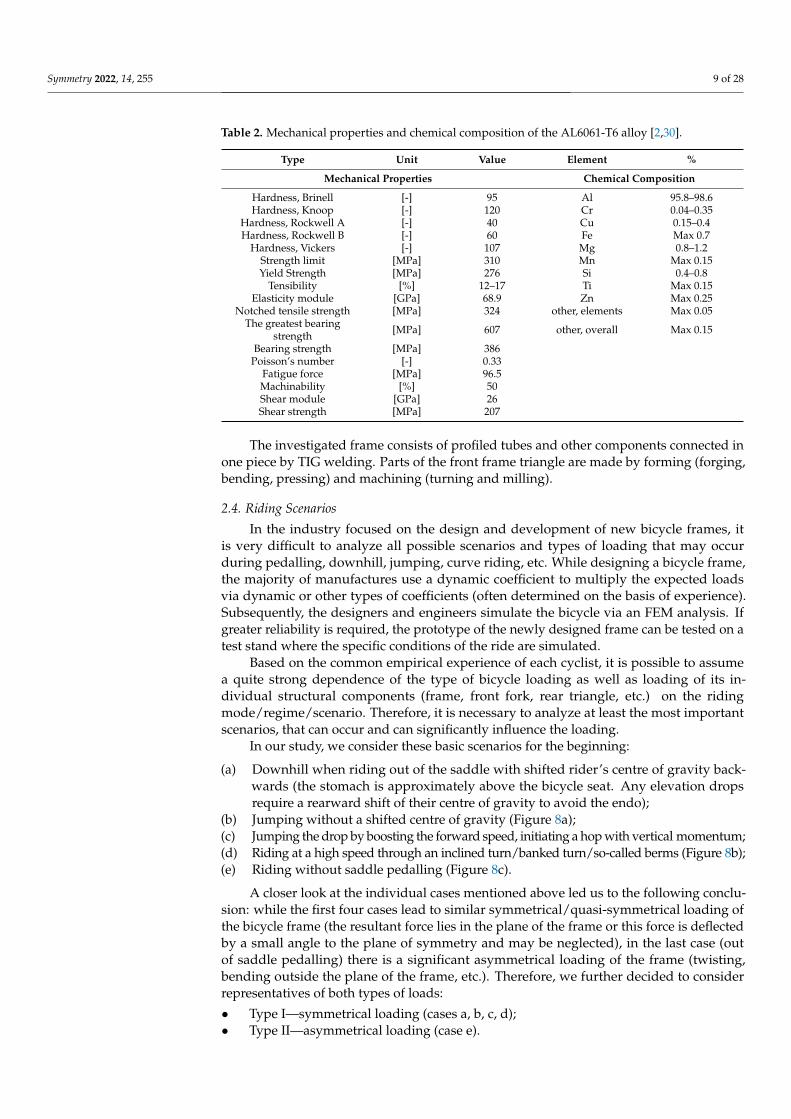
(b) Jumping without a shifted centre of gravity (Figure 8a);(c) Jumping the drop by boosting the forward speed, initiating a hop with vertical momentum;(d) Riding at a high speed through an inclined turn/banked turn/so-called berms (Figure 8b);(e) Riding without saddle pedalling (Figure 8c).
A closer look at the individual cases mentioned above led us to the following conclu-sion: while the first four cases lead to similar symmetrical/quasi-symmetrical loading ofthe bicycle frame (the resultant force lies in the plane of the frame or this force is deflectedby a small angle to the plane of symmetry and may be neglected), in the last case (outof saddle pedalling) there is a significant asymmetrical loading of the frame (twisting,bending outside the plane of the frame, etc.). Therefore, we further decided to considerrepresentatives of both types of loads:
• Type I—symmetrical loading (cases a, b, c, d);• Type II—asymmetrical loading (case e).
Symmetry 2022, 14, 255 10 of 28
Symmetry 2022, 14, x FOR PEER REVIEW 10 of 29
(a) Downhill when riding out of the saddle with shifted rider’s centre of gravity back-wards (the stomach is approximately above the bicycle seat. Any elevation drops re-quire a rearward shift of their centre of gravity to avoid the endo);
(b) Jumping without a shifted centre of gravity (Figure 8a); (c) Jumping the drop by boosting the forward speed, initiating a hop with vertical mo-
mentum; (d) Riding at a high speed through an inclined turn/banked turn/so-called berms (Figure
8b); (e) Riding without saddle pedalling (Figure 8c).
A closer look at the individual cases mentioned above led us to the following conclu-sion: while the first four cases lead to similar symmetrical/quasi-symmetrical loading of the bicycle frame (the resultant force lies in the plane of the frame or this force is deflected by a small angle to the plane of symmetry and may be neglected), in the last case (out of saddle pedalling) there is a significant asymmetrical loading of the frame (twisting, bend-ing outside the plane of the frame, etc.). Therefore, we further decided to consider repre-sentatives of both types of loads:
• Type I—symmetrical loading (cases a, b, c, d); • Type II—asymmetrical loading (case e).
(a)
(b)
(c)
Figure 8. Different riding scenarios: (a) jumping without a shifted centre of gravity; (b) riding at high speed through an inclined turn/banked turn; (c) riding out of saddle pedalling.
2.5. Loading of the Bicycle Frame while Driving
When riding a bicycle, the frame is loaded by its own weight, the weight of the addi-tional components, the rider’s weight, the inertia effects while braking, the dynamic forces generated when driving over rough terrain, and the driving style itself. These loads act in various combinations, and the so-called driving scenario (previous chapter) has a signifi-cant impact too. It is difficult and time-consuming to analytically describe precisely the overall effect of the combined loading. Therefore, the calculation for static and dynamic loads is used. The braking load can be included in the dynamic analysis.
Static load of bicycle frame—is used in the preliminary design phase when we want to find out what forces are acting on the frame, individual components, and spring pre-loading. However, it can be reached only under specific conditions. The static load simu-lates driving at a constant speed, without braking and acceleration, on a perfect surface without bumps while the rider is at rest position and does not change the center of gravity position while driving.
Dynamic load of bicycle frame—determines how the bicycle frame is stressed under more realistic conditions. The dynamic load is constantly changing while driving and it is affected by several factors. The main factors influencing the level of dynamic load while driving we can consider are:
• The rider’s position when driving;
Figure 8. Different riding scenarios: (a) jumping without a shifted centre of gravity; (b) riding at highspeed through an inclined turn/banked turn; (c) riding out of saddle pedalling.
2.5. Loading of the Bicycle Frame while Driving
When riding a bicycle, the frame is loaded by its own weight, the weight of theadditional components, the rider’s weight, the inertia effects while braking, the dynamicforces generated when driving over rough terrain, and the driving style itself. These loadsact in various combinations, and the so-called driving scenario (previous chapter) has asignificant impact too. It is difficult and time-consuming to analytically describe preciselythe overall effect of the combined loading. Therefore, the calculation for static and dynamicloads is used. The braking load can be included in the dynamic analysis.
Static load of bicycle frame—is used in the preliminary design phase when we want tofind out what forces are acting on the frame, individual components, and spring preloading.However, it can be reached only under specific conditions. The static load simulatesdriving at a constant speed, without braking and acceleration, on a perfect surface withoutbumps while the rider is at rest position and does not change the center of gravity positionwhile driving.
Dynamic load of bicycle frame—determines how the bicycle frame is stressed undermore realistic conditions. The dynamic load is constantly changing while driving and it isaffected by several factors. The main factors influencing the level of dynamic load whiledriving we can consider are:
• The rider’s position when driving;• Braking resp. bicycle acceleration;• Terrain nature—slope, unevenness, jumps, etc.;• Rider’s skills—technique and driving style.
It is almost impossible to quantify precisely the dynamic forces acting on the frame ata certain point due to these factors and the highly variable nature of the load. This is alsothe reason why dynamic effects are sometimes replaced by a coefficient that expresses thedynamic load as a function of static loading (it is the numerical coefficient that multipliesthe calculated static load of the frame and components). When designing the bicycle frame,a dynamic coefficient of 3 is used to calculate the dynamic load.
3. Simple Bicycle Load Acting in the Frame’s Symmetry Plane
When calculating the static load of the bicycle, it can be supposed that the main forcesacting on the bicycle frame are caused by the rider’s weight. Assuming the rider standson the pedals, his weight ‘G’ is centered in the bottom bracket, as can be seen in Figure 9.This force is divided into contact points of both tires and the ground surface (reactionforces Fa and Fc) and their ratio depending on the position of the rider’s center of gravity(CG). Depending on its position, a certain percentage of the gravity force can be distributedthrough the handlebars.

Symmetry 2022, 14, 255 11 of 28
Symmetry 2022, 14, x FOR PEER REVIEW 11 of 29
• Braking resp. bicycle acceleration; • Terrain nature—slope, unevenness, jumps, etc.; • Rider’s skills—technique and driving style.
It is almost impossible to quantify precisely the dynamic forces acting on the frame at a certain point due to these factors and the highly variable nature of the load. This is also the reason why dynamic effects are sometimes replaced by a coefficient that expresses the dynamic load as a function of static loading (it is the numerical coefficient that multi-plies the calculated static load of the frame and components). When designing the bicycle frame, a dynamic coefficient of 3 is used to calculate the dynamic load.
3. Simple Bicycle Load Acting in the Frame’s Symmetry Plane
When calculating the static load of the bicycle, it can be supposed that the main forces acting on the bicycle frame are caused by the rider’s weight. Assuming the rider stands on the pedals, his weight ‘G’ is centered in the bottom bracket, as can be seen in Figure 9. This force is divided into contact points of both tires and the ground surface (reaction forces Fa and Fc) and their ratio depending on the position of the rider’s center of gravity (CG). Depending on its position, a certain percentage of the gravity force can be distrib-uted through the handlebars.
Further, they are distributed to the frame via wheels, wheel shafts, front or rear fork. Unfortunately, this position is constantly changing during the ride with respect to the ter-rain profile, instant cyclist riding style, and the main working of the suspension system, etc. Given some empirical experiences, such a simplification can be accepted based on neglecting the effect of the CG shift towards the front wheel (we will consider this as the neutral position of the rider). The front wheel reaction force is distributed via the front fork into the head set, where the force Fc′ can be placed. The rear wheel reaction force Fa is transmitted to the shock absorber via the rear triangle and levering.
Figure 9. Basic external symmetrical load of bicycle frame.
FG [N] gravity force caused by rider and bicycle weight, FG′ [N] gravity force acting in bottom bracket, GF = FC [N] reaction to front wheel axis caused by gravity force, GR = FA [N] reaction to rear wheel axis caused by gravity force, L = WB [mm] wheelbase,
Lf [mm] distance of front wheel from center of gravity, Lf = 778 mm; according [27]
Figure 9. Basic external symmetrical load of bicycle frame.
Further, they are distributed to the frame via wheels, wheel shafts, front or rear fork.Unfortunately, this position is constantly changing during the ride with respect to theterrain profile, instant cyclist riding style, and the main working of the suspension system,etc. Given some empirical experiences, such a simplification can be accepted based onneglecting the effect of the CG shift towards the front wheel (we will consider this as theneutral position of the rider). The front wheel reaction force is distributed via the frontfork into the head set, where the force Fc′ can be placed. The rear wheel reaction force Fa istransmitted to the shock absorber via the rear triangle and levering.
FG [N] gravity force caused by rider and bicycle weight,FG′ [N] gravity force acting in bottom bracket,GF = FC [N] reaction to front wheel axis caused by gravity force,GR = FA [N] reaction to rear wheel axis caused by gravity force,L = WB [mm] wheelbase,
Lf [mm]distance of front wheel from center of gravity, Lf = 778 mm;according [27]
Lr [mm]distance of rear wheel from center of gravity, Lr = 440 mm;according [27]
FC′ [N] force made in fork acting to head set,G′ [N] gravity force.
The calculation is based on the equations of planar static equilibrium for forces andtorques. The rider’s weight and the weight of the bike with the components and geometrydata (basic frame dimensions) will be used as input data. The external load was calculatedfirst, then the analysis and calculations for the individual components of the frame and thesuspension mechanism.
G′ = (m + mb)·g (4)
∑ Fix = 0 ∑ Fiy = 0 ∑ Mi = 0 (5)
Fix [N] forces acting in x-axis,Fiy [N] forces acting in y-axis,Mi [Nm] torque moment to a certain point,m [kg] riders’ weight,mb [kg] weight of bike with components,g [m·s−2] gravitational acceleration.
For further calculation, the weight of the rider m = 90 kg, the weight of the bicycleincluding components mb = 15 kg and the gravitational acceleration constant g = 9.81 m·s−2
can be considered. Then, the gravitational force acting on the central shaft caused by boththe rider’s weight and the bicycle’s weight with the components, after substituting intoEquation (4), is rounded to 1030 N. This force is further used in calculating the load of the

Symmetry 2022, 14, 255 12 of 28
other components. Force Fa acts on the rear wheel shaft while the force Fc acts on the frontwheel shaft. After releasing the system and using the static equilibrium equations we haveobtained the values of forces Fa and Fc.
G′ = (90 + 15)·9.81 = 1030.05 NFor next calculating : G′ = 1030 N
(6)
∑ Fix = 0; (7)
∑ Fiy = 0; FA+FC − G′ = 0 (8)
∑ MiA = 0;−G′·Lr + FC·(
L f + Lr
)= 0 (9)
Lr = 440 mm; L f = 778 mm; FC =G′·440
(440 + 778)= 372 N (10)
FA = G′ − FC = 658 N (11)
3.1. Loadings on Individual Parts of the Bicycle Frame
The external load and forces acting on individual frame components were calculated.Individual components are rigid bodies and can be considered as imaginary rod systemswhere reactions act in their joints. The resulting reactions have sliding and rotating effects.
Rear triangle—For the rear triangle shown in Figure 10, equilibrium equations can beconstructed with respect to point 1 (main bearing axis) while the reaction forces inducedthe rear wheel force Fa. The reaction forces are restrained by the main bearing shaft andcan be decomposed into x and y components F1x and F1y.
Symmetry 2022, 14, x FOR PEER REVIEW 13 of 29
Figure 10. Static release for rear triangle calculation [2].
Then, the force F3 located in contact point 3 can be calculated, which represents the joint connecting the rear triangle and rocker body. Similarly, force F3 can be decomposed into x and y components F3x and F3y.
∑ #$% = 0; #9% − #:% = 0 (12)
∑ #$' = 0; #/ + #9' + #:' = 0 (13)
- �$9 = 0; −#/ · 485 + #:% · 98 − #:' · 35 = 0 (14)
#:% = #: · cos �14.6°� (15)
#:' = #: · sin �14.6°� (16)
#: = #/485
�35 · sin �14.5°� + 98 · cos �14.6°�� = 3710 N (17)
#:% = #: · cos �20.5°� = 3590 N (18)
#:' = #: · sin �20.5°� = 935 N (19)
#9% = #:% = 3590 N (20)
#9' = −#:'−#/ = −1593 N (21)
Rod—When calculating the forces in Figure 11a, we considered that the rod is used as a pull member for the force transmission F3 from point 3 to point 4 in the rod. As input, we use force F3′, the reacting force to F3, which was calculated above (Equation (17)). The calculated force F4′ is the reaction axial force to the force F3’.
(a) (b)
Figure 11. Balance of forces on the rod (a) and rocker arm (b) [2].
#: = −3710 N (22)
- # = 0; #:?−#@ = 0 (23)
#@? = −#:? = 3710 N (24)
Figure 10. Static release for rear triangle calculation [2].
Then, the force F3 located in contact point 3 can be calculated, which represents thejoint connecting the rear triangle and rocker body. Similarly, force F3 can be decomposedinto x and y components F3x and F3y.
∑ Fix = 0; F1x − F3x = 0 (12)
∑ Fiy = 0; FA + F1y + F3y = 0 (13)
∑ Mi1 = 0; −FA·485 + F3x·98− F3y·35 = 0 (14)
F3x = F3· cos (14.6◦) (15)
F3y = F3· sin(14.6◦) (16)
F3 = FA485
(35· sin(14.5◦) + 98· cos(14.6◦))= 3710 N (17)
F3x = F3· cos (20.5◦) = 3590 N (18)
F3y = F3· sin (20.5◦) = 935 N (19)
F1x = F3x = 3590 N (20)

Symmetry 2022, 14, 255 13 of 28
F1y = −F3y − FA = −1593 N (21)
Rod—When calculating the forces in Figure 11a, we considered that the rod is used asa pull member for the force transmission F3 from point 3 to point 4 in the rod. As input,we use force F3′ , the reacting force to F3, which was calculated above (Equation (17)). Thecalculated force F4′ is the reaction axial force to the force F3′ .
F3 = −3710 N (22)
∑ F = 0; F3′ − F4 = 0 (23)
F4′ = −F3′ = 3710 N (24)
Symmetry 2022, 14, x FOR PEER REVIEW 13 of 29
Figure 10. Static release for rear triangle calculation [2].
Then, the force F3 located in contact point 3 can be calculated, which represents the joint connecting the rear triangle and rocker body. Similarly, force F3 can be decomposed into x and y components F3x and F3y.
∑ #$% = 0; #9% − #:% = 0 (12)
∑ #$' = 0; #/ + #9' + #:' = 0 (13)
- �$9 = 0; −#/ · 485 + #:% · 98 − #:' · 35 = 0 (14)
#:% = #: · cos �14.6°� (15)
#:' = #: · sin �14.6°� (16)
#: = #/485
�35 · sin �14.5°� + 98 · cos �14.6°�� = 3710 N (17)
#:% = #: · cos �20.5°� = 3590 N (18)
#:' = #: · sin �20.5°� = 935 N (19)
#9% = #:% = 3590 N (20)
#9' = −#:'−#/ = −1593 N (21)
Rod—When calculating the forces in Figure 11a, we considered that the rod is used as a pull member for the force transmission F3 from point 3 to point 4 in the rod. As input, we use force F3′, the reacting force to F3, which was calculated above (Equation (17)). The calculated force F4′ is the reaction axial force to the force F3’.
(a) (b)
Figure 11. Balance of forces on the rod (a) and rocker arm (b) [2].
#: = −3710 N (22)
- # = 0; #:?−#@ = 0 (23)
#@? = −#:? = 3710 N (24)
Figure 11. Balance of forces on the rod (a) and rocker arm (b) [2].
Rocker arm—When calculating the forces acting in the rocker arm Figure 11b, we canconsider the input force F4 acting in point 4 is the reaction compressive force to force F4′ ,which was calculated above (Equation (22)). The calculated forces acting at points 2 and 5are shown as well. Forces F5x and F5y are made by the rotation of the rocker arm aroundpoint 5. The force F2 acting in point 2 is the reaction axial force made when the force F4 istransmitted to the damper. The calculation proceeds as in the previous chapters.
F4 = 3710 N (25)
∑ Fix = 0; F4x − F2x + F5x = 0 (26)
∑ Fiy = 0; F5y − F4y − F2y = 0 (27)
∑ Mi2 = 0; F4x·67.91− F4y·22.36− F2y·18.69− F2x·122.13 = 0 (28)
F2x = F2·cos (35.9◦) (29)
F2y = F2· sin(35.9◦) (30)
F4x = F4· cos (14.6◦) = 3590 N (31)
F4y = F4·sin (14.6◦) = 935 N (32)
F2 = F4(67.91· cos (14.6◦)− 22.36· sin (14.6◦))(18.69· sin (35.9◦)− 122.13· cos(35.9◦))
= 2534 N (33)
F2x = F2· cos (52.9◦) = 2053 N (34)
F2y = F2· sin(52.9◦) = 1486 N (35)
F5x = F2x − F4x = −1537 N (36)
F5y = F2y + F4y = 2421 N (37)
Symmetry 2022, 14, 255 14 of 28
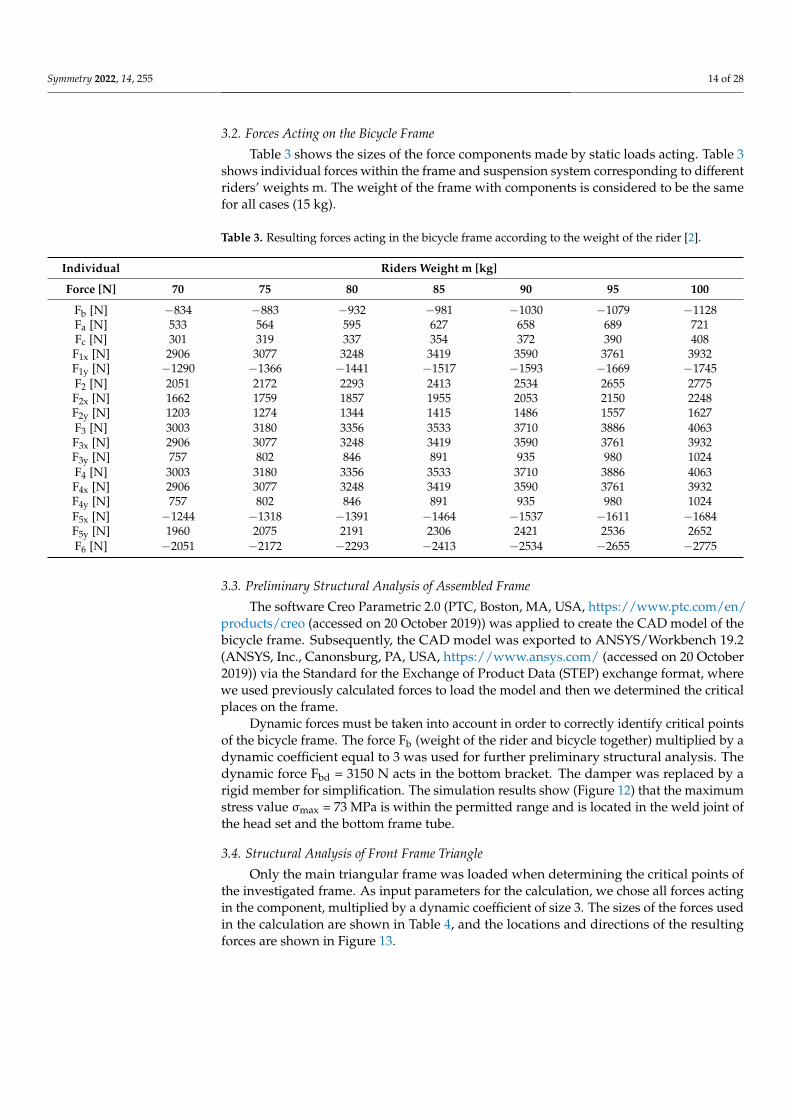
3.2. Forces Acting on the Bicycle Frame
Table 3 shows the sizes of the force components made by static loads acting. Table 3shows individual forces within the frame and suspension system corresponding to differentriders’ weights m. The weight of the frame with components is considered to be the samefor all cases (15 kg).
Table 3. Resulting forces acting in the bicycle frame according to the weight of the rider [2].
Individual Riders Weight m [kg]
Force [N] 70 75 80 85 90 95 100
Fb [N] −834 −883 −932 −981 −1030 −1079 −1128Fa [N] 533 564 595 627 658 689 721Fc [N] 301 319 337 354 372 390 408F1x [N] 2906 3077 3248 3419 3590 3761 3932F1y [N] −1290 −1366 −1441 −1517 −1593 −1669 −1745F2 [N] 2051 2172 2293 2413 2534 2655 2775F2x [N] 1662 1759 1857 1955 2053 2150 2248F2y [N] 1203 1274 1344 1415 1486 1557 1627F3 [N] 3003 3180 3356 3533 3710 3886 4063F3x [N] 2906 3077 3248 3419 3590 3761 3932F3y [N] 757 802 846 891 935 980 1024F4 [N] 3003 3180 3356 3533 3710 3886 4063F4x [N] 2906 3077 3248 3419 3590 3761 3932F4y [N] 757 802 846 891 935 980 1024F5x [N] −1244 −1318 −1391 −1464 −1537 −1611 −1684F5y [N] 1960 2075 2191 2306 2421 2536 2652F6 [N] −2051 −2172 −2293 −2413 −2534 −2655 −2775
3.3. Preliminary Structural Analysis of Assembled Frame
The software Creo Parametric 2.0 (PTC, Boston, MA, USA, https://www.ptc.com/en/products/creo (accessed on 20 October 2019)) was applied to create the CAD model of thebicycle frame. Subsequently, the CAD model was exported to ANSYS/Workbench 19.2(ANSYS, Inc., Canonsburg, PA, USA, https://www.ansys.com/ (accessed on 20 October2019)) via the Standard for the Exchange of Product Data (STEP) exchange format, wherewe used previously calculated forces to load the model and then we determined the criticalplaces on the frame.
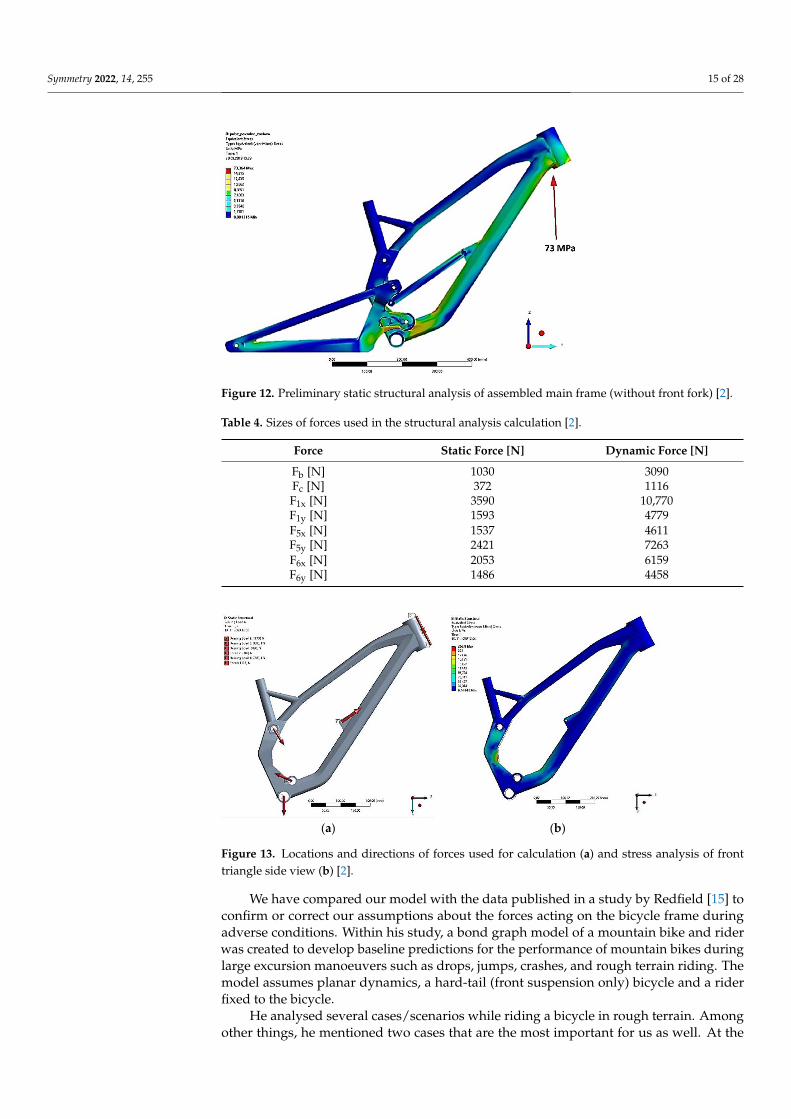
Dynamic forces must be taken into account in order to correctly identify critical pointsof the bicycle frame. The force Fb (weight of the rider and bicycle together) multiplied by adynamic coefficient equal to 3 was used for further preliminary structural analysis. Thedynamic force Fbd = 3150 N acts in the bottom bracket. The damper was replaced by arigid member for simplification. The simulation results show (Figure 12) that the maximumstress value σmax = 73 MPa is within the permitted range and is located in the weld joint ofthe head set and the bottom frame tube.
3.4. Structural Analysis of Front Frame Triangle
Only the main triangular frame was loaded when determining the critical points ofthe investigated frame. As input parameters for the calculation, we chose all forces actingin the component, multiplied by a dynamic coefficient of size 3. The sizes of the forces usedin the calculation are shown in Table 4, and the locations and directions of the resultingforces are shown in Figure 13.
Symmetry 2022, 14, 255 15 of 28
Symmetry 2022, 14, x FOR PEER REVIEW 15 of 29
F5y [N] 1960 2075 2191 2306 2421 2536 2652 F6 [N] −2051 −2172 −2293 −2413 −2534 −2655 −2775
3.3. Preliminary Structural Analysis of Assembled Frame
The software Creo Parametric 2.0 (PTC, Boston, MA, USA, https://www.ptc.com/en/products/creo (accessed on 20 October 2019)) was applied to cre-ate the CAD model of the bicycle frame. Subsequently, the CAD model was exported to ANSYS/Workbench 19.2 (ANSYS, Inc., Canonsburg, PA, USA, https://www.ansys.com/ (accessed on 20 October 2019)) via the Standard for the Exchange of Product Data (STEP) exchange format, where we used previously calculated forces to load the model and then we determined the critical places on the frame.
Dynamic forces must be taken into account in order to correctly identify critical points of the bicycle frame. The force Fb (weight of the rider and bicycle together) multi-plied by a dynamic coefficient equal to 3 was used for further preliminary structural anal-ysis. The dynamic force Fbd = 3150 N acts in the bottom bracket. The damper was replaced by a rigid member for simplification. The simulation results show (Figure 12) that the maximum stress value σmax = 73 MPa is within the permitted range and is located in the weld joint of the head set and the bottom frame tube.
Figure 12. Preliminary static structural analysis of assembled main frame (without front fork) [2].
3.4. Structural Analysis of Front Frame Triangle
Only the main triangular frame was loaded when determining the critical points of the investigated frame. As input parameters for the calculation, we chose all forces acting in the component, multiplied by a dynamic coefficient of size 3. The sizes of the forces used in the calculation are shown in Table 4, and the locations and directions of the result-ing forces are shown in Figure 13.
Table 4. Sizes of forces used in the structural analysis calculation [2].
Force Static Force [N] Dynamic Force [N]
Fb [N] 1030 3090 Fc [N] 372 1116 F1x [N] 3590 10,770 F1y [N] 1593 4779 F5x [N] 1537 4611 F5y [N] 2421 7263
Figure 12. Preliminary static structural analysis of assembled main frame (without front fork) [2].
Table 4. Sizes of forces used in the structural analysis calculation [2].
Force Static Force [N] Dynamic Force [N]
Fb [N] 1030 3090Fc [N] 372 1116F1x [N] 3590 10,770F1y [N] 1593 4779F5x [N] 1537 4611F5y [N] 2421 7263F6x [N] 2053 6159F6y [N] 1486 4458
Symmetry 2022, 14, x FOR PEER REVIEW 16 of 29
F6x [N] 2053 6159 F6y [N] 1486 4458
(a) (b)
Figure 13. Locations and directions of forces used for calculation (a) and stress analysis of front triangle side view (b) [2].
We have compared our model with the data published in a study by Redfield [15] to confirm or correct our assumptions about the forces acting on the bicycle frame during adverse conditions. Within his study, a bond graph model of a mountain bike and rider was created to develop baseline predictions for the performance of mountain bikes during large excursion manoeuvers such as drops, jumps, crashes, and rough terrain riding. The model assumes planar dynamics, a hard-tail (front suspension only) bicycle and a rider fixed to the bicycle.
He analysed several cases/scenarios while riding a bicycle in rough terrain. Among other things, he mentioned two cases that are the most important for us as well. At the beginning, it is the case of riding downhill when out of the saddle with the rider’s centre of gravity shifted backwards (the stomach is approximately above the bicycle seat and any elevation drops require a rearward shift of their centre of gravity to avoid the endo). The second one was the case of jumping without a shifted centre of gravity. Unfortunately, both cases have some limitations for us. His model does not contain a rear suspension system (hardtail bike) and simulates only partially “suspension via legs” (kind of “semi-rigid connection” between rider and bicycle). Despite these limitations, the conclusions of this study can be extrapolated to our set of analyses.
He concludes that for the first case (shifted centre of gravity backwards, riding down-hill a ramp about 1 m high and half braking) forces (call them suspension forces) in a range up to approx. 2500 N can act on the bicycle frame and suspension system.
In the second case, he analyzed the scenario of jumping not by shifting the center of mass and/or braking, but by boosting the forward speed to approx. 16 km per hour and initiating a hop with vertical momentum before the drop. He concluded that this manoeu-vre might result in much higher suspension forces (basically acting on the rear fork) alt-hough some other forces (e.g., braking) can have lower effects and thus can be neglected. In published graphs, there can be seen the peak force which occurs at the impact. The peak force can exceed over 6000 N, which the suspension has to tolerate during jumps like this. He noticed that these forces are double those of the nominal case, and triple those of the previous case. A reliable bicycle frame must be designed to withstand these large, impul-sive loads.
Based on this, we can conclude that our prediction corresponds quite accurately with the data from the study [15]. However, we would like to point out that in our case, the situation may be even more favorable. Certain additional reductions of the acting forces
Figure 13. Locations and directions of forces used for calculation (a) and stress analysis of fronttriangle side view (b) [2].
We have compared our model with the data published in a study by Redfield [15] toconfirm or correct our assumptions about the forces acting on the bicycle frame duringadverse conditions. Within his study, a bond graph model of a mountain bike and riderwas created to develop baseline predictions for the performance of mountain bikes duringlarge excursion manoeuvers such as drops, jumps, crashes, and rough terrain riding. Themodel assumes planar dynamics, a hard-tail (front suspension only) bicycle and a riderfixed to the bicycle.
He analysed several cases/scenarios while riding a bicycle in rough terrain. Amongother things, he mentioned two cases that are the most important for us as well. At the
Symmetry 2022, 14, 255 16 of 28
beginning, it is the case of riding downhill when out of the saddle with the rider’s centre ofgravity shifted backwards (the stomach is approximately above the bicycle seat and anyelevation drops require a rearward shift of their centre of gravity to avoid the endo). Thesecond one was the case of jumping without a shifted centre of gravity. Unfortunately, bothcases have some limitations for us. His model does not contain a rear suspension system(hardtail bike) and simulates only partially “suspension via legs” (kind of “semi-rigidconnection” between rider and bicycle). Despite these limitations, the conclusions of thisstudy can be extrapolated to our set of analyses.
He concludes that for the first case (shifted centre of gravity backwards, riding down-hill a ramp about 1 m high and half braking) forces (call them suspension forces) in a rangeup to approx. 2500 N can act on the bicycle frame and suspension system.
In the second case, he analyzed the scenario of jumping not by shifting the centerof mass and/or braking, but by boosting the forward speed to approx. 16 km per hourand initiating a hop with vertical momentum before the drop. He concluded that thismanoeuvre might result in much higher suspension forces (basically acting on the rearfork) although some other forces (e.g., braking) can have lower effects and thus can beneglected. In published graphs, there can be seen the peak force which occurs at the impact.The peak force can exceed over 6000 N, which the suspension has to tolerate during jumpslike this. He noticed that these forces are double those of the nominal case, and triple thoseof the previous case. A reliable bicycle frame must be designed to withstand these large,impulsive loads.
Based on this, we can conclude that our prediction corresponds quite accurately withthe data from the study [15]. However, we would like to point out that in our case, thesituation may be even more favorable. Certain additional reductions of the acting forces canbe assumed due to the fully suspended bicycle frame, where a considerable amount of theforces (occurred during the first contact phase between the wheels and the ground—impact)should be absorbed by the suspension system.
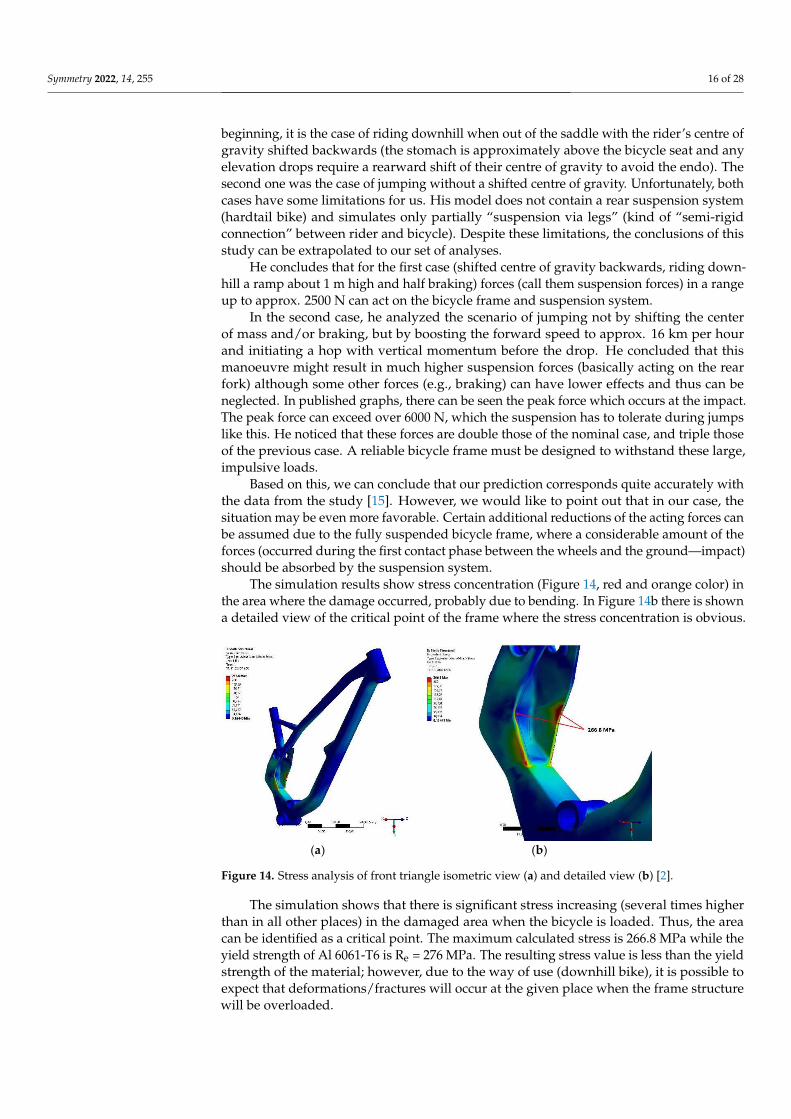
The simulation results show stress concentration (Figure 14, red and orange color) inthe area where the damage occurred, probably due to bending. In Figure 14b there is showna detailed view of the critical point of the frame where the stress concentration is obvious.
Symmetry 2022, 14, x FOR PEER REVIEW 17 of 29
can be assumed due to the fully suspended bicycle frame, where a considerable amount of the forces (occurred during the first contact phase between the wheels and the ground—impact) should be absorbed by the suspension system.
The simulation results show stress concentration (Figure 14, red and orange color) in the area where the damage occurred, probably due to bending. In Figure 14b there is shown a detailed view of the critical point of the frame where the stress concentration is obvious.
(a) (b)
Figure 14. Stress analysis of front triangle isometric view (a) and detailed view (b) [2].
The simulation shows that there is significant stress increasing (several times higher than in all other places) in the damaged area when the bicycle is loaded. Thus, the area can be identified as a critical point. The maximum calculated stress is 266.8 MPa while the yield strength of Al 6061-T6 is Re = 276 MPa. The resulting stress value is less than the yield strength of the material; however, due to the way of use (downhill bike), it is possible to expect that deformations/fractures will occur at the given place when the frame struc-ture will be overloaded.
Furthermore, the study focuses on finding sufficient improved design with higher frame stiffness in critical points and lower production cost at the same time.
4. Improved Design Concept
In the following chapter, several possible solutions will be proposed. One of them will be chosen for deeper study to determine the possibility of its production. There are several options available or design concepts for solving a critical damaged place on the investigated frame (Figure 15). • New pocket design with higher wall thickness (Figure 15b)—it is based on replacing
the critical part with a component with identical shape and external dimensions, but different wall thickness and production technology to reduce the resulting stresses. However, this solution is less suitable from the point of view of technology, total cost of production, and total weight;
• Pocket replacing by square profile with pin housing (Figure 15c)—the node de-sign/shape will be changed while the suspension kinematics will not be affected re-garding the position of the casing, and pin holes for the rocker arm pin remain with-out changes. The most significant change of this variant is that the suspension com-ponents (rocker arm and whole linkage) will be located outside the frame and not inside the pocket housing. Using a profile instead of an open pocket will result in reduced stress at the critical point.
Figure 14. Stress analysis of front triangle isometric view (a) and detailed view (b) [2].
The simulation shows that there is significant stress increasing (several times higherthan in all other places) in the damaged area when the bicycle is loaded. Thus, the areacan be identified as a critical point. The maximum calculated stress is 266.8 MPa while theyield strength of Al 6061-T6 is Re = 276 MPa. The resulting stress value is less than the yieldstrength of the material; however, due to the way of use (downhill bike), it is possible toexpect that deformations/fractures will occur at the given place when the frame structurewill be overloaded.

Symmetry 2022, 14, 255 17 of 28
Furthermore, the study focuses on finding sufficient improved design with higherframe stiffness in critical points and lower production cost at the same time.
4. Improved Design Concept
In the following chapter, several possible solutions will be proposed. One of themwill be chosen for deeper study to determine the possibility of its production. There areseveral options available or design concepts for solving a critical damaged place on theinvestigated frame (Figure 15).
• New pocket design with higher wall thickness (Figure 15b)—it is based on replacingthe critical part with a component with identical shape and external dimensions, butdifferent wall thickness and production technology to reduce the resulting stresses.However, this solution is less suitable from the point of view of technology, total costof production, and total weight;
• Pocket replacing by square profile with pin housing (Figure 15c)—the node de-sign/shape will be changed while the suspension kinematics will not be affectedregarding the position of the casing, and pin holes for the rocker arm pin remainwithout changes. The most significant change of this variant is that the suspensioncomponents (rocker arm and whole linkage) will be located outside the frame andnot inside the pocket housing. Using a profile instead of an open pocket will result inreduced stress at the critical point.
Symmetry 2022, 14, x FOR PEER REVIEW 18 of 29
(a) (b) (c)
Figure 15. Original design (a) versus first (b) and second (c) conceptual design—new pocket design with higher wall thickness or replacement by welding assembly of square profile with pin housing (arrows show the welding connection or the wall thickness, respectively).
In Table 5, individual design solutions are compared regarding the used manufac-turing technology. The table shows what additional components need to be manufactured for further use, the expected financial and technological demands, and the weight of the manufactured piece. For a small production series, which is our case, the forging technol-ogy is not suitable.
Table 5. Comparison of individual solutions.
Conceptual
Design
Forged Pocket with
Reinforced Wall—
Original
Machined Pocket with
Reinforced Wall—
Thicker
Square Profile with
Pin Housing
Model of design
Produced parts Forged pocket
Upper frame tube Machined pocket Upper frame tube
Bushing Square profile
Upper frame tube
Other produced components
Linkage Rocker Arm
Pivots
Linkage Rocker Arm
Pivots
Linkage Rocker Arm
Pivots
Using technology Forging
Machining Welding
Machining Welding
Machining Turning Welding
Weight 0.630 kg 0.630 kg 0.306 kg Financial demands €€€ €€ €
Technological demands
3 2 1
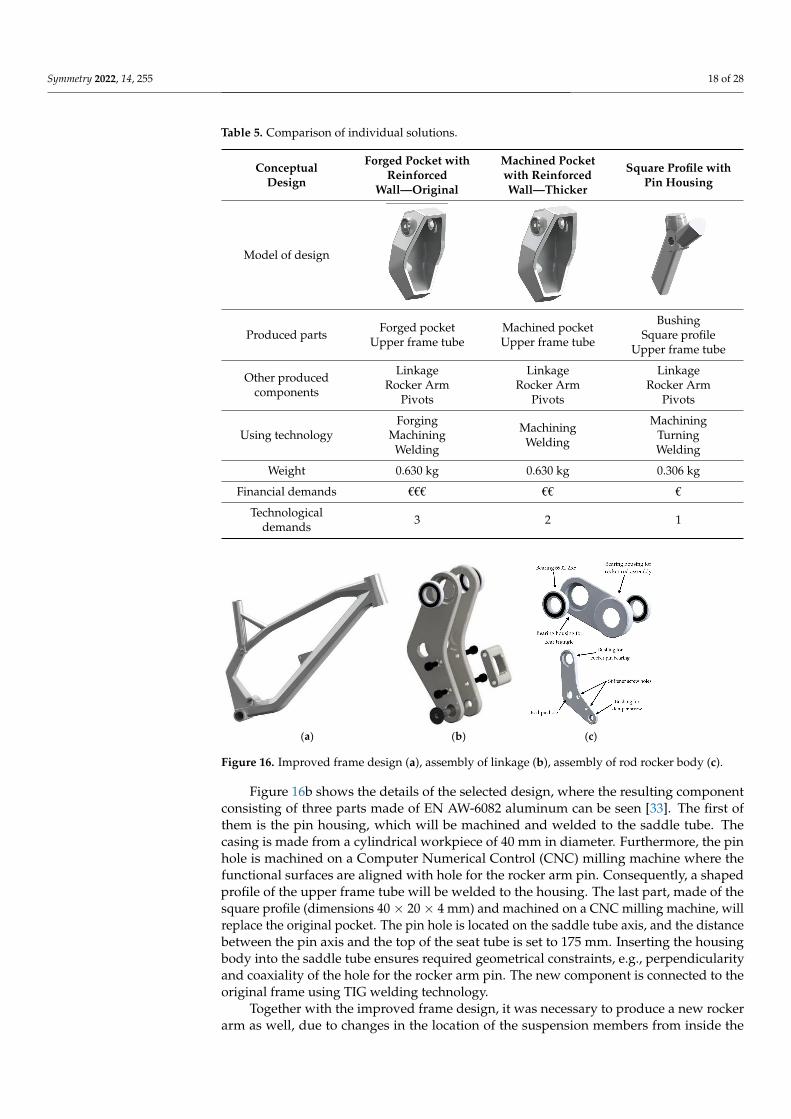
After comparing the financial and technological demands, as well as reviewing the available production technologies, the last option was chosen as a suitable solution—re-placing the critical point with a square profile with pin housing, manufacturing a bushing for the rocker arm pin, and subsequently welding it into the original frame. Figure 16 shows the new design of the front triangle.
Figure 16b shows the details of the selected design, where the resulting component consisting of three parts made of EN AW-6082 aluminum can be seen [33]. The first of
Figure 15. Original design (a) versus first (b) and second (c) conceptual design—new pocket designwith higher wall thickness or replacement by welding assembly of square profile with pin housing(arrows show the welding connection or the wall thickness, respectively).
In Table 5, individual design solutions are compared regarding the used manufacturingtechnology. The table shows what additional components need to be manufactured forfurther use, the expected financial and technological demands, and the weight of themanufactured piece. For a small production series, which is our case, the forging technologyis not suitable.
After comparing the financial and technological demands, as well as reviewing theavailable production technologies, the last option was chosen as a suitable solution—replacing the critical point with a square profile with pin housing, manufacturing a bushingfor the rocker arm pin, and subsequently welding it into the original frame. Figure 16shows the new design of the front triangle.
Symmetry 2022, 14, 255 18 of 28
Table 5. Comparison of individual solutions.
ConceptualDesign
Forged Pocket withReinforced
Wall—Original
Machined Pocketwith ReinforcedWall—Thicker
Square Profile withPin Housing
Model of design
Symmetry 2022, 14, x FOR PEER REVIEW 18 of 29
(a) (b) (c)
Figure 15. Original design (a) versus first (b) and second (c) conceptual design—new pocket design with higher wall thickness or replacement by welding assembly of square profile with pin housing (arrows show the welding connection or the wall thickness, respectively).
In Table 5, individual design solutions are compared regarding the used manufac-turing technology. The table shows what additional components need to be manufactured for further use, the expected financial and technological demands, and the weight of the manufactured piece. For a small production series, which is our case, the forging technol-ogy is not suitable.
Table 5. Comparison of individual solutions.
Conceptual
Design
Forged Pocket with
Reinforced Wall—
Original
Machined Pocket with
Reinforced Wall—
Thicker
Square Profile with
Pin Housing
Model of design
Produced parts Forged pocket
Upper frame tube Machined pocket Upper frame tube
Bushing Square profile
Upper frame tube
Other produced components
Linkage Rocker Arm
Pivots
Linkage Rocker Arm
Pivots
Linkage Rocker Arm
Pivots
Using technology Forging
Machining Welding
Machining Welding
Machining Turning Welding
Weight 0.630 kg 0.630 kg 0.306 kg Financial demands €€€ €€ €
Technological demands
3 2 1
After comparing the financial and technological demands, as well as reviewing the available production technologies, the last option was chosen as a suitable solution—re-placing the critical point with a square profile with pin housing, manufacturing a bushing for the rocker arm pin, and subsequently welding it into the original frame. Figure 16 shows the new design of the front triangle.
Figure 16b shows the details of the selected design, where the resulting component consisting of three parts made of EN AW-6082 aluminum can be seen [33]. The first of
Produced parts Forged pocketUpper frame tube
Machined pocketUpper frame tube
BushingSquare profile
Upper frame tube
Other producedcomponents
LinkageRocker Arm
Pivots
LinkageRocker Arm
Pivots
LinkageRocker Arm
Pivots
Using technologyForging
MachiningWelding
MachiningWelding
MachiningTurningWelding
Weight 0.630 kg 0.630 kg 0.306 kg
Financial demands €€€ €€ €
Technologicaldemands 3 2 1
Symmetry 2022, 14, x FOR PEER REVIEW 19 of 29
them is the pin housing, which will be machined and welded to the saddle tube. The cas-ing is made from a cylindrical workpiece of 40 mm in diameter. Furthermore, the pin hole is machined on a Computer Numerical Control (CNC) milling machine where the func-tional surfaces are aligned with hole for the rocker arm pin. Consequently, a shaped pro-file of the upper frame tube will be welded to the housing. The last part, made of the square profile (dimensions 40 × 20 × 4 mm) and machined on a CNC milling machine, will replace the original pocket. The pin hole is located on the saddle tube axis, and the dis-tance between the pin axis and the top of the seat tube is set to 175 mm. Inserting the housing body into the saddle tube ensures required geometrical constraints, e.g., perpen-dicularity and coaxiality of the hole for the rocker arm pin. The new component is con-nected to the original frame using TIG welding technology.
(a) (b) (c)
Figure 16. Improved frame design (a), assembly of linkage (b), assembly of rod rocker body (c).
Together with the improved frame design, it was necessary to produce a new rocker arm as well, due to changes in the location of the suspension members from inside the pocket (original design) to the outside (new improved design). It was also necessary to create new rods regarding the above changes in the solution of the suspension system. It is possible to keep the original, single-row ball bearings 6902-2RS with dimensions 15 × 28 × 7 mm for revolute joint. Figure 16c shows the rocker arm assembly composed of two rocker arm bodies, stiffeners between the rocker arm, four cylindrical head screws DIN 912 M5 × 20 mm, two ball bearings, and shock absorber screws. The rod assembly consists of a designed body with two bushings at both ends fitted for 6902-2RS bearings. The first one is for the rocker arm bearing while the second one with a 4 mm offset (due to existing welds on the rear triangle) is designed for the rear triangle bearing. The rocker assembly consists of three main components: two rocker arm bodies and a stiffener located between the rocker arms. The stiffener ensures that the entire rocker arm assembly does not twist when rear triangle is moving. There are two bearings 61902-2RS with dimensions 15 × 28 × 7 mm.
For the production of frame components, the material EN AW-6082 was chosen, which has good weldability, similar mechanical properties to EN AW-6061, and is rela-tively available compared to the original material. Low-alloy stainless steel manganese-chrome suitable for cementation 16MnCr5 according to DIN 17,210 (14,220 according to STN) will be used for rod bodies as well as rocker arm manufacturing [34].
5. New Frame Design under Symmetrical and Asymmetrical Loading
The improved front triangle frame model was created in Creo Parametric 2.0. Stress analysis was performed in ANSYS/Workbench using the same procedure as in the first part of the case study when researching the original frame. The locations and directions of the forces are shown in Figure 17.
Figure 16. Improved frame design (a), assembly of linkage (b), assembly of rod rocker body (c).
Figure 16b shows the details of the selected design, where the resulting componentconsisting of three parts made of EN AW-6082 aluminum can be seen [33]. The first ofthem is the pin housing, which will be machined and welded to the saddle tube. Thecasing is made from a cylindrical workpiece of 40 mm in diameter. Furthermore, the pinhole is machined on a Computer Numerical Control (CNC) milling machine where thefunctional surfaces are aligned with hole for the rocker arm pin. Consequently, a shapedprofile of the upper frame tube will be welded to the housing. The last part, made of thesquare profile (dimensions 40 × 20 × 4 mm) and machined on a CNC milling machine, willreplace the original pocket. The pin hole is located on the saddle tube axis, and the distancebetween the pin axis and the top of the seat tube is set to 175 mm. Inserting the housingbody into the saddle tube ensures required geometrical constraints, e.g., perpendicularityand coaxiality of the hole for the rocker arm pin. The new component is connected to theoriginal frame using TIG welding technology.
Together with the improved frame design, it was necessary to produce a new rockerarm as well, due to changes in the location of the suspension members from inside the

Symmetry 2022, 14, 255 19 of 28
pocket (original design) to the outside (new improved design). It was also necessary tocreate new rods regarding the above changes in the solution of the suspension system.It is possible to keep the original, single-row ball bearings 6902-2RS with dimensions15 × 28 × 7 mm for revolute joint. Figure 16c shows the rocker arm assembly composedof two rocker arm bodies, stiffeners between the rocker arm, four cylindrical head screwsDIN 912 M5 × 20 mm, two ball bearings, and shock absorber screws. The rod assemblyconsists of a designed body with two bushings at both ends fitted for 6902-2RS bearings.The first one is for the rocker arm bearing while the second one with a 4 mm offset (dueto existing welds on the rear triangle) is designed for the rear triangle bearing. The rockerassembly consists of three main components: two rocker arm bodies and a stiffener locatedbetween the rocker arms. The stiffener ensures that the entire rocker arm assembly doesnot twist when rear triangle is moving. There are two bearings 61902-2RS with dimensions15 × 28 × 7 mm.
For the production of frame components, the material EN AW-6082 was chosen, whichhas good weldability, similar mechanical properties to EN AW-6061, and is relativelyavailable compared to the original material. Low-alloy stainless steel manganese-chromesuitable for cementation 16MnCr5 according to DIN 17,210 (14,220 according to STN) willbe used for rod bodies as well as rocker arm manufacturing [34].
5. New Frame Design under Symmetrical and Asymmetrical Loading
The improved front triangle frame model was created in Creo Parametric 2.0. Stressanalysis was performed in ANSYS/Workbench using the same procedure as in the firstpart of the case study when researching the original frame. The locations and directions ofthe forces are shown in Figure 17.
Symmetry 2022, 14, x FOR PEER REVIEW 20 of 29
Figure 17. Locations and directions of forces used in calculation.
5.1. Static Structural Analysis of Selected Solution
The static structural analysis calculation is performed by using dynamic forces. The static force magnitude multiplied by a dynamic coefficient of magnitude 3 is shown in Table 6.
After static structural analysis calculation simulation in ANSYS/Workbench, we gen-erated a graphical output picture of the generated stresses in the frame, which shows the higher stress in the area of damage. Figure 18 shows the graphical output of calculated stress.
Table 6. Sizes of forces used in structural analysis calculation.
Force Static Force [N] Dynamic Force [N]
Fb [N] 1030 3090 Fc [N] 372 1116 F1x [N] 3590 10770 F1y [N] 1593 4779 F5x [N] 1537 4611 F5y [N] 2421 7263 F6x [N] 2053 6159 F6y [N] 1486 4458
Figure 17. Locations and directions of forces used in calculation.
5.1. Static Structural Analysis of Selected Solution
The static structural analysis calculation is performed by using dynamic forces. Thestatic force magnitude multiplied by a dynamic coefficient of magnitude 3 is shown inTable 6.
After static structural analysis calculation simulation in ANSYS/Workbench, we gen-erated a graphical output picture of the generated stresses in the frame, which shows thehigher stress in the area of damage. Figure 18 shows the graphical output of calculated stress.

Symmetry 2022, 14, 255 20 of 28
Table 6. Sizes of forces used in structural analysis calculation.
Force Static Force [N] Dynamic Force [N]
Fb [N] 1030 3090Fc [N] 372 1116F1x [N] 3590 10770F1y [N] 1593 4779F5x [N] 1537 4611F5y [N] 2421 7263F6x [N] 2053 6159F6y [N] 1486 4458
Symmetry 2022, 14, x FOR PEER REVIEW 21 of 29
(a) (b) (c)
Figure 18. Stresses acting in front triangle, isometric view (a), side view (b) and detailed view (c).
In the chosen conceptual design, a multiple tension reduction in the resulting stresses can be observed, compared to the original design. When we compare the detailed simu-lation of both outputs from Figure 19, there is visibly reduced tension in the searched location from the original σmax = 266.8 MPa to the current σmax = 105.2 MPa. There the max-imum stress is almost 2.5 times lower (significant decreasing) than the original pocket design.
Figure 19. Comparison between original design and new-designed solution.
5.2. Frame Analysis during Pedalling off Saddle—Asymmetric Bending and Final Design
It seems adequate to do suitable structural analysis with static and dynamic load ac-cording to previous chapters, where to load can be considered as “in-plane” load. The dynamic load can be defined via dynamic coefficient, in our case equal to, so dynamic load is three times higher than static load or via dynamic analysis (e.g., in ADAMS soft-ware). In-plane load corresponds to standard downhill scenarios when all forces (or their resulting force) act almost exclusively in the symmetry plane of the frame in order to maintain the stability of the “bicycle—rider” system. This is an example of riding on a saddle or out of the saddle, but the rider is standing statically evenly on both pedals (rid-ing downhill with jumps under normal conditions).
Figure 18. Stresses acting in front triangle, isometric view (a), side view (b) and detailed view (c).
In the chosen conceptual design, a multiple tension reduction in the resulting stressescan be observed, compared to the original design. When we compare the detailed simula-tion of both outputs from Figure 19, there is visibly reduced tension in the searched locationfrom the original σmax = 266.8 MPa to the current σmax = 105.2 MPa. There the maximumstress is almost 2.5 times lower (significant decreasing) than the original pocket design.
Symmetry 2022, 14, x FOR PEER REVIEW 21 of 29
(a) (b) (c)
Figure 18. Stresses acting in front triangle, isometric view (a), side view (b) and detailed view (c).
In the chosen conceptual design, a multiple tension reduction in the resulting stresses can be observed, compared to the original design. When we compare the detailed simu-lation of both outputs from Figure 19, there is visibly reduced tension in the searched location from the original σmax = 266.8 MPa to the current σmax = 105.2 MPa. There the max-imum stress is almost 2.5 times lower (significant decreasing) than the original pocket design.
Figure 19. Comparison between original design and new-designed solution.
5.2. Frame Analysis during Pedalling off Saddle—Asymmetric Bending and Final Design
It seems adequate to do suitable structural analysis with static and dynamic load ac-cording to previous chapters, where to load can be considered as “in-plane” load. The dynamic load can be defined via dynamic coefficient, in our case equal to, so dynamic load is three times higher than static load or via dynamic analysis (e.g., in ADAMS soft-ware). In-plane load corresponds to standard downhill scenarios when all forces (or their resulting force) act almost exclusively in the symmetry plane of the frame in order to maintain the stability of the “bicycle—rider” system. This is an example of riding on a saddle or out of the saddle, but the rider is standing statically evenly on both pedals (rid-ing downhill with jumps under normal conditions).
Figure 19. Comparison between original design and new-designed solution.

Symmetry 2022, 14, 255 21 of 28
5.2. Frame Analysis during Pedalling off Saddle—Asymmetric Bending and Final Design
It seems adequate to do suitable structural analysis with static and dynamic loadaccording to previous chapters, where to load can be considered as “in-plane” load. Thedynamic load can be defined via dynamic coefficient, in our case equal to, so dynamic loadis three times higher than static load or via dynamic analysis (e.g., in ADAMS software).In-plane load corresponds to standard downhill scenarios when all forces (or their resultingforce) act almost exclusively in the symmetry plane of the frame in order to maintain thestability of the “bicycle—rider” system. This is an example of riding on a saddle or out ofthe saddle, but the rider is standing statically evenly on both pedals (riding downhill withjumps under normal conditions).
However, there exist certain situations when the bicycle frame is loaded by a non-symmetrical load, e.g., when a rider goes uphill during a race and is forced to pedalexplosively, especially when pedalling of the saddle. In such a scenario, the rider isstanding only on one pedal (concentrates the force on only one pedal, e.g., right) andpushing it down while pulling up the opposite handlebar grip (e.g., left, see Figure 20).The final resultant force applied to a pedal is then composed of the rider’s weight andoptionally additional reaction force derived by pulling the opposite handlebar grip. Thiscauses an additional bending load acting out-of-the symmetry plane of the frame and thusleads to its lateral bending/twisting.
Symmetry 2022, 14, x FOR PEER REVIEW 22 of 29
However, there exist certain situations when the bicycle frame is loaded by a non-symmetrical load, e.g., when a rider goes uphill during a race and is forced to pedal ex-plosively, especially when pedalling of the saddle. In such a scenario, the rider is standing only on one pedal (concentrates the force on only one pedal, e.g., right) and pushing it down while pulling up the opposite handlebar grip (e.g., left, see Figure 20). The final resultant force applied to a pedal is then composed of the rider’s weight and optionally additional reaction force derived by pulling the opposite handlebar grip. This causes an additional bending load acting out-of-the symmetry plane of the frame and thus leads to its lateral bending/twisting.
Finally, we decided to carry out the additional analysis to verify these specific, and probably less favourable conditions as well. We decided to analyse the conditions (move-ments of the rider and the bicycle) by analysing the camera records of such a riding style in order to understand what movements they undertake and which forces and moments can act on individual parts of the bicycle frame during such a scenario. The time-lapse of our camera record is shown in figure Figure 20a,b where it is obvious that the rider’s po-sition is changing, as well as the bicycle position while off-saddle pedalling. Due to the difficulty of finding proper a mathematical model for its description, we will consider it with boundary conditions. In Figure 20c we can see a pedalling position in a situation where the rider is pushing via maximal force to the right pedal while his left foot is just placed on the left pedal. We can see the rider is not sitting on the saddle because he is pedalling much stronger compared to when he is sitting. While pedalling out of a saddle rider is holding a handlebar. There we can see also that the rider is pulling the opposite handlebar up with one hand and pushing the other handlebar with the other hand down.
(a) (b) (c)
Figure 20. Rider’s position while scenario “out of saddle pedalling”—front view with main acting forces in positions under maximum asymmetric loading: (a) position 1—rider starting to explosively push his right pedal down (standing on his right pedal) while simultaneously pull the left handle-bar; (b) position 2—opposite situation; (c) main forces generating maximum asymmetric load in the frame.
For further calculation, we will specify the forces acting in the front frame triangle according to the boundary condition shown in Figure 21 (out of saddle pedalling). Forces FA and FC were described in the previous part, and force FH acting to headset and FB acting to the bottom bracket will be described below.
FRH [N] force made by right hand FA [N] force acting to rear wheel FLH [N] force made by left hand
Figure 20. Rider’s position while scenario “out of saddle pedalling”—front view with main actingforces in positions under maximum asymmetric loading: (a) position 1—rider starting to explosivelypush his right pedal down (standing on his right pedal) while simultaneously pull the left handlebar;(b) position 2—opposite situation; (c) main forces generating maximum asymmetric load in the frame.
Finally, we decided to carry out the additional analysis to verify these specific, andprobably less favourable conditions as well. We decided to analyse the conditions (move-ments of the rider and the bicycle) by analysing the camera records of such a riding stylein order to understand what movements they undertake and which forces and momentscan act on individual parts of the bicycle frame during such a scenario. The time-lapseof our camera record is shown in figure Figure 20a,b where it is obvious that the rider’sposition is changing, as well as the bicycle position while off-saddle pedalling. Due to thedifficulty of finding proper a mathematical model for its description, we will consider itwith boundary conditions. In Figure 20c we can see a pedalling position in a situationwhere the rider is pushing via maximal force to the right pedal while his left foot is justplaced on the left pedal. We can see the rider is not sitting on the saddle because he ispedalling much stronger compared to when he is sitting. While pedalling out of a saddle

Symmetry 2022, 14, 255 22 of 28
rider is holding a handlebar. There we can see also that the rider is pulling the oppositehandlebar up with one hand and pushing the other handlebar with the other hand down.
For further calculation, we will specify the forces acting in the front frame triangleaccording to the boundary condition shown in Figure 21 (out of saddle pedalling). ForcesFA and FC were described in the previous part, and force FH acting to headset and FB actingto the bottom bracket will be described below.
Symmetry 2022, 14, x FOR PEER REVIEW 23 of 29
FA′ [N] force to rear triangle made from FA FRL [N] force made by right leg FB [N] reduced force to bottom bracket FLL [N] force made by left leg FC [N] force acting to front wheel FG [N] gravity force FC′ [N] force FC acting to bottom side of headset FH [N] force acting to upper side of head reduced from FRH and FLH
For calculating out of plane/asymmetric bending during out of saddle pedalling we will need to know the reduced forces acting in the bottom bracket and headset. We con-sider that forces acting on other elements of the frame assembly are the same in compari-son to the previous calculation.
(a) (b) (c)
Figure 21. Forces acting in the front triangle during pedalling out of saddle, (a) schematic descrip-tion in 3D view, (b) locations and directions of forces used in calculation and as input parameters in simulation software, (c) forces acting on pedals.
Further, the forces FB and FH need to be calculated and specified. Bracket force FB comes from leg activity reduced to the bottom bracket. It can be considered that it is the same size as the gravity force but the acting plane is at an incline of 10° with respect to the vertical plane (see Figure 20). The headset force FH is acting on headset and is defined as the hands’ reaction to the handlebars. Its value can be set as 10% of the gravity force. The chain force FCH made by pedalling acting on the bottom bracket needs to be calculated as well and its calculation is shown below. The left leg force FLL is derived by the rider’s left leg action and determined as a sum of the gravity force and the force made by the rider’s hand when trying to rotate the bicycle to the opposite side during out of saddle pedalling. We consider the FLH value to be approximately 300 N.
#C = 1030 N, #EF = 300 N
#EE = #C + #EF (38)
#EE = 1330 N
∑ #$% = 0; #G% − #0F = 0 → #0F = #G% (39)
∑ #$' = 0; #G' − #EE = 0 → #EE = #G' (40)
Figure 21. Forces acting in the front triangle during pedalling out of saddle, (a) schematic descriptionin 3D view, (b) locations and directions of forces used in calculation and as input parameters insimulation software, (c) forces acting on pedals.
FRH [N] force made by right handFA [N] force acting to rear wheelFLH [N] force made by left handFA′ [N] force to rear triangle made from FAFRL [N] force made by right legFB [N] reduced force to bottom bracketFLL [N] force made by left legFC [N] force acting to front wheelFG [N] gravity forceFC′ [N] force FC acting to bottom side of headsetFH [N] force acting to upper side of head reduced from FRH and FLH
For calculating out of plane/asymmetric bending during out of saddle pedalling wewill need to know the reduced forces acting in the bottom bracket and headset. We considerthat forces acting on other elements of the frame assembly are the same in comparison tothe previous calculation.
Further, the forces FB and FH need to be calculated and specified. Bracket force FBcomes from leg activity reduced to the bottom bracket. It can be considered that it is thesame size as the gravity force but the acting plane is at an incline of 10◦ with respect to thevertical plane (see Figure 20). The headset force FH is acting on headset and is defined asthe hands’ reaction to the handlebars. Its value can be set as 10% of the gravity force. Thechain force FCH made by pedalling acting on the bottom bracket needs to be calculated aswell and its calculation is shown below. The left leg force FLL is derived by the rider’s leftleg action and determined as a sum of the gravity force and the force made by the rider’shand when trying to rotate the bicycle to the opposite side during out of saddle pedalling.We consider the FLH value to be approximately 300 N.
FG = 1030 N, FLH = 300 N
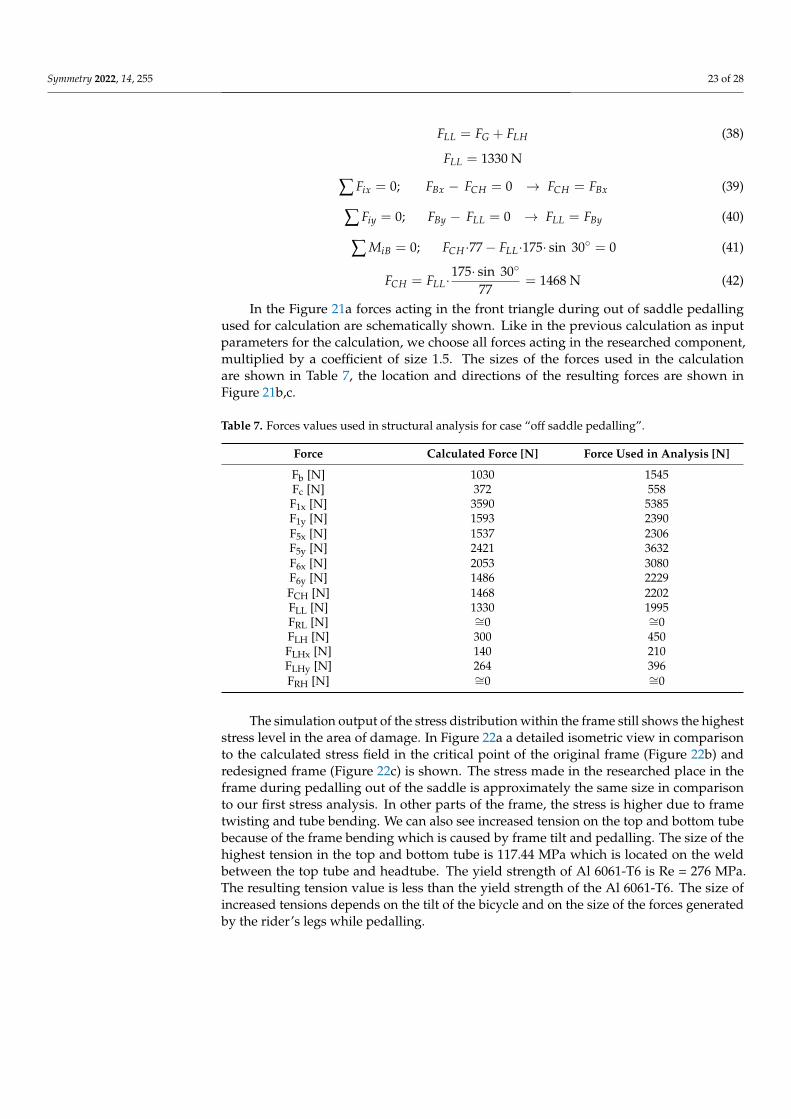
Symmetry 2022, 14, 255 23 of 28
FLL = FG + FLH (38)
FLL = 1330 N
∑ Fix = 0; FBx − FCH = 0 → FCH = FBx (39)
∑ Fiy = 0; FBy − FLL = 0 → FLL = FBy (40)
∑ MiB = 0; FCH ·77− FLL·175· sin 30◦ = 0 (41)
FCH = FLL·175· sin 30◦
77= 1468 N (42)
In the Figure 21a forces acting in the front triangle during out of saddle pedallingused for calculation are schematically shown. Like in the previous calculation as inputparameters for the calculation, we choose all forces acting in the researched component,multiplied by a coefficient of size 1.5. The sizes of the forces used in the calculationare shown in Table 7, the location and directions of the resulting forces are shown inFigure 21b,c.
Table 7. Forces values used in structural analysis for case “off saddle pedalling”.
Force Calculated Force [N] Force Used in Analysis [N]
Fb [N] 1030 1545Fc [N] 372 558F1x [N] 3590 5385F1y [N] 1593 2390F5x [N] 1537 2306F5y [N] 2421 3632F6x [N] 2053 3080F6y [N] 1486 2229FCH [N] 1468 2202FLL [N] 1330 1995FRL [N] ∼=0 ∼=0FLH [N] 300 450FLHx [N] 140 210FLHy [N] 264 396FRH [N] ∼=0 ∼=0
The simulation output of the stress distribution within the frame still shows the higheststress level in the area of damage. In Figure 22a a detailed isometric view in comparisonto the calculated stress field in the critical point of the original frame (Figure 22b) andredesigned frame (Figure 22c) is shown. The stress made in the researched place in theframe during pedalling out of the saddle is approximately the same size in comparisonto our first stress analysis. In other parts of the frame, the stress is higher due to frametwisting and tube bending. We can also see increased tension on the top and bottom tubebecause of the frame bending which is caused by frame tilt and pedalling. The size of thehighest tension in the top and bottom tube is 117.44 MPa which is located on the weldbetween the top tube and headtube. The yield strength of Al 6061-T6 is Re = 276 MPa.The resulting tension value is less than the yield strength of the Al 6061-T6. The size ofincreased tensions depends on the tilt of the bicycle and on the size of the forces generatedby the rider’s legs while pedalling.

Symmetry 2022, 14, 255 24 of 28Symmetry 2022, 14, x FOR PEER REVIEW 25 of 29
(a) (b) (c)
Figure 22. The results of the static structural analysis calculation during out of saddle pedalling—comparison of old and new design—detailed view on critical point: (a) meshing for FEM analysis on old design; (b) stress maximum in old design with pocket tube element; (c) stress maximum in new design with connection of two pipes at an angle.
In Figure 23 a graphical output of the researched place in the improved redesigned frame is shown. It can be seen that the stress level during out of saddle pedalling is 105.4 MPA, which is twice as high as normal symmetrical loading which was 54.70 MPa. The stress made during standing pedalling is significantly smaller than in the case of the old design as well as smaller than the yield strength of Al 6061-T6.
(a) (b)
Figure 23. The results of static structural analysis calculation during out of saddle pedalling—com-parison of old and new design: (a) old design with pocket tube element; (b) new design with con-nection of two pipes at an angle.
Final render of chosen conceptual design—using the CAD software Creo Parametric 2.0 a completed 3D model of the improved redesigned bicycle frame was created shown in Figure 24. In Figure 24b a detailed view of the designed linkage is shown. Figure 25 shows the final render in the designed color and the complete bike after the production and assembling.
Figure 22. The results of the static structural analysis calculation during out of saddle pedalling—comparison of old and new design—detailed view on critical point: (a) meshing for FEM analysis onold design; (b) stress maximum in old design with pocket tube element; (c) stress maximum in newdesign with connection of two pipes at an angle.
In Figure 23 a graphical output of the researched place in the improved redesignedframe is shown. It can be seen that the stress level during out of saddle pedalling is105.4 MPA, which is twice as high as normal symmetrical loading which was 54.70 MPa.The stress made during standing pedalling is significantly smaller than in the case of theold design as well as smaller than the yield strength of Al 6061-T6.
Symmetry 2022, 14, x FOR PEER REVIEW 25 of 29
(a) (b) (c)
Figure 22. The results of the static structural analysis calculation during out of saddle pedalling—comparison of old and new design—detailed view on critical point: (a) meshing for FEM analysis on old design; (b) stress maximum in old design with pocket tube element; (c) stress maximum in new design with connection of two pipes at an angle.
In Figure 23 a graphical output of the researched place in the improved redesigned frame is shown. It can be seen that the stress level during out of saddle pedalling is 105.4 MPA, which is twice as high as normal symmetrical loading which was 54.70 MPa. The stress made during standing pedalling is significantly smaller than in the case of the old design as well as smaller than the yield strength of Al 6061-T6.
(a) (b)
Figure 23. The results of static structural analysis calculation during out of saddle pedalling—com-parison of old and new design: (a) old design with pocket tube element; (b) new design with con-nection of two pipes at an angle.
Final render of chosen conceptual design—using the CAD software Creo Parametric 2.0 a completed 3D model of the improved redesigned bicycle frame was created shown in Figure 24. In Figure 24b a detailed view of the designed linkage is shown. Figure 25 shows the final render in the designed color and the complete bike after the production and assembling.
Figure 23. The results of static structural analysis calculation during out of saddle pedalling—comparison of old and new design: (a) old design with pocket tube element; (b) new design withconnection of two pipes at an angle.
Final render of chosen conceptual design—using the CAD software Creo Parametric2.0 a completed 3D model of the improved redesigned bicycle frame was created shownin Figure 24. In Figure 24b a detailed view of the designed linkage is shown. Figure 25shows the final render in the designed color and the complete bike after the productionand assembling.
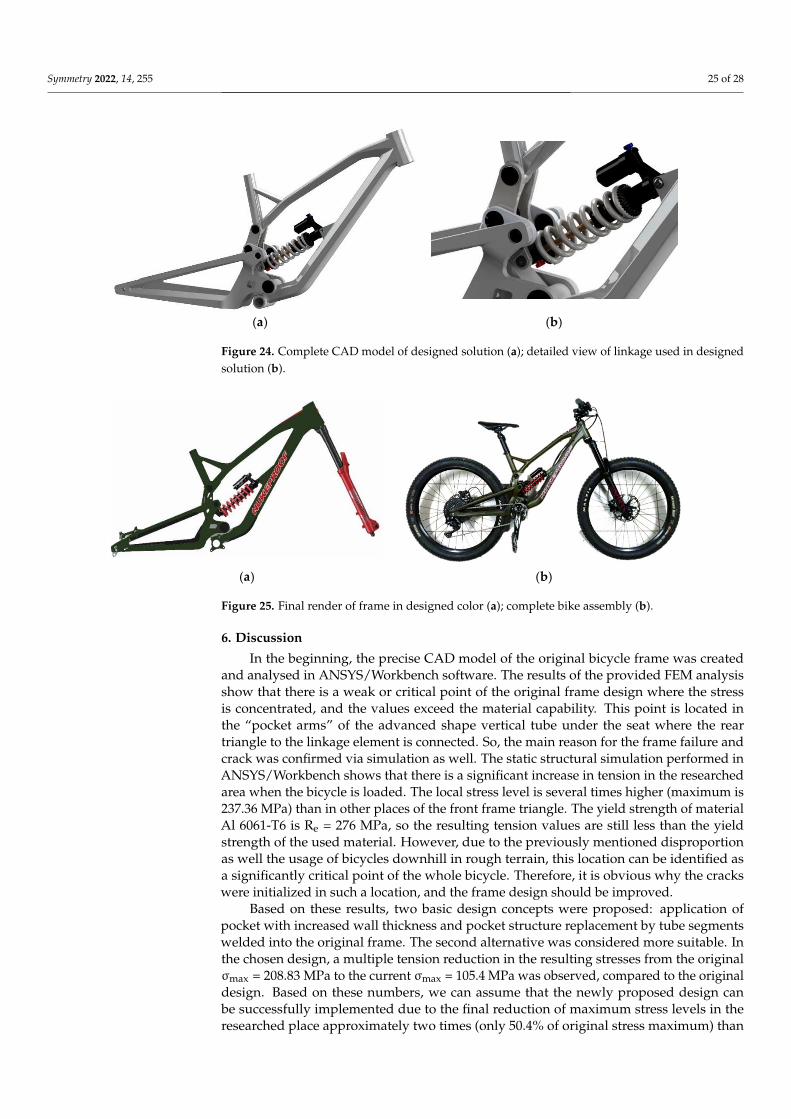
Symmetry 2022, 14, 255 25 of 28Symmetry 2022, 14, x FOR PEER REVIEW 26 of 29
(a) (b)
Figure 24. Complete CAD model of designed solution (a); detailed view of linkage used in de-signed solution (b).
(a) (b)
Figure 25. Final render of frame in designed color (a); complete bike assembly (b).
6. Discussion
In the beginning, the precise CAD model of the original bicycle frame was created and analysed in ANSYS/Workbench software. The results of the provided FEM analysis show that there is a weak or critical point of the original frame design where the stress is concentrated, and the values exceed the material capability. This point is located in the “pocket arms” of the advanced shape vertical tube under the seat where the rear triangle to the linkage element is connected. So, the main reason for the frame failure and crack was confirmed via simulation as well. The static structural simulation performed in AN-SYS/Workbench shows that there is a significant increase in tension in the researched area when the bicycle is loaded. The local stress level is several times higher (maximum is 237.36 MPa) than in other places of the front frame triangle. The yield strength of material Al 6061-T6 is Re = 276 MPa, so the resulting tension values are still less than the yield strength of the used material. However, due to the previously mentioned disproportion as well the usage of bicycles downhill in rough terrain, this location can be identified as a significantly critical point of the whole bicycle. Therefore, it is obvious why the cracks were initialized in such a location, and the frame design should be improved.
Based on these results, two basic design concepts were proposed: application of pocket with increased wall thickness and pocket structure replacement by tube segments welded into the original frame. The second alternative was considered more suitable. In the chosen design, a multiple tension reduction in the resulting stresses from the original σmax = 208.83 MPa to the current σmax = 105.4 MPa was observed, compared to the original design. Based on these numbers, we can assume that the newly proposed design can be successfully implemented due to the final reduction of maximum stress levels in the re-searched place approximately two times (only 50.4% of original stress maximum) than the
Figure 24. Complete CAD model of designed solution (a); detailed view of linkage used in designedsolution (b).
Symmetry 2022, 14, x FOR PEER REVIEW 26 of 29
(a) (b)
Figure 24. Complete CAD model of designed solution (a); detailed view of linkage used in de-signed solution (b).
(a) (b)
Figure 25. Final render of frame in designed color (a); complete bike assembly (b).
6. Discussion
In the beginning, the precise CAD model of the original bicycle frame was created and analysed in ANSYS/Workbench software. The results of the provided FEM analysis show that there is a weak or critical point of the original frame design where the stress is concentrated, and the values exceed the material capability. This point is located in the “pocket arms” of the advanced shape vertical tube under the seat where the rear triangle to the linkage element is connected. So, the main reason for the frame failure and crack was confirmed via simulation as well. The static structural simulation performed in AN-SYS/Workbench shows that there is a significant increase in tension in the researched area when the bicycle is loaded. The local stress level is several times higher (maximum is 237.36 MPa) than in other places of the front frame triangle. The yield strength of material Al 6061-T6 is Re = 276 MPa, so the resulting tension values are still less than the yield strength of the used material. However, due to the previously mentioned disproportion as well the usage of bicycles downhill in rough terrain, this location can be identified as a significantly critical point of the whole bicycle. Therefore, it is obvious why the cracks were initialized in such a location, and the frame design should be improved.
Based on these results, two basic design concepts were proposed: application of pocket with increased wall thickness and pocket structure replacement by tube segments welded into the original frame. The second alternative was considered more suitable. In the chosen design, a multiple tension reduction in the resulting stresses from the original σmax = 208.83 MPa to the current σmax = 105.4 MPa was observed, compared to the original design. Based on these numbers, we can assume that the newly proposed design can be successfully implemented due to the final reduction of maximum stress levels in the re-searched place approximately two times (only 50.4% of original stress maximum) than the
Figure 25. Final render of frame in designed color (a); complete bike assembly (b).
6. Discussion
In the beginning, the precise CAD model of the original bicycle frame was createdand analysed in ANSYS/Workbench software. The results of the provided FEM analysisshow that there is a weak or critical point of the original frame design where the stressis concentrated, and the values exceed the material capability. This point is located inthe “pocket arms” of the advanced shape vertical tube under the seat where the reartriangle to the linkage element is connected. So, the main reason for the frame failure andcrack was confirmed via simulation as well. The static structural simulation performed inANSYS/Workbench shows that there is a significant increase in tension in the researchedarea when the bicycle is loaded. The local stress level is several times higher (maximum is237.36 MPa) than in other places of the front frame triangle. The yield strength of materialAl 6061-T6 is Re = 276 MPa, so the resulting tension values are still less than the yieldstrength of the used material. However, due to the previously mentioned disproportionas well the usage of bicycles downhill in rough terrain, this location can be identified asa significantly critical point of the whole bicycle. Therefore, it is obvious why the crackswere initialized in such a location, and the frame design should be improved.
Based on these results, two basic design concepts were proposed: application ofpocket with increased wall thickness and pocket structure replacement by tube segmentswelded into the original frame. The second alternative was considered more suitable. Inthe chosen design, a multiple tension reduction in the resulting stresses from the originalσmax = 208.83 MPa to the current σmax = 105.4 MPa was observed, compared to the originaldesign. Based on these numbers, we can assume that the newly proposed design canbe successfully implemented due to the final reduction of maximum stress levels in theresearched place approximately two times (only 50.4% of original stress maximum) than
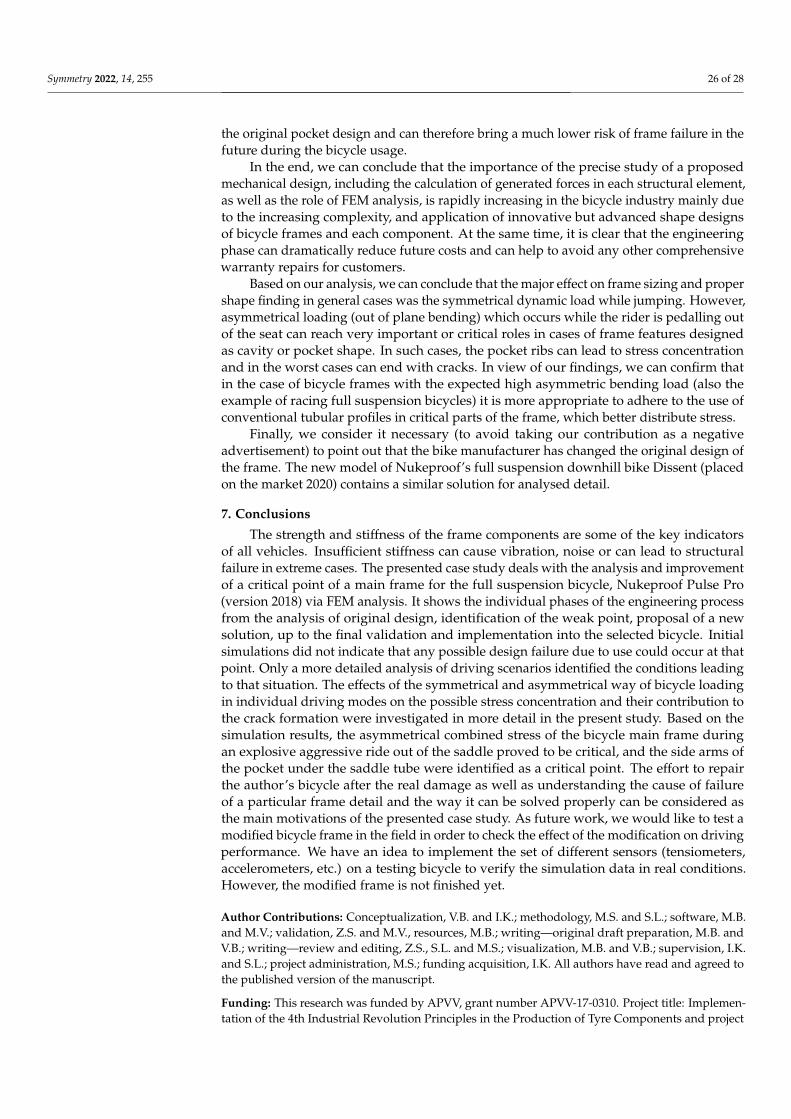
Symmetry 2022, 14, 255 26 of 28
the original pocket design and can therefore bring a much lower risk of frame failure in thefuture during the bicycle usage.
In the end, we can conclude that the importance of the precise study of a proposedmechanical design, including the calculation of generated forces in each structural element,as well as the role of FEM analysis, is rapidly increasing in the bicycle industry mainly dueto the increasing complexity, and application of innovative but advanced shape designsof bicycle frames and each component. At the same time, it is clear that the engineeringphase can dramatically reduce future costs and can help to avoid any other comprehensivewarranty repairs for customers.
Based on our analysis, we can conclude that the major effect on frame sizing and propershape finding in general cases was the symmetrical dynamic load while jumping. However,asymmetrical loading (out of plane bending) which occurs while the rider is pedalling outof the seat can reach very important or critical roles in cases of frame features designedas cavity or pocket shape. In such cases, the pocket ribs can lead to stress concentrationand in the worst cases can end with cracks. In view of our findings, we can confirm thatin the case of bicycle frames with the expected high asymmetric bending load (also theexample of racing full suspension bicycles) it is more appropriate to adhere to the use ofconventional tubular profiles in critical parts of the frame, which better distribute stress.
Finally, we consider it necessary (to avoid taking our contribution as a negativeadvertisement) to point out that the bike manufacturer has changed the original design ofthe frame. The new model of Nukeproof’s full suspension downhill bike Dissent (placedon the market 2020) contains a similar solution for analysed detail.
7. Conclusions
The strength and stiffness of the frame components are some of the key indicatorsof all vehicles. Insufficient stiffness can cause vibration, noise or can lead to structuralfailure in extreme cases. The presented case study deals with the analysis and improvementof a critical point of a main frame for the full suspension bicycle, Nukeproof Pulse Pro(version 2018) via FEM analysis. It shows the individual phases of the engineering processfrom the analysis of original design, identification of the weak point, proposal of a newsolution, up to the final validation and implementation into the selected bicycle. Initialsimulations did not indicate that any possible design failure due to use could occur at thatpoint. Only a more detailed analysis of driving scenarios identified the conditions leadingto that situation. The effects of the symmetrical and asymmetrical way of bicycle loadingin individual driving modes on the possible stress concentration and their contribution tothe crack formation were investigated in more detail in the present study. Based on thesimulation results, the asymmetrical combined stress of the bicycle main frame duringan explosive aggressive ride out of the saddle proved to be critical, and the side arms ofthe pocket under the saddle tube were identified as a critical point. The effort to repairthe author’s bicycle after the real damage as well as understanding the cause of failureof a particular frame detail and the way it can be solved properly can be considered asthe main motivations of the presented case study. As future work, we would like to test amodified bicycle frame in the field in order to check the effect of the modification on drivingperformance. We have an idea to implement the set of different sensors (tensiometers,accelerometers, etc.) on a testing bicycle to verify the simulation data in real conditions.However, the modified frame is not finished yet.
Author Contributions: Conceptualization, V.B. and I.K.; methodology, M.S. and S.L.; software, M.B.and M.V.; validation, Z.S. and M.V., resources, M.B.; writing—original draft preparation, M.B. andV.B.; writing—review and editing, Z.S., S.L. and M.S.; visualization, M.B. and V.B.; supervision, I.K.and S.L.; project administration, M.S.; funding acquisition, I.K. All authors have read and agreed tothe published version of the manuscript.
Funding: This research was funded by APVV, grant number APVV-17-0310. Project title: Implemen-tation of the 4th Industrial Revolution Principles in the Production of Tyre Components and project

Symmetry 2022, 14, 255 27 of 28
VEGA 1/0864/21. The APC was funded by VEGA 1/0864/21 and UNIZA grant system: Applicationof geometric specification in the evaluation process of intelligent production systems (12729).
Institutional Review Board Statement: Not applicable.
Informed Consent Statement: Not applicable.
Data Availability Statement: Data is contained within the article or on request from the correspond-ing author.
Conflicts of Interest: The authors declare no conflict of interest. The funders had no role in the designof the study; in the collection, analyses, or interpretation of data; in the writing of the manuscript, orin the decision to publish the results.
References1. Atkinson, G.; Davison, R.; Jeukendrup, A.; Passfield, L. Science and cycling: Current knowledge and future directions for research.
J. Sports Sci. 2003, 21, 767–787. [CrossRef]2. Bartoš, M. Proposal for the Modification of the Critical Point on the Frame of the Downhill Bike. Master’s Thesis, University of
Žilina, Žilina, Slovakia, 2019. (In Slovak).3. Macdermid, P.W.; Fink, P.W.; Miller, M.C.; Stannard, S. The impact of uphill cycling and bicycle suspension on downhill
performance during cross-country mountain biking. J. Sports Sci. 2017, 35, 1355–1363. [CrossRef]4. Cheng, Y.-C.; Lee, C.-K.; Pornteparak, P. An improved design of an on-road bicycle frame under fatigue testing simulations. J.
Chin. Inst. Eng. 2020, 43, 2158–7299. [CrossRef]5. Xiao, D.; Liu, X.; Du, W.; Wang, J.; He, T. Application of topology optimization to design an electric bicycle main frame. Structural
and Multidisc. Optimization 2012, 46, 913–929. [CrossRef]6. Liu, Y.-S.; Tsay, T.-S.; Wang, T.-C.; Liu, C.-F. Analyzing the influences of bicycle suspension systems on pedaling forces and human
body vibration. J. Vibroeng. 2014, 16, 2527–2535.7. Maier, O.; Gyorfi, B.; Wrede, J.; Kasper, R. Design and validation of a multi-body model of a front suspension bicycle and a
passive rider for braking dynamics investigations. Multibody Syst. Dyn. 2018, 42, 19–45. [CrossRef]8. Cicero, S.; Lacalle, R.; Cicero, R.; Fernández, D.; Méndez, D. Analysis of the cracking causes in an aluminium alloy bike frame.
Eng. Fail. Anal. 2011, 18, 36–46. [CrossRef]9. Covill, D.; Begg, S.; Elton, E.; Milne, M.; Morris, R.; Katz, T. Parametric Finite Element Analysis of Bicycle Frame Geometries.
Procedia Eng. 2014, 72, 441–446. [CrossRef]10. Covill, D.; Allard, P.; Allard, P.; Drouet, J.M.; Emerson, N. An Assessment of Bicycle Frame Behaviour under Various Load
Conditions Using Numerical Simulations. Procedia Eng. 2016, 147, 665–670. [CrossRef]11. Gupta, R.; Rao, G.V.R.S. Analysis of Mountain Bike Frame by FEM. IOSR J. Mech. Civ. Eng. 2016, 13, 60–71. [CrossRef]12. Liu, X.; Shi, G. Residual stress detection of welded parts based on excitation vibration response. Int. J. Adv. Robot. Syst. 2020, 17,
1–11. [CrossRef]13. Virgala, I.; Kelemen, M.; Božek, P.; Bobovský, Z.; Hagara, M.; Prada, E.; Ošcádal, P.; Varga, M. Investigation of Snake Robot
Locomotion Possibilities in a Pipe. Symmetry 2020, 12, 939. [CrossRef]14. Kelemen, M.; Virgala, I.; Lipták, T.; Miková, L’.; Filakovský, F.; Bulej, V. A Novel Approach for A Inverse Kinematics Solution of a
Redundant Manipulator. Appl. Sci. 2018, 8, 2229. [CrossRef]15. Redfield, R. Large motion mountain biking dynamics. Veh. Syst. Dyn. 2005, 43, 845–865. [CrossRef]16. Kopas, P.; Blatnický, M.; Sága, M.; Vaško, M. Identification of mechanical properties of weld joints of AlMgSi07.F25 aluminium
alloy. Metalurgija 2017, 56, 99–102.17. Vaško, A.; Belan, J. Fatigue tests of nodular cast iron at low and high frequency cyclic loading. Mater. Today Proc. 2017, 4,
5985–5988. [CrossRef]18. Chacon-Murguia, M.I.; Sandoval-Rodriguez, R.; Arias-Enriquez, O. Human Gait Feature Extraction Including a Kinematic
Analysis toward Robotic Power Assistance. Int. J. Adv. Robot. Syst. 2012, 9, 1–9. [CrossRef]19. Mellion, M.B. Common Cycling Injuries. Sports Med. 1991, 11, 52–70. [CrossRef] [PubMed]20. Ptak, M.; Wilhelm, J.; Sawicki, M.; Rusinski, E. Child safety on various bicycle-mounted seats during vehicle impact. Transport
2019, 34, 684–691. [CrossRef]21. Zuraulis, V.; Levulyte, L.; Sokolovskij, E. The impact of road roughness on the duration of contact between a vehicle wheel and
road surface. Transport 2014, 29, 431–439. [CrossRef]22. Bárnik, F.; Vaško, M.; Sága, M.; Handrik, M.; Sapietová, A. Mechanical properties of structures produced by 3D printing from
composite materials. MATEC Web Conf. 2019, 254, 01018. [CrossRef]23. Sniehotta, P. 3D printed belt wheels for use in design of bicycles. MM Sci. J. 2020, 13, 3813–3817. [CrossRef]24. Perfetto, D.; Lamanna, G.; Sepe, R.; De Luca, A. Design of a Bamboo Treadmill Bicycle Main Frame. Macromol. Symp. 2020, 389,
1900101. [CrossRef]25. Lin, H.-C.; Yu, B.-R.; Wang, J.-Y.; Lai, J.-Z.; Wu, J.Y. Achievement of Accurate Robotic Arm-based Bike Frame Quality Check Using
3D Geometry Mathematical Model. Appl. Sci. 2019, 9, 5355. [CrossRef]
Symmetry 2022, 14, 255 28 of 28
26. Yang, H.T.; Kwon, I.Y.; Randall, C.J.; Hansma, P.K.; Ly, F.S. Preliminary design, experiment, and numerical study of a prototypehydraulic bio-inspired damper. J. Sound Vib. 2019, 459, 114845. [CrossRef]
27. Nukeproof—Pulse Pro. Available online: http://nukeproof.com/products/pulse/ (accessed on 11 February 2019).28. MTBIKER—Short Cycling Dictionary: Frame Geometry and in-Depth Explanation of Terms. Available online: https://www.
mtbiker.sk/clanky/8807/kratky-cyklisticky-slovnik-geometria-ramu-a-hlbkovy-vyklad-pojmov.html (accessed on 21 March2019). (In Slovak).
29. MTBIKER—Comparison of Materials for Frame Construction—Properties, Advantages, Disadvantages and Their Use. Availableonline: https://www.mtbiker.sk/clanky/9471/porovnanie-materialov-na-stavbu-ramu-vlastnosti-vyhody-nevyhody-aich-vyuzitie.html (accessed on 30 March 2019). (In Slovak).
30. Nedal Aluminium 2005—EN AW-6061. Alloy Datasheet: EN AW-6061 [AlMg1SiCu]. Available online: http://www.nedalextrusion.com/files/9613/0678/5550/Data_6061.pdf (accessed on 18 April 2019).
31. Material Properties Data: 6061-T6 Aluminum, ASM Material Data Sheet Johnson Centrifugal—Aluminum Alloys. Availableonline: http://johnsoncentrifugal.com (accessed on 16 April 2019).
32. 6061 Aluminium Alloy. Available online: https://en.wikipedia.org/wiki/6061_aluminium_alloy (accessed on 19 April 2019).33. ALUNET—Alunet EN AW-6082 T6 (AlMgSi1 F28/F31/F32). Available online: http://www.alunet.cz/ENAW-6082 (accessed on
7 May 2019).34. AGMETAL—Conversion Tables of Material Qualities and Properties of Steels. Available online: http://www.agmetall.cz/cs/
jakosti-materialu-a-vlastnosti-oceli (accessed on 5 March 2019). (In Czech).
Copyright © 2022 FDOKUMEN