
Atmospheric circulation and precipitation in Italy for the last 50 years
17
INTERNATIONAL JOURNAL OF CLIMATOLOGY Int. J. Climatol. 22: 1455–1471 (2002) Published online in Wiley InterScience (www.interscience.wiley.com). DOI: 10.1002/joc.805 ATMOSPHERIC CIRCULATION AND PRECIPITATION IN ITALY FOR THE LAST 50 YEARS MICHELE BRUNETTI, a,b MAURIZIO MAUGERI, b TERESA NANNI b, * a ISAC-CNR, via P. Gobetti 101, I-40129 Bologna, Italy b Istituto di Fisica Generale Applicata, Universit` a degli Studi di Milano, via Brera 28, I-20121 Milan, Italy Received 19 September 2001 Revised 2 May 2002 Accepted 2 May 2002 ABSTRACT Daily precipitation series from 75 Italian stations, for the period 1951–95, are clustered into six regions and the average is calculated for each area. For each average series, the seasonal and annual total precipitation and the number of wet days are calculated. The relationship between precipitation and atmospheric circulation is examined using correlation analysis. Atmospheric circulation is represented by five indexes: the well known North Atlantic oscillation index, a blocking frequency index, a Mediterranean oscillation index based on the 500 hPa geopotential record for Algiers, a Western European zonal circulation index (WEZCI) constructed from Madrid + Barcelona and Trondheim + Lund surface pressure records, and a new Mediterranean circulation index (MCI) constructed from Marseille and Jerusalem surface pressure records. All the indexes are calculated using monthly series; then seasonal and yearly averages are obtained. The indexes that show the most interesting correlation with total precipitation and number of wet days are WEZCI and MCI. Trend analysis of the index series gives evidence of a signal connected to a strong increase in winter air pressure in the Mediterranean area starting around 1980. Copyright 2002 Royal Meteorological Society. KEY WORDS: Italy; trend analysis; precipitation; wet days; air pressure; circulation indexes 1. INTRODUCTION Nowadays, a topical issue in climate research is the application of global circulation models (GCMs) to predict climatic scenarios for the next decades or century. GCMs supply useful information for global or large scales, whereas their output cannot be directly used on the local scale of single grid points or below (Busuioc et al., 1999). A possible solution for obtaining some information on the local scale is the construction of downscaling procedures that allow large-scale information to be related to regional or local parameters (von Storch et al., 1993; Busuioc et al., 1999). Local changes in meteorological variables in mid-latitudes are mainly controlled by the atmospheric circulation (Parker et al., 1994; Hurrell, 1995; Hurrell and Van Loon, 1997). As a consequence, a significant fraction of local variability can be explained by more predictable large-scale oscillation patterns. This also applies to precipitation, in spite of its great time and space variability, as shown by some authors who evaluated the correlation of precipitation with indexes describing some well-known planetary-scale oscillations, like the North Atlantic oscillation (NAO) and El Ni ˜ no – southern oscillation (Hurrell, 1995; Kutiel et al., 1996; Mayers, 1996; Valero et al., 1996). As concerns central and northern Europe, most of the interannual variability in precipitation is related to the NAO, which is associated with changes in the westerlies (Hurrell, 1995): a positive NAO phase leads to more intense precipitation over northern Europe, whereas a negative NAO phase causes a precipitation shift towards southern Europe (Hurrell, 1995). * Correspondence to: Teresa Nanni, ISAC–CNR, via P. Gobetti 101, I-40129 Bologna, Italy; e-mail: [email protected] Copyright 2002 Royal Meteorological Society
Transcript of Atmospheric circulation and precipitation in Italy for the last 50 years

INTERNATIONAL JOURNAL OF CLIMATOLOGY
Int. J. Climatol. 22: 1455–1471 (2002)
Published online in Wiley InterScience (www.interscience.wiley.com). DOI: 10.1002/joc.805
ATMOSPHERIC CIRCULATION AND PRECIPITATION IN ITALY FOR THELAST 50 YEARS
MICHELE BRUNETTI,a,b MAURIZIO MAUGERI,b TERESA NANNIb,*a ISAC-CNR, via P. Gobetti 101, I-40129 Bologna, Italy
b Istituto di Fisica Generale Applicata, Universita degli Studi di Milano, via Brera 28, I-20121 Milan, Italy
Received 19 September 2001Revised 2 May 2002
Accepted 2 May 2002
ABSTRACT
Daily precipitation series from 75 Italian stations, for the period 1951–95, are clustered into six regions and the averageis calculated for each area. For each average series, the seasonal and annual total precipitation and the number of wetdays are calculated. The relationship between precipitation and atmospheric circulation is examined using correlationanalysis. Atmospheric circulation is represented by five indexes: the well known North Atlantic oscillation index, ablocking frequency index, a Mediterranean oscillation index based on the 500 hPa geopotential record for Algiers, aWestern European zonal circulation index (WEZCI) constructed from Madrid + Barcelona and Trondheim + Lund surfacepressure records, and a new Mediterranean circulation index (MCI) constructed from Marseille and Jerusalem surfacepressure records. All the indexes are calculated using monthly series; then seasonal and yearly averages are obtained.The indexes that show the most interesting correlation with total precipitation and number of wet days are WEZCI andMCI. Trend analysis of the index series gives evidence of a signal connected to a strong increase in winter air pressurein the Mediterranean area starting around 1980. Copyright 2002 Royal Meteorological Society.
KEY WORDS: Italy; trend analysis; precipitation; wet days; air pressure; circulation indexes
1. INTRODUCTION
Nowadays, a topical issue in climate research is the application of global circulation models (GCMs) to predictclimatic scenarios for the next decades or century. GCMs supply useful information for global or large scales,whereas their output cannot be directly used on the local scale of single grid points or below (Busuioc et al.,1999). A possible solution for obtaining some information on the local scale is the construction of downscalingprocedures that allow large-scale information to be related to regional or local parameters (von Storch et al.,1993; Busuioc et al., 1999).
Local changes in meteorological variables in mid-latitudes are mainly controlled by the atmosphericcirculation (Parker et al., 1994; Hurrell, 1995; Hurrell and Van Loon, 1997). As a consequence, a significantfraction of local variability can be explained by more predictable large-scale oscillation patterns. This alsoapplies to precipitation, in spite of its great time and space variability, as shown by some authors who evaluatedthe correlation of precipitation with indexes describing some well-known planetary-scale oscillations, like theNorth Atlantic oscillation (NAO) and El Nino–southern oscillation (Hurrell, 1995; Kutiel et al., 1996; Mayers,1996; Valero et al., 1996).
As concerns central and northern Europe, most of the interannual variability in precipitation is related tothe NAO, which is associated with changes in the westerlies (Hurrell, 1995): a positive NAO phase leads tomore intense precipitation over northern Europe, whereas a negative NAO phase causes a precipitation shifttowards southern Europe (Hurrell, 1995).
* Correspondence to: Teresa Nanni, ISAC–CNR, via P. Gobetti 101, I-40129 Bologna, Italy; e-mail: [email protected]
Copyright 2002 Royal Meteorological Society
1456 M. BRUNETTI, M. MAUGERI AND T. NANNI
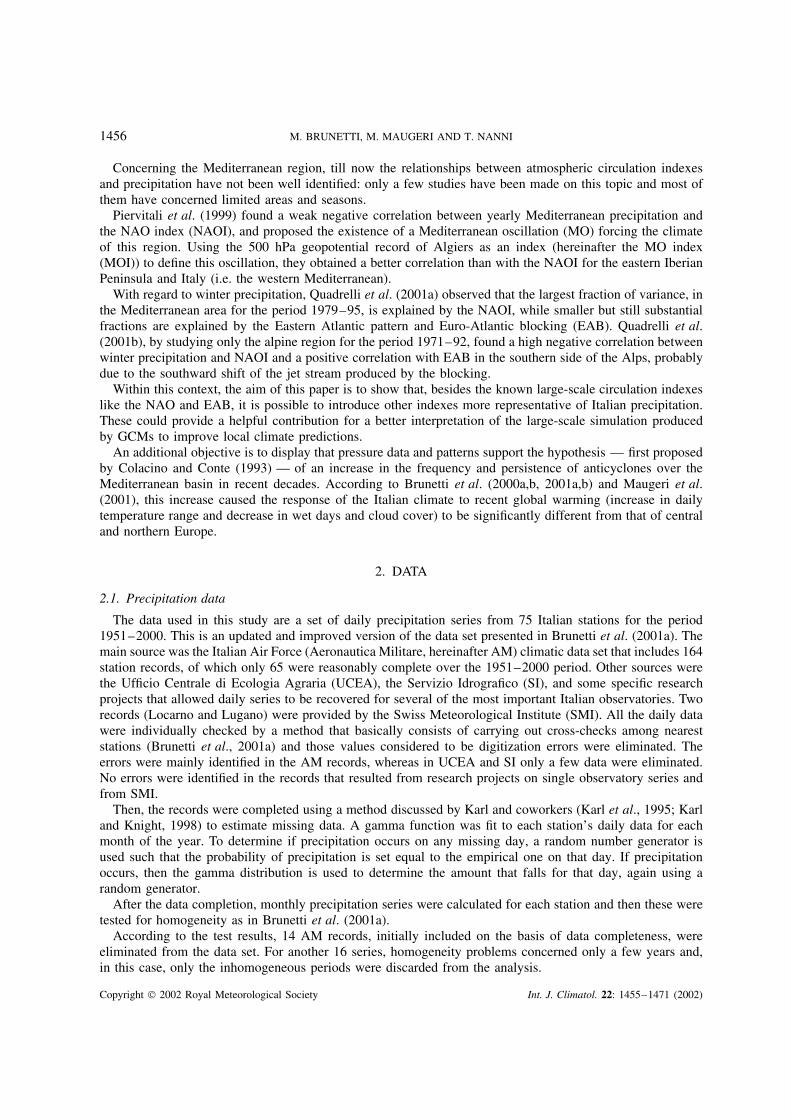
Concerning the Mediterranean region, till now the relationships between atmospheric circulation indexesand precipitation have not been well identified: only a few studies have been made on this topic and most ofthem have concerned limited areas and seasons.
Piervitali et al. (1999) found a weak negative correlation between yearly Mediterranean precipitation andthe NAO index (NAOI), and proposed the existence of a Mediterranean oscillation (MO) forcing the climateof this region. Using the 500 hPa geopotential record of Algiers as an index (hereinafter the MO index(MOI)) to define this oscillation, they obtained a better correlation than with the NAOI for the eastern IberianPeninsula and Italy (i.e. the western Mediterranean).
With regard to winter precipitation, Quadrelli et al. (2001a) observed that the largest fraction of variance, inthe Mediterranean area for the period 1979–95, is explained by the NAOI, while smaller but still substantialfractions are explained by the Eastern Atlantic pattern and Euro-Atlantic blocking (EAB). Quadrelli et al.(2001b), by studying only the alpine region for the period 1971–92, found a high negative correlation betweenwinter precipitation and NAOI and a positive correlation with EAB in the southern side of the Alps, probablydue to the southward shift of the jet stream produced by the blocking.
Within this context, the aim of this paper is to show that, besides the known large-scale circulation indexeslike the NAO and EAB, it is possible to introduce other indexes more representative of Italian precipitation.These could provide a helpful contribution for a better interpretation of the large-scale simulation producedby GCMs to improve local climate predictions.
An additional objective is to display that pressure data and patterns support the hypothesis — first proposedby Colacino and Conte (1993) — of an increase in the frequency and persistence of anticyclones over theMediterranean basin in recent decades. According to Brunetti et al. (2000a,b, 2001a,b) and Maugeri et al.(2001), this increase caused the response of the Italian climate to recent global warming (increase in dailytemperature range and decrease in wet days and cloud cover) to be significantly different from that of centraland northern Europe.
2. DATA
2.1. Precipitation data
The data used in this study are a set of daily precipitation series from 75 Italian stations for the period1951–2000. This is an updated and improved version of the data set presented in Brunetti et al. (2001a). Themain source was the Italian Air Force (Aeronautica Militare, hereinafter AM) climatic data set that includes 164station records, of which only 65 were reasonably complete over the 1951–2000 period. Other sources werethe Ufficio Centrale di Ecologia Agraria (UCEA), the Servizio Idrografico (SI), and some specific researchprojects that allowed daily series to be recovered for several of the most important Italian observatories. Tworecords (Locarno and Lugano) were provided by the Swiss Meteorological Institute (SMI). All the daily datawere individually checked by a method that basically consists of carrying out cross-checks among neareststations (Brunetti et al., 2001a) and those values considered to be digitization errors were eliminated. Theerrors were mainly identified in the AM records, whereas in UCEA and SI only a few data were eliminated.No errors were identified in the records that resulted from research projects on single observatory series andfrom SMI.
Then, the records were completed using a method discussed by Karl and coworkers (Karl et al., 1995; Karland Knight, 1998) to estimate missing data. A gamma function was fit to each station’s daily data for eachmonth of the year. To determine if precipitation occurs on any missing day, a random number generator isused such that the probability of precipitation is set equal to the empirical one on that day. If precipitationoccurs, then the gamma distribution is used to determine the amount that falls for that day, again using arandom generator.
After the data completion, monthly precipitation series were calculated for each station and then these weretested for homogeneity as in Brunetti et al. (2001a).
According to the test results, 14 AM records, initially included on the basis of data completeness, wereeliminated from the data set. For another 16 series, homogeneity problems concerned only a few years and,in this case, only the inhomogeneous periods were discarded from the analysis.
Copyright 2002 Royal Meteorological Society Int. J. Climatol. 22: 1455–1471 (2002)
ATMOSPHERIC CIRCULATION AND ITALIAN PRECIPITATION 1457
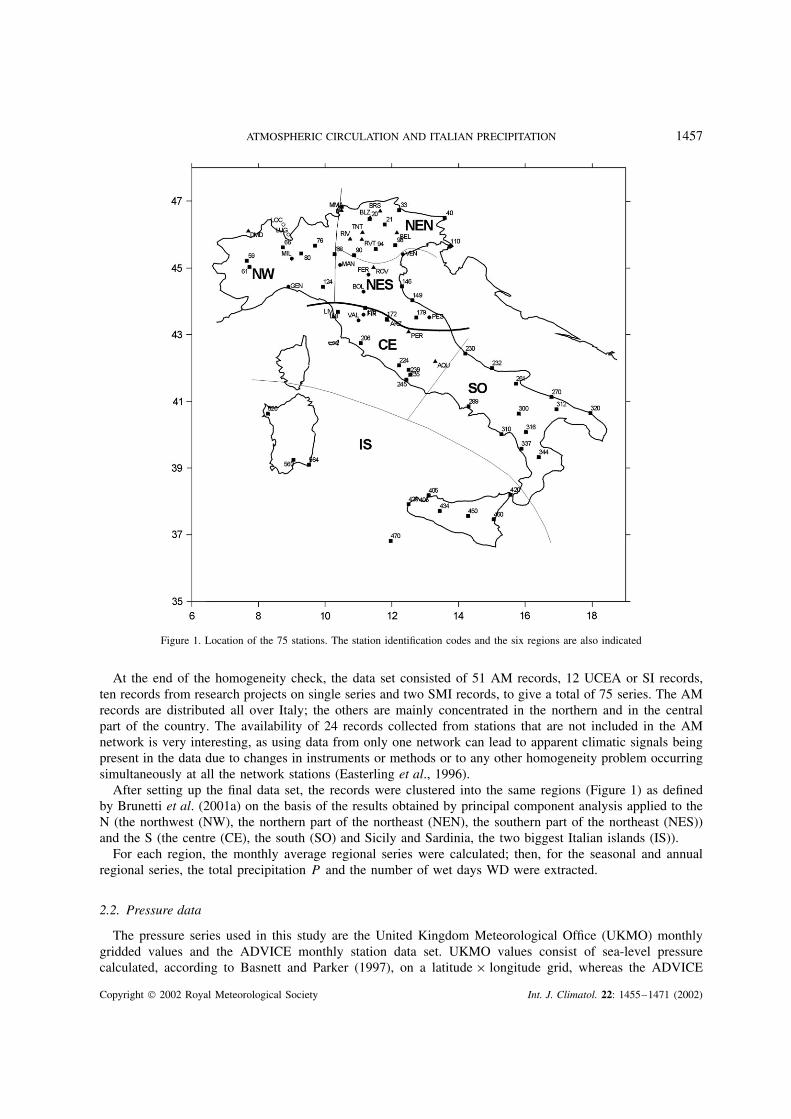
Figure 1. Location of the 75 stations. The station identification codes and the six regions are also indicated
At the end of the homogeneity check, the data set consisted of 51 AM records, 12 UCEA or SI records,ten records from research projects on single series and two SMI records, to give a total of 75 series. The AMrecords are distributed all over Italy; the others are mainly concentrated in the northern and in the centralpart of the country. The availability of 24 records collected from stations that are not included in the AMnetwork is very interesting, as using data from only one network can lead to apparent climatic signals beingpresent in the data due to changes in instruments or methods or to any other homogeneity problem occurringsimultaneously at all the network stations (Easterling et al., 1996).
After setting up the final data set, the records were clustered into the same regions (Figure 1) as definedby Brunetti et al. (2001a) on the basis of the results obtained by principal component analysis applied to theN (the northwest (NW), the northern part of the northeast (NEN), the southern part of the northeast (NES))and the S (the centre (CE), the south (SO) and Sicily and Sardinia, the two biggest Italian islands (IS)).
For each region, the monthly average regional series were calculated; then, for the seasonal and annualregional series, the total precipitation P and the number of wet days WD were extracted.
2.2. Pressure data
The pressure series used in this study are the United Kingdom Meteorological Office (UKMO) monthlygridded values and the ADVICE monthly station data set. UKMO values consist of sea-level pressurecalculated, according to Basnett and Parker (1997), on a latitude × longitude grid, whereas the ADVICE
Copyright 2002 Royal Meteorological Society Int. J. Climatol. 22: 1455–1471 (2002)

1458 M. BRUNETTI, M. MAUGERI AND T. NANNI
data set consists of 51 station records that cover Europe and the surrounding areas, set up in the framework ofthe European Commission project ADVICE, Annual to Decadal Variability of Climate in Europe (ADVICE,1998; Jones et al., 1999).
The advantage of the gridded values is that they are less sensitive to errors in single station records.However, station records have the great advantage of covering a much longer period, extending in severalcases to the 18th century. For the same reason, sea-level pressures are more suitable than geopotential heightsfor long-term climate studies.
2.3. Pressure indexes
Starting from the ADVICE records, we constructed some circulation indexes with the aim of relating thevariability of P and WD in Italy with air-pressure patterns over Europe. The indexes were obtained on amonthly basis as differences between standardized pressure station anomalies. The ADVICE series used toconstruct the indexes were tested by means of the Craddock homogeneity test (Craddock, 1979).
Moreover, we used the NAOI (obtained as the difference between the standardized anomalies of Reykjavikand Gibraltar monthly pressure series and calculated by using the data provided by the Climatic ResearchUnit of the University of East Anglia, UK), the blocking frequency (BF) index (Tibaldi and Molteni, 1990)and the MOI (Piervitali et al., 1999).
3. RESULTS AND DISCUSSION
3.1. Pressure evolution over Europe
Figure 2 shows the map of the UKMO sea-level pressure trend slope over Europe, for individual seasonsand for a full year, for the period 1951–95. The significance level was calculated using the Mann–Kendallnon-parametric test. The light grey areas indicate a significance level (SL) greater than 95%, and the darkgrey areas indicate an SL greater than 99%.
A positive trend (up to 0.04 hPa/year) below 50 °N with highly significant values over all the Mediterraneanbasin, and a negative trend above 60 °N with highly significant values in the eastern North Atlantic, in particularover Iceland and Greenland, are evident on a yearly basis.
The positive trend over the Mediterranean is almost completely due to the winter season, where the slopeis up to 0.12 hPa/year (Figure 2(a)). The positive trend over the Azores and the negative one over Greenlandare mostly due to spring (with slopes up to 0.14 and −0.17 hPa/year) and winter (0.7 and −0.19 hPa/year)(Figure 2(a) and (b)).
These trends, negative in the eastern North Atlantic and positive in the eastern central Atlantic (the tworegions where the NAO dipoles are located), are consistent with the increase in the westerlies accompaniedby the strengthening of the NAO observed for the last decade (Hurrell, 1995). This kind of variation inthe European pressure patterns can justify an increase in precipitation at the higher latitudes (i.e. north ofthe Alps) and a decrease in the Mediterranean region, due to a northward shift of the jet stream, especiallyin winter.
The positive pressure trend over the Mediterranean also agrees with the hypothesis of an increase in thenumber and the persistence of anticyclones in this region.
3.2. Circulation indexes
As mentioned above, the dipolar behaviour in the pressure trend is well described by the increase in theNAOI observed for the last decade. The NAO is the dominant mode of variability of the surface atmosphericcirculation over the North Atlantic (Hurrell, 1995), and many studies have been aimed at relating climatevariability to this pattern. Figure 2, however, shows a different behaviour of pressure trends over the Atlanticareas and the Mediterranean basin. This led us to look for a circulation index, aimed at characterizing thelink between Italian precipitation variability and atmospheric circulation that is better than the NAO.
Copyright 2002 Royal Meteorological Society Int. J. Climatol. 22: 1455–1471 (2002)

ATMOSPHERIC CIRCULATION AND ITALIAN PRECIPITATION 1459
80(a)
(c)
(e)
(d)
(b)
60
40
20-60 -40 -20 0 20 40 60
80
60
40
20-60 -40 -20 0 20 40 60
80
60
40
20
80
60
40
20
-60 -40 -20 0 20 40 60
-60 -40 -20 0 20 40 60
80
60
40
20-60 -40 -20 0 20 40 60
Figure 2. Maps of pressure trends (hPa/year) and SLs (light grey areas indicate an SL greater than 95%; the dark grey ones an SLgreater than 99%): (a) winter; (b) spring; (c) summer; (d) autumn; (e) year
Colacino and Conte (1993) and Piervitali et al. (1999) performed a climatological study of the Mediterraneanand observed a dipolar oscillation in pressure patterns between central–western and eastern areas. Theyintroduced the MOI to describe this oscillation. It explains the yearly precipitation variability above theMediterranean basin better than the NAO. However, its drawbacks are that it is available only for the last50 years and it describes a bipolar pattern using only one station’s series (the 500 hPa geopotential recordfor Algiers).
Copyright 2002 Royal Meteorological Society Int. J. Climatol. 22: 1455–1471 (2002)
1460 M. BRUNETTI, M. MAUGERI AND T. NANNI
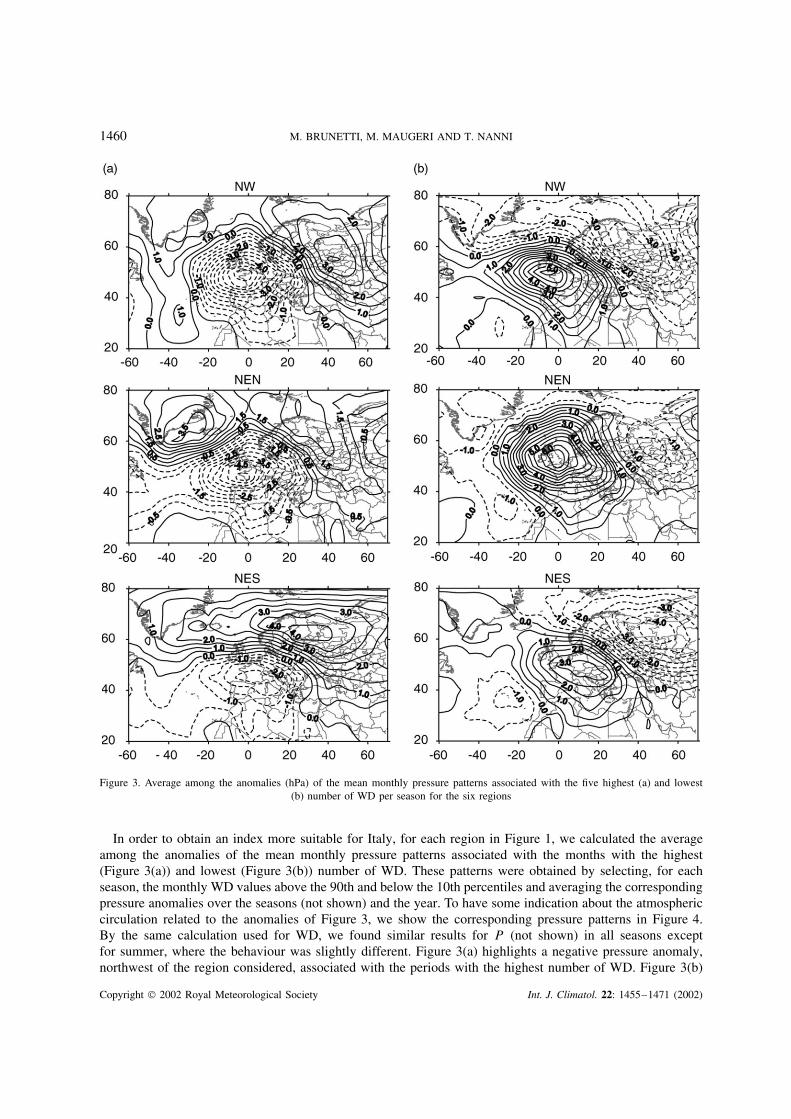
Figure 3. Average among the anomalies (hPa) of the mean monthly pressure patterns associated with the five highest (a) and lowest(b) number of WD per season for the six regions
In order to obtain an index more suitable for Italy, for each region in Figure 1, we calculated the averageamong the anomalies of the mean monthly pressure patterns associated with the months with the highest(Figure 3(a)) and lowest (Figure 3(b)) number of WD. These patterns were obtained by selecting, for eachseason, the monthly WD values above the 90th and below the 10th percentiles and averaging the correspondingpressure anomalies over the seasons (not shown) and the year. To have some indication about the atmosphericcirculation related to the anomalies of Figure 3, we show the corresponding pressure patterns in Figure 4.By the same calculation used for WD, we found similar results for P (not shown) in all seasons exceptfor summer, where the behaviour was slightly different. Figure 3(a) highlights a negative pressure anomaly,northwest of the region considered, associated with the periods with the highest number of WD. Figure 3(b)
Copyright 2002 Royal Meteorological Society Int. J. Climatol. 22: 1455–1471 (2002)

ATMOSPHERIC CIRCULATION AND ITALIAN PRECIPITATION 1461
Figure 3. (Continued)
shows a positive anomaly, northwest of the region considered, associated with the periods with the lowestWD. These negative and positive anomalies shift progressively southward as the region we consider is locatedfurther south. So there is not a unique pressure pattern associated with wet months in Italy. As a consequence,theoretically, different pressure indexes should be constructed for the different regions. However, even if theconstruction of an index for each region were the best solution to provide evidence of the link between wetdays and atmospheric circulation, it is in contrast with our main objective of obtaining indexes that can beused for long-term studies. In fact, at the present time, the availability of secular high-quality pressure seriesis rather low, especially in the southern part of the Mediterranean basin. So our basic problem was to verifyhow much of the Italian wet days (precipitation) variability can be captured by constructing indexes basedon stations for which high-quality secular records are currently available.
Copyright 2002 Royal Meteorological Society Int. J. Climatol. 22: 1455–1471 (2002)


1464 M. BRUNETTI, M. MAUGERI AND T. NANNI
Tabl
eI.
Seas
onal
and
year
lyco
rrel
atio
nva
lues
ofP
and
WD
with
circ
ulat
ion
inde
xes,
for
all
the
regi
ons.
All
valu
esin
dica
ted
have
anSL
grea
ter
than
95%
;bo
ldfa
ceva
lues
have
anSL
grea
ter
than
99%
NA
OI
BF
MO
IM
CI
WE
ZC
I
WSp
SA
YW
YW
SpS
AY
WSp
SA
Y
Prec
ipita
tion
NW
−0.2
9−0
.31
−0.6
6−0
.29
−0.4
0−0
.42
−0.4
2−0
.61
−0.5
8N
EN
−0.3
3−0
.30
−0.6
8−0
.48
−0.4
7−0
.36
−0.4
9−0
.32
NE
S−0
.50
−0.3
6−0
.51
−0.4
4−0
.34
−0.3
9−0
.61
−0.4
4−0
.42
−0.4
0−0
.56
CE
−0.5
7−0
.65
−0.4
0−0
.44
−0.4
7−0
.39
−0.5
9−0
.52
−0.5
3−0
.49
−0.4
4SO
−0.3
7−0
.26
−0.3
1−0
.47
−0.4
8−0
.51
−0.5
3−0
.58
−0.5
2−0
.46
IS−0
.36
−0.0
2−0
.53
−0.4
0−0
.32
−0.4
0−0
.46
N−0
.38
−0.3
6−0
.71
−0.2
6−0
.38
−0.4
5−0
.48
−0.4
8−0
.58
−0.5
4S
−0.5
4−0
.27
−0.3
4−0
.60
−0.4
6−0
.46
−0.3
4−0
.65
−0.6
3−0
.55
−0.5
5−0
.59
Wet
days
NW
−0.3
9−0
.33
−0.4
3−0
.62
−0.3
1−0
.49
−0.4
0−0
.49
−0.3
7−0
.57
−0.4
9N
EN
−0.4
1−0
.40
−0.6
8−0
.49
−0.3
4−0
.44
−0.4
4−0
.29
NE
S−0
.55
−0.3
1−0
.39
−0.6
1−0
.48
−0.4
6−0
.42
−0.5
9−0
.43
−0.4
2−0
.52
−0.3
9C
E−0
.59
−0.3
2−0
.36
−0.2
9−0
.68
−0.3
9−0
.64
−0.4
8−0
.56
−0.5
7−0
.35
−0.5
2−0
.36
SO−0
.52
−0.3
3−0
.50
−0.5
3−0
.54
−0.3
8−0
.47
−0.3
4−0
.58
−0.5
2−0
.36
−0.2
9−0
.38
IS−0
.49
−0.3
70.
32−0
.66
−0.4
0−0
.47
N−0
.47
−0.3
2−0
.46
−0.6
9−0
.30
−0.5
2−0
.43
−0.5
3−0
.29
−0.5
5−0
.45
S−0
.62
−0.3
2−0
.41
−0.4
8−0
.37
−0.6
0−0
.30
−0.3
5−0
.60
−0.4
2−0
.68
−0.6
3−0
.41
−0.5
2−0
.50
Copyright 2002 Royal Meteorological Society Int. J. Climatol. 22: 1455–1471 (2002)

ATMOSPHERIC CIRCULATION AND ITALIAN PRECIPITATION 1465
Figure 5. As Figure 3, but for MCI
Table I shows, for each region, the correlation coefficients (SL > 95%) between yearly and seasonal P andWD and some circulation indexes.
The NAOI plays an important role in the winter season; for the other seasons, it does not explain a significantproportion of the P and WD variance. On a yearly basis, better results were obtained by considering thecorrelation with the MOI, even if few significant values were found for P . No significant correlation wasfound with the BF index. Both MCI and WEZCI explain the P and WD variances better than the NAOI.A highly significant correlation is evident for all seasons and for the year, with the proportion of explainedvariance being up to 42% for the S in winter P and 46% in winter WD (for WEZCI), and up to 50% forthe N in winter P and 48% in winter WD (for MCI). The explained variance reaches 64% if we considerthe indexes calculated as the differences between the anomalies series rather than the standardized series (notshown); however, we preferred to follow the same method used to calculate the NAOI.
The correlation coefficients are always higher for the winter season, due to the more coherent large-scalecirculation typical for this season. Moreover, all the correlations are higher for the WD than for P ; this is
Copyright 2002 Royal Meteorological Society Int. J. Climatol. 22: 1455–1471 (2002)

1466 M. BRUNETTI, M. MAUGERI AND T. NANNI
Figure 6. As Figure 5, but plotted with pressure data (hPa) rather than pressure anomalies
probably due to the fact that WD is a better indicator of the persistence of a perturbed weather conditionthan P . In fact, a season can be highly rainy even if WD is low. So, on a seasonal time scale, WD is a betterindex for studying the relationship between precipitation and pressure patterns.
On the basis of the correlation values, MCI and WEZCI are almost equivalent; there are a few differences,depending on the season and region considered: the former is better for winter in the northern and centralregions, and the latter is better for the other seasons in the northern and central regions and throughout theyear in the south.
In order to understand the meaning of these differences better, we considered the total P and number of WDcorresponding to the highest and lowest five monthly values per season of the MCI and WEZCI series. Theresults, in Table II, show that the values of P and WD associated with the lowest MCI are higher than thoseassociated with the lowest WEZCI, whereas the values of P and WD associated with the highest WEZCIare lower than those associated with the highest MCI. This indicates that the MCI is more representative ofperturbed weather conditions than the WEZCI, which, on the contrary, is more representative of dry spells
Copyright 2002 Royal Meteorological Society Int. J. Climatol. 22: 1455–1471 (2002)

ATMOSPHERIC CIRCULATION AND ITALIAN PRECIPITATION 1467
Figure 7. As Figure 3, but for WEZCI
over Italy. Therefore, MCI can be considered as an Italian wetness index, whereas WEZCI can be consideredas an Italian dryness index.
4. CONCLUSIONS
In this paper we have analysed the variations of P and WD, from 75 Italian daily precipitation records and forthe last half century, in relation to pressure anomalies above Europe and to some global and local circulationindexes. The aim of the research was to identify indexes representing Italian precipitation variability. A furtherobjective was to verify if pressure data and patterns support the hypothesis of the increase in the frequencyand persistence of winter sub-tropical anticyclones over the central–western Mediterranean basin in the last20 years that has been advanced by some authors in order to justify the recent trends of climatic parameters in
Copyright 2002 Royal Meteorological Society Int. J. Climatol. 22: 1455–1471 (2002)

1468 M. BRUNETTI, M. MAUGERI AND T. NANNI
Figure 8. As Figure 7, but plotted with pressure data (hPa) rather than pressure anomalies
this area (Colacino and Conte, 1993; Piervitali et al., 1997; Brunetti et al., 2000a,b, 2001a,b; Maugeri et al.,2001).
The main results are as follows:
• The gridded pressure data over Europe provide evidence of a significant positive trend of surface airpressure over the Mediterranean. The trend is due to the winter season, where the increase is up to 6hPa/50 years.
• The increase in winter air pressure over the Mediterranean basin is well captured by the WEZCI, MCI, andNAOI. The behaviour of these indexes (Figure 9) confirms the hypothesis that the strong signals in Italianrecords observed after 1980 (Brunetti et al., 2000a,b, 2001a,b; Maugeri et al., 2001) are due to changes inatmospheric circulation. Moreover, the indexes indicate not only that the pressure has increased over theMediterranean, but also that, besides the increase in the south–north pressure gradient, there is an increasein the difference between western and eastern Mediterranean pressure, supporting the hypothesis of morefrequent anticyclones over the central–western part of the Mediterranean basin.
Copyright 2002 Royal Meteorological Society Int. J. Climatol. 22: 1455–1471 (2002)

ATMOSPHERIC CIRCULATION AND ITALIAN PRECIPITATION 1469
Table II. Mean of five values of P and WD corresponding to the five highest or lowest monthly values per each seasonof MC and WEZC indexes
NW NEN NES CE SO IS
P WD P WD P WD P WD P WD P WD
MCI minimumW 126 9 84 8 81 10 126 13 105 10 68 8Sp 205 15 143 13 94 11 128 14 71 9 50 7S 144 10 114 11 73 6 63 5 49 4 14 1A 229 13 173 12 123 13 189 14 84 9 80 4
MCI maximumW 42 4 28 2 32 4 52 5 63 7 48 6Sp 99 7 67 6 44 4 44 4 38 4 33 2S 82 4 87 8 44 3 31 2 21 2 3 0A 82 4 39 4 35 3 58 3 53 4 73 6
WEZCI minimumW 79 8 59 6 88 10 123 12 123 12 74 10Sp 122 12 84 7 102 11 98 12 98 12 62 8S 133 9 99 10 54 5 28 2 28 2 10 0A 198 9 99 8 86 9 105 9 105 9 112 8
WEZCI maximumW 29 2 34 2 30 2 29 2 44 4 37 4Sp 63 5 70 7 39 4 35 4 26 4 25 2S 49 2 67 5 30 2 22 1 16 1 9 0A 46 3 55 5 28 3 45 4 48 3 36 2
Figure 9. Winter NAO (a), WEZC (b) and MC (c) index series. The mean values for the periods 1951–79 and 1980–95 are alsoindicated
Copyright 2002 Royal Meteorological Society Int. J. Climatol. 22: 1455–1471 (2002)

1470 M. BRUNETTI, M. MAUGERI AND T. NANNI
• The NAOI explains a significant proportion of the P and WD variance, but only in winter; so, it is not themost appropriate index for Italian precipitation. The WEZCI, introduced by Slonosky et al. (2001), and theMCI, introduced in this work, capture a greater proportion of P and WD variance for all seasons. Hence,they are more suitable for representing Italian precipitation variability. These indexes were constructed bytaking into account both the link between precipitation and atmospheric circulation in the last 50 yearsand the availability of high-quality secular pressure records. In the future, the availability of new secularpressure records (e.g. Cagliari and Palermo) may allow the construction of new indexes to capture a higherfraction of southern Italian precipitation variability.
• The MCI and WEZCI are almost equivalent: the former is more representative of wet conditions, and thelatter is more suitable for representing dry periods.
In the near future we will set up a daily precipitation database, covering 120–130 years (back to about1875), homogeneously distributed all over Italy to extend this kind of study backward. The purpose is tounderstand whether the historically warm and dry periods (like 1860–70 and 1920–50, which are very similarto the last 20 years) can be associated with the same circulation patterns we found to be responsible for theclimate evolution during the last 50 years. Moreover, among our future goals, there is also the possibility toextend our database coverage to other Mediterranean countries, in order to verify if this climatic behaviouris a characteristic of the whole basin or only an Italian peculiarity and, then, to verify if the MCI is still asuitable measure.
ACKNOWLEDGEMENTS
We would like to thank the Aeronautica Militare and the Servizi Idrografici for their cooperation in accessingdatabases. Special thanks go to Dr Buzzi for his helpful suggestions. The research was partially developedin the framework of the project ‘Local climate variability in relation to global climatic change phenomena’funded by the Italian Ministry of Education and Research.
REFERENCES
ADVICE. 1998. Final report of the European Commission Project ADVICE: annual to decadal variability in climate in Europe. ClimaticResearch Unit: University of East Anglia, Norwich.
Basnett TA, Parker DE. 1997. Development of the global mean sea level pressure data set GMSLP2. CRTN 79. Hadley Centre forClimate Prediction and Research: London.
Brunetti M, Maugeri M, Nanni T. 2000a. Variations of temperature and precipitation in Italy from 1866 to 1995. Theoretical and AppliedClimatology 65: 165–174.
Brunetti M, Maugeri M, Nanni T. 2000b. Trends of minimum and maximum daily temperatures in Italy from 1865 to 1996. Theoreticaland Applied Climatology 66: 49–60.
Brunetti M, Colacino M, Maugeri M, Nanni T. 2001a. Trends in the daily intensity of precipitation in Italy from 1951 to 1996.International Journal of Climatology 21: 299–316.
Brunetti M, Maugeri M, Nanni T, Navarra A. 2001b. Droughts and extreme events in regional daily Italian precipitation series.International Journal of Climatology 21: 543–558.
Busuioc A, von Storch H, Schnur R. 1999. Verification of GCM-generated regional seasonal precipitation for current climate and ofstatistical downscaling estimates under changing climate conditions. Journal of Climate 12: 258–272.
Colacino M, Conte M. 1993. Greenhouse effect and pressure patterns in the Mediterranean Basin. Il Nuovo Cimento C 16: 67–76.Craddock JM. 1979. Methods for comparing annual rainfall records for climatic purposes. Weather 34: 332–346.Easterling DR, Peterson TC, Karl TR. 1996. On the development and use of homogenised climate datasets. Journal of Climate 9:
1429–1434.Hurrell JW. 1995. Decadal trend in the North Atlantic oscillation: regional temperature and precipitation. Science 269: 676–679.Hurrell JW, Van Loon H. 1997. Decadal variations in climate associated with the North Atlantic oscillation. Climate Change 36:
301–326.Jones PD, Davies TD, Lister DH, Slonosky V, Jonsson T, Barring L, Jonsson P, Maheras P, Kolyva-Machera F, Barriendos M, Martin-
Vide J, Alcoforado MJ, Wanner H, Pfister C, Schuepbach E, Kass E, Schmith T, Jacobeit J, Beck C. 1999. Monthly mean pressurereconstructions for Europe. International Journal of Climatology 19: 347–364.
Karl TR, Knight RW. 1998. Secular trends of precipitation amount frequency and intensity in the United States. Bulletin of the AmericanMeteorological Society 79: 231–241.
Karl TR, Knight RW, Plummer N. 1995. Trends in high-frequency climate variability in the twentieth century. Nature 377: 217–220.Kutiel H, Maheras P, Guika S. 1996. Circulation and extreme rainfall conditions in the eastern Mediterranean during the last century.
International Journal of Climatology 16: 73–92.
Copyright 2002 Royal Meteorological Society Int. J. Climatol. 22: 1455–1471 (2002)

ATMOSPHERIC CIRCULATION AND ITALIAN PRECIPITATION 1471
Maugeri M, Bagnati Z, Brunetti M, Nanni T. 2001. Trend in Italian total cloud amount, 1951–1996. Geophysical Research Letters 28:4551–4554.
Mayers J. 1996. Spatial and temporal fluctuation of monthly rainfall in the British Isles and variations in the mid-latitude westerlycirculation. International Journal of Climatology 16: 585–596.
Mennella C. 1967. Il Clima d’Italia. Fratelli Conti Editori: Napoli.Parker DE, Jones PD, Folland CK, Bevan A. 1994. Interdecadal changes of surface temperature since the late nineteenth century.
Journal of Geophysical Research 99: 14 373–14 399.Piervitali E, Colacino M, Conte M. 1997. Signals of climatic change in the central–western Mediterranean basin. Theoretical and
Applied Climatology 58: 211–219.Piervitali E, Colacino M, Conte M. 1999. Rainfall over the central–western Mediterranean basin in the period 1951–1995. Part II:
precipitation scenarios. Il Nuovo Cimento C 22: 649–661.Quadrelli R, Pavan V, Molteni F. 2001a. Wintertime variability of Mediterranean precipitation and its links with large-scale circulation
anomalies. Climate Dynamics 17: 457–466.Quadrelli R, Lazzeri M, Caqcciamani C, Tibaldi S. 2001b. Observed winter Alpine precipitation variability and links with large-scale
circulation patterns. Climate Research 17: 275–284.Slonosky VC, Jones PD, Davies TD. 2001. Atmospheric circulation and surface temperature in Europe from the 18th century to 1995.
International Journal of Climatology 21: 63–75.Tibaldi S, Molteni F. 1990. On the operational predictability of blocking. Tellus A 42: 343–365.Valero F, Doblas FJ, Gonzalez JF. 1996. On long-term evolution of seasonal precipitation in south-western Europe. Annales Geophysicae
14: 976–985.Von Storch H, Zorita E, Cubasch U. 1993. Downscaling of global climate change estimates to regional scales: an application to Iberian
rainfall in wintertime. Journal of Climate 6: 1161–1171.
Copyright 2002 Royal Meteorological Society Int. J. Climatol. 22: 1455–1471 (2002)