
Relationship between daily atmospheric circulation types and winter dry/wet spells in western Iran
13
INTERNATIONAL JOURNAL OF CLIMATOLOGY Int. J. Climatol. 32: 1056–1068 (2012) Published online 1 April 2011 in Wiley Online Library (wileyonlinelibrary.com) DOI: 10.1002/joc.2330 Relationship between daily atmospheric circulation types and winter dry/wet spells in western Iran Tayeb Raziei, a * Isabella Bordi, b Luis S. Pereira, c Jo˜ ao Corte-Real d and Jo˜ ao A. Santos e a Soil Conservation and Watershed Management Research Institute (SCWMRI), Tehran, Iran b Department of Physics, University of Rome “La Sapienza”, Rome, Italy c CEER – Biosystems Engineering, Institute of Agronomy, Technical University of Lisbon, Portugal d Institute of Mediterranean Agrarian Sciences (ICAM), Group Water, Soil and Climate, University of ´ Evora, Portugal e Centre for the Research and Technology of Agro-Environmental and Biological Sciences (CITAB), University of Tr´ as-os-Montes and Alto Douro, 5001-801 Vila Real, Portugal ABSTRACT: Aiming at better understanding the causes and processes leading to meteorological dry and wet episodes in western Iran, the present study investigates the space and time variability of winter dry/wet events and their associated large-scale atmospheric driving circulations. Using monthly precipitation data of 140 weather stations for 1965–2000, meteorological dry/wet spells are assessed through the 1-month Standardized Precipitation Index (SPI). By applying the Principal Component Analysis (PCA) with Varimax rotation to the SPI field, three sub-regions of independent climatic variability are identified. Large-scale daily atmospheric circulation patterns are then classified into twelve circulation types (CTs) by applying PCA to the 500 hPa geopotential height fields coupled with the non-iterative K-means clustering technique, in which extreme rotated principal component scores, in their positive and negative phases, are considered as potential groups and their centroids are computed by averaging all days that fulfil the extreme score criterion. The linkage between daily CTs and winter dry/wet spells in the region is investigated by correlating the frequencies of occurrence of each CT with the time series of dry/wet events, derived from both the rotated principal component scores of SPI and the SPI series at three representative stations of the identified sub-regions. Severe/extreme events have also been considered. A performance index is applied to test the relationship between CTs and dry/wet events. Results show statistically significant correlations between the frequencies of occurrence of the identified CTs and of dry/wet spells at the three representative stations, suggesting that particular CTs are potential predictors for the winter dry/wet events in western Iran. Copyright 2011 Royal Meteorological Society KEY WORDS circulation types; large-scale patterns; precipitation extremes; dry/wet events; Iran Received 23 March 2009; Revised 3 January 2011; Accepted 22 February 2011 1. Introduction Regional weather and climate around the globe are strongly influenced by large-scale atmospheric circulation patterns (McKendry, 1994). In fact, during the Northern Hemisphere winter, mid-latitude meteorological condi- tions are mainly modulated by the intense activity of the synoptic eddies along the storm tracks, which also govern many precipitation mechanisms. Since precipitation vari- ability in a region plays an essential role in water resource management, many efforts have been undertaken in order to identify the large-scale atmospheric circulation patterns leading to precipitation (Bogardi et al., 1994; Frakes and Yarnal, 1997; Lamb, 1977). The classification of circulation patterns, as an attempt to reduce the dimensionality of the analysis by isolating a relatively small number of representative circulation types (hereafter CTs), has long been used in synoptic *Correspondence to: Tayeb Raziei, Soil Conservation & Watershed Management Research Institute (SCWMRI), Tehran, Iran. E-mail: [email protected] climatology to assess the influence of CTs on climate variables, including precipitation (Yarnal, 1993; Huth, 1996). Many authors have studied the possible link- ages between atmospheric circulation patterns and surface variables, such as precipitation and temperature (Chen and Hellstr¨ om, 1999; Romero et al., 1999; Kilsby et al., 1998; Wibig, 1999; Kidson, 2000; Xoplaki et al., 2000; Santos et al., 2005). Corte-Real et al. (1998) and Trigo and DaCamara (2000), using Principal Component Anal- ysis (PCA) and Cluster Analysis (CA), classified the main atmospheric patterns associated with precipitation in Por- tugal. Furthermore, several studies found relationships between CTs and natural hazards, including droughts. Duckstein et al. (1993) identified CTs leading to floods in Arizona, USA, while Bogardi et al. (1994) and Pesti et al. (1996), applying the Bhalme and Mooly Drought Index (BMDI) and the Palmer Drought Severity Index (PDSI), linked circulation patterns to drought occur- rences in Nebraska and New Mexico, respectively. Pon- gracz et al. (1999, 2003), using monthly frequencies of Copyright 2011 Royal Meteorological Society
Transcript of Relationship between daily atmospheric circulation types and winter dry/wet spells in western Iran
INTERNATIONAL JOURNAL OF CLIMATOLOGYInt. J. Climatol. 32: 1056–1068 (2012)Published online 1 April 2011 in Wiley Online Library(wileyonlinelibrary.com) DOI: 10.1002/joc.2330
Relationship between daily atmospheric circulation typesand winter dry/wet spells in western Iran
Tayeb Raziei,a* Isabella Bordi,b Luis S. Pereira,c Joao Corte-Reald and Joao A. Santose
a Soil Conservation and Watershed Management Research Institute (SCWMRI), Tehran, Iranb Department of Physics, University of Rome “La Sapienza”, Rome, Italy
c CEER – Biosystems Engineering, Institute of Agronomy, Technical University of Lisbon, Portugald Institute of Mediterranean Agrarian Sciences (ICAM), Group Water, Soil and Climate, University of Evora, Portugal
e Centre for the Research and Technology of Agro-Environmental and Biological Sciences (CITAB), University of Tras-os-Montes and AltoDouro, 5001-801 Vila Real, Portugal
ABSTRACT: Aiming at better understanding the causes and processes leading to meteorological dry and wet episodesin western Iran, the present study investigates the space and time variability of winter dry/wet events and their associatedlarge-scale atmospheric driving circulations. Using monthly precipitation data of 140 weather stations for 1965–2000,meteorological dry/wet spells are assessed through the 1-month Standardized Precipitation Index (SPI). By applying thePrincipal Component Analysis (PCA) with Varimax rotation to the SPI field, three sub-regions of independent climaticvariability are identified. Large-scale daily atmospheric circulation patterns are then classified into twelve circulationtypes (CTs) by applying PCA to the 500 hPa geopotential height fields coupled with the non-iterative K-means clusteringtechnique, in which extreme rotated principal component scores, in their positive and negative phases, are considered aspotential groups and their centroids are computed by averaging all days that fulfil the extreme score criterion. The linkagebetween daily CTs and winter dry/wet spells in the region is investigated by correlating the frequencies of occurrence ofeach CT with the time series of dry/wet events, derived from both the rotated principal component scores of SPI and theSPI series at three representative stations of the identified sub-regions. Severe/extreme events have also been considered. Aperformance index is applied to test the relationship between CTs and dry/wet events. Results show statistically significantcorrelations between the frequencies of occurrence of the identified CTs and of dry/wet spells at the three representativestations, suggesting that particular CTs are potential predictors for the winter dry/wet events in western Iran. Copyright 2011 Royal Meteorological Society
KEY WORDS circulation types; large-scale patterns; precipitation extremes; dry/wet events; Iran
Received 23 March 2009; Revised 3 January 2011; Accepted 22 February 2011
1. Introduction
Regional weather and climate around the globe arestrongly influenced by large-scale atmospheric circulationpatterns (McKendry, 1994). In fact, during the NorthernHemisphere winter, mid-latitude meteorological condi-tions are mainly modulated by the intense activity of thesynoptic eddies along the storm tracks, which also governmany precipitation mechanisms. Since precipitation vari-ability in a region plays an essential role in water resourcemanagement, many efforts have been undertaken in orderto identify the large-scale atmospheric circulation patternsleading to precipitation (Bogardi et al., 1994; Frakes andYarnal, 1997; Lamb, 1977).
The classification of circulation patterns, as an attemptto reduce the dimensionality of the analysis by isolatinga relatively small number of representative circulationtypes (hereafter CTs), has long been used in synoptic
* Correspondence to: Tayeb Raziei, Soil Conservation & WatershedManagement Research Institute (SCWMRI), Tehran, Iran.E-mail: [email protected]
climatology to assess the influence of CTs on climatevariables, including precipitation (Yarnal, 1993; Huth,1996). Many authors have studied the possible link-ages between atmospheric circulation patterns and surfacevariables, such as precipitation and temperature (Chenand Hellstrom, 1999; Romero et al., 1999; Kilsby et al.,1998; Wibig, 1999; Kidson, 2000; Xoplaki et al., 2000;Santos et al., 2005). Corte-Real et al. (1998) and Trigoand DaCamara (2000), using Principal Component Anal-ysis (PCA) and Cluster Analysis (CA), classified the mainatmospheric patterns associated with precipitation in Por-tugal.
Furthermore, several studies found relationshipsbetween CTs and natural hazards, including droughts.Duckstein et al. (1993) identified CTs leading to floodsin Arizona, USA, while Bogardi et al. (1994) and Pestiet al. (1996), applying the Bhalme and Mooly DroughtIndex (BMDI) and the Palmer Drought Severity Index(PDSI), linked circulation patterns to drought occur-rences in Nebraska and New Mexico, respectively. Pon-gracz et al. (1999, 2003), using monthly frequencies of
Copyright 2011 Royal Meteorological Society

CIRCULATION TYPES AND WINTER DRY/WET SPELLS IN WESTERN IRAN 1057
occurrence of CTs and the Southern Oscillation Index(SOI) as input for a conditional fuzzy model, have suc-cessfully predicted the regional droughts in Hungary andNebraska, USA. Stahl and Demuth (2001) found posi-tive frequency anomalies of several high-pressure CTsduring drought in southern Germany, while Fowler andKilsby (2002) showed that the severity and duration ofdroughts in eastern England can be related to the frequen-cies of occurrence of some weather types. Kutiel et al.(2001) identified sea level pressure patterns associatedwith dry/wet conditions in Turkey. Bordi et al. (2007)analysed large-scale atmospheric circulations associatedwith dry and wet extremes in Sicily.
Despite the encouraging results obtained so far, therelationship between CTs and drought is still an openquestion: while the large-scale pattern associated with adrought event can be easily isolated, it is not true that theoccurrence of such a pattern always leads to a droughtepisode. In fact, drought is never the result of a singlecause and usually manifests itself on time scales longerthan the typical time scales of precipitation occurrence.Since precipitation is a critical parameter for drought riskassessment, the large-scale atmospheric features leadingto precipitation events and their relationship with theoccurrence of dry/wet phenomena should be analysed(e.g. Vicente-Serrano and Lopez-Moreno, 2006). It isworth noting that some factors influencing precipitationoccurrence and amount in a region, such as local oro-graphic effects or convective mechanisms, prevent a fullexplanation of local precipitation events through large-scale features. These shortcomings should be consideredwhen developing solutions for a given region. Therefore,further efforts should be made to investigate the poten-tial predictability of dry/wet spells using CTs for westernIran.
Precipitation in Iran is characterized by high spatial-temporal variability. Increasing water demands dueto population growth, urbanisation and industrialisa-tion have amplified the vulnerability of the country todroughts. While some authors have attempted to analysedrought mechanisms in Iran (Morid et al., 2006; Razieiet al., 2008, 2009) or the possible link between atmo-spheric indices (Southern Oscillation Index and ArticOscillation Index) and surface climate variables (Naze-mosadat and Cordery, 2000; Nazemosadat and Ghasemi,2004; Ghasemi and Khalili, 2006; Raziei et al., 2009),rare attempts have been devoted to a classification ofatmospheric circulation patterns and their relationshipwith dry/wet spells. Alijani (2002), applying the S-mode PCA with Varimax rotation to the winter 500 hPageopotential height, studied the spatial-temporal variabil-ity of the 500 hPa flow patterns and their relationshipwith precipitation and temperature anomalies over Iran.Ghasemi and Khalili (2008) investigated the possiblelinkage between the North Sea-Caspian Pattern (NCP)and winter temperature variability in Iran; NCP has astrong negative correlation with winter temperatures andthe AO (Arctic Oscillation) further enhances the cor-relation at all stations. Furthermore, the NCP positive
phase is associated with strong cyclonic activity overIran, enhancing precipitation. Additional efforts shouldthus be made to assess the relationship between CTs anddry/wet spells.
Therefore, the present study aims at identifying daily500 hPa CTs and their relative impact on the occurrenceof dry/wet events during winter months in western Iran,where long records of rain-gauge data are available.Dry/wet conditions are assessed using the StandardizedPrecipitation Index (SPI) (McKee et al., 1993). SPIhas several advantages that make it a useful tool forthis study: it is standardized, allowing the identificationof dry/wet episodes and the comparison of climaticconditions in areas with different hydrological regimes;it can be computed on multiple time scales, monitoringdifferent kinds of dry/wet events; and events are keyedaccording to their values.
2. Data and methods
2.1. Data
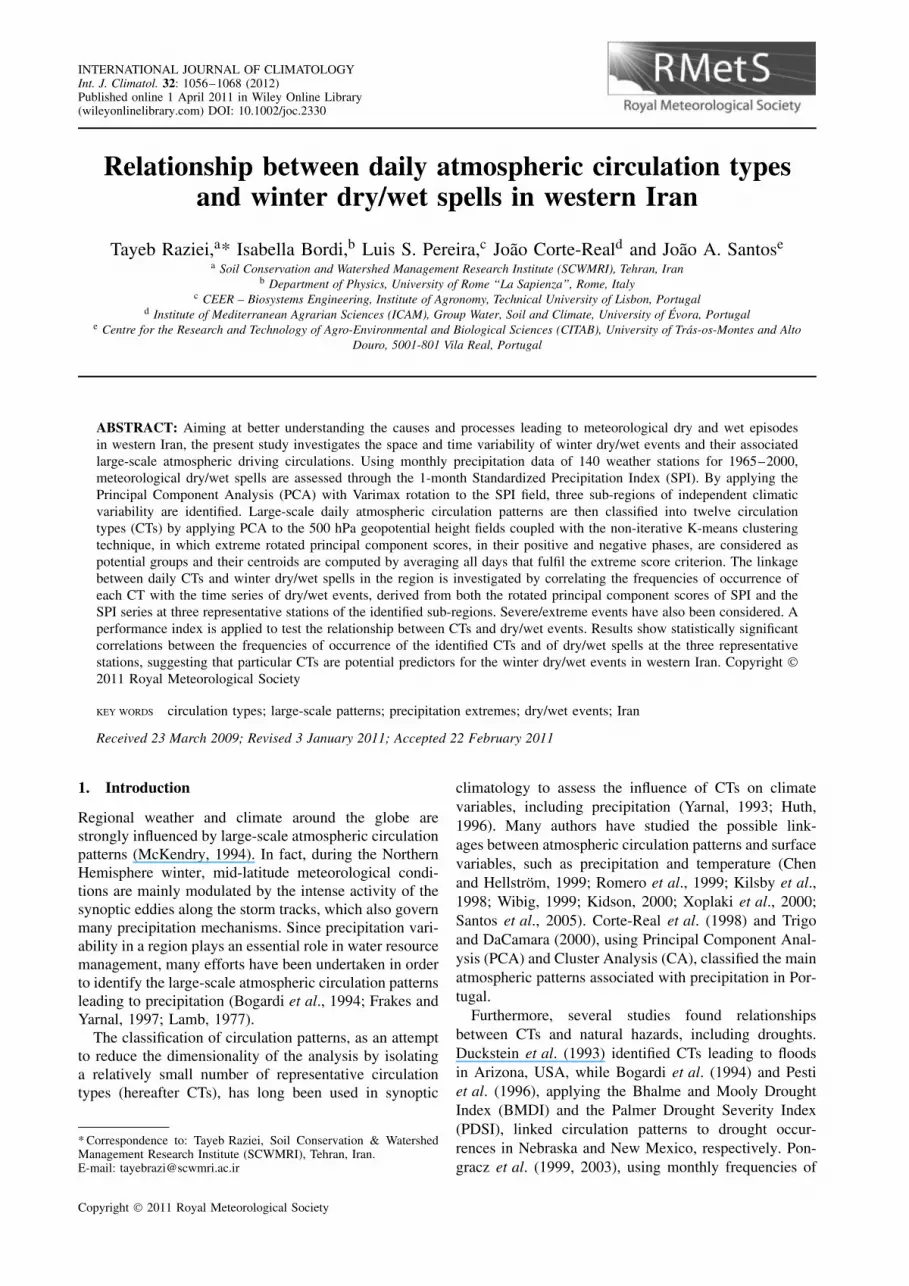
Monthly precipitation data from 140 stations in westernIran were selected and 35 winters (December–March,DJFM) in 1965–2000 were considered (Figure 1). Dataquality and homogeneity were previously checked (Razieiet al., 2008, 2009). For CT classification, daily means ofthe 500 hPa geopotential height, defined over a 2.5° lat-itude × longitude grid and covering an area from theMediterranean basin to the Middle East (10 °E–80 °E,20°N–60°N), were retrieved from the NCEP/NCARreanalysis (Kalnay et al., 1996; Kistler et al., 2001). TheDJFM period is representative of the rainy season inIran and most of its precipitation is strongly related tolarge-scale atmospheric circulation patterns. The selectedsector can be considered large enough to identify all pos-sible large-scale atmospheric features that may influenceprecipitation in Iran.
2.2. SPI computation
SPI was originally proposed by McKee et al. (1993) toquantify precipitation deficits on multiple time scalesthat reflect the impact of drought on the availabilityof different water resources (Keyantash and Dracup,2002; Heim, 2002). It is based on precipitation aloneand its computation requires a long-term precipitationrecord. For each month, the corresponding time seriesis fitted to a Gamma probability distribution (Guttman,1999) that is normalized through an equal-probabilitytransformation. Positive (negative) SPI values indicategreater (lower) than median precipitation (Bordi andSutera, 2004). In particular, SPI values between −0.99and +0.99 denote near-normal conditions, between −1and −1.49 moderately dry, between −1.5 and −1.99severely dry, and less than −2 extremely dry conditions.The same applies to positive values (wet classes).
Meteorological drought is usually an expression ofa negative precipitation departure from normal condi-tions over a sufficiently long time period. Typically
Copyright 2011 Royal Meteorological Society Int. J. Climatol. 32: 1056–1068 (2012)
1058 T. RAZIEI et al.
Figure 1. a) Topographic map of Iran, and b) network of meteorological stations across the target area.
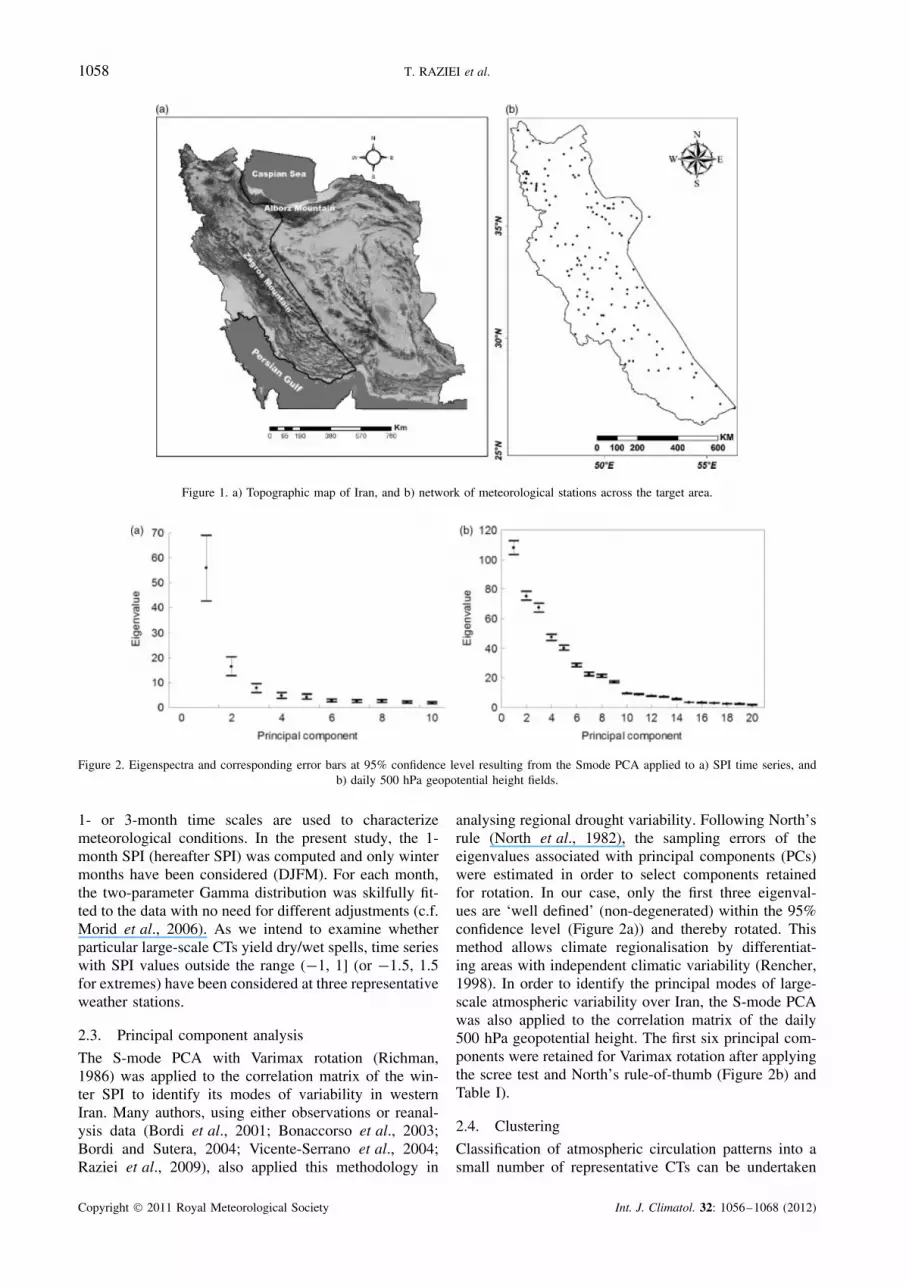
Figure 2. Eigenspectra and corresponding error bars at 95% confidence level resulting from the Smode PCA applied to a) SPI time series, andb) daily 500 hPa geopotential height fields.
1- or 3-month time scales are used to characterizemeteorological conditions. In the present study, the 1-month SPI (hereafter SPI) was computed and only wintermonths have been considered (DJFM). For each month,the two-parameter Gamma distribution was skilfully fit-ted to the data with no need for different adjustments (c.f.Morid et al., 2006). As we intend to examine whetherparticular large-scale CTs yield dry/wet spells, time serieswith SPI values outside the range (−1, 1] (or −1.5, 1.5for extremes) have been considered at three representativeweather stations.
2.3. Principal component analysis
The S-mode PCA with Varimax rotation (Richman,1986) was applied to the correlation matrix of the win-ter SPI to identify its modes of variability in westernIran. Many authors, using either observations or reanal-ysis data (Bordi et al., 2001; Bonaccorso et al., 2003;Bordi and Sutera, 2004; Vicente-Serrano et al., 2004;Raziei et al., 2009), also applied this methodology in
analysing regional drought variability. Following North’srule (North et al., 1982), the sampling errors of theeigenvalues associated with principal components (PCs)were estimated in order to select components retainedfor rotation. In our case, only the first three eigenval-ues are ‘well defined’ (non-degenerated) within the 95%confidence level (Figure 2a)) and thereby rotated. Thismethod allows climate regionalisation by differentiat-ing areas with independent climatic variability (Rencher,1998). In order to identify the principal modes of large-scale atmospheric variability over Iran, the S-mode PCAwas also applied to the correlation matrix of the daily500 hPa geopotential height. The first six principal com-ponents were retained for Varimax rotation after applyingthe scree test and North’s rule-of-thumb (Figure 2b) andTable I).
2.4. Clustering
Classification of atmospheric circulation patterns into asmall number of representative CTs can be undertaken
Copyright 2011 Royal Meteorological Society Int. J. Climatol. 32: 1056–1068 (2012)

CIRCULATION TYPES AND WINTER DRY/WET SPELLS IN WESTERN IRAN 1059
Table I. Eigenvalues, explained and cumulative variances associated with the six un-rotated and Varimax rotated loadings ofdaily 500 hPa geopotential height fields.
PC Un-rotated Varimax rotated
Eigenvalue Explainedvariance (%)
Cumulativevariance (%)
Eigenvalue Explainedvariance (%)
Cumulativevariance (%)
1 107.7 21.9 21.9 77.3 15.7 15.72 75.2 15.3 37.1 65.8 13.3 29.03 67.3 13.6 50.7 61.5 12.5 41.54 47.2 9.6 60.3 60.5 12.3 53.85 40.0 8.1 68.4 50.7 10.3 64.16 28.4 5.8 74.2 50.0 10.1 74.2
by subjective (manual), hybrid (mixed) and objective(automated, computer-assisted) procedures. Each classi-fication consists of two major steps: the definition oftypes and the assignment of individual cases to thesetypes (Yarnal, 1993; Huth, 1996; Yarnal et al., 2001; Huthet al., 2008). Subjective procedures rely on the individualinterpretation of the dynamical features in the circulationpatterns (e.g. Hess–Brezowsky catalogue and the Lambclassification scheme), while the objective techniques arebased on mathematical algorithms. In hybrid procedures,the types are subjectively defined a priori, while the casesare assigned by objective criteria (Huth et al., 2008).According to Huth et al. (2008), the objective classi-fication techniques fall within several major families,such as correlation-based methods (Lund, 1963), sums-of-squares method (Kirchhofer, 1973), T-mode PCA(Huth, 2000), neural network (i.e. self-organising Maps;SOMs, Cavazos, 1999), fuzzy methods (Bardossy et al.,1995) and cluster analysis techniques (Kalkestin et al.,1987).
Cluster analysis (CA) is also a suitable methodologyfor classifying circulation patterns and may be dividedinto hierarchical and non-hierarchical approaches. Hier-archical CA uses average-, single- and complete-linkages,or Ward methods, for clustering. The non-hierarchicalapproach requires a prior selection of the number of typesto be identified and individual patterns are then iterativelykeyed to the clusters (e.g. K-means technique; Romeroet al., 1999). CA is frequently preceded by PCA to reducethe dimensionality of the problem and to remove co-linearity among the input variables (Huth, 1996, Huthet al., 2008).
Among the clustering techniques, the non-hierarchicalK-means CA, coupled with S-mode PCA, is commonlyused for atmospheric circulation pattern classification(e.g. Corte-Real et al., 1998; Romero et al., 1999; Este-ban et al., 2006). The selection of the number of groupsneeded for classification is crucial. The number of groupsfor K-means CA can be determined a priori by applyingthe mean average linkage CA method (Jones and Davis,2000) or the Ward method (Romero et al., 1999) amongmany other possible alternatives, such as the informationmeasure criterion proposed by Corte-Real et al. (1998)that is based on daily precipitation.
Recently, Esteban et al. (2005, 2006) proposed anon-iterative K-means clustering by considering the spa-tial variation patterns of the rotated loadings, in theirpositive and negative phases, i.e. on the location of thedominant centres-of-action, as potential groups for cir-culation pattern classification. In their novel procedure,centroids are computed by averaging all days that ful-fil the ‘extreme score criterion’ for a certain pattern andphase: days with high scores for a certain component (val-ues higher than +2 for positive phase or lower than −2for negative phase), but with low scores in the remainingcomponents (between +2 and −2) were selected and con-sidered as seeds for the centroids, avoiding iterations. It isworth noting that the extreme score procedure establishesthe number of groups and their centroids for K-means.As an eigenvector-based classification, this approach iso-lates CTs by using a fully objective method that hasbeen successfully tested in similar applications (Estebanet al., 2005; 2006; 2008). The present CT classification isbased on this method, i.e. on the location of the dominantcentres-of-action, by applying K-means clustering to theRPCs of the 500 hPa geopotential. Hereafter, CT+ andCT− denote the circulation types deriving from positiveand negative phases of the RPCs, respectively.
2.5. Relationship between CTs and meteorologicaldry/wet events
The linkage between monthly SPI and monthly frequen-cies of occurrence of CTs, relative to each month length,has been considered (Bogardi et al., 1994; Pesti et al.,1996; Pongracz et al., 1999). The time series of dry/wetevents associated with each of the three RPCs of theSPI were correlated with the corresponding frequencies ofoccurrence of CTs. However, the RPCs, which representthe common time behaviour of the SPI time series withinthe sub-regions, leave the exact magnitude of dry/wetspells occurring at each specific station undetermined.Therefore, as a complementary analysis, the SPI timeseries of dry/wet events, at three representative stationsof the identified sub-regions, were also considered in thecorrelation analysis with CTs. Since the RPCs are stan-dardized and following the SPI classification, we definedry/wet events, for both RPCs and SPI time series at therepresentative stations, as RPC/SPI ≤ −1 and RPC/SPI
Copyright 2011 Royal Meteorological Society Int. J. Climatol. 32: 1056–1068 (2012)

1060 T. RAZIEI et al.
≥1. Extreme events are identified for RPC/SPI ≤ −1.5and RPC/SPI ≥1.5. For each sub-region, the representa-tive station is selected according to the highest correlationwith the corresponding RPC time series (i.e. highest pos-itive loading criterion).
The Spearman rank correlation coefficient is used tomeasure the strength of the association between two vari-ables. This coefficient is more robust and less affectedby outliers than the Pearson correlation coefficient, thusbetter reflecting the degree of monotonic associationbetween the analysed data. A two-sided t-test at thesignificance level of 5% was applied to assess the signifi-cance of the correlations (Helsel and Hirsch, 2002; Wilks,2006). Additionally, the persistency in the analysed timeseries was checked using conditional probabilities. TheDurbin-Watson test was applied to detect serial correla-tion in the residuals. All considered time series containindependent values, with no serial correlation at any lag,indicating that the time series fulfil the independenceassumption (Wilks, 2006).
The relationship between CTs and wet/dry events wasalso assessed using the Performance Index (PI; Zhanget al., 1997). PI quantifies the relevance of each CT tothe occurrence of precipitation, by comparing the dailymean precipitation of a given circulation type, i, with theclimatological daily mean precipitation:
PI(i) = Ri/ni
R/n, (1)
where ni is the number of days of type i, Ri is the totalamount of precipitation falling during those days, and R
is the precipitation total received in the entire period ofn days (with or without the presence of type i). Thus,a PI (i) value for a particular type i is a measure of therelative contribution of that type to total precipitation; aPI (i) much higher than one indicates that type i has animportant contribution to total precipitation. To assess thepredicative potentials of CTs to determine dry/wet spellsin Iran, a stepwise Multiple Linear Regression (MLR)was used (Helsel and Hirsch, 2002).
3. Results
3.1. Spatial-temporal variability of winter dry/wetspells
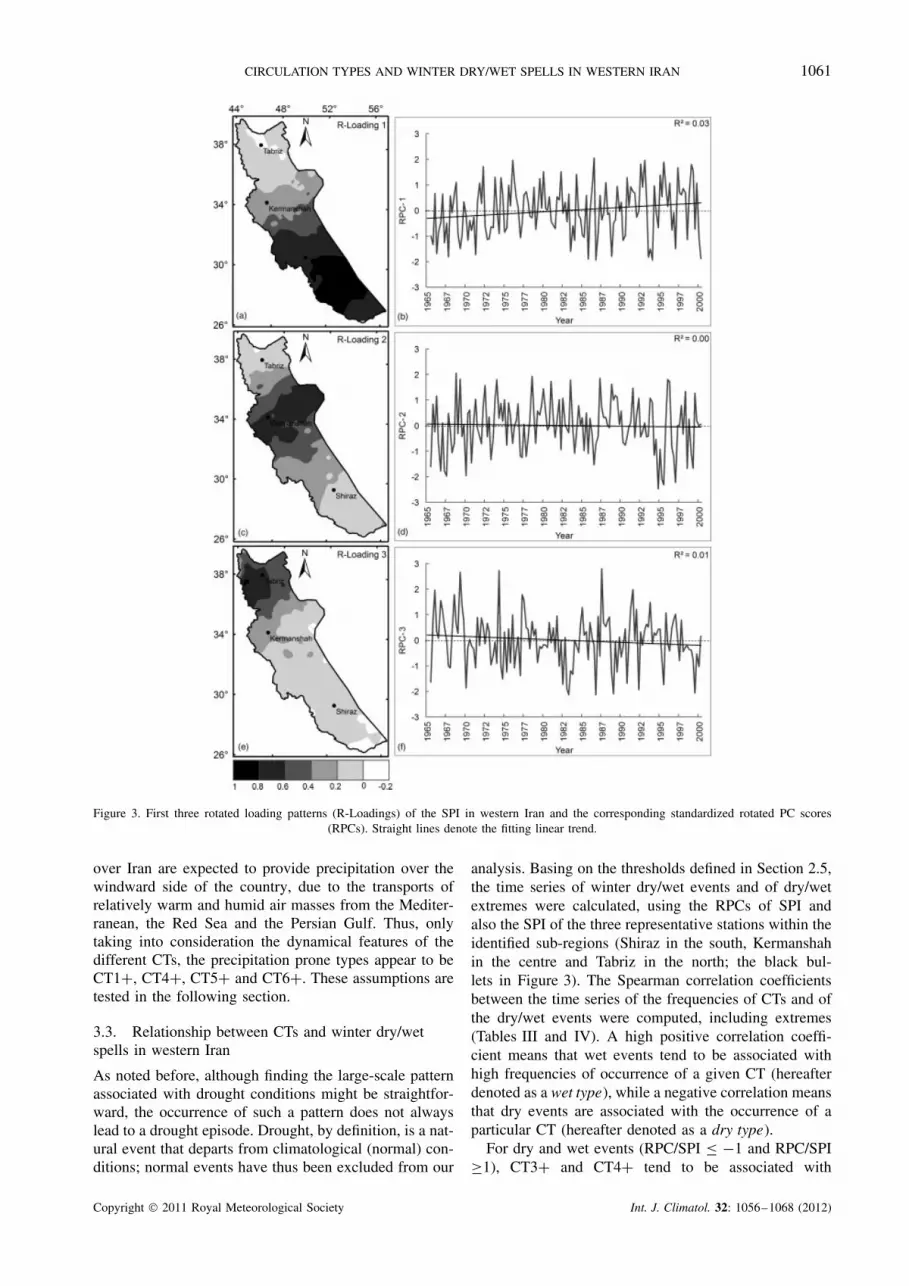
The S-mode PCA has been applied to the winter SPI timeseries. The three Varimax rotated modes, accounting for57.1% of total variance, were used to study the spatial-temporal variability of winter dry/wet spells across west-ern Iran. The target area is divided into three sub-regionscharacterized by high positive values in the rotated load-ings (R-Loadings; Figure 3), which represent the corre-lations between SPI and the corresponding RPCs. Theleading pattern (R-Loading 1) accounts for 24.4% of thetotal variance and isolates the southern part of the targetarea as a distinct sub-region. R-Loading 2 (19.2% of totalvariance) delineates a sub-region in central western Iran.
Finally, R-Loading 3 (13.5% of total variance) isolatesthe north of western Iran.
The corresponding RPCs represent the time variabilityof the SPI in the sub-regions with higher loadings(correlations). RPC-1 and RPC-3 are characterized byhigh variability with weak upward and downward lineartrends, respectively, while RPC-2 fluctuates around itslong-term mean. Raziei et al. (2009) obtained similarresults by analysing the time variability of the 12-month SPI (hydrological drought) for all months of theyear; two sub-regions were identified, one in the north,characterized by a significant negative trend, and theother covering the remaining area and showing a slightlypositive trend.
3.2. The 500 hPa atmospheric circulation types
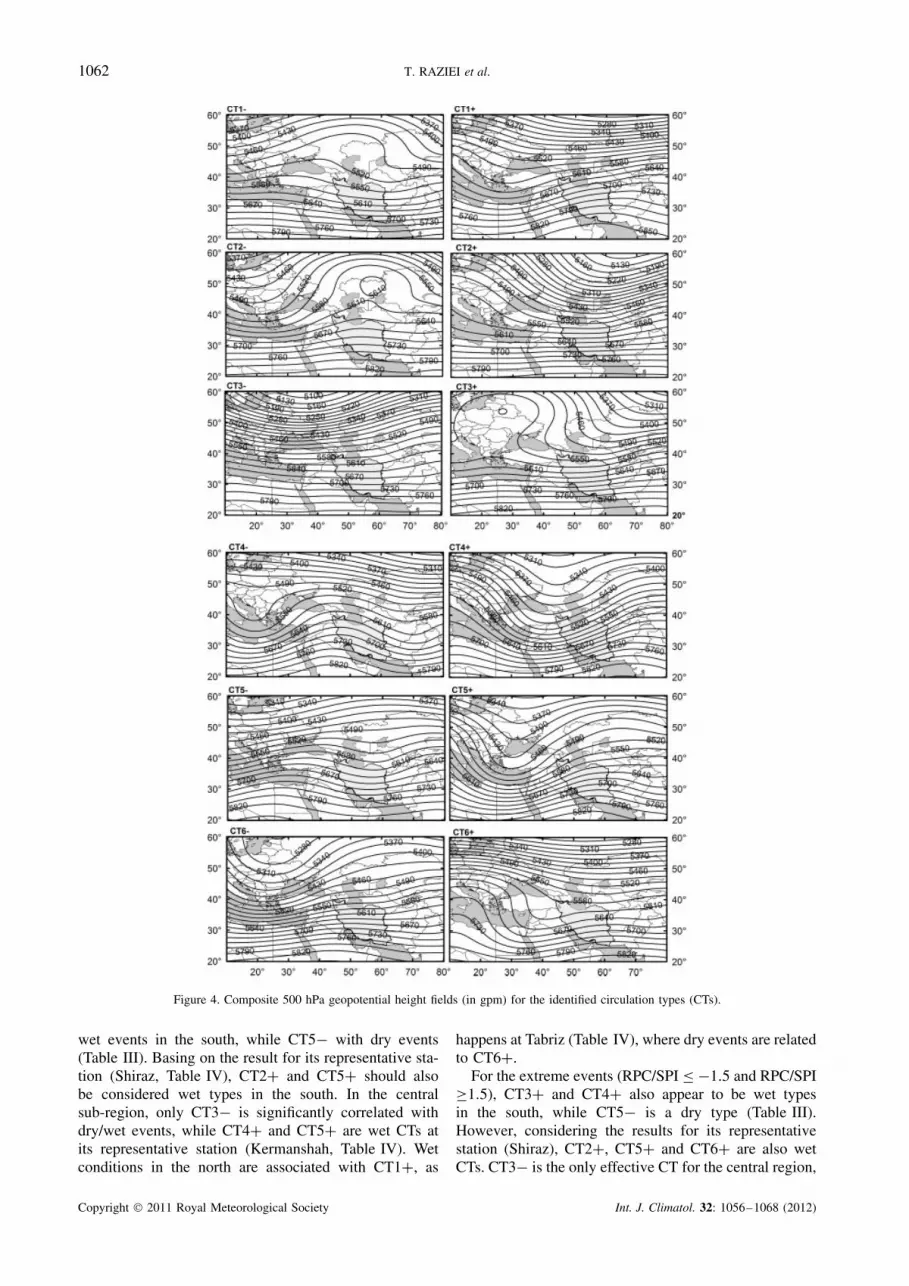
The identified CTs are shown in Figure 4 and theircorresponding frequencies of occurrence are presentedin Table II. CT1− is characterized by a weak ridge overTurkey that generates westerly winds over Iran, especiallyin the north. In contrast, CT1+ is characterized by acyclonic curvature over the Mediterranean and northernIran and by an anticyclonic curvature over central-southern Iran, inducing rain-generating southwesterlyflows. CT2− shows a broad ridge over the northeasternCaspian Sea, while CT2+ reveals a widely extendedtrough over the northeastern sector. Both types generatewesterly flow and marginally affect Iranian weather. Thespatial configuration of CT3− is very similar to CT2+over Iran (prevalently zonal), but the centre of the uppercyclonic curvature migrates from northeastern Russia tonortheastern Europe. CT3+ depicts a ridge over EasternEurope and a trough over southern Russia. The flowdirection over Iran is largely zonal.
The circulation structure of CT4− consists of a troughover the central Mediterranean Sea and a ridge over west-ern Iran, leading to northwesterly flows over the country.CT4+ is characterized by a deep and large trough locatedover the eastern Mediterranean Sea and the Red Sea,causing southwesterly flows over Iran. The geopotentialgradient is strong, making CT4+ very relevant for Iranianweather. A weak and widely extended ridge located overTurkey and the Balkans and a weak, shallow, and broadtrough over eastern Iran characterize CT5−, which leadsto northwesterly flows over the country. CT5+, simi-larly to CT4+, shows a well established trough over theeastern Mediterranean Sea, favouring precipitation occur-rences over Iran. These last two types differ from eachother in the location and direction of their trough axis.The trough location in CT6− is over Eastern Europe,whereas a ridge can be found over Russia, leading towesterly flows over Iran. Finally, CT6+ is characterizedby a weak ridge and a trough located over the Balkans andthe Red Sea, respectively. This circulation structure mightfavour precipitation occurrences over southern Iran, as ittransports maritime air masses from the Red Sea and thePersian Gulf.
Summarising, the circulation types with a south-west–northeast direction of airflow at the 500 hPa level
Copyright 2011 Royal Meteorological Society Int. J. Climatol. 32: 1056–1068 (2012)
CIRCULATION TYPES AND WINTER DRY/WET SPELLS IN WESTERN IRAN 1061
Figure 3. First three rotated loading patterns (R-Loadings) of the SPI in western Iran and the corresponding standardized rotated PC scores(RPCs). Straight lines denote the fitting linear trend.
over Iran are expected to provide precipitation over thewindward side of the country, due to the transports ofrelatively warm and humid air masses from the Mediter-ranean, the Red Sea and the Persian Gulf. Thus, onlytaking into consideration the dynamical features of thedifferent CTs, the precipitation prone types appear to beCT1+, CT4+, CT5+ and CT6+. These assumptions aretested in the following section.
3.3. Relationship between CTs and winter dry/wetspells in western Iran
As noted before, although finding the large-scale patternassociated with drought conditions might be straightfor-ward, the occurrence of such a pattern does not alwayslead to a drought episode. Drought, by definition, is a nat-ural event that departs from climatological (normal) con-ditions; normal events have thus been excluded from our
analysis. Basing on the thresholds defined in Section 2.5,the time series of winter dry/wet events and of dry/wetextremes were calculated, using the RPCs of SPI andalso the SPI of the three representative stations within theidentified sub-regions (Shiraz in the south, Kermanshahin the centre and Tabriz in the north; the black bul-lets in Figure 3). The Spearman correlation coefficientsbetween the time series of the frequencies of CTs and ofthe dry/wet events were computed, including extremes(Tables III and IV). A high positive correlation coeffi-cient means that wet events tend to be associated withhigh frequencies of occurrence of a given CT (hereafterdenoted as a wet type), while a negative correlation meansthat dry events are associated with the occurrence of aparticular CT (hereafter denoted as a dry type).
For dry and wet events (RPC/SPI ≤ −1 and RPC/SPI≥1), CT3+ and CT4+ tend to be associated with
Copyright 2011 Royal Meteorological Society Int. J. Climatol. 32: 1056–1068 (2012)
1062 T. RAZIEI et al.
Figure 4. Composite 500 hPa geopotential height fields (in gpm) for the identified circulation types (CTs).
wet events in the south, while CT5− with dry events(Table III). Basing on the result for its representative sta-tion (Shiraz, Table IV), CT2+ and CT5+ should alsobe considered wet types in the south. In the centralsub-region, only CT3− is significantly correlated withdry/wet events, while CT4+ and CT5+ are wet CTs atits representative station (Kermanshah, Table IV). Wetconditions in the north are associated with CT1+, as
happens at Tabriz (Table IV), where dry events are relatedto CT6+.
For the extreme events (RPC/SPI ≤ −1.5 and RPC/SPI≥1.5), CT3+ and CT4+ also appear to be wet typesin the south, while CT5− is a dry type (Table III).However, considering the results for its representativestation (Shiraz), CT2+, CT5+ and CT6+ are also wetCTs. CT3− is the only effective CT for the central region,
Copyright 2011 Royal Meteorological Society Int. J. Climatol. 32: 1056–1068 (2012)

CIRCULATION TYPES AND WINTER DRY/WET SPELLS IN WESTERN IRAN 1063
Table II. Frequencies of occurrence of the different circulationtypes (CTs).
Circulation type Frequency (%)
CT1− 8.5CT1+ 7.3CT2− 7.5CT2+ 8.8CT3− 7.7CT3+ 9.6CT4− 7.6CT4+ 8.5CT5− 9.6CT5+ 8.9CT6− 8.5CT6+ 7.3
Total 100.0
favouring extremely dry spells (Table III). Yet, accordingto Table IV, CT4+ should be considered the main CTfor extreme wet events. Concerning the northern region,none of the CTs are significantly correlated with RPC-3(Table III), while CT1+ and CT6+ should be consideredcirculation types leading to extreme wet and dry events,respectively, at Tabriz (Table IV).
Wet events in southwestern Iran, including extremes,are mainly related to the occurrence of CT3+ andCT4+, while dry conditions are associated with CT5−(Table III). In the central region, dry and wet events canbe related to CT3− and CT4+, respectively. In the north,CT1+ and CT6+ are mainly responsible for wet and dryconditions, respectively (Table IV). The discrepanciesfound between results in Tables III and IV can beattributed to the different nature of the standardized RPCsand of the SPI time series at individual stations. Forinstance, when the RPC score is below −1, a dry event
is also likely to occur in the SPI time series at a singlestation, though the class of drought for that event cannotbe established. On the contrary, when the SPI time seriesat the representative stations are considered, dry/wetevents are easily identified by the thresholds in the SPIclassification. For this reason, the three representativestations in Table IV better represent the relationshipbetween the occurrence of a given SPI class and CTs.
In order to verify these relationships, the links betweenthe frequencies of occurrence of CTs and daily precipi-tation were analysed by computing PI for each CT atthe three representative stations (Table V). The variabil-ity of the index is also analysed (Table VI), consideringPI values much lower than 1 (much greater than 1) asa dry (wet) type. In agreement with Table IV, it appearsthat CT1+ contributes to precipitation amounts above theclimate-mean (PI >1) in the north (Tabriz), particularly inDecember (Table VI), while it does not contribute to pre-cipitation in the south (PI <1). For Kermanshah (centralwestern Iran), it seems that although the PI for CT1+is greater than 1, no significant correlations are foundwith dry/wet events. This might indicate that precipita-tion associated with CT1+ is not sufficient to cause wetevents.
For CT4+, the PI is greater than 1 at the three stations(Table V), supporting the results of Table IV. However,for Tabriz the correlations are not statistically significant.Also for CT5+ the PI is greater than 1, indicating apositive contribution of this CT to precipitation at allstations. Nevertheless, results in Table IV suggest thatCT5+ has a positive correlation only with wet eventsoccurring in the southern and central sub-regions.
PI greater than 1 is also found for CT6+ at Shirazand Kermanshah. However, from Table IV, it seemsthat CT6+ is only related to extreme events at Shiraz.Conversely, the low value of PI at Tabriz for CT6+supports the findings in Table IV, where the occurrences
Table III. Spearman rank correlation coefficients between the occurrence frequency of the identified CTs and that of dry/wetspells derived from the RPCs of the SPI field. The statistically significant correlation coefficients at 95% confidence level are
denoted in bold.
CT RPC-1 (South) RPC-2 (Center) RPC-3 (North)
RPC ≤ −1or
RPC ≥1
RPC ≤ −1.5or
RPC ≥1.5
RPC ≤ −1or
RPC ≥1
RPC ≤ −1.5or
RPC ≥1.5
RPC ≤ −1or
RPC ≥1
RPC ≤ −1.5or
RPC ≥1.5
CT1− 0.00 −0.10 −0.03 0.04 −0.19 −0.14CT1+ −0.19 −0.20 0.04 0.09 0.32 0.31CT2− −0.11 −0.24 0.11 0.02 0.01 0.09CT2+ 0.21 0.38 0.07 0.09 −0.06 −0.11CT3− −0.25 −0.19 −0.41 −0.58 −0.24 −0.29CT3+ 0.44 0.55 0.08 −0.02 0.06 0.09CT4− −0.17 −0.23 −0.17 −0.07 −0.04 −0.11CT4+ 0.39 0.41 0.09 0.13 0.22 0.17CT5− −0.45 −0.56 0.02 0.10 −0.16 −0.32CT5+ 0.24 0.31 0.22 0.27 0.11 −0.02CT6− 0.08 0.12 −0.07 −0.02 0.01 −0.11CT6+ 0.19 0.20 −0.05 −0.14 −0.19 −0.12
Copyright 2011 Royal Meteorological Society Int. J. Climatol. 32: 1056–1068 (2012)

1064 T. RAZIEI et al.
Table IV. Spearman rank correlation coefficients between the occurrence frequency of the identified CTs and that of dry/wetspells at the three representative stations (Shiraz, Kermanshah, and Tabriz). The statistically significant correlation coefficients at
95% confidence level are denoted in bold.
CT Shiraz (South) Kermanshah (Center) Tabriz (North)
SPI ≤ −1or SPI ≥1
SPI ≤ −1.5or SPI ≥1.5
SPI ≤ −1or SPI ≥1
SPI ≤ −1.5or SPI ≥1.5
SPI ≤ −1or SPI ≥1
SPI ≤ −1.5or SPI ≥1.5
CT1− 0.06 0.02 0.08 0.22 −0.03 0.13CT1+ −0.27 −0.39 −0.11 −0.30 0.33 0.52CT2− −0.23 −0.37 −0.03 −0.20 0.11 0.23CT2+ 0.34 0.65 0.21 0.42 −0.13 −0.29CT3− −0.23 −0.25 −0.40 −0.40 −0.11 −0.11CT3+ 0.38 0.35 0.06 −0.01 −0.19 −0.31CT4− −0.28 −0.10 −0.23 0.00 0.03 −0.19CT4+ 0.41 0.56 0.58 0.48 −0.04 −0.21CT5− −0.49 −0.61 −0.33 −0.43 −0.01 0.09CT5+ 0.32 0.49 0.42 0.23 0.12 −0.02CT6− 0.01 −0.08 −0.17 −0.29 0.26 0.10CT6+ 0.25 0.64 0.27 0.39 −0.43 −0.59
Table V. PI values for each CT that occurred during winter months and relative contribution (in percent) of the identified CTs tothe total winter precipitation at the representative stations (Shiraz, Kermanshah, and Tabriz). PI values associated to statistically
significant contributions of CTs in generating wet events are denoted in bold.
CT Shiraz (South) Kermanshah (Center) Tabriz (North)
Contribution to total (%) PI Contribution to total (%) PI Contribution to total (%) PI
CT1− 6.7 0.8 6.8 0.8 3.1 0.4CT1+ 4.8 0.7 10.2 1.4 13.7 1.9CT2− 4.7 0.6 6.5 0.9 6.9 0.9CT2+ 8.8 1.0 5.5 0.6 8.8 1.0CT3− 5.1 0.7 4.3 0.6 4.3 0.6CT3+ 10.5 1.1 9.2 1.0 8.2 0.8CT4− 1.3 0.2 3.2 0.4 2.8 0.4CT4+ 19.8 2.3 14.9 1.8 15.2 1.8CT5− 3.7 0.4 4.6 0.5 6.2 0.6CT5+ 17.5 2.0 18.6 2.1 16.7 1.9CT6− 6.9 0.8 7.7 0.9 9.6 1.1CT6+ 10.2 1.4 8.4 1.2 4.5 0.6
of this type lead to dry events in the north. Similarconsiderations can also be taken for types with PI valuesless than 1. For example, the PI for CT5− is low at thethree stations, but Table IV suggests that this type leadsto dry events in the central and southern sub-regions.At Tabriz, no significant correlations are found betweenCT5− and dry events.
Results suggest that a PI value lower (greater) than1 is not a sufficient condition for the occurrence of dry(wet) events. However, the statistically significant cor-relations in Table IV are in close agreement with thecorresponding PI values (Tables V and VI), supportingthe relevance of particular large-scale patterns in trigger-ing dry/wet events in western Iran. More robust resultsand a full explanation of dry/wet spells in terms oflarge-scale patterns are mainly undermined by four fac-tors: (1) The relatively short record length (35 years)does not allow more accurate statistics, highlighting the
need for longer precipitation records; (2) The differentnature of processes driving precipitation and dry/wetevents, i.e. neither precipitation events necessarily leadto the occurrence of wet spells nor precipitation deficitsnecessarily produce dry spells. Still, SPI provides anobjective measure of dry/wet conditions; (3) There is nodirect cause-effect relationship between the occurrenceof a particular CT and the occurrence of dry/wet spells;the latter are indeed forced by large-scale processes,but are not the direct consequence of CT occurrences;(4) The effects of local/regional rain-generating mecha-nisms also contribute to weakening the role of large-scalepatterns.
The identified aspects highlight the main limitations ofthe study. However, the CTs relevant for wet/dry spellsin western Iran were already identified and can be usedas an auxiliary tool for short-term prediction of dry/wetconditions, as is illustrated in the next section.
Copyright 2011 Royal Meteorological Society Int. J. Climatol. 32: 1056–1068 (2012)

CIRCULATION TYPES AND WINTER DRY/WET SPELLS IN WESTERN IRAN 1065
Table VI. PI values for each CT that occurred during single winter months at the representative stations. Values in bold refer tostatistically significant contributions of the CT in generating wet events during the given winter month.
CT Shiraz (South) Kermanshah (Center) Tabriz (North)
Jan Feb Mar Dec Jan Feb Mar Dec Jan Feb Mar Dec
CT1− 0.8 0.6 0.8 0.9 0.6 0.9 1.1 0.9 0.3 0.7 0.1 0.3CT1+ 0.3 0.5 1.0 0.6 0.5 0.5 1.1 1.7 1.4 2.2 1.3 2.1CT2− 0.6 1.0 0.6 0.6 0.8 0.8 0.8 0.9 1.6 1.6 0.8 0.4CT2+ 0.9 0.8 1.0 1.4 0.8 0.9 0.3 0.2 1.4 1.1 0.5 1.2CT3− 0.6 0.7 0.3 0.9 0.6 0.4 0.4 1.0 0.7 0.7 0.6 0.4CT3+ 1.4 0.8 0.9 1.3 0.8 1.5 0.8 0.8 0.9 1.4 0.7 0.5CT4− 0.3 0.0 0.1 0.1 0.6 0.2 0.5 0.3 0.5 0.5 0.5 0.1CT4+ 2.8 1.5 1.9 3.2 1.4 1.9 1.8 1.8 1.5 1.0 1.8 2.6CT5− 0.5 0.2 0.4 0.4 0.6 0.3 0.4 0.6 0.4 0.6 0.5 0.6CT5+ 1.7 2.3 2.5 1.0 2.6 1.9 1.8 1.8 2.1 1.7 2.0 1.2CT6− 0.8 0.9 0.8 0.7 0.9 0.9 1.0 0.6 0.9 1.3 1.2 1.2CT6+ 0.9 1.8 1.2 1.8 1.3 0.8 1.5 1.0 0.8 0.3 1.0 0.3
Table VII. Statistics of the fitting MLR model for the three representative stations.
Station Parameter Estimate Standard error T statistic P -value
Shiraz (South) Constant −0.44 0.33 −1.36 0.18CT4+ 0.08 0.02 3.34 0.00CT5− −0.07 0.02 −4.06 0.00CT3+ 0.03 0.01 1.96 0.06
Kermanshah (Center) Constant −0.67 0.37 −1.80 0.08CT3− −0.03 0.02 −1.99 0.05CT4+ 0.09 0.03 2.68 0.01
Tabriz (North) Constant −0.77 0.31 −2.47 0.02CT6− 0.07 0.03 2.93 0.01CT1+ 0.04 0.01 3.17 0.00
3.4. Predictability of dry/wet spells using circulationtypes
Previous results suggest that only a few circulation typescontribute to the occurrences of dry/wet phenomena ateach representative station. By applying a stepwise MLRand using the circulation types as explanatory variables(predictors), it was possible to assess the predictabilityof dry/wet spells in western Iran. At Shiraz, outcomessuggest CT3+, CT4+ and CT5− as predictors (statis-tically significant at 99% confidence level), which canroughly explain 48% of the total variance of dry/wetspells (Table VII). The p-values for CT4+ and CT5−indicate their statistical significance at the 99% confi-dence level, while CT3+ is statistically significant atthe 90% confidence level. The standard error and thet-statistics show the performance of the model. The esti-mates represent the weight of each CT in the model(Table VII). At Kermanshah, about 29% of the total vari-ance can be explained by a linear combination of CT3−and CT4+ (99% confidence level; Table VII). CT1+and CT6− are the most effective CTs at Tabriz; 99%confidence level and explaining nearly 28% of the totalvariance (Table VII). Similar results were also obtainedfor the extremes (not shown).
The model predictability is expected to decrease fromthe south to the north, taking into account local and oro-graphic effects, particularly pronounced in central andnorthwestern Iran (Figure 1a)). In fact, the complex orog-raphy in these regions significantly reduces the relevanceof the large-scale forcing mechanisms in generating pre-cipitation, whereas in the south, where orography ismuch smoother, large-scale CTs play an important role.Orographic and convective precipitation (not resolvedby reanalysis data) might explain the low correlationsobserved between large-scale CTs and dry/wet events atKermanshah and Tabriz (Table IV). As a result, the corre-sponding explained variances are only about 30%. There-fore, taking this limitation into account and the absenceof a direct cause–effect relationship with the occurrencesof particular large-scale CTs, the MLR results can beconsidered satisfactory.
4. Conclusions and discussion
The relationship between large-scale circulation typesand the occurrence of winter dry/wet spells in west-ern Iran was explored in this study. Monthly precip-itation data from 140 rain gauges in 1965–2000 and
Copyright 2011 Royal Meteorological Society Int. J. Climatol. 32: 1056–1068 (2012)
1066 T. RAZIEI et al.
daily mean 500 hPa geopotential height fields, from theNCEP/NCAR reanalysis dataset, were used in the anal-ysis. Meteorological dry/wet conditions were assessedthrough the computation of the 1-month SPI. Applyingthe PCA with Varimax rotation to the SPI field, threesub-regions with independent variability were identified.Three representative stations of the sub-regions were thenselected: Shiraz in the south, Kermanshah in the centre,and Tabriz in the north. Furthermore, daily large-scaleatmospheric circulation patterns were classified into 12circulation types (CTs) by applying a non-iterative K-means clustering technique to the leading rotated princi-pal components of the 500 hPa geopotential height. Theextreme rotated principal component scores, in their pos-itive and negative phases, were considered as potentialgroups for K-means CA and their centroids were com-puted by averaging all days that fulfil the extreme scorecriterion.
The link between daily CTs and winter dry/wet spellsin the region has been evaluated by computing corre-lations between the time series of the frequencies ofoccurrence of CTs and of dry/wet events. These eventswere identified based on the RPCs of SPI and on theSPI time series at the three representative weather sta-tions. The extreme events have been considered sepa-rately. Results for the representative stations suggest thatwet events in central and southwestern Iran are mainlyrelated to the occurrence of a deep and large trough overthe eastern Mediterranean Sea and the Red Sea (CT4+),while dry conditions tend to be related to a ridge locatedover Turkey and the Balkans, and a very sharp troughover eastern Iran (CT5−). In the north, southwesterlyflows (CT1+) and the presence of a ridge/trough overthe Balkans/Red Sea (CT6+) are largely responsible forwet and dry events, respectively. There is close agree-ment between our results and those previously obtainedby Alijani (2002); some regional troughs and ridges inthe 500 hPa geopotential height lead to important pre-cipitation and temperature anomalies over Iran. The rela-tive position of cyclonic/anticyclonic curvatures is indeedthe main feature of the identified CTs that mostly con-tribute to the occurrences of dry/wet spells in westernIran. As such, it seems that particular CTs can be consid-ered potential predictors for the dry/wet events in westernIran.
In order to verify the identified relationships betweenthe occurrences of CTs and dry/wet events, the perfor-mance index (PI) has been applied using daily precipita-tion records for the representative stations. Results sug-gest that the identified wet types are characterized by PIvalues greater than 1, while dry types by PI values lowerthan 1. However, a PI value lower (greater) than 1 for agiven CT is a necessary but insufficient condition for thedevelopment of dry (wet) events.
The combined influence of several circulation types ondry/wet events in the region has been evaluated using aMLR model. Results suggest that a MLR model, withCT3+, CT4+ and CT5− as predictors, explains about48% of total variance of dry/wet spells at Shiraz (southern
region). At Kermanshah (central region), the dry/wetvariability can be explained by a linear combinationof CT3− and CT4+, explaining about 29% of totalvariance. The most effective CTs in reproducing thevariance of dry/wet spells at Tabriz (northern region)are CT1+ and CT6−, explaining nearly 28% of totalvariance.
The relatively low values of the correlation coefficients(Tables III and IV), though statistically significant, under-line the main limitation when predicting meteorologicaldroughts or wet episodes using large-scale CTs: there isno direct cause–effect relationship between the occur-rence of particular CTs and dry/wet spells. Local/regionalfactors very likely contribute to weaken the role of large-scale circulation patterns in regions with complex topog-raphy, like western Iran.
Further efforts should be undertaken to improve thepotential ability of CTs in predicting dry/wet events.Longer time series might be used to increase statisti-cal confidence in the results. Other atmospheric vari-ables, such as vorticity or sea level pressure, mightbe used to isolate relevant meteorological circulationpatterns. Large-scale precipitation might also be distin-guished from that generated by local factors (e.g. con-vective and orographic) prior to the establishment ofrelationships with CTs. Lastly, we also plan to investi-gate the relationship between the orographic–baroclinicinstability (Bordi et al., 2004) and the winter precipitationin western Iran.
Acknowledgements
Rain-gauge data used was supplied by the WaterResources Institute of Iran and by the Iranian Mete-orological Organization. NCEP/NCAR reanalysis wereprovided by the NOAA-CIRES Climate Diagnostics Cen-ter, Boulder, Colorado (USA). This study was funded bythe Department of Physics at the University of Rome“La Sapienza” and partially by the University of Tehran,Iran. We also thank the anonymous reviewers for theirvaluable comments.
ReferencesAlijani B. 2002. Variation of 500hpa flow patterns over Iran and
surrounding areas and their relationship with climate of Iran.Theoretical and Applied Climatology 72: 41–54.
Bardossy A. Duckstein L. Bogardi I. 1995. Fuzzy rule-based classifi-cation of atmospheric circulation patterns, International Journal ofClimatology 15: 1087–1097.
Bogardi I, Matyasovszky I, Bardossy A, Duckstein L. 1994. Ahydroclimatological model of areal drought. Journal of Hydrology153: 245–264.
Bonaccorso B, Bordi I, Cancelliere A, Rossi G, Sutera A. 2003.Spatial variability of drought: an analysis of the SPI in Sicily. WaterResources Management 17: 273–296.
Bordi I, Dell’Aquila A, Speranza A, Sutera A. 2004. On themidlatitude tropopause height and the orographic-baroclinicadjustment theory. Tellus 56A: 278–286.
Bordi I, Fraedrich K, Petitta M, Sutera A. 2007. Extreme valueanalysis of wet and dry periods in Sicily. Theoretical and AppliedClimatology 87: 61–71.
Bordi I, Frigio S, Parenti P, Speranza A. Sutera A. 2001. The analysisof the Standarzized Precipitation Index in the Mediterranean area:Large-scale patterns. Annali di Geofisica 44: 965–978.
Copyright 2011 Royal Meteorological Society Int. J. Climatol. 32: 1056–1068 (2012)

CIRCULATION TYPES AND WINTER DRY/WET SPELLS IN WESTERN IRAN 1067
Bordi I, Sutera A. 2004. Drought variability and its climaticimplications. Global and Planetary Change 40: 115–127.
Cavazos T. 1999. Large-scale circulation anomalies conducive toextreme precipitation events and derivation of daily rainfall innortheastern Mexico and southeastern Texas. Journal of Climate 12:1506–1523.
Chen D, Hellstrom, C. 1999. The influence of the North AtlanticOscillation on the regional temperature variability in Sweden: Spatialand temporal variations. Tellus 51A: 505–516.
Corte-Real J, Qian B, Xu H. 1998. Regional climate change inPortugal: precipitation variability associated with large-scaleatmospheric circulation. International Journal of Climatology 18:619–635.
Duckstein L, Bardossy A, Bogardi I. 1993. Linkage between theoccurrence of daily atmospheric circulation patterns and floods: AnArizona case study. Journal of Hydrology 143: 413–428.
Esteban P, Jones PD, Martin-Vide J, Mases M. 2005. Atmosphericcirculation patterns related to heavy snowfall days in Andorra,Pyrenees. International Journal of Climatology 25: 319–329.
Esteban P, Martin-Vide, J, Mases M. 2006. Daily atmosphericcirculation catalogue for Western Europe using multivariatetechniques. International Journal of Climatology 26: 1501–1515.
Esteban P, Ninyerola M, Prohom M. 2008. Spatial modelling ofair temperature and precipitation for Andorra (Pyrenees) fromdaily circulation patterns, Theoretical and Applied Climatology,DOI:10.1007/s00704-008-0035-3.
Fowler HJ, Kilsby CG. 2002. A weather-type approach to analyzingwater resource drought in the Yorkshire region from 1881 to 1998.Journal of Hydrology 262: 177–192.
Frakes B, Yarnal B. 1997. A procedure for blending manual andcorrelation-based synoptic classifications. International Journal ofClimatology 17: 1381–1396.
Ghasemi AR, Khalili D. 2006. The influence of the Arctic Oscillationon winter temperatures in Iran. Theoretical and Applied Climatology85: 149–164.
Ghasemi AR, Khalili D. 2008. The association between regionaland global atmospheric patterns and winter precipitation in Iran.Atmospheric Research 88: 116–133.
Guttman NB. 1999. Accepting the standardised precipitation index:a calculation algorithm. Journal of American Water ResourcesAssociation 35: 311–322.
Heim RR Jr. 2002. A review of twentieth-century drought indices usedin the United States. Bulletin of the American Meteorological Society83: 1149–1165.
Helsel DR, Hirsch RM. 2002. Statistical methods in water resources.Elsevier: Amsterdam.
Huth R. 1996. An intercomparison of computer-assisted circulationclassification methods. International Journal of Climatology 16:893–922.
Huth R. 2000. A circulation classification scheme applicable in GCMstudies. Theoretical and Applied Climatology 67: 1–18.
Huth R, Beck C, Philipp A, Demuzere M, Ustrnul Z, Cahynova M,Kysely J, Tveito OE. 2008. Classifications of atmospheric circu-lation patterns: recent advances and applications. In: Trends andDirections in Climate Research. Annals of the New York Academyof Sciences 1146: 105–152.
Jones GV, Davis RE. 2000. Using a synoptical approach tounderstand climate/viticulture relationships. International Journal ofClimatology 20: 813–837.
Kalkstein LS. Tan G. Skindlov JA. 1987. An evaluation of threeclustering procedures for use in synoptic climatologcal classification.Journal of Climate and Applied Meteorology 26: 717–730.
Kalnay E, Kanamitsu M, Kistler R, Collins W, Deaven D, Gandin L,Iredell M, Saha S, White G, Woollen J, Zhu Y, Leetmaa A,Reynolds B, Chelliah M, Ebisuzaki W, Higgins W, Janowiak J,Mo KC, Ropelewski C, Wang J, Roy J, Joseph D. 1996. TheNCEP/NCAR 40-year reanalysis project. Bulletin of the AmericanMeteorological Society 77: 437–471.
Keyantash J, Dracup JA. 2002. The quantification of drought:an evaluation of drought indices. Bulletin of the AmericanMeteorological Society 83: 1167–1180.
Kidson JW. 2000. An analysis of New Zealand synoptic types andtheir use in defining weather regimes. International Journal ofClimatology 20: 299–316.
Kilsby CG, Cowpertwait PSP, O’Connel PE, Jones PD. 1998. Predict-ing rainfall statistics in England and Wales using atmospheric circu-lation variables. International Journal of Climatology 18: 523–539.
Kirchhofer W. 1973. Classification of European 500 mb Patterns.Arbeitsbericht der Schweizerischen Meteorologischen Zentralanstalt,Geneva, Switzerland; p. 43.
Kistler R, Kalnay E, Collins W, Saha S, White G, Woollen J,Chelliah M, Ebisuzaki W, Kanamitsu M, Kousky V, van denDool H, Jenne R, Fiorino M. 2001. The NCEP/NCAR 50-YearReanalyses: monthly means CD-ROM and documentation. Bulletinof the American Meteorological Society 82: 247–268.
Kutiel H, Hirsch-Eshkol TR, Turkes M. 2001. Sea level pressurepatterns associated with dry or wet monthly rainfall conditions inTurkey. Theoretical and Applied Climatology 69: 39–67.
Lamb HH. 1977. Climate, present, past and future. vol. 2. Climatehistory and the future. Methuen: London.
Lund IA. 1963. Map-pattern classification by statistical methods.Journal of Applied Meteorology 2: 56–65.
McKee TB, Doesken NJ, Kleist J. 1993. The relationship of droughtfrequency and duration to time scales. In: Proceedings of the 8thConference on Applied Climatology (17–22 January, Anaheim, CA),American Meteorological Society: Boston, MA; pp. 179–184.
McKendry IG. 1994. Synoptic circulation and summertime ground-level ozone concentrations at Vancouver, British Columbia. Journalof Applied Meteorology 33: 627–641.
Morid S, Smakhtin V, Moghaddasi M. 2006. Comparison of sevenmeteorological indices for drought monitoring in Iran. InternationalJournal of Climatology 26: 971–985.
Nazemosadat MJ, Cordery I. 2000. On the relationships betweenENSO and autumn rainfall in Iran. International Journal ofClimatology 20: 47–61.
Nazemosadat MJ, Ghasemi AR. 2004. Quantifying the ENSO-relatedshifts in the intensity and probability of drought and wet periods inIran. Journal of Climate 17: 4005–4018.
North GR, Bell TL, Cahalan RF, Moeng FJ. 1982. Sampling errors inthe estimation of empirical orthogonal functions. Monthly WeatherReview 110: 699–706.
Pesti G, Sherestha BP, Duckstein L, Bogardi I. 1996. A fuzzy rule-based approach to drought assessment. Water Resources Research32: 1741–1747.
Pongracz R, Bogardi I, Duckstein L. 1999. Application of fuzzy rule-based modeling technique to regional drought. Journal of Hydrology224: 100–114.
Pongracz R, Bogardi I, Duckstein L. 2003. Climate forcing of drought:A central European example. Hydrological Sciences 48: 39–50.
Raziei T, Bordi I, Pereira LS. 2008. A precipitation-based regionaliza-tion for Western Iran and regional drought variability. Hydrologyand Earth System Sciences 12: 1309–1321.
Raziei T, Saghafian B, Paulo AA, Pereira LS, Bordi I. 2009. Spatialpatterns and temporal variability of drought in western Iran. WaterResources Management 23: 439–455.
Rencher AC. 1998. Multivariate statistical inference and applications.Wiley: Hoboken.
Richman MB. 1986. Rotation of principal components. InternationalJournal of Climatology 6: 293–335.
Romero R, Sumner G, Ramis C, Genoves C. 1999. A classificationof the atmospheric circulation patterns producing significant dailyrainfall in the Spanish Mediterranean area. International Journal ofClimatology 19: 765–785.
Santos JA, Corte-Real J, Leite SM. 2005. Weather regimes and theirconnection to the winter rainfall in Portugal. International Journalof Climatology 25: 33–50.
Stahl K, Demuth S. 2001. Atmospheric circulation and drought. In:Assessment of the regional impact of droughts in Europe, Stahl K,Demuth S (eds). ARIDE Final report: Univ. of Freiburg, Germany.
Trigo RM, DaCamara CC. 2000. Circulation weather types and theirinfluence on the precipitation regime in Portugal. InternationalJournal of Climatology 20: 1559–1581.
Vicente-Serrano SM, Gonzalez-Hidalgo JC, De Luis M, Raventos J.2004. Drought patterns in the Mediterranean area: the Valenciaregion (eastern Spain). Climate Research 26: 5–15.
Vicente-Serrano SM, Lopez-Moreno JI. 2006. The influence ofatmospheric circulation at different spatial scales on winter droughtvariability through a semi-arid climatic gradient in northeast Spain.International Journal of Climatology 26: 1427–1453.
Wibig J. 1999. Precipitation in Europe in relation to circulation patternsat the 500 hpa level. International Journal of Climatology 19:253–269.
Wilks DS. 2006. Statistical Methods in the Atmospheric Sciences: (2ndedn). Elsevier Academic Press: San Diego, California, USA.
Xoplaki E, Luterbacher J, Burkard R, Patrikas I, and Maheras P. 2000.Conection between the large-scale 500 hpa geopotential height field
Copyright 2011 Royal Meteorological Society Int. J. Climatol. 32: 1056–1068 (2012)

1068 T. RAZIEI et al.
and precipitation over Greece during wintertime. Climate Research14: 129–146.
Yarnal B. 1993. Synoptic Climatology in Environmental Analysis.Belhaven Press: London.
Yarnal B, Comrie AC, Frakes B. Brown DP. 2001. Developments
and prospects in synoptic climatology. International Journal ofClimatology 21: 1923–1950.
Zhang X, Wang XL, Corte-Real J. 1997. On the relationships betweendaily circulation patterns and precipitation in Portugal. Journal ofGeophysical Research 102: 13495–13507.
Copyright 2011 Royal Meteorological Society Int. J. Climatol. 32: 1056–1068 (2012)