Instrumental pressure observations and atmospheric circulation from the 17th and 18th centuries:...
14
INTERNATIONAL JOURNAL OF CLIMATOLOGY Int. J. Climatol. 21: 285–298 (2001) DOI: 10.1002/joc.611 INSTRUMENTAL PRESSURE OBSERVATIONS AND ATMOSPHERIC CIRCULATION FROM THE 17TH AND 18TH CENTURIES: LONDON AND PARIS V.C. SLONOSKY b,c, *, P.D. JONES a and T.D. DAVIES a a Climatic Research Unit, Uni6ersity of East Anglia, Norwich, NR47TJ, UK b Laboratoire des Sciences du Climat et de l’En6ironnement, LSCE-Orme, Orme -des -Merisiers, 91191 Gif -sur -Y6ette, Cedex France c Climate Research Branch, Meteorological Ser6ice of Canada, 4905 Dufferin Street, Downs6iew, Ontario, Canada M3H 5T3 Recei6ed 18 December 1999 Re6ised 25 August 2000 Accepted 31 August 2000 Published online 22 February 2001 ABSTRACT Daily pressure observations recorded by William Derham (1657 – 1735) at Upminster, Essex (near London), from 1697 to 1706 and 1708 have been corrected, converted to modern units and the Gregorian calendar, and adjusted for homogeneity. These pressure readings have been compared with previously published contemporary observations from Paris, and the two sets of early instrumental data used to calculate a daily series of the pressure difference between Paris and London. Frequency analysis of the daily series reveals that reversals of the south – north pressure gradient and easterly winds were more common from 1697 to 1708 than during the 1990s. Monthly mean values of Paris – London pressure differences have been compared with previously published monthly mean reconstructed surface pressure maps and to a reconstructed North Atlantic Oscillation (NAO) index. There is a good agreement between the strength and direction of monthly mean flow between London and Paris estimated from the circulation maps and the sign and magnitude of the Paris–London westerly flow index, but the correlation between the Paris – London index, known to be a good proxy for European zonal circulation, and the reconstructed NAO index, is low (0.2). Correlations between the monthly mean Paris – London zonal circulation index and central England temperatures suggest a strong relationship during winter and late summer from 1697 to 1708. The meticulous daily instrumental observations and the monthly and seasonal climate descriptions of Derham, his collection of instrumental observations and climatic descriptions from contemporary observers throughout Europe, and his early theories on the causes of climate change make his publications a valuable source of information for studies on climate during the early instrumental period. It is hoped that more of Derham’s papers related to weather and climate may eventually come to light. Copyright © 2001 Royal Meteorological Society. KEY WORDS: atmospheric circulation; climate variability; early instrumental data; Europe; historical climatology; Late Maunder Minimum; Little Ice Age; sea-level pressure; William Derham 1. INTRODUCTION The study of climate change has become more popular in recent times as a result of increasing concern regarding the effect of human activity on the climate system. Increasing amounts of carbon dioxide and other greenhouse gases emitted into the atmosphere as a result of human economic activity, as well as changes to the Earth’s land surface, such as deforestation or desertification, have prompted the concern that global temperatures are rising owing to anthropogenically-induced climate change. Climate, however, displays a large amount of natural variability, ranging from astronomically-induced Ice Ages on the millennial time scale to interannual variability generated through atmosphere – ocean interactions, such as the El Nin ˜ o – Southern Oscillation, so that an unambiguous signal of anthropogenic climate change is difficult to detect. Moreover, the natural variability of climate may add to or detract * Correspondence to: Climate Research Branch, Meteorological Service of Canada, 4905 Dufferin Street, Downsview, Ontario, Canada M3H 5T3; e-mail: [email protected] Copyright © 2001 Royal Meteorological Society
Transcript of Instrumental pressure observations and atmospheric circulation from the 17th and 18th centuries:...

INTERNATIONAL JOURNAL OF CLIMATOLOGY
Int. J. Climatol. 21: 285–298 (2001)
DOI: 10.1002/joc.611
INSTRUMENTAL PRESSURE OBSERVATIONS AND ATMOSPHERICCIRCULATION FROM THE 17TH AND 18TH CENTURIES: LONDON
AND PARISV.C. SLONOSKYb,c,*, P.D. JONESa and T.D. DAVIESa
a Climatic Research Unit, Uni6ersity of East Anglia, Norwich, NR4 7TJ, UKb Laboratoire des Sciences du Climat et de l’En6ironnement, LSCE-Orme, Orme-des-Merisiers, 91191 Gif-sur-Y6ette, Cedex France
c Climate Research Branch, Meteorological Ser6ice of Canada, 4905 Dufferin Street, Downs6iew, Ontario, Canada M3H 5T3
Recei6ed 18 December 1999Re6ised 25 August 2000
Accepted 31 August 2000Published online 22 February 2001
ABSTRACT
Daily pressure observations recorded by William Derham (1657–1735) at Upminster, Essex (near London), from1697 to 1706 and 1708 have been corrected, converted to modern units and the Gregorian calendar, and adjusted forhomogeneity. These pressure readings have been compared with previously published contemporary observationsfrom Paris, and the two sets of early instrumental data used to calculate a daily series of the pressure differencebetween Paris and London. Frequency analysis of the daily series reveals that reversals of the south–north pressuregradient and easterly winds were more common from 1697 to 1708 than during the 1990s. Monthly mean values ofParis–London pressure differences have been compared with previously published monthly mean reconstructedsurface pressure maps and to a reconstructed North Atlantic Oscillation (NAO) index. There is a good agreementbetween the strength and direction of monthly mean flow between London and Paris estimated from the circulationmaps and the sign and magnitude of the Paris–London westerly flow index, but the correlation between theParis–London index, known to be a good proxy for European zonal circulation, and the reconstructed NAO index,is low (0.2). Correlations between the monthly mean Paris–London zonal circulation index and central Englandtemperatures suggest a strong relationship during winter and late summer from 1697 to 1708. The meticulous dailyinstrumental observations and the monthly and seasonal climate descriptions of Derham, his collection ofinstrumental observations and climatic descriptions from contemporary observers throughout Europe, and his earlytheories on the causes of climate change make his publications a valuable source of information for studies on climateduring the early instrumental period. It is hoped that more of Derham’s papers related to weather and climate mayeventually come to light. Copyright © 2001 Royal Meteorological Society.
KEY WORDS: atmospheric circulation; climate variability; early instrumental data; Europe; historical climatology; Late MaunderMinimum; Little Ice Age; sea-level pressure; William Derham
1. INTRODUCTION
The study of climate change has become more popular in recent times as a result of increasing concernregarding the effect of human activity on the climate system. Increasing amounts of carbon dioxide andother greenhouse gases emitted into the atmosphere as a result of human economic activity, as well aschanges to the Earth’s land surface, such as deforestation or desertification, have prompted the concernthat global temperatures are rising owing to anthropogenically-induced climate change.
Climate, however, displays a large amount of natural variability, ranging from astronomically-inducedIce Ages on the millennial time scale to interannual variability generated through atmosphere–oceaninteractions, such as the El Nino–Southern Oscillation, so that an unambiguous signal of anthropogenicclimate change is difficult to detect. Moreover, the natural variability of climate may add to or detract
* Correspondence to: Climate Research Branch, Meteorological Service of Canada, 4905 Dufferin Street, Downsview, Ontario,Canada M3H 5T3; e-mail: [email protected]
Copyright © 2001 Royal Meteorological Society
V.C. SLONOSKY ET AL.286
from anthropogenic climate change. In order to detect anthropogenic climate change and predict futureclimate, it is essential to understand the present climate, and how climate has changed in the past,particularly over the last few hundred years. Known causes of natural climate change, on the timescale ofdecades to centuries, include factors external to the climate system, such as variations in solar activity andvolcanic eruptions (Lean et al., 1995; IPCC, 1996; Crowley, 2000), as well as internal variability generatedfrom the interactions between the various components of the climate system, such as those between theocean, sea-ice and atmosphere in the northern North Atlantic (IPCC, 1996).
Instrumental observations are the most reliable indicators of past climates, and frequently have a dailyor monthly time resolution, which is much finer than that of proxy climate indicators such as tree-rings,ice-cores or lake varves. Early instrumental records of climate first became available in the latter half ofthe 17th century, after the invention of the mercury barometer by Evangelista Torricelli (1608–1647) inFlorence in 1644 (Middleton Knowles, 1966). Sixteenth and seventeenth century scientists continuedworking on the design and accuracy of their instruments, and many scientists and amateur meteorologistsof the Enlightenment took meticulous daily observations of weather conditions, wind direction andstrength, and amount and type of precipitation, as well as the quantitative readings from thermometersand barometers. Some of these early instrumental observations, including those of Louis Morin(1635–1715) used in this paper, have been used to reconstruct monthly surface pressure over Europe andcirculation indices for 1675–1715 (the Late Maunder Minimum (LMM)) by Luterbacher et al. (2000), andto reconstruct indices of the North Atlantic Oscillation (NAO) and Eurasian (EU) meridional circulationback to 1675 (Luterbacher et al., 1999).
This paper presents 11 years (1697–1706 and 1708) of the daily meteorological, particularly pressure,observations taken by one such amateur meteorologist, Reverend William Derham (1657–1735), duringthe end of the 17th century and the beginning of the 18th century. Derham was the Rector of Upminster,Essex, 20 km east–northeast of central London, England, and a member of the Royal Society of London.He started recording his observations of the level of the mercury of his barometer, the prevailing weatherand the direction of the wind three times daily, with daily observations of the amount of precipitation, in1697. In 1699, he added readings from his thermometer and observations of the direction of upper-levelclouds; these first 3 years of his observations are published in full (Derham, 1698, 1699, 1700). Theoriginal manuscripts of Derham’s weather registers from 1700 to 1706 are preserved in the archives of theRoyal Society Library in London, and have been transcribed. His temperature observations for the years1697–1706 form the basis of Manley’s Central England temperature record for those years (Manley, 1953,1974). It is almost certain that Derham continued to record his observations well into the 1730s, but fewof these have so far come to light. He further published daily pressure readings for 1708 (Derham, 1709a),and a few other fragmentary records; he often published his observations for the first day of each monthof the year (Derham, 1731).
Similar observations from Paris were recorded by the French physician Louis Morin from 1665 to 1713.These data have been carefully analysed and adjusted to modern standards by Legrand and LeGoff(1992), who published pressure readings from 1670–1713 and temperature readings from 1675–1712; theyclassified the earlier data as unusable. Using both Morin’s and Derham’s records, the atmosphericcirculation for the period 1697–1708 in northwestern Europe is analysed.
The period 1697–1708 is, climatologically speaking, an extremely interesting one, as it was within aphase of particularly harsh and variable climate in Europe generally known as the ‘Little Ice Age’. The1690s were a decade of extremely severe climatic conditions, probably the coldest decade in the NorthernHemisphere of the last millennium, according the analysis of summer temperatures by Jones et al. (1998);evidence from tree-rings suggests that the summers of 1695, 1698 and 1699 were among the coldest in theNorthern Hemisphere of the past 600 years (Briffa et al., 1998). There were disastrous harvest failures andfamines in Scotland and Scandinavia, and terrible harvests in England between 1692 and 1698 (Lamb,1995); according to the central England temperature record (which uses Derham’s temperatureobservations; Manley, 1974), 1695 was the second coldest year in central England since 1659, 1698 was thefourth coldest, and 1692 and 1694 are both ranked as the fifth coldest years.
Copyright © 2001 Royal Meteorological Society Int. J. Climatol. 21: 285–298 (2001)
INSTRUMENTAL PRESSURE OBSERVATION AND ATMOSPHERIC CIRCULATION 287
Contemporary evidence suggests that the climate of this period was also one of extreme variations, withperiods of warm weather, such as the mild winter of 1698/99 and the warm summer of 1707 (when deathsas a result of heat exhaustion are recorded; Derham, 1731), as well as very severe conditions, includingthe cold and wet year of 1708, which culminated in the great frosts in the winter of 1708/9 (Derham,1709a,b, 1731).
This period of harsh climatic conditions towards the end of the 17th and beginning of the 18th centuriescoincided with a period of decreased solar activity known as the ‘LMM’, after the minimum in sunspotactivity observed from 1675–1715 (Bradley and Jones, 1993; Lean et al., 1995). The estimated decrease insolar output during this period appears to account well for the estimated drop in temperatures (Lean etal., 1995; Mann et al., 1998), although this could be a coincidence, as explosive volcanic activity was alsohigher at this time (Briffa et al., 1998), and can also account for the estimated decrease in NorthernHemisphere temperature (Crowley, 2000).
Derham’s temperature readings were used by Manley (1953, 1974) in his construction of a centralEngland temperature series, but the pressure readings have not, until now, been converted into modernunits. The details of the corrections to the barometric readings for temperature, gravity, and height abovesea-level, as well as the conversion to modern units, are described in the second section. The next sectionanalyses the atmospheric circulation, based on the pressure gradient between Paris and London, onmonthly and daily scales for 1697–1708. In the following section, the relationship between theatmospheric circulation and temperature is investigated for 1697–1708, and conclusions are presented inthe final section. The primary purpose of this paper is to bring attention to the existence of these dailypressure observations from 3 hundred years ago. It is also hoped that this paper might help in locatingDerham’s later weather observations, from 1707 to the 1730s.
2. DATA SOURCES AND CORRECTIONS
2.1. Derham’s obser6ations
There are several corrections that are necessary to apply to the observed heights of the mercury columnin mercury barometers in order to obtain a true measurement of the atmospheric pressure. There areinstrumental corrections (such as scale errors and capillarity) which are particular to the actual barometerused; the correction for temperature, which accounts for the thermal expansion of mercury, the expansionof the barometer itself and that of the measuring scale used to read the mercury level, and the gravitycorrection (Middleton Knowles, 1964). The instrumental corrections for scale errors, zero error andcapillarity must be applied to all readings made with a particular barometer, and the correction fortemperature must be applied to each individual reading, as the correction depends on the temperature atthe time of observation. As the height of a mercury column depends on the local acceleration owing togravity, pressure readings are usually corrected to a standard value of gravity, taken to be that at 45°N.Pressure series are generally also reduced to mean sea level in order to draw circulation maps and enablecomparison between stations. The readings must also be converted to modern (metric) units.
Derham’s weather registers for Upminster (51.5°N, 0.9°E, elevation 25 m) from 1697 onwards containobservations of the state of the weather (fair, cloudy, frost etc.), the direction and strength of the winds,the height of the mercury in the barometer ‘in inches and centesimals ’ (Derham, 1698), and the
quantity of rain that fell e6ery day through a tunnel of twel6e inches diameter, in pounds and centesimalsof a pound (Derham, 1698).
Rain which fell overnight was recorded on the line of the register which separated the two days. If itsnowed, the depth of snow on the ground was recorded.
Two more columns were added in 1699, one for the thermometer and one for the ‘flying of the clouds ’,observed ‘but when they 6aried from the Winds ’ (Derham, 1700). The thermometer was graduated in(English) inches and tenths. Derham wrote that the point of freezing was about 8.0 inches, or in his degree
Copyright © 2001 Royal Meteorological Society Int. J. Climatol. 21: 285–298 (2001)
V.C. SLONOSKY ET AL.288
notation, 80 or 82 (Derham, 1700). The divisions of his thermometer reached 240, although he notes thatthe highest temperature he could record, by exposing the thermometer ‘to the heat of a pretty strong sun ’is 225 (Derham, 1700). The thermometer was placed against a northern wall in the open air,
whereby it is defended against the heat of the sun, and showeth only the true present temperature of theair. ‘Tis also guarded against the beams of the morning and e6ening sun, when it riseth and setteth onthe northern side of the east and west points of the horizon (Derham, 1700).
It is interesting to note that he considered the temperature of the first winter (1698–1699) he recorded as‘6ery mild ’, by the ‘spirits ha6ing been for the most part abo6e 82 degrees ’ (i.e. above freezing); this wouldbe considered a normal winter in southern England today.
These observations were taken three times a day; always at noon and 9 p.m., but at hours that variedfor the morning observation with the seasons: January at 8 a.m., February to 20 March at 7 a.m., from21 March to the end of September at 6 a.m., October at 7 a.m., and back to 8 a.m. for November andDecember. The tables for the first 3 years (1697–1699) were published in the Philosophical Transactionsof the Royal Society (Derham, 1698, 1699, 1700). Derham’s hand-written observation sheets for the years1700–1706 are preserved in the Royal Society’s archive collection, and have been transcribed anddigitized. He later published the noon observations of his barometer for 1708 (Derham, 1709a), and theobservations of the first day of each month for 1707, 1715 and 1716 (Derham, 1731). He also publisheddiverse observations, mainly pressure, but occasionally temperature and rainfall, which were sent to himby contemporary observers in other countries, including monthly rainfall for Paris for 1689–1711(Derham, 1715), and daily rainfall for Pisa for 1707 and 1708, and Zurich for 1708 (Derham, 1709a), dailypressure for Zurich for 1708 (Derham, 1709a), and monthly mean pressure values from Bengal for 1727,Berlin for 1726, Christiana (now Oslo) for 1727, Lund for 1724 and 1726, Naples for 1727 and Uppsalafor 1726 (Derham, 1733a,b,c). Of these distant locations, only the Paris and Uppsala records for this timeare known at present; a daily record of temperature and pressure since 1722 for Uppsala has recently beendeveloped (Bergstorm and Moberg, 2001). Derham himself very probably continued making observationsat Upminster until the 1730s (Derham, 1731), but all efforts to locate these later observations have, so far,proved fruitless.
Derham’s observations were taken before Protestant England changed to the Gregorian (New Style,N.S.) calendar, and so the observations had to be converted from Julian (Old Style, O.S.) dates toGregorian dates, shifting the observation dates by 10 days at the beginning of the record in 1697. Thenumber of missing observations is few, except for the midday reading, when Derham was away fromhome and unable to make his observations (Derham, 1698). There are 158 missing morning observations,753 missing midday observations, and 155 missing evening observations, which are missing value rates of4.3%, 20% and 4.2%, respectively. There are one or two clusters of missing values when Derham was awayfor several days; the rest are occasional absences, with random missing values. If more than 10 days weremissing in 1 calendar month, the values for that month were classified as missing. Outliers were detectedby finding the difference between all successive observations (i.e. midday–morning, and evening–midday).If this difference was greater than three times the standard deviation of the observations, then the valueswere flagged as outliers and verified for transcribing errors. If there was no transcribing error, thereadings were also checked against the weather observations for physical plausibility; plausible readingswere kept, other values were classified as missing.
The values of the barometer readings were recorded in English inches of mercury, which were convertedinto hectoPascals (hPa). Gravity corrections were applied to reduce the readings to standard gravity. Thevalue for gravity at Upminster was estimated by calculating the theoretical value of gravity at 51.5°N.
Temperature values are necessary to correct for the effects of thermal expansion, but as Derham onlystarted taking temperature measurements in 1699, the temperature corrections could only be calculatedfor 1699–1706. Estimated corrections based on the average temperatures for 1699–1706 were applied to1697 and 1698, so the data for these 2 years may be slightly suspect.
Before adjusting for the effects of temperature on Derham’s mercury barometer, it was first necessaryto convert Derham’s temperature units to recognized metric units. Manley (1953, 1974) had estimated that
Copyright © 2001 Royal Meteorological Society Int. J. Climatol. 21: 285–298 (2001)
INSTRUMENTAL PRESSURE OBSERVATION AND ATMOSPHERIC CIRCULATION 289
one of Derham’s units corresponded to 0.59°F (0.33°C; Manley, 1961), which he later revised slightly,although he did not specify exactly how he changed his estimate (Manley, 1974). A scale was estimatedhere by equating 0°C with 82 of Derham’s degrees, and Derham’s maximum temperature reading of 186with the modern day maximum of 33.1°C, which was determined by taking the average of 8-yearmaximum daily temperature values at Kew (51.5°N, 0.3°W, elevation 5 m) between 1961 and 1992 (thestandard deviation of these 8-year maxima is 1.5). Using these two values, a scale was determined of0.32°C to one of Derham’s temperature divisions.
The temperature corrections for the expansion of mercury could then be applied to the pressure data,although the temperature readings were outdoor values, and so may not correspond exactly to thetemperature of the barometer, which was kept indoors. The temperature readings from the outdoorsthermometer are likely to be too high to correspond to the inside temperature for the midday reading (asthe house, where the barometer was kept, would not have had enough time to adjust to the middaywarming) and too low for the evening readings (as the house would have stored heat for longer than theoutside air), so the morning readings are probably those with the least temperature difference between theinside barometer and the outdoor thermometer (although there was still likely to have been some heatretention during the preceding night). The pressure readings were corrected according to:
Pcor=Porg
1+qT(1)
where
Pcor is the temperature corrected pressure,Porg is the original pressure reading,q is the volume expansion coefficient of mercury (value used is 1.818×10⁻⁴, Serway, 1986), andT is the temperature (equation modified from Middleton Knowles, 1964).
Pressure varies with temperature and exponentially with height. By combining the hypsometric equationand the ideal gas equation for air, the following equation for reducing station level pressure to sea levelpressure is obtained:
Pslp=Pcor exp� hg
287(T+273.3)�
(2)
where T is in °C, g is 9.81 ms−2, and h in metres, using the elevation of the rectory at Upminster as 25m (82 feet; Derham, 1698). To apply the temperature based corrections to the values with no associatedtemperature readings (i.e. 1697, 1698 and 1708), adjustments were calculated using the monthly meanvalue of the height and temperature adjustments over the 1699–1706 period. As these gave unsatisfactoryresults for 1697 and 1698, it is suspected that there may have been a change of instrument or adjustmentto the existing barometer in 1699, and so correction factors for the 1697 and 1698 data are calculated asthe monthly mean differences between the pressure values for the first 2 years and the years 1699–1706.Finally, all values were adjusted to bring the average for the 11 years to the same level as the long-term(1774–1995) mean value for London of 1016.1 hPa (Jones et al., 1999; Slonosky et al., 1999), whichinvolved adding 9.1 hPa to the morning readings, 10.5 hPa to the midday readings, and 9.0 hPa to theevening readings. These rather large adjustments are likely to be due to imperfections in Derham’sbarometer, possibly due to the presence of trapped air in the mercury column.
2.2. Louis Morin’s obser6ations
Observations from Paris were taken three or four times daily from 1665 to 1713 by Dr Louis Morin,a physician and botanist, and have been transformed into modern units and corrected by Legrand andLeGoff (1992). Legrand and LeGoff (1992) describe, in great detail, the comparison of Morin’stemperature readings with contemporary readings of Philippe de la Hire (1640–1718), a Frenchastronomer at the Royal Observatory in Paris and correspondent of Derham, and with some more
Copyright © 2001 Royal Meteorological Society Int. J. Climatol. 21: 285–298 (2001)
V.C. SLONOSKY ET AL.290
complete daily readings from the Paris Observatory for 1816–1852. For the barometer readings, the rawdaily values were transformed into mm of mercury, and adjustment values to account for the presence ofair in the mercury column, the altitude of the barometer and the temperature of the observation roomwere calculated by Legrand and LeGoff (1992). For the purposes of this work, outliers were detected bythe method described above for the Upminster observations, the readings were transformed into hPa, andLegrand and LeGoff’s corrections and adjustment values were added to the raw daily observations. Anadditional adjustment factor of 0.3 hPa was added to adjust the mean of the Morin observations to thelong-term mean of the monthly Paris values from 1764–1995 (Jones et al., 1999; Slonosky et al., 1999).
3. PARIS AND LONDON CIRCULATION, 1697–1708
3.1. Monthly
The Paris–London circulation index has been extensively studied by Slonosky et al. (2000,2001), andwas demonstrated to be a good proxy for a European zonal circulation index over the period from the1820s to 1995. The zonal circulation index used in Slonosky et al. (2000,2001) was objectively derived asthe second principal component of European surface pressure from 1822–1995, and is similar to the NAOindex (and the Paris–London index), in that positive values represent enhanced westerly flow and negativevalues reduced westerly or easterly flow. The Paris–London index constructed from the monthly meanpressure data from Paris and London for 1774–1995 has been shown to correlate well with Europeanzonal flow, with correlations ranging from 0.8 in February to 0.6 in July. The NAO calculated fromhomogenized pressure data (Slonosky et al., 1999, 2000), on the other hand, correlates less well withEuropean zonal flow (0.7 in February, 0.2 in July), although it has higher correlations with theParis–London index (0.9 in February; 0.4 in June). Slonosky et al. (2000) concluded that the NAOprovided a reasonably good approximation of European zonal flow in winter, but not in summer. Thecorrelation between the Paris–London index and surface temperature is also very good in winter, andsimilar to the correlation between winter temperature and European zonal flow, but is almost zero insummer, whereas the correlation between summer temperature and European zonal flow is significantlynegative (Slonosky et al., 2001).
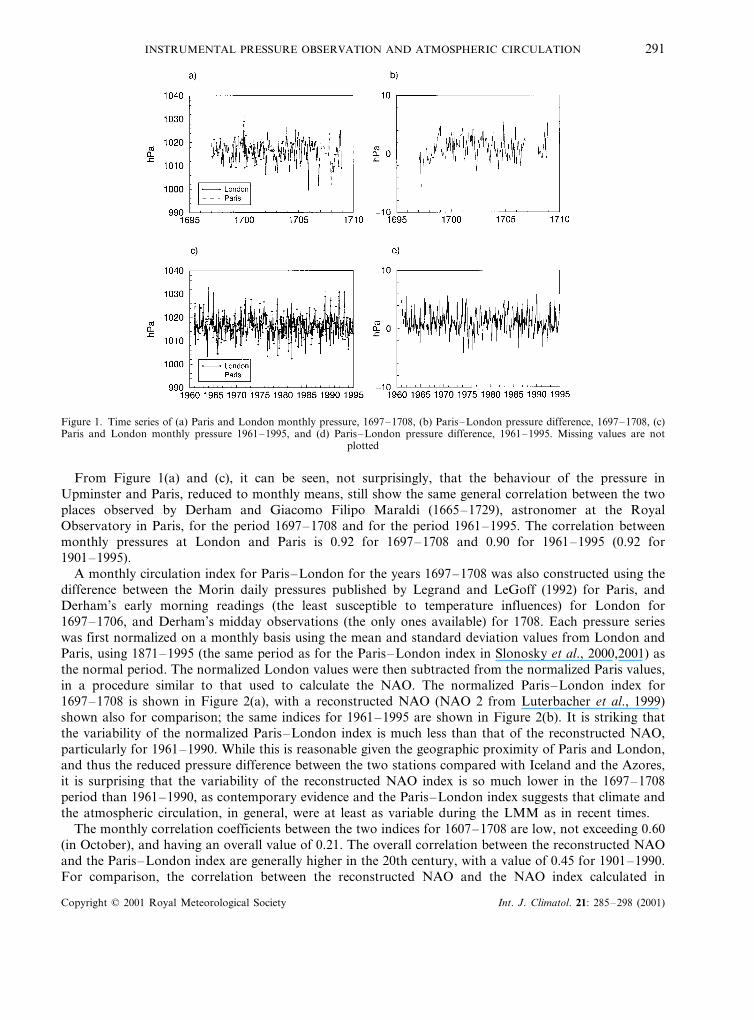
The mean monthly pressures and absolute pressure difference between Paris and London from1697–1708 are shown in Figure 1, with those for 1961–1995 also shown for comparison purposes. Thepressure difference is generally positive, indicating that the pressure at Paris is higher than London, andthe geostrophic flow between them is westerly; a negative value of pressure difference implies easterlyflow, with the pressure at London higher than at Paris. The pressure difference between two given pointsgives an approximation of the pressure gradient, and thus the geostrophic, not actual, surface winds; nearthe Earth’s surface, friction effects influence the direction of the actual surface winds, causing them todeviate slightly from the geostrophic wind. The Paris–London pressure difference and circulation indexcan only estimate the strength of the flow in a direction perpendicular to the line of the two stations, ororientated on a somewhat east–northeast/west–southwest axis; they give little indication of the strengthof the northerly or southerly flow.
Similar comparisons between barometer readings from Upminster and Paris had been undertaken in the1700s:
Monsieur Meraldi, by comparing his Obser6ations at the Paris Obser6atory with mine at Upminster,takes notice, ‘That there is a great agreement between the 6ariation of the Heights of the Barometersin both Places; that he finds almost always that one riseth or falleth, that the other doth so too, althoughnot always alike: That the Days in each Month whereon the Mercury hath been highest or lowest, it hathbeen the same at Paris as at Upminster, but ordinarily somewhat more than 3 or 4 Lines lower at Paristhan Upminster’. (Academie des Sciences, 1699; Derham, 1709a).
Copyright © 2001 Royal Meteorological Society Int. J. Climatol. 21: 285–298 (2001)
INSTRUMENTAL PRESSURE OBSERVATION AND ATMOSPHERIC CIRCULATION 291
Figure 1. Time series of (a) Paris and London monthly pressure, 1697–1708, (b) Paris–London pressure difference, 1697–1708, (c)Paris and London monthly pressure 1961–1995, and (d) Paris–London pressure difference, 1961–1995. Missing values are not
plotted
From Figure 1(a) and (c), it can be seen, not surprisingly, that the behaviour of the pressure inUpminster and Paris, reduced to monthly means, still show the same general correlation between the twoplaces observed by Derham and Giacomo Filipo Maraldi (1665–1729), astronomer at the RoyalObservatory in Paris, for the period 1697–1708 and for the period 1961–1995. The correlation betweenmonthly pressures at London and Paris is 0.92 for 1697–1708 and 0.90 for 1961–1995 (0.92 for1901–1995).
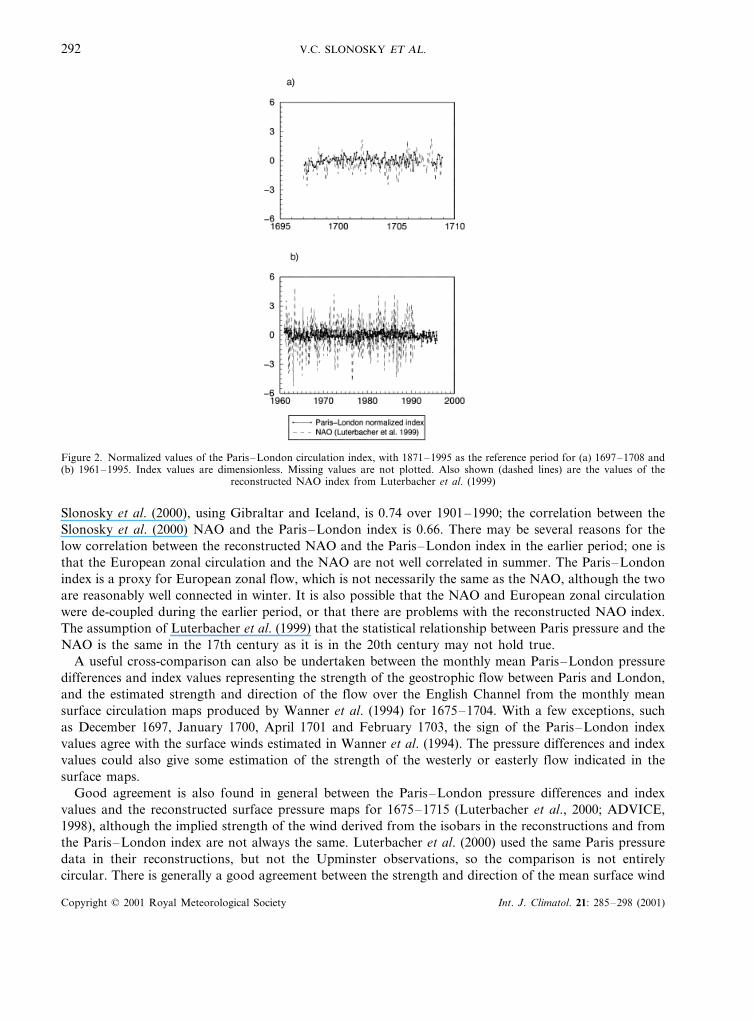
A monthly circulation index for Paris–London for the years 1697–1708 was also constructed using thedifference between the Morin daily pressures published by Legrand and LeGoff (1992) for Paris, andDerham’s early morning readings (the least susceptible to temperature influences) for London for1697–1706, and Derham’s midday observations (the only ones available) for 1708. Each pressure serieswas first normalized on a monthly basis using the mean and standard deviation values from London andParis, using 1871–1995 (the same period as for the Paris–London index in Slonosky et al., 2000,2001) asthe normal period. The normalized London values were then subtracted from the normalized Paris values,in a procedure similar to that used to calculate the NAO. The normalized Paris–London index for1697–1708 is shown in Figure 2(a), with a reconstructed NAO (NAO 2 from Luterbacher et al., 1999)shown also for comparison; the same indices for 1961–1995 are shown in Figure 2(b). It is striking thatthe variability of the normalized Paris–London index is much less than that of the reconstructed NAO,particularly for 1961–1990. While this is reasonable given the geographic proximity of Paris and London,and thus the reduced pressure difference between the two stations compared with Iceland and the Azores,it is surprising that the variability of the reconstructed NAO index is so much lower in the 1697–1708period than 1961–1990, as contemporary evidence and the Paris–London index suggests that climate andthe atmospheric circulation, in general, were at least as variable during the LMM as in recent times.
The monthly correlation coefficients between the two indices for 1607–1708 are low, not exceeding 0.60(in October), and having an overall value of 0.21. The overall correlation between the reconstructed NAOand the Paris–London index are generally higher in the 20th century, with a value of 0.45 for 1901–1990.For comparison, the correlation between the reconstructed NAO and the NAO index calculated in
Copyright © 2001 Royal Meteorological Society Int. J. Climatol. 21: 285–298 (2001)
V.C. SLONOSKY ET AL.292
Figure 2. Normalized values of the Paris–London circulation index, with 1871–1995 as the reference period for (a) 1697–1708 and(b) 1961–1995. Index values are dimensionless. Missing values are not plotted. Also shown (dashed lines) are the values of the
reconstructed NAO index from Luterbacher et al. (1999)
Slonosky et al. (2000), using Gibraltar and Iceland, is 0.74 over 1901–1990; the correlation between theSlonosky et al. (2000) NAO and the Paris–London index is 0.66. There may be several reasons for thelow correlation between the reconstructed NAO and the Paris–London index in the earlier period; one isthat the European zonal circulation and the NAO are not well correlated in summer. The Paris–Londonindex is a proxy for European zonal flow, which is not necessarily the same as the NAO, although the twoare reasonably well connected in winter. It is also possible that the NAO and European zonal circulationwere de-coupled during the earlier period, or that there are problems with the reconstructed NAO index.The assumption of Luterbacher et al. (1999) that the statistical relationship between Paris pressure and theNAO is the same in the 17th century as it is in the 20th century may not hold true.
A useful cross-comparison can also be undertaken between the monthly mean Paris–London pressuredifferences and index values representing the strength of the geostrophic flow between Paris and London,and the estimated strength and direction of the flow over the English Channel from the monthly meansurface circulation maps produced by Wanner et al. (1994) for 1675–1704. With a few exceptions, suchas December 1697, January 1700, April 1701 and February 1703, the sign of the Paris–London indexvalues agree with the surface winds estimated in Wanner et al. (1994). The pressure differences and indexvalues could also give some estimation of the strength of the westerly or easterly flow indicated in thesurface maps.
Good agreement is also found in general between the Paris–London pressure differences and indexvalues and the reconstructed surface pressure maps for 1675–1715 (Luterbacher et al., 2000; ADVICE,1998), although the implied strength of the wind derived from the isobars in the reconstructions and fromthe Paris–London index are not always the same. Luterbacher et al. (2000) used the same Paris pressuredata in their reconstructions, but not the Upminster observations, so the comparison is not entirelycircular. There is generally a good agreement between the strength and direction of the mean surface wind
Copyright © 2001 Royal Meteorological Society Int. J. Climatol. 21: 285–298 (2001)
INSTRUMENTAL PRESSURE OBSERVATION AND ATMOSPHERIC CIRCULATION 293
presented in ADVICE (1998), and the circulation inferred from the Paris–London differences forDecember and January. The only exception is for January 1706, where the reconstructed map impliessouthwesterly flow over the English Channel, but the Paris–London pressure difference is −1.8 hPa,indicating easterly flow. Most of the contradictions between the wind direction from the surface pressuremaps and the value of the Paris–London index occur in the spring and early summer months of April,May and June.
There appears to be a number of negative values in the Paris–London pressure difference andcirculation index from 1697–1708, particularly in the years 1697 and 1698. As no temperature data wereavailable for Upminster for these years, it is possible that the data for London are at fault, although, withthe exception of some months in 1697, they agree well with Paris. However, these two years are also onesof historically recorded severity in Europe, and Kington (1997), based on the reconstructions of Wanneret al. (1994), showed that December 1696 experienced pronounced anomalous northerly flow, andJanuary and February 1697 experienced anomalous easterly flow, which would give negative extremes inthe Paris–London index. Kington noted that the winters of 1696–1697 and 1697–1698 were severe(Kington, 1997, 1999). The summer of 1698 was also cold, one of the fifteen coldest summers in centralEngland since 1659 (Lamb, 1995), having a mean temperature of 14.0°C, 1.4°C below the 1961–1990mean. The negative extremes of the Paris–London pressure difference (Figure 1) and normalized index(Figure 2) during these years suggest frequent reversals of the usual south–north pressure gradient,implying strong easterly flow across the English Channel, bringing cold air from the Arctic and theinterior of the Eurasian continent over England and France, as can also be seen in Wanner et al. (1994)and Kington (1997).
Derham also discussed extensively the cold year of 1708 at Upminster, particularly late April and earlyMay (N.S. which corresponds to April O.S.), which was an unusually cold and frosty month, and June,when temperatures were near the point of hoar frost on the summer solstice, although August wasunusually hot (Derham, 1709b, 1731). The mean pressure difference for April 1708 is +0.4 (zonal indexvalue of −0.17); the month started out with positive pressure differences and ended with stronglynegative ones, suggesting easterly flow towards the end of the month. The mean pressure difference forJune 1708 is −0.8 hPa (index value −0.74), implying easterly winds, and for August is +2.2 hPa (indexvalue 0.66), the heat perhaps being a result of southerly flow from the western Mediterranean. Derham(1709b) described the end of September and October 1708 (O.S.; October N.S) as being cold and frostywith northerly winds, and the pressure difference for October 1708 is −0.9 hPa (index value −0.35),indicating reversed zonal flow, with possibly northeasterly winds. December 1708 was open and mild untilthe onset of the ‘Great Frost’ of 1708–1709 at the end of December (O.S., beginning of January N.S.;Derham, 1709b), and the index value is high, +3.1, indicating mainly westerly winds across the EnglishChannel. The winter of 1709 was well documented across Europe for the unusual degree of coldtemperatures, ice and snow. Derham recorded his lowest ever temperature reading on 30 December 1708(O.S.; 10 January, 1709 N.S.), of 45 (−12°C; Derham, 1709b), and Morin recorded temperatures below−15°C for 11 consecutive days, starting from 6 January 1709 (N.S.) onwards (Legrand and LeGoff,1992).
The causes of the unusual degree of cold in 1709, and of changes in climate generally, were discussedin Derham’s publications. In 1709, he notes that one of his contemporaries, Mr G. Reamus of Danzig(Gdansk), considered (but rejected!)
The 6ariation of the mutual Distance between the Earth and the Sun, the mutation of the Earth’s placein respect of the Hea6ens . . . it being at a greater distance from the Sun, and the obstruction of theSolar Rays by the Spots on the Sun . . .
as a possible cause of the unusual cold of 1709 (Derham, 1709b).Derham himself rejected Reamus’ idea that the cold was caused by misty damp weather, noting instead
that:
Copyright © 2001 Royal Meteorological Society Int. J. Climatol. 21: 285–298 (2001)
V.C. SLONOSKY ET AL.294
I take (the misty, cloudy, dark Weather) to be the reason we ha6e not more frequent se6ere Frosts, atleast in our Island places surrounded by the warm Vapours of the Sea. Clouds and Vapours do indeedintercept and keep off the Sun-beams; and probably imbibe and retain a great deal of Warmththemsel6es, nay, perhaps they may (as Mr. Reamus says) reflect back some of the Sun-Rays; But weconstantly in Winter find, that the fewer the Exhalations are, and the clearer the Air, and after theWarmth of the Sun by Day, the sharper the Frost is at night (Derham, 1709b).
Although discussing the ‘Wind cooling the Air, and the North and East winds more than other Winds ’,Derham wrote that he has no theories to account for the unusual cold of 1709, but discussed the
Mint of Meteors in the Superior Regions of the Air, and the Source of Exhalations being theTerraqueous-Globe, in those two Places we are to seek for the further and more grand Causes of the lateFrost (Derham, 1709b).
3.2. Daily
A comparison was also made between the 1697–1706 daily index of Paris–London and an index ofParis–London constructed from modern daily data. It was only possible to obtain daily data for themodern period from 1994 to 1997, with data for London from the London Weather Centre and for Parisfrom Paris-Orly, available from the US National Oceanographic and Atmospheric Administration’sNational Climatic Data Centre. The 1697–1706 data are the only daily circulation values available fromsuch an early date, and, as such, even a very limited comparison, the only one possible here, is of interest.
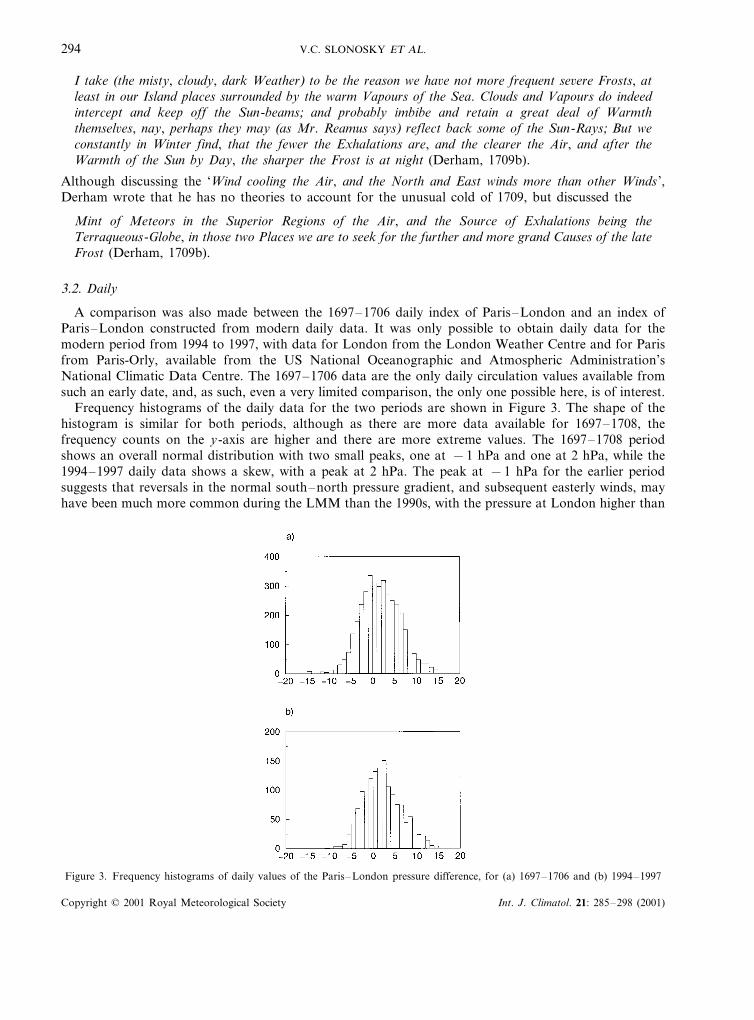
Frequency histograms of the daily data for the two periods are shown in Figure 3. The shape of thehistogram is similar for both periods, although as there are more data available for 1697–1708, thefrequency counts on the y-axis are higher and there are more extreme values. The 1697–1708 periodshows an overall normal distribution with two small peaks, one at −1 hPa and one at 2 hPa, while the1994–1997 daily data shows a skew, with a peak at 2 hPa. The peak at −1 hPa for the earlier periodsuggests that reversals in the normal south–north pressure gradient, and subsequent easterly winds, mayhave been much more common during the LMM than the 1990s, with the pressure at London higher than
Figure 3. Frequency histograms of daily values of the Paris–London pressure difference, for (a) 1697–1706 and (b) 1994–1997
Copyright © 2001 Royal Meteorological Society Int. J. Climatol. 21: 285–298 (2001)

INSTRUMENTAL PRESSURE OBSERVATION AND ATMOSPHERIC CIRCULATION 295
at Paris. As discussed by Moses et al. (1987), reversals imply blocking flow, so this suggests that blockingflow may have been much more prevalent during the LMM than in recent times. It is, however, difficultto draw any overall conclusions as to the differences between the two periods because of the brevity ofthe data records, particularly for the modern period.
4. PARIS–LONDON ZONAL INDEX, 1697–1708 AND CENTRAL ENGLANDTEMPERATURES
The monthly correlations between the Paris–London circulation index for 1697–1708 and the CentralEngland temperature (CET) record were calculated and are shown in Figure 4. For comparison, thecorrelations between the Paris–London index and Central England temperatures from 1774–1995 are alsoshown (from Slonosky et al., 2000). The daily temperature corrections performed on the pressure data arenecessary to reduce the barometer readings to an acceptable common standard (0°C), and to remove thespurious effects of the thermal expansion of mercury from the pressure reading, but do not substantiallyaffect the variability (or even the magnitude, the temperature correction being small) of the pressurereadings, so a comparison between a circulation index based on the Upminster pressure data, eventemperature-corrected, and the monthly CET record, based on the Upminster temperature readings, is notcircular.
Figure 4 demonstrates clearly the problems with determining behaviour based on short records; as thenumber of observations (11) is low for the earlier period, the values of correlation coefficientscorresponding to the 95% confidence level are very high. Furthermore, the monthly cycle is not smooth,as there are not enough observations to smooth out the noise inherent in observed data. The annual cycleof correlation for 1697–1708 shows statistically significant correlations for January and March only,whereas the peak correlation for the 1774–1995 period is in February (Figure 4(b)), suggesting somedifferences in the late winter and early spring temperature–circulation relationship between the two
Figure 4. Monthly correlation between Paris–London pressure index and central England temperatures, for (a) 1697–1708 and (b)1774–1995. 95% confidence levels are indicated by dotted lines
Copyright © 2001 Royal Meteorological Society Int. J. Climatol. 21: 285–298 (2001)
V.C. SLONOSKY ET AL.296
periods. The peak negative correlation during the summer is in July for 1697–1708, and is much strongerthan the inverse summer correlation in August for the 1774–1995 period, despite the fact that it is justbelow the significance level. The correlation coefficient for September for the 1697–1708 period is alsomuch higher than for the 1774–1995 period.
5. CONCLUSIONS
The daily early instrumental pressure observations of Derham for the years 1697–1708 (except for 1707)have been corrected for temperature effects, gravity and height above sea-level, converted to modern unitsand the Gregorian calendar, and adjusted to conform with the long-term monthly mean values of pressureat London for 1774–1995, under the assumption of stationarity of long-term pressure values.
These pressure observations have been used together with the contemporary observations of LouisMorin from Paris, compiled and corrected by Legrand and LeGoff (1992), also adjusted here to thelong-term monthly mean values of pressure at Paris for 1764–1996, to form a zonal circulation indexbased on the pressure gradient between Paris and London. Previous work (Slonosky et al., 2000)established the Paris–London circulation index as a good proxy of the zonal circulation over Europe,particularly in winter. The years 1697 and 1698 contain many extreme negative values in theParis–London circulation index, which may be a result of problems with the data, temperature data notbeing available to correct the barometer readings for Upminster during those years, or may represent trulyanomalous circulation during those years, as accounts exist which imply that those were unusually coldyears. The winter of 1708–1709 was also renowned in Europe as one of ‘Great Frost’, and Derham madedetailed observations as to the nature of the seasons for 1708, which accord well with the atmosphericcirculation inferred from the calculated Paris–London zonal index.
Comparisons were also undertaken between the daily values of this index during 1697–1708 and the1990s. Although it was only possible to obtain a very short period for modern daily data, the comparisonis still an interesting one, especially as the daily values of the Paris–London circulation index are theearliest available at such high resolution, and can give an unprecedented glimpse at the character of dailycirculation for this period. Frequency histograms of the daily values suggest that reversals of thesouth–north pressure gradient and easterly winds were more prevalent during 1697–1708 than during1994–1997. As such reversals are connected to blocking highs and meridional flow (Moses et al., 1987),it can be inferred that the circulation was more meridional during 1697–1708, which would account forboth the increased severity and variability of the climate of this period. It would be interesting to continuethis analysis into the daily circulation of 1697–1708 by not only comparing the daily flow with moreextensive daily data from the modern period, but also by correlating Paris–London index values withdaily weather types, and attempting to reconstruct daily weather types for 1697–1708.
The correlations between the Paris–London index and central England temperatures were calculated ona monthly basis and compared with the long period 1774–1995. Some differences can be seen between thetwo periods; in particular, the lower correlation between the zonal index and central Englandtemperatures in February, and the higher correlation in July for the period 1697–1708. The Julycorrelation value between the Paris–London index and central England temperatures from 1697–1708 issimilar to that of the correlation between European zonal index (PC 2 of Slonosky et al., 2000) andwestern European temperatures. This suggests that the Paris–London index may be more closely relatedto European zonal flow from 1697–1708 than 1822–1995, accounting for some of the variability in bothwinter and summer temperatures.
The observations of Derham are of immense value to the study of past climate, as he was a meticulousobserver of weather and climate, and kept detailed records of his observations. His theories and hiscomments on those of his contemporaries are interesting as they described the progress of scientificthought and the philosophy of climatology; in the early 18th century, the influence of solar variations onclimate change, the effects of the differential heating of the Earth’s surface caused by the curvature of theglobe (with more solar energy incident at the equator than the poles), warm and cold air advection and
Copyright © 2001 Royal Meteorological Society Int. J. Climatol. 21: 285–298 (2001)

INSTRUMENTAL PRESSURE OBSERVATION AND ATMOSPHERIC CIRCULATION 297
the moderating influence of the ocean on climate are all discussed by Derham in the PhilosophicalTransactions of the Royal Society (Derham, 1709b). It is hoped that more of his daily instrumentalobservations and weather registers may eventually come to light, especially those for the early 18thcentury. If it were possible to find pressure data from London for the 18th century, it would be feasibleto construct a Paris–London circulation index for most of the past 300 years, as pressure and temperaturereadings were taken daily at the Paris Observatory during most of the period from the 1670s to the 1730s,and elsewhere in Paris from the 1750s onwards. Such an index would be of value to study the naturalvariability and extremes of European atmospheric circulation during the entire instrumental period, andmight also be of use for reconstructing NAO-type circulation indices, although, as has been seen here, therelationship between European zonal flow and the NAO is not always straightforward.
ACKNOWLEDGEMENTS
The authors would like to thank Mary Sampson, Royal Society archivist, and the archivists at the EssexCounty Records Office, for their help and patience in tracing the manuscripts of Derham’s weatherobservations. This paper benefited from comments by David Parker and Tim Osborn, and wassubstantially improved by the review of Juerg Luterbacher, to whom we are also grateful for sending ushis reconstructed NAO index. VCS was supported during the research for this work by the CanadianNatural Sciences and Engineering Research Council and the Quebec Fonds pour la formations deschercheurs et l’aide a la recherche. This work was also undertaken in the context of the EC projectADVICE ENV4-CT95-0129.
REFERENCES
Academie des Sciences. 1699. Comparaisons d’observations faites en differens lieux sur le Barometre, sur le Vents et sur la quantitedes Pluyes. Histoires Academie des Sciences 1699: 20–22.
ADVICE. 1998. Final report of the European Commission project ADVICE; Annual to decadal variability in climate in Europe.Climatic Research Unit, University of East Anglia, Norwich, UK.
Bergstorm H, Moberg A. 2001. Daily series of air temperature and pressure series at Uppsala 1772–1998. Climate Change(submitted).
Bradley RS, Jones PD. 1993. Climate since AD 1500. Routledge: London.Briffa KR, Jones PD, Schweingruber FH, Osborn TJ. 1998. Influence of volcanic eruptions on Northern Hemisphere summer
temperatures over the past 600 years. Nature 393: 450–455.Crowley TJ. 2000. Causes of climate change over the past 1000 years. Science 289: 270–277.Derham W. 1698. A letter of Mr. W. Derham, Rector of Upminster, dated Jan 13 1697/8, to Dr. Sloan; about a contrivance to
measure the height of the mercury in the barometer, by a circle on one of the weather plates, with a register of the weather, etc.,for the year 1697. Philosophical Transactions of the Royal Society of London 20: 45–48.
Derham W. 1699. Part of a letter from Mr. William Derham to Dr. Sloan; accompanying his observations of the height of mercuryin the barometer, rains, winds, etc, for the year 1698. Philosophical Transactions of the Royal Society of London 21: 45–46+2plates.
Derham W. 1700. Part of a letter from the Reverend Mr. Derham to Dr. Sloan, giving an account of his observations of the weatherfor the year 99. Philosophical Transactions of the Royal Society of London 22: 527–529+2 plates.
Derham W. 1709a. Tables of the Barometrical altitudes at Zurich in Switzerland in the year 1708, observed by Dr. Joh. Ja.Scheuchzer, F.R.S. and at Upminster in England, observed at the same time by Mr. W. Derham, F.R.S. as also the rain at Pisain Italy in 1707 and 1708, observed there by Dr. Micheal Angelo Tilli, F.R.S., and at Zurich in 1708, and at Upminster in all thattime; With remarks on the same tables, as also on the winds, heat and cold, and divers other matters occurring in those threedifferent parts of Europe. Philosophical Transactions of the Royal Society of London 26: 342–366.
Derham W. 1709b. The History of the Great Frost in the last Winter 1708 and 1708/9. Philosophical Transactions of the RoyalSociety of London 26: 454–478.
Derham W. 1715. An account of the rain which fell every year at Upminster in Essex in the last 18 years. Philosophical Transactionsof the Royal Society 29: 130–132.
Derham W. 1931. An abstract of the meteorological diaries communicated to the Royal Society, with remarks upon them by W.Derham, Part I. Philosophical Transactions of the Royal Society of London 37: 261–273.
Derham W. 1733a. An abstract of the meteorological diaries communicated to the Royal Society, with remarks upon them by W.Derham, Part II. Philosophical Transactions of the Royal Society of London 38: 101–109.
Derham W. 1733b. An abstract of the meteorological diaries communicated to the Royal Society, with remarks upon them by W.Derham, Part III. Philosophical Transactions of the Royal Society of London 38: 334–344.
Derham W. 1733c. An abstract of the meteorological diaries communicated to the Royal Society, with remarks upon them by W.Derham, Part IV. Philosophical Transactions of the Royal Society of London 38: 405–412.
Copyright © 2001 Royal Meteorological Society Int. J. Climatol. 21: 285–298 (2001)
V.C. SLONOSKY ET AL.298
IPCC. 1996. In Climate Change 1995; The Science of Climate Change, Houghton JT, Meira Filho LG, Callander BA, Harris N,Kattenberg A, Maskell K (eds). Cambridge University Press: Cambridge; 572 pp.
Jones PD, Briffa KR, Barnett TP, Tett SFB. 1998. High resolution records for the last millenium; interpretation, integration andcomparison with GCM control-run temperatures. The Holocene 8: 455–471.
Jones PD, Davies TD, Lister DH, Slonosky V, Jonsson T, Barring L, Jonsson P, Maheras P, Kolyva-Machera F, Barriendos M,Martin-Vide S, Rodriguez R, Alcoforado MJ, Wanner H, Pfister C, Luterbacher J, Rickli R, Schuepbach E, Kass E, Schmith T,Jacobeit J, Beck C. 1999. Monthly mean pressure reconstructions for Europe for the 1780–1995 period. International Journal ofClimatology 19: 347–364.
Kington J. 1997. The severe winter of 1696/97. Weather 52: 386–391.Kington J. 1999. The severe winter of 1697/98. Weather 54: 43–48.Lamb HH. 1995. Climate, History and the Modern World (2nd edn). Routledge: London; 1995.Lean J, Beer J, Bradley R. 1995. Reconstruction of solar irradiance since 1610; Implications for climate change. Geophysical
Research Letters 22: 3195–3198.Legrand J-P, LeGoff M. 1992. Les observations meteorologiques de Louis Morin. Direction de la Meteorologie Nationale, Ministere
de l’Equipement, de Logement et des Transports, monographie No. 6, vol. 1.Luterbacher J, Schmutz C, Gyalistras D, Xoplaki E, Wanner H. 1999. Reconstruction of monthly NAO and EU indices back to AD
1675. Geophysical Research Letters 26: 2745–2748.Luterbacher J, Rickli R, Tinguely C, Xoplaki E, Schupbach E, Dietrich D, Husler J, Ambuhl M, Pfister C, Beeli P, Dietrich U,
Dannecker A, Davies TD, Jones PD, Slonosky V, Ogilvie AEJ, Maheras P, Kolyva-Machera F, Martin-Vide J, Barriendos M,Alcoforado M, Nunes MF, Jonsson T, Glaser R, Jacobeit J, Beck C, Philipp A, Beyer U, Kaas E, Schmith T, Barring L, JonssonP, Racz L, Wanner H. 2000. Reconstruction of monthly mean sea level pressure over Europe for the Late Maunder Minimumperiod (1675–1715) based on canonical correlation analysis. International Journal of Climatology 20: 1049–1066.
Manley G. 1953. The mean temperature of Central England, 1698–1952. Quarterly Journal of the Royal Meteorological Society 79:242–257.
Manley G. 1961. A preliminary note on early meteorological observations. Meteorological Magazine 113: 303–310.Manley G. 1974. Central England temperature; monthly means 1659 to 1973. Quarterly Journal of the Royal Meteorological Society
100: 389–405.Mann ME, Bradley RS, Hughes MK. 1998. Global-scale temperature patterns and climate forcing over the past six centuries. Nature
352: 779–787.Middleton Knowles WE. 1964. The History of the Barometer. Johns Hopkins Press: Baltimore, MD.Middleton Knowles WE. 1966. The In6ention of the Meteorological Instruments. Johns Hopkins Press: Baltimore, MD.Moses T, Kiladis GN, Diaz HF, Barry RG. 1987. Characteristics and frequency of reversals in mean sea level pressure in the North
Atlantic sector and their relationship to long-term temperature trends. Journal of Climatology 7: 13–30.Serway RA. 1986. Physics for Scientist and Engineers. Saunders College Publishing: Philadelphia, PA.Slonosky VC, Jones PD, Davies TD. 1999. Homogenization techniques for European monthly mean surface pressure series. Journal
of Climate 8: 2658–2672.Slonosky VC, Jones PD, Davies TD. 2000. Variability of the surface atmospheric circulation over Europe; 1774–1995. International
Journal of Climatology 20: 1875–1897.Slonosky VC, Jones PD, Davies TD. 2001. Atmospheric circulation and surface temperature in Europe from the 18th century to
1995. International Journal of Climatology 21: 63–75.Wanner H, Bradzil R, Frich P, Frydendahl K, Jonsson T, Kington J, Pfister C, Rosenorn S, Wishman E. 1994. Synoptic
reconstruction of monthly weather maps for the Late Maunder Minimum (1675–1704). In Climatic Trends and Anomalies inEurope, 1675–1715, Frenzel B, Pfister C, Glaser B (eds). Fischer: Stuttgart; 401–424.
Copyright © 2001 Royal Meteorological Society Int. J. Climatol. 21: 285–298 (2001)