Cardiorespiratory Fitness in Pediatric Renal Transplant Recipients

Mtw
RsvLMSVSH
S1
2
Association of Malnutrition-Inflammation Score With Quality of Life andMortality in Hemodialysis Patients: A 5-Year
Prospective Cohort Study
Mehdi Rambod, MD,1,2 Rachelle Bross, RD, PhD,3 Jennifer Zitterkoph, RD,3
Deborah Benner, RD,4 Juhi Pithia, RD,5 Sara Colman, RD,5 Csaba P. Kovesdy, MD,6
Joel D. Kopple, MD,2,7,8 and Kamyar Kalantar-Zadeh, MD, MPH, PhD1,2,7,8
Background: The Malnutrition-Inflammation Score (MIS), an inexpensive and easy-to-assess scoreof 0 to 30 to examine protein-energy wasting (PEW) and inflammation, includes 7 components of theSubjective Global Assessment, body mass index, and serum albumin and transferrin concentrations.We hypothesized that MIS risk stratification of hemodialysis (HD) patients in predicting outcomes isbetter than its components or laboratory markers of inflammation.
Study Design: 5-Year cohort study.Setting & Participants: We examined 809 stable HD outpatients and followed them for up to 5 years
(October 2001 to December 2006).Predictors: MIS and other nutritional and inflammatory markers.Outcomes & Measurements: Prospective all-cause mortality, health-related quality of life using the
36-Item Short Form Health Survey (SF-36), and tests of body composition.Results: The MIS correlated with logarithm of serum interleukin 6 level (r � �0.26; P � 0.001),
logarithm of C-reactive protein level (r � �0.16; P � 0.001), and several measures of nutritionalstatus. Patients with a higher MIS had lower SF-36 scores. After multivariate adjustment forcase-mix and other measures of PEW, HD patients in the second (3 to 4), third (5 to 7), and fourth(�8) quartiles of MIS had worse survival rates than those in the first (0 to 2) quartile (P � 0.001).Each 2-unit increase in MIS was associated with a 2-fold greater death risk, ie, adjusted deathhazard ratio of 2.03 (95% confidence interval, 1.76 to 2.33; P � 0.001). Cubic spline survival modelsconfirmed linear trends. Adding MIS to the constellation of age, sex, race/ethnicity, and vintagesignificantly improved the area under the receiver operating characteristic curve developed forpredicting mortality (0.71 versus 0.67; P � 0.001).
Limitations: Selection bias and unknown confounders.Conclusions: In HD patients, the MIS is associated with inflammation, nutritional status, quality of
life, and 5-year prospective mortality. The mortality predictability of the MIS appears equal to seruminterleukin 6 and somewhat greater than C-reactive protein levels. Controlled trials are warranted toexamine whether interventions to improve the MIS can also improve clinical outcomes in HD patients.Am J Kidney Dis 53:298-309. © 2009 by the National Kidney Foundation, Inc.
INDEX WORDS: Malnutrition-inflammation score (MIS); chronic kidney disease (CKD); hemodialysis;malnutrition; inflammation; cardiovascular disease; protein-energy wasting (PEW); health-related qual-ity of life.
ttco
any individuals with chronic kidney dis-ease (CKD) stage 5 who undergo long-
erm hemodialysis (HD) have protein-energyasting (PEW), also known as uremic malnutri-
From the 1Harold Simmons Center for Kidney Diseaseesearch and Epidemiology; 2Los Angeles Biomedical Re-earch Institute at Harbor-UCLA Medical Center; and 3Di-ision of Bionutrition, General Clinical Research Center,os Angeles Biomedical Research Institute at Harbor-UCLAedical Center, Torrance; 4DaVita Nutrition, DaVita Inc, El
egundo; 5DaVita Wild West Division, Downey, CA; 6Salemeterans Affairs Medical Center, Salem, VA; 7David Geffenchool of Medicine at UCLA; and 8UCLA School of Publicealth, Los Angeles, CA.Received March 31, 2008. Accepted in revised form
eptember 2, 2008. Originally published online as doi:
0.1053/j.ajkd.2008.09.018 on December 15, 2008.American Journal of Kid98
ion.1-3 The International Society of Renal Nutri-ion and Metabolism (ISRNM) Expert Panel re-ently proposed a set of criteria for the detectionf PEW.2 In addition to the 4 sets of traditional
Address correspondence to Kamyar Kalantar-Zadeh, MD,PH, PhD, Harold Simmons Center for Kidney Diseaseesearch and Epidemiology, Los Angeles Biomedical Re-earch Institute at Harbor-UCLA Medical Center, and UCLAavid Geffen School of Medicine and UCLA School ofublic Health, 1124 West Carson St, C1-Annex, Torrance,A 90502. E-mail: [email protected]© 2009 by the National Kidney Foundation, Inc.0272-6386/09/5302-0014$36.00/0doi:10.1053/j.ajkd.2008.09.018
MRsDPC
ney Diseases, Vol 53, No 2 (February), 2009: pp 298-309

ctmeut(rt
Jtha
rodMSmotniaasa
(
(
(
(
1
cs
Malnutrition-Inflammation Score and Outcomes in CKD 299
riteria for the diagnosis of PEW, ie, biochemicalests, low body weight, reduced total body fat oruscle fat or weight loss, and low protein or
nergy intakes, the ISRNM also suggested these of such scoring systems as the semiquantita-ive Subjective Global Assessment of NutritionSGA) or its fully quantitative and CKD-tailoredefinements, such as the Malnutrition-Inflamma-ion Score (MIS).2
Originally introduced in 2001 in the Americanournal of Kidney Diseases,4 the MIS is one ofhe CKD-specific nutritional scoring systems thatas received considerable attention in researchnd clinical practice in the past years and cur-
Table 1. Com
MIS Components 0
A) Medical history:1. Change in end dialysis dry
weight (overall change inthe past 3-6 mo)
�0.5 kg
2. Dietary intake Good appetite, nodeterioration indietary intake
Subopinta
3. Gastrointestinalsymptoms
No symptoms withgood appetite
Mild sappnauocc
4. Functional capacity(nutritionally relatedfunctional impairment)
Normal to improvedfunctionalcapacity, feelingfine
Occaswithambtired
5. Comorbidity* No comorbidity Mild c(exc
B) Physical examination6. Decreased fat stores or
loss of subcutaneous fat(below eyes, triceps,biceps, triceps, chest)
No change
7. Signs of muscle wasting(temple, clavicle, scapula,ribs, quadriceps, knee,interosseous)
No change
C) Body size8. Body mass index (kg/m2) �20
D) Laboratory parameters9. Serum albumin (g/L) �4
10. Serum total iron-bindingcapacity (mg/dL)
�250
Note: Total MIS equals the sum of these 10 componentsAbbreviations: GI, gastrointestinal; MCC, major comorbid*In the original MIS, dialysis treatment age (vintage) conyear, 1 if vintage 1 to 4 years, and at least 2 if vintage gre†MCC includes congestive heart failure class III or IV,
oronary artery disease, moderate to severe chronic obst
tatic malignancy, or recent chemotherapy.ently is used for annual nutritional assessmentf more than 100,000 dialysis patients in DaVitaialysis clinics across the United States. TheIS incorporates 7 components of the original
GA plus body mass index (BMI), serum albu-in level, and total iron-binding capacity (TIBC)
r transferrin level (Table 1).4 In dialysis pa-ients, the MIS has been associated with coro-ary artery disease,5 hospitalization and mortal-ty,4,6 health-related quality of life (QoL),7 sleepnd depressive disorders,7,8 exercise capacitynd oxygen uptake,9 and erythropoietin hypore-ponsiveness.10,11 The efficacy of the MIS haslso been examined in peritoneal dialysis pa-
ts of the MIS
Score
2 3
.0kg �1 kg but �5% �5%
lid dietary Moderate overall decreaseto full liquid diet
Hypocaloric liquid tostarvation
s, poor
y
Occasional vomiting ormoderate GI symptoms
Frequent diarrheaor vomiting orsevere anorexia
ficultyeor feelingntly
Difficulty with otherwiseindependent activities(eg, going to bathroom)
Bed/chair-ridden orlittle to nophysical activity
ityCC†)
Moderate comorbidity(including 1 MCC*)
Any severe multiplecomorbidity (�2MCCs*)
Moderate Severe
Moderate Severe
.9 16-17.99 �16
.9 3.0-3.4 �3.049 150-199 �150
g from 0 (no malnutrition) to 30 (severely malnourished).tion; MIS, Malnutrition-Inflammation Score.d to the comorbid condition scoring: 0 if vintage less thann 4 years.n acquired immunodeficiency syndrome (AIDS), severepulmonary disease, major neurological sequelae, meta-
ponen
1
0.5-1
timal soke
ymptometite, orseatedasionallional difbaselinulationfreque
omorbidluding M
Mild
Mild
18-19
3.5-3200-2
, rangincondi
tributeater thafull-blowructive

tats
cmfMttenintMdo(pryltucfiapmwa
P
tSoD(msthfaniFou
tp
rtosasf
T
en(cmo
ctscown1(T4r
A
mttwm
N
msiftmfvson
L
n
Rambod et al300
ients,12-14 as well as different populations6,12,14,15
nd different age groups.16 A recent study usedhe MIS as the gold standard for examining otherimpler scoring systems.15,17
However, many of these studies have signifi-ant limitations, including small sample sizes,ostly fewer than 100 participants, and short
ollow-up. The mortality predictability of theIS originally was examined in only 83 long-
erm HD patients over a 12-month period,4 andhe association between the MIS and QoL wasxamined in only 76 Turkish HD patients.7 It isot known whether the MIS has superior mortal-ty predictability compared with its 10 compo-ents or other markers of nutrition or inflamma-ion. The inflammatory representativeness of the
IS has not yet been well studied. Recent evi-ence suggests that increased circulatory levelsf interleukin 6 (IL-6) and C-reactive proteinCRP) are strong correlates of mortality in HDatients.18-21 The prognostic value of these elabo-ate laboratory markers of inflammation has notet been compared with the MIS in larger andonger cohorts. Hence, to examine the hypothesishat MIS risk stratification of HD patients isseful in predicting outcomes and better than itsomponent alone or in diverse combinations, werst examined the association between the MISnd health-related QoL and mortality in 809 HDatients. Next, we studied the commensurateortality predictability of the MIS comparedith explicit laboratory markers of inflammation
nd proinflammatory cytokines.
METHODS
atient Population
We studied HD patients who participated in the Nutri-ional and Inflammatory Evaluation in Dialysis (NIED)tudy.22 The original patient cohort was derived from a poolf more than 3,000 HD outpatients during 5 years in 8aVita dialysis facilities in the South Bay Los Angeles, CA
see the NIED Study website at www.NIEDStudy.org forore details, as well as previous publications23-25). Inclu-
ion criteria were outpatients who had been undergoing HDreatment for at least 8 weeks, were 18 years or older, andad signed the institutional review board–approved consentorm. Patients with acute infections or anticipated life expect-ncy less than 6 months (eg, because of a metastatic malig-ancy or advanced human immunodeficiency virus/acquiredmmunodeficiency syndrome [HIV/AIDS]) were excluded.rom October 1, 2001, through December 31, 2006, a totalf 893 HD patients signed the informed consent form and
nderwent the periodic evaluations of the NIED Study. For chis study, data including MIS were available for 809 HDatients.The medical chart of each HD patient was thoroughly
eviewed by a collaborating physician, and data pertainingo the underlying kidney disease, cardiovascular history, andther comorbid conditions were extracted. A modified ver-ion of the Charlson comorbidity index, ie, without the agend kidney disease components, was used to assess theeverity of comorbidities.26,27 The 809 HD patients wereollowed for up to 63 months, ie, until December 31, 2006.
heMIS
The MIS has 4 sections (nutritional history, physicalxamination, BMI, and laboratory values) and 10 compo-ents.4 Each component has 4 levels of severity, from 0normal) to 3 (severely abnormal). The sum of all 10 MISomponents can range from 0 (normal) to 30 (severelyalnourished); a higher score reflects a more severe degree
f malnutrition and inflammation (Table 1).The 5 nutritional history–based components include weight
hange, dietary intake, gastrointestinal symptoms, func-ional capacity, and comorbid conditions. In the presenttudy, dialysis vintage was not included in the comorbidityomponent. The 2 physical examination components consistf assessment of subcutaneous body fat and signs of muscleasting. In addition to the foregoing 7 SGA-based compo-ents, the 3 MIS-unique sections include BMI (�20, 18 to9.99, 16 to 17.99, and �16 kg/m2), serum albumin level�4.0, 3.5 to 3.9, 3.0 to 3.4, and �3.0 g/dL), and serumIBC (�250, 200 to 249, 150 to 200, and �150 mg/dL), theincrements of which are also scored from 0 through 3,
espectively.4
nthropometricMeasures
Body weight assessment and anthropometric measure-ents were performed while patients underwent an HD
reatment or within 5 to 20 minutes after termination of thereatment. Biceps skinfold and triceps skinfold thicknessesere measured using a conventional skinfold caliper byeans of standard techniques as previously described.28,29
ear-Infrared Interactance
To estimate percentage of body fat and fat-free bodyass, near-infrared (NIR) interactance was measured at the
ame time as anthropometric factors.30 A commercial NIRnteractance sensor with a coefficient of variation of 0.5%or total body fat measurement (portable Futrex 6100; Fur-ex Inc, Gaithersburg, MD; www.futrex.com) was used. NIReasurements were performed by placing a Futrex sensor
or several seconds on the upper aspect of the arm without aascular access and entering the required data (date of birth,ex, weight, and height) of each patient. NIR measurementsf body fat appear to correlate significantly with otherutritional measures in HD patients.25
aboratory Tests
Predialysis blood samples and postdialysis serum ureaitrogen values were obtained on a midweek day that coin-
ided chronologically with the drawing of quarterly blood
trsF
tmamemupwLhpwm
S
swtTttcwa[padM
topcvvcerccDwtS(odutdt
a
ApkmsmFitevs
G
wAd1b3ivvpwotcdOahdwf
Malnutrition-Inflammation Score and Outcomes in CKD 301
ests in DaVita facilities. The single-pool Kt/V was used toepresent weekly dialysis dose. All routine laboratory mea-urements were performed by DaVita Laboratories (Deland,L) using automated methods.Serum high-sensitivity CRP was measured by using a
urbidometric immunoassay (WPCI, Osaka, Japan; unit,illigrams per liter; normal range, �3.0 mg/L).31,32 IL-6
nd tumor necrosis factor � (TNF-�) were measured byeans of immunoassay kits based on a solid-phase sandwich
nzyme-linked immunosorbent assay using recombinant hu-an IL-6 and TNF-� (R&D Systems, Minneapolis, MN;
nits, picograms per milliliter; normal range: IL-6, �9.9g/mL; TNF-�, �4.7 pg/mL).21,33 CRP, TNF-�, and IL-6ere measured in the General Clinical Research Centeraboratories of Harbor-UCLA, Torrance, CA. Serum transt-yretin (prealbumin) was measured by using immunopreci-itin analysis. Plasma total homocysteine concentrationsere determined by means of high-performance liquid chro-atography in the Harbor-UCLA Clinical Laboratories.
tatisticalMethods
Pearson correlation coefficient (r) was used for analy-es of linear associations. Restricted cubic splines graphsere used as exploratory data analysis strategies to illus-
rate systematic relations between MIS and mortality.his method also served to examine nonlinear associa-
ions as continuous mortality predictors as an alternativeo inappropriate linearity assumptions.34 Thereafter, toalculate the relative risks of death, hazard ratios (HRs)ere obtained by using Cox proportional hazard models
fter controlling for the relevant covariates. Plots of log�log (survival rate)] against log (survival time) wereerformed to establish the validity of the proportionalityssumption. Kaplan-Meier analyses were used to assessifferences in surviving proportions between quartiles ofIS.To compare the prognostic ability of the full version of
he MIS with each of its 10 components, any combinationf them or other nutritional or inflammatory markers inredicting mortality, receiver operating characteristicurves were constructed in which death was the referenceariable, and the death hazard function of the full MISersion, each of the 10 MIS components alone or inombination, or selected inflammatory or nutritional mark-rs were the predicting variables. The area under theeceiver operating characteristic curve (AUC) and 95%onfidence interval (CI) were calculated using somersdommand in Stata (Stata Corp, College Station, TX).ifferences in the AUCs were examined and comparedith the full MIS version (with 10 components) by using
he lincom command after the somersd command in Stata.ensitivity (y-axis) was plotted versus 1 minus specificityx-axis) for each possible cutoff value of hazard functionf each component or combination of components andeath as the dependent (reference) variable.35 The areander the curve represents the discriminative power of theest. Values are expected to be between 0.5 (indicating noiscriminative ability) and 1.0 (indicating highest detec-ion accuracy).
Case-mix and comorbidity covariates included sex,
ge, race and ethnicity (Hispanic, African American, Isian, and other), diabetes mellitus, dialysis vintage,rimary insurance, marital status, dialysis dose (Kt/V),idney residual urine, and laboratory measures of thealnutrition-inflammation complex syndrome (excluding
erum albumin, TIBC, and BMI) in fully adjusted Coxodels that included serum CRP, TNF-�, and IL-6 levels.iducial limits are given as mean � SD or median and
nterquartile range; risk ratios include 95% CIs. P lesshan 0.05 or a 95% CI that did not span 1.0 was consid-red to be statistically significant. Descriptive and multi-ariate statistics were carried out using the statisticaloftware Stata, version 10.0.
RESULTS
eneral and Laboratory Characteristics
Mean patient age was 53.6 � 14.9 years, 47%ere women, 52% were Hispanic, 30% werefrican American, and 54% had diabetes. Meanialysis vintage was 30 � 33 months (median,9 months; interquartile range, 7 to 42). Averageaseline MIS in the 809 HD patients was 5.1 �.6 (median, 4; minimum, 0; maximum, 23;nterquartile range, 2 to 7; Fig 1). Table 2 listsalues for relevant demographic and clinicalariables according to quartiles of the MIS. Pro-ortions of women, unmarried patients, or thoseith diabetes were higher in the fourth quartilef the MIS (ie, MIS � 8). Moreover, in additiono BMI and midarm muscle circumference, bi-eps (but not triceps) skinfold also showed aecreasing trend across increasing MIS quartiles.f laboratory measures, in addition to serum
lbumin level and TIBC, levels of serum transt-yretin, calcium, iron, and blood hemoglobinecreased across increasing MIS categories,hereas serum CRP, IL-6, white blood cell, and
erritin levels showed the opposite trend.
Figure 1. Distribution of the baseline Malnutrition-nflammation Score in 809 hemodialysis patients.

H
F
pP
D
B
H
B
cme
f easur
Rambod et al302
ealth-RelatedQoLTable 3 lists the average crude 36-Item Short
Table 2. Baseline Demographic, Clinical, and LaMalnutrition-Inflammation S
VariableQuartile 1
0, 1, 2 (n � 20
emographicAge (y) 48.5 � 13.Women (%) 38Marital status (% married) 56Race (% African American) 23Ethnicity (% Hispanic) 39Primary insurance (% Medicare) 44Diabetes mellitus (%) 46Modified Charlson comorbidity score 1.2 � 1.2Mortality in 5 y (%) 14
ody compositionBody mass index (kg/m2) 27.1 � 5.6Triceps skinfold (mm) 17.2 � 9.9Biceps skinfold (mm) 10.4 � 9.2Midarm muscle circumference (cm) 26.6 � 4.2Near-infrared measured body fat (%) 25.8 � 10.emodialysis treatment measuresDialysis vintage � 6 mo (%) 20Dialysis vintage (mo) 31.0 � 33.Dialysis dose (Kt/V single pool) 1.64 � 0.3nPNA (nPCR) (g/kg/d) 1.11 � 0.2Erythropoietin dose (1,000 U/wk) 13.4 � 12.Active vitamin D dose (�g/mo) 43.3 � 39.
iochemical measurementsSerum albumin (g/dL) 4.12 � 0.2Prealbumin (transthyretin) (mg/dL) 31.2 � 10.Creatinine (mg/dL) 10.7 � 3.3Total iron-binding capacity (mg/dL) 235 � 33Calcium (mg/dL) 9.4 � 0.7Iron (mg/dL) 73 � 24Iron saturation ratio 31.7 � 10.Phosphorus (mg/dL) 5.9 � 1.4Ferritin (ng/mL) 438 � 394Bicarbonate (mg/dL) 21.6 � 3.0Total homocysteine (�mol/L) 23.4 � 10.C-Reactive protein (mg/L) 4.6 � 5.6Interleukin 6 (pg/mL) 10.0 � 20.Tumor necrosis factor � (pg/mL) 8.7 � 13.Blood hemoglobin (g/dL) 12.3 � 0.8White blood cells (� 1,000 cell/�L) 7.1 � 2.0Lymphocyte (% total white blood cells) 25.0 � 7.6
Note: Values expressed as mean � SD or percent. Areatinine in mg/dL to �mol/L by multiplying by 88.4; calcig/dL to mmol/L by multiplying by 0.3229. Ferritin levelsxpressed in mEq/L and mmol/L are equivalent; white blooAbbreviations: nPNA, normalized protein nitrogen appea*P for dialysis dose (vintage), ferritin level, vitamin D dos
actor � level are based on the logarithmic values of these m
orm Health Survey (SF-36) scores for 688 HD M
atients who answered this QoL questionnaire.oorer self-reported Qol was noted with higher
ry Values in Total and According to Quartiles of809 Hemodialysis Patients
alnutrition-Inflammation Score
Quartile 2 Quartile 3 Quartile 4P for trend, 4 (n � 227) 5, 6, 7 (n � 219) �8 (n � 160)
3.7 � 15.4 54.6 � 14.5 58.8 � 14.1 �0.00149 50 53 0.00545 44 45 0.0734 34 29 0.254 50 49 0.0854 59 50 0.253 62 66 �0.001
1.7 � 1.5 2.2 � 1.6 2.6 � 1.8 �0.00124 31 51 �0.001
6.8 � 5.8 27.2 � 6.6 24.1 � 6.0 �0.0018.1 � 9.0 19.0 � 11.0 15.4 � 8.9 0.40.1 � 6.7 10.5 � 8.2 8.1 � 6.1 0.036.1 � 4.5 25.8 � 4.1 24.3 � 4.5 �0.0015.3 � 10.6 27.7 � 11.0 24.9 � 10.8 0.7
23 19 27 0.32.1 � 36.9 25.6 � 25.7 31.5 � 35.6 0.6.63 � 0.29 1.58 � 0.28 1.60 � 0.32 0.09.07 � 0.22 1.06 � 0.22 1.03 � 0.27 0.0022.2 � 8.7 15.3 � 12.0 18.7 � 16.9 �0.0012.2 � 44.1 41.7 � 3.5 39.6 � 37.6 0.6
.93 � 0.29 3.86 � 0.33 3.56 � 0.43 �0.0018.9 � 8.9 29.1 � 8.8 23.3 � 8.5 �0.0010.7 � 3.3 10.2 � 3.0 8.8 � 2.9 �0.001207 � 37 197 � 31 187 � 40 �0.0019.4 � 0.7 9.3 � 0.6 9.3 � 0.7 0.00568 � 26 63 � 23 59 � 31 �0.0012.8 � 10.9 31.8 � 10.6 31.0 � 12.1 0.45.6 � 1.3 5.9 � 1.5 5.7 � 1.7 0.5556 � 402 639 � 454 655 � 484 �0.0012.5 � 2.7 22.2 � 2.6 22.7 � 3.0 0.0033.9 � 9.1 25.1 � 13.5 21.2 � 9.5 0.34.7 � 4.8 6.7 � 7.7 7.4 � 9.2 �0.0011.7 � 19.7 19.5 � 61.3 31.6 � 80.5 �0.0018.9 � 11.7 7.9 � 7.9 8.3 � 10.1 0.52.2 � 0.9 12.1 � 0.9 11.7 � 1.3 �0.0017.1 � 1.9 7.3 � 1.9 7.4 � 2.4 0.093.1 � 8.2 21.4 � 7.0 20.7 � 8.1 �0.001
in g/dL may be converted to g/L by multiplying by 10;g/dL to mmol/L by multiplying by 0.2495; phosphorus in
sed in ng/mL and �g/L are equivalent; bicarbonate levelsount in 103/�L and 109/L is equivalent.nPCR, normalized protein catabolic rate.active protein level, interleukin 6 level, and tumor necrosises.
boratocore in
M
3) 3
6 5
2112
5 2
4 33 14 10 11 5
9 33 2
1
1 3
21 2
7 15
1
2
lbuminum in mexpresd cell crance;e, C-re
IS values. This trend was prominent in all scales
at
L
i(Pa
r(p��0wP0
S
S
S
quality-
S
Malnutrition-Inflammation Score and Outcomes in CKD 303
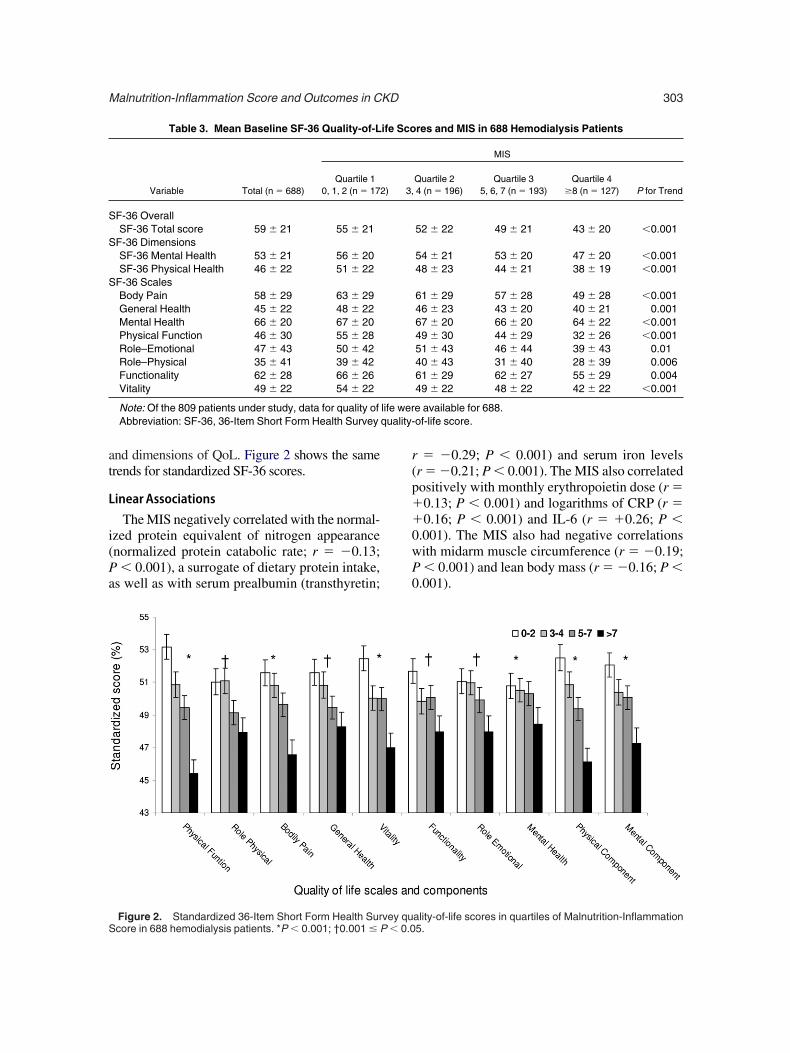
nd dimensions of QoL. Figure 2 shows the samerends for standardized SF-36 scores.
inearAssociations
The MIS negatively correlated with the normal-zed protein equivalent of nitrogen appearancenormalized protein catabolic rate; r � �0.13;� 0.001), a surrogate of dietary protein intake,
s well as with serum prealbumin (transthyretin;
Table 3. Mean Baseline SF-36 Quality-of-L
Variable Total (n � 688)Quartile 1
0, 1, 2 (n � 172
F-36 OverallSF-36 Total score 59 � 21 55 � 21
F-36 DimensionsSF-36 Mental Health 53 � 21 56 � 20SF-36 Physical Health 46 � 22 51 � 22
F-36 ScalesBody Pain 58 � 29 63 � 29General Health 45 � 22 48 � 22Mental Health 66 � 20 67 � 20Physical Function 46 � 30 55 � 28Role–Emotional 47 � 43 50 � 42Role–Physical 35 � 41 39 � 42Functionality 62 � 28 66 � 26Vitality 49 � 22 54 � 22
Note: Of the 809 patients under study, data for quality ofAbbreviation: SF-36, 36-Item Short Form Health Survey
Figure 2. Standardized 36-Item Short Form Health Survey qucore in 688 hemodialysis patients. *P � 0.001; †0.001 � P � 0.0
� �0.29; P � 0.001) and serum iron levelsr � �0.21; P � 0.001). The MIS also correlatedositively with monthly erythropoietin dose (r �0.13; P � 0.001) and logarithms of CRP (r �0.16; P � 0.001) and IL-6 (r � �0.26; P �
.001). The MIS also had negative correlationsith midarm muscle circumference (r � �0.19;� 0.001) and lean body mass (r � �0.16; P �
.001).
res and MIS in 688 Hemodialysis Patients
MIS
Quartile 2 Quartile 3 Quartile 4P for Trend4 (n � 196) 5, 6, 7 (n � 193) �8 (n � 127)
52 � 22 49 � 21 43 � 20 �0.001
54 � 21 53 � 20 47 � 20 �0.00148 � 23 44 � 21 38 � 19 �0.001
61 � 29 57 � 28 49 � 28 �0.00146 � 23 43 � 20 40 � 21 0.00167 � 20 66 � 20 64 � 22 �0.00149 � 30 44 � 29 32 � 26 �0.00151 � 43 46 � 44 39 � 43 0.0140 � 43 31 � 40 28 � 39 0.00661 � 29 62 � 27 55 � 29 0.00449 � 22 48 � 22 42 � 22 �0.001
e available for 688.of-life score.
ife Sco
) 3,
life wer
ality-of-life scores in quartiles of Malnutrition-Inflammation5.

M
(atbctpaiFqMmKwt
vlmtrd2
CM
vicoca
Jcarp tin leved erleuki
Rambod et al304
IS andSurvival
During the 5-year follow-up, 232 patients29%) died, 92 (11%) underwent transplantation,nd 147 (18%) left the cohort. Figure 3 showshe cubic splines illustrating the associationsetween baseline MIS and mortality in the 5-yearohort of 809 HD patients. A consistent trendoward increased death risk was observed inatients with higher MIS, even after multivariatedjustment for other markers of nutrition andnflammation, including CRP, IL-6, and TNF-�.igure 4 shows the HRs of mortality for MISuartiles. Patients in the fourth quartile of theIS had a significantly higher HR of death afterultivariate adjustments. As shown in Fig 5,aplan-Meier survival plots show incrementallyorsening survival across increasing MIS quar-
Figure 3. Mortality predictability of Malnutrition-Inflamanuary 2007): (A) unadjusted; (B) adjusted for case-mix vomplex syndrome (MICS) variables; and (D) adjusted forge, sex, race/ethnicity, diabetes mellitus, log vintage, priesidual urine. MICS variables include erythropoietin dose,rotein catabolic rate, bicarbonate level, calcium level, ferriose. Inflammatory variables include C-reactive protein, int
iles. Sensitivity analyses to examine such di- S
erse calibrations as MIS quintiles yielded simi-ar results (data not shown). Because splineodels (Fig 3) showed somewhat linear associa-
ions, we also examined linear Cox survivalegression, which showed that the fully adjustedeath HR for each 2-unit increase in MIS was.03 (95% CI, 1.76 to 2.33; P � 0.001).
omparing theMISWithOtherortality Predictors
We examined the prognostic value of differentersions and components of the MIS in predict-ng 5-year mortality by analyzing the AUC. Weompared the full version of the MIS with eachf its 10 components, a combination of the first 6omponents (after excluding comorbidity, BMI,lbumin level, and TIBC, to imitate the original
Score in 809 hemodialysis patients (October 2001 tos; (C) adjusted for case-mix and malnutrition-inflammation
ix, MICS, and inflammation. Case-mix variables includesurance, marital status, dialysis dose (Kt/V), and kidneyine level, hemoglobin level, phosphorus level, normalizedl, white blood cells, lymphocyte percentage, and vitamin Dn 6, and tumor necrosis factor � levels.
mationariablecase-m
mary increatin
GA), inflammatory markers, and prealbumin

(Attthn((lsAisi
Htatrn2
gstobvoavTrsQast
hvodasriPnacoalr
y
Mtitapiifarl7
Malnutrition-Inflammation Score and Outcomes in CKD 305
transthyretin) level. As listed in Table 4, theUC for the full version of the MIS was higher
han each of the 10 MIS components, includinghe commensurate serum albumin. The AUC forhe MIS in predicting death was significantlyigher than the combination of the first 6 compo-ents (P � 0.001) and serum prealbumin levelP � 0.009), somewhat higher than CRP levelP � 0.2), and essentially equal to serum IL-6evel (P � 0.9). Figure 6 shows the AUC compari-on among MIS, CRP level, and IL-6 level.dding MIS to age or other case-mix variables,
ncluding sex, race/ethnicity, diabetes, and dialy-is vintage, improved their mortality predictabil-ty significantly (P � 0.001).
DISCUSSION
In this prospective 5-year cohort study of 809D outpatients in Southern California, we found
hat MIS is associated with health-related QoLnd prospective 5-year mortality. The increasingrend of mortality associated with higher MIS isobust to controlling for case-mix and otherutritional and inflammatory measures. Each
Figure 4. Mortality predictability of quartiles of baselinealnutrition-Inflammation Score in 809 hemodialysis pa-
ients (October 2001 to January 2007). Case-mix variablesnclude age, sex, race/ethnicity, diabetes mellitus, log vin-age, primary insurance, marital status, dialysis dose (Kt/V),nd kidney residual urine. Malnutrition-inflammation com-lex syndrome variables include erythropoietin dose, creat-
nine level, hemoglobin level, phosphorus level, normal-zed protein catabolic rate, bicarbonate level, calcium level,erritin level, white blood cells, lymphocyte percentage,nd vitamin D dose. Inflammatory variables include C-eactive protein, interleukin 6, and tumor necrosis factor �evels. Quartile 1, 0 to 2; quartile 2, 3 and 4; quartile 3, 5 to; and quartile 4, 8 or higher.
-unit increase in MIS is associated with a 2-foldMt
reater death risk. The MIS could predict deathomewhat similar to IL-6 level, slightly betterhan CRP level, and significantly better than eachf its 10 components, the SGA, and serum preal-umin level. Poorer health-related QoL in di-erse scales and dimensions of the SF-36 wasbserved across the worsening MIS quartiles. Inddition, MIS correlated with other nutritionalariables, serum iron and hemoglobin levels.hese findings imply that MIS is a useful and
obust marker of nutritional and inflammatorytatus with clinically relevant associations withoL and survival and that its mortality predict-
bility is at least as good as, if not better than,ome elaborate tests of inflammation and nutri-ional status.
Individuals with CKD have an exceptionallyigh mortality rate and a high burden of cardio-ascular disease.36 Approximately 1 of every 5f the 400,000 HD patients in the United Statesie every year.37 Although half of these deathsre attributed to cardiovascular disease, mea-ures of PEW and not traditional cardiovascularisk factors are the strongest predictors of mortal-ty in HD patients.2,38 The confounding effect ofEW and inflammation, together known as mal-utrition-inflammation complex syndrome, onssociations between such traditional cardiovas-ular risk factors as lipid levels and clinicalutcome is so strong that these latter associationsppear paradoxically inversed.39,40 Therefore, re-iable markers of PEW with stronger and moreobust associations with morbidity and mortality
Figure 5. Kaplan-Meier proportion surviving after 5ears of observation according to quartiles of baseline
alnutrition-Inflammation Score in 809 hemodialysis pa-ients (October 2001 to January 2007).

ica
attdml7sadolaaaptn
af
taitikt(rparbmsosirpH
tr
M
MMLLLSAA
S
Rambod et al306
n HD patients are needed so that patients at riskan be identified better for focused nutritionalnd anti-inflammatory interventions.
The MIS was first introduced in 2001 as anttempt to make a comprehensive and quantita-ive, but easy-to-assess, tool to evaluate malnutri-ion and inflammation in dialysis patients.2,4 To-ay, the MIS is used to assess nutritional status inore than 100,000 DaVita dialysis patients at
east annually. The MIS is a constellation of 6 tooriginal SGA components, along with BMI,
erum albumin level, and TIBC, which are readilynd frequently (monthly) available in almost allialysis patients in the United States and manyther countries around the world. Hence, calcu-ating the MIS in a given patient does not needdditional testing and does not usually imposedditional cost, especially because all the vari-bles included in the MIS are usually available inatient records or can be directly obtained fromhe patients or through a brief nutritional exami-ation.In this study, we found that MIS was associ-
ted with QoL and mortality during a 5-year
Table 4. Comparing the AUC of the Full MIS Ver(6-component) Combination, Inflammatory M
Risk in 809 He
Variable
IS components1. Changes in dry weight2. Dietary intake3. Gastrointestinal symptoms4. Functional capacity5. Decreased fat storage6. Muscle wasting7. Comorbidity8. Body mass index9. Serum albumin
10. Total iron-binding capacityIS with 6 components (SGA)†IS with 10 components
og interleukin 6og C-reactive proteinog tumor necrosis factor �erum prealbuminge � sex � diabetes � race/ethnicity � vintage‡ge � sex � diabetes � race/ethnicity � vintage � MIS‡
Abbreviations: AUC, area under the receiver operating cubjective Global Assessment.*P for comparison of AUC of each variable with MIS (con†Comorbidity, body mass index, serum albumin level, an‡P � 0.001 comparing the AUC of the last 2 rows.
ollow-up period. These associations were robust q
o multivariate adjustment, including case-mixnd nutritional and inflammatory variables notncluded in the MIS. The cubic spline figure forhe fully adjusted Cox proportional model, whichncluded adjustment for proinflammatory cyto-ines, showed that death risk increased substan-ially in patients with an MIS higher than 4 to 5Fig 3D). This finding is in accordance with aecent report by Ho et al,6 who found that HDatients with an MIS score higher than 4 to 5 hadsignificant risk of 1-year mortality. Several
ecent studies have found strong associationsetween proinflammatory cytokine levels andortality in patients with CKD.18-21 In our present
tudy, we found that the mortality predictabilityf MIS is equal to that of serum IL-6 level andomewhat higher than for CRP level. This find-ng implies that IL-6 and CRP levels can beeplaced easily by the MIS in daily clinicalractice to determine the inflammation state ofD patients and risk stratify these individuals.A clinically relevant finding was the associa-
ion of the MIS and SF-36–measured health-elated QoL. HD patients within the highest MIS
ith the 10 Components of the MIS and the SGA, and Prealbumin in Predicting 5-Year Deathlysis Patients
AUC 95% Confidence Interval P*
0.57 0.54–0.61 �0.0010.55 0.52–0.58 �0.0010.56 0.53–0.60 �0.0010.63 0.59–0.66 0.010.56 0.53–0.59 �0.0010.58 0.54–0.61 �0.0010.62 0.58–0.66 0.020.53 0.50–0.57 �0.0010.62 0.58–0.65 0.0040.57 0.53–0.61 �0.0010.63 0.58–0.67 �0.0010.67 0.63–0.71 Reference0.67 0.63–0.71 0.90.63 0.59–0.67 0.10.53 0.48–0.57 �0.0010.59 0.55–0.62 0.0090.67 0.63–0.70 �0.0010.71 0.68–0.75 �0.001
eristic curve; MIS, Malnutrition-Inflammation Score; SGA,
10 components).iron-binding capacity are excluded to imitate the SGA.
sion Warkersmodia
haract
tainingd total
uartiles had the worst QoL scores across most

SisstcdIowlSoh
moatcsamepptw
airtt
sctsbolsosarosbcemttsdappiFsm
lcod5tpnmoMott
cmk(t
Malnutrition-Inflammation Score and Outcomes in CKD 307
F-36 scales and dimensions. This finding ismportant because QoL per se is a predictor ofurvival in the CKD patient population.41,42 In atudy of 1,000 patients at 3 dialysis facilities inhe United States, lower scores on the physicalomponent of QoL were associated with greatereath risk and hospitalization in the next 2 years.43
n addition to physical component and scales,ur study showed that the MIS was associatedith mental and psychological aspects of QoL. A
arge study of 5,256 HD patients from the Unitedtates and Europe showed that the psychologicalr mental components of QoL predict death andospitalization in HD patients.44
Our study also showed that the MIS capturesost of the main criteria suggested for diagnosis
f PEW.2 Whereas serum albumin level, BMI,nd muscle wasting are inherent components ofhe MIS, our study showed that the MIS alsoorrelates with other markers of PEW, includingerum prealbumin (transthyretin) level, fat weight,nd NIR-measured fat percentage, midarmuscle circumference, and normalized protein
quivalent of nitrogen appearance (normalizedrotein catabolic rate) as a surrogate of dietaryrotein intake. Considering the associations be-ween the MIS and inflammatory markers, as
Figure 6. Receiver operating characteristic (ROC)urves of probabilities obtained from hazard regressionodels including C-reactive protein (CRP) level, interleu-
in 6 (IL-6) level, and Malnutrition-Inflammation ScoreMIS) as independent variables and all-cause mortality ashe dependent (reference) variable.
ell as diagnostic markers of PEW, and also the t
ssociations of the MIS with QoL and mortality,t could be speculated that the MIS has wideange of clinical utility, from assessment of nutri-ional status and inflammation to risk stratifica-ion of patients with CKD.
A potential limitation of the present study iselection bias during enrollment. However, be-ause mortality in our cohort was less than that inhe base population,22 it might be argued thatelection bias with such a direction would lead toias toward the null; therefore, without this bias,ur results may have been even stronger. Otherimitations include lack of information for dialy-is access, dialysis membrane, and other knownr unknown confounders. The strengths of ourtudy include the sample size, which was moder-tely large; the comprehensive clinical and labo-atory evaluations with concomitant assessmentf quality of life and body composition mea-ures; and detailed evaluation of comorbid statesy study physicians at baseline. Unlike previousohorts that have been studied, ours has beenxtensively characterized for markers of inflam-ation and nutritional status, including direct
otal body fat measurements. The availability ofhese measures allowed us to show that MIS istrongly associated with mortality risk indepen-ent of influences from other known nutritionalnd inflammatory markers in this group of HDatients. Another strength of this cohort is thatarticipants were selected randomly without hav-ng prior knowledge of their inflammation status.inally, the same blood specimens used to mea-ure markers of PEW were used for cytokineeasurements.In conclusion, we found that MIS, as a constel-
ation of readily available clinical and paraclini-al variables, correlated with several surrogatesf body composition, health-related QoL, andeath risk in 809 HD patients followed for up toyears. The full version of the MIS was superior
o its 10 components in predicting survival. Com-arisons between the MIS and other markers ofutrition and inflammation indicate that the MISay be used as a marker of inflammation in lieu
f IL-6 or CRP level. Examining the utility of theIS and its associations with clinically relevant
utcomes may lead to more effective strategieso identify patients at risk of PEW and inflamma-ion and to the development of focused nutri-
ional and anti-inflammatory interventions to im-
pamtw
HriiS
DoarcGt
tK
peI
tk3
Mmt
Hwha
msN
Ha1
aiN
M
aP
et2
Ntm7
Hi2
Htp
ms(
nd
se1
twN
is
kmN
tc3
OmD
aSt
ms
gw
Rambod et al308
rove nutritional status and hence survival inlmost half a million dialysis patients and theore than 20 million individuals with CKD in
he United States and many more throughout theorld.
ACKNOWLEDGEMENTSThe authors thank Stephanie Griffith and Dr Victor Goh at
arbor-UCLA General Clinical Research Center Core Labo-atories for the management of blood samples and measur-ng inflammatory markers and the hard-working collaborat-ng dietitians in 10 DaVita dialysis facilities in Los Angelesouth Bay area and DaVita teammates in these facilities.Support: This study was supported by Grant K21-
K61162 to Dr Kalantar-Zadeh from the National Institutesf Health (NIH), National Institute of Diabetes, Digestive,nd Kidney Disease. Additional sources of funding includeesearch grants from Watson Pharmaceuticals, DaVita Clini-al Research, Harold Simmons (for Dr Kalantar-Zadeh), andeneral Clinical Research Center Grant M01-RR00425 from
he National Centers for Research Resources, NIH.Financial Disclosure: None.
REFERENCES1. National Kidney Foundation: K/DOQI Clinical Prac-
ice Guidelines for Nutrition in Chronic Renal Failure. Am Jidney Dis 35:S1-S140, 2000 (suppl 2)2. Fouque D, Kalantar-Zadeh K, Kopple J, et al: A
roposed nomenclature and diagnostic criteria for protein-nergy wasting in acute and chronic kidney disease. Kidneynt 73:391-398, 2008
3. Kalantar-Zadeh K: Recent advances in understandinghe malnutrition-inflammation-cachexia syndrome in chronicidney disease patients: What is next? Semin Dial 18:365-69, 20054. Kalantar-Zadeh K, Kopple JD, Block G, HumphreysH: A malnutrition-inflammation score is correlated withorbidity and mortality in maintenance hemodialysis pa-
ients. Am J Kidney Dis 38:1251-1263, 20015. Elsurer R, Afsar B, Sezer S, Arat Z, Ozdemir FN,
aberal M: Malnutrition inflammation score is associatedith coronary artery disease in hepatitis C virus-infectedemodialysis patients. Eur J Clin Nutr 2007 Aug 1 [Epubhead of print]
6. Ho LC, Wang HH, Peng YS, et al: Clinical utility ofalnutrition-inflammation score in maintenance hemodialy-
is patients: Focus on identifying the best cut-off point. Am Jephrol 28:840-846, 20087. Bilgic A, Akgul A, Sezer S, Arat Z, Ozdemir FN,
aberal M: Nutritional status and depression, sleep disorder,nd quality of life in hemodialysis patients. J Ren Nutr7:381-388, 20078. Micozkadioglu H, Micozkadioglu I, Zumrutdal A, et
l: Relationship between depressive affect and malnutrition-nflammation complex syndrome in haemodialysis patients.ephrology (Carlton) 11:502-505, 20069. Sezer S, Elsurer R, Ulubay G, Ozdemir FN, Haberal
: Factors associated with peak oxygen uptake in hemodi- 7lysis patients awaiting renal transplantation. Transplantroc 39:879-882, 200710. Akgul A, Bilgic A, Sezer S, et al: Effect of protein-
nergy malnutrition on erythropoietin requirement in main-enance hemodialysis patients. Hemodial Int 11:198-203,00711. Kalantar-Zadeh K, McAllister CJ, Lehn RS, Lee GH,
issenson AR, Kopple JD: Effect of malnutrition-inflamma-ion complex syndrome on EPO hyporesponsiveness inaintenance hemodialysis patients. Am J Kidney Dis 42:761-
73, 200312. Afsar B, Sezer S, Ozdemir FN, Celik H, Elsurer R,
aberal M: Malnutrition-inflammation score is a useful tooln peritoneal dialysis patients. Perit Dial Int 26:705-711,00613. Sezer S, Elsurer R, Afsar B, Arat Z, Ozdemir NF,
aberal M: Peritoneal small solute transport rate is related tohe malnutrition inflammation score in peritoneal dialysisatients. Nephron Clin Pract 107:c156-c162, 200714. Chan JY, Che KI, Lam KM, et al: Comprehensivealnutrition inflammation score as a marker of nutritional
tatus in Chinese peritoneal dialysis patients. NephrologyCarlton) 12:130-134, 2007
15. Yamada K, Furuya R, Takita T, et al: Simplifiedutritional screening tools for patients on maintenance hemo-ialysis. Am J Clin Nutr 87:106-113, 200816. Yang SC, Chiang CK, Hsu SP, Hung KY: Relation-
hip between interdialytic weight gain and nutritional mark-rs in younger and older hemodialysis patients. J Ren Nutr8:210-222, 200817. Rambod M, Kovesdy CP, Kalantar-Zadeh K: Malnu-
rition-Inflammation Score for risk stratification of patientsith CKD: Is it the promised gold standard? Nat Clin Practephrol 4:354-355, 200818. Rao M, Guo D, Perianayagam MC, et al: Plasma
nterleukin-6 predicts cardiovascular mortality in hemodialy-is patients. Am J Kidney Dis 45:324-333, 2005
19. Panichi V, Maggiore U, Taccola D, et al: Interleu-in-6 is a stronger predictor of total and cardiovascularortality than C-reactive protein in haemodialysis patients.ephrol Dial Transplant 19:1154-1160, 200420. Badiou S, Cristol JP, Jaussent I, et al: Fine-tuning of
he prediction of mortality in hemodialysis patients by use ofytokine proteomic determination. Clin J Am Soc Nephrol:423-430, 200821. Pecoits-Filho R, Barany P, Lindholm B, Heimburger
, Stenvinkel P: Interleukin-6 is an independent predictor ofortality in patients starting dialysis treatment. Nephrolial Transplant 17:1684-1688, 200222. Colman S, Bross R, Benner D, et al: The Nutritional
nd Inflammatory Evaluation in Dialysis patients (NIED)tudy: Overview of the NIED Study and the role of dieti-
ians. J Ren Nutr 15:231-243, 200523. Kalantar-Zadeh K, Brennan ML, Hazen SL: Serumyeloperoxidase and mortality in maintenance hemodialy-
is patients. Am J Kidney Dis 48:59-68, 200624. Kalantar-Zadeh K, Kopple JD, Kamranpour N, Fo-
elman AM, Navab M: HDL-inflammatory index correlatesith poor outcome in hemodialysis patients. Kidney Int
2:1149-1156, 2007
tlC
pd2
Aa2
AK
m9
ip
Ctl
tC
Tn
w
c
mA
Cc1
2tIA
ei
Ssi
pd
oN
ri(
tt3
ps
Malnutrition-Inflammation Score and Outcomes in CKD 309
25. Kalantar-Zadeh K, Kuwae N, Wu DY, et al: Associa-ions of body fat and its changes over time with quality ofife and prospective mortality in hemodialysis patients. Am Jlin Nutr 83:202-210, 200626. Mehrotra R, Kermah D, Fried L, et al: Chronic
eritoneal dialysis in the United States: Declining utilizationespite improving outcomes. J Am Soc Nephrol 18:2781-788, 200727. Beddhu S, Bruns FJ, Saul M, Seddon P, Zeidel ML:simple comorbidity scale predicts clinical outcomes
nd costs in dialysis patients. Am J Med 108:609-613,00028. Nelson EE, Hong CD, Pesce AL, Singh S, Pollak VE:
nthropometric norms for the dialysis population. Am Jidney Dis 16:32-37, 199029. Williams AJ, McArley A: Body composition, treat-ent time, and outcome in hemodialysis patients. J Ren Nutr
:157-162, 199930. Kalantar-Zadeh K, Dunne E, Nixon K, et al: Near
nfra-red interactance for nutritional assessment of dialysisatients. Nephrol Dial Transplant 14:169-175, 199931. Ridker PM, Rifai N, Rose L, Buring JE, Cook NR:
omparison of C-reactive protein and low-density lipopro-ein cholesterol levels in the prediction of first cardiovascu-ar events. N Engl J Med 347:1557-1565, 2002
32. Erbagci AB, Tarakcioglu M, Aksoy M, et al: Diagnos-ic value of CRP and Lp(a) in coronary heart disease. Actaardiol 57:197-204, 200233. Beutler B, Cerami A: The biology of cachectin/
NF—A primary mediator of host response. Ann Rev Immu-ol 7:625-655, 198934. Durrleman S, Simon R: Flexible regression models
ith cubic splines. Stat Med 8:551-561, 198935. Pepe MS, Janes H, Longton G, Leisenring W, New-
omb P: Limitations of the odds ratio in gauging the perfor- 6
ance of a diagnostic, prognostic, or screening marker.m J Epidemiol 159:882-890, 200436. Go AS, Chertow GM, Fan D, McCulloch CE, Hsu
Y: Chronic kidney disease and the risks of death, cardiovas-ular events, and hospitalization. N Engl J Med 351:1296-305, 200437. US Renal Data System: Excerpts from the USRDS
005 Annual Data Report: Atlas of end-stage renal disease inhe United States, National Institutes of Health, Nationalnstitute of Diabetes and Digestive and Kidney Diseases.m J Kidney Dis 47:S1-S286, 2006 (suppl 1)38. Kalantar-Zadeh K, Balakrishnan VS: The kidney dis-
ase wasting: Inflammation, oxidative stress, and diet-genenteraction. Hemodial Int 10:315-325, 2006
39. Kilpatrick RD, McAllister CJ, Kovesdy CP, DeroseF, Kopple JD, Kalantar-Zadeh K: Association betweenerum lipids and survival in hemodialysis patients andmpact of race. J Am Soc Nephrol 18:293-303, 2007
40. Kalantar-Zadeh K, Abbott KC, Salahudeen AK, Kil-atrick RD, Horwich TB: Survival advantages of obesity inialysis patients. Am J Clin Nutr 81:543-554, 200541. Kalantar-Zadeh K, Unruh M: Health related quality
f life in patients with chronic kidney disease. Int Urolephrol 37:367-378, 200542. Mapes DL, Lopes AA, Satayathum S, et al: Health-
elated quality of life as a predictor of mortality and hospital-zation: The Dialysis Outcomes and Practice Patterns StudyDOPPS). Kidney Int 64:339-349, 2003
43. DeOreo PB: Hemodialysis patient-assessed func-ional health status predicts continued survival, hospitaliza-ion, and dialysis-attendance compliance. Am J Kidney Dis0:204-212, 199744. Lopes AA, Bragg J, Young E, et al: Depression as a
redictor of mortality and hospitalization among hemodialy-is patients in the United States and Europe. Kidney Int
2:199-207, 2002Copyright © 2022 FDOKUMEN