Prevalence and Management of Anemia in Renal Transplant Recipients: A European Survey
11
Prevalence and Management of Anemia in Renal Transplant Recipients: A European Survey Yves Vanrenterghem a , Claudio Ponticelli b , Jose ´ Maria Morales c , Daniel Abramowicz d , Keshwar Baboolal e , Bjo ¨ rn Eklund f , Volker Kliem g , Christophe Legendre h , Antonio Luis Morais Sarmento i and Flavio Vincenti j a Department of Nephrology, University Hospital Gasthuisberg, Leuven, Belgium b Divisione di Nefrologia e Dialisi, IRCCS Ospedale Maggiore Policlinico, Milan, Italy c Servicio de Nefrologı ´a, Hospital Doce de Octubre, Madrid, Spain d Department of Nephrology, Hospital Erasme, Brussels, Belgium e Nephrology and Transplant Directorate, University Hospital of Wales, Cardiff, UK f HUCH, Surgical Hospital, Helsinki, Finland g Innere Medizin/Nephrologie, Nephrologisches Zentrum Niedersachsen, Hannoversch Mu ¨ nden, Germany h Service de Ne ´ phrologie, Ho ˆpital Saint-Louis, Paris, France i Servico de Nefrologia, Hospital de Santo Antonio, Porto, Portugal j Kidney Transplant Service, University of California-San Francisco, San Francisco, CA *Corresponding author: Yves Vanrenterghem, [email protected] The TRansplant European Survey on Anemia Manage- ment (TRESAM) documented the prevalence and management of anemia in kidney transplant recipi- ents. Data from 72 transplant centers in 16 countries were screened, involving 4263 patients who had received transplants 6 months, 1, 3 or 5 years earlier. The mean age of transplant recipients was 45.5 years at transplantation. The most common etiology was chronic glomerulonephritis. The most common comorbidities were coronary artery disease, hepatitis B/C, and type 2 diabetes. The mean hemoglobin levels before transplantation were significantly higher in the more recently transplanted recipients. At enrollment, 38.6% of patients were found to be anemic. Of the 8.5% of patients who were considered severely anemic, only 17.8% were treated with epoetin. There was a strong association between hemoglobin and graft function; of the 904 patients with serum creati- nine > 2 mg/dL, 60.1% were anemic, vs. 29.0% of those with serum creatinine £ 2 mg/dL (p < 0.01). Therapy with angiotensin-converting enzyme (ACE) inhibitors, angiotensin II receptor antagonists, mycophenolate mofetil (MMF) or azathioprine was also associated with a higher likelihood of anemia. The prevalence of anemia in the transplant recipients was remarkably high and appeared to be associated with impaired renal function and with ACE inhibitors and angio- tensin II receptor antagonist use. Further studies should be carried out to interpret whether appropriate management of anemia after kidney transplantation may improve long-term outcome. Key words: Anemia, epoetin, hemoglobin, immuno- suppressive treatment, kidney transplantation, chronic kidney disease Received 24 September 2002, revised 14 January 2003 and accepted for publication 12 February 2003 Introduction Renal transplantation is considered the treatment modality of choice for patients with chronic renal failure. In recent years, advances in transplantation management, especially related to immunosuppressive therapy, have increased the 1-year patient survival rate to greater than 95% and the 1-year graft survival rate to greater than 90% (1). Patients with a well-functioning renal graft will also enjoy a signifi- cantly better quality of life compared with patients on long-term hemodialysis or peritoneal dialysis (2). Quality of life of renal transplant recipients can be affected by many factors. Apart from the comorbidities that are present before transplantation, patients are likely to suffer from both the short-term and long-term side effects of chronic immunosuppressive therapy. In addition, in the majority of transplant recipients, the renal graft does not function optimally, with the result that the excretory and endocrine functions are not restored completely. Although hemoglobin (Hb) levels will generally increase after trans- plantation, anemia can persist in patients with a graft that functions suboptimally (3). Anemia in kidney transplant recipients may also negatively affect long-term outcome. Anemia in patients who undergo dialysis has been linked to the development of left ventricular hypertrophy, and is believed to be a major contributor to cardiovascular risk (4,5). Anemia may also be a cardiovascular risk factor in post-transplant recipients, which is particularly worrying because cardiovascular events are known to be the main cause of death in trans- plant recipients (6). At present, there is little insight into the prevalence and management of anemia in the renal transplant population. The main goal of the Transplant European Survey on American Journal of Transplantation 2003; 3: 835–845 Copyright # Blackwell Munksgaard 2003 Blackwell Munksgaard ISSN 1600-6135 835
-
Upload
independent -
Category
Documents
-
view
3 -
download
0
Transcript of Prevalence and Management of Anemia in Renal Transplant Recipients: A European Survey

Prevalence and Management of Anemia in RenalTransplant Recipients: A European Survey
Yves Vanrenterghema, Claudio Ponticellib, JoseMaria Moralesc, Daniel Abramowiczd, KeshwarBaboolale, Bjorn Eklundf, Volker Kliemg,Christophe Legendreh, Antonio Luis MoraisSarmentoi and Flavio Vincentij
aDepartment of Nephrology, University HospitalGasthuisberg, Leuven, BelgiumbDivisione di Nefrologia e Dialisi, IRCCS OspedaleMaggiore Policlinico, Milan, ItalycServicio de Nefrologıa, Hospital Doce de Octubre, Madrid,SpaindDepartment of Nephrology, Hospital Erasme, Brussels,BelgiumeNephrology and Transplant Directorate, UniversityHospital of Wales, Cardiff, UKfHUCH, Surgical Hospital, Helsinki, FinlandgInnere Medizin/Nephrologie, Nephrologisches ZentrumNiedersachsen, Hannoversch Munden, GermanyhService de Nephrologie, Hopital Saint-Louis, Paris, FranceiServico de Nefrologia, Hospital de Santo Antonio, Porto,PortugaljKidney Transplant Service, University of California-SanFrancisco, San Francisco, CA*Corresponding author: Yves Vanrenterghem,[email protected]
The TRansplant European Survey on Anemia Manage-ment (TRESAM) documented the prevalence andmanagement of anemia in kidney transplant recipi-ents. Data from 72 transplant centers in 16 countrieswere screened, involving 4263 patients who hadreceived transplants 6 months, 1, 3 or 5 years earlier.The mean age of transplant recipients was 45.5 yearsat transplantation. The most common etiologywas chronic glomerulonephritis. The most commoncomorbidities were coronary artery disease, hepatitisB/C, and type 2 diabetes. The mean hemoglobin levelsbefore transplantation were significantly higher in themore recently transplanted recipients. At enrollment,38.6% of patients were found to be anemic. Of the8.5% of patients who were considered severelyanemic, only 17.8% were treated with epoetin. Therewas a strong association between hemoglobin andgraft function; of the 904 patients with serum creati-nine >2 mg/dL, 60.1% were anemic, vs. 29.0% of thosewith serum creatinine £ 2 mg/dL (p <0.01). Therapywith angiotensin-converting enzyme (ACE) inhibitors,angiotensin II receptor antagonists, mycophenolatemofetil (MMF) or azathioprine was also associatedwith a higher likelihood of anemia. The prevalence ofanemia in the transplant recipients was remarkablyhigh and appeared to be associated with impairedrenal function and with ACE inhibitors and angio-
tensin II receptor antagonist use. Further studiesshould be carried out to interpret whether appropriatemanagement of anemia after kidney transplantationmay improve long-term outcome.
Key words: Anemia, epoetin, hemoglobin, immuno-suppressive treatment, kidney transplantation,chronic kidney disease
Received 24 September 2002, revised 14 January 2003and accepted for publication 12 February 2003
Introduction
Renal transplantation is considered the treatment modality
of choice for patients with chronic renal failure. In recent
years, advances in transplantation management, especially
related to immunosuppressive therapy, have increased the
1-year patient survival rate to greater than 95% and the
1-year graft survival rate to greater than 90% (1). Patients
with a well-functioning renal graft will also enjoy a signifi-
cantly better quality of life compared with patients on
long-term hemodialysis or peritoneal dialysis (2).
Quality of life of renal transplant recipients can be affected
by many factors. Apart from the comorbidities that are
present before transplantation, patients are likely to suffer
from both the short-term and long-term side effects of
chronic immunosuppressive therapy. In addition, in the
majority of transplant recipients, the renal graft does not
function optimally, with the result that the excretory and
endocrine functions are not restored completely. Although
hemoglobin (Hb) levels will generally increase after trans-
plantation, anemia can persist in patients with a graft that
functions suboptimally (3).
Anemia in kidney transplant recipients may also negatively
affect long-term outcome. Anemia in patients who
undergo dialysis has been linked to the development of
left ventricular hypertrophy, and is believed to be a major
contributor to cardiovascular risk (4,5). Anemia may also
be a cardiovascular risk factor in post-transplant recipients,
which is particularly worrying because cardiovascular
events are known to be the main cause of death in trans-
plant recipients (6).
At present, there is little insight into the prevalence and
management of anemia in the renal transplant population.
The main goal of the Transplant European Survey on
American Journal of Transplantation 2003; 3: 835–845 Copyright # Blackwell Munksgaard 2003Blackwell Munksgaard
ISSN 1600-6135
835

Anemia Management (TRESAM) was to create a large
European database to document the prevalence and risk
factors of anemia, as well as current treatment practices
in transplant centers across Europe.
Patients and Methods
Survey design and patient population
The survey used a descriptive correlational design. Inclusion criteria for the
participating transplant centers (72 centers in 16 European countries)
included a minimum of 5 years’ experience performing renal transplants
and a minimum activity of 40 kidney transplants per year.
During the survey enrollment period from 15 November 2000 through 31
May 2001, participating centers screened all kidney transplant recipients
who received a transplant from 6 months up to 5 years ago. Exclusion
criteria were multiple organ transplantation, pregnancy at the time of
enrollment, and age less than 10 years at the time of enrollment. Patients
were included into one of four cohorts, depending on when their transplant
had been performed: 6 months (± 1 month), 1 year (± 1 month), 3 years
(± 3 months) or 5 years (± 3 months) previous. Centers were instructed,
once they had started to include the first patient from each cohort into
the survey, to include all consecutive patients who received transplants in
that corresponding period and who met the inclusion criteria. Centers were
also asked to include in each of the four cohorts an equal number of
patients. For patients no longer followed in the transplant center, the
data were obtained through the physician in charge of the patients (mostly
the referring nephrologist).
Measurements
Demographic and historical data collected at enrollment included age,
gender, etiology of chronic renal failure, and comorbidities. Transplant-
related data included: number of previous transplants, age of donor of
current transplant, donor type (living or cadaveric), number of treated
acute rejection episodes since the most recent transplant, and the most
recent Hb measurement before transplantation. Current clinical and labora-
tory data for the patients in the four cohorts included body weight, blood
pressure, current smoking status, performance status (WHO score with 0
being the most optimal and 4 being the least optimal performance), Hb,
serum ferritin, serum albumin, percent transferrin saturation, parathyroid
hormone (PTH), serum creatinine, 24-h proteinuria, measured (24-h urine)
creatinine clearance, calculated creatinine clearance, homocysteine,
triglycerides, HDL cholesterol, LDL cholesterol and total cholesterol. Data
on epoetin levels were not collected. The following recent clinical events
(occurring within 3 months of the enrollment date) were included: infection
treated with antibiotics, cerebrovascular accident (CVA), chronic blood loss,
severe acute blood loss, cardiac failure, myocardial infarction, peripheral
vascular disease (PVD), neoplasia, percutaneous transluminal coronary
angioplasty (PTCA), and coronary artery bypass grafting (CABG).
Patients’ use of maintenance immunosuppressives [steroids, cyclosporine,
tacrolimus, mycophenolate mofetil (MMF), azathioprine or sirolimus],
antihypertensives [angiotensin-converting enzyme (ACE) inhibitors, vasodi-
lators, beta-blockers, angiotensin II receptor antagonists, calcium channel
blockers, alpha-1 antagonists, diuretics and clonidine] or other medications
(antibiotics, aspirin, oral anticoagulants, insulin, oral antihyperglycemics, H2
blockers, statins, antiepileptics, and theophylline) was assessed. Only use
of the above-mentioned drugs (yes or no) was assessed, not the daily
dose. Anemia management therapies in the month before enrollment
[administration of recombinant human erythropoietin (rHuEPO/epoetin),
iron supplementation and blood transfusions] were also assessed.
Following the Clinical Practice Guidelines for Outpatient Surveillance
of Renal Transplant Recipients, anemia was defined as Hb levels of
�13 g/dL for males and �12 g/dL for females. (7). Anemic patients were
further subdivided into three subcategories based on the severity of the
anemia:
I. Mild: males: Hb>12 g/dL and Hb� 13 g/dL, females: Hb>11 g/dL and
Hb�12 g/dL
II. Moderate: males: Hb> 11 g/dL and Hb¼12 g/dL, females: Hb> 10 g/dL
and Hb¼11 g/dL
III. Severe: males: Hb�11 g/dL, females: Hb�10 g/dL
Creatinine clearance was calculated using the Cockcroft-Gault formula (8).
Measured creatinine clearance was determined from a 24-h urine
collection.
The impact of risk factors other than kidney function on anemia was
assessed in a subgroup that excluded those patients in whom anemia
was already associated with poor kidney function. These risk analyses
were performed on the data from the 3359 patients who had serum
creatinine levels up to 2 mg/dL.
Statistical analyses
Data assessment and descriptive statistics were performed on all study
variables. The Chi-square test was used to test the difference in propor-
tions in two or more groups. Relevant statistical tests were used to
evaluate differences between cohorts and other stratifications. After
exploring distribution and statistical assumptions, parametric and non-
parametric tests were used where appropriate.
Differences between group means for interval level variables that were
normally distributed were tested using either the t-test (two samples) or
analysis of variance (ANOVA; more than two samples). As ANOVA shows an
overall difference, further post-hoc ANOVA Tukey tests were performed to
determine between which groups differences existed. For variables with
non-normal distributions, the Mann–Whitney U-test (two samples) or the
Kruskal–Wallis test (more than two samples) were used. Again, the
(ranked) post-hoc Tukey test was performed to determine specifically
between which groups differences existed.
To determine whether a relationship existed between two interval/ratio
level variables, a Pearson’s correlation was utilized if the distribution was
normal. Associations between non-normally distributed variables were
tested using Kendall’s tau.
Finally, an associative logistic regression was used to explore the relation-
ship between anemia and the following variables: age of recipient
>60 years, age of donor > 60 years (yes/no), serum creatinine > 2 mg/dL
(yes/no), use of ACE inhibitors or angiotensin II receptor antagonists
(yes/no), use of azathioprine and/or MMF (yes/no), and polycystic kidney
disease (yes/no).
For all statistical tests, a probability value of alpha 0.05 or less was considered
significant. All analyses were conducted on the total sample and on the four
transplant cohorts (6 months, 1, 3 and 5 years). Reported percentages are
computed based upon patients with valid data on a test-by-test basis. All stat-
istical analyses were performed using SPSS 9.01 (SPSS Inc., Chicago, IL, USA).
Vanrenterghem et al.
836 American Journal of Transplantation 2003; 3: 835–845

Results
Demographics and baseline characteristicsThe total sample consisted of 4263 patients from the fol-
lowing countries: Austria (2.3%), Belgium (8.6%), Bulgaria
(1.9%), Czech Republic (3.0%), Finland (1.7%), Germany
(19.8%), Hungary (6.8%), Italy (5.3%), the Netherlands
(1.6%), Norway (1.5%), Poland (3.3%), Portugal (3.3%),
Spain (26.3%), Sweden (2.5%), Switzerland (3.0%), and
the UK (9.1%). The patient characteristics in Table 1 indi-
cate that the survey was performed in a representative
European transplant population.
The 4263 patients in the total sample were more or less
evenly distributed over the four cohorts: 1003, 960, 1254
and 1046 patients, respectively, were enrolled in the trans-
plant cohorts of 6 months, 1, 3 and 5 years after transplan-
tation. There were 2641 male patients (62.0%) and 1622
female patients (38.0%), and these proportions were simi-
lar in the four cohorts. Patients who received a transplant
more recently had a higher mean age at transplantation
than patients transplanted earlier (Table 1).
A total of 3823 patients (89.7%) received a kidney from a
cadaver donor and 440 patients (10.3%) received a kidney
from a living donor, and these proportions were similar in the
different cohorts. The mean age of all donors was
43.6 ± 15.8 years; the mean age of living donors
(49.0 ± 11.5 years) being significantly higher (p< 0.01) than
the mean age of cadaveric donors (42.9 ± 16.1 years)
(Table 1). In total, 1598 donors were aged > 50 years [1394
(87.2%) cadaveric donors, 204 (12.8%) living], and the propor-
tions cadaveric and living donors> 50 years were similar in the
different cohorts. The median age was 50 and 45 years,
respectively, for the living and cadaveric donors.
Interestingly, the mean age of the donors significantly
increased in the more recent years (40.6 ± 15.9 in the
5-year cohort vs. 43.3 ± 16.0 and 45.0 ± 16.8 in the 6-month
and 1-year cohorts, respectively). Also, a greater propor-
tion of more recent transplants was a second transplant
(13.1% in the 6-month cohort vs. 10.1% in the 5-year
cohort). The incidence of treated acute rejections was
lower in the more recent years, when new immunosup-
pressive drugs became available. Mean body weight
was lower in the 6-month cohort than in the other
cohorts (Table 1).
The most prevalent underlying kidney disease was chronic
glomerulonephritis (ranging from 29.8 to 37.0% across the
four cohorts). In descending order, the next most preva-
lent underlying diseases were polycystic kidney disease
(10.9–14.0% across the cohorts), tubular interstitial
nephropathy (7.2–11.0%), diabetic nephropathy (6.5–7.5%),
renal vascular disease (3.7–5.5%), systemic diseases
(2.8–4.4%), and other hereditary diseases (2.2–3.9%).
Other underlying kidney diseases accounted for 9.8–14.1%
across the four cohorts, and disease of undefined etiology
was present in 12.3–14.6% of the patients.
Across the four cohorts, the most frequently occurring comor-
bidities were coronary artery disease (13.0–16.1%), hepatitis
B carrier or presence of anti HCV antibodies (9.3–10.8%), and
type 2 diabetes (8.7–10.1%). The prevalences of post-
transplant polycythemia in the 6-month, 1-year, 3-year and
5-year cohorts were 3.5%, 4.7%, 8.7% and 8.8%, respec-
tively, (6.6% overall). In descending order, other comorbidities
were chronic cardiac arrhythmia (4.6–6.5%), type 1 diabetes
(4.4–5.7%), chronic bacterial infection (3; 1–5.0%), malignant
neoplasia (excluding nonmelanoma skin cancer) (3.2–4.5%),
chronic obstructive pulmonary disease (2.8–3.8%), and other
chronic inflammatory diseases (2.3–3.5%).
During the 3 months before enrollment, infection (treated
with antibiotics) was the most common clinical event in all
four cohorts (13.1–25.0%), followed in frequency by CABG
(2.7–7.9%), PVD (2.3–3.7%), cardiac failure (1.3–1.7%) and
chronic blood loss (1.0–1.2%). Other clinical events were
neoplasia (0.6–1.0%), severe acute blood loss (0.6–1.3%),
CVA (0.4–0.8%), PTCA (0.3–0.7%) and myocardial
infarction (0.1–0.5%). A history of active smoking was
reported in 25.5–31.6% of the patients across the four
cohorts.
Prevalence of anemiaHemoglobin concentrations at the time of transplantation
were significantly higher in patients who received a
transplant more recently: in patients who received kidney
transplants 6 months, 1, 3 and 5 years earlier, the mean
Hb levels before transplantation were 11.9 ± 1.7 g/dL,
11.7 ± 1.8 g/dL, 11.2 ± 1.8 g/dL and 10.8 ± 1.8 g/dL, respec-
tively (p< 0.01).
At the time of enrollment, the mean Hb levels were
13.2 ± 1.9 g/dL for the total sample (Table 2). Figure 1 illus-
trates the distribution of Hb levels for each cohort at the
time of the survey. Overall, Hb levels ranged from 4.5 to
20.1 g/dL. A small but statistically significant difference
was found between the mean Hb levels of patients who
received transplants 6 months ago (13.0 ± 1.8 g/dL) com-
pared with those who received transplants 1 year ago
(13.3 ± 1.0 g/dL) (p< 0.01) and 3 years ago (13.2 ± 1.9 g/
dL) (p¼ 0.05). In the total sample, 1645 patients (38.6%)
were found to be anemic. Of these patients, 786 (18.4%
of total population) had mild anemia, 495 (11.6% of total)
had moderate anemia, and 364 (8.5% of total) had severe
anemia.
Risk factors for anemiaAlthough the female transplant recipients had lower mean
Hb levels (12.6 ± 1.7 g/dL) than the male patients
(13.5 ± 1.9 g/dL) (p< 0.01), prevalence of anemia did not
differ by gender (in the whole group or by cohort) (Figure 2).
Anemia in Renal Transplant Recipients
American Journal of Transplantation 2003; 3: 835–845 837

Tab
le1:
Chara
cte
ristics
of
the
transpla
nt
cohort
s
Tota
lsam
ple
n¼
4263
6m
onth
s
n¼
1003
(23.5
%)
1year
n¼
960
(22.5
%)
3years
n¼
1254
(29.4
%)
5years
n¼
1046
(24.5
%)
Sig
nific
ance
testing*
Recip
ient
gender
Male
2641
(62.0
%)
622
(62.0
%)
583
(60.7
%)
804
(64.1
%)
632
(60.4
%)
p¼
NS
Fem
ale
1622
(38.0
%)
381
(38.0
%)
377
(39.3
%)
450
(35.9
%)
414
(39.6
%)
Recip
ient
age
(years
)A
tenro
llmenta
48.0
±13.0
46.6
±13.1
48.4
±13.0
48.1
±12.7
48.7
±13.3
p<
0.0
1
At
transpla
nta
tion
a45.5
±13.1
46.1
±13.1
47.3
±13.0
45.1
±12.7
43.6
±13.2
p¼
0.0
1
Donor
type
Cadaveric
3823
(89.7
%)
885
(88.2
%)
858
(89.4
%)
1122
(89.5
%)
958
(91.6
%)
Liv
ing
440
(10.3
%)
118
(11.8
%)
102
(10.6
%)
132
(10.5
%)
88
(8.4
%)
p¼
NS
Tra
nspla
nt
num
ber
First
3705
(86.9
%)
849
(84.6
%)
853
(88.9
%)
1092
(87.1
%)
911
(87.1
%)
Second
471
(11.0
%)
131
(13.1
%)
93
(9.7
%)
141
(11.2
%)
106
(10.1
%)
Third
87
(2.0
%)
23
(2.3
%)
14
(1.5
%)
21
(1.7
%)
29
(2.8
%)
p<
0.0
5
Num
ber
of
treate
dacute
reje
ctions
b0.5
±1.4
(0)
0.4
±0.8
(0)
0.4
±1.7
(0)
0.5
±1.7
(0)
0.6
±1.0
(0)
p<
0.0
1
Donor
age
(years
)C
adaveric
a42.9
±16.1
43.3
±16.0
45.0
±16.8
43.0
±15.7
40.6
±15.9
p¼
0.0
1
Liv
ing
a49.0
±11.5
50.0
±10.9
48.5
±12.7
49.9
±10.3
46.9
±12.1
p¼
NS
Blo
od
pre
ssure
at
tim
eof
enro
llment
Systo
lic(m
mH
g)a
137.4
±18.1
137.3
±18.6
137.1
±18.2
137.5
±17.6
137.7
±18.0
p¼
NS
Dia
sto
lic(m
mH
g)a
81.2
±10.2
80.8
±10.2
80.9
±10.2
81.6
±10.0
81.1
±10.3
Body
weig
ht
at
tim
eof
enro
llment
(kg)a
73.1
±14.7
71.7
±14.5
73.9
±14.4
73.6
±14.8
73.1
±14.8
p<
0.0
1
WH
Operf
orm
ance
score
b0.5
±0.8
(0)
0.5
±0.8
(0)
0.5
±0.8
(0)
0.6
±0.8
(0)
0.5
±0.8
(0)
p¼
NS
*C
hi-square
,A
NO
VA
or
Kru
skal–
Walli
sw
as
used
where
appro
priate
.aM
ean
±S
D;
bM
ean
±S
D(m
edia
n).
Vanrenterghem et al.
838 American Journal of Transplantation 2003; 3: 835–845

A relationship between age of the recipient and Hb levels
was not found. Hb levels were higher in patients who
received a first kidney transplant (13.2 ± 1.9 g/dL) than in
those who received a second (12.8 ± 1.9 g/dL) or third
transplant (12.7 ± 2.1 g/dL) (p< 0.01). Patients who had
experienced more episodes of treated acute rejections
had lower mean Hb levels: patients without rejection
episodes had mean Hb levels of 13.3 ± 1.9 g/dL, whereas
those who had experienced one rejection had mean Hb
levels of 13.1 ± 1.9 g/dL, and patients with two, three, four
or more rejections had mean Hb levels of 12.5 ± 1.9 g/dL,
12.3 ± 1.8 g/dL, 11.6 ± 2.2 g/dL and 12.8 ± 2.0 g/dL, respect-
ively (p< 0.01).
The mean (± SD) serum creatinine concentration for the entire
sample was 1.7 ± 1.0 mg/dL (median 1.5 mg/dL) (Table 2).
Patients who received transplants 3 years ago had signifi-
cantly higher serum creatinine concentrations than patients
in the other cohorts (p< 0.01) (Table 2). Measured creatinine
clearance was significantly higher in patients in the 1-year
cohort than in patients in the 3-year (p¼ 0.05) and 5-year
(p< 0.01) cohorts (Table 2). No correlation existed between
Table 2: Mean hemoglobin and creatinine concentrations at the time of enrollment for each transplant cohort
Total sample
n¼4263
6 months
n¼1003
1 years
n¼ 960
3 years
n¼1254
5 years
n¼1046 Significance testing*
Hemoglobin (g/dL)a 13.2 ± 1.9 13.0 ± 1.8 13.3 ± 1.9 13.2 ± 1.9 13.2 ± 1.9 p< 0.01
Serum creatinine
(mg/dL)b (median)
1.7 ± 1.0 (1.5) 1.6 ± 0.6 (1.4) 1.6 ± 0.8 (1.5) 1.8 ± 1.0 (1.6) 1.8 ± 1.2 (1.5) p< 0.01
Measured creatinine
clearance (mL/min)a60.9 ± 27.3 62.4 ± 28.2 64.3 ± 28.0 59.5 ± 26.3 57.7 ± 26.4 p< 0.01
*ANOVA or Kruskal–Wallis was used where appropriate.aMean ± SD.bMean ± SD (median).
Figure 1: Hemoglobin levels in each of the four cohorts. Distribution of mean Hb levels (in g/dL) in the patient cohorts who received
kidney transplants 6 months, 1, 3, or 5 years earlier.
Anemia in Renal Transplant Recipients
American Journal of Transplantation 2003; 3: 835–845 839

the age of the recipient and serum creatinine. Creatinine
clearance and Hb concentrations decreased significantly
with increasing donor age (p< 0.01). While higher Hb concen-
trations were correlated with improved creatinine clearance
rates the strength of this relationship weakened with
increasing donor age.
Patients not treated with epoetin had lower Hb levels if
serum creatinine was high (p< 0.01) or creatinine clear-
ance was low (p< 0.01; Figure 3). Of the 904 patients with
serum creatinine levels > 2 mg/dL, a significantly greater
proportion were anemic (62.8%, sum of 21.0% with mild,
21.5% with moderate, and 20.4% with severe anemia)
compared with patients with serum creatinine levels
� 2 mg/dL (32.1%) (p< 0.01).
Steroids and cyclosporine were the most commonly used
immunosuppressive agents (used by 84.5% and 66.6% of
patients, respectively) (Table 3). The differences in the four
cohorts reflect the changes in immunosuppressive ther-
apies available in Europe. The combination of cyclosporine,
steroids and MMF was the most often used combination
therapy (30.7%) (Table 3). Mean Hb levels in patients treated
with combination therapies ranged from 12.6 ± 1.6 g/dL
(steroids and MMF) to 13.5 ± 1.9 g/dL (tacrolimus and
steroids) (Table 4).
Azathioprine and MMF are immunosuppressives that may
induce anemia (9). A significant difference in Hb levels
was found in patients treated with MMF, or combinations
including MMF, compared with patients not treated with
MMF (13.1 ± 1.9 g/dL vs. 13.4 ± 2.0 g/dL, respectively,
p< 0.01) (Table 5). No such difference was found for
azathioprine in the total patient sample (Table 5). In the
subgroup of patients with serum creatinine levels � 2 mg/
dL, however, a significant difference in Hb levels (0.2 g/dL)
was found between patients treated with or without
azathioprine (p< 0.05).
Of those cases with complete medication data (n¼ 3631),
1408 patients (38.8%) received a combination of calcium-
channel blockers, steroids, and either tacrolimus or cyclo-
sporine. The proportion of patients treated with this
combination of medications was significantly higher
(p< 0.01) in the 6-month cohort (43.8%) compared with
the 1-year (36.7%), 3-year (39.9%) or 5-year (34.3%)
cohorts. Patients on this regimen had higher Hb levels
(13.5 ± 1.9 g/dL) than patients not receiving this treatment
(13.0 ± 1.9 g/dL) (p< 0.01).
Of the antihypertensive treatments, beta-blockers were
prescribed most frequently (47.4% overall), followed by
calcium-channel blockers (47.1%) and diuretics (29.1%).
Other antihypertensives included ACE inhibitors (25.9%),
alpha-1 antagonists (18.5%), angiotensin II receptor
antagonists (10.3%), vasodilators (7.8%) and clonidine
(5.3%). For the total sample, there were no significant
differences in Hb levels between patients treated with
ACE inhibitors (13.1 ± 1.9 g/dL) and those not given ACE
inhibitors (13.2 ± 1.9 g/dL). Anemic patients treated
with ACE inhibitors, however, had only slightly but
statistically significantly higher Hb levels (11.7 ± 1.4 g/dL)
than anemic patients not treated with ACE inhibitors
(11.4 ± 1.1 g/dL) (p< 0.01). Patients treated with angio-
tensin II receptor antagonists had significantly lower
Hb levels (12.9 ± 2.0 g/dL) than patients not treated
with angiotensin II receptor antagonists (13.2 ± 1.9 g/dL)
(p< 0.01).
Many patients also received H2 blockers (42.2%),
statins (34.1%), aspirin (22.7%), antibiotics (16.4%),
insulin (10.3%), oral anticoagulants (6.6%), oral antihyper-
glycemics (3.6%), antiepileptics (1.5%) or theophylline
(0.8%).
Recent infections had an impact on the occurrence of
anemia; the mean Hb of patients who had experienced
recent infections was 12.5 ± 2.3 g/dL vs. 13.0 ± 2.0 g/dL in
patients who had not had recent infections (p< 0.001).
Hepatitis B or C, on the other hand, did not have an impact
on anemia (mean Hb of patients with hepatitis B or C
was 13.1 ± 2.2 g/dL vs. 13.0 ± 2.1 g/dL in patients without
hepatitis B or C, p ¼ 0.134). Hb concentrations were also
significantly correlated with the occurrence of clinical events
(including infections, CVA, chronic blood loss, cardiac failure,
myocardial infarction, PVD, new-onset neoplasia, surgery
including PTCA). The mean Hb of patients who experienced
at least one clinical event was significantly lower than that of
Male patientsn = 2641
Female patientsn = 1622
60.8% 62.4%19.7%
9.6%6.8%
11.9%11.2%
17.7%
No anemia
Mild anemia
Moderate anemia
Severe anemia
Figure 2: Anemia by gender. Preva-
lence of mild, moderate and severe
anemia in the total patient sample
(n¼4263) divided by gender.
Vanrenterghem et al.
840 American Journal of Transplantation 2003; 3: 835–845

patients who had not experience any clinical event
(12.6 ± 2.2 g/dL vs. 13.1 ± 1.0 g/dL, p < 0.01).
Associative logistic regression was used to determine the
relationship between anemia as a nominal variable and the
following variables: age of donor > 60 years (yes/no),
serum creatinine > 2 mg/dL (yes/no), presence of a recent
infection, use of ACE inhibitors or angiotensin II receptor
antagonists (yes/no), use of azathioprine and/or MMF
(yes/no) and polycystic kidney disease (yes/no). Collect-
ively, these variables accounted for 11.4% of the variance
in anemia. The goodness of fit test indicated adequate fit
of the model to the data and the overall correct classifica-
tion was 68.6%. Results indicate that the odds of being
anemic were 3.48 times greater in patients with serum
creatinine levels > 2 mg/dL than in those patients whose
serum creatinine was� 2 mg/dL (Table 6). Use of ACE
inhibitors or angiotensin II receptor antagonists was
also associated with a higher odds ratio for being anemic
(odds ratio¼ 1.55) as was donor age> 60 years (odds
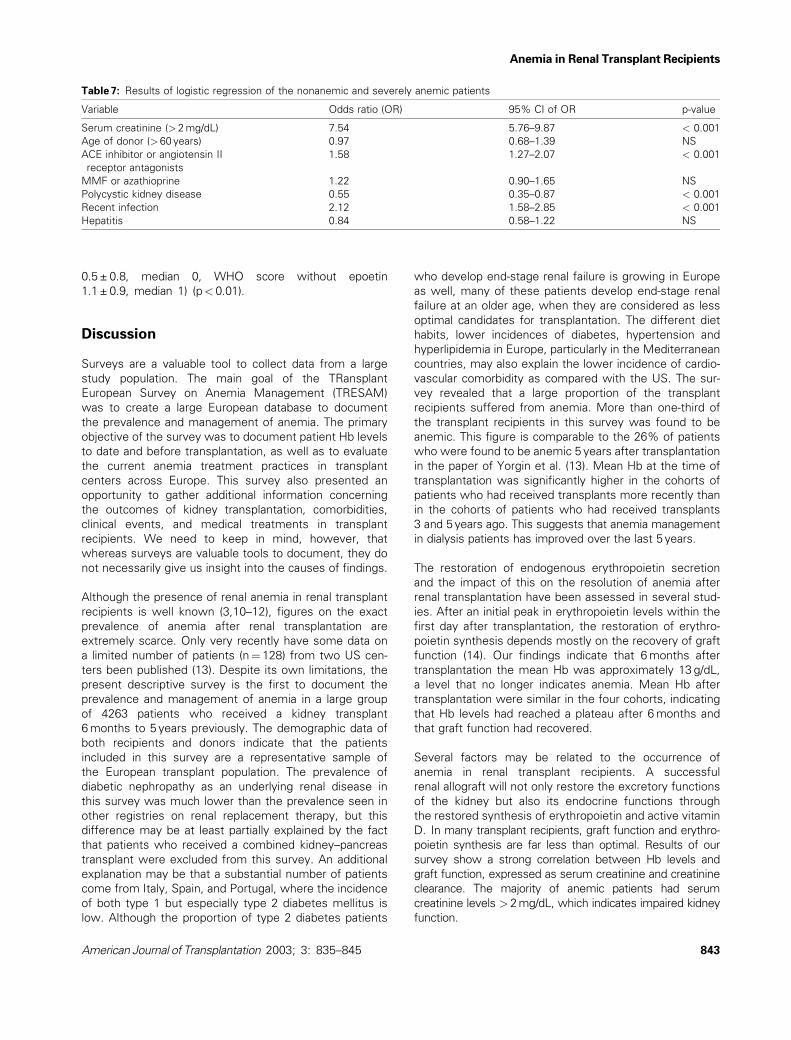
ratio¼ 1.41). When comparing nonanemic with severely
anemic patients, the model achieved an 88.10% classifi-
cation accuracy rate. The odds ratios obtained for this
model are given in Table 7. Serum creatinine (> 2 mg/dL),
use of ACE inhibitors or angiotensin II receptor antag-
onists, and a recent infection significantly increased the
risk of severe anemia, while polycystic kidney disease as
original diagnosis was protective (p< 0.05).
Anemia managementOf the 3969 patients for whom epoetin use (yes/no) was
documented, 207 patients (5.2%) received epoetin for
treatment of anemia. Of the 2430 nonanemic patients
for whom epoetin use was documented, 47 (1.9%)
received epoetin. Of the 731 patients with mild anemia,
44 (6.0%) were treated with epoetin, of the 465 patients
with moderate anemia 55 (11.8%) were treated with
epoetin, and of the 343 patients with severe anemia 61
(17.8%) were treated with epoetin. The mean Hb level in
patients receiving epoetin was significantly lower than in
patients not receiving epoetin (11.1 ± 2.0 g/dL vs.
13.1 ± 2.1 g/dL, p < 0.01). Rates of epoetin administration
in the cohorts of 6 months, 1 year, 3 years and 5 years
post-transplantation were similar (4.0%, 5.5%, 5.4% and
5.8%, respectively; p¼NS). The median epoetin dose that
was administered in the total sample was 4000.0 IU/week
(mean ± SD: 5831.7 ± 4217.4 IU/week).
Performance status and anemiaOverall, the performance status of kidney transplant
recipients, as measured by the WHO score, was good
with a median score of 0 (mean ± SD 0.5 ± 0.8) (with
WHO score 0 being the most optimal and 4 being the
least optimal performance). The performance status of
patients with severe anemia (mean ± SD 0.9 ± 1.0, median 1)
was significantly different from those of patients without
anemia or with mild or moderate anemia (all median 0,
p< 0.01). Among patients with anemia, there was a
significant difference in WHO score associated with
epoetin treatment only in the group of transplant reci-
pients with mild anemia (WHO score with epoetin
(A)
(B)
Figure 3: Hemoglobin level and kidney function. Relationship
between hemoglobin levels and kidney function expressed as
serum creatinine concentration (A) and measured creatinine
clearance (B) in patients not treated with epoetin.
Anemia in Renal Transplant Recipients
American Journal of Transplantation 2003; 3: 835–845 841

Table 3: Immunosuppressive therapies
Total sample 6 months 1 years 3 years 5 years Significance
Immunosuppressantsa n¼4263 n¼1003 n¼ 960 n¼ 1254 n¼1046 testing*
Steroids 3290 (84.5%) 829 (89.2%) 746 (83.8%) 958 (84.6%) 757 (80.2%) p< 0.01
Cyclosporine 2518 (66.6%) 467 (52.6%) 436 (51.1%) 836 (75.0%) 779 (84.3%) p< 0.01
Tacrolimus 1156 (31.3%) 430 (48.2%) 395 (47.6%) 226 (21.0%) 105 (11.8%) p< 0.01
Mycophenolate mofetil (MMF) 1882 (50.2%) 575 (64.5%) 522 (60.8%) 562 (51.2%) 223 (24.8%) p< 0.01
Azathioprine 1001 (26.9%) 169 (19.0%) 172 (20.5%) 307 (28.3%) 353 (38.7%) p< 0.01
Sirolimus 54 (1.5%) 34 (3.9%) 10 (1.2%) 7 (0.7%) 3 (0.3%) p< 0.01
Total sample 6 months 1 years 3 years 5 years Significance
Combinationsb n¼2973 n¼ 753 n¼664 n¼873 n¼ 683 testing*
Cyclosporine/steroids 545 (18.3%) 90 (11.9%) 71 (10.7%) 141 (16.1%) 243 (35.5%) p< 0.01
Tacrolimus/steroids 213 (7.1%) 53 (7.0%) 72 (10.8%) 57 (6.5%) 31 (4.5%) p< 0.01
Cyclosporine/steroids/azathioprine 585 (19.6%) 89 (11.8%) 93 (14.0%) 191 (21.8%) 212 (31.0%) p< 0.01
Tacrolimus/steroids/azathioprine 128 (4.3%) 32 (4.2%) 35 (5.3%) 41 (4.7%) 20 (2.9%) p¼NS
Cyclosporine/steroids/MMF 916 (30.7%) 236 (31.3%) 189 (28.4%) 353 (40.3%) 138 (20.2%) p< 0.01
Tacrolimus/steroids/MMF 501 (16.8%) 241 (32.0%) 186 (28.0%) 57 (6.5%) 17 (2.5%) p< 0.01
Steroids/MMF 85 (2.9%) 12 (1.6%) 18 (2.7%) 33 (3.8%) 22 (3.2%) p ¼ NS
*Chi-square: comparing proportions in four transplant cohorts.aCategories are not mutually exclusive; bcategories are mutually exclusive.
Table 4: Mean hemoglobin levels in the patients treated with various combinations of immunosuppressive therapies
Total sample (n¼ 4263) Hemoglobin
Immunosuppressive therapies n (mean ± SD) (g/dL)
Cyclosporine/steroids 545 13.4 ± 2.0
Tacrolimus/steroids 213 13.5 ± 1.9
Cyclosporine/steroids/azathioprine 585 13.4 ± 1.9
Tacrolimus/steroids/azathioprine 128 13.0 ± 2.0
Cyclosporine/steroids/MMF 916 13.1 ± 1.9
Tacrolimus/steroids/MMF 501 13.0 ± 1.9
Steroids/MMF 85 12.6 ± 1.6
Table 5: Hemoglobin levels across various immunosuppressive regimens
All patients n Hemoglobin (mean ± SD) (g/dL) Significance testing*
Tacrolimus and/or cyclosporine With azathioprine 713 13.3 ± 1.9
and/or steroids Without azathioprine 758 13.4 ± 2.0p ¼ NS
Tacrolimus and/or cyclosporine With MMF 1502 13.1 ± 1.9
and/or steroids Without MMF 758 13.4 ± 2.0p<0.01
*Independent samples t-test.
Table 6: Results of logistic regression of non-anemic and anemic patients
Variable Odds ratio (OR) 95% CI of OR p-value
Serum creatinine (> 2 mg/dL) 3.48 2.92–4.14 < 0.001
Age of donor (>60 years) 1.41 1.16–172 < 0.001
ACE inhibitor or angiotensin II
receptor antagonists
1.55 1.34–1.80 < 0.001
MMF or azathioprine 1.24 1.05–1.47 < 0.05
Polycystic kidney disease 0.70 0.56–0.88 < 0.01
Recent infection 1.36 1.13–1.64 < 0.001
Vanrenterghem et al.
842 American Journal of Transplantation 2003; 3: 835–845
0.5 ± 0.8, median 0, WHO score without epoetin
1.1 ± 0.9, median 1) (p< 0.01).
Discussion
Surveys are a valuable tool to collect data from a large
study population. The main goal of the TRansplant
European Survey on Anemia Management (TRESAM)
was to create a large European database to document
the prevalence and management of anemia. The primary
objective of the survey was to document patient Hb levels
to date and before transplantation, as well as to evaluate
the current anemia treatment practices in transplant
centers across Europe. This survey also presented an
opportunity to gather additional information concerning
the outcomes of kidney transplantation, comorbidities,
clinical events, and medical treatments in transplant
recipients. We need to keep in mind, however, that
whereas surveys are valuable tools to document, they do
not necessarily give us insight into the causes of findings.
Although the presence of renal anemia in renal transplant
recipients is well known (3,10–12), figures on the exact
prevalence of anemia after renal transplantation are
extremely scarce. Only very recently have some data on
a limited number of patients (n¼ 128) from two US cen-
ters been published (13). Despite its own limitations, the
present descriptive survey is the first to document the
prevalence and management of anemia in a large group
of 4263 patients who received a kidney transplant
6 months to 5 years previously. The demographic data of
both recipients and donors indicate that the patients
included in this survey are a representative sample of
the European transplant population. The prevalence of
diabetic nephropathy as an underlying renal disease in
this survey was much lower than the prevalence seen in
other registries on renal replacement therapy, but this
difference may be at least partially explained by the fact
that patients who received a combined kidney–pancreas
transplant were excluded from this survey. An additional
explanation may be that a substantial number of patients
come from Italy, Spain, and Portugal, where the incidence
of both type 1 but especially type 2 diabetes mellitus is
low. Although the proportion of type 2 diabetes patients
who develop end-stage renal failure is growing in Europe
as well, many of these patients develop end-stage renal
failure at an older age, when they are considered as less
optimal candidates for transplantation. The different diet
habits, lower incidences of diabetes, hypertension and
hyperlipidemia in Europe, particularly in the Mediterranean
countries, may also explain the lower incidence of cardio-
vascular comorbidity as compared with the US. The sur-
vey revealed that a large proportion of the transplant
recipients suffered from anemia. More than one-third of
the transplant recipients in this survey was found to be
anemic. This figure is comparable to the 26% of patients
who were found to be anemic 5 years after transplantation
in the paper of Yorgin et al. (13). Mean Hb at the time of
transplantation was significantly higher in the cohorts of
patients who had received transplants more recently than
in the cohorts of patients who had received transplants
3 and 5 years ago. This suggests that anemia management
in dialysis patients has improved over the last 5 years.
The restoration of endogenous erythropoietin secretion
and the impact of this on the resolution of anemia after
renal transplantation have been assessed in several stud-
ies. After an initial peak in erythropoietin levels within the
first day after transplantation, the restoration of erythro-
poietin synthesis depends mostly on the recovery of graft
function (14). Our findings indicate that 6 months after
transplantation the mean Hb was approximately 13 g/dL,
a level that no longer indicates anemia. Mean Hb after
transplantation were similar in the four cohorts, indicating
that Hb levels had reached a plateau after 6 months and
that graft function had recovered.
Several factors may be related to the occurrence of
anemia in renal transplant recipients. A successful
renal allograft will not only restore the excretory functions
of the kidney but also its endocrine functions through
the restored synthesis of erythropoietin and active vitamin
D. In many transplant recipients, graft function and erythro-
poietin synthesis are far less than optimal. Results of our
survey show a strong correlation between Hb levels and
graft function, expressed as serum creatinine and creatinine
clearance. The majority of anemic patients had serum
creatinine levels > 2 mg/dL, which indicates impaired kidney
function.
Table 7: Results of logistic regression of the nonanemic and severely anemic patients
Variable Odds ratio (OR) 95% CI of OR p-value
Serum creatinine (> 2 mg/dL) 7.54 5.76–9.87 < 0.001
Age of donor (>60 years) 0.97 0.68–1.39 NS
ACE inhibitor or angiotensin II
receptor antagonists
1.58 1.27–2.07 < 0.001
MMF or azathioprine 1.22 0.90–1.65 NS
Polycystic kidney disease 0.55 0.35–0.87 < 0.001
Recent infection 2.12 1.58–2.85 < 0.001
Hepatitis 0.84 0.58–1.22 NS
Anemia in Renal Transplant Recipients
American Journal of Transplantation 2003; 3: 835–845 843

Rejection episodes also affect the occurrence of anemia.
Transplant recipients who had experienced one or more
rejection episodes, or who had received a second or third
graft, had lower Hb levels than recipients without rejection
episodes or recipients of a first transplant. Although it has
been shown that the onset of an acute rejection within the
first month after transplantation completely abrogates the
erythropoietic response (15), the correlation between Hb
levels and previous rejections in our survey most likely
results from the suboptimal kidney function in patients
who had experienced several acute rejection episodes.
More intensified immunosuppressive treatment to control
the rejection or to prevent subsequent rejections, or the
more frequent use of ACE inhibitors in these patients who
are more prone to have higher blood pressure, may also
play a role.
Donor age is another risk factor for anemia. In fact, in
donors aged older than 60 years, the presence of anemia
is significantly affected. As the use of donors aged more
60 years is increasing in Europe, donor age could have
important clinical implications.
Several of the above-mentioned factors like kidney
function, incidence of rejection and donor age may explain
why the mean Hb level is lower in second- and third-
transplant recipients than in first transplant recipients. Also
the more widespread use of MMF in these patients may
play a role.
Among the different immunosuppressive agents used
after transplantation, the purine synthesis inhibitors
azathioprine and MMF are best known to cause anemia
(9). MMF selectively blocks the de novo or ribose-derived
purine synthesis pathway, and is therefore not expected
to have a major effect on the cell proliferation of bone
marrow cells except on that of lymphocytes (16). Contrary
to this expectation, a similar incidence of anemia was
reported in the pivotal trials that compared MMF and
azathioprine (17,18). In our survey, the lowest mean Hb
levels were found in patients treated with combination
therapy of MMF and steroids, and Hb levels were signifi-
cantly lower in patients treated with immunosuppressant
combinations including MMF than in those without MMF.
In the present survey, the difference in mean Hb levels
between patients treated with or without azathioprine did
not reach statistical significance in the total patient sam-
ple. This may be because of the fact that low doses of
azathioprine are used during combination therapy with the
potent calcineurin inhibitors. When patients with poor kid-
ney function (i.e. serum creatinine > 2 mg/dL) were
excluded from the analyses, the difference in mean Hb
levels between patients treated with or without azathio-
prine reached statistical significance. In the past, depression
of bone marrow proliferation as a result of azathioprine
has been a frequent cause of transient anemia in renal
transplant recipients. Macrocytosis was present in a
majority of the patients treated with azathioprine. Select-
ive erythroid toxicity of azathioprine is rare and poorly
understood (19).
Other medications used after transplantation with possible
erythrotoxic effects include the ACE inhibitors. In our
survey, no significant difference could be found in Hb
levels between patients treated with ACE inhibitors and
those not given ACE inhibitors. Still, the associative
regression analysis showed that the use of ACE inhibitors
or angiotensin II receptor antagonists was associated with
a higher likelihood of anemia. One possible explanation
may be that ACE inhibitors are not only given as
antihypertensives, but also to correct post-transplant
erythrocytosis. The more recent angiotensin II receptor
antagonists are still less popular as antierythrocytosis
drugs, which may explain the lower Hb levels seen in
the patients treated with these drugs. As angiotensin II
receptor antagonists were introduced more recently, it
may be that other factors like the more frequent use of
MMF or the use of older donors may at least in part also
explain the lower Hb in these patients.
Anemia in kidney transplant recipients may negatively
affect long-term outcome. Anemia in patients who
undergo hemodialysis has been linked to the development
of left ventricular hypertrophy, and is therefore considered
to be a major contributor to cardiovascular risk (4,5).
Anemia may also be a major contributor to cardiovascular
risk in post-transplant patients, which is particularly worrying
because cardiovascular events are known to be the main
cause of death in post-transplant recipients (6). This sur-
vey revealed that many post-transplant patients (38.6%)
are anemic but only few receive adequate anemia treat-
ment. Even transplant recipients with severe anemia
received epoetin in only 17.8% of cases. In pretransplant
patients, observational studies and clinical trials indicate
that treatment of anemia of renal failure with epoetin
improves left ventricular structure and function, increases
cardiac output, and improves quality of life (4,5). Whether
the same holds true for renal transplant recipients with
persistent or recurrent anemia is still to be proven. In
addition, neither for dialysis patients nor for predialysis
patients, a consensus has been reached on the optimal
target Hb with epoetin therapy. Should all anemic trans-
plant recipients be treated with epoetin in an attempt to
normalize their Hb, or should treatment be reserved only
for those who are severely anemic? Will epoetin therapy in
transplant recipients be as effective as in nontransplanted
patients? Several reports of small groups of patients have
shown that epoetin is as effective in renal transplant reci-
pients as in dialysis patients (20–22). However, epoetin
resistance in transplant recipients, probably related to the
inflammatory syndrome of chronic rejection, has been
reported as well (23). The fact that in our survey the mean
Hb level in patients receiving epoetin was significantly
lower than in patients not receiving epoetin is in our opinion
more a result of the design of the survey than an indication
of erythropoietin resistance. Only prospective interventional
Vanrenterghem et al.
844 American Journal of Transplantation 2003; 3: 835–845
studies in anemic renal transplant recipients will be able to
better answer these questions.
Acknowledgment
This study was sponsored by Ortho Biotech, a division of Janssen-Cilag.
References
1. US Renal Data System. USRDS 2001 Annual Report. Bethesda,
MD: National Institute of Health, 2001 (http://www.usrds.org/
atlas.htm).
2. Parfrey PS, Vavasour HM, Gault MH. A prospective study of
health status in dialysis and transplant patients. Transplant Proc
1988; 20: 1231–1232.
3. Muirhead N. Erythropoietin and renal transplantation. Kidney Int
Suppl 1999; 69: S86–S92.
4. Silberberg JS, Rahal DP, Patton R, Sniderman AD. Role of
anemia in the pathogenesis of left ventricular hypertrophy in
end-stage renal disease. Am J Cardiol 1989; 64: 222–224.
5. Mann JFE. What are the short-term and long-term conse-
quences of anemia in CRF patients? Nephrol Dial Transplant
1999; 14 (Suppl. 2): S29–S36.
6. Kasiske BL, Guijarro C, Massy ZA, Wiederkehr MR, Ma JZ.
Cardiovascular disease after renal transplantation. J Am Soc
Nephrol 1996; 7: 158–165.
7. Kasiske BL, Vazquez MA, Harmon WE et al. Recommendations
for the outpatient surveillance of renal transplant recipients.
American Society of Transplantation. J Am Soc Nephrol 2000;
11 (Suppl. 15): S1–S86.
8. Cockcroft DW, Gault MH. Prediction of creatinine clearance from
serum creatinine. Nephron 1976; 16: 31–41.
9. Vanwalleghem JF, Vanrenterghem YFC. Hematologic consider-
ations of organ transplantation. In: Ginns LC, Cosimi AB
Morris, PJ, eds. Transplantation. Malden: Blackwell Science,
1999: 685–695.
10. Ternero F, Prats D, Alvarez-Sala JL, Coronel F, Sanchez A,
Barrientos A. Iron deficiency anemia after successful renal trans-
plantation. J Urol 1993; 149: 1398–1400.
11. Moore LW, Smith SO, Winsett RP, Acchiardo SR, Gaber AO.
Factors affecting erythropoietin production and correction of
anemia in kidney transplant recipients. Clin Transplant 1994; 8:
358–364.
12. Miles AM, Markell MS, Daskalakis P et al. Anemia following
renal transplantation: erythropoietin response and iron defi-
ciency. Clin Transplant 1997; 11: 313–315.
13. Yorgin PD, Scandling JD, Belson A, Sanchez J, Alexander SR,
Andreoni KA. Late post-transplant anemia in adult renal trans-
plant recipients. An under-recognized problem? Am J Transplant
2002; 2: 429–435.
14. Sun CH, Ward HJ, Paul WL, Koyle MA, Yanagawa N, Lee DBN.
Serum erythropoietin levels after renal transplantation. N Engl J
Med 1989; 321: 151–157.
15. Besarab A, Caro J, Jarrell BE, Francos G, Erslev AJ. Dynamics of
erythropoiesis following renal transplantation. Kidney Int 1987;
32: 526–536.
16. Franklin TJ, Cook JM. The inhibition of nucleic acid synthesis by
mycophenolic acid. Biochemistry 1969; 113: 515–524.
17. European Mycophenolate Mofetil Cooperative Study Group.
Placebo-controlled study of mycophenolate mofetil combined
with cyclosporin and corticosteroids for prevention of acute
rejection. Lancet 1995; 345: 1321–1325.
18. Sollinger HW. Mycophenolate Mofetil for the prevention of
acute rejection in primary cadaveric renal allograft recipients.
U.S. Renal Transplant Mycophenolate Mofetil Study Group.
Transplantation 1995; 60: 225–232.
19. Old CW, Flannery EP, Grogan TM. Azathioprine-induced pure red
cell aplasia. JAMA 1978; 240: 552–554.
20. Lezaic V, Djukanovic LJ, Pavlovic-Kentera V. Recombinant
human erthropoietin treatment of anemia in renal transplant
patients. Ren Fail 1995; 5: 1216–1222.
21. Traindl O, Barnas U, Franz M. Recombinant erythropoietin in
renal transplant recipients with renal anemia. Clin Transplant 1994;
8: 45–48.
22. Jindal KK, Hirsch DJ, Belitsky P, Whalen MA. Low-dose subcuta-
neous erythropoietin corrects anemia of renal transplant failure.
Nephrol Dial Transplant 1992; 7: 142–146.
23. Almond MK, Tailor D, Marsh FP, Raftery MJ, Cunningham J.
Increased erythropoeitin requirements in patients with failed
renal transplants returning to a dialysis programme. Nephrol
Dial Transplant 1994; 9: 270–273.
Anemia in Renal Transplant Recipients
American Journal of Transplantation 2003; 3: 835–845 845