Study on Prevalence of Protein Energy Malnutrition among ...
8
Original Article :: 14 :: Study on Prevalence of Protein Energy Malnutrition among Children of 3-6 Years of Age in the Study District 1 2 Malay Savalia , Sumit Unadkat 1 2 Resident Doctor, Associate Professor, Shree M. P. Shah Government Medical College, Jamnagar, Gujarat, India Correspondence : Dr Sumit Unadkat, E mail: [email protected] Abstract : Introduction : Children are generally most vulnerable and least able to help themselves. Malnutrition in its several forms of under nutrition has been coined as “silent emergency” by United Nations Children's Fund (UNICEF). Rural area shows inequalities in distribution of beneficiaries in form of structure, performance and pattern of economic growth. Objectives : To estimate prevalence of Protein Energy Malnutrition (PEM), to find out association between various factors and prevalence of malnutrition and to assess various aspects of feeding of child with prevalence of malnutrition in children of 3-6 years of age. Method : A community based cross sectional study was conducted on 3-6 years old children of rural area of study district. Results : Out of total 894 children, 27.96% children were underweight and 6.71% children were severely underweight. Malnutrition was seen in 42.78% children amongst those who did not consume calories as per Recommonded Dietary Allowarce (RDA). Conclusion : Protein energy malnutrition in form of underweight was present in more than one third children. Higher prevalence of malnutrition was found in children who had birth weight of less than 2.5 kilograms, having interpregnancy interval of less than 24 months, of birth order of 4 or more, who were breastfed for a period of 6 to 12 months, to whom complementary feeding was started before the age of 6 months or who were partially immunized. Key words : Children of 3-6 years of age, Protein energy malnutrition, Underweight Introduction : The hearts of most grown-ups melt at the sight of small children who constitute one of the most vulnerable sections of society. Children are our supreme assets because children of today form the [1] human resource of tomorrow. Children need extra care because these are generally the most vulnerable and least able to help themselves. Interventions early in life can thus have lifelong benefits not just for [2] individual but for society as a whole. It is now an established fact that the brain undergoes development and growth within the first five years of a child's life. Therefore, malnutrition of children under 5 years will surely lead to reduced mental abilities affecting the intellectual capabilities of the children when they reach adulthood. It is well recognised and documented that preschool children are a nutritionally vulnerable segment of population and their growth and nutritional status are useful and sensitive indicators for judging health of a community [3, 4] or a nation. Early childhood is a period of rapid growth and that nutritional insults during this period [5, 6] result into under or over nutrition. Malnutrition in its several forms of under nutrition, namely wasting, stunting and underweight has been coined as the “silent emergency” by the [7] United Nations Children's Fund (UNICEF). Malnutrition and infection are the two most important factors that affect the growth of children. Under nutrition is associated with impaired immune function and consequent increased susceptibility to infections; infections aggravate undernutrition; if this vicious cycle continues it can result in death of the child. Nutrition plays a key role in physical, mental and emotional development of children and much emphasis has been given to provide good nutrition to growing populations especially in the formative years [8] of life. The subject gains more importance in rural children, due to certain adverse realities like Healthline Journal Volume 10 Issue 2 (July - December 2019)
-
Upload
khangminh22 -
Category
Documents
-
view
3 -
download
0
Transcript of Study on Prevalence of Protein Energy Malnutrition among ...

Original Article
:: 14 ::
Study on Prevalence of Protein Energy Malnutrition among Children of
3-6 Years of Age in the Study District1 2
Malay Savalia , Sumit Unadkat1 2Resident Doctor, Associate Professor, Shree M. P. Shah Government Medical College, Jamnagar, Gujarat, India
Correspondence : Dr Sumit Unadkat, E mail: [email protected]
Abstract :
Introduction : Children are generally most vulnerable and least able to help themselves. Malnutrition in
its several forms of under nutrition has been coined as “silent emergency” by United Nations Children's Fund
(UNICEF). Rural area shows inequalities in distribution of beneficiaries in form of structure, performance
and pattern of economic growth. Objectives : To estimate prevalence of Protein Energy Malnutrition (PEM),
to find out association between various factors and prevalence of malnutrition and to assess various aspects
of feeding of child with prevalence of malnutrition in children of 3-6 years of age. Method : A community
based cross sectional study was conducted on 3-6 years old children of rural area of study district. Results :
Out of total 894 children, 27.96% children were underweight and 6.71% children were severely
underweight. Malnutrition was seen in 42.78% children amongst those who did not consume calories as per
Recommonded Dietary Allowarce (RDA). Conclusion : Protein energy malnutrition in form of underweight
was present in more than one third children. Higher prevalence of malnutrition was found in children who
had birth weight of less than 2.5 kilograms, having interpregnancy interval of less than 24 months, of birth
order of 4 or more, who were breastfed for a period of 6 to 12 months, to whom complementary feeding was
started before the age of 6 months or who were partially immunized.
Key words : Children of 3-6 years of age, Protein energy malnutrition, Underweight
Introduction :
The hearts of most grown-ups melt at the sight of
small children who constitute one of the most
vulnerable sections of society. Children are our
supreme assets because children of today form the [1]
human resource of tomorrow. Children need extra
care because these are generally the most vulnerable
and least able to help themselves. Interventions early
in life can thus have lifelong benefits not just for [2]
individual but for society as a whole.
It is now an established fact that the brain
undergoes development and growth within the first
five years of a child's life. Therefore, malnutrition of
children under 5 years will surely lead to reduced
mental abilities affecting the intellectual capabilities
of the children when they reach adulthood. It is well
recognised and documented that preschool children
are a nutritionally vulnerable segment of population
and their growth and nutritional status are useful and
sensitive indicators for judging health of a community
[3, 4]or a nation. Early childhood is a period of rapid
growth and that nutritional insults during this period [5, 6]
result into under or over nutrition.
Malnutrition in its several forms of under
nutrition, namely wasting, stunting and underweight
has been coined as the “silent emergency” by the [7]
United Nations Children's Fund (UNICEF).
Malnutrition and infection are the two most
important factors that affect the growth of children.
Under nutrition is associated with impaired immune
function and consequent increased susceptibility to
infections; infections aggravate undernutrition; if this
vicious cycle continues it can result in death of the
child. Nutrition plays a key role in physical, mental
and emotional development of children and much
emphasis has been given to provide good nutrition to
growing populations especially in the formative years [8]
of life.
The subject gains more importance in rural
children, due to certain adverse realities like
Healthline Journal Volume 10 Issue 2 (July - December 2019)

:: 15 ::
intake, frequent infections, lack of access to health
services, illiteracy, unhygienic personal habits,
adverse cultural practices etc. Major factors which
modulate nutritional status during early childhood
include birth weight, infant and young child feeding
practices, morbidity due to infections, treatment of
infections, nutrition care during infection and
convalescence. Factors which are responsible for the
higher prevalence of malnutrition comprise low birth
weight, maternal health problems, delay in
introduction of complementary feeds, faulty child
care and other poor environmental conditions which [9]
are again more prevalent in rural areas. In
association to neonatal and infant mortality and
morbidity Low Birth Weight (LBW) is also associated
with growth retardation in children and development
of chronic diseases such as diabetes mellitus, [10]cardiovascular diseases and hypertension in adults.
Anthropometric assessment is widely used and often
regarded as the best single measure for health and [11]nutritional status in children.
Globally 52 million children under 5 years of age
are wasted, 17 million are severely wasted and 155
million are stunted. Around 45% of deaths among
children under-5 years of age are linked to [12]
undernutrition. According to National Family
Health Survey (NFHS) – 4, under-5 mortality in India
is 50 per 1000 live births, 38.4% children under 5
years of age are stunted, 21% are wasted, 7.5% are [13]
severely wasted and 35.7% are underweight.
Rural area shows inequalities in the distribution of
the beneficiaries in the form of structure,
performance and pattern of economic growth.
Present study was undertaken on a socio-cultural and
economically underprivileged group i.e. children of
3-6 years of age of rural area aiming to estimate
prevalence of Protein Energy Malnutrition (PEM)
among them. Apart from prevalence attempts are
made to identify relationship of birth outcome, socio
economic status, nutritional status, morbidity
pattern, immunization status and factors associated
with those on prevalence of Protein Energy
Malnutrition (PEM).
Objectives :
• To estimate the prevalence of Protein Energy
Malnutrition (PEM) in children of 3-6 years of age.
• To find out association between various factors
and prevalence of malnutrition in children of 3-6
years of age.
• To assess various aspects of feeding of child with
prevalence of malnutrition in children of 3-6
years of age.
Method :
Community based cross sectional study was
conducted from August 2017 to August 2018.
Present study was carried out on 3-6 years old
children of rural area of the study district. All the
children of 3-6 years of age group in the district were
the target population. Sample size was calculated for
the population of 157556 children as per Census
2011 Data. Prevalence of malnutrition among under- 5 children in rural area of the study district is 33.2%.
[14] With precision level of 4%, taking design effect of
1.5 and considering non-response rate around 10%
the final sample size was (n) ≈ 875 children of 3-6
years.
Two stage sampling technique was used. In first
stage, from total 6 talukas of the study district, 35
villages were selected by cluster sampling technique.
In second stage, from total 35 villages, 25 children of
3-6 years of age group were selected after obtaining
list of all children in the age group of 3-6 years from
the anganwadi by simple random sampling
technique from each village. Thus total 875 children
were selected from the study district as samples.
Data were collected in a predesigned and
pretested proforma after getting consent from the
parents and the information was obtained from
mother or primary care giver of child. Data collection
was divided in to interview schedule and
anthropometric measurements. Close ended
interview schedule was designed for the mother or
the primary care taker of children.
Weight, height and mid arm circumference were
measured of all study subjects as anthropometry is
very sensitive and useful tool to measure nutritional
status.
Data entry was done in EPI INFO software. Z
scores were compared for weight for age using
Microsoft Excel software. Data analysis was primarily
Savalia & Unadkat Prevalence of Protein Energy Malnutrition...

:: 16 ::
carried out in EPI INFO software. EPI INFO software
and Microsoft Excel were used to create graphs for
present study. Descriptive analysis was done for all
predictor and outcome variables. Chi square test was
used to find association between predictor and
outcome variables.
Under nutrition is the outcome variable in the
present study and it was calculated by parameter
WAZ (weight for age). WHO growth standards were
used to define under nutrition. Weight-for-age is a
composite index of height-for-age and weight-for-
height. It takes into account both acute and chronic
undernutrition. Children whose weight-for-age Z-
score was below minus two standard deviations (-2
SD) from the median of the reference population
were classified as underweight. Children whose
weight-for-age Z-score was below minus three
standard deviations (-3 SD) from the median were
considered severely underweight.
Table 1 : Age and sex wise distribution of children
Results :
Table 1 shows that about two-fifth of 894 children
i.e. 363 (40.6%) were in the age group of 4-5 years,
followed by 309 (34.56%) in the age group of 3-4
years and 222 (24.83%) in the age group of 5-6 years.
Observation also shows that out of 894 children 463
(51.79%) were males and 431 (48.21%) were
females.
Table 2 reveals that out of 894 children, 310
(34.68%) children were malnourished of whom 250
(27.96%) were underweight while 60 (6.71%) were
severely underweight. Sex wise distribution of
malnutrition was found to be somewhat higher in
females (35.27%) than males (34.13%).
Table 2: Distribution of children according to their Weight for Age (Underweight)
Weight for Age (Underweight)
Male Female Total No.
%
No.
%
No.
%
Normal
≥ -2SD
305
65.87%
279
64.73% 584
65.32%
Underweight < -2SD and ≥ -3SD
135
29.16%
115
26.68% 250
27.96%
Severe underweight
< -3SD
23
4.97%
37
8.58%
60
6.71%
Total 463 100.00% 431 100.00% 894 100.00%
Age Group Male Female Total
No. % No. % No. %
3-4 years 157 33.91% 152 35.27% 309 34.56%
4-5 years
195
42.12%
168 38.98%
363
40.60%
5-6 years
111
23.97%
111 25.75%
222
24.83%
Total
463
100.00% 431
100.00%
894
100.00%
Healthline Journal Volume 10 Issue 2 (July - December 2019)

Variables
Normal (%)
PEM (%)
Total (%) χ2 value
p
value
Social class
Upper
260 (73.03%)
96 (26.97%)
356 (100%) 15.522
0.000082
Lower
324 (60.22%)
214 (39.78%)
538 (100%)
Type of family
Nuclear
219 (62.93%)
129 (37.07%)
348 (100%)
4.171
0.124Joint
215 (64.18%)
120 (35.82%)
335 (100%)
Three generation
150 (71.09%)
61 (28.91%)
211 (100%)
Overcrowding
Present
354 (61.78%)
219 (38.22%)
573 (100%)
8.85
0.00293Absent
230 (71.65%)
91 (28.35%)
321 (100%)
Literacy status of mother
Illiterate
123 (58.29%)
88 (41.71%)
211 (100%)
6.027
0.0141Literate 461 (67.5%)
222 (32.5%)
683 (100%)
Occupation of mother
Home maker
467 (67.88%)
221 (32.12%)
688 (100%)
20.975
0.00032
Service
15 (88.24%)
2 (11.76%)
17 (100%)
Business
8 (80%)
2 (20%)
10 (100%)
Labourer
35 (47.95%)
38 (52.05%)
73 (100%)
Agricultural 59 (55.66%) 47 (44.34%) 106 (100%)
:: 17 ::
Table 3: Association between consumption of calories as per recommended daily
allowance (RDA) and malnutrition in children
According to table 3 prevalence of malnutrition was
higher (42.78%) in children who did not consume
calories as per Recommended Daily Allowance (RDA)
Table 4: Association between various demographic variables and malnutrition in children
Consumption of calories as per Recommended Daily
Allowance (RDA)
Normal PEM Total
No. % No. % No. %
Yes
279
77.29%
82
22.71%
361
100.00%
No
305
57.22%
228
42.78%
533
100.00%
Total
584
65.32%
310
34.68%
894
100.00%
Savalia & Unadkat Prevalence of Protein Energy Malnutrition...
for their age in comparison to those children who were
consuming calories as per RDA (22.71%). Observed
difference was statistically highly significant.
:: 18 ::
Table 4 shows association between various
demographic variables and malnutrition in children.
The prevalence of malnutrition was higher i.e. 39.78%
in children belonging to lower social class compared
to children belonging to upper social class (26.97%).
Observed difference was statistically highly
significant. Prevalence of malnutrition was higher i.e.
37.07% in children belonging to nuclear families,
followed by 35.82% and 28.91% in children
belonging joint families and three generation families
respectively. Observed difference was statistically not
significant. Distribution of children according to type
of house revealed that prevalence of malnutrition was
higher (38.22%) in children who dwelled in
overcrowded houses, while it was lower (28.35%) in
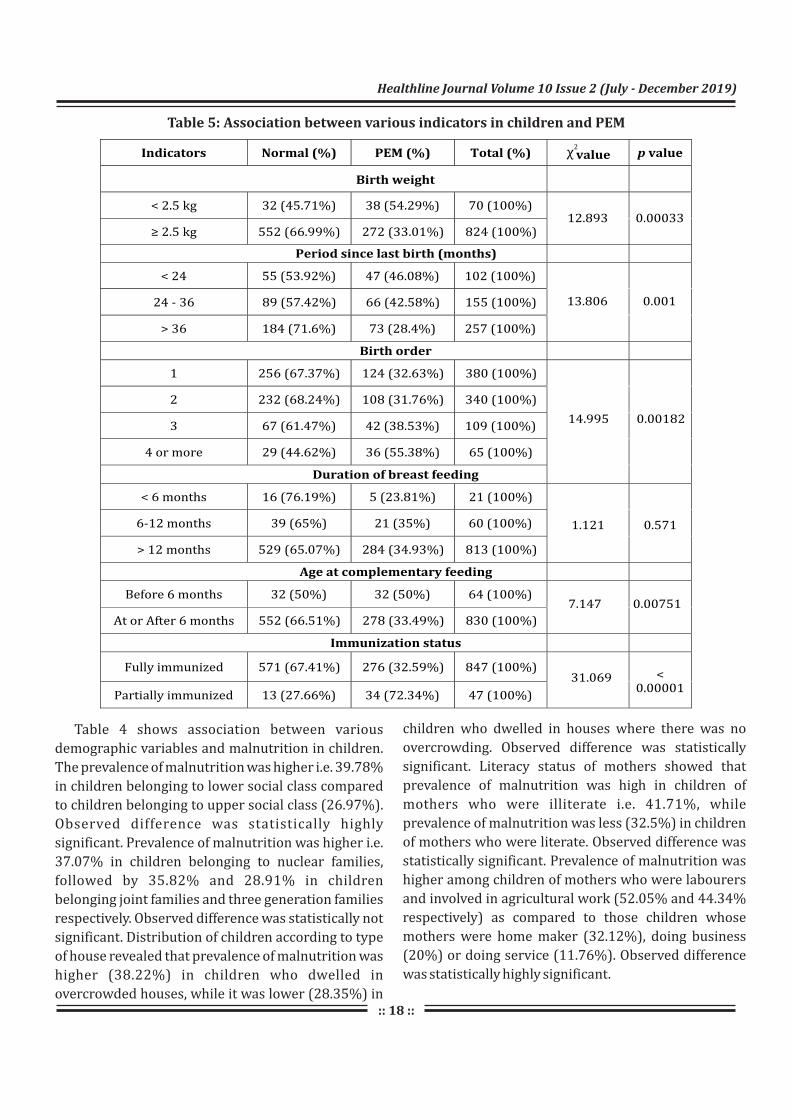
Table 5: Association between various indicators in children and PEM
Healthline Journal Volume 10 Issue 2 (July - December 2019)
children who dwelled in houses where there was no
overcrowding. Observed difference was statistically
significant. Literacy status of mothers showed that
prevalence of malnutrition was high in children of
mothers who were illiterate i.e. 41.71%, while
prevalence of malnutrition was less (32.5%) in children
of mothers who were literate. Observed difference was
statistically significant. Prevalence of malnutrition was
higher among children of mothers who were labourers
and involved in agricultural work (52.05% and 44.34%
respectively) as compared to those children whose
mothers were home maker (32.12%), doing business
(20%) or doing service (11.76%). Observed difference
was statistically highly significant.

:: 19 ::
Table 5 shows association between various
variables related to children and malnutrition in
them. Prevalence of malnutrition was higher i.e.
54.29% in children who had birth weight of less than
2.5 kilograms, as compared to children (33.01%)
who had birth weight of more than 2.5
kilograms.Observed difference was statistically
highly significant. In the present study, prevalence of
malnutrition was highest i.e. 46.08% in children
having interpregnancy interval of less than 24
months followed by 42.58% and 28.4% in children
having interpregnancy interval between 24 to 36
months and more than 36 months respectively.
Observed difference was statistically highly
significant. The prevalence of malnutrition was high
i.e. 55.38% in children of birth order of 4 or more
followed by 38.53% and 32.63% in children of birth
order 3 and 1 respectively. The prevalence of
malnutrition was lowest i.e. 31.76% in children of
birth order 2. Observed difference was statistically
highly significant. Results also revealed that the
prevalence of malnutrition was 35% in children who
were breastfed for a period of 6 to 12 months as
compared to 34.93% and 23.81% children who were
breast fed for more than 12 months and less than 6
months respectively. Observed difference was
statistically not significant . Prevalence of
malnutrition was less in children to whom
complementary feeding was started at or after the
age of 6 months (33.49%), whereas it was higher in
children to whom complementary feeding was
started before the age of 6 months (50%). Observed
difference was statistically significant. Immunization
status of children showed that the prevalence of
malnutrition was high in partially immunized
children i.e. 72.34%, while it was 32.59% in fully
immunized children. Observed difference was
statistically highly significant.
Discussion:
According to National Family Health Survey
(NFHS) – 4, 35.7% children under 5 years of age were
underweight and 11% children were severely
underweight. The results were similar to the present
study. National Family Health Survey – 4 (2015-
2016) reported that poor rich ratio was nearly 2.5 for
underweight category meaning lowest quintile
group has 2.5 times more prevalence of underweight
(48.6%) compared to highest wealth quintile group [15](20.1%). The results of the present study were
slightly different from NFHS – 4. The reason behind
higher number of children being malnourished
belonging to nuclear families was lack of knowledge
regarding proper feeding habits or working parents. [16]
Mahendraker et al (1996) found similar results in
their study that morbidity in children was more
common in overcrowded houses than in non
overcrowded house. A. Mittal and S. K. Ahluwalia [17](2007) in their study also found similar results of
high prevalence of malnutrition in children of
illiterate mothers (60.9%) as compared to children of
mother's education above high school level (21.2%). [17]
A. Mittal and J. Singh (2007) also found similar
results of high prevalence among children of working
mothers (46.15%) as compared with housewives
(37.8%).
[18]M. Shafiqur Rahman et al. (2016) found
similar results that the prevalence of malnutrition
was high (56.2%) in children with low birth weight as
compared to children (38.1%) having normal birth [19]
weight. J. Lakshmi A and K. Begum (2003) in their
study also found similar results of higher prevalence
of malnutrition with higher birth order, it was found
34% in birth order 1, 39% in birth order 2-3 and 56%
in birth order more than 4 or more. Victora CG et al. [20](1984) in their study found that prevalence of
malnutrition was smallest in those children breast-
fed for 3 to 6 months, but after this age nutritional
status appeared to be worse in those breast-fed for
longer. The results were similar to the present study.
The reason behind more number of children found
being malnourished who were breastfed for the
period of 6 to 12 months and for more than 12
months was that proper complementary feeding was
not initiated after the age of 6 months. Anita Khokhar [21]and S. Singh (2003) in their study also found
similar results that the prevalence of malnutrition
was high in children weaning early (64.8%) as
Savalia & Unadkat Prevalence of Protein Energy Malnutrition...

:: 20 ::
compared to children breast feed exclusively up to six [22]
months (35.2%). S. N. Dwivedi et al (1992) in their
study found that immunized children experience less
m a l n u t r i t i o n ( 5 7 . 0 % ) i n c o m p a r i s o n t o
unimmunized children (66.40%).
Conclusion:
Protein energy malnutrition in the form of
underweight was present in more than one third
children, while some children suffered from severe
underweight. Prevalence of malnutrition was
somewhat higher in female children than in male
children. Prevalence of malnutrition was highest in
the age group of 5 to 6 years and lowest in the age
group of 4 to 5 years. Children who did not consume
calories as per Recommended Daily Allowance (RDA)
for their age showed higher prevalence of
malnutrition in comparison to those children who
were consuming calories as per RDA. Prevalence of
malnutrition was more in children belonging to
social class I, belonging to nuclear families, who
dwelled in overcrowded houses, whose mother were
illiterate or of mothers who were labourer and
engaged in agricultural work. Higher prevalence of
malnutrition was found in children who had birth
weight of less than 2.5 kilograms, having
interpregnancy interval of less than 24 months, of
birth order of 4 or more, who were breastfed for a
period of 6 to 12 months, to whom complementary
feeding was started before the age of 6 months or
who were partially immunized.
Recommendations:
Maternal education is positively related with
child rearing practices and utilization of child health
services. So, female literacy should be improved for
promotion of child health, prevention of malnutrition
and associated morbidities and better utilization of
services. Mothers should be counselled regarding
young child feeding practices like importance of
colostrums, initiation of breast feeding, exclusive
breast feeding during antenatal period. Nutritional
education and time to time counselling of mothers
s h o u l d b e d o n e re g a rd i n g i n i t i a t i o n o f
complementary feeding and also the quality and
quantity of food that can be given after six months of
age. Health care providers like anganwadi workers,
ASHA and Female Health Workers need to be
sensitized time to time about infant and young child
feeding. Immunization protects against common
vaccine preventable diseases and also has protective
effects over stunting. Routine immunization
coverage should be maintained at high level and
services need to be strengthened. Regular growth
monitoring of each and every child by trained and
qualified health care providers is very essential for
early detection in growth faltering. Monitoring
activities for situation of malnutrition and factors
responsible for it at local levels should be
strengthened and supervised.
Declaration:
Funding : Nil
Conflict of Interest : Nil
References:
1. K. R. G. Nair. Malnourishment among Children in India: A
Regional Analysis. Economic and Political Weekly. 2007
September; 42(37): p. 3797-3803.
2. David Briggs. Making a Difference:Indicators to Improve
Children's. Imperial College London, Department of
Epidemiology and Public Health; 2003.
3. Assessing Child Malnutrition- Some Basic Issues(Sachdev).pdf
[Internet]. Google Docs. [cited 2019 Aug 27]. Available from:
https://drive.google.com/file/d/1teO5FJAV93Ex3OC_SSOF4o
PoCVFrh4Sw/view?usp=sharing&usp=embed_facebook
4. Bishnoi P, Sehgal S, Kwatra A, Chernysheva T, Gerasimenko T,
Apukhtina T. Anthropometric measurements of preschool
children as effected by socio-economic factors. :1.
5. Sen PK. Nutritional status of under five children in an urban
slum community of Calcutta. Indian J Public Health. 1994 Sep;
38 (3) : 113–4.
6. De Onis M, Monteiro C, Akré J, Clugston GA. The Worldwide
magnitude of protein-energy malnutrition : an overview from
the WHO Global Database on Child Growth. Bulletin of the World
Health Organization 1993 ; 71(6) : 703-712 [Internet]. 1993
[ c i te d 2 0 1 9 Au g 2 7 ] ; Ava i l a b l e f ro m : " h t t p s : / /
apps.who.int/iris/handle/10665/51422"https://apps.who.in
t/iris/handle/10665/51422
7. Bellamy C. The State Of The World's Children. United Nations
Children's Fund (UNICEF), Executive Director; 1998.
8. A. Kumar et al. Nutritional status assessment of under-five
beneficiaries of Integrated Child Development Services
Healthline Journal Volume 10 Issue 2 (July - December 2019)

:: 21 ::
program in rural Karnataka. Australian Medical Journal. 2010;
3(8): p. 495-498.
9. Malnutrition: a South Asian enigma. | POPLINE.org [Internet].
[cited 2019 Aug 27]. Available from: HYPERLINK
" h t t p s : / / w w w . p o p l i n e . o r g / n o d e / 2 7 4 0 8 3 "
https://www.popline.org/node/274083
10. Tessa Wardlaw et al. Low Birthweight : Country, Regional and
Global estmates. United Nations Children's Fund (UNICEF) and
World Health Organization (WHO); 2004.
11. M. De Onis. Measuring nutritional status in relation to mortality.
Bulletin of the WHO. 2000: p. 1271-1274.
12. Malnutrition [Internet]. [cited 2019 Aug 27]. Available from:
HYPERLINK "https://www.who.int/news-room/fact-
sheets/detail/malnutrition" https://www.who.int/news-
room/fact-sheets/detail/malnutrition
13. National Family Health Survey 4 - India Fact Sheet. Mumbai:
International Institute for Population Sciences, Ministry of
Health and Family Welfare, Government of India; 2015-2016.
14. National Family Health Survey 4 - Jamnagar District Fact Sheet.
Mumbai: International Institute for Population Sciences,
Ministry of Health and Family Welfare, Government of India;
2015-2016.
15. National Family Health Survey (NFHS-4) 2015-16. Deonar,
Mumbai 400088: International Institute for Population
Sciences; December 2017.
Savalia & Unadkat Prevalence of Protein Energy Malnutrition...
16. Mahendraker et al. A study of medico social profile of under five
children suffering from diarrhoeal disease. Indian Journal
Maternal and Child Health. 1991; 2(4): p. 127-130.
17. A. Mittal et al. Effect of Maternal Factors on Nutritional Status of
1-5-Year-Old Children in Urban Slum Population. Indian Journal
of Community Medicine. 2007 October; 32(4): p. 264-267.
18. M. Shafiqur Rahman et al. Association of Low-Birth Weight with
Malnutrition in Children under Five Years in Bangladesh: Do
Mother's Education, Socio- Economic Status, and Birth Interval
Matter? PLOS ONE. 2016 June; 10.
19. Jyothi Lakshmi A et al. Nutritional status of rural preschool
children - mediating factors. The Journal of Family Welfare.
2003 December; 49(2): p. 45-56.
20. Victora CG et al. Is prolonged breast-feeding associated with
malnutrition? American Journal of Clinical Nutrition. 1984
February; 39(2): p. 307-314.
21. Anita Khokhar et al. A study of malnutrition among children
aged 6 months to 2 years from a resettlement colony Delhi,
Department of community medicine, VVCM & Safadarjang
Hospital. Indian Journal of Medical Sciences. 2003; 57(7): p.
286-289.
22. S. N. Dwivedi et al. Malnutrition among the children in an urban
Indian slum and its associations. Indian Journal of Maternal and
Child Health. 1992 July-September; 3(3): p. 79-81.