Prevalence of Malnutrition and Its Associated Factors in Adult People Living With HIV/AIDS, In...
73
I Joint MPH program Hawassa University and Addis Continental Institute of Public Health Prevalence of Malnutrition and Its Associated Factors in Adult People Living With HIV/AIDS, In Hawassa Health Institutes, SNNPR, Ethiopia By: Sisay Tadesse ( Bsc Nurse) A thesis Submitted to: Hawassa University College of Medicines and Health Science School of Public Health and Environmental Health in Partial Fulfillment of the requirement for degree in Master of Public Health. September , 2014 Hawassa, Ethiopia
-
Upload
independent -
Category
Documents
-
view
3 -
download
0
Transcript of Prevalence of Malnutrition and Its Associated Factors in Adult People Living With HIV/AIDS, In...

I
Joint MPH program
Hawassa University and Addis Continental Institute of Public
Health
Prevalence of Malnutrition and Its Associated Factors in
Adult People Living With HIV/AIDS, In Hawassa Health
Institutes, SNNPR, Ethiopia
By:
Sisay Tadesse ( Bsc Nurse)
A thesis Submitted to:
Hawassa University College of Medicines and Health Science School
of Public Health and Environmental Health in Partial Fulfillment of
the requirement for degree in Master of Public Health.
September , 2014
Hawassa, Ethiopia

II
Joint Mph Program
Hawassa University and Addis Continental Institute of Public
Health
Prevalence of Malnutrition and Its Associated Factors in
Adult People Living With HIV/AIDS, In Hawassa Health
Institutes, SNNPR, Ethiopia
By:
Sisay Tadesse (Bsc Nurse)
Advisor: Achamyelesh G/Tsadik (Mph, PhD fellow)
September , 2014
Hawassa, Ethiopia

III
COLLEGE OF MEDICINE AND HEALTH SCIENCE SCHOOL OF PUBLIC HEALTH AND
ENVIRONMENTAL HEALTH GRADUATE PROGRAM
Approval of the Thesis by the advisor (s)
This is to certify that the thesis entitled “Prevalence of malnutrition and its associated factors in
adult people living with HIV/AIDS, in Hawassa health institutes, SNNPR, Ethiopia” submitted
in partial fulfillment for the requirement of master degree in public health, to the school of public
and environmental health, college of medicines and health science, is a record of original research
carried out by Sisay Tadesse Bekele, ID.No PGH/131/04 under my supervision and no part of the
thesis has been submitted for any degree or diploma.
The assistance and help received during the course of this investigation have been duly
acknowledged. Therefore, I recommended that the thesis be accepted as fulfilling the requirement.
Approved by:
_______________________ __________ ______________
Name of primary Advisor Signature Date
________________________ __________ ______________
Name of Co-advisor Signature Date
IV
HAWASSA UNIVERSITY COLLEGE OF MEDICINE AND HEALTH SCIENCE
SCHOOL OF GRADUATE STUDIES FINAL THESIS APPROVAL FORM
As a member of the board of examiners of the final MPH open defense, we certify that we have
read and evaluated the thesis prepared by Sisay Tadesse, under the title of “Prevalence of
malnutrition and its associated factors in adult people living with HIV/AIDS, in Hawassa health
institutes, SNNPR, Ethiopia”, and examiner the candidate. This is therefore, to certify that the
thesis has been accepted in partial fulfillment of the requirement for the degree of Master of public
health.
___________________ _____________ _______________
Name of the chairperson Signature Date
Achamyelesh G/Tsadik ______________ ______________
Name of Primary advisor Signature Date
__________________ ________________ _______________
Name of Internal examiner Signature Date
___________________________ ________________ _______________
Name of External Examiner Signature Date

V
Acknowledgements
First of all I am indebted to thank my very grateful Advisor Achamyelesh G/Tsadik (MPH, PhD
Fellow). The advice, encouragement and guidance she gave me was so helpful and valuable.
Starting from writing this thesis proposal throughout the whole thesis work, her knowledge and
many years of experience has been the light of my way. To study public health was my all night
dream and I am also grateful to thanks Hawassa University and Addis continental institute of public
health for making my dream real.
My appreciation also extends to Hawassa City Health office for providing me the necessary
information and facilitating conditions, while I was carrying out this study. I also thank Mr.
Sintayehu Assefa for his help during the fieldwork and the rest of my friends who devoted their
precious time helping me in every aspects of my work. I would also like to thank all the
interviewers (data collectors) for their unreserved commitment and careful field work. Data clerks
and nurses at Hawassa referral hospital, Adare hospital and Bushilo Health center ART unit deserve
my great acknowledgment. My gratitude goes to all of the study participants for their willingness
and participation in the interview. Special thanks also go to my wife Sr. Meaza Samuel for sharing
me her valuable ideas and support.

VI
TABLE OF CONTENTS
Contents
Acknowledgements ........................................................................................................................ V
TABLE OF CONTENTS ..................................................................................................................... VI
LIST OF TABLES ............................................................................................................................ VIII
LIST OF FIGURES ....................................................................................................................... IX
LIST OF APPENDEX .................................................................................................................... X
Acronyms ...................................................................................................................................... XI
Abstract .......................................................................................................................................... 1
1. Introduction ............................................................................................................................ 2
1.1. Statement of the problem ..................................................................................................... 2
1.2. Rationale of the study............................................................................................................... 3
2. Literature review ..................................................................................................................... 5
2.1. Food and nutrition security ................................................................................................. 5
2.2. HIV/AIDS and malnutrition .................................................................................................. 5
2.3. Nutrition and HIV/AIDS ....................................................................................................... 8
2.4. Nutrition and ART ................................................................................................................ 8
3. Objective .............................................................................................................................. 11
3.1. General Objective.............................................................................................................. 11
3.2. Specific Objective ............................................................................................................. 11
4. Methodology ......................................................................................................................... 12
4.1. Study setting ..................................................................................................................... 12
4.2. Study design ...................................................................................................................... 12
4.3. Study period: ..................................................................................................................... 12
4.4. Source population.............................................................................................................. 12
4.5. Study Population ............................................................................................................... 12
4.6. Inclusion and exclusion criteria ......................................................................................... 12
4.7. Sample size ....................................................................................................................... 13

VII
4.8. Sampling procedure ........................................................................................................... 15
4.9. Data collection procedure .................................................................................................. 17
4.10. Variable ........................................................................................................................ 18
4.9. Operation definition .......................................................................................................... 19
4.10. Data management .......................................................................................................... 19
4.11. Data analysis procedure ................................................................................................. 20
4.12. Ethical consideration ..................................................................................................... 21
5. Result.................................................................................................................................... 22
5.1. Socio-demographic characteristics Respondents ..................................................................... 22
5.3. Nutritional and food security status of patients’ On-ART and Pre-ART .................................. 27
5.4. Association between risk factors and Under Nutrition and over nutrition among adult PLWHA.29
5.4.1. Association factors between risk factors and under nutrition among adult PLWHA.............. 29
5.4.2. Association factors between risk factors and over nutrition among adult PLWHA ............... 32
6. Discussion............................................................................................................................. 35
7. Strength and weakness of the study ....................................................................................... 38
7.1. Strength of the study .............................................................................................................. 38
7.2. Limitation of the study ........................................................................................................... 38
8. Conclusion ............................................................................................................................ 39
9. Recommendation .................................................................................................................. 40
10. Reference .......................................................................................................................... 41
ANNEXES: .................................................................................................................................. 46

VIII
LIST OF TABLES
Page
Table 1. Socio-Demographic Characteristics of PLWHAs in Hawassa health facilities, Hawassa,
SNNPRS, Ethiopia, 2014………………………………………………………………………….23
Table 2. Health and clinical characteristics of HIV/AIDS clients in pre-ART and on ART care in
Hawassa Health facilities, Hawassa, SNNPR, 2014……………………………………………..26
Table 3. Nutrition and food security status of HIV/AIDS clients in pre-ART and on ART care in
Hawassa Health facilities, Hawassa, SNNPR, 2014………………………………………………28
Table- 4.Associated risk factors for under nutrition in HIV/AIDS clients in pre-ART and on ART
care in Hawassa Health facilities, Hawassa, SNNPR, 2014……………………………………….30
Table 5. Associated risk factors for over nutrition in HIV/AIDS clients in pre-ART and on ART
care in Hawassa health facilities, Hawassa, Ethiopia……………………………………………....33

IX
LIST OF FIGURES
Page
Figur 1. Vicious cycle of HIV and malnutrition (Source: FMOH, National Guidelines for
HIV/AIDS and Nutrition)……………………………………………………………………….6
Figure 2. conceptual framework of malnutrition among Pre-ART and On-ART patients……...10
Figure 3. Thematic presentation of participant selection or sampling procedure ………………16

X
LIST OF APPENDEX
Page
Annes I. English version questionnaire ………………………………………………………..47
Annex II: Guideline for anthropometric measurement…………………………………………53
Annex III. Amharic questionnaire ………………………………………………………………55
Annex IV. Hawassa City Maps ………………………………………………………………...62

XI
Acronyms
AIDS: Acquired Immune Deficiency Syndrome
AOR: Adjusted Odds Ration
ART: Anti Retro Viral Therapy
BMI: Body Mass Index
BWL: Body weight loss
CD4 cell: T-lymphocyte bearing CD4 receptor
CI: Confidence Interval
COR: Crude Odds ratio
EDHS: Ethiopia Demographic Health and Survey
FAO: Food for Agriculture Organization
HAART: Highly Active Anti Retro Viral Therapy
HIV: Human Immune deficiency Virus
Kg: Kilo gram
MAM: Moderate Acute Malnutrition
MDG: millennium Development Goals
MOH: Ministry of Health
M2: Meter square
OIs: Opportunistic infections
PLWHA: People Living With HIV/AIDS
SAM: Severe Acute Malnutrition
SNNP: Southern Nation Nationality people
TB: Tuberculosis
WHO: World Health Organization

1
Abstract
Background: HumanImmunodeficiencyVirus/AcquiredImmuno Deficiency Syndrome(HIV/AIDS)
and malnutrition effects are interrelated and exacerbate one another in a vicious cycle. Nutrition
insecurity is a serious problem of People Living with Human Immunodeficiency Virus (PLWHA)
and it is a silent factor that delays treatment outcomes. Currently due to the advent of antiretroviral
drug therapy and subsequent improved life expectancy, HIV has become a chronic disease. Long-
term complications related to diet, overweight, and obesity has gained a new importance. This
study will find new and additional facts on HIV/AIDS and Malnutrition through assess prevalence
of malnutrition and its associated factors among adult PLWHA in Hawassa health facilities.
Objectives: To assess the prevalence of malnutrition (over & under nutrition) & its associated
factor among adult PLWHA in Hawassa city health facilities, Hawassa, Southern Ethiopia
Methods: Facility based cross sectional study design was used to all ART clinics in Hawassa city,
from February 2014 to April 15, 2014. Systematic sampling method was used to get the study
subjects and the sample size was 719. A structured pre-tested questionnaire was used to collect
data. Descriptive statistics, Bivariate and multivariate logistic regression were used for data
analysis.
Result: A total of 715 study participants were interviewed; of them 16.6% were chronic energy
deficiency (BMI <18.5Kg/m2);15.1% from ART and 18.7% from Pre-ART care and 14.1% were
overweight and obese. The proportion of mild, Moderate and sever malnourished of the study
participants were 68.9%, 16% and 15.9% respectively. Nutritional support (AOR=2.353, 95%CI
(1.305, 4.242)) and greater than 10% Body Weight Loss (BWL) (AOR=3.967 , 95% CI (1.682,
9.358)) were significantly associated with under nutrition for ART and Pre-ART Clients. CD4
count less than 200 (AOR= 0.264, 95% CI (0.082,0.85); nutritional support ( AOR=0.164 , 95%CI
(0.039,0.694), Daily eating pattern of the last six month [AOR=0.183, 95% CI (0.042, 0.796)],
Eating difficulties [AOR= 0.488, 95% CI (0.26, 0.914)] and age between 30-39 [AOR= 5.273,
95% CI (2.291, 12.138)] and 40-49 [AOR=2.938 , 95% CI (1.437, 6.006) were significantly
associated with Over nutrition for both ART and Pre-ART clients.
Conclusion: In this study the prevalence of Malnutriton is lower than most of the study conducted
before. Nutritional support and body weight loss percentage of >10% were predictor of under
nutrition. CD4 count less than 200cell/mm3, getting nutritional support, Daily eating pattern of the
last six month, eating difficulties and age were predictor of over nutrition. The Nutritional
counseling should be strengthen and focus on the prevention of both types of malnutrition .

2
1. Introduction
1.1. Statement of the problem
Nutrition is a critical determinant of immune responses and malnutrition is the most common cause
of immune-deficiency worldwide(1). Human Immunodeficiency Virus/Acquire Immune Deficiency
Syndrome (HIV/AIDS) is associated with biological and social factors that affect the individual’s
ability to consume and utilize food and to acquire food. These biological and social factors lead to
poor nutritional status and weight loss, which is an important cause of morbidity in an individual’s
infected with HIV, resulting in a poor quality of life; weight loss is an important predictor of death
from AIDS (2). In the social context malnutrition aggravates the negative effects of HIV/AIDS on
food and nutrition security (3).
Malnutrition is one of the major complications of HIV infection and adding a fuel to the fire by
accelerating the progress of HIV infection to AIDS (4, 5, 6, and 7). The effect of malnutrition along
with HIV/AIDS patients are weakens the immune system and ability to fight the infection,
decreases CD4 count leads to appearance of Opportunities Infections (OIs), the appearance of OIs
leads to increase viral replication and further damage to the immune system, delays/weakens
reaction to infections and it also associated a patients with poor treatment outcome (7, 8, 9, 10, 11).
Even in the current era of highly active antiretroviral therapy (HAART), weight loss and muscle
wasting remain significant clinical problems (12). HIV/AIDS Patient with SAM are 4 to 5 times
more likely to die and with MAM are 2 to 3 times more likely to die within the first 90 days after
starting ART (11).
Barely two decades ago, had HIV disease deemed a terminal illness accompanied by severe
wasting. Today, HIV disease has become a chronic illness, largely due to the success of highly
active antiretroviral therapy (ART). In the U.S., this increased longevity has naturally led to HIV-
infected persons becoming increasingly overweight and obese, with rates of weight excess similar
to that of the general population. Weight excess in the general and HIV-infected populations is
associated with adverse medical conditions, such as hypertension, dyslipidemia and diabetes
mellitus (13).
HIV/AIDS and malnutrition effects are interrelated and exacerbate one another in a vicious cycle
(9, 11, and 12). HIV infection may result under nutrition as a result of increasing energy
requirements, insufficient dietary intake, frequent diarrhea and vomiting, OIs, malabsorption, and
altered metabolism (4, 7, 9, 10, and 11). HIV-infected adults have greater energy needs than
uninfected adults (10). The energy needs depend on whether the PLWHA is symptomatic or
asymptomatic. When the patients is asymptomatic (WHO stage 1), HIV-positive adults need to

3
increase energy intake by 10 percent. In the presence of symptoms (WHO stage 2 and above), HIV-
positive adults need to increase energy intake by 20 to 30 percent (4, 7, 10, 11, 15, 21).
Obesity is a major long-term concern in human immunodeficiency virus (HIV)-positive (HIV+)
persons given their increased cardiovascular risk , and the pathogenic link of obesity to diabetes
mellitus, cardiovascular disease and all-cause mortality(16.).
Empirical evidences on malnutrition among People Living with HIV/AIDS had shown that socio
demographic factors such as gender, Age, educational status, occupation and monthly income were
closely related determinants of nutritional status. Additionally, gastrointestinal symptom,
Adherence to HAART in past 6 month, CD4 cell count, Eating difficulty, ART status, ART
duration, number of previous opportunistic infections and WHO clinical AIDS stage were reported
to be risk factors for malnutrition among PLWHA(36, 37).
The aim of the study was to discover the prevalence of under nutrition, over nutrition (obesity and
over weight) among adult PLWHA in all reference to ART clinics in Hawassa, SNNPR, Ethiopia.
The study was also designed to predict those factors that have the potential to contribute to the
development of under and over nutrton in PLWHA. This is the first study on Over nutrition
(overweight and Obesity) among PLWHA Hawassa, Ethiopia.
1.2. Rationale of the study
The rate of malnutrition under nutrition among PLWHA is high in different settings and remains to
be the key challenge of to achieve MDG 6 in many countries of the world and worsen the disease
impact and poses significant challenge to HIV care and treatment. In Ethiopia, although not well
documented, and some studies were conducted in different health institutions depict that the rate of
under nutrition among PLWHA on ART and pre-ART is high. Malnutrition is a frequent, marker
for poor prognosis among HIV-infected subjects and it is critical underestimated factors
susceptibility to infection. Different scientific evidence is needed to discover and maintain possible
factors with malnutrition among PLWHA.
There is miniature evidence on the factors associated with over and underweight among PLHWA in
Ethiopian in general and in the study area in particular regarding to the nutritional status of peoples’
living HIV/AIDS in ART and pre-ART follow up.
The study conducted before in the same study area in 2012, only assessed under nutrition among
PLWHA but this study tried to overcome the gaps seen on the previous study by assessing the
prevalence and factors associated with both under and overweight among PLWHA on all ART
clinics (Pre-ART and ART). Inaddtion the studies conducted previously only assessed chronic

4
energy deficiency using BMI but this study determined both acute and chronic malnutrition using
both BWL percentage and BMI.
The findings of this study will be used as additional input to enhance nutritional status of HIV
patients on ART and Pre-ART. It will also improve adherence to and efficacy of ART at local
and/or national levels. Moreover it will be used as reference for other researcher/investigator.

5
2. Literature review
2.1. Food and nutrition security
According to FAO estimates that 870 million people worldwide, the vast majority live in
developing countries, were undernourished in 2010-2012 (17). In Ethiopia, approximately 49% of
the population is without adequate nutrition (11). The EDHS 2011 revealed that the level of under
nutrition among women and men in Ethiopia is relatively high, with 27 %of women and 37% men
either thin or undernourished—that is, having a body mass index (BMI) of less than 18.5 kg/m2.
And on the other hand, 5% overweight and 1% Obese women, 2 % are overweight or obese (BMI
25 kg/m2 or above) in Ethiopia (43). In addition to this, according to two studies in Ethiopia (Dire
Dawa and Jimma) the prevalence of food insecurity among PLWHA on ART were 90% and 63%
respectively (44, 45), which indicates that adults on ART are suffering from malnutrition.
2.2. HIV/AIDS and malnutrition
HIV/AIDS and malnutrition are highly prevalent in many parts of the world, especially in sub-
Saharan Africa (15). The twin global epidemics of HIV infection and food scarcity
disproportionately affect sub-Saharan Africa, and a significant proportion of patients who require
ART are malnourished because of a combination of HIV-associated wasting and inadequate
nutrient intake. Protein-calorie malnutrition, the most common form of adult malnutrition in the
region, is associated with significant morbidity and compounds the immunosuppressive effects of
HIV. A low body mass index (BMI), a sign of advanced malnutrition in adult, is an independent
predictor of early mortality (6 month) after ART initiation in several analyses (23).
Under nutrition and HIV status have negative feedback loops, resulting in severe effects on the
resilience of individuals, households, and communities. Such interactions manifest at both the level
of the HIV-infected individual and the level of the affected household in terms of clinical,
nutritional, quality-of-life, and economic outcomes (18). Malnutrition and HIV have similar
deleterious effects on the immune system (24-26). In both malnutrition and HIV there is reduced
CD4 and CD8 T-lymphocyte numbers (27, 28), delayed cutaneous sensitivity, reduced bactericidal
properties (25, 29).
This synergistic effects of malnutrition and HIV on the immune system occur in a vicious cycle
(Fig. 1) in which decreased immunity associated with both conditions leads to increased
susceptibility to infections (including HIV infection), morbidity, and mortality through OIs, fever,
diarrhea, loss of appetite, nutrient malabsorption and weight loss, that in turn lead to increased
nutrient requirements, which if not adequately met lead to more malnutrition (11, 15, 22, 30, 31).
Malnutrition, specifically wasting, is an important predictor of HIV progression to AIDS (32).

6
Fig 1. Vicious cycle of HIV and malnutrition (Source: FMOH, National Guidelines for HIV/AIDS
and Nutrition)
One of the possible signs of the onset of clinical AIDS is a weight loss of about 6-7 kg for an
average adult. So as evidence indicates that even relatively small losses in weight (5%) are
associated with decreased survival rate (21). When a person is already underweight, a further
weight loss can have serious effects. A healthy and balanced diet, early treatment of infection and
proper nutritional recovery after infection can reduce this weight loss and reduce the impact of
future infection(20).
A cross sectional study conducted in Iranian shows that the prevalence of malnutrition among
HIV/AIDS was 77% (33In Brazil a cross sectional study conducted the overall prevalence
malnutrition among patients with AIDS showed that 43% and severe malnutrition (BMI ,16
kg/m2) was 15% and 35% presented a weight loss greater than 20% and 55% presented a weight
loss greater than 10%(34). Another cross sectional study conducted in China the prevalence of
Malnutrition in hospitalized people living with HIV/AIDS 37.2% (47).
A Meta analysis from 11 sub Sahara African countries indicated that the prevalence of HIV-
related malnutrition among women (HIV-positive women with low body weight) varied widely,
from 0.6% in Lesotho to 16.9% in Burkina Faso and in all 11 countries yielded an overall pooled
prevalence of 10.3% and in the same study in Ethiopia was 13.2 % and in the same study
prevalence malnutrition was higher among women residing in rural areas than among women
residing in urban areas; and lower among women that were professionally employed than
unemployed( 35). Another study conducted in Sub Sahara Africa in 12 country on HIV and
Nutrition among women showed that HIV-positive status becomes significantly positively
associated with being underweight and the prevalence of under nutrition, or BMI below 18.50, is
highest in Ethiopia, at over 25 percent, and is also widespread in Burkina Faso, Niger, and Senegal,

7
where approximately 20 percent of women are underweight (36). Cross sectional study was
conducted in Botswana the prevalence of malnutrition among HIV/AIDS was 28.5% (37).
Institutional based cross sectional research was conducted in Dilla showed that the overall
prevalence of malnutrition among PLWHA was 12.3 % and Unemployment, WHO clinical stage
Four, gastrointestinal symptoms, previous (one) opportunistic infection and two & above previous
opportunistic infections were significantly associated with malnutrition among PLWHA (38).
While 7 % of the male had malnutrition and the proportion among female was 16% (38) and the
same study conducted Bahirdar showed that 25.5% were chronic energy deficiency
(BMI<18.5kg/m2); 36.5% from pre-ART, 63.5% from on ART care (39) and eating difficulty, Pre
ART clients and on ARV drugs < 12months were the predictors associated to malnutrition, besides
Females were most affected (56.7%) (39). Similar study conducted in Gondar referral hospital
showed that the prevalence of malnutrition among PLWHA was 27.8% and Income, duration of
ART in months, presence of eating problems and nutritional support were significantly associated
with malnutrition(40) . A case control study conducted in Northern Ethiopia the prevalence of
malnutrition with BMI < 18.5 Kg/m2 in the ART adherent group were 8% and non-adherent group
was 42.5% which was associated with non-adherence to ART. Inability to get enough and quality
food was also associated with non-adherence to ART (41). Another study conducted in Tigray,
Humera hospital in HIV positive women shows that the prevalence of under nutrition (Body mass
index < 18.5 kg/m2) was 42.3%. Severe, moderate and mild under nutrition was detected on 12%,
10% and 20.3% respondents, respectively. The prevalence of wasting (percentage body weight loss
>5%) was 75% (95% CI: 70.4% - 79.2%). Severe wasting was accounted for 26.9% of respondents
and house hold food insecurity, dietary diversity, anemia and absence of nutritional support were
found to be independent predictors of under-nutrition.(46) similar study conducted in India
(Kolkata)in HIV positive women showed that the prevalence of malnutrition 27.3% (BMI
<18.5kg/m2) (48)
The prevalence of adult malnutrition in sub-Saharan Africa is not easy to estimate and varies with
natural and man-made disasters, but an analysis of multiple demographic and nutrition surveys
anticipated that 10–20% of African women age 20–49 are malnourished (BMI <18.5kg/m2; similar
data for men not available (49).
A cohort study conducted in Swiss showed that the prevalence overweight/obesity was 38% in
2012 among PLWHA and .CD 4 counts, and being black are predicator of overweight/obesity
(51). A cross-sectional study was conducted in the city of São Paulo was showed that the
prevalence of central obesity was 45.7% among HIV/AIDS patients and it was associated with
greater consumption of lipids (52). A retrospective cross-sectional study conducted in Philadelphia

8
revealed that 14 % Obesity and 31 % overweight(53). A cross sectional study conducted in
Porto Alegre, Brazil, showed that 8.3% were obesity and 34.2% were overweight.(54).
2.3. Nutrition and HIV/AIDS
The HIV/AIDS epidemic has had a devastating impact on health, nutrition, food security and
overall socioeconomic development in countries that have been greatly affected by the disease (7).
Evidence has show important links between improved HIV outcomes and nutrition and although
epidemiological studies show that a strong relationship between micro-nutrients and HIV and
progression, and the efficacy of ARV drug treatment is greatly increased by sound nutrition (19).
Good nutritional is very important from the time a person is infected with HIV and also helps to
maintain good health and quality of life of the person suffering from AIDS (19, 20). People living
with HIV who are well nourished are able to work and contribute to family income, and thus
remain active and able to care for themselves and help with the care of children and other
dependants, have reduced illnesses and recover more quickly from infections, therefore reducing
costs for health care, maintain a good appetite and stable weight, Children can go to school
regularly, resulting in better education and development (19, 20).
The hormonal connection between immunity and nutrition becomes equally evident in nutritional
dysregulatory eating disorders such as obesity, which is becoming alarmingly common in high-
income countries, notably in the United States and United Kingdom, and is also spreading to
transitional societies at an unexpectedly high speed. (47)
Poor nutrition weakens the immune system leading to frequent illnesses, poor growth and
development in children, and an inability to replace and repair body cells and tissues, resulting in
severe weight loss (5). Poor nutrition quickens the progression from HIV to AIDS while good
nutrition slows it down (19). Infection with HIV damages the immune system, which leads to other
infections such as fever, diarrhea and other. These infections can lower food intake because they
both reduce appetite and interfere with the body’s ability to absorb food. As a result , the person
becomes malnourished, loses weight and is weakened (20). In addition inadequate nutritional status
may increase the risk of vertical HIV transmission by influencing maternal and child factors for
transmission (3).
2.4. Nutrition and ART
Antiretroviral therapy (ART) based on combinations of antiretroviral drugs is prescribed to
PLHIVs with immune suppression, signs and symptoms of AIDS based on clinical staging criteria,
or both (13). ART is essential to save lives of PLWHA, and clearly nutritional support alone cannot
substitute ART. Nutrition is an essential component of antiretroviral therapy (ART) interventions,

9
particularly in resource limited settings (15, 42). Because good nutrition can reinforce the effect of
drug, supporting the recovery of the defense system and improving overall well-being and also
ensures optimal benefits from the use of ART, and prevent transmission of HIV from mother to
child (10, 15, 20, 42). To be ART effective must be regular food supply, a good nutrition plan and
continuous support to ensure healthy eating. Food and nutrition play an inextricable role in the
bioavailability (i.e. absorption, digestion, metabolism, and transport) of drugs (15, 42). On other
hand poor nutrition reduces the body’s ability to absorb medication and individuals may find it
difficult to cope with the side effects of ART (15, 42). Due to the advent of antiretroviral drug
therapy (ART) and subsequent improved life expectancy, HIV has become a chronic disease. Long-
term complications related to diet, overweight, and obesity have gained a new importance. Among
the Nutrition for Healthy Living (NFHL) cohort in 1998, 27% of women were overweight and 21%
were obese while 33% of men were overweight and 6% were obese(50).
A person may be receiving treatment for the opportunistic infections and also perhaps combination
therapy for HIV; these treatments and medicines may influence eating and nutrition (21).
Furthermore, there are metabolic complications associated with long-term ART use that have
nutritional implications. Currently, body mass index (BMI) may be the ―best predictor‖ of mortality
in PLWHA. Thus, BMI and nutritional issues also need to be monitored once a patient is on
treatment (15).

10
Figure 2- conceptual framework of malnutrition among Pre-ART and On-ART patients
Dietary and food security
Related factors:
Inadequate dietary intake Change in dietary diversity Change dialy meal frequency Food security Nutritional support Nutritional counseling
Clinical and Health related factors
- CD4, WHO HIV stage, Opportunistic infections (tuberculosis, diaharia and others) , HARRT adherence, and ART status
- Care and support of PLWHA ( alchol, Drug addiction, HAART Adherence , cotrimoxazole prophlaxis
- Body weight loss
- Malabsorption
Socio-demographic factor
Age , Sex, Education,
residence, marital status, Religion,
Ocupation,
NUTRITION status of PLWHA
- Mortality
- Malnutrition among PLWHA
- Faster progression of HIV to AIDS
- Increase severity, duration and frequency of
OIs( morbidity) among PLWHA
Socio-economic , behavioral factors and Hygien and sanitation
- Disclosure
- Drinikng water
- Sanitation facilities
- Income
- Soft drug (Khat, shisha)
- Smoking
- Alcohol drinking
- Hard drug
-

11
3. Objective
3.1. General Objective
- To assess prevalence of malnutrition and its factors associated in adult PLWHA in ART and
pre-ART clinics at Hawassa health facilities, Hawassa, SNNPR, Ethiopia.
3.2. Specific Objective
- To determine the prevalence of under nutrition among PLWHA in Hawassa health facilities
- To determine the prevalence of over nutrition among PLWHA in Hawassa health facilities
- To assess factors associated with Under nutrition among PLWHA in Hawassa health facilities,
Hawassa, SNNPR, Ethiopia
- To assess factors associated with over nutrition among PLWHA in Hawassa health facilities,
Hawassa, SNNPR, Ethiopia

12
4. Methodology
4.1. Study setting
The study was conduct in Hawassa health institutions on those receiving ART and pre-ART
services in Hawassa, SNNP, Ethiopia. Hawassa is the capital city of SNNP Regional State, situated
275 Km southern of Addis Ababa. The area is dominated by hot climatic condition. The city is
divided into 8 sub city (7 urban and 1 sub city which is partially rural) and 32 total kebeles (21
urban and 11 rural kebeles).
According to 2007 CSA projected total population of the city for 2013/2014 were 341,659(175,773
males and 165,886 females) with estimated household of 69,727. The health service coverage of
Hawassa city was 92% with one referral hospital, four hospital, 8health centers, 12 Pharmacy, 13
Diagnostics laboratories and 15 health post owned by the government. Currently in Hawassa city
there are five health facilities were providing ART and pre ART service for a total of 8,609 clients
living with HIV/AIDS among which 4,841 clients of PLWHA on ART service and from the five
health facility Hawassa referral hospital comprise the highest number of PLWHA.
4.2. Study design
Facility based cross sectional study design was e used.
4.3. Study period:
February 1-April, 2014
4.4. Source population
All adult people living with HIV/AIDS who were enrolled to ART care for ART and Pre-ART
follow up in all Health facilities of Hawassa administrative town .
4.5. Study Population
All adult people (people aged 18 years and older) living with HIV/AIDS who were enrolled to
ART care clinic for ART and Pre-ART follow up in all Health facilities of Hawassa administrative
town, which were included in the study.
4.6. Inclusion and exclusion criteria
Inclusion
Those who were actively following HIV/AIDS chronic care in Hawassa health Facilities aged
18years and older, followed to ART clinic for ART and Pre- ART service was included.
13
Exclusion
Patients who were seriously ill and/or with spinal deformity , those who are not willing to include
in the study and Clinical records that did not have complete information to relevant the study was
excluded.
4.7. Sample size
Sample size was computed using the formula for single population proportion. The assumption of
prevalence of undernutrition among PLWHA patients is 25.5% which was obtained from study
conducted in Gondar, Gondar Referral Hospital (38) and prevalence of over nutrition among
PLWHA was 38%, whoch was obtained from the study conducted in Swiss . A 95% confidence
level and 3% precision was taken. The following formula was used
n = sample size
Z 1- /2= 95% CI two tailed (1.96)
d= desired precisions = 4%
P= prevalence of undernutrition among PLWHA = 27.8 % and prevalence of over nutrition among
PLWHA=38%
Accordingly the total sample size for this study will be 482 for under nutrition and 622 for over
nutrition.

14
Sample size for the third and fourth objective
Table-1 Sample size calculation summary
*Dilla
** Bahirdar
Using Epi-info version-7, and using different factors such Gastro intestinal symptom, ART
duration, Eating difficulty, ART status, symptoms 2wks prior to survey and WHO clinical stage
four of AIDS were Used to determine the sample size. And non response rate of 10% was made
the total sample size in the table above and from the calculated sample size for the two objectives
(prevalence and the factors) the largest sample size is 719, therefore for this study the final sample
size required was 719.
Factors Confiden
ce level
Power Exposed–
to-non
exposed
ratio
Prevalence
of
Malnutrition
among non
exposed
Odds
ratio
response
rate
Required
sample
size
Gastrointestinal symptom* 95% 80 1 8.56 % 5.3 10% 110
ART duration ** 95% 80 1 19.7% 1.7 10% 719
Eating difficulty ** 95% 80 1 20.4% 1.8 10% 570
WHO clinical stage of
AIDS *
95% 80 1 7.5% 7.01 10% 84
ART status** 95% 80 1 34.5% 1.77 10% 473
Symptoms 2wks prior to
survey**
95% 80 1 21.9 1.93 10% 433
15
4.8. Sampling procedure
From the total 8,609 HIV/AIDS patients who were in pre-ART and on ART chronic care, 4,851
were on ART and 3,758 were on Pre-ART care. Therefore in order to select 719 participants from
on ART and Pre-ART cases proportionately, we used mathematical equation. That means n1 =
(N1*nf)/Nt. At the same time, n2= (N2*nf)/Nt, where n1 is the required sample size from ART
care cases, n2 is the required sample size from Pre-ART care cases, nf is be the total required
sample size, N1 is the total number of ART care cases, N2 is the total number of pre-ART care
cases, and Nt is the total number of both on ART and on Pre-ART care cases. I.e., n1=
(4,851*719)/8,609= 405, and n2= (3758*719)/8,609= 314 cases will select proportionately. Since
nf= n1+n2, then a total of 405 cases from on ART care, and a total of 314 cases from Pre-ART care
were recruited making the final sample size 719.
A systematic sampling was used to select the participant for interview, anthropometric
measurement and clinical records review from register of each hospital/health center as a sampling
frame. The selected study participants of this study were used for face to face interview,
anthropometric measurement and record review. Sample size for each hospital/ health centers were
obtained in proportion to the number of PLWHA patients registered in each hospitals/health
centers. Sampling interval (Kth
) was determined by dividing the total PLWHA patients in each
hospital/health centers by the allocated sample size. From the total cases in sample the first clinical
record was selected by simple random sampling and every (kth) record was selected for gathering
information until the required sample was obtained.

16
Fig. 3. Thematic presentation of participant selection or sampling procedure
As you see on the above sampling procedure in two health facilities (Millennium and Tula Health
Center) the sample sizes are very small. Therefore I was proportional allocated the number in to the
rest of three health facilities.
Hawassa City ART sites health facilities
Hawassa Referal Hospital
5428
PLWHA
ART
3340
Sampled ART
(279)
Pre-ART
2088
Sampled Pre-ART
(174)
Adare Hospital
1723
PLWHA
ART
847
Sampled ART
(71)
Pre-ART
876
Sampled pre-ART
(73)
Millenium Health center
189
PLWHA
ART
48
Sampled ART
(4)
Pre-ART
141
Sampled Pre-ART
(12)
Bushilo Health center
1677
PLWHA
ART
586
Sampled ART
(49)
Pre-ART
556
Sampled Pre-ART
(47)
Tula health center
127
PLWHA
ART
30
Sampled ART
(2)
Pre-ART
97
Sampled Pre-ART
(8)
Total Sample (719)
715
4 Missing

17
4.9. Data collection procedure
Eight clinical nurse working in each health facilities were data collectors and 2 ART, Nutrition and
HIV/AIDS trained nurses or health Officer supervisors were recruited and train for 3 days with the
objective of standardizing the data collection instrument among the data collectors and providing
them with basic skill of communicating with the study participants and taking height and weight
measurement of the study participants.
The data collection process was followed daily by the supervisors and principal investigator. Socio-
demographic details such as Age, sex, marital status, level of education, religion, ethnicity,
residence, monthly income, source of water and occupation collect using face to face interview.
Similar instrument was used for the collection of gastrointestinal symptoms, eating difficulty, the
existence of tuberculosis and side effect of ARVs in the past six months from each participant.
Weights of participants were taken using standard beam balance and the scale was check at zero
before and after each measurement. Participants’ weight was measured after removal of heavy
clothes and recorded to the nearest 0.1KG.
Height measurement of participants was taken using the standard measuring scale. Participants’
takeoff his/her shoes, stand erect (knees straight and feet together), and look straight in horizontal
plain. The shoulder blades, buttocks, heels, and back of the head against the measuring board/ wall
and height will record to the nearest 0.01cm.
Body mass index (BMI), was calculated as weight in kilograms divided by the square of height in
meters (kg/m2). For the initial analysis, BMI was stratifying into the WHO criteria: <17 (moderate
to severe malnutrition), 17 to < 18.5 (mild malnutrition), >18.5 to 25 (normal nutrition) and >25
kg/m2 (overweight and obese) (6). Again this study was used the weight measured as a part of
routine monthly ART follow up activity to classify weight loss percentage of the study participant.
Percentage of body Weight Loss was calculated as follows: (Usual body weight - current
weight)/usual body weight x100%. It was classified in to four, normal (<5%), mild (5-10%),
moderate (10.1- 20%) and severe (>20%). Blood samples was drawn from subjects as part of
routine monthly ART follow up investigation to measure CD4 cell count. This study was used the
CD4 cell count to classify the patients into four categories according to WHO criteria; <200
cells/mm3 severe, 200–349cells/mm
3 as moderate or advance, 350-499 cells/mm
3 as mild and >500
cells/mm3 as not significant. Patients’ medical chart was reviewed for extraction of AIDS’ clinical
stage, ART duration, and history of previous opportunistic infections (OIs) in the last 6 months. In
addition, adherence to HAART was extract from each medical chart of individual patients which
was registered during their monthly spell of follow up. Similar to the previous opportunistic
infection, adherence status was delimited to the last six months follow up time. However, self

18
report adherence measurement technique was used by asking the patients about the number of times
they have missed taking their pills each month and recorded. In this study, the mean adherence to
HAART for each eligible record was operationally defined as ―good adherent‖ if the average
adherence was equal to or greater than 95% or < 3 doses missed per month), Fair adherent (85-
94% or 4-8 doses missed per month), or Poor adherent (less than 85% or > 9 doses missed per
month).
4.10. Variable
Independent
Socio demographic characteristics (Age, sex, marital status, level of education, religion,
ethnicity, residence, monthly income, occupation)
Clinical characteristics (CD4 count, WHO clinical stage of AIDS (I, II, III, IV), Side effect
of HAART (treatment of HIV), Opportunistic infections, Adherence to HAART (poor, Fair
and good))
Weight loss, Source of water
Disclosure
ART status
Gastrointestinal symptom (diarrhea, nausea and vomiting),
Eating difficulty (loss of appetite, swallowing difficulty, oral thrush and esophageal thrush)
Tuberculosis
Daily Meal Frequency
Dietary diversity
Food security
Dependent
Malnutrition (Over and undernutrtition)

19
4.9. Operation definition
Malnutrition: - Is the condition that results from an imbalance between dietary intake &
requirements. It includes both under nutrition & over nutrition.
Under weight (under Nutrition):- means the person BMI less than 18.49Kg/M2
Overweight (over nutrition):- means the person BMI greater than 25Kg/M2- 29.99Kg/M
2
Obese (Over Nutrition):- means the person BMI greater than 30 Kg/M2
Adult people: - age greater or equal to 18 years old
Adult Malnutrition: Adult malnutrition (under nutrition) is defined by using; BMI or body mass
index is called underweight or overweight. Under weight means the person BMI less than
18.49Kg/m2.
Therefore to say mild underweight (BMI is between 17-18.49 Kg/m
2), moderate
underweight (BMI must between 16 -16.99 kg/m2) and severe underweight (BMI must be less than
16 kg/m2).These three groups are considered to be chronically energy deficient (CED).
Adherence: - fulfillment with a drug regimen, as in taking medications properly and on time.
Opportunistic infection: - Illnesses caused by various organisms, some of which usually do not
cause disease in persons with normal immune systems. Persons living with advanced HIV infection
suffer opportunistic infections of the lungs, brain, eyes, and other organs. Opportunistic infections
common in persons diagnosed with AIDS include Pneumocystis carinii pneumonia; Kaposi’s
sarcoma; cryptosporidiosis; histo plasmosis; other parasitic, viral, and fungal infections; and some
types of cancers.
CD4 (T4): - A type of T cell involved in protecting against viral, fungal, and protozoa infections.
Meal frequency – is the number of reported daily eating occasions by household members in a
household experienced within a day. This does not include eating occasions by the household
members experienced outside home.
Dietary diversity – is the number of reported different foods and food groups consumed in a
household over a 24-hour period. This does not include food group consumed by the household
members outside home.
Household food security – the ability of household members to have the type of food they need at
the time they need it sufficiently to meet their dietary needs and food preferences for an active and
healthy life. It is assessed by asking whether the household has enough food or money to meet its
basic food needs and on the normal behavioral and subjective responses to that condition, as these
have been observed.
4.10. Data management
The questionnaire was adjusted and modified in to our context from previous literatures. It was
prepared first in English and then translated into the local language Amharic, and then retranslated

20
back to English by an expert who was fluent in both languages to maintain its consistency. To
achieve good quality data, training was provided to selected 8 data collectors and 2 supervisors for
two consecutive days on data collection tools and interview guide for questions on food security,
and diatery. Before the actual data collection pursue a pre-test of questionnaire was conducted on
both ART and PR-ART care clients in the nearby Yirgalem Hospital a week prior to the actual
survey and appropriate corrective measures was taken. .
Both principal investigator and supervisors check the collected data for completeness clarity,
consistency and accuracy on daily basis. Then questionnaires will be cleaned and coded for
computer data entry by principal investigator
4.11. Data analysis procedure
The collected data from the respondents were entered and cleaned in to Epi info version 3.5.1 and
imported to SPSS for windows version 16 for analysis.
To measure food security status of households number of affirmative answers given by study
participants to the 18 questions in the core module were added and depending on the presence of
children in the households (in the absence of children maximum possible affirmative answer would
be 10 because 8 questions were not applicable in households without children) the households were
classified as food secure (0-2 affirmative answers), food insecure without hunger (3-7 affirmative
answers in households with children and 3-5 in households without children), food insecure with
moderate hunger (8-12 affirmative answers in households with children and 6-8 in households
without children) and food insecure with severe hunger (13-18 affirmative answers in households
with children and 9-10 in households without children). The first and the last two categories were
combined throughout the analysis with the assumption that hunger is important in population where
food insecurity is a common phenomenon as in the participants of this study. Seven meal occasions
and 12 food groups were asked to assess the food frequency and dietary diversity situation of
households and those households with more than the median score of the meal frequency and
dietary diversity scores were classified as high meal frequency and high dietary diversity
households.
The data analysis was range from the basic description of outcomes to the identification of
statistically significant associations. First, the basic descriptive summaries of patients’
characteristics and outcome of interest was computed. Accordingly, simple frequencies, measure of
central tendencies and measure of dispersions were scrutinized. Second, bivariate analysis and
multiple logistic regression models were used to show the relation between malnutrition and
various associated factors. Finally, all explanatory variables that were statistically significantly
associated with the outcome variable in the bivariate analyses (P < 0.05) were entered in to logistic

21
regression model to identify independent variable of malnutrition. Confidence interval of 95% was
used to see the precision of the study and the level of significance was taken at α <0.05.
4.12. Ethical consideration
To conduct this research project ethical approval was secured from Hawassa University and Addis
continental Institute of public Health (ACIPH), Institutional review board [IRB] and permission
from Hawassa City Health Department and all Hawassa health facilities providing Pre-ART and
ART service was obtained.
During data collection process the data collectors were informed each study participant about the
purpose and anticipated benefits of the research project and the study participants were also be
informed on their full right to refuse, withdraw or completely reject part or all of their part in the
study and they were assured that their treatment and other benefits they gain from the hospital,
health center and/or other organizations were not be influenced by their participation in the study.
Finally, they were asked for their informed written consent to participate or not in the study and for
their willingness on use of their files and records for the study. Interviews and measurements were
conducted in a quiet, ventilated, lighted room to respect the study participants’ anonymity and
boost their confidence on the study.
During the interview and measurements study participants were provided with general information
by interviewers on the means of improving their household food and nutrition security status and on
the mechanisms to promote their health and maximize their well being and adherence to ART.

22
5. Result
5.1. Socio-demographic characteristics Respondents
A total of 719 PLWHA (405 on ART and 314 Pre-ART) were approached and 715(405 On-ART
and 310 Pre-ART) consented to participate in the present study giving a response rate of 99.4%, of
which females accounted 264 (36.9%) On ART and 192(26.9%) from Pre-ART. The mean age of
the study participants was 34.56 + 8.5 years with 188 (26.3%) on ART and 136 (19%) from Pre-
ART of them belonging to the age group 30 – 39 years.
Among 715 participants 239 (33.4%) On ART and 137 (19.2%) Pre-ART were orthodox and
140(19.6%) on ART and 136 (19%) Pre-ART were protestant. The majority of the study
participants were married, 209 (29.2%) On ART and 192 (26.9%) Pre-ART.
About 378 (52.8%) On ART and 255 (35.7%) Pre-ART) study participants claimed that they are
disclosed their HIV serum status to at least one person other than their counselor/doctor and from
the total study participants the majority were from urban dwellers 386 (54%) On ART and 270
(37.7%) from Pre-ART.
From the total study participants 394 (55.1%) On ART and 282 (39.4%) Pr-ART was received
drinking water from improved source but 250 (35%) On ART and 213 (29.8%) Pre-ART of the
respondent have unimproved sanitation facilities in their household. Regarding the main source of
food in the house hold 382 (53.4%) On ART and 264 (36.9%) Pre-ART of the respondents was got
their food from purchased from market.

23
Table 1. Socio-Demographic Characteristics of PLWHAs in Hawassa health facilities, Hawassa,
SNNPRS, Ethiopia, 2014.
Variable (n=715)
ART (405) Pre-ART (310) Total (715)
n (%) n (%) N (%)
Sex Male 141(19.7%) 118 (16.5%) 259(36.2%)
Female 264(36.9%) 192(26.9%) 456 (63.8%)
Age 18-29 107(15%) 100 (14%) 207(29.0%)
30-39 188 (26.3%) 136 (19.0%) 324(45.3%)
40-49 76(10.6%) 60(8.4%) 136(19.0%)
>=50 34(4.7%) 14(2.0%) 48(6.7%)
Religion Orthodox 239(33.4%) 137(19.2%) 376(52.6%)
Protestant 140(19.6%) 136 (19.0%) 276(38.6%)
Catholic 1(0.1%) 9 (1.3%) 10(1.4%)
Muslim 21(2.9%) 27 (3.8%) 48(6.7%)
Other* 4 (0.6%) 1(0.1%) 5(0.7%)
Current Educational
level
Not Able to read &write 48 (6.7%) 36 (5.0%) 84(11.7%)
Able to read and write 9 (1.3%) 13 (1.8%) 22(3.1%)
Grade 1-4 46 (6.4%) 56 (7.9%) 102(14.3)
Grade 5-8 129(18.0%) 100 (14.0%) 229(32.0%)
Secondary school 122 (17.1%) 71 (9.9%) 193(27.0%)
College/University 51 (7.1%) 34 (4.8%) 85(11.9%)
Ethnicity Sidama 42 (5.9%) 80 (11.2%) 122(17.1%)
Wolayta 86 (12.0%) 74 (10.4) 160(22.4%)
Gurage 42 (5.9%) 34 (4.7%) 76(10.6%)
Amahara 139 (19.5%) 63 (8.8%) 202(28.3%)
Gedoe 3 (0.4%) 2 (0.3%) 5(0.7)
Oromo 75 (10.5%) 48 6.7%) 123(17.2%)
Other** 16 (2.2%) 11 (1.6%) 27(3.8%)

24
Table 1. Socio-Demographic Characteristics of PLWHAs in Hawassa health facilities,
Hawassa, SNNPRS, Ethiopia, 2014 continued
Variable (n=715)
ART (405) Pre-ART (310) Total (715)
n (%) n (%) N (%)
Marital status Married 209 (29.2%) 192 (26.9%) 401(56.1%)
Unmarried 54 (7.6%) 40 (5.5%) 94(13.1%)
Divorced 76 (10.6%) 44 (6.2%) 120(16.8%)
Widowed 66 (9.2%) 34 (4.8%) 100(14.0%)
Disclosure No 27 (3.8%) 55 (7.7%) 82(11.5%)
Yes 378 (52.8%) 255 (35.7%) 633(88.5%)
Current Residence Urban 386 (54.0%) 270 (37.7%) 656(91.7%)
Rural 19 (2.7%) 40 (5.6%) 59(8.3%)
Main Occupation Student 3 (0.4%) 4 (0.6%) 7(1%)
Casual worker 96 (13.4%) 72(10.1%) 168 (23.5%)
Employed 106(14.8%) 66 (9.3%) 172 (24.1%)
Farmer 15 (2.1%) 26(3.6%) 41 (5.7%)
Business (Self employed) 111 (15.5%) 80 (11.2%) 191(26.7%)
Unemployed 74(10.3%) 62(8.7%) 136 (19%)
Main source of food
for the house hold
Purchase 382(53.4%) 264 (36.9%) 646 (90.3%)
Household farm/garden 21(2.9%) 42(5.9%) 63 (8.8%)
Others*** 2(0.28%) 4(0.56%) 6 (0.84%)
Main source of
drinking water
Improved 394(55.1%) 282(39.4%) 676 (94.5%)
Unimproved 11(1.5%) 28(3.9%) 39 (5.4%)
Monthly Income <=200 21 (2.9%) 17(2.4%) 38 (5.3%)
201-700 164(22.9%) 99 (13.9%) 263 (36.8%)
701-1500 130(18.2%) 111 (15.5%) 241 (33.7%)
>1500 90 (12.6%) 83 (11.6%) 173 (24.2%)
Sanitation facility unimproved 250(35%) 213 (29.8%) 463 (64.8%)
Improved 155(21.7%) 97(13.5%) 252 (35.2%)
Key: *: Johva, aethist, Adventist,
**: Hadiya, Kembata, Somalia, Tigrey, Gamo
*** Welfare/NGO support, Relatives and friends

25
5.2. Health and clinical characteristic of the study participants PLWHA
Regarding health related characteristics of PLWHA (405) 56.6% of the study participants were
received ART, of which 73.3% of the respondents were received ART greater than 12 months and
from the total ART user 93.6% of them were good adherence to HAART in the past six month.
From the total interviewed study participants 36.5%(261) and 31.7%(227) were on World Health
Organization (WHO) clinical stage of Acquired Immuno Deficiency syndrome ( ADIS) one and
two respectively, 253 (35.4%) had CD4 count between 350-499cells/mm3
and 36.5%(261) above
500cells/mm3.
More than 1/3rd
(252) ( 13.8%(99) from On-ART and 21.4% (153)from Pre-ART) of the study
participants were developed eating difficulties in the past six month and among them more than
76% (193) (28.6% (72) from On –ART and 48% (121) from Pre-ART) of them complained loss of
appetite. Of the total study participants 24.3% (174) of were complains gastrointestinal symptom
(9.1% (65) from On-ART and 15.2% (109) Pre-ART).

26
Table 2. Health and clinical characteristics of HIV/AIDS clients in pre-ART and on ART
care in Hawassa Health facilities, Hawassa, SNNPR, 2014.
Variable (715) ART (405) Pre-ART (310) Total (715)
n (%) n (%) N (%)
ART Status 405
(56.6%)) 310 (43.4%) 705(100%)
Gastrointestinal
Symptom
No 340 (47.6%) 201(28.1%) 541 (75.7%)
Yes 65 (9.1%) 109 (15.2%) 174 (24.3%)
Eating Difficulty No 306 (42.8%) 157 (22%) 463 (64.8%)
Yes 99 (13.8%) 153 (21.4%) 252 (35.2%)
Kind of Eating
Difficulty
Loss of appetite 72 (28.6%) 121 (48%) 193 (76.6%)
Nausea/ Vomit 27 (10.7%) 27 (10.7%) 54 (21.4%)
Others* 0(0%) 5 (2%) 5 (2%)
Pulmonary
Tuberculosis
No 399 (55.8%) 282 (39.4%) 681 (95.2%)
Yes 6 (0.8%) 28 (3.9%) 34 (4.8%)
Tuberculosis
Drug Side Effect
No 6 (17.6%) 25 (73.5%) 31 (91.2%)
Yes 0(0%) 3 (8.8%) 3 (8.8%)
Unwell in the
Past 2 weeks
No 346 (48.4%) 218 (30.5%) 564 (78.9%)
Yes 59 (8.3%) 92 (12.8%) 151 (21.1%)
Adherence to
HAART in past 6
month
Good adherence 379 (93.6%) 0 379 (93.6%)
Poor adherence 26 (6.4%) 0 26 (6.4%)
WHO ADIS
stage
Stage I 169 (23.6%) 92 (12.9%) 261 (36.5%)
Stage II 79 (11%) 148 (20.7%) 227 (31.7%)
Stage III 135 (18.9%) 67 (9.4%) 202 (28.3%)
Stage IV 22 (3.1%) 3 (0.4%) 25 (3.5%)
CD4 count
<200 cells/mm3 44 (6.2%) 17 (2.4%) 61 (8.5%)
200-349cells/mm3 101 (14.1%) 43(6%) 144 (20.1%)
350-499 cells/mm3 127 (17.8%) 124 (17.3%) 251 (35.1%)
>500 cells/mm3 133 (18.6%) 126 (17.6%) 259 (36.2%)
ART Duration < or = 12 month 108 (26.6%) 0 108 (26.6%)
> 12 months 297 (73.4%) 0 297 (73.4%)
Key: * Swallowing difficulty, oral or/ and esophageal thrush

27
5.3. Nutritional and food security status of patients’ On-ART and Pre-ART
The nutritional status of patients among On-ART and Pre-ART follow up care were determined
using BMI in Hawassa health facilities; the overall prevalence of under nutrition 16.6% (119), of
which 15.1% on _ART and 18.7% on Pre-ART were undernourished.
Of which 2.5 % On-ART and 2.6% Pre-ART were severe malnourished, 2.2 % On-ART and 3.2%
Pre-ART were Moderate malnourished and 10.4% On-ART and 12.9% Pre-ART were mild
malnourished.
In addition to underweight or under nutrition, the present study was found the prevalence of over
nutrition (overweight and Obese) was 14.1% (101), of which 14.3% On-ART and 13.9% Pre-ART
were overweight and Obese. Among the total study participants had 11% of overweight and 3.1%
obese.
The study also sought food security situation of households of PLWHA and it was found that close
to 65%; 64.2 % from On-ART and 65.5% from Pre-ART of the households were food insecure
(with Mild, with moderate or severe hunger). Of the total study participant of PLWHA in Hawassa
health facilities 55.1 % (28.7% (205) On ART and 26.4% (189) Pre-ART) were ate less or three
times daily. Furthermore the present study was seen the nutritional status of PLWHA in Hawassa
health facilities using percentage of Body Weight Loss. Therefore accordingly 16.6% of PLWHA
were Undernourished; 8.9% from ART and 26.8% from Pre-ART care.
Out of the total PLWHA more than 85% (50.6% from On-ART and 34.7% from Pre-ART) the
study participants were counseled for nutrition and 88.1% (50.1% from On ART and 38 % from
Pre-ART) PLWHA were not got nutritional support. From the entire interviewed participants
57.5% (32.9% from On-ART and 24.6% from Pre-ART) of them were changed their feeding style
after knowing the HIV sero status.

28
Table 3. Nutrition and food security status of HIV/AIDS clients in pre-ART and on ART care
in Hawassa Health facilities, Hawassa, SNNPR, 2014
Variable ART(405) Pre-ART(310) Total (715)
n (%) n (%) N (%)
Daily Meal
Frequency
Less than two time 2 (0.3%) 2(0.3%) 4 (0.6)
Two or three times 203(28.4%) 187 (26.1%) 390 (54.5)
More than three times 200(28%) 121(16.9%) 321 (44.9)
Daily Eating
Pattern the Last
6 months
Three meals & above 341(47.7%) 236(33%) 577 (80.7)
Two meals & eating
between meals
23(3.2%) 23(3.2%) 46 (6.4)
Two meals or less 41(5.8%) 51(7.1%) 92 (12.9)
Body Weight Loss
percentage <5% 369(51.6%) 227(31.7%) 596 (83.4)
5-10% 28(3.9%) 61(8.5%) 89 (12.4)
>10 8(1.1%) 22(3.1%) 30 (4.2)
Food Security Food Secure 145(20.3%) 107(14.9%) 252 (35.3)
Food Insecure without Hunger 123(17.2%) 78(10.9%) 201 (28.1)
Food insecure with moderate
Hunger 50(7%) 56(7.8%) 106 (14.8)
Food Insecure with sever
Hunger 8(12.2%)7 69(9.6%) 156 (21.8)
Dietary Diversity Low dietary Diversity 12(1.7%) 14(1.9%) 26 (3.6)
Medium Dietary Diversity 119(16.6%) 91(12.7%) 210 (29.4)
High Dietary Diversity 274(38.3%) 205(28.7%) 479 (67)
Body Mass Index <15.99 10(1.4%) 8(1.1%) 18 (2.5)
16-16.99 9(1.3%) 10(1.4%) 19 (2.7)
17-18.49 42(5.9%) 40(5.6%) 82 (11.5)
18.5-24.99 286(40%) 209(29.2%) 495 (69.2)
>=25 58(8.1%) 43(6%) 101 (14.1)
Nutritional Support No 358(50.1%) 272(38%) 630 (88.1)
Yes 47(6.6%) 38(5.3%) 85 (11.9)
Changing feeding
style after Knowing
HIV status
No
170(23.8%) 134(18.7%) 304 (42.5)
Yes 235(32.9%) 176(24.6%) 411 (57.5)
Nutritional
counseled
No 43(6%) 62(8.7%) 105 (14.7)
Yes 362(50.6%) 248(34.7%) 610 (85.3)

29
5.4. Association between risk factors and Under Nutrition and over nutrition
among adult PLWHA.
5.4.1. Association factors between risk factors and under nutrition among adult
PLWHA.
Logistic regression analysis was used to identify the variables which influence malnutrition. The
study found that getting nutritional support and Body Weight Loss (BWL) greater than 10% has
significantly associated with Malnutrition for both Pre-ART and ART of PLWHA in Hawassa city
health facilities. In this study those who had Body Weight Loss percentage (>10%) was 3.9 times
more likely develop Malnutrition than that of normal body weight loss (<5%) (AOR=3.967, 95%
CI (1.682, 9.358) for ART and Pre-ART of PLWHA. From this study getting nutritional support
were 2.3 times higher risk of developing malnutrition than not getting nutritional support (
AOR=2.353,95%CI(1.305, 4.242).

30
(Table- 4.) Associated risk factors for under nutrition in HIV/AIDS clients in pre-ART and
on ART care in Hawassa Health facilities, Hawassa, SNNPR, 2014.
Variable prevalence of
Malnutrition
COR (95%) AOR (95%)
Yes No
WHO ADIS
Stage
stage IV 3 22 1.05(.296 , 3.720) 2.217 (0.568, 8.657)
Stage III 49 153 2.466(1.498, 4.058) 1.348( 0.336, 5.413)
Stage II 37 190 1.499(.893,2.518) 1.315 (.326,5.304)
Stage I 30 231 1 1
Nutritional
counseled
Yes 91 519 0.482(0.296, 0 .784) 0.731 (0.388, 1.377)
no 28 77 1 1
Nutritional
Support
Yes 29 56 3.107(1.883, 5.127) 2.353(1.305, 4.242)*
no 90 540 1 1
current Residence Rural 18 41 2.412(1.333, 4.367 1.145 (0.403, 3.253)
Urban 101 555 1 1
Main source of
drinking water
unimproved 16 23 3.87(1.977, 7.575) 0.697 (0.287, 1.69)
improved 103 573 1 1
Taking
Cotrimoxazole
yes 73 286 1.72(1.150, 2.572) 1.129 (0.705,1.809)
no 46 310 1 1
Gastrointestinal
Symptom
yes 46 128 2.304(1.518, 3.498) 1.092 (0.581, 2.054)
No 73 468 1 1
Eating
Difficulties
Yes 63 189 2.423(1.625,3.611) 1.209 (0.69, 2.121)
No 56 407 1 1
Pulmonary
Tuberculosis
Yes 13 21 3.358(1.631, 6.913) 1.272 (0.529, 3.059)
No 106 575 1 1

31
Table.4. Associated risk factors for under nutrition in HIV/AIDS clients in pre-ART and on
ART care in Hawassa Health facilities continued
Variable
prevalence of
Malnutrition
COR (95%) AOR (95%)
yes No
Daily Eating
Pattern the Last
6 months
Two meals or less 30 62 3.05(1.837, 5.011) 0.626(0.248, 1.581)
Two meals & eating
between meals
10 36 1.751 (0.836,3.669) 0.616 (0.334, 1.134)
Three meals & above 79 498 1 1
Number of OI
in the past 6
months
2+ 30 81 2.380(1.415, 4.001) 0.809 (0.415, 1.578)
1 times 42 213 1.267( 0.807,1.990) 0.93 (0.446, 1.939)
None 47 302 1 1
Food security Food Insecurity with
Severe Hunger
37 119 2.487(1.451, 4.262) 0.938 (0.482, 1.824)
Food insecurity with
moderate Hunger
22 84 2.095( 1.136, 3.864) 0.951 (0.517, 1.748)
Food insecurity
without Hunger
32 169 1.515(0.878, 2.613) 0.714 (0.377, 1.352)
Food secure 28 224 1 1
Unwell in the
last 2 weeks
Yes 38 113 2.005(1.296, 3.102) 1.272 (0.712, 2.274)
No 81 483 1 1
Body Weight
Loss
percentage
>10% 15 15 6.74(3.169,14.336) 3.967 (1.682, 9.358)*
5-10% 27 62 2.935(1.76, 4.895) 1.75(0.953, 3.212)
<5% 77 519 1 1
Main source of
food
others 2 4 2.796(0.505, 5.473) 1.271 (0.152, 10.63)
Household
farm/garden
19 44 2.415(1.353, 4.310) 0.809 (0.12, 5.451)
Purchase
(Market/grocery
store)
98 548 1
*P-value < 0.05

32
5.4.2. Association factors between risk factors and over nutrition among adult
PLWHA .
Logistic regression analysis was used to identify the variables which influence over nutrition. The
study found that CD4 count less than 200cell, getting nutritional support, ,age, eating difficulties
and Daily Eating Pattern the Last 6 months has significantly associated with Malnutrition (over
nutrition) for both Pre-ART and ART of PLWHA in Hawassa city health facilities. In this study
those who had CD4 count less than 200 is significantly associated with the over nutrition (AOR:
0.264, 95% CI (0.082, 0.85) for ART and Pre-ART of PLWHA. Who had CD4 count less than 200
reduced the risk of developing over nutrition by odds of 0.264.
Similarly, getting nutritional support is significantly associated with the development of over
nutrition of PLWHA (AOR= 0.164, 95%CI (0.039, 0.694), which means getting nutritional support
is reduce the risk of developing over nutrition by odds of 0.164. In this study being age 30-39
[AOR= 2.336, 95% CI (1.256, 4.342)] and 40-49 [AOR= 2.938, 95% CI (1.437, 6.006)] are 2.3 and
2.3 times higher risk of developing over nutrition than age 20-29 respectively. Additionally having
eating difficulties [AOR=0.488, 95%CI (0.26, 0.914)] is protective for over nutrition. Who had a
problem of eating difficulties were reduced the risk of developing over nutrition by odds of 0.488.
Similarly Two meal or less daily eating pattern the last six month [AOR=0.183, 95%CI (0.042,
0.796)] is protective for over nutrition. Those who had two meal or less daily eating pattern in the
last six month reduced the risk of developing over nutrition by odds of 0.183.

33
Table 5. Associated risk factors for over nutrition in HIV/AIDS clients in pre-ART and on
ART care in Hawassa health facilities, Hawassa, Ethiopia.
Variable Prevalence of
Over nutrition
COR (95%) AOR (95%)
Yes No
No of Opportunistic
Infection
2 or more 15 96 0.738(0.401, 1.358) 1.65(0.786, 3.462)
1 25 230 0.513(0.312,0.843) 0.611(0.358,1.042)
None 61 288 1 1
Nutritional counseled Yes 95 515 3.044(1.298, 7.140) 2.426(0.993, 5.928)
no 6 99 1 1
CD4 count <200 cells/mm3 4 57 0.325(0.112, 0.940) 0.264( 0.082,0.85)**
200-349
cells/mm3
23 121 0.880(0.509,1.523) 0.872(0.453, 1.68)
350-499
cells/mm3
28 223 0.581(0.351,0.964) 0.615(0.356,1.064)
>500 cells/mm3 46 213 1 1
Ever used Soft Drug Yes 4 86 0.253(0.091,0.706) 0.347(0.118,1.016)
No 97 528 1 1
Daily Eating Pattern
the Last 6 months
Two meals or
less
2 90 0.114(0.028,0.472) 0.183(0.042,
0.796)**
Two meals &
eating between
meals
5 41 0.627(0.241,1.627) 0.991(0.355,2.768)
Three meals &
above
94 483 1 1
Nutritional Support Yes 2 83 0.129(0.031,0.534) 0.164(0.039,0.694)**
No 99 531 1 1
Sanitation Facilities Improved 50 202 2(1.307, 3.056) 1.131(0.818, 2.097)
unimproved 51 412 1 1

34
Table 5. Associated risk factors for over nutrition in HIV/AIDS clients in pre-ART and on
ART care in Hawassa health facilities, Hawassa, Ethiopia. Continued
**P-value < 0.05
Variable Prevalence of
Over nutrition
COR (95%) AOR (95%)
Yes No
Age >=50 7 41 2.038(0.788, 5.270) 1.937(0.708, 5.299)
40-49 26 110 2.822(1.450, 5.489) 2.938(1.437,6.006)**
30-39 52 272 2.282(1.265, 4.117) 2.336(1.256,4.342)**
18-29 16 191 1 1
Educational
level
College/University 17 68 3.95(1.384, 11.271) 2.448(0.788, 7.604)
Secondary school 34 159 3.379(1.272, 8.973) 2.325(0.827, 6.537)
Grade 5-8 32 197 2.566(0.965, 6.825) 2.209(0.784, 6.227)
Grade 1-4 11 91 1.910(0.636, 5.733) 2.096(0.657, 6.687)
Able to read and write 2 20 1.580(0.285, 8.750) 2.403(0.397, 14.53)
Not Able to read &write 5 79 1 1
Taking
cotrimoxazole
Yes 41 318 0.305(0.094, 0.994) 0.804 (0.475, 1.359)
No 60 296 1 1
Eating
Difficulties
Yes 19 233 0.379 (0.224, 0.640) 0.488 (0.26, 0.914)
No 82 381 1 1

35
6. Discussion
The present study found that malnutrition were serious problems of PLWHA and in this study the
overall prevalence of under nutrition (under weight) in HIV/AIDS clients who attend chronic care
was 16.6% (BMI <18.5Kg/m2); 15.1% from On-ART and 18.7% from Pre-ART care and the
overall of prevalence of over nutrition (over weight and Obese) is 14.1% (14.3% from On-ART and
13.9% from Pre-ART)
The prevalence of malnutrition differed based on the client ART status (Pre-ART and On-ART). In
this study the prevalence of under nutrition (under weight) was higher in Pre-ART than ART clients
due to underlying condition. The proportions of under nutrition among on ART and Pre-ART
clients were much lower than the study conducted in Bahirdar (37); the difference may due to good
adherence to HAART, changing feeding style after knowing HIV status, and availability of
nutrition counseling and therapy in each health facilities .
Meta-analysis from 11 sub-Saharan African countries indicated that the prevalence of under
nutrition in Ethiopia among HIV-infected women was 13.2% (33). It is a bit lower than the
prevalence proportion of women’s malnutrition in this study (14.9%). Another study conducted
from 12 Sub Sahara Africa countries indicated that the prevalence of under nutrition in Ethiopia in
HIV positive women was 25% (34) and another the study conducted in Tigray Humera Hospital in
HIV positive women was 42.3% (44). The proportion of malnourished women in this study is much
lower than the study conducted in Tigray Humera Hospital; this is being may due to different socio-
cultural, residence and dietary diversity. The overall prevalence of under nutrition in this study
was lower than the findings from Botswana (35), Iranian (31), Bahrdar (37), Gondar (38), Brazil
(32) and China (45). But it was higher than the study conducted in Dilla (36). The difference may
be due to socio economic status, year of the study, and the differences in residence of the study
participants.
Malnutrition could occur in different forms and degrees. In this study the proportion of degree of
malnutrition it differs from different setting and circumstance. In this study the total malnourished
individual 2.5%, 2.7% and 11.5% were in severe, moderate, and mild malnutrition respectively are
lower than the other study conducted in Bahirdar (37). The variation may be due to ART service
increased, socio economic status, Awareness of PLHWAs were changed and year of the study.
Furthermore in this study the proportion of degree of malnutrition in women HIV positive
individual also was 2%, 2.4% and 10.5% were detected severe, moderate and mild malnutrition
respectively lowered than the study conducted in Humera Hospitals(44) revealed that 12%, 10%
and 20.3% were detected sever, Moderate and Mild malnutrition respectively. This difference may
due socioeconomic status of concomitant, and area of the study. The above descriptive result
showed that there is the difference in the distribution of degree of malnutrition. What so ever, the
36
difference degree of malnutrition is; what clearly seen is HIV/AIDS related malnutrition is the
major problem to HIV/AIDS patients.
One of the possible signs of the onset of clinical AIDS is a weight loss of about 6-7Kg for an
average adult, so as evidence indicated that even relatively small loses in weight (5%) were
associated with decreased survival rate (19). In this study found that 83.4%, 12.4%, 4.1% and 0.1%
were normal, mild, moderate and sever body weight loss. When a person is already underweight, a
further weight loss can have serious effects (17).Among the body weight loss study participants
12.9% from normal, 30.3% from mild and 48.3% from moderate were developed under nutrition.
In this study the prevalence of body weight loss percentage greater than 5% was 16.6%. The
prevalence was much lower than the study conducted in Gondar hospital 60.9% (38) the difference
may due to the increased expansion of HAART, awareness of individual and availability
therapeutic food in each health facilities.
This study found that there was strong association between body weight loss percentage and under
nutrition. The body weight loss percentage greater than 10% was 3.9 times more likely to develop
under nutrition than those who had normal body weight loss (<5%) [(AOR=3.967, 95% CI (1.682,
9.358)]. This finding is similar with the findings of the study done in the University of Gondar
Referral Hospital (38). This may be due to loss of weight by itself could cause under nutrition in the
patients with HIV/AIDS and make faster the progression of AIDS.
From the total under nourished study participants, those who get nutritional support were 2.4
times more likely to develop under nutrition than those who didn’t get nutritional support [(
AOR=2.353,95%CI (1.305, 4.242)]. This is due to those who get Nutritional support (both
therapeutic and supplementary) showed that they were already under nourished, presence of
inadequate dietary intake and HIV itself could affect the dietary intake of the patients. This finding
is also similar with the findings of the study done in the University of Gondar Referral Hospital
(38).
In present study prevalence of over nutrition , it was observed lower than the study conducted
Philadelphia (49), Swiss (51) São Paulo city(52) and Porto Alegre (55) due to different study
area, different economic status, study period and different feeding style.
In the present study of over nutrition , nutritional support , age between 30 -39 and 40-49, and
CD4 countless than200 cells/mm3, Two meal or less daily eating pattern of the last six months,
eating difficulties, were highly significant for over nutrition.

37
Getting nutritional support was protective for developing over nutrition (over weight and Obese).
Which means that 84 % of those who get nutrition support were less likely to develop over nutrition
than those who were not getting nutritional support [AOR=0.164, 95% CI (0.039, 0.694))]. This is
because of may be those people, who get nutritional support were already they were developed
under nutrition, inadequate dietary intake, low income. Similarly, people living with HIV that had
eating difficulties, were protective for having over nutrition by odds of 0.488 than those who hadn’t
eating difficulties [AOR=0.488, 95% CI (0.26, 0.914)]. This is due to the disease of HIV causes
oral and/or esophageal candidacies and could brought loss of appetite. In addition, two meal or
less daily eating pattern was less likely by 82% to develop over nutrition than those who had three
or more eating pattern in the last six months [AOR= 0.183, 95% CI (0.042, 0.796)]. This may be
due to people eating two meals or less daily were only fulfilling their daily energy requirement,
income, food insecurity.
CD4 count less than 200cells/mm3 is also protective for developing over nutrition [AOR= 0.264,
95% CI (0.082, 0.85)]. Among PLWHA those who had CD4 count less than 200 cell/mm3
were
less likely to develop over nutrition by 74% than those whose CD4 count higher than 500
cells/mm3. This is due to the fact that patients with CD4 count less than 200 cell/mm
3 were more
susceptible for infection than patients those who had CD4 count higher than 500 cells/mm3 and the
AIDS progression worsen.
Furthermore in this study age between 30-39 and 40-49 was also associated with the prevalence of
over nutrition [AOR=2.336, 95% CI (1.256, 4.342))] and [AOR=2.938, 95% CI (1.437, 6.006)]
respectively. This may be due to people after they knowing their sero type, they were changing
their feeding style intentionally and decline in physical function and frailty. From this study
finding, it was proved that 66% of PLWHA who were age above 30 year changed their feeding
style after knowing their sero type. In addition those age groups had increased feeding frequency.
38
7. Strength and weakness of the study
7.1. Strength of the study
The study was assessed the degree of malnutrition using both BMI and Body weight loss
percentage
To avoid recall biases, medical charts and ART data base were triangulated with the
primary data collected structured interview administered questionnaire.
7.2. Limitation of the study
Due to the nature of cross sectional study couldn’t established cause and effect relationship
between dependent and independent variable.
The present study is not study dietary intake and food record
The present study was not assessed central obesity using waist circumference
The present study was not assessed the information on diet and certain psychiatric co-
medications potentially associated with weight gain and physical activity

39
8. Conclusion
In this study the prevalence of under and over Nutrition is lower than most of the study
conducted before.
Nutritional support and Body weight loss percentage was predictor of under nutrition
(under weight).
CD4 count less than 200 cell/mm3, getting nutritional support, ,age, eating difficulties and
Daily Eating Pattern the Last 6 months has significantly associated with over nutrition (over
weight).
Over weight and obesity is an emerging health problem among HIV+ men and women

40
9. Recommendation
It has been learnt that malnutrition (over nutrition and under nutrition) & its problems in HIV
patients are complex & interwoven; no single recipe exists as solution either. A chronic HIV/ADIS
care and treatment should accompany or strength by nutrition support through governmental &
non-governmental organizations.
For Federal the Government
- All health facilities giving chronic HIV/AIDS care should start and strength both body weight
loss percentage and BMI to identify the malnutrition as early as possible.
- Need to look and have a policy or guideline to tackle newly emerging public health threat of
over nutrition (over weight and obese).
For Hawassa city Health department and each health facilities
- Improve screening methodology using both (BWL percentage and BMI) method and
management of under nutrition with PLWHA in each health facilities.
- Providing nutrition therapy doesn’t alleviate the nutritional problem of PLWHA therefore the
present study recommend need to improve house hold income through creating employment
opportunities and engaging PLWHA in different income generating activities could possibly
alleviate these predicament.
- ART access alone is not alleviating the problem of nutrition, therefore improve nutritional
therapy, dietary counseling, and support should strengthen with the access of ART.
- Provision of IEC/BCC on ART, nutrition, and adherence to the public in general and to the
PLWHA community in particular. IEC/BCC materials should be produced and distributed in
the context of PLWHA and cultural attractive and the public could improve the attitude
towards ART, nutrition, care and prevention.
- Assuring the food and nutrition security individual having HIV/AIDS is not enough to tackle
malnutrition (over nutrition), as a result of this all health facility providing ART service should
giving diet counseling at each contact point and need to strengthen counseling focusing drug
and food interaction.
- PLWHA should counseled focusing on altering dietary and physical activity patterns to prevent
development of obesity and to produce moderate weight loss.
- Provide awareness session on dietary therapy approaches such as low-calorie diets and lower-
fat diets; altering physical activity patterns; behavior therapy techniques; pharmacotherapy;
surgery; and combinations of these techniques.
- Furthermore this study is recommended to conducted comparative study, between PLWHA and
people not living with HIV that could discover more risk factors for malnutrition.
41
10. Reference
1. Chandra RK, Nutrition and Immune system: Introduction; Am J clin. Nutr 1997, 6:450S-3S
2. Colecraft E: HIV/AIDS: nutritional implications and impact on human development. Proc
Nutr Soc 2008, 67:109–113.
3. Gillespie S., Kadayila S., HIV/AIDS and Food and Nutrition Security: From Evidence to
Action. Food Policy Review no. 7: Washington, DC: IFPRI, 2005.
4. FANTA, HIV/AIDS: a guide for nutritional care and support, Washington, D.C, 2004, 2nd
Edition. available at www.fantaproject.org
5. Macallan DC, Wasting in HIV infection and AIDS. J Nutr , 1999, 129: 238S-242S.
6. Shalini Duggal, HIV and Malnutrition: Effects on Immune System, Hindawi Publishing
Corporation Clinical and Developmental Immunology Volume 2012, Article ID 784740, 8
pages
7. World Health Organization, Nutrient Requirements for people living with HIV/AIDS: Report
of a Technical consultation. Geneva: WHO, 2003.
8. The Millennium Development Goals report 2012, United Nations, new York,2012
9. Daniel J. Raiten, Steven G. and Stephen A. Nutritional considerations in Resource-limited
settings Consultation on Nutrition & HIV/AIDS in Africa: Evidence, lessons &
recommendations for action -13 April 2005.
10. Jean W-C, Paul B. penchar2, Derek Macallan and Andrew Tomkins, Macronutrients and
HIV/AIDS: a review of current evidence, consultation on Nutrition and HIV/AIDs in Africa:
evidence, lesson and recommendation for action, Durban South Africa 10-13 April, WHO,
2005.
11. The Federal Democratic Republic of Ethiopia, Ministry of Health, National Nutrition and
HIV/AIDS Implementation Reference Manual. Ministry of Health Sept. 2008, revised May,
2010.
12. Stephen D. WORLD AIDS DAY the role of nutrition in living with HIV/ AIDS.01-Dec-2008.
pp 12-15
13. .Krupa Shah, Amina P. Alio, William J. Hall and Amneris E. Luque; The Physiological Effects of Obesity in
HIV-Infected Patients: J AIDS Clinic Res 3:151 2012; Volume 3 • Issue 4 • 1000151; doi:10.4172/2155-
6113.1000151.
14. Ulrich E. Schaible, Stefan H. E. Kaufmann malnutrition and infection; complex mechanism
and global impacts, PLoS Medicine | www.plosmedicine.org, May 2007 | Volume 4 | Issue 5 |
e115

42
15. The united state president’s emergency plan for AIDS relief, Report on Food and Nutrition for
People with HIV/AIDS May, 2006
16. Valerianna Amorosa, MD, Marie Synnestvedt, MSEd, Robert Gross, MD, MSCE: The
Intersection Between Obesity and HIV Infection in Philadelphia, J Acquire Immune Defic
Syndr _ Volume 39, Number 5, August 15 2005
17. FAO, WFP and IFAD, the State of Food Insecurity in the World 2012. Economic growth is
necessary but not sufficient to accelerate reduction of hunger and malnutrition. Rome, FAO,
2012.
18. Louise C. Ivers, Kimberly A. Cullen, Kenneth A. Freed berg, Steven Block, Jennifer Coates and
Patrick Webb: HIV/AIDS, Under nutrition, and Food Insecurity, CID Clin Infect Dis. 2009
October 1; 49(7): 1096–1102
19. FAO, Building capacity for the agriculture sector response to AIDS, Module the Role of
Nutrition in the AIDS Response, 2010.
20. WHO, FAO , Living well with HIV/AIDS A manual on nutritional care and support for
people living with HIV/AIDS, Rome, 2002
21. Wheeler DA, Gibert CL, Launer CA, Muurahainen N, Elion RA, Abrams DI, Bartsch GE.
Weight loss as a predictor of survival and disease progression in HIV infection. Terry Beirn
Community Programs for Clinical Research on AIDS. J AIDS. 1998; 18:80-5.
22. Piwoz EG & Preble EA HIV/AIDS and Nutrition: A Review of the Literature and
Recommendations for Nutritional Care and Support in Sub-Saharan Africa. Washington, DC,
2000, Support for Analysis and Research in Africa (SARA) Project Bureau for Africa, Office
of Sustainable Development and USAID; available at http://pdf.usaid.gov/pdf_docs/
23. John R Koethe and Douglas C Heimburger, Nutritional aspects of HIV-associated wasting in
sub-Saharan Africa, Am J Clin Nutr 2010; 91(suppl):1138S–42S. 2010 American Society for
Nutrition
24. Jain VK & Chandra RK Does nutritional deficiency predispose to acquired deficiency
syndrome? Nutr Res 4, 1984, 537–543.
25. Beissel WR, Nutrition and immune function: Overview Journal of nutrition, 1996, volume
126, no 10, 2611S–2615S
26. Piwoz EG, Nutrition and HIV/AIDS: evidence, gaps, and priority actions, 2004.
http://sara.aed.org/publications/cross_ cutting/hiv_nutrition/HIV-Nutrition_%20brief.pdf
27. Chandra RK, Nutrition and immunology: from clinic to cellular biology and back again. Proc
Nutr Soc, 1999, 58, 681– 683.
28. Suttajit M Advances in nutrition support for quality of life in HIV/AIDS. Asia Pac J Clin Nutr
16, 2007, Suppl., 318–322.

43
29. Faulk WP, Demaeyer EM & Davis AJS Some effects of malnutrition on the immune response
in man. Am J Clin Nutr 27, 1974, 638–646.
30. Semba RD & Tang AM Micronutrients and the pathogenesis of human immunodeficiency
virus infection. Br J Nutr 81, 1999, 181–189.
31. Georg B., Maria G., Lioba W. Achieving Food and Nutrition Security – Actions to Meet the
Global Challenge – A Training Course Reader, DWHH, GTZ, InWEnt; November 2009, 3rd
ed.,
32. Malvy D, Thie´baut R, Marimoutou C & Dabis F (2001) Weight loss and body mass index as
predictors of disease progression to AIDS in adults. Aquitaine Cohort, France, 1985–1997. J
Am Coll Nutr 20, 609–615
33. Khalili H, Soudbakhsh A, Hajiabdolbaghi M, et al: Nutritional status and serum zinc and
selenium levels in Iranian HIV infected individuals. BMC Infect Dis 2008, 8:165
34. Carine S. Andrade, Rosangela P. Jesus, Taciana B. Andrade, Neyara S. Oliveira: Prevalence
and Characteristics Associated with Malnutrition at Hospitalization among Patients with
Acquired Immunodeficiency Syndrome in Brazil. PLOS ONE | www.plosone.org , November
2012 | Volume 7 | Issue 11 | e48717
35. Olalekan AU: Prevalence and pattern of HIV-related malnutrition among women in sub-
Saharan Africa: a meta-analysis of demographic health surveys. BMC Public Health 2008,
8:226
36. Sarah E.K. Bradley, HIV and Nutrition among Women in Sub-Saharan Africa:, DHS
analytical studies 16, September 2008
37. Nnyepi MS, The risk of developing malnutrition in people living with HIV/AIDS:
Observations from six support groups in Botswana, S Afr J Clin Nutr, 2009;22(2)
38. Hailemariam S., Tenkolu G., and Tadesse H., Malnutrition: Prevalence and its associated
factors in People living with HIV/AIDS, in Dilla University Referral Hospital, Archives of
Public Health 2013, 71:13
39. Daniel M., Mazengia F, Birhanu D., Nutritional status and associated factors among adult
HIV/AIDS clients in Felege Hiwot Referral Hospital, BahirDar, Ethiopia, Science Journal of
Public Health, Vol. 1, No. 1, 2013, pp. 24-31.
40. Belaynew W. Taye, Adult Nutritional Status and Factors Associated with Malnutrition among
PLHIV in University of Gondar Referral Hospital, April 24, 2012
41. Berhe N, Tegabu D. and Alemayehu M. Effect of nutritional factors on adherence to
antiretroviral therapy among HIV-infected adults: a case control study in Northern Ethiopia,
BMC Infectious Diseases 2013, 13:233

44
42. Castle man, T., Seumo-Fosso, E. and Cogill B. Food and nutrition implications of
antiretroviral therapy in resource limited settings. Food and nutrition technical assistance –
Technical note No. 7. Washington, revised on May 2004, available at
(http://www.fantaproject.org/downloads/pdfs/tn7_ARVs.pdf)
43. Central Statistical Authority (CSA) and ICF International Calverton, Maryland, USA, 2012,
Ethiopia Demographic and Health Survey 2011. Addis Ababa and Calverton, Maryland: CSA
and ICF International.
44. Tiyou A, Belachew T, Alemseged F and Biadgilign S., Food insecurity and associated
factors among HIV-infected individuals receiving highly active antiretroviral therapy in
Jimma zone Southwest Ethiopia, Nutrition Journal, 2012, 11:51.
45. Seifu A.: Impact of Food and Nutrition Security on Adherence to Anti-Retroviral Therapy
(ART) and Treatment Outcomes among Adult PLWHA in Dire Dawa Provisional
Administration. Addis Ababa University [Internet]. 2007. Available from:
http://hdl.handle.net/123456789/861.
46. Hailu T. ,Worku W, Tetemke D and Berhe H; Under nutrition among HIV positive women in
Humera hospital, Tigray, Ethiopia, 2013: antiretroviral therapy alone is not enough, cross
sectional study, BMC Public Health 2013, 13:943 doi:10.1186/1471-2458-13-943
47. Wen Hu, Hua Jiang, Wei Chen, Sheng-Hua He, Bin Deng, Wen-Yuan Wang, Yan Wang
,Charles Damien Lu, Karen Klassen , and Jun Zeng ; Malnutrition in hospitalized people
living with HIV/AIDS: evidence from a cross-sectional study from Chengdu, China
48. Ananya Bhowmik, Padmini Ghugre,, Shobha Udipi and Subhasish Kamal Guha; Nutritional
Status and Quality of Life of Women with HIV/AIDS, Kolkata 700073, West Bengal, India,
2012, cross sectional, American Journal of Infectious Diseases 8 (1): 13-18, 2012, ISSN
1553-6203
49. John R. Koethe, Benjamin H. Chi, Karen M. Megazzini, Douglas C. Heimburger, and Jeffrey
S. A. Stringer, Macronutrient Supplementation for Malnourished HIV-infected Adults: A
Review of the Evidence in Resource-Adequate and Resource-Constrained Settings, Clin
Infect Dis. 2009 September 1; 49(5): 787–798. doi:10.1086/605285
50. Kristy M. Hendricks, ScD, RD, Karen Willis, MS, RD, Robert Houser, PhD, Clara Y. Jones,
MD, MPH: Obesity in HIV-Infection: Dietary Correlates; Journal of the American College of
Nutrition, Vol. 25, No. 4, 321–331 (2006)
51. Barbara Hasse, Martin Iff, Bruno Ledergerber, Alexandra Calmy: Obesity Trends and Body
Mass Index Changes After Starting Antiretroviral Treatment: The Swiss HIV Cohort Study;
OFID • Hasse et al
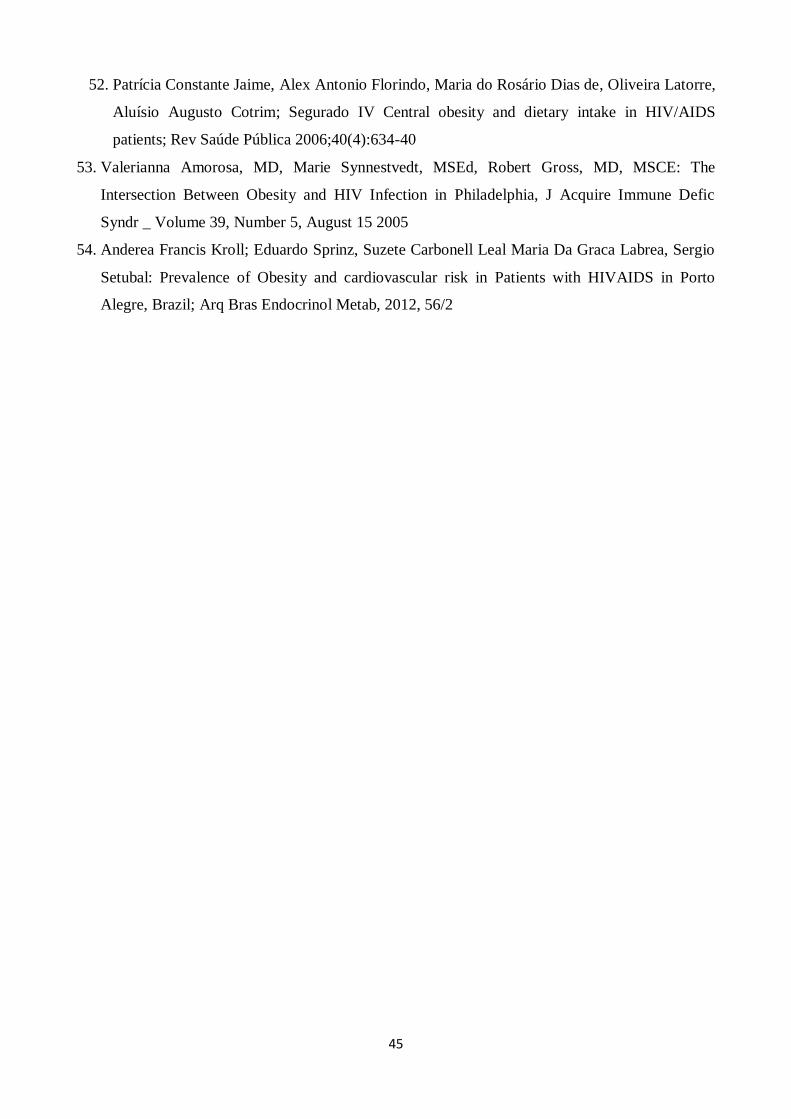
45
52. Patrícia Constante Jaime, Alex Antonio Florindo, Maria do Rosário Dias de, Oliveira Latorre,
Aluísio Augusto Cotrim; Segurado IV Central obesity and dietary intake in HIV/AIDS
patients; Rev Saúde Pública 2006;40(4):634-40
53. Valerianna Amorosa, MD, Marie Synnestvedt, MSEd, Robert Gross, MD, MSCE: The
Intersection Between Obesity and HIV Infection in Philadelphia, J Acquire Immune Defic
Syndr _ Volume 39, Number 5, August 15 2005
54. Anderea Francis Kroll; Eduardo Sprinz, Suzete Carbonell Leal Maria Da Graca Labrea, Sergio
Setubal: Prevalence of Obesity and cardiovascular risk in Patients with HIVAIDS in Porto
Alegre, Brazil; Arq Bras Endocrinol Metab, 2012, 56/2

46
ANNEXES:
ANNEX I . ENGLISH VERSION QUESTIONAIRE
TO ASSESS THE PREVALENCE OF MALNUTRITION AND ITS FACTOR
ASSOCIATED WITH ADULT PLWHA IN HAWASSA
ENGLISH CONSENT FORM AND INFORMATION SHEET
Good morning/good afternoon. My name is ________. We came from Hawassa University
College of medicine and health science. We are working for an investigator doing this thesis for the
partial fulfillment of master’s degree in public health. You are selected for the interview by chance.
We would like to ask you few questions about your socio demographic characteristics, HIV related
symptom, adherence of ART, antiretroviral treatments out come and related factors affecting of
nutritional status. This will help us to identify some of the factor affecting nutritional status of
PLWHA based on your answer to our questions.
We will also take some measurements including weight and height from you. If you are interested
we can tell you your weight and height measurements. You have full right to refuse, withdraw or
completely reject part or all of your participation in the study. But we encourage your full
participation as the answers you give on this form and your participation in taking your
measurements are very important to this study and to plan ways to help other people who must take
pills and on Pre-ART follow up on a difficult situation. We need also to take some information
from your files and records achieved in the ART Unit from your hospital or health center log book.
We would like to assure you that all of your responses to our questions will be kept confidential
throughout the study process. Any of your information you provide will be used only by the
research team and will, by no means, be revealed to a third party. We will ask you questions and
take measurements in a place where other people or conditions couldn’t interfere. We would like to
assure you that your participation on this research will not affect any of your treatment and other
benefit that you get from any organization. We would be thankful if you spend few minutes with us
answering questions related to the issues described above and cooperating in taking some
measurements from you. The questions and measurements will take 30-45 minutes. If you have
any questions about this study you may ask me or the principal investigator Sisay Tadesse Tele:
0932659999 or Email: [email protected]. May I get your permission to continue my
interview?
1. Yes 2. No if No Stop
If yes, Study participant’s Unique ART ID No. _______Signature ______Date___________
Data collector’s Supervisor’s
Name _____________ Sign.______ Name _______________ Sign._______

47
PART I
Socio-demographic characteristics
General direction: please, ask each question exactly as it is and circle it as per response of the study participants.
No. QUESTIONS AND FILTERS CATEGORIES CODE SKIPs
101 Sex of study participant Female
Male
1
2
102 Please state your age in year? _____ years
103 Please state your Religion? Orthodox Christian
Protestant
Catholic
Muslim
Others (specify)______________
1
2
3
4
5
104 What is the highest level of education you
have attained?
Not able to read & write
Able to read and write
Grade 1 − 4
Grade 5 − 8
Secondary school
College/University
1
2
3
4
5
6
105 Please state your Ethnicity?
Sidama
wolayta
Gurage
Amahara
Gedoe
Oromo
Others (specify)_______
1
2
3
4
5
6
7
106 What is your current Marital status? Married
Unmarried
Divorced
Widowed
Others(specify)______
1
2
3
4
5
107 Please describe your current Residence? Urban
Rural
1
2
108 How many people are living in your
household?
_________ people
109 House hold condition
109a How many rooms in your household are
used for sleeping?
_____ room
109b Electricity Yes
No
Don’t know

48
Part II. Socio- economic information
201 What is your main occupation? Student
Casual worker/part-time
Employed
Farmer
Business (Self employed)
Unemployed
Other (Specify) ---------
1
2
3
4
5
6
7
202 Are you the head of your household? Yes
No
1
2
If yes, skip to #
204
203 If no, what is the occupation of the head
of the household?
Employed
Business (Self employed)
Casual worker/part-time
Farmer
Unemployed
Other (Specify) ------------------
1
2
3
4
5
6
204 What is the main source of food for your
household the last six month?
Purchase (Market/grocery store)
Household farm/garden
Relatives and friends
Welfare/NGO support
Other (Specify) ------------------
1
2
3
4
5
205 What is your monthly income in Eth Birr? ____________ birr
206 Daily eating pattern of last 6 months Three meals & above
Two meals & eating between meals
Two meals or less
1
2
3
207 Please describe source of drinking water? Piped water into dwelling
Piped water into yard/plot
Public tap/standpipe
Tube well/borehole
Protected dug well Unprotected dug well Protected spring Unprotected spring Rainwater collection Bottled water Cart with small tank/drum Tanker truck Surface water (river, dam, lake,
pond, stream, canal, irrigation channels) Other (specify)___________
1
2
3
4
5
6
7
8
9
10
11
12
13
14
208 Food consumption pattern of last 24 hours Three meals & above
Less than three meals
Don’t know
1
2
3
209 Does your household have the following
communication media?
Television
Radio
1
2

49
Telephone(Mobile)
non-mobile telephone
Internet
If other ( specify)______________
3
4
5
6
Part III. Anthropometric assessment
301 What is the current height of the study
participants (in meter)?
________meter
302 What is the current Weight of the study
participants (in Kg)?
________Kg
303 What is current BMI calculated (Kg/m2) ________Kg/m
2
304 What is the usual body weight of study
participant before six month of Pre-ART
follow up and ART?
______ Kg
305 What is the current weight of the study
participant?
______Kg
306 Percentage of weight loss (%) Sever(>20)
Moderate(10.1 -20)
Mild(5 - 10)
1
2
3
Part IV. Health related factors and others
401 Are you starting ART? Yes
No
Don’t know
1
2
3
If no go to
403
402 Have you had any side effect of HAART in the past six month?
Yes No
1 2
403 Are you taking septrin? Yes
No
Don’t know
1
2
3
If no go to #
405
404 If yes, have you had any side effects from
taking the septrin in the last 1 month?
Yes
No Don’t know
1
2 3
405 Are you getting nutritional support? Yes
No
Don’t know
1
2
3
406 Are you Changing your feeding style after knowing HIV status?
Quality of food Frequency
Feeding cooked food
If other (specify)______
1 2
3
4
407 Are you disclosed your HIV sero type status to your relative or any one?
Yes No
Don’t know
1 2
3
408 If yes who? Wife/husband
Own child (ren) Parents
Brothers/sisters
Relatives
Friends Others (Specify)_________
1
2 3
4
5
6 7

50
409 Have you ever had gastrointestinal symptom
in the past six month?
Yes
No
Don’t know
1
2
3
410 Have you ever had eating difficulty in the past six month?
Yes No
Don’t know
1 2
3
If no go to 410
411 If yes, what kind of eating difficulty? Loss of appetite
Nausea/ Vomit Swallowing difficulty
oral or/ and esophageal thrush
If others(specify)_______
1
2 3
4
5
412 Have you ever had get nutritional counseling at your health facility?
Yes No
Don’t know
1 2
3
413 Have you ever had pulmonary tuberculosis
in the past six month?
Yes
No
Don’t know
1
2
3
414 If yes, are you taking anti Tb drug? Yes
No
Don’t know
1
2
3
415 If yes, have you had any side effects? Yes
No Don’t know
1
2 3
416 If yes, please specify what side effect(s). ________________________________
________________________________
417 Have you been unwell in the last 2 weeks prior to the survey?
Yes No
Don’t know
1 2
3
If no stop here
418 If yes, have you been taking any drugs? Yes
No Don’t know
1
2 3
419 If yes, have you had any side effects? Yes
No
Don’t know
1
2
3
420 If yes, please specify what side effect(s). ________________________________________________________________
Part V. Behavioral related factor
501 Have you ever smoked cigarette? Yes
No Don’t know
1
2 3
If no go #
502 Do you smoke cigarettes currently? Yes
No
Don’t know
1
2
3
503 Have you ever drunk alcohol? Yes No
Don’t know
1 2
3
504 Do you drink alcohol now? Yes No
Don’t know
1 2
3
505 Have you ever used soft drugs (e.g.
Khat, Shisha)
Yes
No Don’t know
1
2 3
If yes go
#506

51
506 Do you use soft drug currently? Yes
No
1
2
507 Have ever use hard drugs(cocaine,
morphine and others)
Yes
No Don’t know
1
2 3
If yes go #
508
508 Do you use hard drug currently? Yes
No
1
2
PART VI. Clinical characteristics of study participants( secondary data)
601 WHO clinical AIDS staging of a patients Stage I
Stage II Stage III
Stage IV
1
2 3
4
602 Adherence to HAART in past 6 month Good adherence
Fair adherence Poor adherence
1
2 3
603 What is current CD4 cell count of the study
participants
______cells/mm3
604 ART duration ≤ 12 month
>12months
1
2
605 How many times does the patients have
Opportunistic Infections in the past six
month
None
1
2+
1
2
3
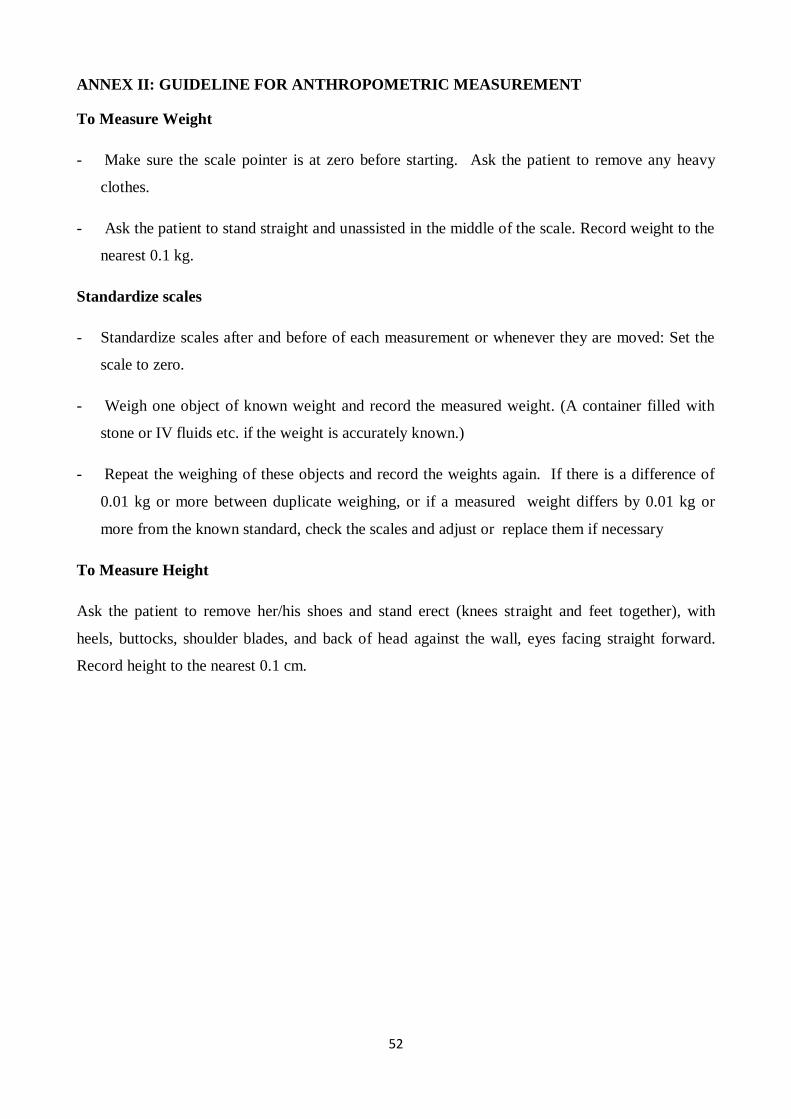
52
ANNEX II: GUIDELINE FOR ANTHROPOMETRIC MEASUREMENT
To Measure Weight
- Make sure the scale pointer is at zero before starting. Ask the patient to remove any heavy
clothes.
- Ask the patient to stand straight and unassisted in the middle of the scale. Record weight to the
nearest 0.1 kg.
Standardize scales
- Standardize scales after and before of each measurement or whenever they are moved: Set the
scale to zero.
- Weigh one object of known weight and record the measured weight. (A container filled with
stone or IV fluids etc. if the weight is accurately known.)
- Repeat the weighing of these objects and record the weights again. If there is a difference of
0.01 kg or more between duplicate weighing, or if a measured weight differs by 0.01 kg or
more from the known standard, check the scales and adjust or replace them if necessary
To Measure Height
Ask the patient to remove her/his shoes and stand erect (knees straight and feet together), with
heels, buttocks, shoulder blades, and back of head against the wall, eyes facing straight forward.
Record height to the nearest 0.1 cm.
53
Guide to categorize “improved” and “unimproved” water source (UNICEF and WHO, 2012)
JMP category Supply technology
“Improved” -Piped water into dwelling, yard or plot
-Publiuc tap or standpipe
-Tubewell or borehole
- Protected spring
-Protected dug well
- Rain water collection
“Unimproved” - Unprotected dug well
- unprotected spring
- Cart with small tank or drum
- Tanker truck
- Surface water( river, dam, lake, pond, stream, canal
, irrigation canal)
- Bottled water

54
ANNEX III. AMHARIC QUESTIONNAIRE /አማረኛ ኮንሰት ፎርም
በሀዋሳ ዩንቨርሲቲ እና አዱስ ኮንቲኔታሌ የህብረሰተሰብ ጤና እንስቲትዩት ጥምር የህብረተሰብ ጤና ማስተርስ
ፕሮግራም
የ2ኛ ዴግሪ የምርምርና ጥናት መጠየቂያ
ጤና ይስጥሌኝ ስሜ ይባሊሌ፡፡ የሀዋሳ ዩኒቨርስቲ ተማሪ ነኝ፡፡
እኛ በዚህ ሆስቲታሌ ወይም ጤና አጠባበቅ ጣቢያ ከኤች አይ ቪ ቨይረስ ጋር የሚኖሩ ህብረተሰብ ሊይ የስነ ምግብ
ችግርን ሉያመጡ የሚችለ ነገሮችን/ችግሮችን ጥናት ስሇምንሰራ እርሶ የሚሰጡት መረጃ ሇጥናቱ ወሳኝና አስፈሊጊ
ከመሆኑም በተጨማሪ ከኤች አይ ቪ ቫይረስ ጋር ሇሚኖሩ ህብረተሰብ በተመሇከተ ከጥናቱ ውጠት በመነሳት
ሇወዯፊት መሻሻሌ ያሇበትን ችግር የሚጠቁም መሆኑን ሌንገሇጽልት እንወዲሇው፡፡
ስሇሆነም ጥያቄዎቹ የሚያተኩሩት ከቨይረስ ጋር የሚኖሩ ህብረተሰብን የስነ-ምግብ ችግር ሉያመጡ የሚችለ
ጉዲዮችን ሊይ ነው በመሆኑም ጥናቱ የሚዯረግባችዉ ቦታዎች እንዯሚከተሇዉ ይሆናለ በሀዋሳ ሪፈራሌ
ሆስፒታሌ፣ አዲሬ ሆስፒታሌ፣ ቡሽል ጤና አጠባበቅ ጣቢያ፣ ሚሉኒየም ጤና አጠባበቅ ጣቢያ እና በቱሊ ጤና
አጠባበቅ ጣቢያ ዉስጥ የፀረ ኤች አይ ቪ መዴሀጋኒት የሚጠቀሙ እና ፀረ-ኤች አይቪ መዴሃኒት ሇማግኘት
ክትትሌ ሊይ ያለ ሰዎችን ነው፡፡ ማንኛውንም ከርስዎ የወሰዴነውን መረጃ ከንተ ወይም ካንች ፈቃዴ ዉጪ
ሇማንም አይሰጥም፡፡ መረጃውን ሇመስጠት ከእርስዎ ሙለ ፈቃዴኝነት ይስፈሌጋሌ፡፡ ማንኛውን ጥያቄዎች
የመመሌስና ያሇመመሇስ ሙለ መብት አሇህ/ሽ፡፡በማንኛዉም ጊዜ ጥያቄዉን የማቋረጥ መብት አሇህ/ሽ፡፡
ስሇዚህ በዚህ ሆስቲታሌ ወይም ጤና አጠባበቅ ጣቢያ እርስዎን ከሊይ ሇተጠቀሰዉ ጥናት የተመረቱ ስሇሆነ
ሇምንሰራዉ ጥናት ችግር አምጭ ናቸዉ ያሌናቸዉን ጥያቄዎችን ሌንጠይቅዎ ፍቃዯኛ ነዎት?
አዎ ---------- አይዯሇሁም-----------
የኤርቲ መሇያ ቁጥር _________
የመረጃ ሰብሳብው ስም ---------------------------- ፊርማ ----------------------
መረጃው የተሰበሰበበት ቀን ---------------- የተጀመረበት ሰዓት-----------የተጠናቀቀበት ሰዓት------
ያረጋገጠው ሱፐርቫይዘር ስም ----------------------------ፊርማ --------------ቀን ---------------------

55
ክፍሌ አንዴ ፡ ሶሽዮ ዱሞግራፊን በተመሇከተ የመጠየቁ መመሪያ እያንዲንደን ጥያቄ ግሌፅ በሆነ መሌኩ ይጠየቅ
ተ.ቁ መሌሱን አክብቡ ወይም
ባድ ቦታ ሊይ ሙሊ/ሙይ
ምርጫ ዎች ኮዴ ዝሇሌ/ይ
101 ጻታ ወንዴ ሴት
1 2
102 እዴሜ (በአመት) ስንት ነው? ___________ አመት
103 እባክዎ ሏይማኖትዎ ምንዴን ነዉ? ኦርቶድክስ ክርስቲያን ፐሮቴስታት
ካቶሉክ ሙስሉም
ላሊ ከሆነ ይግሇጹ________
1 2 3 4 5
104 አሁን ያሇዎት የትምህርት ዯረጃዎ ምንዴን ነው?
ማንበብ እና መጸህፍ አሌችሌም ማንበብ እና መጸህፍ እችሊሇሁ
ከ1ኛ እስከ 4ኛ ክፍሌ ከ5ኛ እስከ 8ኛ ክፍሌ
ከ9ኛ እስከ 12 ኛ ክፍሌ ኮላጅ/ዩንቨርስቲ
1 2 3 4 5 6
105 ብሄርዎ ምንዴን ነዉ?
ሲዲማ ወሊይታ ጉራጌ አማራ ጌዴዮ ኦሮሞ
ላሊ(ይግሇጹ)_______________
1 2 3 4 5 6
106 እባክዎ የጋብቻ ሁኔታዎ ምንዴን ነዉ? ያገባ ያሊገባ/ች
አግብታ/ቶ የተፋታ/ች ባሎ/ሚስቱ የሞተበት/ባት
ላሊ ከሆነ ይግሇፁ_______________
1 2 3 4 5
107 መኖሪያ አዴራሻ የት ነዉ? ከተማ ገጠር
1 2
108 ስንት ሰዎች አብረዎት ይኖራለ? _______________ ሰዎች
109 የመኖሪያ ቤትን መሇከተ
ስንት መኝታ ክፍልች አሇዎት? _________________ ክፍሌ
ኤላክትሪክ ይጠቀማለ አዎ አሌጠቀምም አሊዉቅም
1 2 99
ክፍሌ ሁሇት ፡ ሶሾ ኢኮኖሚክ መጠይቅ
201 እባክዎ ዋና ስራዎ ምንዴን ነዉ? ተማሪ የቀን ሰራተኛ
ተቀጣሪ አርሶ አዯር
ነጋዳ
1 2 3 4 5

56
ስራ የሇኝም ላሊ ከሆነ ይግሇፁ____________
6 7
202 የቤቱ ሃሊፊ እርሶ ነዎት? አዎ አይዯሇሁም
1 2
አዎ ከሆነ ቁጥር 204 ሊይ ይሂደ
203 አይዯሇሁም ከሆነ የቤቱ ሃሊፊ ስራ ምንዴን ነዉ?
ተቀጣሪ ነጋዳ
የቀን ሰራተኛ አርሶ አዯር
ስራ የሊትም/የሇዉም ላሊ ከሆነ ይግሇጹ____________
1 2 3 4 5 6
204 ዋና የምግብ ምንጭዎ ከየት ነዉ? ከገበያ/ከግሮሰሪ ገዝቼ ከእርሻ
ከዘመዴ/ከጔዯኛ በእርዲታ
ከላሊ ከሆነ ይግሇፁ____________
1 2 3 4 5
205 እባክዎ የወር ገቢዎ በኢትዮጲያ ብር ስንት ነዉ?
__________ ብር
206 በቀን ስንት ጊዜ ይመገባለ ሶስት እና ከዚያ በሊይ ሁሇት ጊዜ እና በመሃሌ ሊይ እመገባሇሁ
ሁሇቴ ወይም ከዚያ በታች
1 2 3
207 የመጠጥ ዉሃ የሚያገኙበት ምንጭ ምንዴን ነዉ?
የታጠረ/የተከሇሇ የምንጭ ውሃ ያሌታጠረ/ያሌተከሇሇ ምንጭ ውሃ
የዝናብ ዉሃ የታሸገ ውሃ
ያሌታጠረ የጉዴጔዴ ውሃ የታጠረ የጉዴጔዴ ውሃ
የህዝብ ውሃ
የወንዝ፤የሀይቅ፤ የመስኖ፤የግዴብ፤
1 2 3 4 5 6 7
8
208 የአመጋገብ ሁኔታዎ ሊሇፉት 24 ሰዓት ምን ይመስሊሌ
ሶስት እና ከዚያ በሊይ ከሶስት በታች አሊውቅም
1 2 99
209 በቤትዎ ከሚከተለት ውስጥ የትኞቹ የመገናኛ ዘዳዎች አለ
ቴሇቨዥን ራዱዮ
ሞባይሌ ስሌክ መዯበኛ ስሌክ ኢንተረኔት
ላሊ ካሇይግሇጹ_____________
1 2 3 4 5 6
ክፍሌ ሦስት፡- የአንትሮፖሜትሪ የሌኬት ሁኔታ
301 ቁመት በሜትር
________ሜትር
302 ክብዯት በኪል ግራም ________በኪል ግራም
303 BMI በ ኪ.ግ/ሜትር2 ________ኪ.ግ/ሜትር2

57
304 ከስዴስት ወር በፊት የፀረ-ኤች አይቪ መዴሃኒት ከመጀመሩ ወይም የፀረ-ኤች አይቪ መዴሃኒት ቅዴመ ክትትሌ ከመጀመሩ በኃሊ ያሇዎት ክብዯት በኪ.ግ ስንት ነዉ
________በኪል ግራም
305 አሁን ያሇዎት ክብዯት ስንት ነዉ? ________በኪል ግራም
306 ክብዯት የቀነሱት በፐርሰንታይሌ ስንት ነዉ?
ከፍትኛ (ከ20% በሊይ) መካከሇኛ(ከ10.1 -20%)
ዝቅተኛ(ከ5-10%) ኖርማሌ(ከ5% በታች)
1 2 3 4
ክፍሌ አራት፡ጤና ነክ ጉዲዮችን እና ላልች
401 የፀረ-ኤች አይቪ መዴሃኒት(ART) ጀምረዋሌ
አዎ አሌጀመርኩም
1 2
ካሌጀምሩ ወዯ # 403 ይሂደ
402 ሊሇፉት ስዴስት ወር የፀረ-ኤች አይቪ
መዴሃኒት የጎኑየሽ ጉዲት (side
effect) አጋጥመዎታሌ?
አዎ
አሊጋጠመኝም
1
2
403 ኮትሪሞክሳዞሌ(Cotrimoxazole) መዴሃኒት ወስዯዋሌ?
አዎ
አሌወሰዴኩም
1 2
ካሌወሰደ ወዯ# 405 ይሂደ
404 አዎ፤ ከዎነ የጎንዮሽ ጉዲት (side effect) አጋጥመዉታሌ?
አዎ
አሌገጠመኝም
1 2
405 የስነ-ምግብ (nutritional) እርዲታ ያገኛለ?
አዎ
አሊገኝም
1
2
406 ኤች አይ ቪ ቫይረስ በዯሞዎ ዉስጥ መኖሩን ካዎቁ በኃሊ የአመጋገብ ሁኔታዎን ቀይረዋሌ
አዎ
አሌቀየርኩም
አሊዉቅም
1
2
99
407 አዎ ከሆነ መሌሱ ምን ሊይ ነዉ የቀየሩት
ጥራት ያሇዉ ምግብ
ዴግግሞሽ/ቁጥር ሊይ
የበሰሇ ምግብ መመገብ
ላሊ ከሆነ ይግሇፁ_____________
1
2
3
4
408 የኤች አይቪ ቫይረስ በዯመዎ መኖሩን ሇቤተሰበዎ ወይም ሇላሊ ሰው ነግረዋሌ?
አዎ
አሌነገርኩም
1 2
409 አዎ ከዎነ ሇማን ሇሚሰት/ሇባሌ ሇሌጆቼ
ሇወንዴም/ሇእህት ሇቤተሰብ አባሌ
ሇጔዯኛ
1 2 3 4 5

58
ላሊ ከሆነ ይግሇጹ________________ 6
410 የሆዴና አንጀት የህመም ነበርዎት ሇአሇፉት 6 ወራት?
አዎ አሌነበረኝም አሊዉቅም
1 2 99
411 ሊሇፉት 6 ወራት የምግብ መመገብ
ችግር ገጥመዎታሌ?
አዎ
አሌገጠመኝም
አሊዉቅም
1
2
99
ካሌገጠመዎት
ወዯ ቁጥር
413 ይሂደ
412 አዎ ከሆነ፣ ምን አይነት ችግር ነዉ? የምግብ ፍሊጎት አሇመኖር
ማቅሇሽሇሽ/ትዉከት
የመዋጥ ችግር
የአፍ ወይም የጉሮሮ ቁስሇት/ህመም
ላሊ ከሆነ ይግሇጹ________
1
2
3
4
5
413 የስነ-ምግብ የምክር አገሌግልት ህክምና
በሚወስደበት ጤና ዴርጅት
ተሰጥቶዎታሌ?
አዎ
አሌተሰጠኝም
አሊዉቅም
1
2
99
414 በሳንባ ነቀርሳ/Tuberculosis/ በሽታ
ሊሇፉት ስዴስት ወራት ታመዋሌ?
አዎ
አሌታመምኩም
አሊዉቅም
1
2
99
አሌታመምኩ
መ
ከሆነ ወዯ
#418 ይሂደ
415 አዎ ከሆነ መሌሱ የሳንባ ነቀርሳ
መዴሃኒት ጀምረዋሌ?
አዎ
አሌወስዴም
አሊዉቅም
1
2
99
416 አዎ ከሆነ የጎንዮሽ ጉዲት ነበርዎት አዎ
አሌነበረኝም
አሊዉቅም
1
2
99
417 አዎ ከዎነ ምን አይነት ነዉ ____________________________
____________________________
418 ከዚህ ጥናት 2 ሳምንት በፊት ህመም
ነበረዎት
አዎ
አሌነበረኛም
አሊዉቅም
1
2
99
አሌነበረኛም
ከሆነ ወዯ
ክፍሌ
አምስት
ይሂደ;

59
419 አዎ ከሆነ መዴሃኒት ወስዯዋሌ አዎ
አሌወሰዴኩም
አሊዉቅም
1
2
99
420 አዎ ከሆነ የጎንዮሽ ጉዲት ነበረዎ አዎ
አሌነበረኝም
አሊዉቅም
1
2
99
421 አዎ ከዎነ ይግሇጹ ____________________________
_______________________
ክፍሌ አምስት. የባህሪ ወይም ብሄቨራሌ ነክ ጥያቄዎች
501 ሲጋራ አጭሰዉ ያዉቃለ አዎ
አሊጨስኩም
አሊዉቅም
1
2
99
አሊጨስም
ከሆነ #
503 ይሂደ
502 አሁን የጨሳለ አዎ
አሊጨስም
አሊዉቅም
1
2
99
503 አሌኮሌ ያሇዉ መጠት ጠጥተዉ
ያውቃለ
አዎ
አሌጠጣሁም
አሊውቅም
1
2
99
504 አሁን የአሌኮሌ መጠጥ ይጠጣለ አዎ
አሌጠጣም
አሊዉቅም
1
2
99
505 ጫት፤ሺሻ ወይም ላሊ ተጠቅመው
ያዉቃለ
አዎ
አሌተጠቀምኩም
አሊዉቅም
1
2
99
506 አሁንም ጫት፤ሺሻ ወይም ላሊ
ይጠቀማለ
አዎ
አሌጠቀምም
አሊወቅም
1
2
99
507 ኮኬን፤ ሞረፊን ወይም ላልችን
ተጠቅምው ያውቃለ
አዎ
አሌተጠቀምኩም
አሊውቅም
1
2
99

60
508 ኡሁንም ኮኬን፤ሞርፊን ፤ላልችን
ይጠቀማለ
አዎ
አሌጠቀምም
አሊውቅም
1
2
99
ክፍሌ ስዴስት. ክሉኒካሌን ሁኔታን በተመሇከተ (clinical characteristics of study participants)
601 የአሇም ጤና ዴርጅት የኤዴስ ዯረጃ ዯረጃ አንዴ
ዯረጃ ሁሇት
ዯረጃ ሦስት
ዯረጃ አራት
1
2
3
4
602 ሊሇፉት ስዴስት ወራት ከጸረ-ኤች
አይ ቪ መዴሃኒት ጋር ያዎት
ቁርኝት(adherence) ምን ይመስሊሌ
ጥሩ ቁርኝት (Good adherence)
መካከሇኛ ቁርኝት (Fair adherence)
ዯካማ ቁርኝት (Poor adherence)
1
2
3
603 የCD4 ሴሌ ቁጥር መጥፎ/ከፍተኛ ቀንሷሌ (Sever)
በመካከሇኛ ቀንሷሌ(Moderate)
ትንሽ ቀንሷሌ (Mild)
ጥሩ (Not significant)
1
2
3
604 ስንት ወር ሆነዎት ፀረ ኤች አይ ቪ
መዴሃኒት ከጀመሩ
12 ወር እና ከዚያ በታች
ከ12 ወር በሊይ
1
2
605 ሊሇፉት ስዴስት ወር ሇኤች አይ
ቪ/ኤዴስ ተጔዲኝ በሽታዎች ሇስንት
ጊዜ ተጋሌጠዋሌ?
ምንም አሌተጋሇጥኩም
ሇአንዴ ጊዜ
ሇሁሇት ጊዜ እና ከዚያ በሊይ
1
2
3

61
Annex IV. Hawassa City Maps

62
DECLARATION
I declare that this thesis is my original work in partial fulfillment of the requirement for the degree
of Master of Public Health. I also declare that it has never been presented in this or any other
university and that all resources and materials used in the thesis have been duly acknowledged.
Student Name: Sisay Tadesse Signature: _________________
Place of submission: Hawassa University College of Medicine and Health Science, School of
Public and Environmental Health, Hawassa, Ethiopia
Date of submission: _____________________________________
This thesis has been submitted for examination with my approval as a university advisor.
Advisor Name: Achamyelesh G/Tsadik ( MPH, PhD fellow) Signature: ________________
Date of submission: _____________________________________