CHILDHOOD MALNUTRITION IN SRI LANKA: A ROAD MAP ...
192
CHILDHOOD MALNUTRITION IN SRI LANKA: A ROAD MAP FOR THE LAST MILE A review of literature Analysis of correlates of undernutrition A qualitative inquiry
-
Upload
khangminh22 -
Category
Documents
-
view
1 -
download
0
Transcript of CHILDHOOD MALNUTRITION IN SRI LANKA: A ROAD MAP ...

CHILDHOOD MALNUTRITION
IN SRI LANKA:
A ROAD MAP FOR THE LAST MILEA review of literature
Analysis of correlates of undernutritionA qualitative inquiry

2019
World Health Organization
Childhood malnutrition in Sri Lanka: a road map for the last mile
A review of literature Analysis of correlates of undernutrition
A qualitative inquiry

ii Childhood malnutrition in Sri Lanka: a road map for the last mile
Childhood malnutrition in Sri Lanka: a road map for the last mile - A review of literature, Analysis of correlates of undernutrition, A qualitative inquiry, 2019
ISBN: 978-92-9022-784-7
© World Health Organization 2020
Some rights reserved. This work is available under the Creative Commons Attribution-NonCommercial-ShareAlike 3.0 IGO licence (CC BY-NC-SA 3.0 IGO; https://creativecommons.org/licenses/by-nc-sa/3.0/igo).
Under the terms of this licence, you may copy, redistribute and adapt the work for non-commercial purposes, provided the work is appropriately cited, as indicated below. In any use of this work, there should be no suggestion that WHO endorses any specific organization, products or services. The use of the WHO logo is not permitted. If you adapt the work, then you must license your work under the same or equivalent Creative Commons licence. If you create a translation of this work, you should add the following disclaimer along with the suggested citation: “This translation was not created by the World Health Organization (WHO). WHO is not responsible for the content or accuracy of this translation. The original English edition shall be the binding and authentic edition”.
Any mediation relating to disputes arising under the licence shall be conducted in accordance with the mediation rules of the World Intellectual Property Organization.
Suggested citation. Childhood malnutrition in Sri Lanka: a road map for the last mile - A review of literature, Analysis of correlates of undernutrition, A qualitative inquiry: World Health Organization, Country Office for Sri Lanka; 2020. Licence: CC BY-NC-SA 3.0 IGO.
Cataloguing-in-Publication (CIP) data. CIP data are available at http://apps.who.int/iris.
Sales, rights and licensing. To purchase WHO publications, see http://apps.who.int/bookorders. To submit requests for commercial use and queries on rights and licensing, see http://www.whoint/about/licensing.
Third-party materials. If you wish to reuse material from this work that is attributed to a third party, such as tables, figures or images, it is your responsibility to determine whether permission is needed for that reuse and to obtain permission from the copyright holder. The risk of claims resulting from infringement of any third-party-owned component in the work rests solely with the user.
General disclaimers. The designations employed and the presentation of the material in this publication do not imply the expression of any opinion whatsoever on the part of WHO concerning the legal status of any country, territory, city or area or of its authorities, or concerning the delimitation of its frontiers or boundaries. Dotted and dashed lines on maps represent approximate border lines for which there may not yet be full agreement.
The mention of specific companies or of certain manufacturers’ products does not imply that they are endorsed or recommended by WHO in preference to others of a similar nature that are not mentioned. Errors and omissions excepted, the names of proprietary products are distinguished by initial capital letters.
All reasonable precautions have been taken by WHO to verify the information contained in this publication. However, the published material is being distributed without warranty of any kind, either expressed or implied. The responsibility for the interpretation and use of the material lies with the reader. In no event shall WHO be liable for damages arising from its use.
Printed in Sri Lanka
Suggested citation:
World Health Organization (2019). Childhood malnutrition in Sri Lanka: a road map for the last mile: A review of literature, analysis of correlates of undernutrition, a qualitative inquiry. Contributors: Lalini C. Rajapaksa and Upul Senarath. Colombo: World Health Organization.
iiiChildhood malnutrition in Sri Lanka: a road map for the last mile
List of Contributors
Investigators
Dr. Lalini C. Rajapaksa
Prof. Upul Senarath
Biostatisticians
Prof. Upul Senarath
Mr. Indika Siriwardena
Project Assistants
K. Partheepan
J. Dushyantharaj
K. Ravindran
S. Sujendran
V. Lokeesan
P. Jayawardena
J. K. Pushpakumara
iv Childhood malnutrition in Sri Lanka: a road map for the last mile
“We need to look at the world through the eyes of a mother, the head of a poor household, a small holder farmer, and a poor slum dweller to really understand the subtle and interlinked causes of hunger. In this way problems that seemed technical become people’s problems and as a result our response becomes more social, more human. I think this could be another mindset shift in our efforts to tackle hunger and undernutrition.”
Mary Robinson, former President of Ireland and President of the Mary Robinson Foundation – Climate Justice
vChildhood malnutrition in Sri Lanka: a road map for the last mile
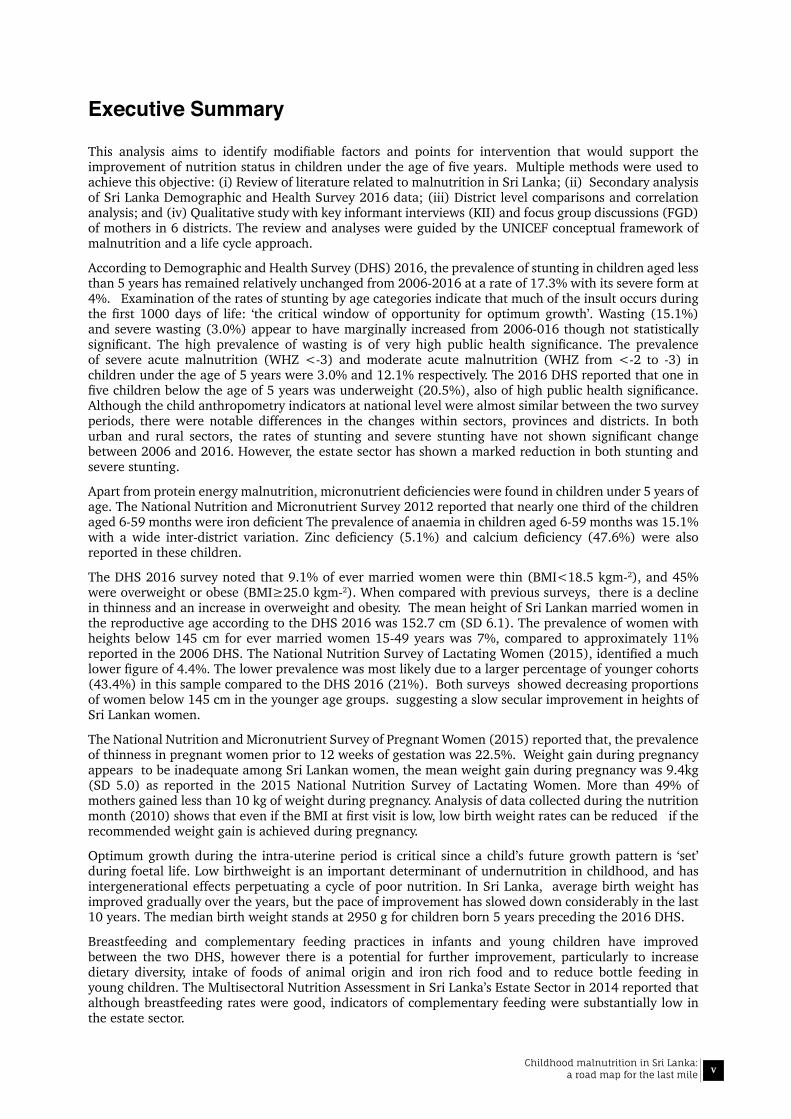
Executive Summary
This analysis aims to identify modifiable factors and points for intervention that would support the improvement of nutrition status in children under the age of five years. Multiple methods were used to achieve this objective: (i) Review of literature related to malnutrition in Sri Lanka; (ii) Secondary analysis of Sri Lanka Demographic and Health Survey 2016 data; (iii) District level comparisons and correlation analysis; and (iv) Qualitative study with key informant interviews (KII) and focus group discussions (FGD) of mothers in 6 districts. The review and analyses were guided by the UNICEF conceptual framework of malnutrition and a life cycle approach.
According to Demographic and Health Survey (DHS) 2016, the prevalence of stunting in children aged less than 5 years has remained relatively unchanged from 2006-2016 at a rate of 17.3% with its severe form at 4%. Examination of the rates of stunting by age categories indicate that much of the insult occurs during the first 1000 days of life: ‘the critical window of opportunity for optimum growth’. Wasting (15.1%) and severe wasting (3.0%) appear to have marginally increased from 2006-016 though not statistically significant. The high prevalence of wasting is of very high public health significance. The prevalence of severe acute malnutrition (WHZ <-3) and moderate acute malnutrition (WHZ from <-2 to -3) in children under the age of 5 years were 3.0% and 12.1% respectively. The 2016 DHS reported that one in five children below the age of 5 years was underweight (20.5%), also of high public health significance. Although the child anthropometry indicators at national level were almost similar between the two survey periods, there were notable differences in the changes within sectors, provinces and districts. In both urban and rural sectors, the rates of stunting and severe stunting have not shown significant change between 2006 and 2016. However, the estate sector has shown a marked reduction in both stunting and severe stunting.
Apart from protein energy malnutrition, micronutrient deficiencies were found in children under 5 years of age. The National Nutrition and Micronutrient Survey 2012 reported that nearly one third of the children aged 6-59 months were iron deficient The prevalence of anaemia in children aged 6-59 months was 15.1% with a wide inter-district variation. Zinc deficiency (5.1%) and calcium deficiency (47.6%) were also reported in these children.
The DHS 2016 survey noted that 9.1% of ever married women were thin (BMI<18.5 kgm-2), and 45% were overweight or obese (BMI≥25.0 kgm-2). When compared with previous surveys, there is a decline in thinness and an increase in overweight and obesity. The mean height of Sri Lankan married women in the reproductive age according to the DHS 2016 was 152.7 cm (SD 6.1). The prevalence of women with heights below 145 cm for ever married women 15-49 years was 7%, compared to approximately 11% reported in the 2006 DHS. The National Nutrition Survey of Lactating Women (2015), identified a much lower figure of 4.4%. The lower prevalence was most likely due to a larger percentage of younger cohorts (43.4%) in this sample compared to the DHS 2016 (21%). Both surveys showed decreasing proportions of women below 145 cm in the younger age groups. suggesting a slow secular improvement in heights of Sri Lankan women.
The National Nutrition and Micronutrient Survey of Pregnant Women (2015) reported that, the prevalence of thinness in pregnant women prior to 12 weeks of gestation was 22.5%. Weight gain during pregnancy appears to be inadequate among Sri Lankan women, the mean weight gain during pregnancy was 9.4kg (SD 5.0) as reported in the 2015 National Nutrition Survey of Lactating Women. More than 49% of mothers gained less than 10 kg of weight during pregnancy. Analysis of data collected during the nutrition month (2010) shows that even if the BMI at first visit is low, low birth weight rates can be reduced if the recommended weight gain is achieved during pregnancy.
Optimum growth during the intra-uterine period is critical since a child’s future growth pattern is ‘set’ during foetal life. Low birthweight is an important determinant of undernutrition in childhood, and has intergenerational effects perpetuating a cycle of poor nutrition. In Sri Lanka, average birth weight has improved gradually over the years, but the pace of improvement has slowed down considerably in the last 10 years. The median birth weight stands at 2950 g for children born 5 years preceding the 2016 DHS.
Breastfeeding and complementary feeding practices in infants and young children have improved between the two DHS, however there is a potential for further improvement, particularly to increase dietary diversity, intake of foods of animal origin and iron rich food and to reduce bottle feeding in young children. The Multisectoral Nutrition Assessment in Sri Lanka’s Estate Sector in 2014 reported that although breastfeeding rates were good, indicators of complementary feeding were substantially low in the estate sector.
vi Childhood malnutrition in Sri Lanka: a road map for the last mile
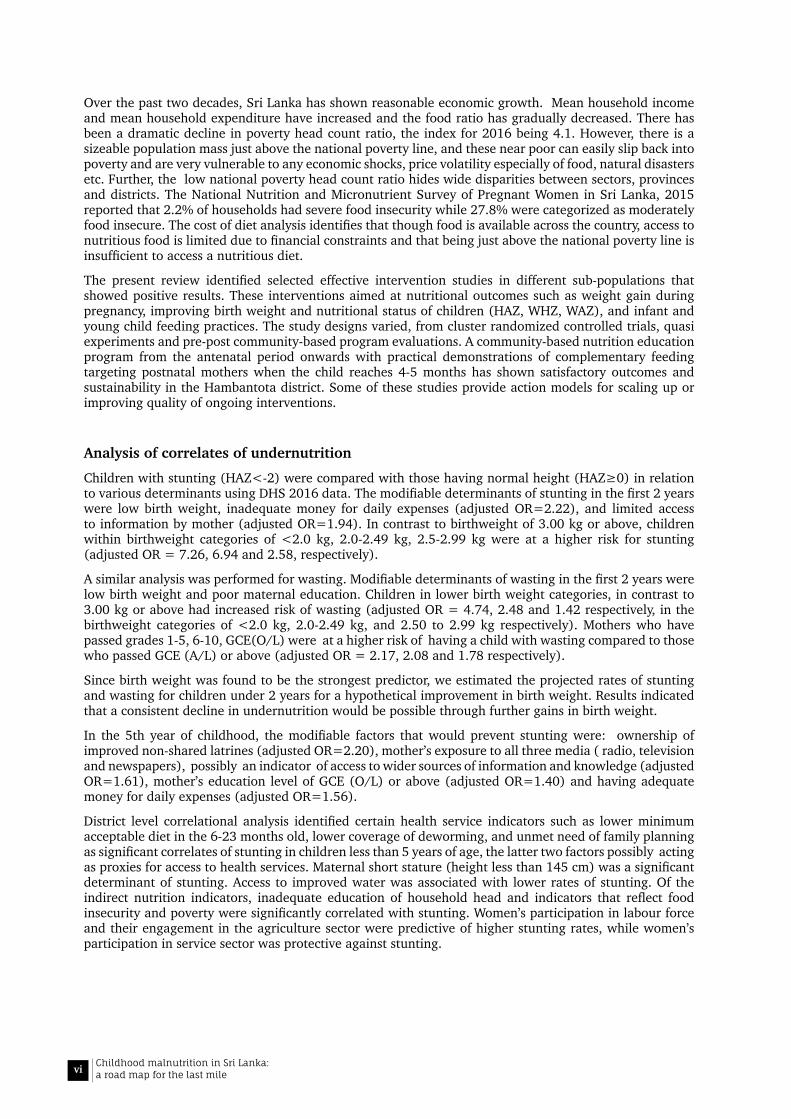
Over the past two decades, Sri Lanka has shown reasonable economic growth. Mean household income and mean household expenditure have increased and the food ratio has gradually decreased. There has been a dramatic decline in poverty head count ratio, the index for 2016 being 4.1. However, there is a sizeable population mass just above the national poverty line, and these near poor can easily slip back into poverty and are very vulnerable to any economic shocks, price volatility especially of food, natural disasters etc. Further, the low national poverty head count ratio hides wide disparities between sectors, provinces and districts. The National Nutrition and Micronutrient Survey of Pregnant Women in Sri Lanka, 2015 reported that 2.2% of households had severe food insecurity while 27.8% were categorized as moderately food insecure. The cost of diet analysis identifies that though food is available across the country, access to nutritious food is limited due to financial constraints and that being just above the national poverty line is insufficient to access a nutritious diet.
The present review identified selected effective intervention studies in different sub-populations that showed positive results. These interventions aimed at nutritional outcomes such as weight gain during pregnancy, improving birth weight and nutritional status of children (HAZ, WHZ, WAZ), and infant and young child feeding practices. The study designs varied, from cluster randomized controlled trials, quasi experiments and pre-post community-based program evaluations. A community-based nutrition education program from the antenatal period onwards with practical demonstrations of complementary feeding targeting postnatal mothers when the child reaches 4-5 months has shown satisfactory outcomes and sustainability in the Hambantota district. Some of these studies provide action models for scaling up or improving quality of ongoing interventions.
Analysis of correlates of undernutrition
Children with stunting (HAZ<-2) were compared with those having normal height (HAZ≥0) in relation to various determinants using DHS 2016 data. The modifiable determinants of stunting in the first 2 years were low birth weight, inadequate money for daily expenses (adjusted OR=2.22), and limited access to information by mother (adjusted OR=1.94). In contrast to birthweight of 3.00 kg or above, children within birthweight categories of <2.0 kg, 2.0-2.49 kg, 2.5-2.99 kg were at a higher risk for stunting (adjusted OR = 7.26, 6.94 and 2.58, respectively).
A similar analysis was performed for wasting. Modifiable determinants of wasting in the first 2 years were low birth weight and poor maternal education. Children in lower birth weight categories, in contrast to 3.00 kg or above had increased risk of wasting (adjusted OR = 4.74, 2.48 and 1.42 respectively, in the birthweight categories of <2.0 kg, 2.0-2.49 kg, and 2.50 to 2.99 kg respectively). Mothers who have passed grades 1-5, 6-10, GCE(O/L) were at a higher risk of having a child with wasting compared to those who passed GCE (A/L) or above (adjusted OR = 2.17, 2.08 and 1.78 respectively).
Since birth weight was found to be the strongest predictor, we estimated the projected rates of stunting and wasting for children under 2 years for a hypothetical improvement in birth weight. Results indicated that a consistent decline in undernutrition would be possible through further gains in birth weight.
In the 5th year of childhood, the modifiable factors that would prevent stunting were: ownership of improved non-shared latrines (adjusted OR=2.20), mother’s exposure to all three media ( radio, television and newspapers), possibly an indicator of access to wider sources of information and knowledge (adjusted OR=1.61), mother’s education level of GCE (O/L) or above (adjusted OR=1.40) and having adequate money for daily expenses (adjusted OR=1.56).
District level correlational analysis identified certain health service indicators such as lower minimum acceptable diet in the 6-23 months old, lower coverage of deworming, and unmet need of family planning as significant correlates of stunting in children less than 5 years of age, the latter two factors possibly acting as proxies for access to health services. Maternal short stature (height less than 145 cm) was a significant determinant of stunting. Access to improved water was associated with lower rates of stunting. Of the indirect nutrition indicators, inadequate education of household head and indicators that reflect food insecurity and poverty were significantly correlated with stunting. Women’s participation in labour force and their engagement in the agriculture sector were predictive of higher stunting rates, while women’s participation in service sector was protective against stunting.
viiChildhood malnutrition in Sri Lanka: a road map for the last mile
Qualitative inquiry
Districts were selected for the qualitative study based on their change in prevalence of stunting: Hambantota and Nuwara Eliya as ‘improved’, Ratnapura and Kilinochchi as ‘unchanged’, and Colombo and Ampara as ‘worsened’, districts. The Focus Group Discussions covered the spectrum of Sri Lankan mothers in general and followed the ‘positive deviance’ approach. The Key Informant Interviews with district and divisional level stakeholders in the health and other sectors provided information about existing services, interventions and options for improvement. The stakeholders also identified reasons for child malnutrition in their respective areas. Direct nutrition interventions are being implemented successfully through the routine health services. Mothers have gained knowledge and skills for breastfeeding and complementary feeding through special nutrition education programmes. Most families followed this guidance and fed their children accordingly, however some mothers failed to do so due to lack of family support, poverty and other reasons. There is need and potential for indirect nutrition interventions with the involvement of non-health sectors through a multi-sectoral approach, at present poorly implemented in some districts.
Taking these findings into consideration, we suggest the following opportunities for intervention in the health sector, other sectors and for implementation research, based on identified knowledge gaps.
The interventions recommended under the health sector are as follows:
• Improve birth weight - Shift the focus from 2500 to 3000g - Improvement would be possible if a large majority of mothers achieved the recommended weight gain during pregnancy. Some studies have demonstrated effective interventions that may be scaled up to achieve this objective.
• Implement measures to help women achieve a pre-pregnancy BMI of ≥18 kgm-2 and the recommended weight gain during pregnancy.
• Scale up interventions that have been shown to improve pregnancy weight gain, birth weight and nutritional status of children.
• Minimise preterm births.
• Help women achieve optimum BMI postpartum.
• Further improve infant and young child feeding (IYCF) practices through community-oriented, tailored interventions and by strengthening IYCF training and behaviour change communication programs.
• Address nutritional needs of children during the secondary growth spurt through special programmes.
• Enhance access to information on improving nutrition through multiple media, especially via user friendly communication platforms such as social media and m-Health.
• Services of a health personnel trained on nutrition be made available at MOH clinics for prompt attention to individual nutrition problems detected by field health staff.
• Special efforts to reach the vulnerable through training field health staff for the use of food security assessment tools, and identification of children at risk of stunting and wasting.
• Strengthen supervision, monitoring and evaluation of all nutrition programs for women and children delivered by the Ministry of Health and other sectors.
• Enhance service delivery for nutrition through retooling of field health staff - The nutrition interventions that have been described as successful are highly human resource intensive. Therefore, it is necessary to review the roles and responsibilities of the Public Health Midwife, her workload and norms, and the population to be served, so that her focus on nutrition can be improved.
Interventions through other sectors:
• Uplift educational attainment in females and enhance the health and nutrition literacy among young women. The feasibility of using the present school system and alternative innovative methods to involve school dropouts has to be explored.
• Improve Water Sanitation and Hygienic (WaSH) - Protect water sources, enhance and ensure proper purification / chlorination of water and provide support for construction of latrines.
viii Childhood malnutrition in Sri Lanka: a road map for the last mile
• Improve multi-sectoral nutrition programming - Re-energize the multi-sector district nutrition committees and provide clearly defined and specific responsibilities to different stakeholders as per multi-sector action plan. Vulnerable families can be identified and tailor-made interventions should be provided through poverty alleviation and income generation programs.
• Ensure food security - Some areas that may need attention are improvements in research and development in agriculture, enhancing adaptive capacities to climate change, resilience plans such as buffer stocks and in the short-term safety nets for the poorer segments of society.
• Special focus on reducing child poverty - Special attention must be available for pregnant mothers and children under 5 years of age in poor households and special programs implemented to break the cycle of malnutrition and poverty.
Research priorities:
• Longitudinal studies on all aspects of growth of children from in-utero life up to 5 years, qualitative studies to identify socio-cultural barriers and behavioural challenges to adopting proper IYCF practices, and studies for underlying causes of anaemia in different population groups.
• Interventional studies to examine the effectiveness of internet-based and m-Health communication strategies, before recommendation for wider use.
ixChildhood malnutrition in Sri Lanka: a road map for the last mile
Abbreviations
AHB Annual Health Bulletin
AOR Adjusted Odds Ratio
BMI Body Mass Index
CDC Child Development Centre (formerly known as crèche)
CDO Child Development Officer (formerly known as crèche attendant)
CHDR Child Health and Development Record
CI Confidence Interval
DCS Department of Census and Statistics
DHS Demographic and Health Survey
DS Divisional Secretary
ELBW Extremely Low Birth Weight
FGD Focus Group Discussion
FHB Family Health Bureau
GCE(A/L) General Certificate of Education (Advanced Level)
GCE(O/L) General Certificate of Education (Ordinary Level)
GDP Gross Domestic Product
GFSI Global Food Security Index
GHI Global Hunger Index
GNI Gross National Income
HARTI Hector Kobbekaduwa Agrarian Research and Training Institute
HAZ Height-for-Age Z score
Hb Haemoglobin
HFCAS Household Food Consumption Adequacy Score
HIES Household Income and Expenditure Survey
IDI In-Depth Interview
IMMR Indoor Morbidity and Mortality Returns
INGO International Non-Governmental Organization
IUGR Intrauterine Growth Retardation
IYCF Infant and Young Child Feeding
KII Key Informant Interview
LBW Low Birth Weight
MAM Moderate Acute Malnutrition
MCCAL Minimum Cost of diet that only meets the average energy requirement
MCNUT Minimum Cost of diet that meets the average energy and Nutrition requirement
MCH Maternal and Child Health
MDG Millennium Development Goal
MGRS Multicentre Growth Reference Study
x Childhood malnutrition in Sri Lanka: a road map for the last mile
MNAES Multisectoral Nutritional Assessment in Sri Lanka’s Estate Sector
MOH Medical Officer of Health
MO-MCH Medical Officer Maternal and Child Health
MRI Medical Research Institute
MUAC Mid Upper Arm Circumference
NCD Non-communicable diseases
NFSA Nutrition and Food Security Assessment in Sri Lanka
NNMS National Nutrition and Micronutrient Survey
NPD Non-Positive Deviant
NPL National Poverty Line
OR Odds Ratio
PAR Population Attributable Risk
PD Positive Deviant
PEM Protein Energy Malnutrition
PHCI Poverty Head Count Index
PHDT Plantation Human Development Trust
PHM Public Health Midwife
PHNS Public Health Nursing Sister
POA Period of Amenorrhoea
RDHS Regional Director of Health Services
RHMIS Reproductive Health Management Information System
RPC Regional Plantation Company
RSPHNO Regional Supervising Public Health Nursing Officer
SAIFRN South Asia Infant Feeding Research Network
SAM Severe Acute Malnutrition
SAPRI South Asia Policy and Research Institute
SD Standard Deviation
SDG Sustainable Development Goal
SLDHS Sri Lanka Demographic and Health Survey
U-5 Children under 5 years of age
UNICEF United Nations Children’s Fund
VLBW Very Low Birth Weight
WaSH Water Sanitation and Hygiene
WaSSIP Water Supply and Sanitation Improvement Project
WAZ Weight-for-Age Z score
WFP Word Food Programme
WHO World Health Organization
WHZ Weight-for-Height Z score
xiChildhood malnutrition in Sri Lanka: a road map for the last mile
Contents
List of Contributors iii
Executive Summary v
Abbreviations ix
Contents xi
List of Tables xiii
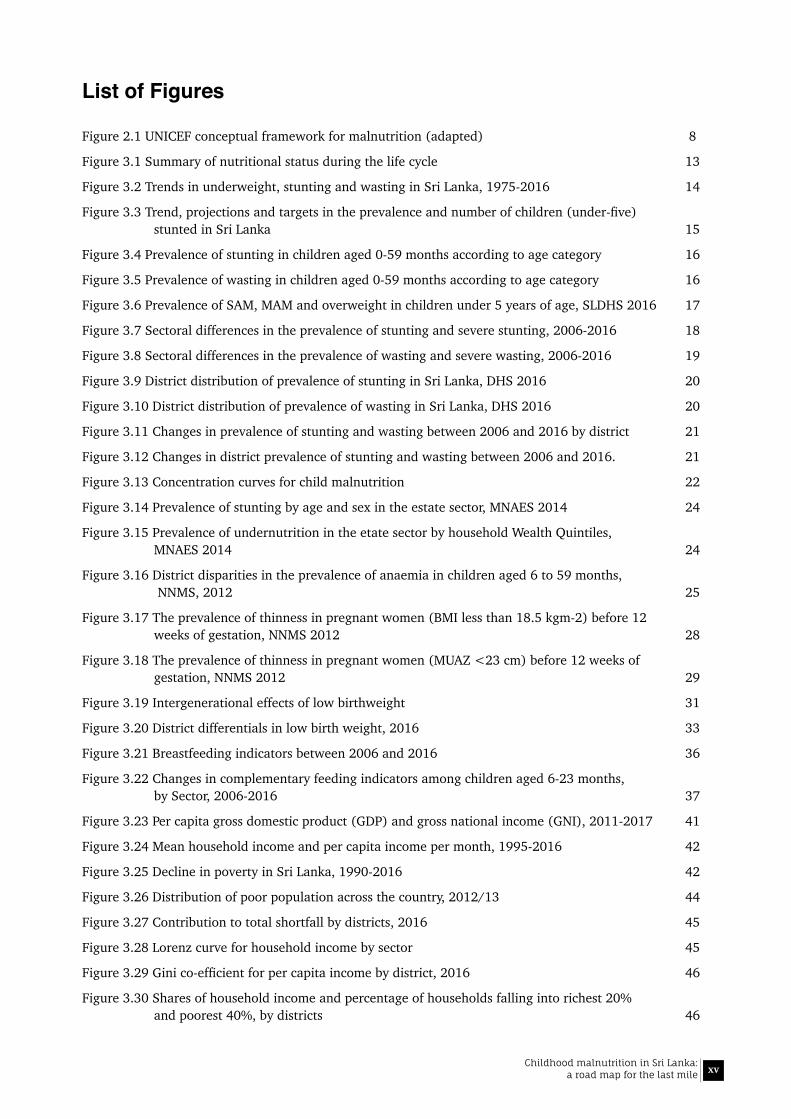
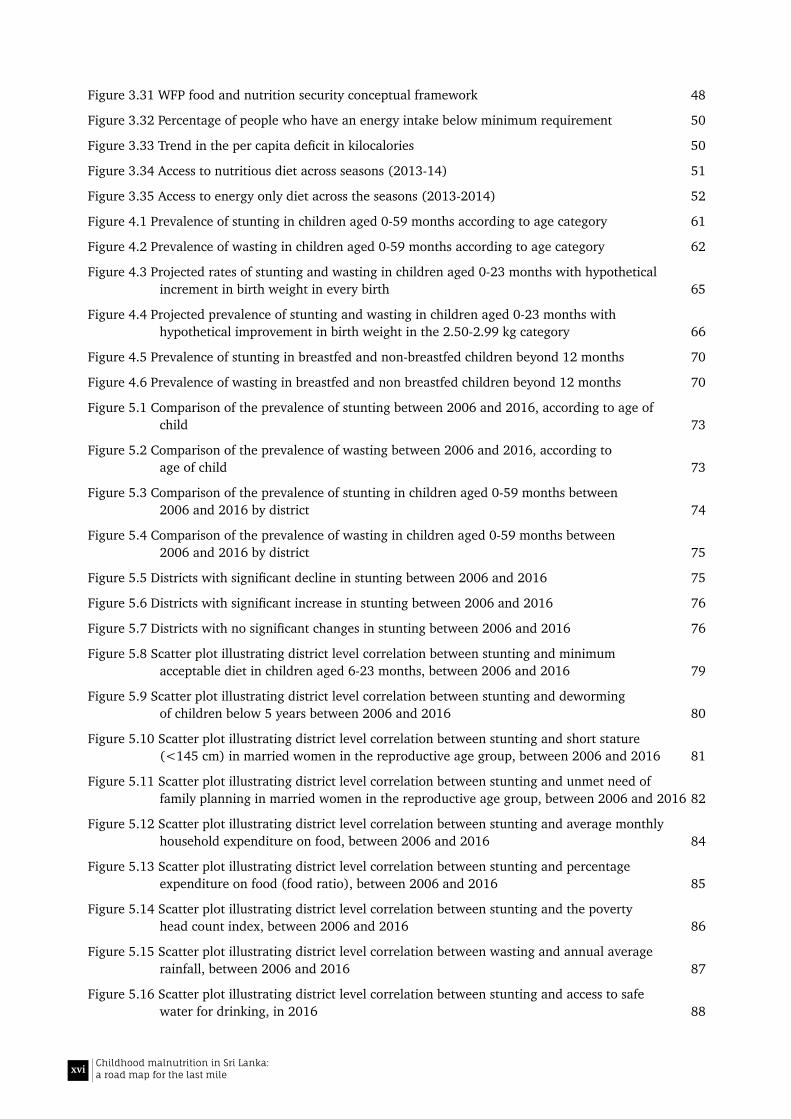
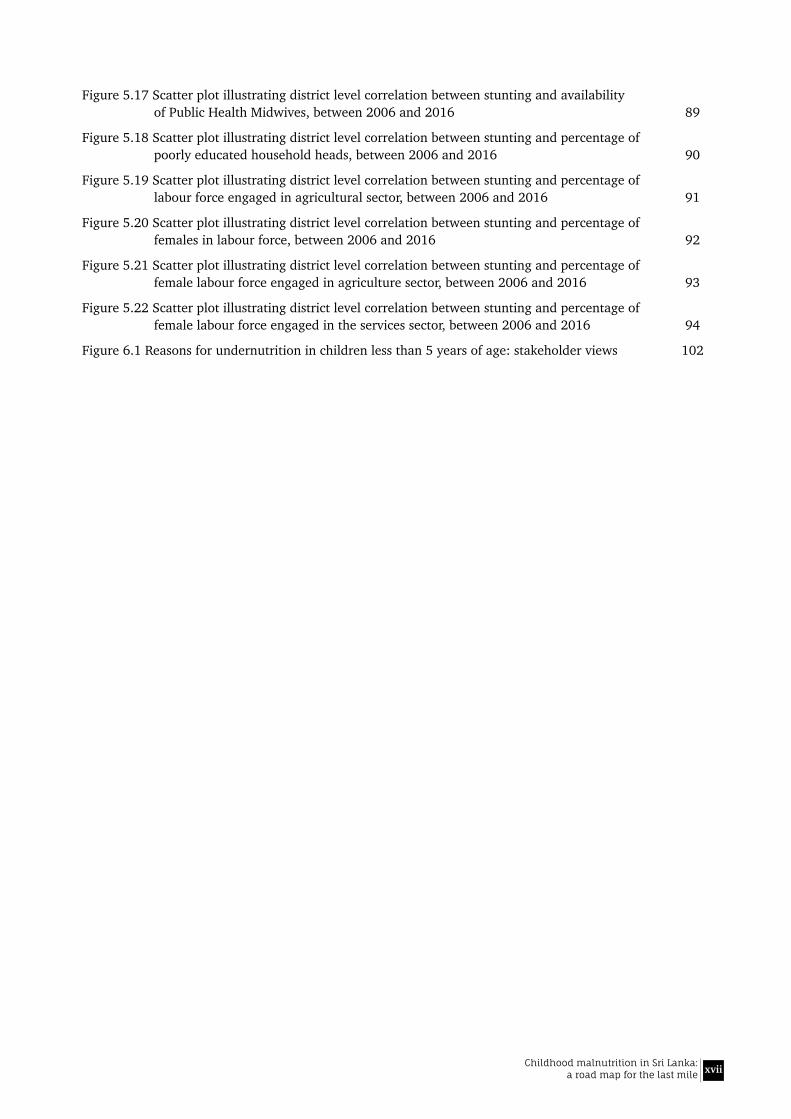
List of Figures xv
1.0 Introduction 3
1.1 Background 3
1.2 Objectives 3
2.0 Methodology 7
2.1 Review of literature 7
2.2 Further analysis of Sri Lanka Demographic and Health Survey (DHS) 2016 data 7
2.3 District level comparisons and correlation analysis to identify the predictors of undernutrition 9
2.4 Qualitative study using FGD and KII in 6 districts 9
3.0 Undernutrition in children and women: Review of Literature 13
3.1 Prevalence and trends of undernutrition in children under 5 years of age 14
3.2 Sectoral variation in stunting and wasting 18
3.3 District variations in stunting and wasting 19
3.4 Regional and sectoral surveys 23
3.5 Micronutrient deficiencies among children 6-59 months of age 25
3.6 Nutritional status of non-pregnant women 26
3.7 Undernutrition in pregnant and lactating mothers 27
3.8 Low birth weight 30
3.9 Infant and Young Child Feeding 36
3.10 Poverty 41
3.11 Food security and nutrition security 47
4.0 Risk factors for undernutrition: Further analysis of SLDHS 2016 data 55
4.1 Part A: Factors associated with stunting and wasting in infants and young children 55
4.2 Part B: Determinants of improvement of stunting in late childhood 61
4.3 Part C: Probable areas for intervention 64
5.0 District level correlates of undernutrition 73
5.1 Part A: Comparison of undernutrition between 2006 and 2016 73
5.2 Part B: Correlation of stunting with direct and indirect nutrition data available at district level 78
xii Childhood malnutrition in Sri Lanka: a road map for the last mile
6.0 Findings of the qualitative study 97
6.1 Part A: Practices and behaviours revealed through FGD with mothers 97
6.2 Part B: Nutrition interventions at district and divisional level 101
7.0 Opportunities for intervention 109
7.1 Summary of the findings 113
7.2 Recommendations 118
Acknowledgements 119
References 122
Annexes

xiiiChildhood malnutrition in Sri Lanka: a road map for the last mile
List of Tables
Table 2.1 Summary of qualitative data collection plans in each district 9
Table 3.1 Comparison of child nutrition data from the DHS 2006, NFSA 2009, NNMS 2012 and DHS 2016 15
Table 3.2 Sectoral differences in the prevalence of stunting and wasting 18
Table 3.3 revalence of thinness (BMI <18.5) by age group, 2010-2016 27
Table 3.4 Prevalence of Overweight and Obesity (BMI ≥ 25.0) 27
Table 3.5 Prevalence of low birth weight at national level, 1993-2016 32
Table 3.6 Sectoral differences in the prevalence of low birth weight 32
Table 3.7 District differentials in low birth weight, 2010-2016 33
Table 3.8 Pre pregnancy weight and pregnancy weight gain and birth weight 34
Table 3.9 Comparison in outcomes between intervention and control arms in a cluster randomized trial on nutrition counselling for pregnancy weight gain 35
Table 3.10 Interventions from different parts of Sri Lanka to improve nutritional status 39
Table 3.11 Incidence of poverty in Sri Lanka in 2016 based on different measures of poverty 43
Table 3.12 Poverty head count ratio and size of poor population by sector 43
Table 4.1 Unadjusted Odds Ratios for the determinants of stunting in children than 2 years in contrast to those with normal height (HAZ≥0): Results of bivariate regression analysis 56
Table 4.2 Adjusted Odds Ratios for the determinants of stunting in children than 2 years in contrast to those with normal height (HAZ≥0): Results of multivariate regression analysis 57
Table 4.3 Adjusted Odds Ratios for the determinants of stunting in children than 2 years in contrast to those with normal height (HAZ≥0): Final step of the multiple logistic regression analyses 59
Table 4.4 Unadjusted Odds Ratios for the determinants of wasting in children than 2 years in contrast to those without wasting (WHZ≥0): Results of bivariate regression analysis 60
Table 4.5 Adjusted Odds Ratios for the determinants of wasting in children than 2 years in contrast to those without wasting (WHZ≥0): Results of multivariate regression analysis 62
Table 4.6 Adjusted Odds Ratios for the determinants of wasting in children than 2 years in contrast to those without wasting (WHZ≥0): Final step of the multiple logistic regression analysis 63
Table 4.7 Predictors of being a non-stunted child (HAZ ≥ -2) during the 5th year of life: Multiple logistic regression analysis (n=1282) 64
Table 4.8 Significant predictors of being a non-stunted child (HAZ ≥ -2) during the 5th year of life: The final step of multiple logistic regression analysis 64
Table 4.9 Distribution of birth weights of children aged 0-23 months, DHS 2016 65
Table 4.10 Stunting and wasting according to birth weight categories 66
Table 4.11 Projected rates of stunting and wasting in children aged 0-23 months, with hypothetical increment in birth weight in every birth 68
Table 4.12 Determinants of low birth weight in children aged 0-59 months: Multiple logistic regression analysis of DHS 2016 data (n=5036) 68
Table 4.13 Prevalence of stunting in children 0-59 months according to perceived poverty by mother 68
xiv Childhood malnutrition in Sri Lanka: a road map for the last mile
Table 4.14 Prevalence of stunting in children aged 0-59 months according to mother’s educational achievement of GCE O/L or above 69
Table 4.15 Prevalence of stunting in children aged 0-59 months according to mother’s educational achievement of GCE (A/L) or above 69
Table 5.1 Mean birth weight and prevalence of low birth weight, in 2006 and 2016 74
Table 5.2 Nutrition specific and nutrition sensitive information included in the analysis, classified according to the UNICEF conceptual framework 77
Table 5.3 Correlation between stunting in children aged less than 5 years and district level IYCF and health service indicators in 2006 and 2016 78
Table 5.4 Correlation between stunting in children aged less than 5 years and district level household food consumption and expenditure data in 2006 and 2016 83
Table 5.5 Correlation between stunting/wasting in children aged less than 5 years and district level housing and environmental indicators in 2006 and 2016 87
Table 5.6 Correlation between stunting in children aged less than 5 years and district level human resources/ labour force indicators in 2006 and 2016 88
Table 6.1 Characteristics of the mothers who participated in the Focus Group Discussions 98
Table 7.1 Key determinants of stunting, wasting and low birth weight based on the analysis of DHS 2016 data 110
Table 7.2 Summary of district level correlates of stunting which were significant at least one of the time periods concerned 111
Table 7.3 Key findings of the literature review regarding the determinants of birth weight, stunting and wasting 112
xvChildhood malnutrition in Sri Lanka: a road map for the last mile
List of Figures
Figure 2.1 UNICEF conceptual framework for malnutrition (adapted) 8
Figure 3.1 Summary of nutritional status during the life cycle 13
Figure 3.2 Trends in underweight, stunting and wasting in Sri Lanka, 1975-2016 14
Figure 3.3 Trend, projections and targets in the prevalence and number of children (under-five) stunted in Sri Lanka 15
Figure 3.4 Prevalence of stunting in children aged 0-59 months according to age category 16
Figure 3.5 Prevalence of wasting in children aged 0-59 months according to age category 16
Figure 3.6 Prevalence of SAM, MAM and overweight in children under 5 years of age, SLDHS 2016 17
Figure 3.7 Sectoral differences in the prevalence of stunting and severe stunting, 2006-2016 18
Figure 3.8 Sectoral differences in the prevalence of wasting and severe wasting, 2006-2016 19
Figure 3.9 District distribution of prevalence of stunting in Sri Lanka, DHS 2016 20
Figure 3.10 District distribution of prevalence of wasting in Sri Lanka, DHS 2016 20
Figure 3.11 Changes in prevalence of stunting and wasting between 2006 and 2016 by district 21
Figure 3.12 Changes in district prevalence of stunting and wasting between 2006 and 2016. 21
Figure 3.13 Concentration curves for child malnutrition 22
Figure 3.14 Prevalence of stunting by age and sex in the estate sector, MNAES 2014 24
Figure 3.15 Prevalence of undernutrition in the etate sector by household Wealth Quintiles, MNAES 2014 24
Figure 3.16 District disparities in the prevalence of anaemia in children aged 6 to 59 months, NNMS, 2012 25
Figure 3.17 The prevalence of thinness in pregnant women (BMI less than 18.5 kgm-2) before 12 weeks of gestation, NNMS 2012 28
Figure 3.18 The prevalence of thinness in pregnant women (MUAZ <23 cm) before 12 weeks of gestation, NNMS 2012 29
Figure 3.19 Intergenerational effects of low birthweight 31
Figure 3.20 District differentials in low birth weight, 2016 33
Figure 3.21 Breastfeeding indicators between 2006 and 2016 36
Figure 3.22 Changes in complementary feeding indicators among children aged 6-23 months, by Sector, 2006-2016 37
Figure 3.23 Per capita gross domestic product (GDP) and gross national income (GNI), 2011-2017 41
Figure 3.24 Mean household income and per capita income per month, 1995-2016 42
Figure 3.25 Decline in poverty in Sri Lanka, 1990-2016 42
Figure 3.26 Distribution of poor population across the country, 2012/13 44
Figure 3.27 Contribution to total shortfall by districts, 2016 45
Figure 3.28 Lorenz curve for household income by sector 45
Figure 3.29 Gini co-efficient for per capita income by district, 2016 46
Figure 3.30 Shares of household income and percentage of households falling into richest 20% and poorest 40%, by districts 46
xvi Childhood malnutrition in Sri Lanka: a road map for the last mile
Figure 3.31 WFP food and nutrition security conceptual framework 48
Figure 3.32 Percentage of people who have an energy intake below minimum requirement 50
Figure 3.33 Trend in the per capita deficit in kilocalories 50
Figure 3.34 Access to nutritious diet across seasons (2013-14) 51
Figure 3.35 Access to energy only diet across the seasons (2013-2014) 52
Figure 4.1 Prevalence of stunting in children aged 0-59 months according to age category 61
Figure 4.2 Prevalence of wasting in children aged 0-59 months according to age category 62
Figure 4.3 Projected rates of stunting and wasting in children aged 0-23 months with hypothetical increment in birth weight in every birth 65
Figure 4.4 Projected prevalence of stunting and wasting in children aged 0-23 months with hypothetical improvement in birth weight in the 2.50-2.99 kg category 66
Figure 4.5 Prevalence of stunting in breastfed and non-breastfed children beyond 12 months 70
Figure 4.6 Prevalence of wasting in breastfed and non breastfed children beyond 12 months 70
Figure 5.1 Comparison of the prevalence of stunting between 2006 and 2016, according to age of child 73
Figure 5.2 Comparison of the prevalence of wasting between 2006 and 2016, according to age of child 73
Figure 5.3 Comparison of the prevalence of stunting in children aged 0-59 months between 2006 and 2016 by district 74
Figure 5.4 Comparison of the prevalence of wasting in children aged 0-59 months between 2006 and 2016 by district 75
Figure 5.5 Districts with significant decline in stunting between 2006 and 2016 75
Figure 5.6 Districts with significant increase in stunting between 2006 and 2016 76
Figure 5.7 Districts with no significant changes in stunting between 2006 and 2016 76
Figure 5.8 Scatter plot illustrating district level correlation between stunting and minimum acceptable diet in children aged 6-23 months, between 2006 and 2016 79
Figure 5.9 Scatter plot illustrating district level correlation between stunting and deworming of children below 5 years between 2006 and 2016 80
Figure 5.10 Scatter plot illustrating district level correlation between stunting and short stature (<145 cm) in married women in the reproductive age group, between 2006 and 2016 81
Figure 5.11 Scatter plot illustrating district level correlation between stunting and unmet need of family planning in married women in the reproductive age group, between 2006 and 2016 82
Figure 5.12 Scatter plot illustrating district level correlation between stunting and average monthly household expenditure on food, between 2006 and 2016 84
Figure 5.13 Scatter plot illustrating district level correlation between stunting and percentage expenditure on food (food ratio), between 2006 and 2016 85
Figure 5.14 Scatter plot illustrating district level correlation between stunting and the poverty head count index, between 2006 and 2016 86
Figure 5.15 Scatter plot illustrating district level correlation between wasting and annual average rainfall, between 2006 and 2016 87
Figure 5.16 Scatter plot illustrating district level correlation between stunting and access to safe water for drinking, in 2016 88
xviiChildhood malnutrition in Sri Lanka: a road map for the last mile
Figure 5.17 Scatter plot illustrating district level correlation between stunting and availability of Public Health Midwives, between 2006 and 2016 89
Figure 5.18 Scatter plot illustrating district level correlation between stunting and percentage of poorly educated household heads, between 2006 and 2016 90
Figure 5.19 Scatter plot illustrating district level correlation between stunting and percentage of labour force engaged in agricultural sector, between 2006 and 2016 91
Figure 5.20 Scatter plot illustrating district level correlation between stunting and percentage of females in labour force, between 2006 and 2016 92
Figure 5.21 Scatter plot illustrating district level correlation between stunting and percentage of female labour force engaged in agriculture sector, between 2006 and 2016 93
Figure 5.22 Scatter plot illustrating district level correlation between stunting and percentage of female labour force engaged in the services sector, between 2006 and 2016 94
Figure 6.1 Reasons for undernutrition in children less than 5 years of age: stakeholder views 102

xviii Childhood malnutrition in Sri Lanka: a road map for the last mile

01Introduction

2 Childhood malnutrition in Sri Lanka: a road map for the last mile
3Childhood malnutrition in Sri Lanka: a road map for the last mile
1.1 Background
Sri Lanka is recognized for achieving good health outcomes at low cost while it was a country with low levels of per capita income, the exception being nutrition outcomes. Malnutrition remains a challenging and unresolved public health problem. At national level it is a human development issue and at individual level it can be considered a violation of the right to achieve his/her full genetic potential.
The importance of early childhood nutrition to development outcomes is well recognised. Nutrition failure especially during pregnancy and the first 24 months of life leads to loss of potential human capital. It translates into poor physical health, poor cognitive development, low educational attainment and increased health care costs. It results in slowing of economic growth through losses in productivity and perpetuates poverty. On the other hand, returns on investments in nutrition are rated among the highest with lifelong dividends for the individual, societies and economies (Shekar et al 2017).
Sri Lanka is currently faced with a triple burden of malnutrition; undernutrition, micronutrient deficiencies and rising levels of overweight and obesity. It is seen that these nutritional problems pervade the whole life cycle and have intergenerational effects.
Malnutrition in children under five years of age (U-5) is widespread. Stunting, wasting and underweight are all at levels identified by the WHO as being public health problems, wasting being at the level of ‘very high’ while stunting is at a medium level of public health significance. (Refer for Annex 1.1 for WHO revised cut-off values for public health significance).
Trends in malnutrition have improved over time but no progress has been made in the ten-year period 2006-2016 despite the impressive decrease in overall poverty. The national poverty head count ratio has declined from 15.2 in 2006-07 to 4.1 in 2016 and many direct and indirect nutrition programs have been implemented by the government in collaboration with development partners (Department of Census and Statistics 2008; 2018). The present analysis aims to identify modifiable factors and points for intervention that may guide actions to improve the levels of malnutrition in children under the age of five years.
1.2 Objectives
• To review recent literature related to trends in nutrition and nutritional status in children aged less than 5 years, its determinants and differentials
• To identify interventions and modifiable factors associated with stunting and wasting in young children and improvement of the condition in late childhood
• To analyse district level direct nutrition (nutrition specific) and indirect nutrition (nutrition sensitive) information that may explain district disparities and trends
• To explore practices and behaviours that may influence nutritional status among families
01Introduction

4 Childhood malnutrition in Sri Lanka: a road map for the last mile
5Childhood malnutrition in Sri Lanka: a road map for the last mile
02Methodology

6 Childhood malnutrition in Sri Lanka: a road map for the last mile
7Childhood malnutrition in Sri Lanka: a road map for the last mile
The study used multiple methods to achieve the objectives given above.
2.1 Review of literature
Literature related to malnutrition with special reference to chronic protein energy malnutrition, determinants and interventions in Sri Lanka was collected for the period from 2011 to December 2018; however, reference is made to data from before 2011 where necessary for comparison. The cut-off of April 2011 was selected because a review of documents, research and other information on nutritional status, its determinants and evaluation of interventions for the period from January 2006 to April 2011 has been collated earlier for UNICEF (Rajapaksa et. al., 2012).
Both health and related non-health data were collected. Health-related data were on prevalence of chronic malnutrition, its determinants, and interventions and non-health data related to nutrition were on poverty, food availability, and food security.
The main sources of information were national surveys and reviews, published reports, records, conference proceedings and scientific journals were perused and relevant thesis and dissertations at the PGIM searched. Routinely collected data were used where appropriate and when available. An internet search was conducted through Google Scholar and Pub Med using the search terms ‘nutrition in children’, ‘malnutrition’, ‘stunting’, ‘wasting’, ‘underweight’, ‘low birth weight’, ‘infant and young child feeding’, ‘Iron deficiency’, ‘anaemia’, ‘vitamin deficiency’, ‘micronutrient deficiency’, ‘zinc deficiency’, ‘maternal nutrition’, ‘pregnancy weight gain’, ‘food security’, ‘nutrition interventions’, etc., so as to ensure access of all relevant data.
2.2 Further analysis of Sri Lanka Demographic and Health Survey (DHS) 2016 data
DHS is a nationally representative household survey aimed to gather data for monitoring and evaluation of population, health and nutrition programs in the country. Sri Lanka DHS 2016 was conducted in all 25 districts form the 9 provinces in Sri Lanka, and the number of households enumerated in the survey was 27,210 (Department of Census and Statistics and Ministry of Health, 2017). Data were collected from ever-married women aged 10-49 years (n=18,302) and their children less than 5 years of age (n=8459). Data on the nutritional status of children were collected by measuring the height and weight of all children less than five years of age, according to the standard procedure, and converted to Z scores using World Health Organization (WHO) child growth standards (WHO Multicenter Growth Reference Study Group. 2006). Details of methodology of the survey is available in the DHS report (Department of Census and Statistics and Ministry of Health, 2017). Further analysis was conducted using Stata (12.0) and SPSS (20.0) generating the following outputs:
02Methodology
8 Childhood malnutrition in Sri Lanka: a road map for the last mile
1. Differentials of undernutrition in infants and young children (0-23 months):
Three categories of linear growth, that is HAZ≥0, HAZ -2.00 to <0, and HAZ<-2 were cross-tabulated against a series of co-variates including feeding practices, childhood illness, child care practices, household and environmental factors, social-cultural and community attributes. Similar cross-tabulations were generated for acute nutritional status (WHZ≥0, WHZ -2.00 to <0, and WHZ<-2).
2. Factors associated with stunting and wasting in infants and young children: Case-control analysis
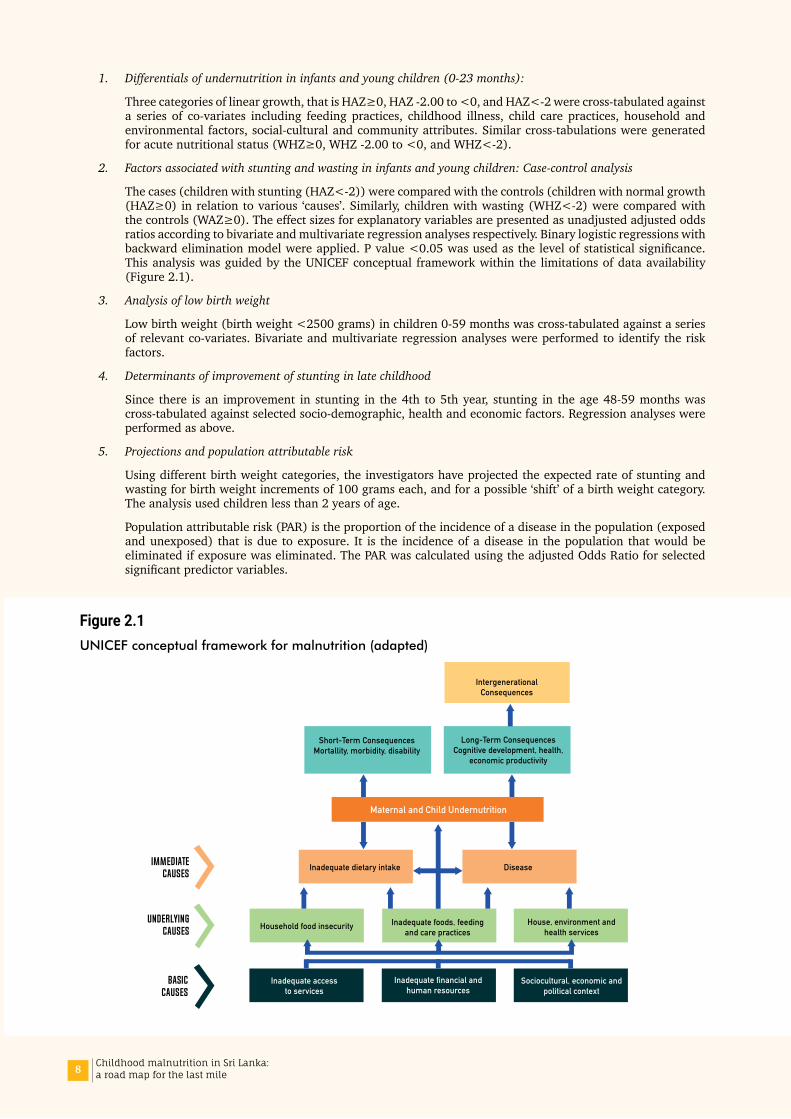
The cases (children with stunting (HAZ<-2)) were compared with the controls (children with normal growth (HAZ≥0) in relation to various ‘causes’. Similarly, children with wasting (WHZ<-2) were compared with the controls (WAZ≥0). The effect sizes for explanatory variables are presented as unadjusted adjusted odds ratios according to bivariate and multivariate regression analyses respectively. Binary logistic regressions with backward elimination model were applied. P value <0.05 was used as the level of statistical significance. This analysis was guided by the UNICEF conceptual framework within the limitations of data availability (Figure 2.1).
3. Analysis of low birth weight
Low birth weight (birth weight <2500 grams) in children 0-59 months was cross-tabulated against a series of relevant co-variates. Bivariate and multivariate regression analyses were performed to identify the risk factors.
4. Determinants of improvement of stunting in late childhood
Since there is an improvement in stunting in the 4th to 5th year, stunting in the age 48-59 months was cross-tabulated against selected socio-demographic, health and economic factors. Regression analyses were performed as above.
5. Projections and population attributable risk
Using different birth weight categories, the investigators have projected the expected rate of stunting and wasting for birth weight increments of 100 grams each, and for a possible ‘shift’ of a birth weight category. The analysis used children less than 2 years of age.
Population attributable risk (PAR) is the proportion of the incidence of a disease in the population (exposed and unexposed) that is due to exposure. It is the incidence of a disease in the population that would be eliminated if exposure was eliminated. The PAR was calculated using the adjusted Odds Ratio for selected significant predictor variables.
Figure 2.1UNICEF conceptual framework for malnutrition (adapted)
UnderlyingCauses
BasicCauses
ImmediateCauses
Inadequate dietary intake
Maternal and Child Undernutrition
Disease
Household food insecurity
Short-Term ConsequencesMortallity, morbidity, disability
Long-Term ConsequencesCognitive development, health,
economic productivity
IntergenerationalConsequences
Inadequate accessto services
Inadequate foods, feedingand care practices
Inadequate financial andhuman resources
Sociocultural, economic andpolitical context
House, environment andhealth services
9Childhood malnutrition in Sri Lanka: a road map for the last mile
2.3 District level comparisons and correlation analysis to identify the predictors of undernutrition
Correlation analyses were performed at district level between stunting rates and available direct and indirect nutrition data, across the two time periods 2006 and 2016. Correlation analysis was performed using non-parametric tests and presented as Spearman’s rho, with statistical significance.
Significant trends are illustrated using scatter plots where relevant. Direct and indirect nutrition variables were grouped according to the UNICEF conceptual framework. Data that coincided with or was closest to the 2 survey years, 2006 and 2016 were used for correlation analyses between nutritional outcomes and identified variables.
2.4 Qualitative study using FGD and KII in 6 districts
The qualitative study aimed to examine district level factors that have influenced nutritional outcomes with a focus on a multi-sectoral approach. The districts were classified into the following three groups, based on the change in stunting between 2006 and 2016 among children less than 5 years of age:
• Districts that have improved - Hambantota and Nuwara Eliya
• Districts that show no change - Ratnapura and Kilinochchi
• Districts that have deteriorated - Colombo and Ampara
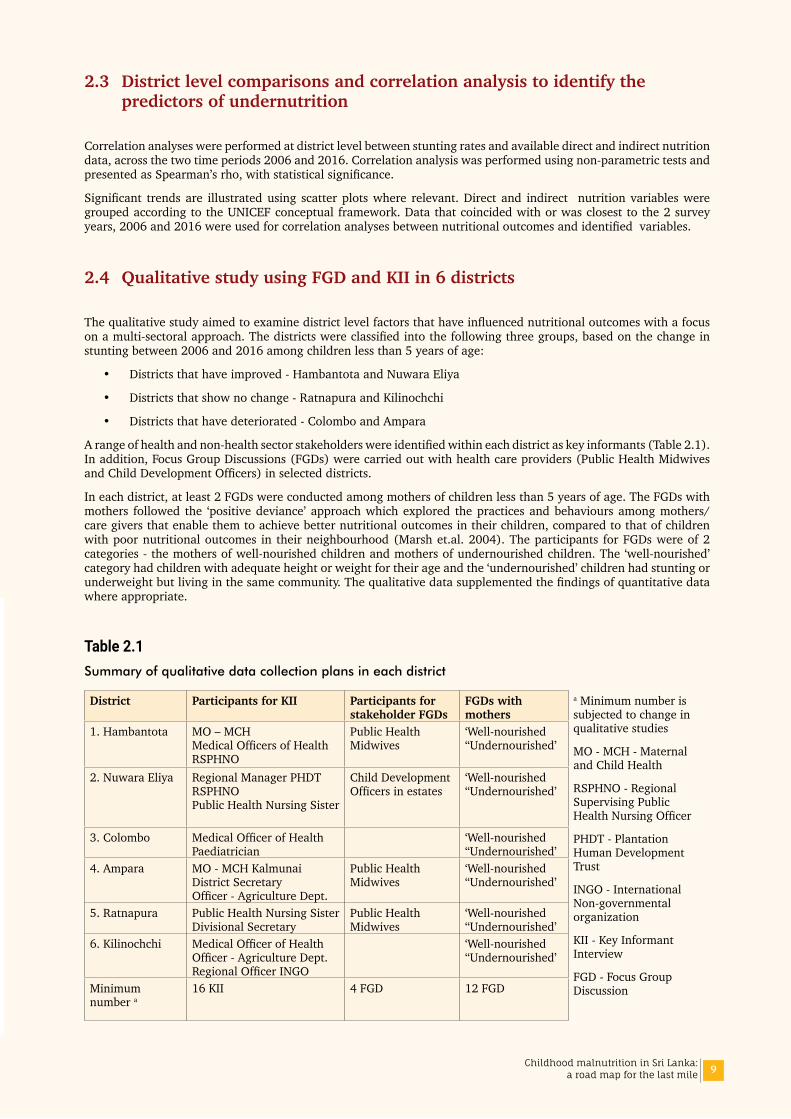
A range of health and non-health sector stakeholders were identified within each district as key informants (Table 2.1). In addition, Focus Group Discussions (FGDs) were carried out with health care providers (Public Health Midwives and Child Development Officers) in selected districts.
In each district, at least 2 FGDs were conducted among mothers of children less than 5 years of age. The FGDs with mothers followed the ‘positive deviance’ approach which explored the practices and behaviours among mothers/care givers that enable them to achieve better nutritional outcomes in their children, compared to that of children with poor nutritional outcomes in their neighbourhood (Marsh et.al. 2004). The participants for FGDs were of 2 categories - the mothers of well-nourished children and mothers of undernourished children. The ‘well-nourished’ category had children with adequate height or weight for their age and the ‘undernourished’ children had stunting or underweight but living in the same community. The qualitative data supplemented the findings of quantitative data where appropriate.
Table 2.1Summary of qualitative data collection plans in each district
District Participants for KII Participants for stakeholder FGDs
FGDs with mothers
a Minimum number is subjected to change in qualitative studies
MO - MCH - Maternal and Child Health
RSPHNO - Regional Supervising Public Health Nursing Officer
PHDT - Plantation Human Development Trust
INGO - International Non-governmental organization
KII - Key Informant Interview
FGD - Focus Group Discussion
1. Hambantota MO – MCH Medical Officers of Health RSPHNO
Public Health Midwives
‘Well-nourished ‘‘Undernourished’
2. Nuwara Eliya Regional Manager PHDT RSPHNO Public Health Nursing Sister
Child Development Officers in estates
‘Well-nourished ‘‘Undernourished’
3. Colombo Medical Officer of Health Paediatrician
‘Well-nourished ‘‘Undernourished’
4. Ampara MO - MCH Kalmunai District Secretary Officer - Agriculture Dept.
Public Health Midwives
‘Well-nourished ‘‘Undernourished’
5. Ratnapura Public Health Nursing Sister Divisional Secretary
Public Health Midwives
‘Well-nourished ‘‘Undernourished’
6. Kilinochchi Medical Officer of Health Officer - Agriculture Dept. Regional Officer INGO
‘Well-nourished ‘‘Undernourished’
Minimum number a
16 KII 4 FGD 12 FGD
10 Childhood malnutrition in Sri Lanka: a road map for the last mile
The investigators conducted FGDs with mothers/care givers of children aged less than 5 years with a view of examining factors that are associated with normal growth compared to chronic undernutrition. The selection of mothers was based on (a) Age of child less than 5 years (b) stunted or not (HAZ less than -2 or HAZ >0). If height was not available, then underweight (WAZ) was used as a proxy.
The interview guide for FGD with mothers is given in Annex 2.1. The guide for stakeholder Key Informant Interviews (KII) is given in Annex 2.2. The interviewers had previous experience in qualitative research, and were trained adequately prior to data collection. The findings were recorded, transcribed and translated. Data were analysed using a thematic approach.
11Childhood malnutrition in Sri Lanka: a road map for the last mile
03Undernutrition in children and women: Review of Literature

12 Childhood malnutrition in Sri Lanka: a road map for the last mile

13Childhood malnutrition in Sri Lanka: a road map for the last mile
Figure 3.1summarises nutrition status at different stages of lifecycle based on the latest available national level surveys.
03Undernutrition in children and women: Review of Literature
Elderly (60-69 years)
Underweight 15.3%Overweight 23.7%Obese 6.3%
(STEPS 2015)
Newborn
Low birth weight 15.7%
(DHS2016)
Non pregnant women witha child under 5 years of age
Anaemia 22.2%
(NFSA 2009)
Lactating women
Short stature (<145 cm) 4.4% Underweight 11.2%
(NNS Lactating Women 2015)
Anaemia 22.2%
(NFSA 2009)
Pregnant women
Short stature (<145 cm 4.4%MUAC ≤ 23 cm 16.6%Pre-pregnant BMI<18.5 22.6%Anaemia 31.8%Iron deficiency 21.8%Vitamin A deficiency 3.4%
(NNMS Pregnant Women 2014)
6-12 year old
Stunting 11.5%Thinness 39.9% Boys 45.3% Girls 33.6% Anaemia 11.1%
(Nutritional status, dietary practices andpattern of physical activity among school children 6 -12 years, 2017)
Ever married women 15-49 years
Height<145 cm 7.2%Thinness 9.1 %Overweight 31.9 %Obese 13.3 %
(DHS 2016)
Children (0-59 months)
Stunting 17.3%Wasting 15.1%Underweight 20.5%
(DHS 2016)
Anaemia 15.1%(6-59 months)
(NNMS 2012)
End of 2 years (18-23 m)
Stunting 21.2%Wasting 13.0%Underweight 19.8%
(DHS 2016)
Anaemia 26.5%(6-23 months)
(NNMS 2012)
End of 5 years (5th year)
Stunting 13.6%Wasting 15.4%Underweight 20.5%
(DHS 2016)
Adapted from Nutritional status in Sri Lanka, determinants and interventions:a desk review 2006-2011 Rajapaksa LC,Arambepola C, Gunawardena NS, Unicef 2012.
14 Childhood malnutrition in Sri Lanka: a road map for the last mile
3.1 Prevalence and trends of undernutrition in children under 5 years of age
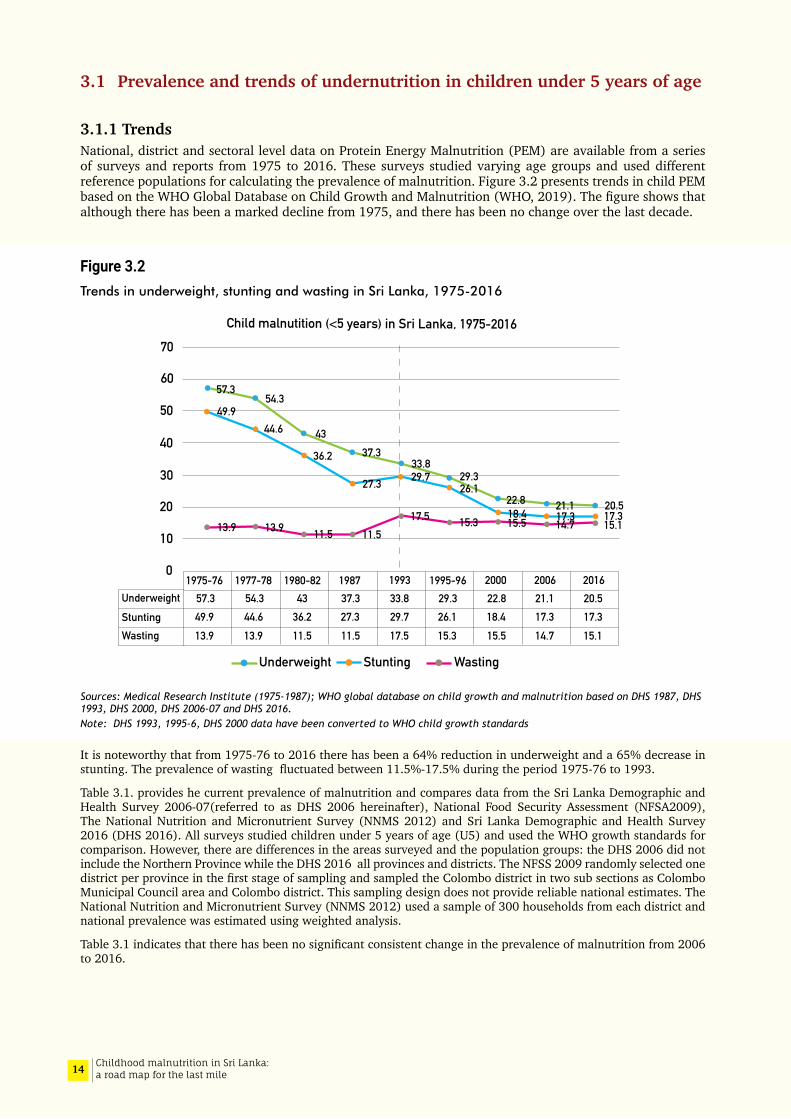
3.1.1 TrendsNational, district and sectoral level data on Protein Energy Malnutrition (PEM) are available from a series of surveys and reports from 1975 to 2016. These surveys studied varying age groups and used different reference populations for calculating the prevalence of malnutrition. Figure 3.2 presents trends in child PEM based on the WHO Global Database on Child Growth and Malnutrition (WHO, 2019). The figure shows that although there has been a marked decline from 1975, and there has been no change over the last decade.
Figure 3.2Trends in underweight, stunting and wasting in Sri Lanka, 1975-2016
Sources: Medical Research Institute (1975-1987); WHO global database on child growth and malnutrition based on DHS 1987, DHS 1993, DHS 2000, DHS 2006-07 and DHS 2016. Note: DHS 1993, 1995-6, DHS 2000 data have been converted to WHO child growth standards
It is noteworthy that from 1975-76 to 2016 there has been a 64% reduction in underweight and a 65% decrease in stunting. The prevalence of wasting fluctuated between 11.5%-17.5% during the period 1975-76 to 1993.
Table 3.1. provides he current prevalence of malnutrition and compares data from the Sri Lanka Demographic and Health Survey 2006-07(referred to as DHS 2006 hereinafter), National Food Security Assessment (NFSA2009), The National Nutrition and Micronutrient Survey (NNMS 2012) and Sri Lanka Demographic and Health Survey 2016 (DHS 2016). All surveys studied children under 5 years of age (U5) and used the WHO growth standards for comparison. However, there are differences in the areas surveyed and the population groups: the DHS 2006 did not include the Northern Province while the DHS 2016 all provinces and districts. The NFSS 2009 randomly selected one district per province in the first stage of sampling and sampled the Colombo district in two sub sections as Colombo Municipal Council area and Colombo district. This sampling design does not provide reliable national estimates. The National Nutrition and Micronutrient Survey (NNMS 2012) used a sample of 300 households from each district and national prevalence was estimated using weighted analysis.
Table 3.1 indicates that there has been no significant consistent change in the prevalence of malnutrition from 2006 to 2016.
57.354.3
4337.3
33.829.3
22.8 21.1 20.517.317.318.4
26.129.727.3
36.2
44.649.9
13.9 13.9 11.5 11.517.5 15.3 15.5 14.7 15.1
0
10
20
30
40
50
60
70
1975-76 1977-78 1980-82 1995-96 1987 1993 2000 2006 2016Underweight 57.3 54.3 37.3 33.8 29.3 22.8 21.1 20.5
17.3 17.3 18.4 26.1 29.7 27.3 36.2 44.6 49.9 13.9 13.9 11.5 11.5 17.5 15.3 15.5 15.1 14.7
43 StuntingWasting
Underweight Stunting Wasting
Child malnutition (<5 years) in Sri Lanka, 1975-2016

15Childhood malnutrition in Sri Lanka: a road map for the last mile
Table 3.1Comparison of child nutrition data from the DHS 2006, NFSA 2009, NNMS 2012and DHS 2016
Year of survey No. of children
Height for age Weight for height Weight for age
< -3SD < -2SD < -3SD < -2SD < -3SD < -2SD
2006 (DHS)a 6648 3.9 17.3 2.8 14.7 3.7 21.1
2009 (NFSA)b 2588 4.6 19.2 1.9 11.7 3.9 21.6
2012 (NNMS)c 7306 2.0 13.1 2.3 19.6 3.8 23.5
2016 (DHS) 7909 4.1 17.3 3.0 15.1 4.0 20.5a DHS-Demographic and Health Survey, b NFSA–Nutrition and Food Security Assessment, c NNMS- National Nutrition and Micronutrient Survey
3.1.2 StuntingFigure 3.3 provides the trends, projections and targets in the prevalence and number of U5 children who are stunted. According to WHO tracking tool, the 2025 target for the prevalence of stunting in U-5 children in Sri Lanka is 10.8%. However, the rate of stunting has remained relatively unchanged from 2006 to 2016 in the range categorised as being of medium public health significance (WHO cut-off values for public health significance). At a rate of 17.3% it is estimated that around 300,000 children under five years are stunted.
Figure 3.3Trend, projections and targets in the prevalence and number of children (under-five) stunted in Sri Lanka
Source: European Commission, 2017
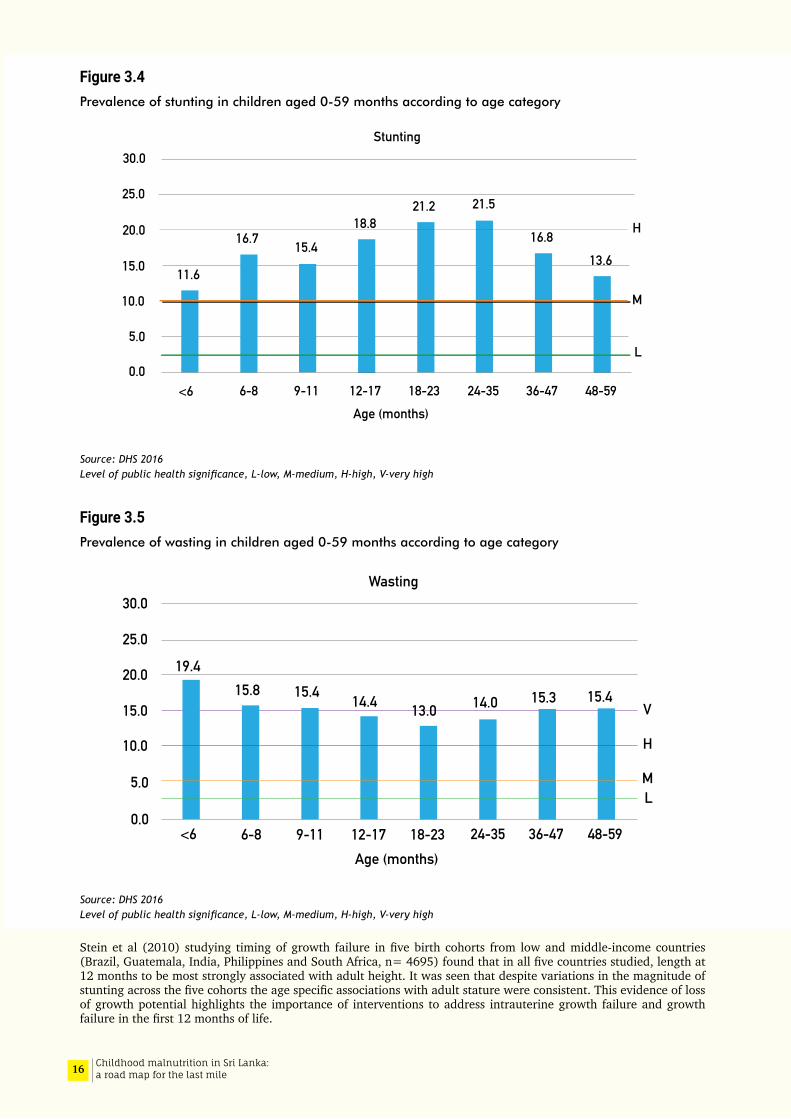
Disaggregating stunting prevalence by age categories shows that much of the insult occurs during the first 1000 days of life; “the critical window of opportunity for optimum growth”. Although cross sectional data should be interpreted with caution, stunting appears to have an additive effect, the prevalence showing an increase until three years of age (Figure 3.4)
Stunting is lowest among children whose mothers have a degree level education (12%) and three times higher when mothers are uneducated (38%). It is also two times high among the poorest wealth quintile (25%) compared to the wealthiest quintile (12%). The percentage stunted among the wealthiest quintile has increased by 3.6 percentage points in the 2016 DHS compared to the DHS 2006. Stunting shows an increasing trend from <6 months to 24-35 months but declines thereafter and is not different between males and females (Male 17.9% Female 16.6%).
Sri lanka, Projection and targets in the prevelance and number of children(under five) stunted
0.610.51
0.45
0.30
2.99%0.35
0.310.26 0.18
0.14 0.15
0.16
WHA targetby 2025
Govt. target 9%stunting by 2020
1983 1988 1994 1999 2005 2010 2016 2021 20270
5
10
15
20
25
30
35
40
No new data since 2012,so no change determined
in the rate of stuntingreduction
Number of stuntedestimated by surveys(million)
Projected number of stunted children caculated in 2017(million)
Average annual rate of reduction in stuntingestimated in 2017
Prev
elan
ce o
f stu
ntin
g (%
)
16 Childhood malnutrition in Sri Lanka: a road map for the last mile
Figure 3.4Prevalence of stunting in children aged 0-59 months according to age category
Source: DHS 2016 Level of public health significance, L-low, M-medium, H-high, V-very high
Figure 3.5Prevalence of wasting in children aged 0-59 months according to age category
Source: DHS 2016 Level of public health significance, L-low, M-medium, H-high, V-very high
Stein et al (2010) studying timing of growth failure in five birth cohorts from low and middle-income countries (Brazil, Guatemala, India, Philippines and South Africa, n= 4695) found that in all five countries studied, length at 12 months to be most strongly associated with adult height. It was seen that despite variations in the magnitude of stunting across the five cohorts the age specific associations with adult stature were consistent. This evidence of loss of growth potential highlights the importance of interventions to address intrauterine growth failure and growth failure in the first 12 months of life.
30.0
25.0
20.0
15.0
10.0
5.0
0.0
11.6
16.7 15.4
18.821.2 21.5
16.813.6
H
M
L
<6 6-8 9-11 12-17 18-23 24-35 36-47 48-59Age (months)
Stunting
30.0
25.0
20.0
15.0
10.0
5.0
0.0<6 6-8 9-11 12-17 18-23 24-35 36-47 48-59
Wasting
Age (months)
V
H
ML
19.415.8 15.4 14.4 13.0
15.3 15.414.0

17Childhood malnutrition in Sri Lanka: a road map for the last mile
3.1.3 WastingWasting and severe wasting appears to have remained static from 2006 to 2016. The 2016 prevalence of wasting is of very high public health significance. The 2012 data from the NNMS shows an unusual feature; where the prevalence of wasting is seen to be higher than the prevalence of stunting. In most countries where there are high rates of child malnutrition, the prevalence of stunting which is a reflection of chronic deprivation and repeated infections is higher than that of wasting which reflects acute weight loss due to illness or short-term deprivation.
Prevalence of wasting decreases with maternal education. The prevalence of wasting in children whose mothers have a degree level education is half (9%) that of children of mothers with no education (18%). Wasting is high among children whose mothers have a low BMI (24.5%), and higher in the poorest quintile (17%) compared to the highest wealth quintile (10%). Wasting gradually declines from <6 months of age up to the end of the second year (<6 months: 19.4%, 18-23 months: 13.0%) and gradually increases thereafter (48-59 months:15.4%) (Figure 3.5). There is no sex difference in wasting (male 15.4% female 14.7%).
3.1.4 Severe Acute Malnutrition According to the 2016 DHS, the prevalence of severe acute malnutrition [SAM] (WHZ <-3) and moderate acute malnutrition [MAM] (WHZ from <-2 to -3) in U-5 children were 3.0% and 12.1% respectively (Figure 3.6). Distribution WHZ shows a normal distribution pattern, with relatively low number of children being in the lower and upper extremities (Figures 1 and 2 in Annex 3.1). Differentials of SAM, MAM and overweight in children aged < 24 months are described in detail in the Tables 1 to 7 in Annex 3.2.
A very high rate of SAM was found in children with very low birth weight (15% in <2.0 kg birth-weights) and those born before 37 weeks of POA (10.3%), with marked differences in SAM across the districts.
Figure 3.6Prevalence of SAM, MAM and overweight in children under 5 years of age, SLDHS 2016
SAM – Severe Acute Malnutrition; MAM – Moderate Acute Malnutrition WHZ – weight-for-height Z score
3.1.5 UnderweightThe 2016 DHS reported that one in five U-5 children are underweight, which is of high public health significance. Underweight may reflect wasting (i.e. low weight-for-height) and/or stunting (i.e. low height-for-age).
WHZ 0 to +2,19.6%
WHZ -2 to 0,63.3%
WHZ > +2, 2.0%
SAM, 3.0%
SAM - Severe Acute MalnutritionMAM - Moderate Acute MalnutritionWHZ - Weight-for-height Z score
MAM, 12.1%
18 Childhood malnutrition in Sri Lanka: a road map for the last mile
3.2 Sectoral variation in stunting and wasting
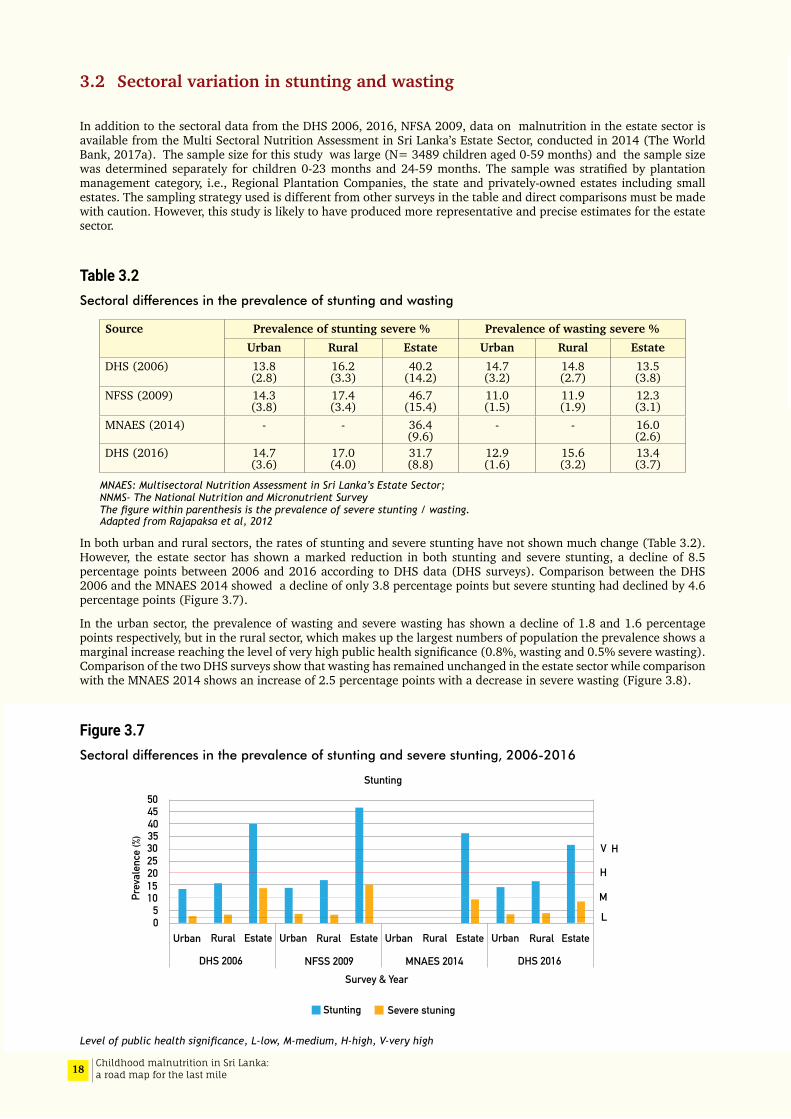
In addition to the sectoral data from the DHS 2006, 2016, NFSA 2009, data on malnutrition in the estate sector is available from the Multi Sectoral Nutrition Assessment in Sri Lanka’s Estate Sector, conducted in 2014 (The World Bank, 2017a). The sample size for this study was large (N= 3489 children aged 0-59 months) and the sample size was determined separately for children 0-23 months and 24-59 months. The sample was stratified by plantation management category, i.e., Regional Plantation Companies, the state and privately-owned estates including small estates. The sampling strategy used is different from other surveys in the table and direct comparisons must be made with caution. However, this study is likely to have produced more representative and precise estimates for the estate sector.
Table 3.2Sectoral differences in the prevalence of stunting and wasting
Source Prevalence of stunting severe % Prevalence of wasting severe %Urban Rural Estate Urban Rural Estate
DHS (2006) 13.8 (2.8)
16.2 (3.3)
40.2 (14.2)
14.7 (3.2)
14.8 (2.7)
13.5 (3.8)
NFSS (2009) 14.3 (3.8)
17.4 (3.4)
46.7 (15.4)
11.0 (1.5)
11.9 (1.9)
12.3 (3.1)
MNAES (2014) - - 36.4 (9.6)
- - 16.0 (2.6)
DHS (2016) 14.7 (3.6)
17.0 (4.0)
31.7 (8.8)
12.9 (1.6)
15.6 (3.2)
13.4 (3.7)
MNAES: Multisectoral Nutrition Assessment in Sri Lanka’s Estate Sector; NNMS- The National Nutrition and Micronutrient Survey The figure within parenthesis is the prevalence of severe stunting / wasting. Adapted from Rajapaksa et al, 2012
In both urban and rural sectors, the rates of stunting and severe stunting have not shown much change (Table 3.2). However, the estate sector has shown a marked reduction in both stunting and severe stunting, a decline of 8.5 percentage points between 2006 and 2016 according to DHS data (DHS surveys). Comparison between the DHS 2006 and the MNAES 2014 showed a decline of only 3.8 percentage points but severe stunting had declined by 4.6 percentage points (Figure 3.7).
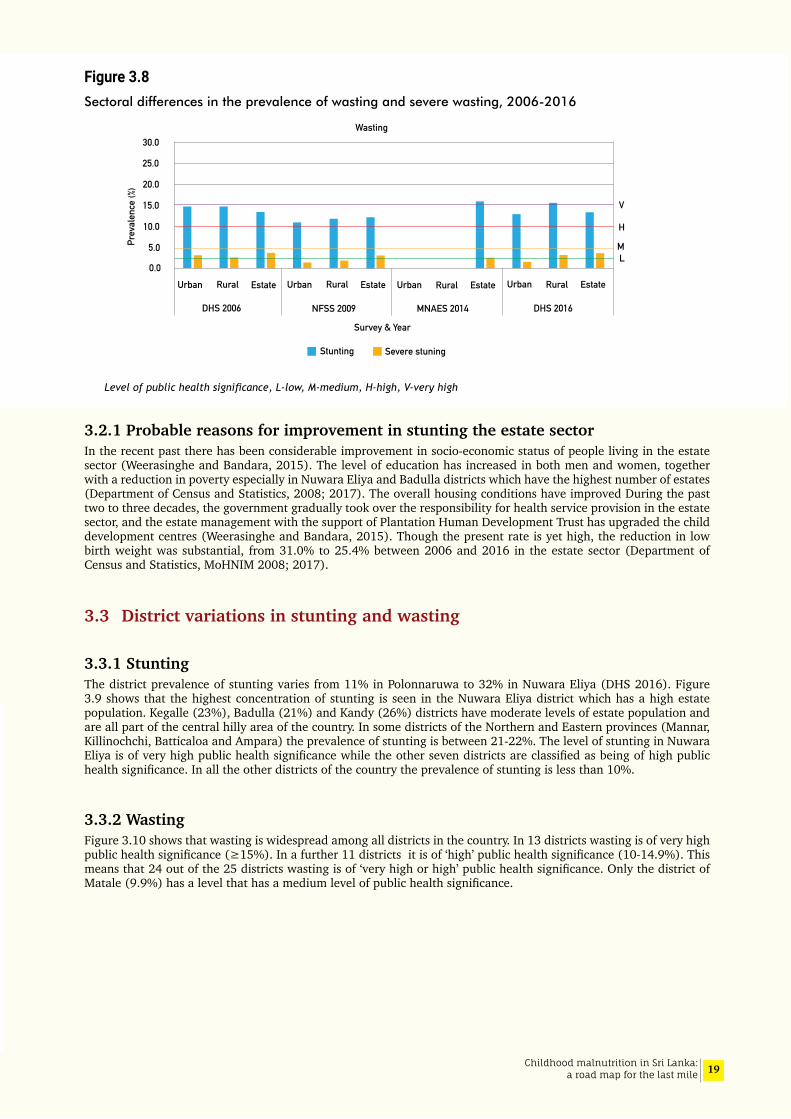
In the urban sector, the prevalence of wasting and severe wasting has shown a decline of 1.8 and 1.6 percentage points respectively, but in the rural sector, which makes up the largest numbers of population the prevalence shows a marginal increase reaching the level of very high public health significance (0.8%, wasting and 0.5% severe wasting). Comparison of the two DHS surveys show that wasting has remained unchanged in the estate sector while comparison with the MNAES 2014 shows an increase of 2.5 percentage points with a decrease in severe wasting (Figure 3.8).
Figure 3.7Sectoral differences in the prevalence of stunting and severe stunting, 2006-2016
Level of public health significance, L-low, M-medium, H-high, V-very high
3025201510
50
3540 4550
Prev
alen
ce (%
)
Urban Rural Estate Urban Rural Estate Urban Rural Estate Urban Rural Estate
DHS 2016MNAES 2014NFSS 2009Survey & Year
Stunting Severe stuning
DHS 2006
V H
M
L
H
Stunting
19Childhood malnutrition in Sri Lanka: a road map for the last mile
Figure 3.8Sectoral differences in the prevalence of wasting and severe wasting, 2006-2016
Level of public health significance, L-low, M-medium, H-high, V-very high
3.2.1 Probable reasons for improvement in stunting the estate sectorIn the recent past there has been considerable improvement in socio-economic status of people living in the estate sector (Weerasinghe and Bandara, 2015). The level of education has increased in both men and women, together with a reduction in poverty especially in Nuwara Eliya and Badulla districts which have the highest number of estates (Department of Census and Statistics, 2008; 2017). The overall housing conditions have improved During the past two to three decades, the government gradually took over the responsibility for health service provision in the estate sector, and the estate management with the support of Plantation Human Development Trust has upgraded the child development centres (Weerasinghe and Bandara, 2015). Though the present rate is yet high, the reduction in low birth weight was substantial, from 31.0% to 25.4% between 2006 and 2016 in the estate sector (Department of Census and Statistics, MoHNIM 2008; 2017).
3.3 District variations in stunting and wasting
3.3.1 StuntingThe district prevalence of stunting varies from 11% in Polonnaruwa to 32% in Nuwara Eliya (DHS 2016). Figure 3.9 shows that the highest concentration of stunting is seen in the Nuwara Eliya district which has a high estate population. Kegalle (23%), Badulla (21%) and Kandy (26%) districts have moderate levels of estate population and are all part of the central hilly area of the country. In some districts of the Northern and Eastern provinces (Mannar, Killinochchi, Batticaloa and Ampara) the prevalence of stunting is between 21-22%. The level of stunting in Nuwara Eliya is of very high public health significance while the other seven districts are classified as being of high public health significance. In all the other districts of the country the prevalence of stunting is less than 10%.
3.3.2 WastingFigure 3.10 shows that wasting is widespread among all districts in the country. In 13 districts wasting is of very high public health significance (≥15%). In a further 11 districts it is of ‘high’ public health significance (10-14.9%). This means that 24 out of the 25 districts wasting is of ‘very high or high’ public health significance. Only the district of Matale (9.9%) has a level that has a medium level of public health significance.
30.0
25.0
20.0
15.0
10.0
5.0
0.0Urban Rural Estate Urban Rural Estate Urban Rural Estate Urban Rural Estate
DHS 2016MNAES 2014NFSS 2009
Survey & Year
Stunting Severe stuning
DHS 2006
V
ML
H
Prev
alen
ce (%
)Wasting

20 Childhood malnutrition in Sri Lanka: a road map for the last mile
Figure 3.9District distribution of prevalence of stunting in Sri Lanka, DHS 2016
Figure 3.10District distribution of prevalence of wasting in Sri Lanka, DHS 2016
Prevelance of Stunting
Kilinochchi21%
Jaffna14%
Mullativu17%
Anuradhapura19%
Puttalam12%
Kurunegala18%
Gampaha13%
Kegalle23%
Kandy26%
Badulla21%Nuwara Eliya
32%
Ratnapura 18%Kalutara
13%
Galle 13% Matara
16%
Hambantota12%
Monaragala16%
Ampara22%
Colombo 16%
Matale14%
Polonnaruwa11%
Batticaloa21%
Trincomalee16%
Vavuniya19%
Mannar21%
<10%
10-20%
20-30%
>30%
Prevelance of Wasting <5%
5-10%
10-15%
>15%
Kilinochchi17%
Jaffna12%
Mullativu22%
Anuradhapura20%
Puttalam17%
Kurunegala14%
Gampaha16%
Kegalle16%
Kandy13%
Badulla13%Nuwara Eliya
12%
Ratnapura 16%
Kalutara 17%
Galle 17% Matara
17%
Hambantota22%
Monaragala25%
Ampara12%
Colombo 12%
Matale10%
Polonnaruwa11%
Batticaloa14%
Trincomalee12%
Vavuniya16%Mannar
13%
21Childhood malnutrition in Sri Lanka: a road map for the last mile
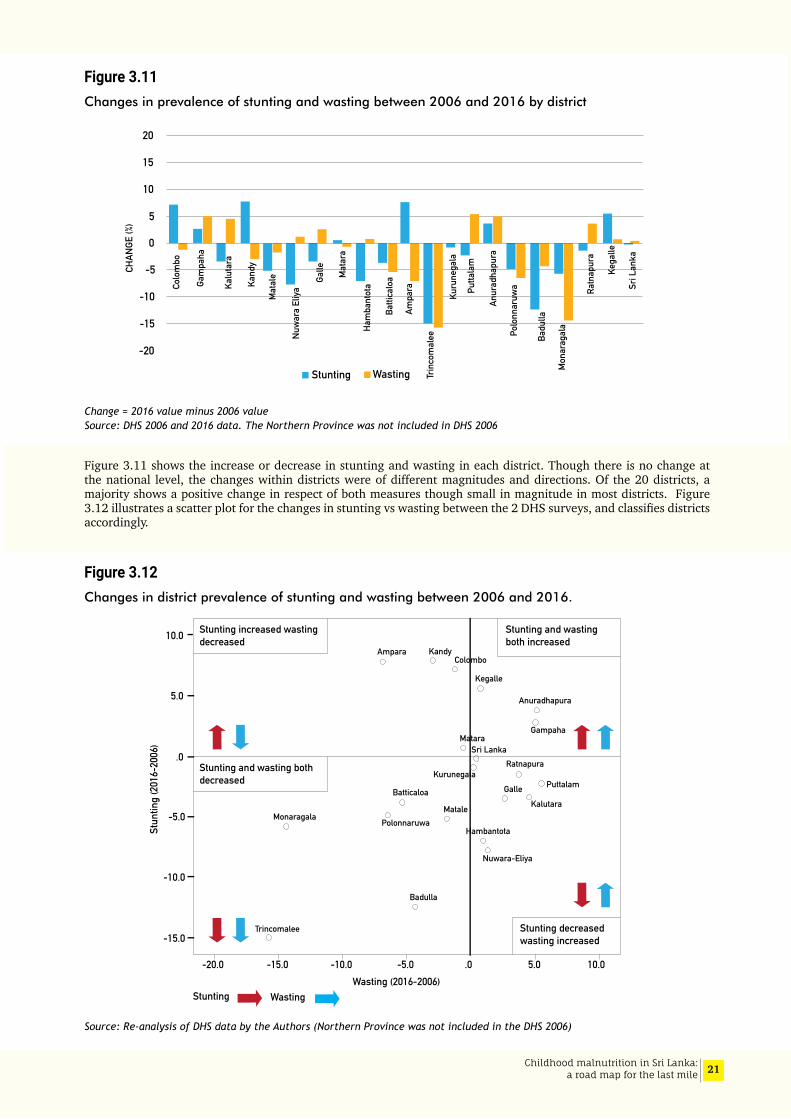
Figure 3.11Changes in prevalence of stunting and wasting between 2006 and 2016 by district
Change = 2016 value minus 2006 value Source: DHS 2006 and 2016 data. The Northern Province was not included in DHS 2006
Figure 3.11 shows the increase or decrease in stunting and wasting in each district. Though there is no change at the national level, the changes within districts were of different magnitudes and directions. Of the 20 districts, a majority shows a positive change in respect of both measures though small in magnitude in most districts. Figure 3.12 illustrates a scatter plot for the changes in stunting vs wasting between the 2 DHS surveys, and classifies districts accordingly.
Figure 3.12Changes in district prevalence of stunting and wasting between 2006 and 2016.
Source: Re-analysis of DHS data by the Authors (Northern Province was not included in the DHS 2006)
20
15
10
5
0
-20
-15
-10
-5CHAN
GE (%
)
Stunting Wasting
Colo
mbo
Gam
paha
Kalu
tara
Kand
y
Mat
ale
Nuw
ara
Eliya
Galle Mat
ara
Ham
bant
ota
Batti
calo
a
Ampa
ra
Trin
com
alee
Kuru
nega
la
Putta
lam
Anur
adha
pura
Polo
nnar
uwa
Badu
lla
Mon
arag
ala
Ratn
apur
a
Kega
lle
Sri L
anka
Stunting increased wastingdecreased
Stunting and wasting bothdecreased
Stunting decreasedwasting increased
Stunting and wastingboth increased
-15.0
-10.0
-5.0
5.0
10.0
.0
-20.0 -15.0 -10.0 -5.0 10.0 5.0 .0
Badulla
Colombo
Gampaha
Kandy
HambantotaPolonnaruwa
Ampara
PuttalamKurunegala
Matale Kalutara
Nuwara-Eliya
Sri Lanka
Kegalle
Monaragala
Anuradhapura
Batticaloa
Trincomalee
Ratnapura
Galle
Matara
Stun
ting
(201
6-20
06)
Wasting (2016-2006)Stunting Wasting
22 Childhood malnutrition in Sri Lanka: a road map for the last mile
3.3.3 Further analysis of DHS 2006: socioeconomic inequality, birth weight and child malnutrition
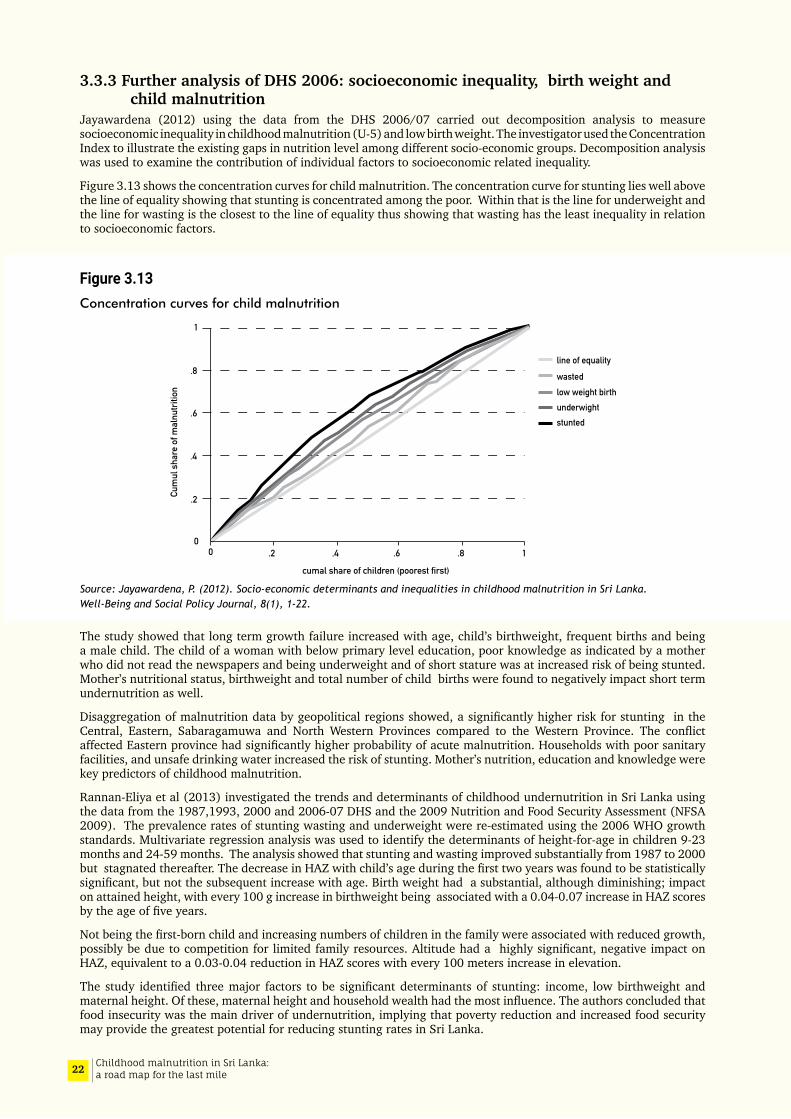
Jayawardena (2012) using the data from the DHS 2006/07 carried out decomposition analysis to measure socioeconomic inequality in childhood malnutrition (U-5) and low birth weight. The investigator used the Concentration Index to illustrate the existing gaps in nutrition level among different socio-economic groups. Decomposition analysis was used to examine the contribution of individual factors to socioeconomic related inequality.
Figure 3.13 shows the concentration curves for child malnutrition. The concentration curve for stunting lies well above the line of equality showing that stunting is concentrated among the poor. Within that is the line for underweight and the line for wasting is the closest to the line of equality thus showing that wasting has the least inequality in relation to socioeconomic factors.
Figure 3.13Concentration curves for child malnutrition
Source: Jayawardena, P. (2012). Socio-economic determinants and inequalities in childhood malnutrition in Sri Lanka. Well-Being and Social Policy Journal, 8(1), 1-22.
The study showed that long term growth failure increased with age, child’s birthweight, frequent births and being a male child. The child of a woman with below primary level education, poor knowledge as indicated by a mother who did not read the newspapers and being underweight and of short stature was at increased risk of being stunted. Mother’s nutritional status, birthweight and total number of child births were found to negatively impact short term undernutrition as well.
Disaggregation of malnutrition data by geopolitical regions showed, a significantly higher risk for stunting in the Central, Eastern, Sabaragamuwa and North Western Provinces compared to the Western Province. The conflict affected Eastern province had significantly higher probability of acute malnutrition. Households with poor sanitary facilities, and unsafe drinking water increased the risk of stunting. Mother’s nutrition, education and knowledge were key predictors of childhood malnutrition.
Rannan-Eliya et al (2013) investigated the trends and determinants of childhood undernutrition in Sri Lanka using the data from the 1987,1993, 2000 and 2006-07 DHS and the 2009 Nutrition and Food Security Assessment (NFSA 2009). The prevalence rates of stunting wasting and underweight were re-estimated using the 2006 WHO growth standards. Multivariate regression analysis was used to identify the determinants of height-for-age in children 9-23 months and 24-59 months. The analysis showed that stunting and wasting improved substantially from 1987 to 2000 but stagnated thereafter. The decrease in HAZ with child’s age during the first two years was found to be statistically significant, but not the subsequent increase with age. Birth weight had a substantial, although diminishing; impact on attained height, with every 100 g increase in birthweight being associated with a 0.04-0.07 increase in HAZ scores by the age of five years.
Not being the first-born child and increasing numbers of children in the family were associated with reduced growth, possibly be due to competition for limited family resources. Altitude had a highly significant, negative impact on HAZ, equivalent to a 0.03-0.04 reduction in HAZ scores with every 100 meters increase in elevation.
The study identified three major factors to be significant determinants of stunting: income, low birthweight and maternal height. Of these, maternal height and household wealth had the most influence. The authors concluded that food insecurity was the main driver of undernutrition, implying that poverty reduction and increased food security may provide the greatest potential for reducing stunting rates in Sri Lanka.
00
.2
.2
.4
.4
.6
.6 .8
.8
1
1
Cum
ul s
hare
of m
alnu
tritio
n
cumal share of children (poorest first)
underwight
line of equality
wastedlow weight birth
stunted

23Childhood malnutrition in Sri Lanka: a road map for the last mile
Maternal height was identified as a major determinant of birthweight as well as subsequent growth in height. The effects of maternal height were examined by adjusting maternal heights to match the reported maternal heights of the MGRS study that generated the WHO growth standards (WHO Multicentre Growth Reference Study Group, 2006). In this re-weighted sample, the overall rate of stunting falls to 4% in the richest quintile (overall 9%, poorest quintile 19%), implying that in the most affluent families in Sri Lanka, the children already grow at similar rates to the WHO reference population when maternal heights are similar. The authors argue that the findings of the simulation imply that about half the shortfall in child height growth in Sri Lanka, and almost all that in the richest quintile, can be explained by the shortness of the average Sri Lankan mother which may be a genetic influence or be mediated through epigenetic factors through intergenerational effects. The authors refer to the fact that a similar explanation has been offered in a study of child growth in Hong Kong Special Administrative Region, a population which is affluent and healthy but where mothers remain short.
3.3.4 Addressing stunting through nutrition counselling Sujendran (2016) developed a nutrition counselling intervention package for the improvement of nutritional status of children aged 6-36 months and evaluated the effectiveness of the package in Batticaloa and Kalmunai Regional Director of Health Services areas in the Eastern Province. Two parallel arm cluster randomized controlled trial was carried out using Public Health Midwife (PHM) divisions as clusters. Forty-four PHM divisions were randomized either to intervention or control arm (22 each), recruiting 880 mother-baby pairs within each arm. Hands on skills development through PHMs on achieving an optimum diet using locally grown foods was the mainstay of the intervention. The PHMs counselled mothers initially at weighing posts, and then during their home visits for 12 months in the intervention arm. significant improvement in nutritional status and feeding practices resulted in the intervention group in contrast to the control group. After 12 months of intervention there was significant improvement in mean HAZ, WHZ, WAZ and MUAC in the intervention arm compared to no change in the control arm. The intervention package was accepted by the health services in Batticaloa district. The package was made available as a booklet in both Tamil and English languages and is deemed suitable for scale-up in the area.
3.4 Regional and sectoral surveys
3.4.1 Assessment of nutritional status Northern province (2012)The Medical Research Institute (MRI) survey of the Northern Province 2012 (n=1192 households, 568 U-5 children) reported a 22.8% of children stunted, 18.3% wasted and 29.2% underweight (Jayatissa et al, 2012a). Prevalence of stunting showed an increasing trend up to the age of 36-47 months and then declined in 48-59 month old children. Wasting was low in the age groups <6 months and 6-11 months but there was no consistent pattern in the older age groups. Comparison between children from families who were resident and those who were resettled shows that all indicators of nutritional status were higher among the children from resettled families. This information however should be interpreted with caution since the stratification was not taken into consideration in the sampling.
3.4.2 Baseline survey of nutritional status among children under 5 years old and pregnant and lactating mothers in the Northern Province (Unpublished data of the World Bank - JSDF project 2012)
This survey sampled 2000 children aged 0-59 months from the Northern Province which ensured adequate numbers to make valid estimates at provincial level The overall prevalence of stunting in U-5 children was 19.2% with 4.3% being severely stunted (less than that reported from the 2012 MRI survey). The sample size of the World Bank-Japan Social Development Fund (JSDF) project survey is much larger than the MRI survey and therefore estimates are more likely to be robust. Among the districts of the Northern Province the prevalence of stunting varied from 18.5% in the Jaffna district to 24.3% in Mullaitivu district. The rate was 3.3% higher among male children (males: 20.8%, females: 17.5%). The prevalence was lowest in the 6-11 months age group, increasing up to 24-35 months (24.1%) and declining again to 21.7% in the older children (aged 48-59 months) Education level of the mother was inversely related to the prevalence of stunting, and in children whose mothers had no schooling, the prevalence was 7 times higher than in those whose mothers had a tertiary level education. Multivariate analysis examining individual, household and community factors for children 0-23 months showed that low birth weight (AOR 3.19), mother’s knowledge on nutrition being poor (AOR 8) and being from a household without a toilet (AOR 1.49) were risk factors associated with stunting.
Global acute malnutrition was seen in 20.1 percent of children, with 15.7 % being moderately malnourished (MAM) and 5.6% classified as having severe acute malnutrition (SAM). Multivariate analysis showed that adjusted rates for wasting increased with age, at 12-17 months, a child was 1.7 times more likely to be at risk of wasting compared to a child aged 6-11 months. The risk of acute malnutrition was higher (1.54 times) if the child was of low birth weight compared to a child born with a normal weight. A household with no toilet facilities (AOR 2.02) and those reporting
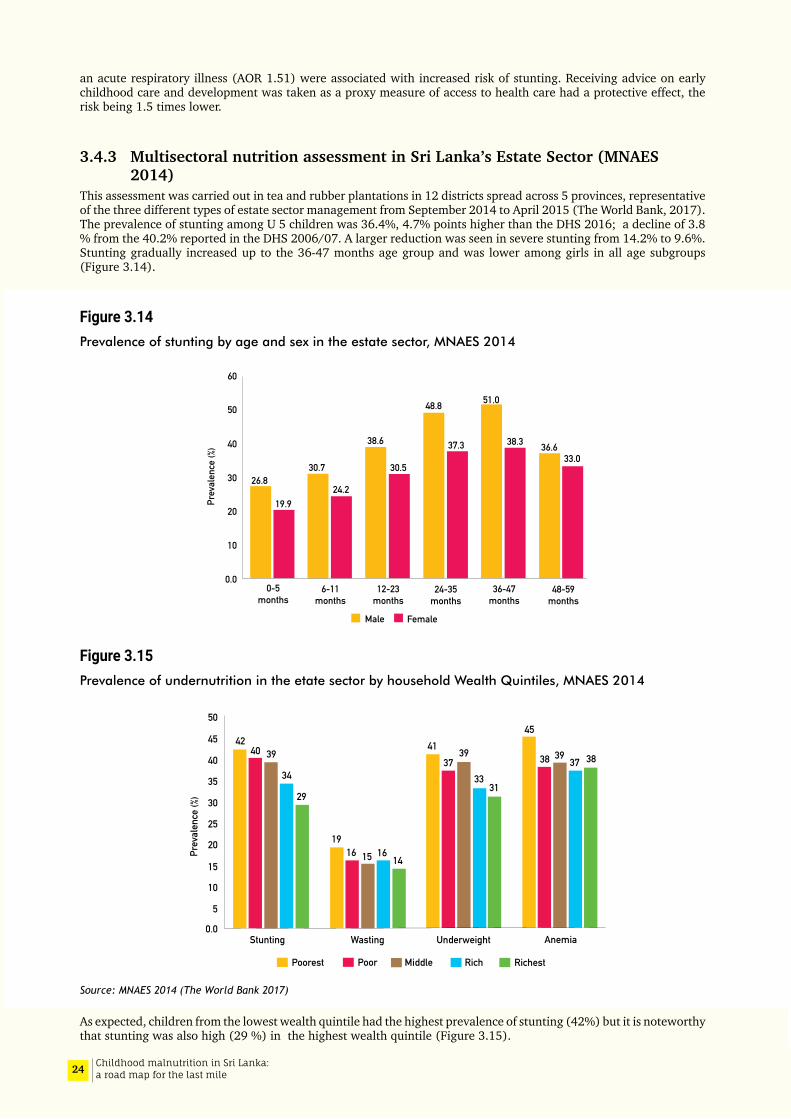
24 Childhood malnutrition in Sri Lanka: a road map for the last mile
an acute respiratory illness (AOR 1.51) were associated with increased risk of stunting. Receiving advice on early childhood care and development was taken as a proxy measure of access to health care had a protective effect, the risk being 1.5 times lower.
3.4.3 Multisectoral nutrition assessment in Sri Lanka’s Estate Sector (MNAES 2014)
This assessment was carried out in tea and rubber plantations in 12 districts spread across 5 provinces, representative of the three different types of estate sector management from September 2014 to April 2015 (The World Bank, 2017). The prevalence of stunting among U 5 children was 36.4%, 4.7% points higher than the DHS 2016; a decline of 3.8 % from the 40.2% reported in the DHS 2006/07. A larger reduction was seen in severe stunting from 14.2% to 9.6%. Stunting gradually increased up to the 36-47 months age group and was lower among girls in all age subgroups (Figure 3.14).
Figure 3.14 Prevalence of stunting by age and sex in the estate sector, MNAES 2014
Figure 3.15Prevalence of undernutrition in the etate sector by household Wealth Quintiles, MNAES 2014
Source: MNAES 2014 (The World Bank 2017)
As expected, children from the lowest wealth quintile had the highest prevalence of stunting (42%) but it is noteworthy that stunting was also high (29 %) in the highest wealth quintile (Figure 3.15).
30
20
10
0.0
40
50
60
Prev
alen
ce (%
)
26.8
19.9
30.7
24.2
38.6
30.5
48.8
37.3
51.0
38.3 36.633.0
0-5months
6-11months
12-23months
24-35months
36-47months
48-59months
Male Female
30
20
10
0.0
40
50
15
25
35
45
5
Stunting Wasting Underweight Anemia
Poorest Poor Middle Rich Richest
4240 39
34
29
1916 15 16
14
4137
39
3331
45
38 3937 38
Prev
alen
ce (%
)

25Childhood malnutrition in Sri Lanka: a road map for the last mile
The underweight prevalence was 16%, higher than reported from the 2006/07 DHS (13.5%) and a 2.6% increase from the DHS 2016 (13.4%). Prevalence of wasting was higher among the older children but in contrast to stunting did not show a significant variation across wealth quintiles and showed no differences across sex of the child in age group.
Based on the WHO classification of public health significance (Annex 1.1), both the stunting and wasting rates are of very high public health significance.
3.5 Micronutrientdeficienciesamongchildren6-59monthsofage
3.5.1 AnaemiaThe Nutrition and Food Security Assessment carried out in 2009, measured the haemoglobin concentration in 2373 children (aged 6-59 months ) using the Haemocue method. The cut-off point used was a haemoglobin level below 11.0 g/dl (MRI, 2009). The prevalence of anaemia was 25.2%. The highest prevalence was noted in the latter half of the first year of age (50.4%) and declined with increasing age, the lowest prevalence being 10.2% in the 48-59 months age group. Male children had higher prevalence compared to females. District prevalence varied; the highest prevalence being from the Jaffna district (34.0%) and the lowest in Kurunegala (19.3%).
The National Nutrition and Micronutrient Survey (2012), where the sample size calculation was based on the prevalence of zinc deficiency, sampled 300 children between 6-59 months from each district. Haemoglobin estimation was done in a total of 7050 children. In this group 15.1% were classified as anaemic, a value lower than in the earlier survey. Both surveys used the same cut off value of 11.0 g/dl. A similar relationship to age was observed in both surveys; the highest prevalence of 34% being in the 6-11 months age group with prevalence decreasing with increasing age. The lowest prevalence was noted in Kegalle district (4.9%) and the highest in Killinochchi (26.9 %) (Figure 3.16).
Of the 15.1% of anaemic children, 12.8% had haemoglobinopathies, 4.3% had evidence of acute infections and 52.3% were iron deficient. These conditions were not mutually exclusive. In the other 30.6% of anaemic children, the causes of anaemia could not be ascertained. The NNMS (2012) also measured iron, zinc and calcium deficiency in children 6-59 months of age. The survey did not assess folic acid and vitamin B12 levels.
The NNMS (2012) found that nearly a third of the population (33.6%) were iron deficient (ferritin level <12μg/dl) and 7.3% had iron deficiency anaemia (Hb<11g/dL and low ferritin <12μg/dl). The highest prevalence of iron deficiency anaemia was in the second year of life and showed a decreasing prevalence with increasing age. Iron deficiency anaemia was more common among boys. Anaemia was not related to maternal education, father’s occupation, and economic status. Iron deficiency was more prevalent in overweight children. The inter-district variation of iron deficiency anaemia and iron deficiency was wide.
Figure 3.16District disparities in the prevalence of anaemia in children aged 6 to 59 months, NNMS, 2012
Source: NNMS, 20120.0% 5.0% 10.0% 15.0% 20.0% 25.0% 30.0%
KegalleGalle
Hambantotamatara
RatnapuraMatale
Nuwara EliyaAmpara
MullativeKalutara
Sri LankaBatticaloMannar
GampahaBadulla
KurunegalaAnuradhapura
KandyColomboVavuniya
JaffnaPuttalam
PolonnaruwaTrincomaleeMonaragalaKilinochchi
4.9%8.9%
9.7%10.0%
11.1%12.9%
13.3%13.6%
14.3%14.7%
15.1%15.3%15.4%15.8%15.9%16.0%16.2%
16.9%17.1
18.1%18.6%
20.3%21.5%
23.1%25.6%
26.9%

26 Childhood malnutrition in Sri Lanka: a road map for the last mile
The Multisectoral Nutrition Assessment in Sri Lanka’s Estate Sector (The World Bank, 2017) estimated that 38.4% of children aged 6-59 months were anaemic. In the 6-23 months age group every other child was anaemic (53.1%), decreasing to 30.4% among the age group 24-59 months. The improvement in the older age groups is most likely due to increasing dietary diversity. Anaemia was a severe public health problem (≥40.0 %) in the younger age group (6-23 months) and a moderate problem (20.0-39.9%) in the older age group. The prevalence in the total group (6-59 months) was 38.4%, showing only a marginal reduction from the DHS 2006-07.
3.5.2ZincdeficiencyIn the NNMS Serum zinc levels were estimated in 4477 children aged 6-59 months, and zinc deficiency was defined as low serum zinc (<65 mcg/dL in the morning and,57 μg/dL in the afternoon with a normal C- reactive protein (<6.0). In the total sample, only 5.1% were zinc deficient. The prevalence decreased with increasing age and females had a higher prevalence. No statistically significant trends were seen with maternal education, father’s employment, household income, wealth quintiles or the number of members in the household.
The prevalence of zinc deficiency was higher among the wasted (6.3%) and underweight (5.9%) children compared to the stunted (4.9%). Five percent of nutritionally normal children of were deficient in zinc. Zinc levels were lowest among the overweight (2.7%) children. Almost 6.7% of anaemic children had zinc deficiency compared to those without anaemia and the prevalence was marginally higher among those who were not iron deficient (difference of 0.3% points).
The authors conclude that “in general zinc levels in this population could be considered satisfactory”.
3.5.3 Calcium The survey (NNMS) identified relatively high levels of calcium deficiency (prevalence of 47.6%). The lowest prevalence was seen among 6-11 month age group and the prevalence was not associated with any of the socioeconomic indicators examined. The inter-district variations were noted to be high. This needs further study.
3.5.4IodinedeficiencystatusinSriLankaIodine deficiency was identified as a public health problem in Sri Lanka in 1986 and a universal iodisation programme was launched in 1995. Since then four national surveys on iodine deficiency status have been carried out, the last two in 2010 and 2016. The overall goitre prevalence among children aged 6-10 years was 4.4 % in 2010 and 1.8% in 2016 showing that iodine deficiency is no longer a public health problem in the country. The median urinary iodine levels in all provinces was more than 100 μg/L with the highest levels in the Northern province and the lowest in Uva province. A wide variation in urinary iodine levels by province was noted. The 2016 survey showed that all provinces and at national level data indicated more than adequate iodine levels which is a cause for concern. This is a deviation from the 2000 survey which showed that the median iodine levels in all provinces and at national level showed ideal iodine status.
3.6 Nutritional status of non-pregnant women
3.6.1 Thinness, overweight and obesityThe NFSA 2009 and NNMS 2012 both report on the nutritional status of women. The NFSA 2009 reported on non-pregnant women aged 15-49 years in the identified households. The nutritional status was described using BMI and haemoglobin levels. In women under 20 years of age, 40.5% were classified as thin, while 22.5% of 20-29-year-old women were thin (Table 3.3). Overweight rose with increasing age from 14.3% in the below 20 years group to 35 % among 30-49-year olds (Table 3.4).
The NNMS 2012 reported on non-pregnant women aged 18-60 years. Thinness varied from 36.7% in women below 20 years of age to 13% in women aged 40-49 years. Overweight gradually increased up to 40-49 years and then declined to 24.6% in 50-59-year age group. The DHS 2016 sampled non-pregnant ever married women aged 15-49 years. thinness gradually decreased with age while obesity increased. In the 40-49-year age group, overweight and obesity was as high as 52%.
In all three surveys overweight and obesity shows a gradual increase up to 40-49 years and then declines with increasing age. Comparison of the three surveys suggests that there is a declining trend of thinness and an increasing trend towards overweight and obesity. The DHS 2016 survey noted that 45% of ever married women were overweight or obese (Table 3.4).

27Childhood malnutrition in Sri Lanka: a road map for the last mile
Table 3.3Prevalence of thinness (BMI <18.5kg/m2) by age group, 2010-2016
Survey Age (years)
< 20 20-29 30-39 40-49 50-59
NFSA 2009 40.5 22.5 12.9 14.2
NNMS 2012 36.7 10.9 10.6 13.6 9.0
DHS 2016a 22.9 16.3 7.8 6.2
a DHS sampled non-pregnant ever married women 15-49 years of age
Table 3.4Prevalence of Overweight and Obesity (BMI ≥ 25.0 kg/m2)
Survey Age (years)
< 20 years 20-29 30-39 40-49 50-59
NFSA 2009 14.3 22.9 35.3 35.1
NNMS 2012 7.3 (6.2) 9.8 (5.1) 27.6(9.4) 30.1(8.1) 24.6 (6.9)
DHS 2016a 20.9 % 32.8 % 45.9 52.0
*figures given include overweight or obese ** figure within parenthesis is % obese a DHS sampled non-pregnant ever married women 15-49 years of age
3.6.2 Anaemia in non-pregnant women The Nutrition and Food Security Survey 2009 reported the prevalence of anaemia to be 21.7% among non-pregnant and non-lactating women.
3.7 Undernutrition in pregnant and lactating mothers
3.7.1 Thinness National Nutrition and Micronutrient Survey of Pregnant Women in Sri Lanka (NNMS - Pregnant Women 2015) used a stratified multistage cluster sampling design. A sample of 300 women were identified from each district, the sampling design allowing district level estimates and national estimates based on weighted analysis.
Calculation of BMI was carried out for women whose anthropometric measurements were available prior to 12 weeks of pregnancy. The prevalence of thinness prior to 12 weeks pregnancy was 22.5%. Prevalence of thinness decreased with increasing age (Figure 3.17). The prevalence of women with a BMI less than 18.5 kg/m-2 decreased with the educational level of the woman and across increasing wealth quintiles. Estates and the rural sector showed an increased prevalence of thinness compared to? urban.
Acute undernutrition in pregnant women, as indicated by a Mid Upper Arm Circumference (MUAC) less than 23 cm was reported in 16.6% of pregnant women (Figure 3.18). Nearly 40% of women <20 years were acutely undernourished, the lowest level of 10.6% being in the age group 30-39 years of age. The estate sector had the highest prevalence of thinness (29.4%) while in the rural and urban sectors 17.0% and 11.6% respectively were thin. The prevalence was inversely related to educational level, the relationship to the wealth quintiles was not as clear, the levels decreasing from the lowest (20.3%) to 14.6% in the third quintile and showing no distinct pattern in the 4th (15.6%) and 5th quintiles (14.7%). District variations reported the highest prevalence in Nuwara Eliya Badulla and Matara, respectively (22.3%,21.8% and 21.6%). Colombo and Gampaha had the lowest prevalence, 11.6%, and 11.4% respectively.
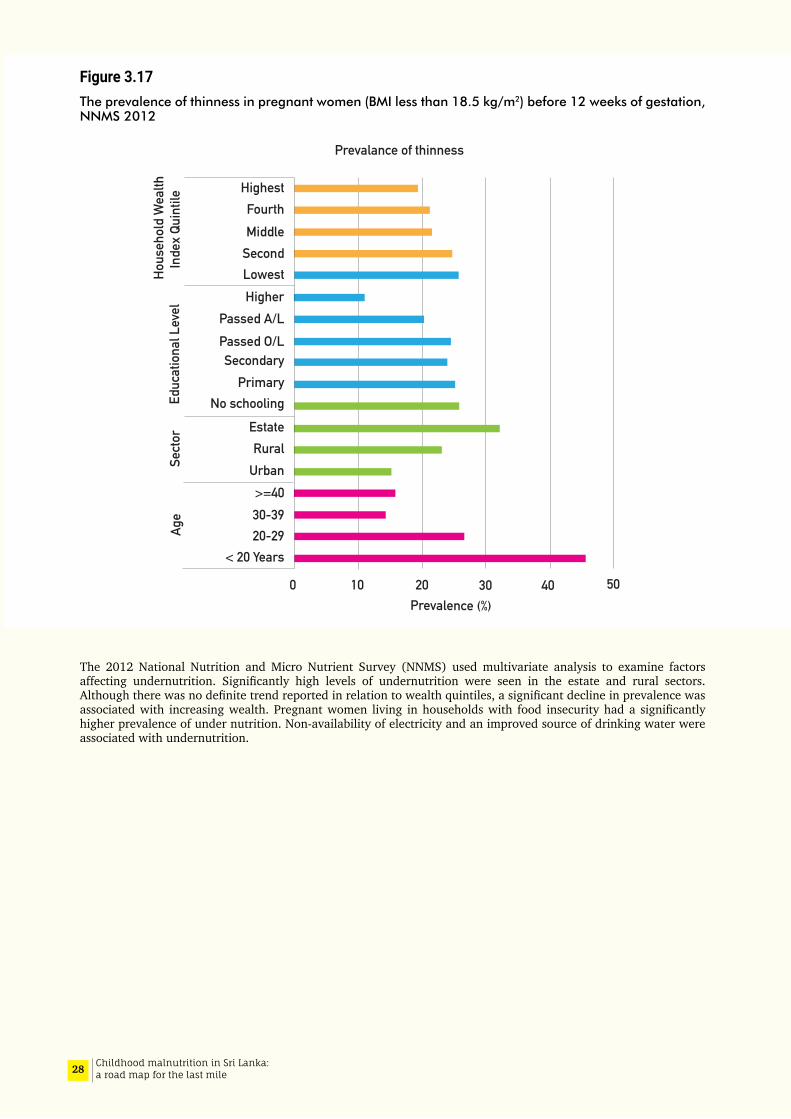
28 Childhood malnutrition in Sri Lanka: a road map for the last mile
Figure 3.17The prevalence of thinness in pregnant women (BMI less than 18.5 kg/m2) before 12 weeks of gestation, NNMS 2012
The 2012 National Nutrition and Micro Nutrient Survey (NNMS) used multivariate analysis to examine factors affecting undernutrition. Significantly high levels of undernutrition were seen in the estate and rural sectors. Although there was no definite trend reported in relation to wealth quintiles, a significant decline in prevalence was associated with increasing wealth. Pregnant women living in households with food insecurity had a significantly higher prevalence of under nutrition. Non-availability of electricity and an improved source of drinking water were associated with undernutrition.
3020100 40 50Prevalence (%)
Prevalance of thinness
HighestFourthMiddle
SecondLowestHigher
Passed A/LPassed O/LSecondary
PrimaryNo schooling
EstateRural
Urban>=4030-3920-29
< 20 Years
Age
Sect
orEd
ucat
iona
l Lev
elHo
useh
old
Wea
lthIn
dex
Quin
tile
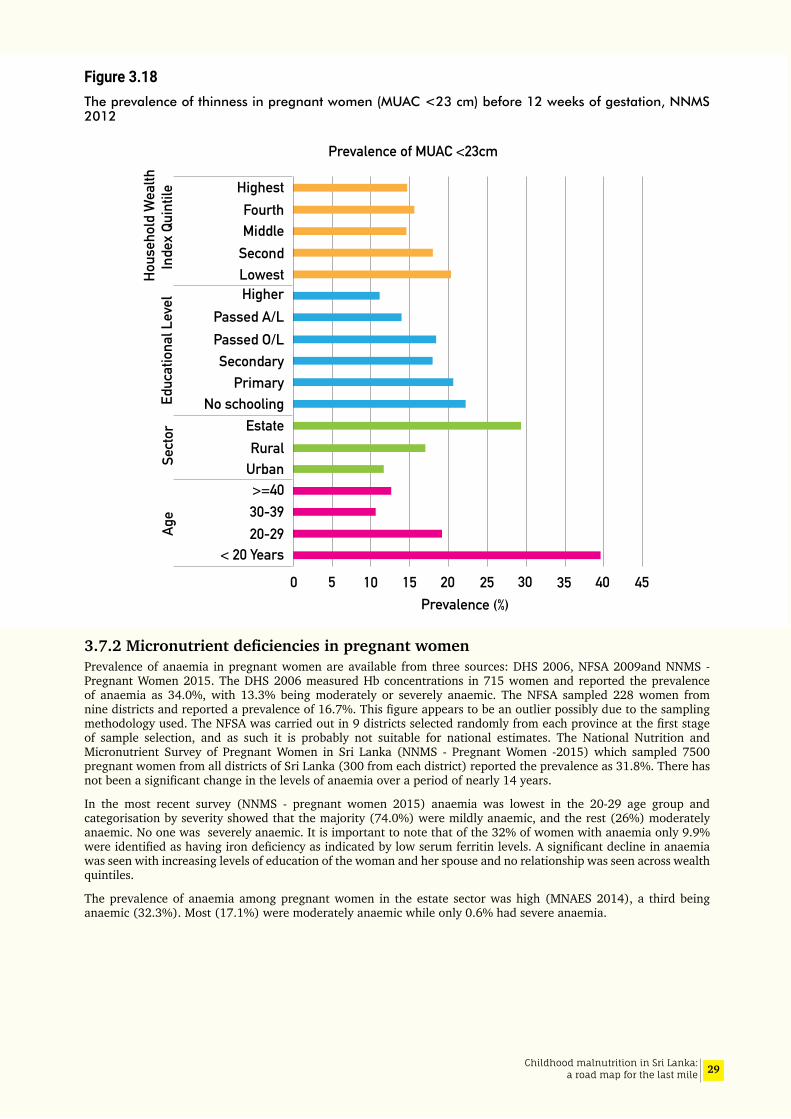
29Childhood malnutrition in Sri Lanka: a road map for the last mile
Figure 3.18The prevalence of thinness in pregnant women (MUAC <23 cm) before 12 weeks of gestation, NNMS 2012
3.7.2MicronutrientdeficienciesinpregnantwomenPrevalence of anaemia in pregnant women are available from three sources: DHS 2006, NFSA 2009and NNMS - Pregnant Women 2015. The DHS 2006 measured Hb concentrations in 715 women and reported the prevalence of anaemia as 34.0%, with 13.3% being moderately or severely anaemic. The NFSA sampled 228 women from nine districts and reported a prevalence of 16.7%. This figure appears to be an outlier possibly due to the sampling methodology used. The NFSA was carried out in 9 districts selected randomly from each province at the first stage of sample selection, and as such it is probably not suitable for national estimates. The National Nutrition and Micronutrient Survey of Pregnant Women in Sri Lanka (NNMS - Pregnant Women -2015) which sampled 7500 pregnant women from all districts of Sri Lanka (300 from each district) reported the prevalence as 31.8%. There has not been a significant change in the levels of anaemia over a period of nearly 14 years.
In the most recent survey (NNMS - pregnant women 2015) anaemia was lowest in the 20-29 age group and categorisation by severity showed that the majority (74.0%) were mildly anaemic, and the rest (26%) moderately anaemic. No one was severely anaemic. It is important to note that of the 32% of women with anaemia only 9.9% were identified as having iron deficiency as indicated by low serum ferritin levels. A significant decline in anaemia was seen with increasing levels of education of the woman and her spouse and no relationship was seen across wealth quintiles.
The prevalence of anaemia among pregnant women in the estate sector was high (MNAES 2014), a third being anaemic (32.3%). Most (17.1%) were moderately anaemic while only 0.6% had severe anaemia.
HighestFourthMiddle
SecondLowestHigher
Passed A/LPassed O/LSecondary
PrimaryNo schooling
EstateRural
Urban>=4030-3920-29
< 20 Years
Age
Sect
orEd
ucat
iona
l Lev
elHo
useh
old
Wea
lthIn
dex
Quin
tile
3020100 40 45Prevalence (%)
3525155
Prevalence of MUAC <23cm
30 Childhood malnutrition in Sri Lanka: a road map for the last mile
3.7.3 Nutritional status of lactating women National data on the nutritional status of lactating women in Sri Lanka are limited. The NFSA 2009 identified 921 lactating women in the identified households. Of these, 20.5% were anaemic. Information on lactating women are available from a MRI survey done in 2015 (NNS- Lactating Women 2015). A sample size of 300 lactating mothers were selected from each district using a multistage cluster sampling procedure so that national as well as district estimates could be made.
Lactating mothers were categorised in to four groups, underweight (<18.5kgm-2), normal (18.5-24.9kgm-2), overweight (25.0-29.0kgm-2) and obese (≥30kgm-2) based on the BMI. It was found that 11.2% of mothers were underweight, 26% overweight and 7% obese. Prevalence of low BMI was high among the younger mothers (29.4% in those below 20 years, and 14.1% among those 20-29 years). Overweight and obesity was seen to increase with age (31.9% overweight and 9.2% obese among those aged 30-39 years compared to 11.4 % overweight and 2.0 % obese among those less than 20 years of age.
Weight gain during pregnancy was assessed based on the data available on the pregnancy record. The mean weight gain in the total sample was 9.4 kg. (SD 5.0); over 50% of mothers gained less than 10 kg.
3.7.4 Height of women The 2016 DHS reported on the heights of ever married women 15-49 years of age, and the mean height was 152.7 cm (SD 6.1) (Department of Census and Statistics, 2017). Seven percent of the sample had a height below 145 cm. This value is lower than that reported in 2006 DHS (11%). The National Nutrition Survey of Lactating Women (2015) and The National Nutrition and Micronutrient Survey of Pregnant Women (2015) both reported a much lower figure of 4.4% of women with height <145 cm. This may be explained by the fact that the sample in the NNSLW included a larger percentage of younger women, 43.4% between the ages <20-29 years compared to the DHS which had only 21% in this age group.
The corelates of short stature were similar in all studies. Increasing prevalence of short stature was seen with increasing age suggesting a slow secular improvement in heights of Sri Lankan women. It is noted that the prevalence of shortness decreased with increasing current levels of education and household wealth quintiles (11% among the poorest to 4% in the richest quintile).
The DHS 2016, reported that in the estate sector, the prevalence of short stature (14.9%) was high compared to the urban (5.2%) and rural sectors (7.2%) and was nearly double the national level. The mean height in women in the estate sector (150.2 cm) was significantly lower than that of rural (152.7 cm) and urban (153.7 cm) women. This is very likely a reflection of the very high levels of childhood stunting noted in the estate sector in the past. Wide differences in short stature are observed between districts. Mannar and Kilinochchi and Jaffna reporting prevalence of 3.0%, 3.5%and 3.7% respectively compared to 12.7% in the Nuwara Eliya district. None of the studies report on possible ethnic differences in prevalence of short stature.
Nutritional deprivation at the time the woman was growing up no doubt contributed considerably towards short stature in adult life. Current association with low education and poverty suggests that the current living and socio-economic circumstances are probably similar to what the women experienced during their childhoods; the cyclical perpetuation of poverty and malnutrition. Thus, it is important to institute well targeted processes and programs specifically designed for breaking this cycle.
3.8 Low birth weight
Low Birth Weight (LBW) is defined by the World Health Organization as the birthweight of an infant 2499g or less regardless of gestational age. (P07 - Disorders related to short gestation and low birth weight in ICD-10). Subcategories include very low birth weight (VLBW):< 1500 g, and extremely low birth weight (ELBW): < 1000 g.
Optimum growth during the intra-uterine period is critical since a child’s future growth pattern is ‘set’ during foetal life. It lays the foundation for good health in adult life; for example, diseases such as coronary heart disease, hypertension and diabetes have been shown to originate through responses to under nutrition during foetal life and infancy. The response to foetal deprivation leads to permanent changes in the structure, physiology and metabolism of the body (Barker et al, 1989 and 1995). Low birthweight is an important determinant of undernutrition in childhood and it has intergenerational effects perpetuating a cycle of poor nutrition (Figure 3.19).
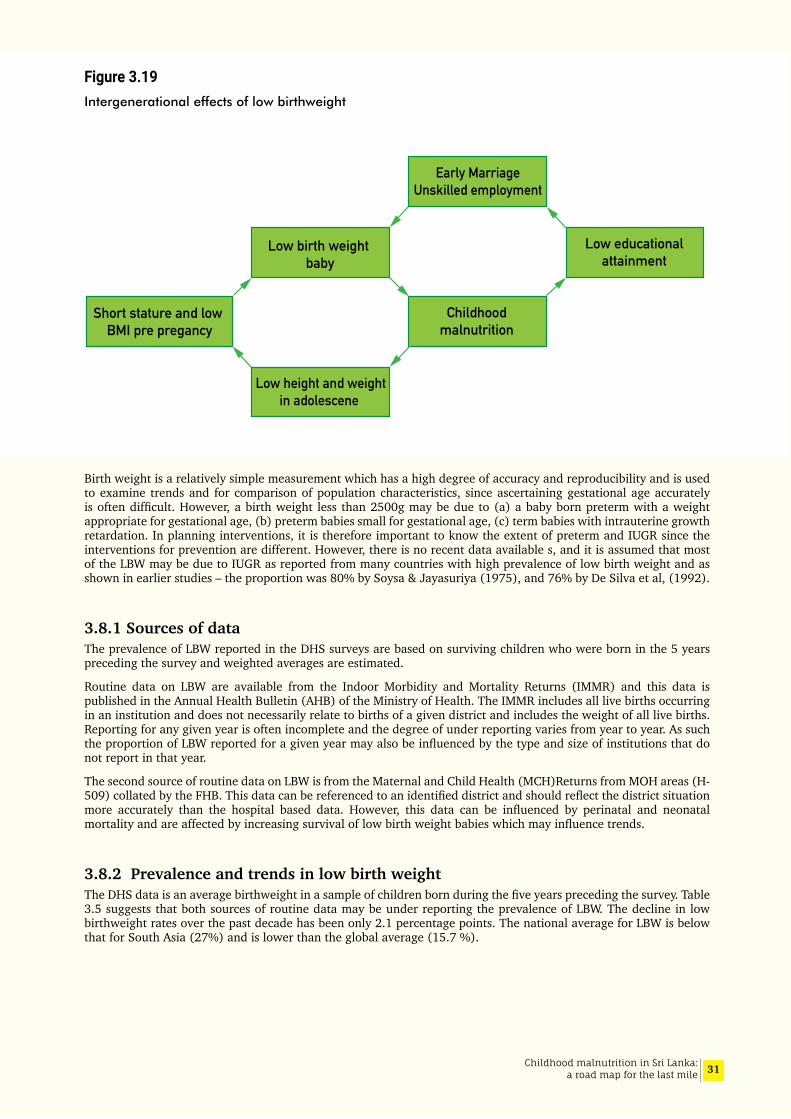
31Childhood malnutrition in Sri Lanka: a road map for the last mile
Figure 3.19Intergenerational effects of low birthweight
Birth weight is a relatively simple measurement which has a high degree of accuracy and reproducibility and is used to examine trends and for comparison of population characteristics, since ascertaining gestational age accurately is often difficult. However, a birth weight less than 2500g may be due to (a) a baby born preterm with a weight appropriate for gestational age, (b) preterm babies small for gestational age, (c) term babies with intrauterine growth retardation. In planning interventions, it is therefore important to know the extent of preterm and IUGR since the interventions for prevention are different. However, there is no recent data available s, and it is assumed that most of the LBW may be due to IUGR as reported from many countries with high prevalence of low birth weight and as shown in earlier studies – the proportion was 80% by Soysa & Jayasuriya (1975), and 76% by De Silva et al, (1992).
3.8.1 Sources of data The prevalence of LBW reported in the DHS surveys are based on surviving children who were born in the 5 years preceding the survey and weighted averages are estimated.
Routine data on LBW are available from the Indoor Morbidity and Mortality Returns (IMMR) and this data is published in the Annual Health Bulletin (AHB) of the Ministry of Health. The IMMR includes all live births occurring in an institution and does not necessarily relate to births of a given district and includes the weight of all live births. Reporting for any given year is often incomplete and the degree of under reporting varies from year to year. As such the proportion of LBW reported for a given year may also be influenced by the type and size of institutions that do not report in that year.
The second source of routine data on LBW is from the Maternal and Child Health (MCH)Returns from MOH areas (H-509) collated by the FHB. This data can be referenced to an identified district and should reflect the district situation more accurately than the hospital based data. However, this data can be influenced by perinatal and neonatal mortality and are affected by increasing survival of low birth weight babies which may influence trends.
3.8.2 Prevalence and trends in low birth weightThe DHS data is an average birthweight in a sample of children born during the five years preceding the survey. Table 3.5 suggests that both sources of routine data may be under reporting the prevalence of LBW. The decline in low birthweight rates over the past decade has been only 2.1 percentage points. The national average for LBW is below that for South Asia (27%) and is lower than the global average (15.7 %).
Short stature and low BMI pre pregancy
Low birth weight baby
Early MarriageUnskilled employment
Low height and weightin adolescene
Childhoodmalnutrition
Low educationalattainment
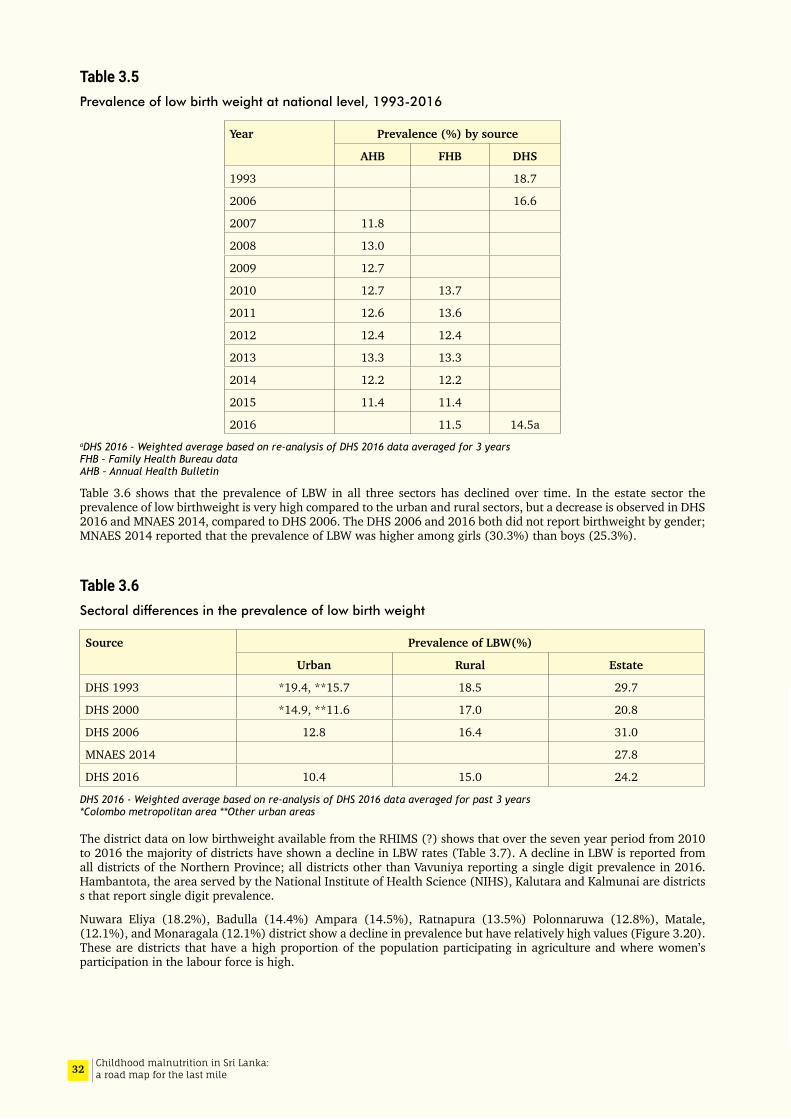
32 Childhood malnutrition in Sri Lanka: a road map for the last mile
Table 3.5Prevalence of low birth weight at national level, 1993-2016
Year Prevalence (%) by source
AHB FHB DHS
1993 18.7
2006 16.6
2007 11.8
2008 13.0
2009 12.7
2010 12.7 13.7
2011 12.6 13.6
2012 12.4 12.4
2013 13.3 13.3
2014 12.2 12.2
2015 11.4 11.4
2016 11.5 14.5aaDHS 2016 - Weighted average based on re-analysis of DHS 2016 data averaged for 3 years FHB – Family Health Bureau data AHB – Annual Health Bulletin
Table 3.6 shows that the prevalence of LBW in all three sectors has declined over time. In the estate sector the prevalence of low birthweight is very high compared to the urban and rural sectors, but a decrease is observed in DHS 2016 and MNAES 2014, compared to DHS 2006. The DHS 2006 and 2016 both did not report birthweight by gender; MNAES 2014 reported that the prevalence of LBW was higher among girls (30.3%) than boys (25.3%).
Table 3.6Sectoral differences in the prevalence of low birth weight
Source Prevalence of LBW(%)
Urban Rural Estate
DHS 1993 *19.4, **15.7 18.5 29.7
DHS 2000 *14.9, **11.6 17.0 20.8
DHS 2006 12.8 16.4 31.0
MNAES 2014 27.8
DHS 2016 10.4 15.0 24.2
DHS 2016 - Weighted average based on re-analysis of DHS 2016 data averaged for past 3 years *Colombo metropolitan area **Other urban areas
The district data on low birthweight available from the RHIMS (?) shows that over the seven year period from 2010 to 2016 the majority of districts have shown a decline in LBW rates (Table 3.7). A decline in LBW is reported from all districts of the Northern Province; all districts other than Vavuniya reporting a single digit prevalence in 2016. Hambantota, the area served by the National Institute of Health Science (NIHS), Kalutara and Kalmunai are districts s that report single digit prevalence.
Nuwara Eliya (18.2%), Badulla (14.4%) Ampara (14.5%), Ratnapura (13.5%) Polonnaruwa (12.8%), Matale, (12.1%), and Monaragala (12.1%) district show a decline in prevalence but have relatively high values (Figure 3.20). These are districts that have a high proportion of the population participating in agriculture and where women’s participation in the labour force is high.
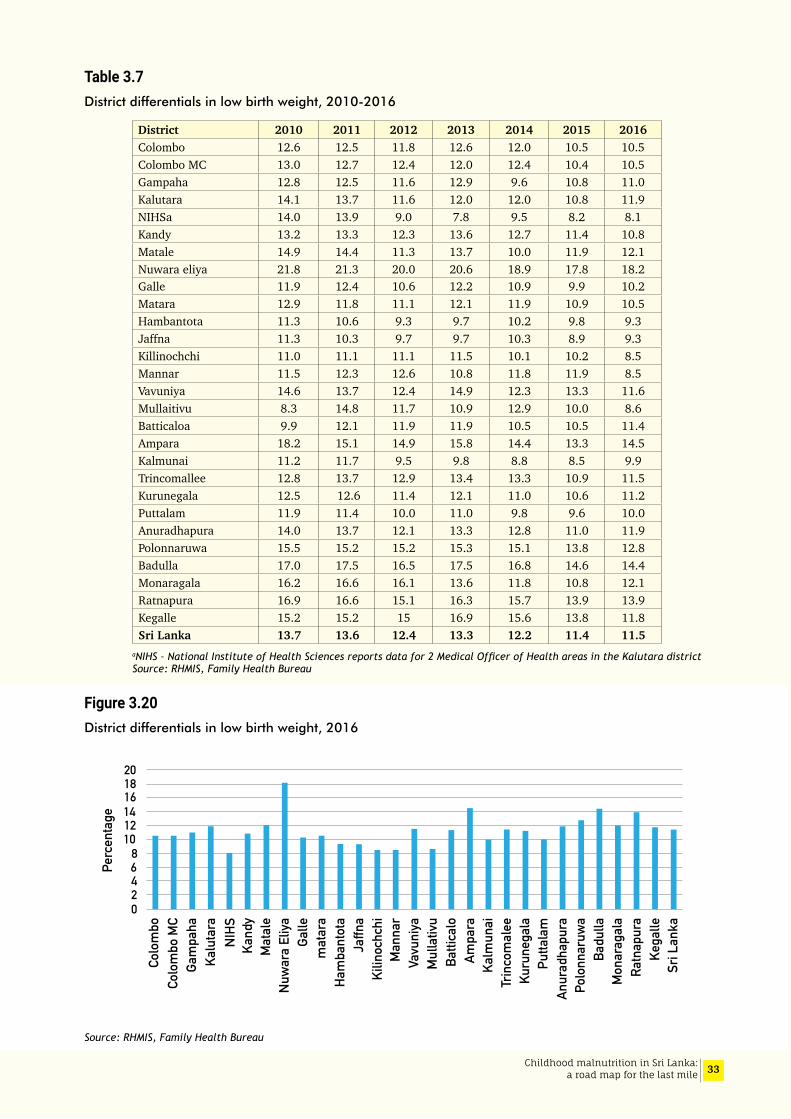
33Childhood malnutrition in Sri Lanka: a road map for the last mile
Table 3.7District differentials in low birth weight, 2010-2016
District 2010 2011 2012 2013 2014 2015 2016Colombo 12.6 12.5 11.8 12.6 12.0 10.5 10.5Colombo MC 13.0 12.7 12.4 12.0 12.4 10.4 10.5Gampaha 12.8 12.5 11.6 12.9 9.6 10.8 11.0Kalutara 14.1 13.7 11.6 12.0 12.0 10.8 11.9NIHSa 14.0 13.9 9.0 7.8 9.5 8.2 8.1Kandy 13.2 13.3 12.3 13.6 12.7 11.4 10.8Matale 14.9 14.4 11.3 13.7 10.0 11.9 12.1Nuwara eliya 21.8 21.3 20.0 20.6 18.9 17.8 18.2Galle 11.9 12.4 10.6 12.2 10.9 9.9 10.2Matara 12.9 11.8 11.1 12.1 11.9 10.9 10.5Hambantota 11.3 10.6 9.3 9.7 10.2 9.8 9.3Jaffna 11.3 10.3 9.7 9.7 10.3 8.9 9.3Killinochchi 11.0 11.1 11.1 11.5 10.1 10.2 8.5Mannar 11.5 12.3 12.6 10.8 11.8 11.9 8.5Vavuniya 14.6 13.7 12.4 14.9 12.3 13.3 11.6Mullaitivu 8.3 14.8 11.7 10.9 12.9 10.0 8.6Batticaloa 9.9 12.1 11.9 11.9 10.5 10.5 11.4Ampara 18.2 15.1 14.9 15.8 14.4 13.3 14.5Kalmunai 11.2 11.7 9.5 9.8 8.8 8.5 9.9Trincomallee 12.8 13.7 12.9 13.4 13.3 10.9 11.5Kurunegala 12.5 12.6 11.4 12.1 11.0 10.6 11.2Puttalam 11.9 11.4 10.0 11.0 9.8 9.6 10.0Anuradhapura 14.0 13.7 12.1 13.3 12.8 11.0 11.9Polonnaruwa 15.5 15.2 15.2 15.3 15.1 13.8 12.8Badulla 17.0 17.5 16.5 17.5 16.8 14.6 14.4Monaragala 16.2 16.6 16.1 13.6 11.8 10.8 12.1Ratnapura 16.9 16.6 15.1 16.3 15.7 13.9 13.9Kegalle 15.2 15.2 15 16.9 15.6 13.8 11.8Sri Lanka 13.7 13.6 12.4 13.3 12.2 11.4 11.5
aNIHS – National Institute of Health Sciences reports data for 2 Medical Officer of Health areas in the Kalutara district Source: RHMIS, Family Health Bureau
Figure 3.20District differentials in low birth weight, 2016
Source: RHMIS, Family Health Bureau
Kega
lle
Galle
Ham
bant
ota
mat
ara
Ratn
apur
a
Mat
ale
Nuw
ara
Eliya
Ampa
ra
Mul
lativ
u
Kalu
tara
Sri L
anka
Batti
calo
Man
nar
Gam
paha
Badu
lla
Kuru
nega
la
Anur
adha
pura
Kand
y
Colo
mbo
Vavu
niya
Jaffn
a
Putta
lam
Polo
nnar
uwa
Trin
com
alee
Mon
arag
ala
Kilin
ochc
hi
Colo
mbo
MC
Kalm
unai
NIHS
02468
101214161820
Perc
enta
ge
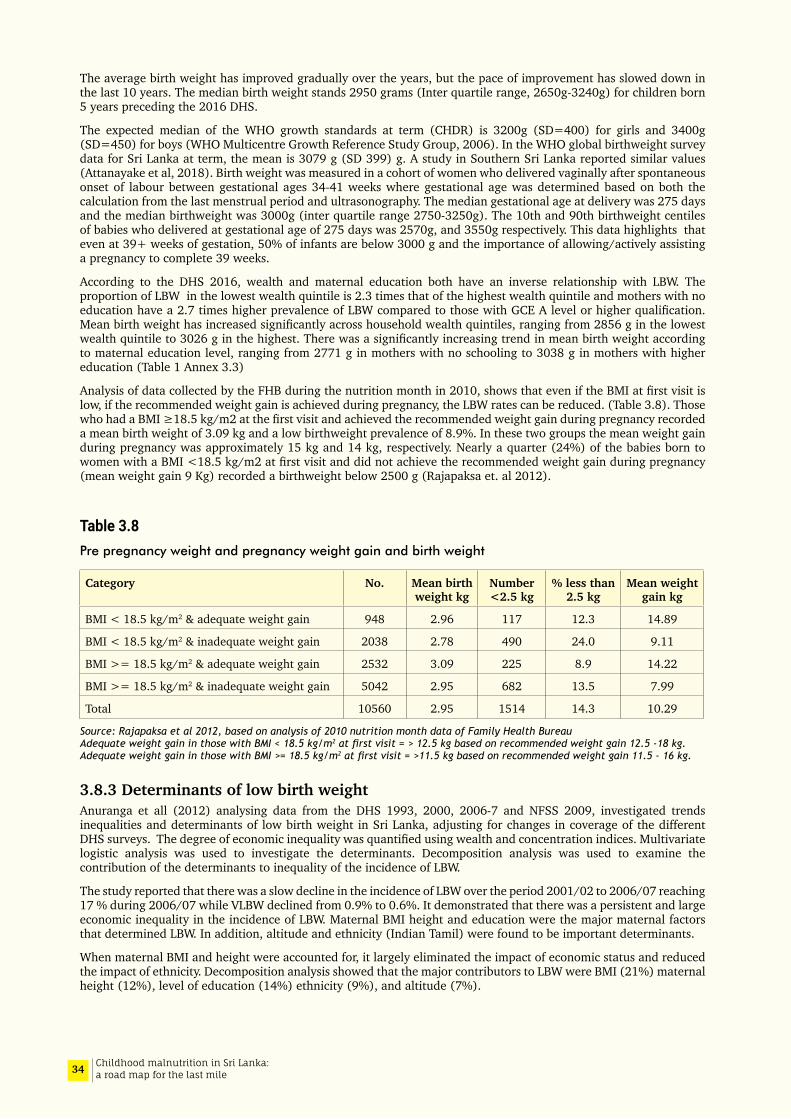
34 Childhood malnutrition in Sri Lanka: a road map for the last mile
The average birth weight has improved gradually over the years, but the pace of improvement has slowed down in the last 10 years. The median birth weight stands 2950 grams (Inter quartile range, 2650g-3240g) for children born 5 years preceding the 2016 DHS.
The expected median of the WHO growth standards at term (CHDR) is 3200g (SD=400) for girls and 3400g (SD=450) for boys (WHO Multicentre Growth Reference Study Group, 2006). In the WHO global birthweight survey data for Sri Lanka at term, the mean is 3079 g (SD 399) g. A study in Southern Sri Lanka reported similar values (Attanayake et al, 2018). Birth weight was measured in a cohort of women who delivered vaginally after spontaneous onset of labour between gestational ages 34-41 weeks where gestational age was determined based on both the calculation from the last menstrual period and ultrasonography. The median gestational age at delivery was 275 days and the median birthweight was 3000g (inter quartile range 2750-3250g). The 10th and 90th birthweight centiles of babies who delivered at gestational age of 275 days was 2570g, and 3550g respectively. This data highlights that even at 39+ weeks of gestation, 50% of infants are below 3000 g and the importance of allowing/actively assisting a pregnancy to complete 39 weeks.
According to the DHS 2016, wealth and maternal education both have an inverse relationship with LBW. The proportion of LBW in the lowest wealth quintile is 2.3 times that of the highest wealth quintile and mothers with no education have a 2.7 times higher prevalence of LBW compared to those with GCE A level or higher qualification. Mean birth weight has increased significantly across household wealth quintiles, ranging from 2856 g in the lowest wealth quintile to 3026 g in the highest. There was a significantly increasing trend in mean birth weight according to maternal education level, ranging from 2771 g in mothers with no schooling to 3038 g in mothers with higher education (Table 1 Annex 3.3)
Analysis of data collected by the FHB during the nutrition month in 2010, shows that even if the BMI at first visit is low, if the recommended weight gain is achieved during pregnancy, the LBW rates can be reduced. (Table 3.8). Those who had a BMI ≥18.5 kg/m2 at the first visit and achieved the recommended weight gain during pregnancy recorded a mean birth weight of 3.09 kg and a low birthweight prevalence of 8.9%. In these two groups the mean weight gain during pregnancy was approximately 15 kg and 14 kg, respectively. Nearly a quarter (24%) of the babies born to women with a BMI <18.5 kg/m2 at first visit and did not achieve the recommended weight gain during pregnancy (mean weight gain 9 Kg) recorded a birthweight below 2500 g (Rajapaksa et. al 2012).
Table 3.8Pre pregnancy weight and pregnancy weight gain and birth weight
Category No. Mean birth weight kg
Number <2.5 kg
% less than 2.5 kg
Mean weight gain kg
BMI < 18.5 kg/m2 & adequate weight gain 948 2.96 117 12.3 14.89
BMI < 18.5 kg/m2 & inadequate weight gain 2038 2.78 490 24.0 9.11
BMI >= 18.5 kg/m2 & adequate weight gain 2532 3.09 225 8.9 14.22
BMI >= 18.5 kg/m2 & inadequate weight gain 5042 2.95 682 13.5 7.99
Total 10560 2.95 1514 14.3 10.29
Source: Rajapaksa et al 2012, based on analysis of 2010 nutrition month data of Family Health Bureau Adequate weight gain in those with BMI < 18.5 kg/m2 at first visit = > 12.5 kg based on recommended weight gain 12.5 -18 kg. Adequate weight gain in those with BMI >= 18.5 kg/m2 at first visit = >11.5 kg based on recommended weight gain 11.5 - 16 kg.
3.8.3 Determinants of low birth weightAnuranga et all (2012) analysing data from the DHS 1993, 2000, 2006-7 and NFSS 2009, investigated trends inequalities and determinants of low birth weight in Sri Lanka, adjusting for changes in coverage of the different DHS surveys. The degree of economic inequality was quantified using wealth and concentration indices. Multivariate logistic analysis was used to investigate the determinants. Decomposition analysis was used to examine the contribution of the determinants to inequality of the incidence of LBW.
The study reported that there was a slow decline in the incidence of LBW over the period 2001/02 to 2006/07 reaching 17 % during 2006/07 while VLBW declined from 0.9% to 0.6%. It demonstrated that there was a persistent and large economic inequality in the incidence of LBW. Maternal BMI height and education were the major maternal factors that determined LBW. In addition, altitude and ethnicity (Indian Tamil) were found to be important determinants.
When maternal BMI and height were accounted for, it largely eliminated the impact of economic status and reduced the impact of ethnicity. Decomposition analysis showed that the major contributors to LBW were BMI (21%) maternal height (12%), level of education (14%) ethnicity (9%), and altitude (7%).
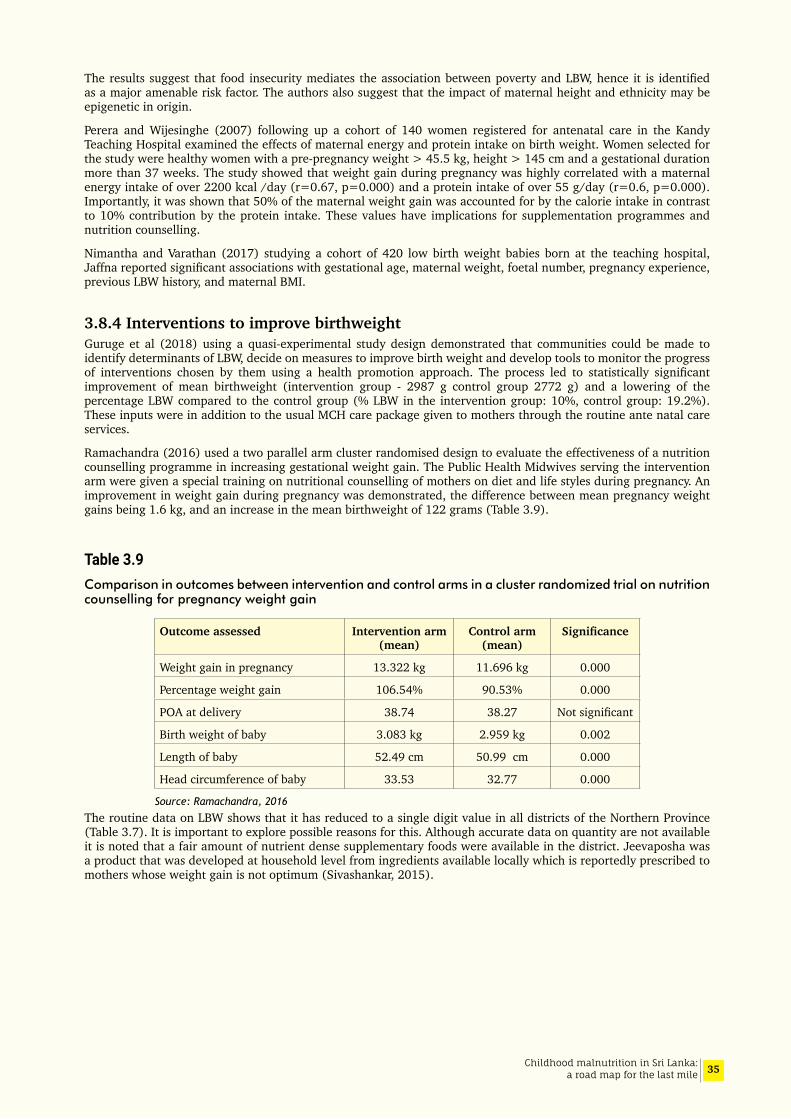
35Childhood malnutrition in Sri Lanka: a road map for the last mile
The results suggest that food insecurity mediates the association between poverty and LBW, hence it is identified as a major amenable risk factor. The authors also suggest that the impact of maternal height and ethnicity may be epigenetic in origin.
Perera and Wijesinghe (2007) following up a cohort of 140 women registered for antenatal care in the Kandy Teaching Hospital examined the effects of maternal energy and protein intake on birth weight. Women selected for the study were healthy women with a pre-pregnancy weight > 45.5 kg, height > 145 cm and a gestational duration more than 37 weeks. The study showed that weight gain during pregnancy was highly correlated with a maternal energy intake of over 2200 kcal /day (r=0.67, p=0.000) and a protein intake of over 55 g/day (r=0.6, p=0.000). Importantly, it was shown that 50% of the maternal weight gain was accounted for by the calorie intake in contrast to 10% contribution by the protein intake. These values have implications for supplementation programmes and nutrition counselling.
Nimantha and Varathan (2017) studying a cohort of 420 low birth weight babies born at the teaching hospital, Jaffna reported significant associations with gestational age, maternal weight, foetal number, pregnancy experience, previous LBW history, and maternal BMI.
3.8.4 Interventions to improve birthweightGuruge et al (2018) using a quasi-experimental study design demonstrated that communities could be made to identify determinants of LBW, decide on measures to improve birth weight and develop tools to monitor the progress of interventions chosen by them using a health promotion approach. The process led to statistically significant improvement of mean birthweight (intervention group - 2987 g control group 2772 g) and a lowering of the percentage LBW compared to the control group (% LBW in the intervention group: 10%, control group: 19.2%). These inputs were in addition to the usual MCH care package given to mothers through the routine ante natal care services.
Ramachandra (2016) used a two parallel arm cluster randomised design to evaluate the effectiveness of a nutrition counselling programme in increasing gestational weight gain. The Public Health Midwives serving the intervention arm were given a special training on nutritional counselling of mothers on diet and life styles during pregnancy. An improvement in weight gain during pregnancy was demonstrated, the difference between mean pregnancy weight gains being 1.6 kg, and an increase in the mean birthweight of 122 grams (Table 3.9).
Table 3.9Comparison in outcomes between intervention and control arms in a cluster randomized trial on nutrition counselling for pregnancy weight gain
Outcome assessed Intervention arm (mean)
Control arm (mean)
Significance
Weight gain in pregnancy 13.322 kg 11.696 kg 0.000
Percentage weight gain 106.54% 90.53% 0.000
POA at delivery 38.74 38.27 Not significant
Birth weight of baby 3.083 kg 2.959 kg 0.002
Length of baby 52.49 cm 50.99 cm 0.000
Head circumference of baby 33.53 32.77 0.000
Source: Ramachandra, 2016
The routine data on LBW shows that it has reduced to a single digit value in all districts of the Northern Province (Table 3.7). It is important to explore possible reasons for this. Although accurate data on quantity are not available it is noted that a fair amount of nutrient dense supplementary foods were available in the district. Jeevaposha was a product that was developed at household level from ingredients available locally which is reportedly prescribed to mothers whose weight gain is not optimum (Sivashankar, 2015).

36 Childhood malnutrition in Sri Lanka: a road map for the last mile
3.9 Infant and Young Child Feeding
3.9.1 Breastfeeding and complementary feedingImmediate causes of undernutrition are inadequate dietary intake and disease according to the UNICEF framework (Figure 2.1). As such it is important to examine IYCF practices in Sri Lanka. A very comprehensive desk review of IYCF practices in Sri Lanka from 2006-2017 was carried out by Lanerolle et al (2018) and findings from the in-depth analysis of IYCF practices from the DHS 2006 and 2016 (Senarath et al,2018) are briefly presented in this section.
Sri Lanka has a long history of emphasis on breast feeding both early initiation and exclusive feeding which has resulted in considerable improvement in breastfeeding practice. When the DHS data from 2006 and 2016 are examined alongside the national objectives in respect of breastfeeding it is seen that all indicators have improved during the 10 year period (Figure 3.21). This success may be attributed to widespread, intense and clear educational campaigns which has resulted in increased knowledge in mothers and in the general population, training of all health workers to identify problems and the skills necessary for solving them and backup support when necessary, the baby friendly hospital initiative in a setting where the vast majority of births are institutional based, early legislation of the Code of Marketing for Breast-milk Substitutes (as early as 1980s), and legislation enabling working mothers to breast-feed.
The DHS 2016 data on complementary feeding in comparison to the strategic objectives also indicate that these are on target (Figure 3.22). However, these national achievements mask many district and sectoral disparities. District level analysis are available for Vavuniya and Trincomalee (MoH and UNICEF 2010) but not for the other districts that are faltering. However, these analyses do not attempt to relate IYCF practices to nutritional outcomes.
Figure 3.21Breastfeeding indicators between 2006 and 2016
Source: Senarath et al 2018 (unpublished data)
Early initiationof
breastfeeding
Exclusivebreastfeedng
Currentbreastfeeding
Continuedbreastfeeding
(1 year)
Continuedbreastfeeding
(2 year)
2006 2016
0
20
40
60
80
10083.3 89
75.882.2
93.1 92.7 92.6 95.383.5 85.4
Perc
ent
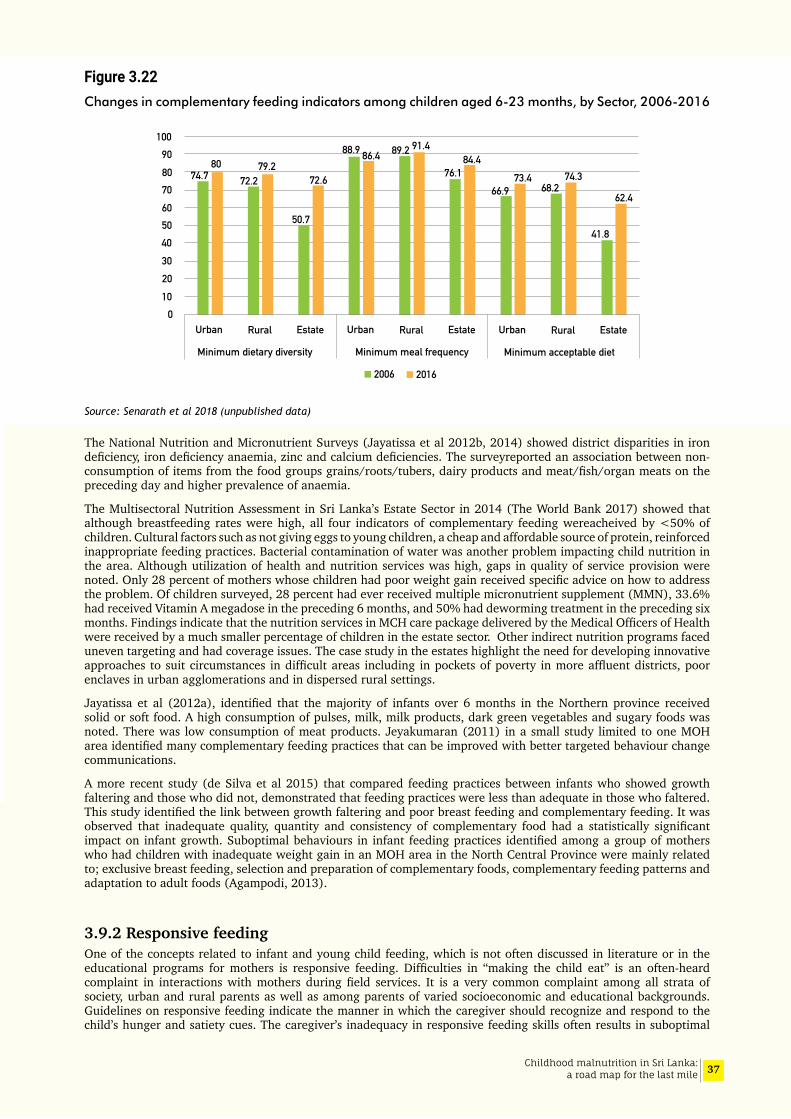
37Childhood malnutrition in Sri Lanka: a road map for the last mile
Figure 3.22Changes in complementary feeding indicators among children aged 6-23 months, by Sector, 2006-2016
Source: Senarath et al 2018 (unpublished data)
The National Nutrition and Micronutrient Surveys (Jayatissa et al 2012b, 2014) showed district disparities in iron deficiency, iron deficiency anaemia, zinc and calcium deficiencies. The surveyreported an association between non-consumption of items from the food groups grains/roots/tubers, dairy products and meat/fish/organ meats on the preceding day and higher prevalence of anaemia.
The Multisectoral Nutrition Assessment in Sri Lanka’s Estate Sector in 2014 (The World Bank 2017) showed that although breastfeeding rates were high, all four indicators of complementary feeding wereacheived by <50% of children. Cultural factors such as not giving eggs to young children, a cheap and affordable source of protein, reinforced inappropriate feeding practices. Bacterial contamination of water was another problem impacting child nutrition in the area. Although utilization of health and nutrition services was high, gaps in quality of service provision were noted. Only 28 percent of mothers whose children had poor weight gain received specific advice on how to address the problem. Of children surveyed, 28 percent had ever received multiple micronutrient supplement (MMN), 33.6% had received Vitamin A megadose in the preceding 6 months, and 50% had deworming treatment in the preceding six months. Findings indicate that the nutrition services in MCH care package delivered by the Medical Officers of Health were received by a much smaller percentage of children in the estate sector. Other indirect nutrition programs faced uneven targeting and had coverage issues. The case study in the estates highlight the need for developing innovative approaches to suit circumstances in difficult areas including in pockets of poverty in more affluent districts, poor enclaves in urban agglomerations and in dispersed rural settings.
Jayatissa et al (2012a), identified that the majority of infants over 6 months in the Northern province received solid or soft food. A high consumption of pulses, milk, milk products, dark green vegetables and sugary foods was noted. There was low consumption of meat products. Jeyakumaran (2011) in a small study limited to one MOH area identified many complementary feeding practices that can be improved with better targeted behaviour change communications.
A more recent study (de Silva et al 2015) that compared feeding practices between infants who showed growth faltering and those who did not, demonstrated that feeding practices were less than adequate in those who faltered. This study identified the link between growth faltering and poor breast feeding and complementary feeding. It was observed that inadequate quality, quantity and consistency of complementary food had a statistically significant impact on infant growth. Suboptimal behaviours in infant feeding practices identified among a group of mothers who had children with inadequate weight gain in an MOH area in the North Central Province were mainly related to; exclusive breast feeding, selection and preparation of complementary foods, complementary feeding patterns and adaptation to adult foods (Agampodi, 2013).
3.9.2 Responsive feedingOne of the concepts related to infant and young child feeding, which is not often discussed in literature or in the educational programs for mothers is responsive feeding. Difficulties in “making the child eat” is an often-heard complaint in interactions with mothers during field services. It is a very common complaint among all strata of society, urban and rural parents as well as among parents of varied socioeconomic and educational backgrounds. Guidelines on responsive feeding indicate the manner in which the caregiver should recognize and respond to the child’s hunger and satiety cues. The caregiver’s inadequacy in responsive feeding skills often results in suboptimal
0102030405060708090
100
74.780
72.279.2
50.7
72.6
88.9 86.4 89.2 91.4
76.184.4
66.973.4
68.274.3
41.8
62.4
Urban Rural Estate Urban Rural Estate Urban Rural Estate
Minimum dietary diversity Minimum meal frequency Minimum acceptable diet
2006 2016
38 Childhood malnutrition in Sri Lanka: a road map for the last mile
feeding behaviour patterns such as controlled feeding, forced feeding, bribery and indulgence. It is an integral part of responsive parenting and it plays an important role in bonding between the child and the caregiver. This in turn leads to an environment of trust and a sense of security which is essential for the child’s social and emotional development.
A community-based intervention study was carried out in the Colombo district to examine the impact of an educational intervention on responsive feeding, on child feeding practices adopted by caregivers, and eating behaviour and growth of their children aged 12-23 months. A pair of MOH areas were selected, matched for socioeconomic and health status one serving as the intervention area and the other the control area. The intervention was directed at caregivers of 12 to 23 months old children through the existing primary healthcare system. Primary healthcare providers involved in maternal and child health (Public Health Nursing Sisters, Supervising Public Health Midwives and Public Health Midwives) were trained to implement the intervention. The study demonstrated that improving responsive feeding practices of caregivers was feasible using existing MCH services and that the process led to effective and significant improvements in eating behaviour and growth of young children. The findings suggest that incorporating methodologies for the development of caregiver skills in responsive feeding is feasible in the MCH service setting and it would address an important gap in current service provision (Jayawickrama 2006). However, the methodology may need adjustments and wider piloting in different settings with careful re-examination of the workload etc of existing MCH care providers before scaling up.
3.9.3 Special interventions on IYCF
Promoting IYCF in HambantotaRajapaksa et al (2015) reported a special program to improve complementary feeding practices in Hambantota district in the Southern province which was delivered within the existing MCH services. One of the main changes in practice was to include ongoing community based educational programs from the antenatal period onwards. The program improved the competencies of Public Health Midwives in IYCF and in improving the knowledge and skills of mothers on IYCF by the time their infants were 5 months of age. Communities were mobilised to support and correct complementary feeding practices. Attention was paid to ensure 95% coverage of the target group and maintaining uniformity of content across the district. The workshops focused on the 10 key messages on IYCF supported by display boards and demonstrations were arranged on the key aspects of IYCF including consistency of the food and portion sizes for various ages. The demonstrations were supervised by the supervisory staff of the MOH and district level staff.
The effectiveness of the program was monitored through routinely collected data via the growth monitoring program. The program has been in place throughout the district from 2008 to date. The publication “Improving the practice of complementary feeding: experience from a community-based program in Hambantota District (2015)” describes the program and outcomes.
Home-made supplementary food in MOH area KopaySivashankar (2015) reported the feasibility, acceptability and effectiveness of a homemade supplementary food (Jeevaposha) to improve the weight gain of moderately acute malnourished children (MAM) between the ages 3 to 5 years in the MOH area of Kopay in the Northern province. The acceptability and feasibility was assessed by Focus group discussions with the public health staff and the mothers while effectiveness was assessed using a quasi experimental study design.
Focus group discussions with mothers and public health staff showed that the intervention was acceptable, and it was feasible. The study showed that although there was no statistically significant difference between the intervention and control groups in the prevalence of nutritional status, at the end of 3 months, the mean weight gain in the test group and the control group were 688.5 g (SD 437g) and 583 g (SD 461g) respectively. The mean difference in weight gain of 105 g was statistically significant (95%CI 0.03-0.18, p=0.006). The mean height gain in the test group and the control group at the end of 3 months were 1.5 cm (SD 0.93cm) and 1.66cm (SD 1.3 cm) respectively, but the s difference was not significant.
m-Health for promoting IYCFThe South Asia Infant Feeding Research Network (SAIFRN) conducted a pilot study in Haputale estate in Badulla district in the Uva province to investigate the feasibility of a mobile phone based IYCF counselling package (Senarath et al 2017). A formative study was conducted prior to the development of the mobile application. A series of IYCF and health messages were compiled conforming with the national guidelines. A sample of 108 mothers (pregnant and mothers of infants) were enrolled and followed up for 12 months. Age appropriate voice and text messages were delivered to mothers from an automated application to a standard (feature) mobile phone provided to each participant. Each message has an interactive feature where a mother can respond using a short code if she has encountered any problem regarding feeding her baby and is in need of urgent attention by the PHM. The PHM was involved in the communication network. The project was successfully implemented in partnership with Dialog Axiata (Pvt) Ltd. The project concluded that mobile health is a possible technology to deliver IYCF counselling in the Estate sector and a feasible and acceptable intervention in enhancing IYCF. Use of mobile phone technology could strengthen the existing MCH services to improve the nutritional status of children.
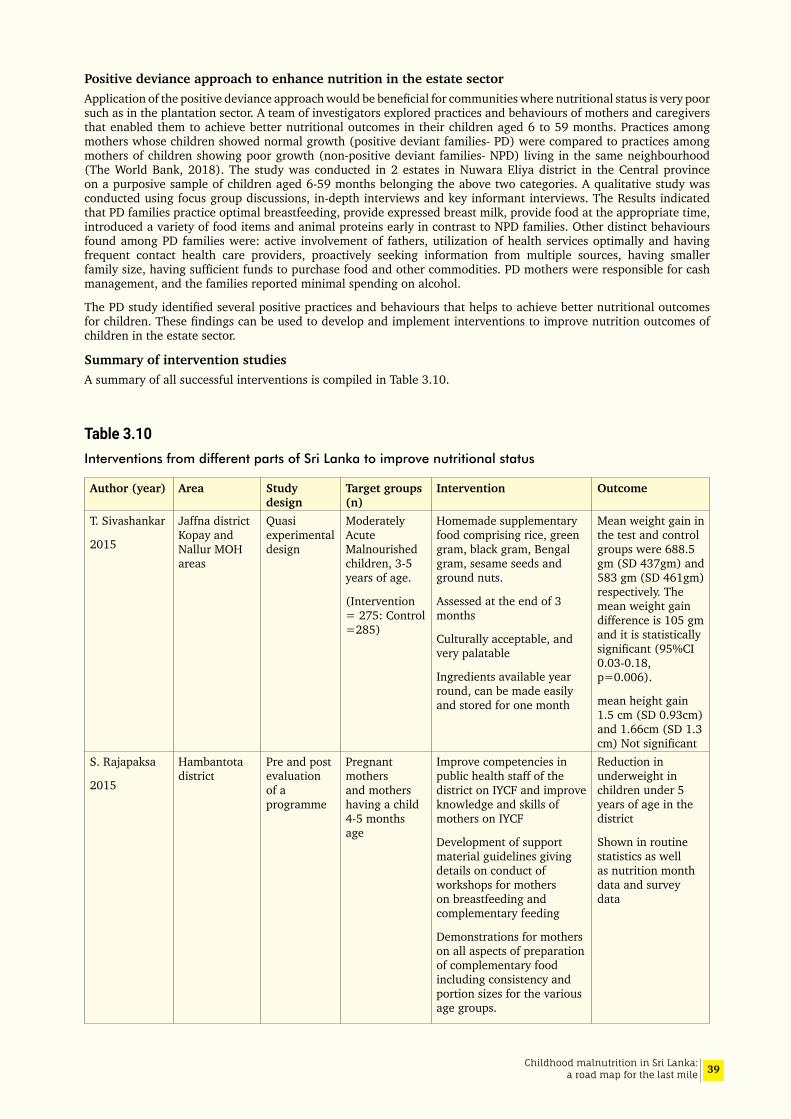
39Childhood malnutrition in Sri Lanka: a road map for the last mile
Positive deviance approach to enhance nutrition in the estate sector Application of the positive deviance approach would be beneficial for communities where nutritional status is very poor such as in the plantation sector. A team of investigators explored practices and behaviours of mothers and caregivers that enabled them to achieve better nutritional outcomes in their children aged 6 to 59 months. Practices among mothers whose children showed normal growth (positive deviant families- PD) were compared to practices among mothers of children showing poor growth (non-positive deviant families- NPD) living in the same neighbourhood (The World Bank, 2018). The study was conducted in 2 estates in Nuwara Eliya district in the Central province on a purposive sample of children aged 6-59 months belonging the above two categories. A qualitative study was conducted using focus group discussions, in-depth interviews and key informant interviews. The Results indicated that PD families practice optimal breastfeeding, provide expressed breast milk, provide food at the appropriate time, introduced a variety of food items and animal proteins early in contrast to NPD families. Other distinct behaviours found among PD families were: active involvement of fathers, utilization of health services optimally and having frequent contact health care providers, proactively seeking information from multiple sources, having smaller family size, having sufficient funds to purchase food and other commodities. PD mothers were responsible for cash management, and the families reported minimal spending on alcohol.
The PD study identified several positive practices and behaviours that helps to achieve better nutritional outcomes for children. These findings can be used to develop and implement interventions to improve nutrition outcomes of children in the estate sector.
Summary of intervention studiesA summary of all successful interventions is compiled in Table 3.10.
Table 3.10Interventions from different parts of Sri Lanka to improve nutritional status
Author (year) Area Study design
Target groups (n)
Intervention Outcome
T. Sivashankar
2015
Jaffna district Kopay and Nallur MOH areas
Quasi experimental design
Moderately Acute Malnourished children, 3-5 years of age.
(Intervention = 275: Control =285)
Homemade supplementary food comprising rice, green gram, black gram, Bengal gram, sesame seeds and ground nuts.
Assessed at the end of 3 months
Culturally acceptable, and very palatable
Ingredients available year round, can be made easily and stored for one month
Mean weight gain in the test and control groups were 688.5 gm (SD 437gm) and 583 gm (SD 461gm) respectively. The mean weight gain difference is 105 gm and it is statistically significant (95%CI 0.03-0.18, p=0.006).
mean height gain 1.5 cm (SD 0.93cm) and 1.66cm (SD 1.3 cm) Not significant
S. Rajapaksa
2015
Hambantota district
Pre and post evaluation of a programme
Pregnant mothers and mothers having a child 4-5 months age
Improve competencies in public health staff of the district on IYCF and improve knowledge and skills of mothers on IYCF
Development of support material guidelines giving details on conduct of workshops for mothers on breastfeeding and complementary feeding
Demonstrations for mothers on all aspects of preparation of complementary food including consistency and portion sizes for the various age groups.
Reduction in underweight in children under 5 years of age in the district
Shown in routine statistics as well as nutrition month data and survey data

40 Childhood malnutrition in Sri Lanka: a road map for the last mile
Author (year) Area Study design
Target groups (n)
Intervention Outcome
S. Ramachandra
2016
Kalutara district
Parallel arm cluster randomized controlled trial
Pregnant mothers
PHMs in the intervention area given training in nutrition counselling during pregnancy. PHMs performed counselling on diet and lifestyle for pregnant mothers during clinic and field visits.
difference between the two groups mean pregnancy weight gain of 1.6 kg, and an increase in the mean birthweight of 122 grams
S. Sujendran
2016
Eastern Province – Baticaloa and Kalmunai RDHS areas
Parallel arm cluster randomized controlled trial
Forty-four PHM areas were randomized
(880 mother-baby pairs with 6-36 months old children in each arm)
Hands on skill development through PHMs on achieving an optimum diet using locally grown foods in mothers/caregivers
The package was made available as a booklet in both Tamil and English languages
After 12 months of intervention there was significant improvement in mean HAZ, WHZ, WAZ and MUACZ in the intervention arm
U. Senarath et al
2017
Tea Estate in Badulla district
Pilot study of a single arm intervention
pregnant mothers and mothers with infants were followed up for 1 year (n=108 mothers)
Interactive mobile app to deliver IYCF messages to a standard mobile phone of users. Mothers receive age appropriate voice and text messages on a regular frequency. PHM is alerted, and mother could inform PHM on any problems with feeding the child which need immediate attention.
Mobile health is a possible technology to deliver IYCF counselling in Estate sector and a feasible and acceptable intervention to enhance IYCF
D. Guruge et al 2018
Anuradhapura and Polonnaruwa districts
Quasi experimental design
Pregnant mothers their spouses Neighborhood action committees /mother support groups
(n=403 in each arm)
Recruited from 3 MOH areas for each arm
From 26 antenatal clinics
Health promotion methodology used to help communities identify determinants of low birthweight, decide on measures to improve birth weight and develop tools to monitor the progress of interventions chosen by them
Intervention group
% LBW = 10%
Mean birthweight 2987 g
Control group
% LBW = 19. 2%
Mean birthweight 2772 g
H.S Jayawickrama
2006
Colombo District Padukka and Piliyandala MOH areas
Community based intervention over a period of 6 months
503 & 409 children recruited 472 & 471 completed
Children 12-23 months and their mothers/primary caregivers
IYCF and counselling skills improved in primary healthcare providers involved in maternal and child health. Education material for mothers and for public health staff produced.
Staff imparted knowledge and skills to mothers during clinics and home visits
Increase in knowledge among staff and mothers
Significant change in eating behaviour and weight for age and height for age mean Z scores showed significant improvement in the intervention group.
weight for age, 0.25 vs 0.09, p=0.000 and height for age 0.37 vs 0.14, p=0.000).
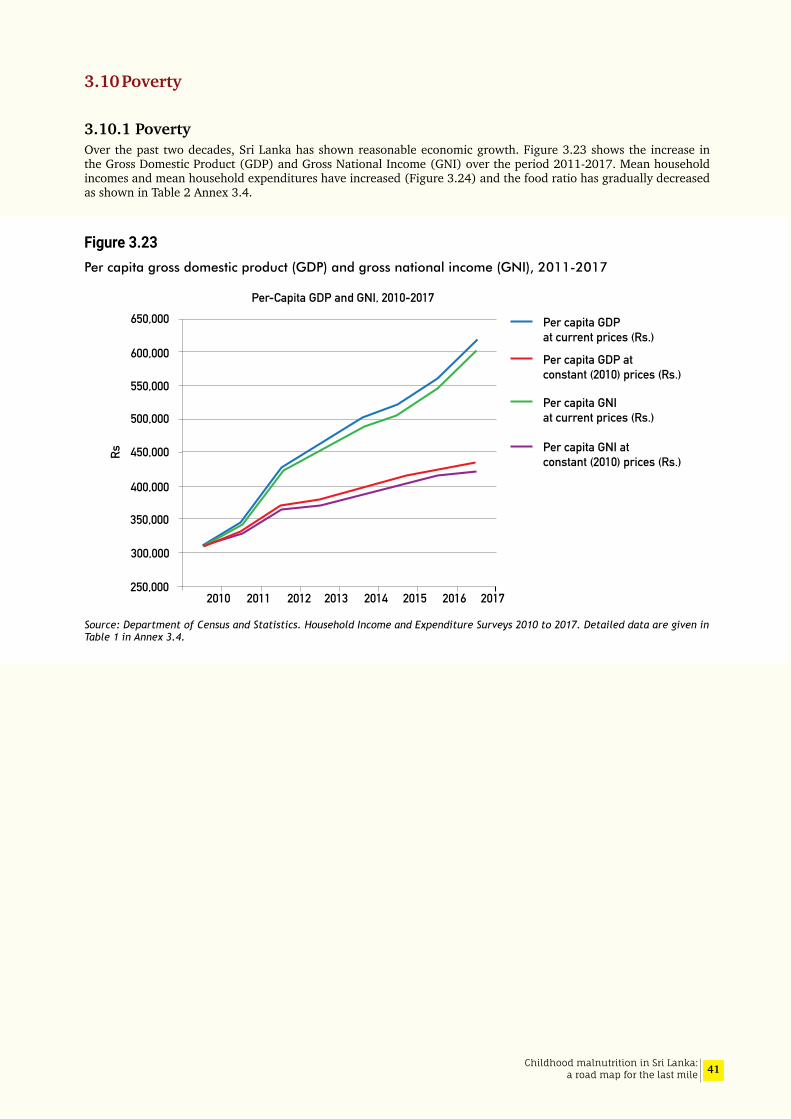
41Childhood malnutrition in Sri Lanka: a road map for the last mile
3.10 Poverty
3.10.1 PovertyOver the past two decades, Sri Lanka has shown reasonable economic growth. Figure 3.23 shows the increase in the Gross Domestic Product (GDP) and Gross National Income (GNI) over the period 2011-2017. Mean household incomes and mean household expenditures have increased (Figure 3.24) and the food ratio has gradually decreased as shown in Table 2 Annex 3.4.
Figure 3.23Per capita gross domestic product (GDP) and gross national income (GNI), 2011-2017
Source: Department of Census and Statistics. Household Income and Expenditure Surveys 2010 to 2017. Detailed data are given in Table 1 in Annex 3.4.
Per capita GDPat current prices (Rs.)
Per capita GDP atconstant (2010) prices (Rs.)
Per capita GNIat current prices (Rs.)
Per capita GNI atconstant (2010) prices (Rs.)
2010 2011 2012 2013 2014 2015 2016 2017250,000
300,000
350,000
400,000
450,000
500,000
550,000
600,000
650,000Per-Capita GDP and GNI, 2010-2017
Rs

42 Childhood malnutrition in Sri Lanka: a road map for the last mile
Figure 3.24Mean household income and per capita income per month, 1995-2016
The country has made notable strides towards the goal of ending extreme poverty (Figure 3.25). In Sri Lanka, poverty headcount index is the commonly used measure of the incidence of poverty. This refers to the share of individuals whose household per capita consumption falls below the official poverty line.
Figure 3.25Decline in poverty in Sri Lanka, 1990-2016
Source: Department of Census and Statistics, 2017
As indicated in the Figure 3.25 there has been a dramatic decline in poverty head count ratio, the index for 2016 being 4.1. Table 3.11 below shows that the percentage of population in poverty depends on the measure used. The National Poverty Line (NPL) is considered as “moderate by regional standards, but below what one might expect from a country at Sri Lanka’s level of development (The World Bank, 2017b).
Many Sri Lankans live just above and very close to the National Poverty Line (NPL). The table shows that more than 400,000 persons fall within 10 per cent above the NPL and nearly a million persons live within 20 per cent above the NPL. The near poor can easily slip back into poverty and are very vulnerable to any economic shocks, price volatility especially of food, natural disasters etc (Nanayakkara, 2019).
10000
20000
30000
40000
50000
60000
70000
01995/96 2002 2005 2006/07 2009/10 2012/13 2016
Mean household income per month Mean per capita income per month
Household and per capita income
0
5
10
15
20
25
30
35
26.1
22.7
15.2
8.9
6.74.1
1990/91 1995/96 2002 2006/07 2009/10 2012/13 2016
28.8
Pore
rty H
ead
Coun
t Ind
ex (%
)
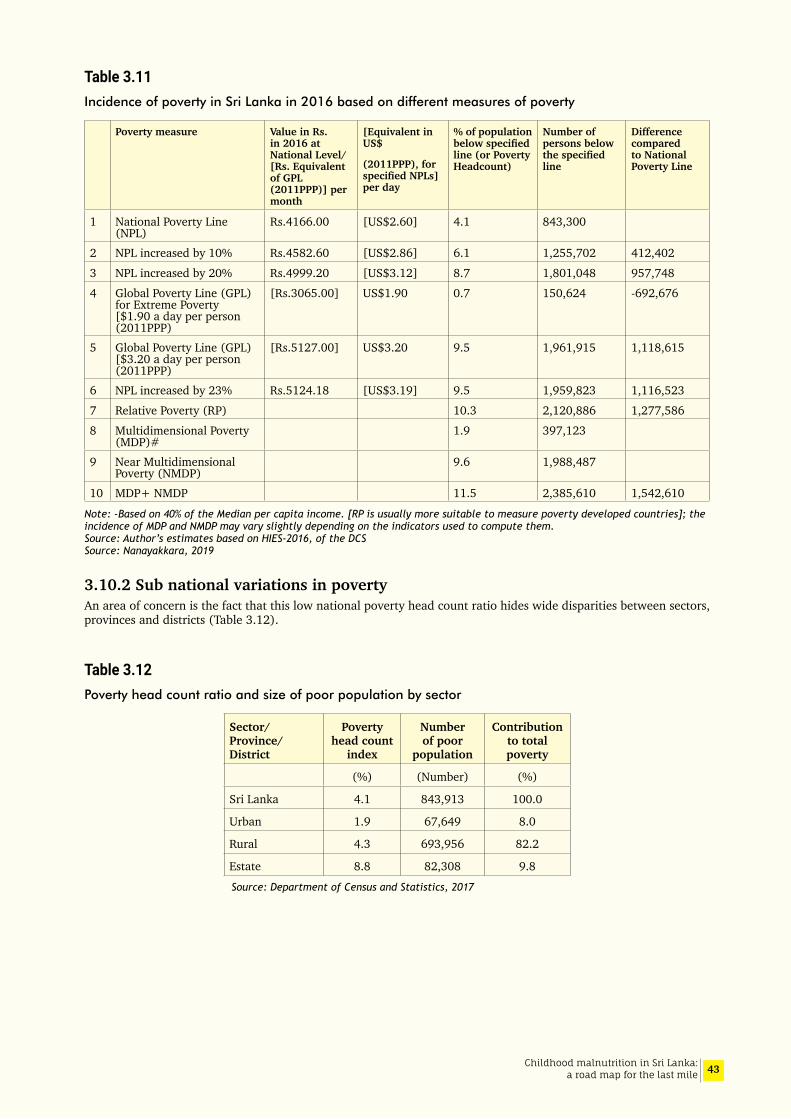
43Childhood malnutrition in Sri Lanka: a road map for the last mile
Table 3.11Incidence of poverty in Sri Lanka in 2016 based on different measures of poverty
Poverty measure Value in Rs. in 2016 at National Level/[Rs. Equivalent of GPL (2011PPP)] per month
[Equivalent in US$
(2011PPP), for specifiedNPLs]per day
% of population belowspecifiedline (or Poverty Headcount)
Number of persons below thespecifiedline
Difference compared to National Poverty Line
1 National Poverty Line (NPL)
Rs.4166.00 [US$2.60] 4.1 843,300
2 NPL increased by 10% Rs.4582.60 [US$2.86] 6.1 1,255,702 412,402
3 NPL increased by 20% Rs.4999.20 [US$3.12] 8.7 1,801,048 957,748
4 Global Poverty Line (GPL) for Extreme Poverty [$1.90 a day per person (2011PPP)
[Rs.3065.00] US$1.90 0.7 150,624 -692,676
5 Global Poverty Line (GPL) [$3.20 a day per person (2011PPP)
[Rs.5127.00] US$3.20 9.5 1,961,915 1,118,615
6 NPL increased by 23% Rs.5124.18 [US$3.19] 9.5 1,959,823 1,116,523
7 Relative Poverty (RP) 10.3 2,120,886 1,277,586
8 Multidimensional Poverty (MDP)#
1.9 397,123
9 Near Multidimensional Poverty (NMDP)
9.6 1,988,487
10 MDP+ NMDP 11.5 2,385,610 1,542,610
Note: -Based on 40% of the Median per capita income. [RP is usually more suitable to measure poverty developed countries]; the incidence of MDP and NMDP may vary slightly depending on the indicators used to compute them. Source: Author’s estimates based on HIES-2016, of the DCS Source: Nanayakkara, 2019
3.10.2 Sub national variations in povertyAn area of concern is the fact that this low national poverty head count ratio hides wide disparities between sectors, provinces and districts (Table 3.12).
Table 3.12Poverty head count ratio and size of poor population by sector
Sector/ Province/ District
Poverty head count
index
Number of poor
population
Contribution to total poverty
(%) (Number) (%)
Sri Lanka 4.1 843,913 100.0
Urban 1.9 67,649 8.0
Rural 4.3 693,956 82.2
Estate 8.8 82,308 9.8
Source: Department of Census and Statistics, 2017

44 Childhood malnutrition in Sri Lanka: a road map for the last mile
In the estate sector the poverty head count ratio is more than twice that of the rural sector and more than four times that of the urban sector. However, the geographic areas that report high head count indices do not necessarily have the largest number of poor people.
The greatest number of poor are seen in the rural sector and even the most affluent districts have poor populations (Figure 3-26). It should also be noted that in districts such as Mullaitivu, Kilinochchi, Mannar, and Vavuniya, the shares of the households in the ‘poorest group’ out of the total in Sri Lanka, are extremely small <1.0%), although the percentages within each of these districts are high. As such, it is important to consider both the percentage as well as the absolute number of households with low/very low levels of income, in deciding on interventions that improve living conditions of poorer households so as to minimize chances of anyone being left behind.
Figure 3.26Distribution of poor population across the country, 2012/13
Although poverty head count is the most commonly used indicator it does not take into account the depth and severity of poverty which should be considered when targeting the poor. Poverty gap is the mean shortfall from the poverty line, taking the non-poor as having no shortfall (zero shortfall). Figure 3.27 shows the contribution made by each district to the total short fall. It is seen that Kandy contributes the highest to the national shortfall.
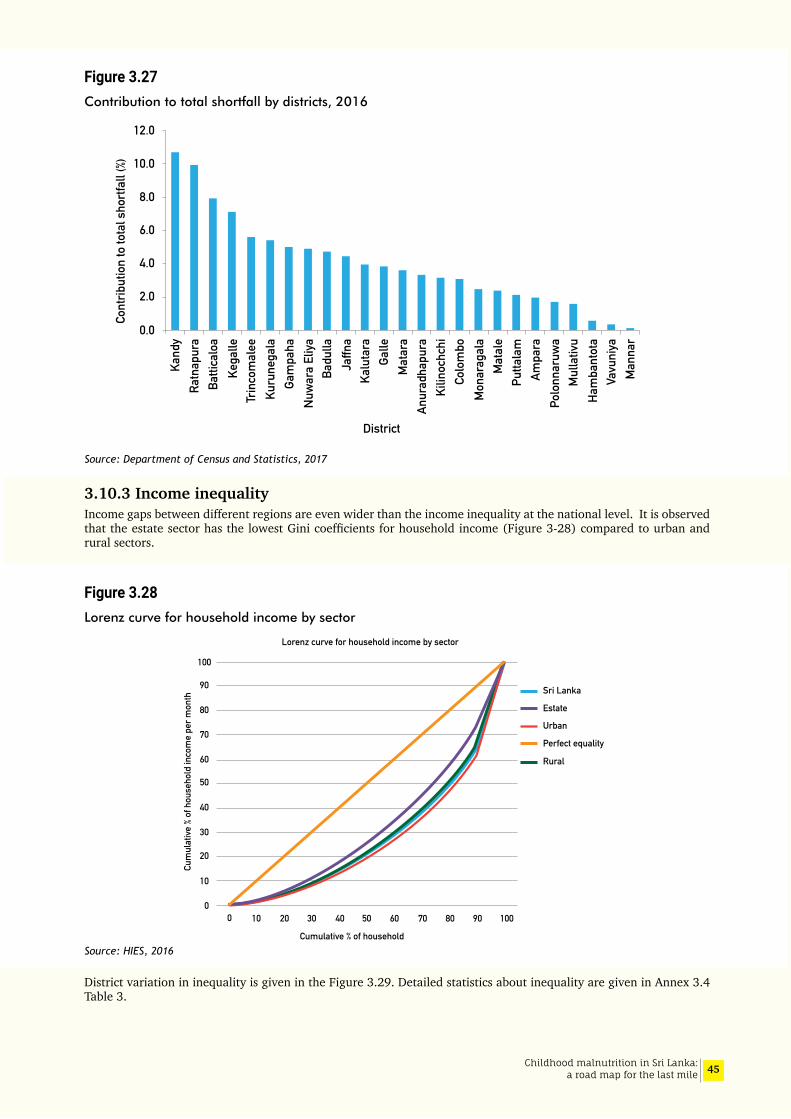
45Childhood malnutrition in Sri Lanka: a road map for the last mile
Figure 3.27Contribution to total shortfall by districts, 2016
Source: Department of Census and Statistics, 2017
3.10.3 Income inequalityIncome gaps between different regions are even wider than the income inequality at the national level. It is observed that the estate sector has the lowest Gini coefficients for household income (Figure 3-28) compared to urban and rural sectors.
Figure 3.28Lorenz curve for household income by sector
Source: HIES, 2016
District variation in inequality is given in the Figure 3.29. Detailed statistics about inequality are given in Annex 3.4 Table 3.
Cont
ribut
ion
to to
tal s
hortf
all (
%)
0.0
2.0
4.0
6.0
8.0
10.0
12.0
Kega
lle
Galle
Ham
bant
ota
Mat
ara
Ratn
apur
a
Mat
ale
Nuw
ara
Eliya
Ampa
ra
Mul
lativ
u
Kalu
tara
Batti
calo
a
Man
nar
Gam
paha
Badu
lla
Kuru
nega
la
Anur
adha
pura
Kand
y
Colo
mbo
Vavu
niya
Jaffn
a
Putta
lam
Polo
nnar
uwa
Trin
com
alee
Mon
arag
ala
Kilin
ochc
hiDistrict
0 10 20 30 40 50 60 70 80 90 1000
10
20
30
40
50
60
70
80
90
100
Cum
ulat
ive %
of h
ouse
hold
inco
me
per m
onth
Cumulative % of household
Sri Lanka
Estate
Urban
Rural
Perfect equality
Lorenz curve for household income by sector

46 Childhood malnutrition in Sri Lanka: a road map for the last mile
Figure 3.29Gini co-efficient for per capita income by district, 2016
Source: HIES 2016
If improvement in income is to make a mark on undernutrition, then the national growth needs to involve the poor and the dividends should reach the poor, the poor have to use the increased income for improving the quality and quantity of food consumed. It is also important for the government to direct some of the gains towards poverty alleviation. In Sri Lanka it is noted that there is considerable
inequality in incomes within sectors, provinces and districts (Figure 3.28, Figure 3.29).
Nanayakkara (2018) notes that “the richest 20% enjoy more than half the total household income of the country, while the poorest 20% get only 5%. The situation of the poorest 10% of the households is worse, with the share of household income being just 1.8% or less (Figure 3.30).
Figure 3.30Shares of household income and percentage of households falling into richest 20% and poorest 40%, by districts
Source: Nanayakkara, 2018
-0.1
6E-16
0.1
0.2
0.3
0.4
0.5
0.6
Kega
lle
Galle
Ham
bant
ota
Mat
ara
Ratn
apur
a
Mat
ale
Nuw
ara
Eliya
Ampa
ra
Mul
lativ
u
Kalu
tara
Batti
calo
a
Man
nar
Gam
paha
Badu
lla
Kuru
nega
la
Anur
adha
pura
Kand
y
Colo
mbo
Vavu
niya
Jaffn
a
Putta
lam
Polo
nnar
uwa
Trin
com
alee
Mon
arag
ala
Kilin
ochc
hi
0.0
10.0
20.0
30.0
40.0
50.0
60.0
70.0
80.0
72.9
54.5
51.5
50.2
9.7
55.3
41.4
16.0
65.2
71.6
66.6
% sh
are
of th
e Ho
useh
old
Inco
me
(for b
ars)
Kega
lle
Ham
bant
ota
Mat
ara
Ratn
apur
a
Mat
ale
Nuw
ara
Eliya
Ampa
ra
Mul
lativ
u
Kalu
tara
Batti
calo
aM
anna
r
Gam
paha
Badu
lla
Kuru
nega
la
Anur
adha
pura
Kand
y
Galle
Colo
mbo
Vavu
niya
Jaffn
a
Putta
lam
Polo
nnar
uwa
Trin
com
alee
Mon
arag
ala
Kilin
ochc
hi
0
1
2
3
4
5
6
7
8
Share of the HH income of theRichest 20% based on NationalHH income Deciles
% of Households with HH incomegreater than Rs. 81,380 (lowerlimit for richest 20% in National HH income Deciles
% of Households with HH incomeless than Rs. 36,500 (upper limitfor poorest 40% in National HH income Deciles
47Childhood malnutrition in Sri Lanka: a road map for the last mile
These inequalities mean that the country must purposively ensure an equitable access to economic participation for all its citizens, with particular emphasis on improving the livelihoods of the poorer 40% of households.
Based on his analysis of HIES 2016, and using the livelihood of the head of the household, Nanayakkara (2017) identifies four socioeconomic groups as living in poverty; namely persons living in households headed by “Agricultural, Forestry and Fishery Labourers” are identified as the poorest, followed by those in households headed by “Non-agricultural Labourers and similar workers”, “those unable or too old to work” and “Skilled Agriculture, Forestry and Fishery Workers”. He estimates that out of the children who are in “Income Poverty and/or Multidimensional Poverty”, 70 per cent are in households headed by the above 4 groups. Such analysis may help improve targeting of poverty alleviation and nutrition programs.
Nanayakkkara (2018) identifies key reasons for the spatial income inequality in Sri Lanka as follows:
1. “Inadequacy of opportunities in predominantly rural districts, the main contributing factor being inadequacy of infrastructure facilities, especially connectivity,
2. Inadequate attention given to the agricultural sector; 27% of the employed population are engaged in agricultural activities and nearly 30% of the moderately poor (based on global poverty line of $3.20 a day) are living in households headed by those engaged in agricultural activities. Many of them are also affected by frequent natural disasters, especially floods and droughts,
3. Low female labour force participation in Sri Lanka (only around 36%), especially in rural areas. This is mainly due to the inadequacy of decent employment opportunities in their villages,
4. Weaknesses in targeting the most deserving in the social protection programmes also adds to this prevailing undesirable situation”.
Of importance when considering childhood malnutrition is the fact that, around one-third of the poor are children under 15 years of age. The children in this age group account for 36.4 per cent of all persons in extreme poverty, surviving on less than $1.90 a day. Out of 5.2 million children < 15 years, 12.9 per cent are living in the poorest 10 per cent of households, while the percentage in the richest 10 per cent of households was only 6.9 in 2016. As such it is essential to develop strategies to identify vulnerable children and help them move out of poverty taking into consideration the current experience in poverty alleviation and difficulties faced in appropriate targeting of such help.
3.11 Food security and nutrition security
Food security refers to having “enough of the right foods at all times” and depends on the availability of food in the country, locally and at household level and the individual’s access and proper utilization.
Nutrition security also requires having enough of the right foods but in addition it requires having access to adequate feeding, care giving and hygienic practices as well as access to health, water and sanitation services (Figure 3.31). This means that food security is essential for nutrition security but not sufficient to prevent childhood malnutrition (Ruel, 2013).
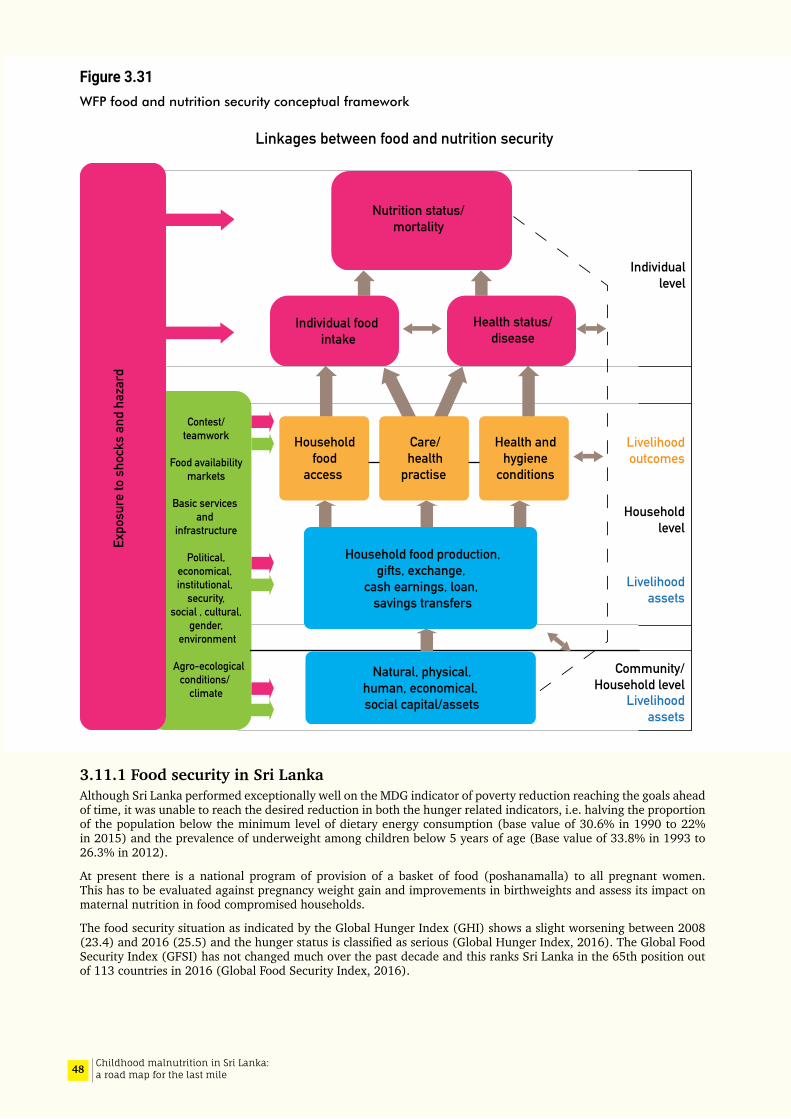
48 Childhood malnutrition in Sri Lanka: a road map for the last mile
Figure 3.31WFP food and nutrition security conceptual framework
3.11.1 Food security in Sri LankaAlthough Sri Lanka performed exceptionally well on the MDG indicator of poverty reduction reaching the goals ahead of time, it was unable to reach the desired reduction in both the hunger related indicators, i.e. halving the proportion of the population below the minimum level of dietary energy consumption (base value of 30.6% in 1990 to 22% in 2015) and the prevalence of underweight among children below 5 years of age (Base value of 33.8% in 1993 to 26.3% in 2012).
At present there is a national program of provision of a basket of food (poshanamalla) to all pregnant women. This has to be evaluated against pregnancy weight gain and improvements in birthweights and assess its impact on maternal nutrition in food compromised households.
The food security situation as indicated by the Global Hunger Index (GHI) shows a slight worsening between 2008 (23.4) and 2016 (25.5) and the hunger status is classified as serious (Global Hunger Index, 2016). The Global Food Security Index (GFSI) has not changed much over the past decade and this ranks Sri Lanka in the 65th position out of 113 countries in 2016 (Global Food Security Index, 2016).
Contest/teamwork
Food availability
markets
Basic services and
infrastructure
Political,economical, institutional,
security, social , cultural,
gender, environment
Agro-ecologicalconditions/
climate
Expo
sure
to s
hock
s an
d ha
zard
Nutrition status/mortality
Individual food intake
Health status/disease
Linkages between food and nutrition security
Individuallevel
Livelihoodoutcomes
Householdlevel
Livelihoodassets
Livelihoodassets
Community/
Household level
Householdfood
access
Care/health
practise
Health andhygiene
conditions
Household food production,gifts, exchange,
cash earnings, loan, savings transfers
Natural, physical,human, economical, social capital/assets

49Childhood malnutrition in Sri Lanka: a road map for the last mile
3.11.2 National surveys of food securityNutrition and food security survey, 2009This survey identified that stunting and underweight were associated with low dietary scores at household level and fewer months of adequate household food provisioning (MAHFP) in the previous year (MRI, 2009). The number of days that food stocks in the house would last was associated with acute undernutrition. However, the food consumption adequacy score (HFCAS) did not show a significant relationship. At the individual level, stunted children aged 6-23 months had significantly lower Dietary Diversity Scores and a lower meal frequency.
Increasing expenditure on food as a proportion of total household expenditure an indicator of poverty, was found to be associated with an upward trend in rates of stunting. As expected, children in food insecure households had higher prevalence of all indicators of malnutrition but specifically underweight. The later association may reflect the fact that food security assessment relates to deprivation in the immediate past. Although the above changes were not statistically significant a higher level of stunting was reported in households that adopted coping strategies and in households that received loans.
The prevalence of stunting and wasting was found to be inversely related to wealth quintiles and increasing house hold incomes. Non-availability of electricity probably reflecting poverty was a significant determinant of both stunting and underweight.
National Nutrition and micronutrient survey of pregnant women in Sri Lanka, 2015The mean Household Food Adequacy Score increased with maternal education- the difference between no schooling (80.4) and higher than A levels (93.8) being 13.4. The difference between the highest and lowest wealth quintiles was 9.1 (lowest- 83.1 and highest quintile- 92.2) (MRI,2015).
The percentage of households that were severely food insecure in the urban, rural and estate sectors were 1.8, 2.1 and 6.7 respectively. This percentage varied from 7.9% and 1.6% in the lowest and the second lowest wealth quintiles. It is noted that even the highest wealth quintile had 0.6% of food insecure households. Overall 2.2% of households had severe food insecurity while 27.8% were categorised as moderately food insecure.
National strategic review of food security and Nutrition: Towards Zero Hunger, 2017This review was designed as an analytical multi-stakeholder consultative exercise envisaged to provide a comprehensive study of the overall food security and nutrition situation of the country with a view to identifying key challenges to achieving SDG2 by 2030. The objectives were to analyse the food security situation in the country, evaluate the policy and programmatic responses aimed at improving food security and nutrition and to identify the gaps in accelerating progress and to provide recommendations to all stake holders for consideration and action (SAPRI et al, 2017).
According to the report, food availability in Sri Lanka at national level is not of great concern. National food availability has been increasing due to increased domestic production and importation. Currently 80% of the Sri Lanka’s annual food requirement is produced domestically and 20% is imported. The country is nearly self-sufficient in rice the staple food. Domestic food production accounts for nearly 70% of total availability and self- sufficiency in animal proteins (fish and poultry) is nearly 97% except for processed food such as dried fish, canned fish and milk powder. The staple food rice is imported when there is a short domestic supply like during crisis situations such as floods, droughts etc.
However, availability of adequate food at the national level does not ensure economic and physical access to food. Physical access to food has improved with increasing road densities and it is thought that increased per capita income and reduction in poverty has improved this situation. However, food and nutrition insecurity are reflected in the levels of undernutrition and especially disparities in its distribution. Income inequality, volatility in food prices, high post- harvest losses, poor storage and food processing capacities, high informal sector labour force participation, adverse weather phenomena and yield stagnation are some of the concerns identified in the analysis.
3.11.3 Trends in calorie inadequacyFigure 3.32 shows the trends in the estimated percentage of people who have an energy intake below minimum requirement. The world trend shows that there has been a reversal of the declining trend in the last few years. This is reflected in the Sri Lankan trend but not in the South Asian trend line.
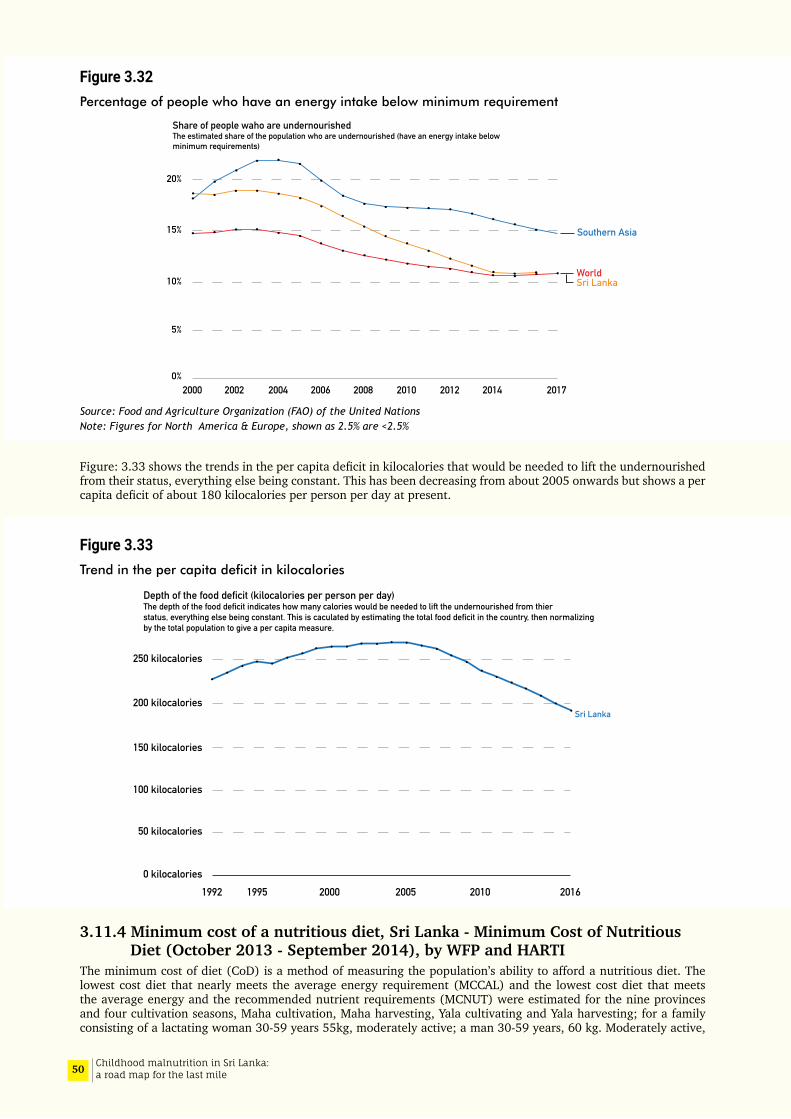
50 Childhood malnutrition in Sri Lanka: a road map for the last mile
Figure 3.32Percentage of people who have an energy intake below minimum requirement
Source: Food and Agriculture Organization (FAO) of the United NationsNote: Figures for North America & Europe, shown as 2.5% are <2.5%
Figure: 3.33 shows the trends in the per capita deficit in kilocalories that would be needed to lift the undernourished from their status, everything else being constant. This has been decreasing from about 2005 onwards but shows a per capita deficit of about 180 kilocalories per person per day at present.
Figure 3.33Trend in the per capita deficit in kilocalories
3.11.4 Minimum cost of a nutritious diet, Sri Lanka - Minimum Cost of Nutritious Diet (October 2013 - September 2014), by WFP and HARTI
The minimum cost of diet (CoD) is a method of measuring the population’s ability to afford a nutritious diet. The lowest cost diet that nearly meets the average energy requirement (MCCAL) and the lowest cost diet that meets the average energy and the recommended nutrient requirements (MCNUT) were estimated for the nine provinces and four cultivation seasons, Maha cultivation, Maha harvesting, Yala cultivating and Yala harvesting; for a family consisting of a lactating woman 30-59 years 55kg, moderately active; a man 30-59 years, 60 kg. Moderately active,
0%
5%
10%
15%
20%
Share of people waho are undernourished The estimated share of the population who are undernourished (have an energy intake belowminimum requirements)
2000 2002 2004 2006 2008 2010 2012 2014 2017
Southern Asia
Sri LankaWorld
0 kilocalories
50 kilocalories
100 kilocalories
150 kilocalories
200 kilocalories
250 kilocalories
1992 1995 2000 2005 2010 2016
Depth of the food deficit (kilocalories per person per day)The depth of the food deficit indicates how many calories would be needed to lift the undernourished from thierstatus, everything else being constant. This is caculated by estimating the total food deficit in the country, then normalizingby the total population to give a per capita measure.
Sri Lanka
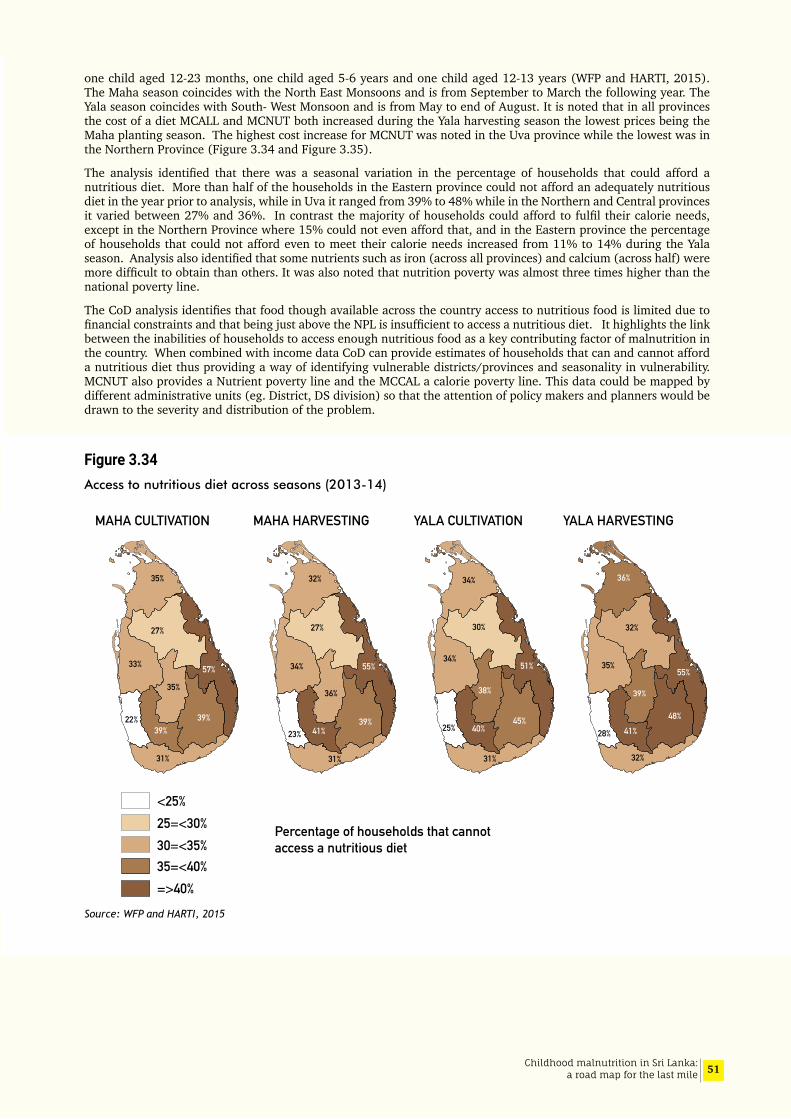
51Childhood malnutrition in Sri Lanka: a road map for the last mile
one child aged 12-23 months, one child aged 5-6 years and one child aged 12-13 years (WFP and HARTI, 2015). The Maha season coincides with the North East Monsoons and is from September to March the following year. The Yala season coincides with South- West Monsoon and is from May to end of August. It is noted that in all provinces the cost of a diet MCALL and MCNUT both increased during the Yala harvesting season the lowest prices being the Maha planting season. The highest cost increase for MCNUT was noted in the Uva province while the lowest was in the Northern Province (Figure 3.34 and Figure 3.35).
The analysis identified that there was a seasonal variation in the percentage of households that could afford a nutritious diet. More than half of the households in the Eastern province could not afford an adequately nutritious diet in the year prior to analysis, while in Uva it ranged from 39% to 48% while in the Northern and Central provinces it varied between 27% and 36%. In contrast the majority of households could afford to fulfil their calorie needs, except in the Northern Province where 15% could not even afford that, and in the Eastern province the percentage of households that could not afford even to meet their calorie needs increased from 11% to 14% during the Yala season. Analysis also identified that some nutrients such as iron (across all provinces) and calcium (across half) were more difficult to obtain than others. It was also noted that nutrition poverty was almost three times higher than the national poverty line.
The CoD analysis identifies that food though available across the country access to nutritious food is limited due to financial constraints and that being just above the NPL is insufficient to access a nutritious diet. It highlights the link between the inabilities of households to access enough nutritious food as a key contributing factor of malnutrition in the country. When combined with income data CoD can provide estimates of households that can and cannot afford a nutritious diet thus providing a way of identifying vulnerable districts/provinces and seasonality in vulnerability. MCNUT also provides a Nutrient poverty line and the MCCAL a calorie poverty line. This data could be mapped by different administrative units (eg. District, DS division) so that the attention of policy makers and planners would be drawn to the severity and distribution of the problem.
Figure 3.34Access to nutritious diet across seasons (2013-14)
Source: WFP and HARTI, 2015
25=<30%<25%
30=<35% 35=<40% =>40%
Percentage of households that cannot access a nutritious diet
MAHA CULTIVATION MAHA HARVESTING YALA CULTIVATION YALA HARVESTING
32%
27%
34%
23%
31%
39%
36%
55%
41%
35%
27%
33%
35%
22%39%
39%
57%
31%
34%
30%
34%
25%
31%
38%
51%
40% 45%
36%
32%
35%
39%
28%
32%
55%
41% 48%
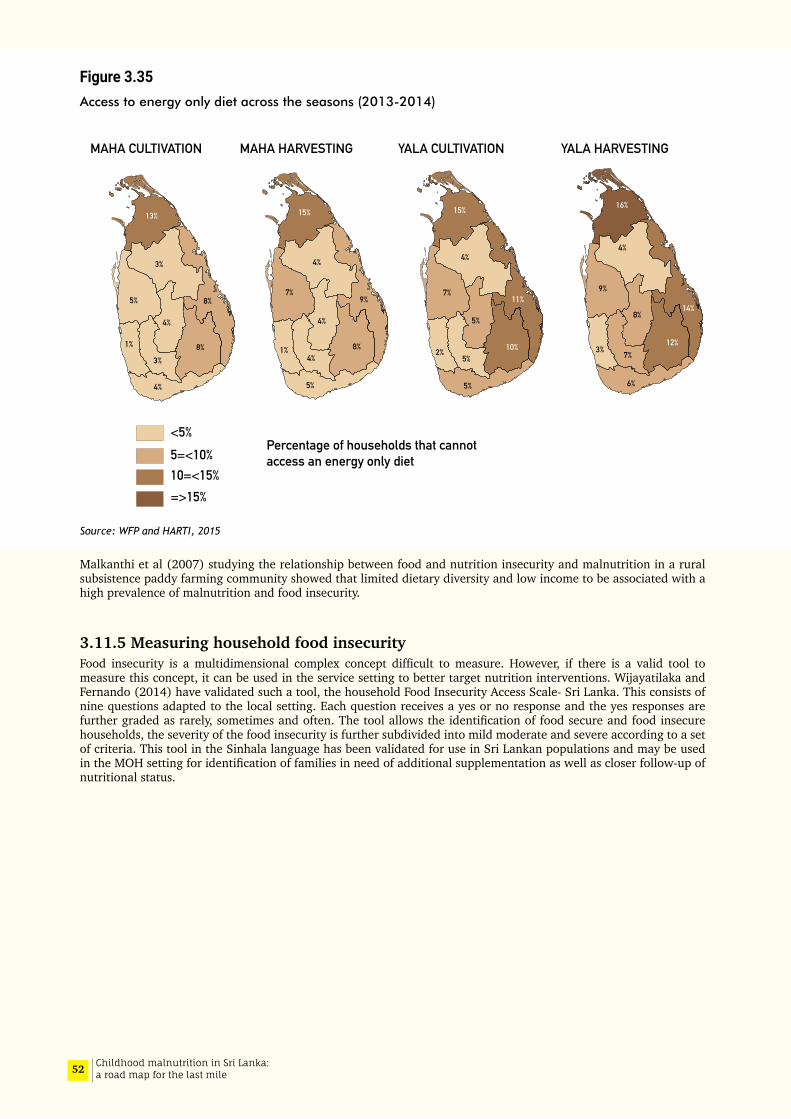
52 Childhood malnutrition in Sri Lanka: a road map for the last mile
Figure 3.35Access to energy only diet across the seasons (2013-2014)
Source: WFP and HARTI, 2015
Malkanthi et al (2007) studying the relationship between food and nutrition insecurity and malnutrition in a rural subsistence paddy farming community showed that limited dietary diversity and low income to be associated with a high prevalence of malnutrition and food insecurity.
3.11.5 Measuring household food insecurityFood insecurity is a multidimensional complex concept difficult to measure. However, if there is a valid tool to measure this concept, it can be used in the service setting to better target nutrition interventions. Wijayatilaka and Fernando (2014) have validated such a tool, the household Food Insecurity Access Scale- Sri Lanka. This consists of nine questions adapted to the local setting. Each question receives a yes or no response and the yes responses are further graded as rarely, sometimes and often. The tool allows the identification of food secure and food insecure households, the severity of the food insecurity is further subdivided into mild moderate and severe according to a set of criteria. This tool in the Sinhala language has been validated for use in Sri Lankan populations and may be used in the MOH setting for identification of families in need of additional supplementation as well as closer follow-up of nutritional status.
<5%5=<10%10=<15%=>15%
Percentage of households that cannot access an energy only diet
15%
4%
7%
5%
4%
4%8%
9%
1%
MAHA CULTIVATION MAHA HARVESTING YALA HARVESTINGYALA CULTIVATION
13%
3%
5%
4%
8%
8%
4%
3%
1%
15%
4%
7%
2% 10%
11%
5%
5%
5%
16%
4%
7%
6%
9%
8%14%
12%3%
53Childhood malnutrition in Sri Lanka: a road map for the last mile
04Risk factors for undernutrition: Further analysis of SLDHS 2016 data

54 Childhood malnutrition in Sri Lanka: a road map for the last mile
55Childhood malnutrition in Sri Lanka: a road map for the last mile
4.1 Part A: Factors associated with stunting and wasting in infants and young children
4.1.1 Differentials of undernutrition in infants and young childrenThree categories of linear growth, that is HAZ≥0, HAZ -0.01 to -2.00, and HAZ<-2 were cross-tabulated against a series of individual factors including feeding practices, childhood illness, child care practices, household and environmental factors, social-cultural and community attributes. The analyses were done for the children aged 0-23 months. Similar cross-tabulations were generated for acute nutritional status (WHZ≥0, WHZ -0.01 to -2.00, and WHZ<-2). The detailed tables are given in Annexes 4.1 and 4.2.
4.1.2 Differentials of stunting: descriptive bivariate analysis (Tables 1 to 7 in Annex 4.1)
As shown in Table 1 in Annex 4.1, the prevalence of stunting increases with age of child, and is higher in males than females. Preterm births and children with birthweight less than 3.00 kg, reported higher rates of stunting. The feeding practices were based on 24-hour recall; thus the prevalence of stunting did not show much difference according to feeding indicators (Annex 4.1, Table 2). However, children who received snacks (sugary foods, biscuits, bites) had an increased rate of stunting than those who did not receive any of these. Having diarrhoea or cough during the preceding 2 weeks was not associated with increased stunting (Annex 4.1, Table 3).
Table 4 in Annex 4.1 shows that children born to mothers with lower levels of education reported higher prevalence of stunting. The children of mothers who said that they did not have enough money for daily expenses of the household had higher rates of stunting. Prevalence of stunting was higher in households with unimproved drinking water sources and unimproved latrines and among those who were using solid (Bio-mass) fuel for cooking (Annex 4.1, Table 5). Stunting rate declined across household wealth quintiles from the lowest to highest. Stunting was lower in mothers who accessed the internet in the previous 12 months, this being considered as a proxy for wider exposure to information.
The prevalence of stunting varied according to ethnicity and religion of the chief householder (Annex 4.1, Table 6); but, there was no significant difference when domestic violence, women’s autonomy, or family burden due to illness were considered. Children living in the estate sector had higher rates of stunting than those in the urban and rural sectors. Notable differences were observed at provincial and district level (Annex 4.1, Table 7).
4.1.3 Factors associated with stunting in infants and young children: Case-control analysis
Children with stunting (HAZ<-2) were compared with children with normal height (HAZ≥0) in relation to various ‘causes’ as per UNICEF conceptual framework. The effect sizes for explanatory variables are presented as unadjusted and adjusted odds ratios.
In the bivariate analysis shown in Table 8 in Annex 4.1, odds of stunting was seen to increase significantly with advancing age of the child, was higher in males, and low birth weight or pre-term babies. Children living in households without improved sources of drinking water and using solid fuel (bio-mass) for cooking are at a significantly higher risk of stunting. Being in the lower three quintiles of the Household Wealth Index and mothers’ perceived poverty were predictive of stunting. Other explanatory factors include lower maternal education, low maternal exposure to media, non-usage of internet by mother, ethnicity being non-Sinhalese, living in the estate sector and in certain provinces (Central, Northern, Eastern, Uva, and Sabaragamuwa).
When adjusted for confounding effects through multivariate regression analysis (Table 4.1), the predictors that remained significant were: advancing age of child, male sex, birth weight less than 3.0 kg, not having enough money
04Risk factors for undernutrition: Further analysis of SLDHS 2016 data
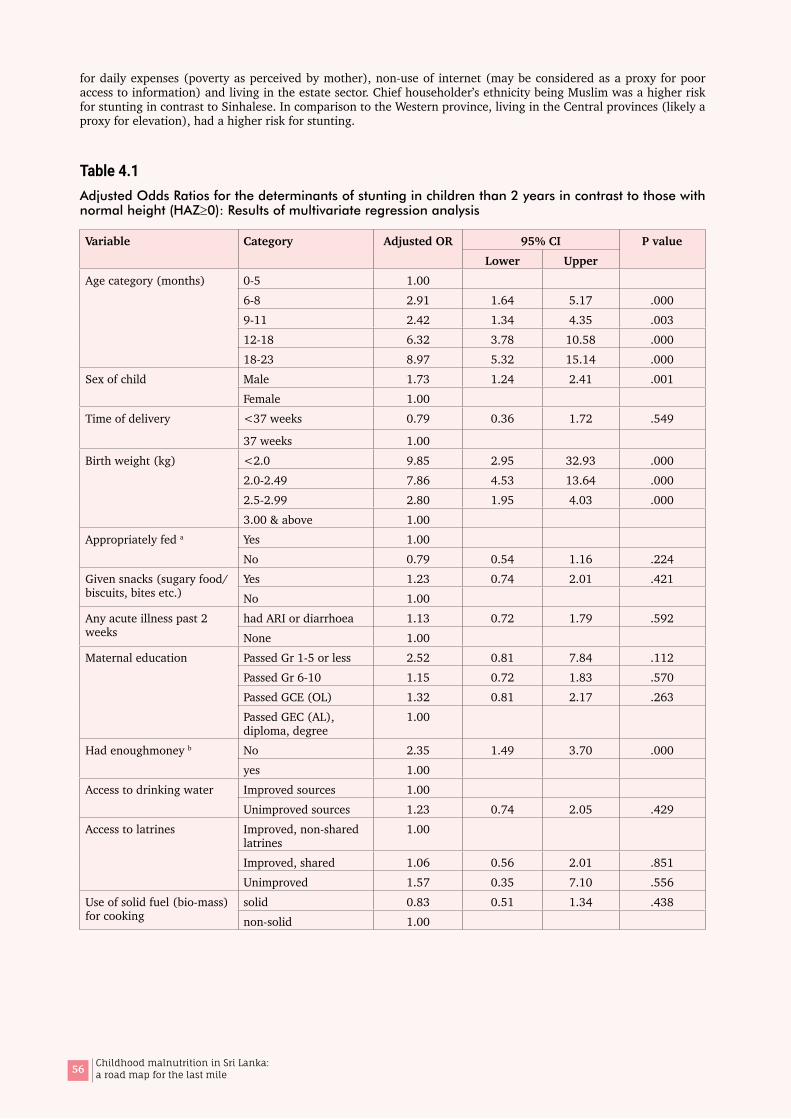
56 Childhood malnutrition in Sri Lanka: a road map for the last mile
for daily expenses (poverty as perceived by mother), non-use of internet (may be considered as a proxy for poor access to information) and living in the estate sector. Chief householder’s ethnicity being Muslim was a higher risk for stunting in contrast to Sinhalese. In comparison to the Western province, living in the Central provinces (likely a proxy for elevation), had a higher risk for stunting.
Table 4.1Adjusted Odds Ratios for the determinants of stunting in children than 2 years in contrast to those with normal height (HAZ≥0): Results of multivariate regression analysis
Variable Category Adjusted OR 95% CI P valueLower Upper
Age category (months) 0-5 1.00 6-8 2.91 1.64 5.17 .0009-11 2.42 1.34 4.35 .00312-18 6.32 3.78 10.58 .00018-23 8.97 5.32 15.14 .000
Sex of child Male 1.73 1.24 2.41 .001Female 1.00
Time of delivery <37 weeks 0.79 0.36 1.72 .549
37 weeks 1.00 Birth weight (kg) <2.0 9.85 2.95 32.93 .000
2.0-2.49 7.86 4.53 13.64 .0002.5-2.99 2.80 1.95 4.03 .0003.00 & above 1.00
Appropriately fed a Yes 1.00 No 0.79 0.54 1.16 .224
Given snacks (sugary food/ biscuits, bites etc.)
Yes 1.23 0.74 2.01 .421No 1.00
Any acute illness past 2 weeks
had ARI or diarrhoea 1.13 0.72 1.79 .592None 1.00
Maternal education Passed Gr 1-5 or less 2.52 0.81 7.84 .112Passed Gr 6-10 1.15 0.72 1.83 .570Passed GCE (OL) 1.32 0.81 2.17 .263Passed GEC (AL), diploma, degree
1.00
Had enoughmoney b No 2.35 1.49 3.70 .000yes 1.00
Access to drinking water Improved sources 1.00 Unimproved sources 1.23 0.74 2.05 .429
Access to latrines Improved, non-shared latrines
1.00
Improved, shared 1.06 0.56 2.01 .851Unimproved 1.57 0.35 7.10 .556
Use of solid fuel (bio-mass) for cooking
solid 0.83 0.51 1.34 .438non-solid 1.00

57Childhood malnutrition in Sri Lanka: a road map for the last mile
Variable Category Adjusted OR 95% CI P valueLower Upper
Wealth index quintile Lowest 1.16 0.50 2.71 .724Second 1.24 0.59 2.59 .574Middle 1.41 0.69≠ 2.87 .342Fourth 1.15 0.60 2.21 .678Highest 1.00
Exposure to media (Radio, TV, Newspaper)
Access to all 3 1.00 No access to all 3 0.79 0.50 1.23 .289
Internet usage Used within 12 months 1.00 Did not use 1.80 1.01 3.19 .044
Ethnicity Sinhala 1.00 Tamil 1.20 0.61 2.36 .587Muslim 1.98 1.07 3.69 .030
Autonomy of women Yes 1.00 No 0.76 0.48 1.19 .224
Residential sector Estate 1.29 0.76 2.18 .350Rural 0.74 0.26 2.10 .569Urban 1.00
Province Western 1.00 Central 2.30 1.14 4.66 .020Southern 0.71 0.37 1.39 .318Northern 1.92 0.79 4.68 .149Eastern 1.82 0.85 3.91 .123North-western 1.06 0.55 2.05 .864North-central 1.42 0.68 2.97 .347Uva 1.80 0.85 3.83 .127Sabaragamuwa 1.69 0.82 3.47 .152
aAppropriately fed is defined as exclusively breastfed if age is < 6 months or having a minimum acceptable diet if aged 6 to 23 months b based on the response to the question “Do you have enough money for the daily expenses of your house?”
Table 4.2Adjusted Odds Ratios for the determinants of stunting in children than 2 years in contrast to those with normal height (HAZ≥0): Final step of the multiple logistic regression analyses
Variable Category Adjusted OR 95% CI P valueLower Upper
Age category (months) 0-5 1.00 6-8 2.15 1.27 3.64 .0049-11 1.79 1.04 3.08 .03612-18 4.75 2.96 7.62 .00018-23 6.94 4.28 11.28 .000
Sex of child Male 1.62 1.18 2.24 .003Female 1.00
Birth weight (kg) <2.0 7.26 2.47 21.32 .0002.0-2.49 6.94 4.16 11.59 .0002.5-2.99 2.58 1.82 3.64 .0003.00 & above 1.00
Had enough money b No 2.22 1.48 3.34 .000yes 1.00
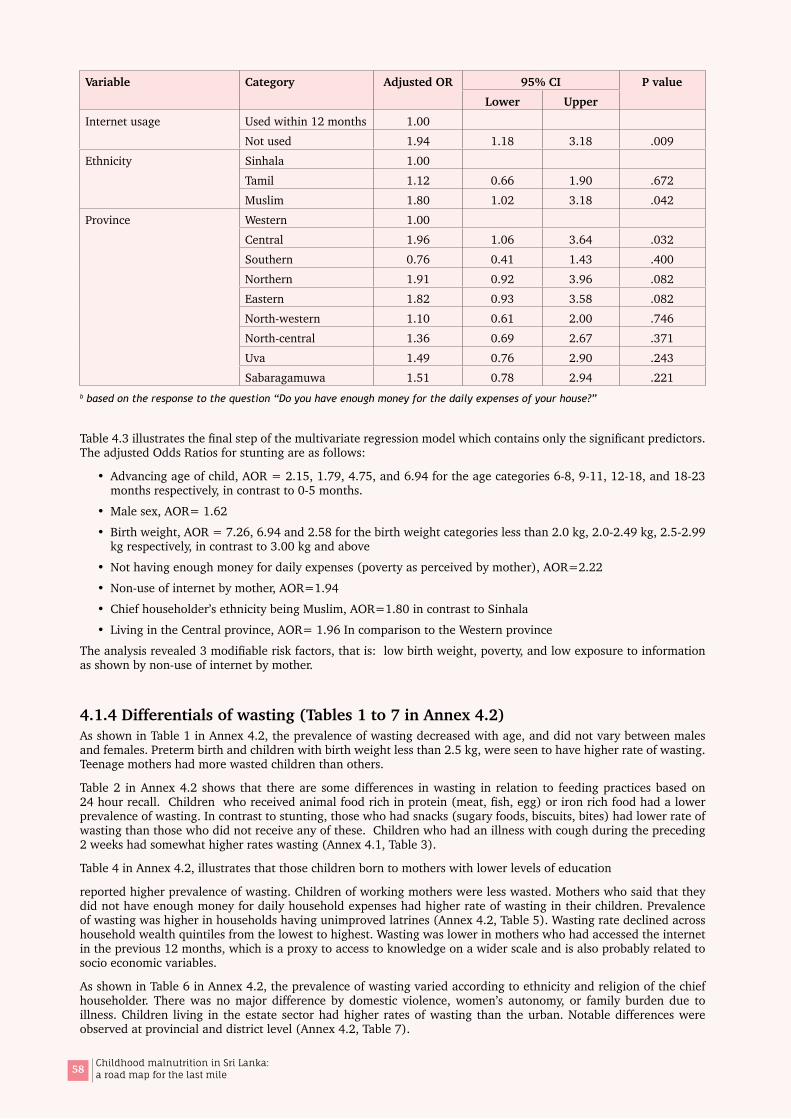
58 Childhood malnutrition in Sri Lanka: a road map for the last mile
Variable Category Adjusted OR 95% CI P valueLower Upper
Internet usage Used within 12 months 1.00 Not used 1.94 1.18 3.18 .009
Ethnicity Sinhala 1.00 Tamil 1.12 0.66 1.90 .672Muslim 1.80 1.02 3.18 .042
Province Western 1.00 Central 1.96 1.06 3.64 .032Southern 0.76 0.41 1.43 .400Northern 1.91 0.92 3.96 .082Eastern 1.82 0.93 3.58 .082North-western 1.10 0.61 2.00 .746North-central 1.36 0.69 2.67 .371Uva 1.49 0.76 2.90 .243Sabaragamuwa 1.51 0.78 2.94 .221
b based on the response to the question “Do you have enough money for the daily expenses of your house?”
Table 4.3 illustrates the final step of the multivariate regression model which contains only the significant predictors. The adjusted Odds Ratios for stunting are as follows:
• Advancing age of child, AOR = 2.15, 1.79, 4.75, and 6.94 for the age categories 6-8, 9-11, 12-18, and 18-23 months respectively, in contrast to 0-5 months.
• Male sex, AOR= 1.62
• Birth weight, AOR = 7.26, 6.94 and 2.58 for the birth weight categories less than 2.0 kg, 2.0-2.49 kg, 2.5-2.99 kg respectively, in contrast to 3.00 kg and above
• Not having enough money for daily expenses (poverty as perceived by mother), AOR=2.22
• Non-use of internet by mother, AOR=1.94
• Chief householder’s ethnicity being Muslim, AOR=1.80 in contrast to Sinhala
• Living in the Central province, AOR= 1.96 In comparison to the Western province
The analysis revealed 3 modifiable risk factors, that is: low birth weight, poverty, and low exposure to information as shown by non-use of internet by mother.
4.1.4 Differentials of wasting (Tables 1 to 7 in Annex 4.2)As shown in Table 1 in Annex 4.2, the prevalence of wasting decreased with age, and did not vary between males and females. Preterm birth and children with birth weight less than 2.5 kg, were seen to have higher rate of wasting. Teenage mothers had more wasted children than others.
Table 2 in Annex 4.2 shows that there are some differences in wasting in relation to feeding practices based on 24 hour recall. Children who received animal food rich in protein (meat, fish, egg) or iron rich food had a lower prevalence of wasting. In contrast to stunting, those who had snacks (sugary foods, biscuits, bites) had lower rate of wasting than those who did not receive any of these. Children who had an illness with cough during the preceding 2 weeks had somewhat higher rates wasting (Annex 4.1, Table 3).
Table 4 in Annex 4.2, illustrates that those children born to mothers with lower levels of education
reported higher prevalence of wasting. Children of working mothers were less wasted. Mothers who said that they did not have enough money for daily household expenses had higher rate of wasting in their children. Prevalence of wasting was higher in households having unimproved latrines (Annex 4.2, Table 5). Wasting rate declined across household wealth quintiles from the lowest to highest. Wasting was lower in mothers who had accessed the internet in the previous 12 months, which is a proxy to access to knowledge on a wider scale and is also probably related to socio economic variables.
As shown in Table 6 in Annex 4.2, the prevalence of wasting varied according to ethnicity and religion of the chief householder. There was no major difference by domestic violence, women’s autonomy, or family burden due to illness. Children living in the estate sector had higher rates of wasting than the urban. Notable differences were observed at provincial and district level (Annex 4.2, Table 7).

59Childhood malnutrition in Sri Lanka: a road map for the last mile
4.1.5 Factors associated with wasting in infants and young children: Case-control analysis
Children with wasting (WHZ<-2) were compared with children with normal growth (WHZ≥0) in relation to various ‘causes’ as per UNICEF conceptual framework. The effect sizes for explanatory variables are presented as unadjusted and adjusted odds ratios.
In the bivariate analysis as shown in Table 8 in Annex 4.2, advancing age of child was protective against wasting. Wasting was significantly high in LBW or pre-term babies. Households using solid fuel (bio-mass) for cooking are at a significantly higher risk for wasting. Households in the lower 4 quintiles according to Household Wealth Index, and mothers’ perceived poverty were predictive of wasting. Other explanatory factors include lower maternal education, low maternal exposure to media, non-usage of internet by mother, ethnicity being Sinhala or Tamil, living in the rural sector and in the Central province.
When adjusted for confounding effects (Table 4.3), through multivariate regression analysis, few predictors remained significant: age of child, maternal education, birth weight less than 3.0 kg, and ethnicity of the chief householder.
Table 4.3Adjusted Odds Ratios for the determinants of wasting in children than 2 years in contrast to those without wasting (WHZ≥0): Results of multivariate regression analysis
Variable Category Adjusted OR 95% CI P valueLower Upper
Age Category (months) 0-5 1.00 6-8 0.33 0.13 0.85 .0219-11 0.42 0.15 1.15 .09112-18 0.39 0.15 1.06 .06518-23 0.45 0.17 1.23 .122
Time of delivery <37 weeks 1.35 0.67 2.74 .404≥ 37 weeks 1.00
Birth weight (kg) <2.0 4.42 1.53 12.74 .0062.0-2.49 2.27 1.41 3.64 .0012.5-2.99 1.28 0.92 1.80 .1493.00 & above 1.00
Given foods of animal origin Yes 1.00 No 1.13 0.68 1.89 .635Child <6 months 0.50 0.19 1.31 .156
Given snacks (sugary food/ biscuits, bites etc.)
Yes 0.88 0.56 1.36 .551No 1.00
Any acute illness past 2 weeks
Had ARI or diarrhoea 1.21 0.80 1.84 .358None 1.00
Maternal education Passed Gr 1-5 or less 2.25 0.93 5.40 .071Passed Gr 6-10 1.69 1.09 2.63 .020Passed GCE (OL) 1.53 0.95 2.47 .079Passed GEC (AL), diploma, degree
1.00
Has enough money for daily expenses b
No 1.06 0.71 1.58 .793Yes 1.00
Wealth index quintile Lowest 1.63 0.80 3.32 .175Second 1.28 0.67 2.47 .458Middle 1.24 0.66 2.32 .505Fourth 1.30 0.70 2.41 .399Highest 1.00
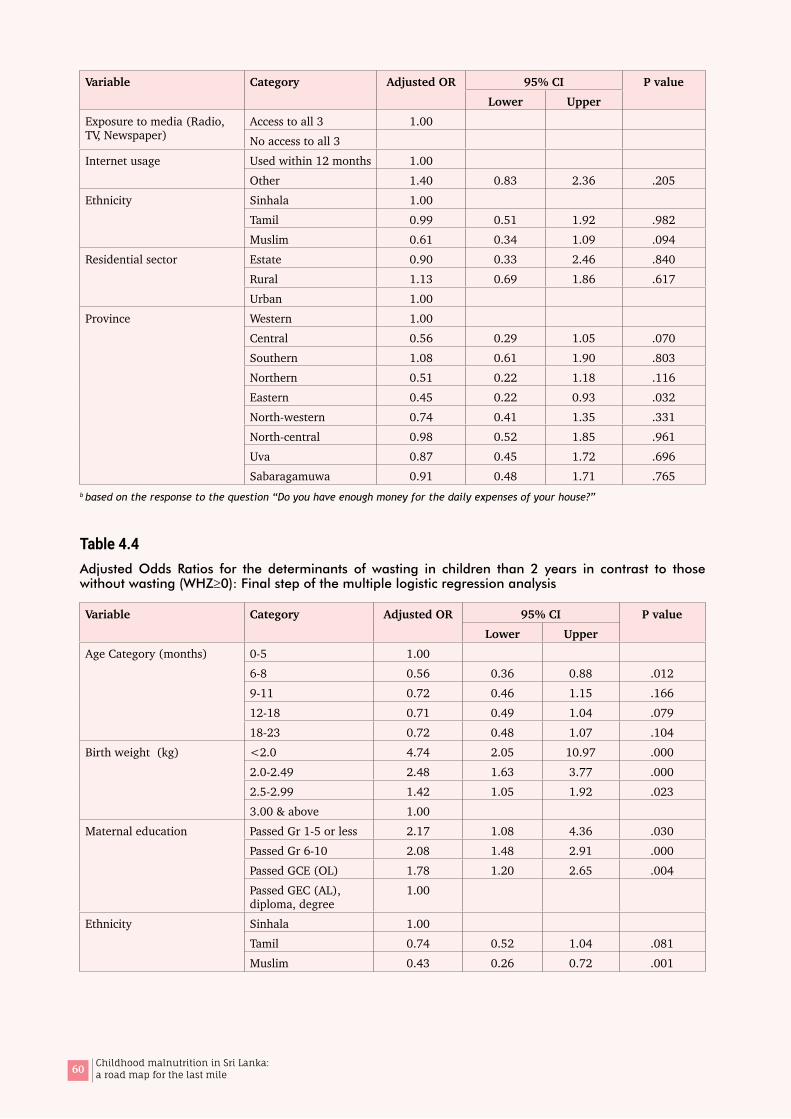
60 Childhood malnutrition in Sri Lanka: a road map for the last mile
Variable Category Adjusted OR 95% CI P valueLower Upper
Exposure to media (Radio, TV, Newspaper)
Access to all 3 1.00 No access to all 3
Internet usage Used within 12 months 1.00 Other 1.40 0.83 2.36 .205
Ethnicity Sinhala 1.00 Tamil 0.99 0.51 1.92 .982Muslim 0.61 0.34 1.09 .094
Residential sector Estate 0.90 0.33 2.46 .840Rural 1.13 0.69 1.86 .617Urban 1.00
Province Western 1.00 Central 0.56 0.29 1.05 .070Southern 1.08 0.61 1.90 .803Northern 0.51 0.22 1.18 .116Eastern 0.45 0.22 0.93 .032North-western 0.74 0.41 1.35 .331North-central 0.98 0.52 1.85 .961Uva 0.87 0.45 1.72 .696Sabaragamuwa 0.91 0.48 1.71 .765
b based on the response to the question “Do you have enough money for the daily expenses of your house?”
Table 4.4Adjusted Odds Ratios for the determinants of wasting in children than 2 years in contrast to those without wasting (WHZ≥0): Final step of the multiple logistic regression analysis
Variable Category Adjusted OR 95% CI P valueLower Upper
Age Category (months) 0-5 1.00 6-8 0.56 0.36 0.88 .0129-11 0.72 0.46 1.15 .16612-18 0.71 0.49 1.04 .07918-23 0.72 0.48 1.07 .104
Birth weight (kg) <2.0 4.74 2.05 10.97 .0002.0-2.49 2.48 1.63 3.77 .0002.5-2.99 1.42 1.05 1.92 .0233.00 & above 1.00
Maternal education Passed Gr 1-5 or less 2.17 1.08 4.36 .030Passed Gr 6-10 2.08 1.48 2.91 .000Passed GCE (OL) 1.78 1.20 2.65 .004Passed GEC (AL), diploma, degree
1.00
Ethnicity Sinhala 1.00 Tamil 0.74 0.52 1.04 .081Muslim 0.43 0.26 0.72 .001
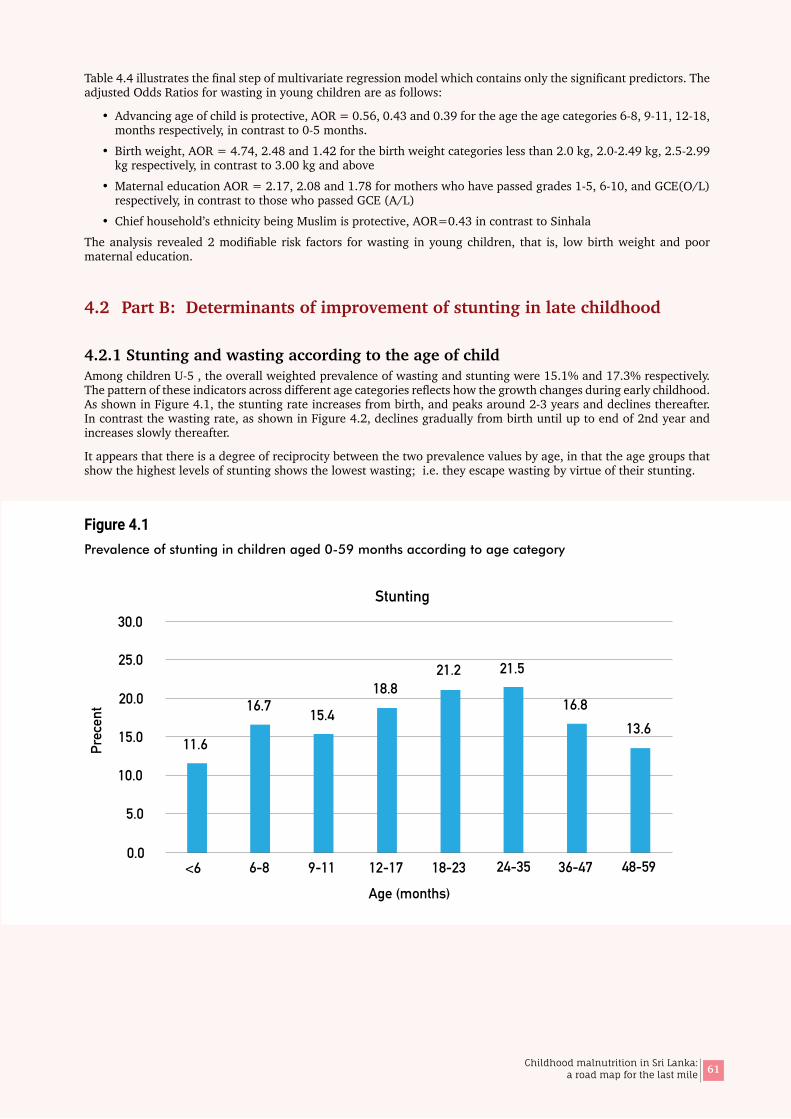
61Childhood malnutrition in Sri Lanka: a road map for the last mile
Table 4.4 illustrates the final step of multivariate regression model which contains only the significant predictors. The adjusted Odds Ratios for wasting in young children are as follows:
• Advancing age of child is protective, AOR = 0.56, 0.43 and 0.39 for the age the age categories 6-8, 9-11, 12-18, months respectively, in contrast to 0-5 months.
• Birth weight, AOR = 4.74, 2.48 and 1.42 for the birth weight categories less than 2.0 kg, 2.0-2.49 kg, 2.5-2.99 kg respectively, in contrast to 3.00 kg and above
• Maternal education AOR = 2.17, 2.08 and 1.78 for mothers who have passed grades 1-5, 6-10, and GCE(O/L) respectively, in contrast to those who passed GCE (A/L)
• Chief household’s ethnicity being Muslim is protective, AOR=0.43 in contrast to Sinhala
The analysis revealed 2 modifiable risk factors for wasting in young children, that is, low birth weight and poor maternal education.
4.2 Part B: Determinants of improvement of stunting in late childhood
4.2.1 Stunting and wasting according to the age of childAmong children U-5 , the overall weighted prevalence of wasting and stunting were 15.1% and 17.3% respectively. The pattern of these indicators across different age categories reflects how the growth changes during early childhood. As shown in Figure 4.1, the stunting rate increases from birth, and peaks around 2-3 years and declines thereafter. In contrast the wasting rate, as shown in Figure 4.2, declines gradually from birth until up to end of 2nd year and increases slowly thereafter.
It appears that there is a degree of reciprocity between the two prevalence values by age, in that the age groups that show the highest levels of stunting shows the lowest wasting; i.e. they escape wasting by virtue of their stunting.
Figure 4.1Prevalence of stunting in children aged 0-59 months according to age category
0.0
5.0
10.0
15.0
20.0
25.0
30.0
11.6
16.7 15.4
18.821.2 21.5
16.813.6
<6 6-8 9-11 12-17 18-23 24-35 36-47 48-59
Age (months)
Prec
ent
Stunting
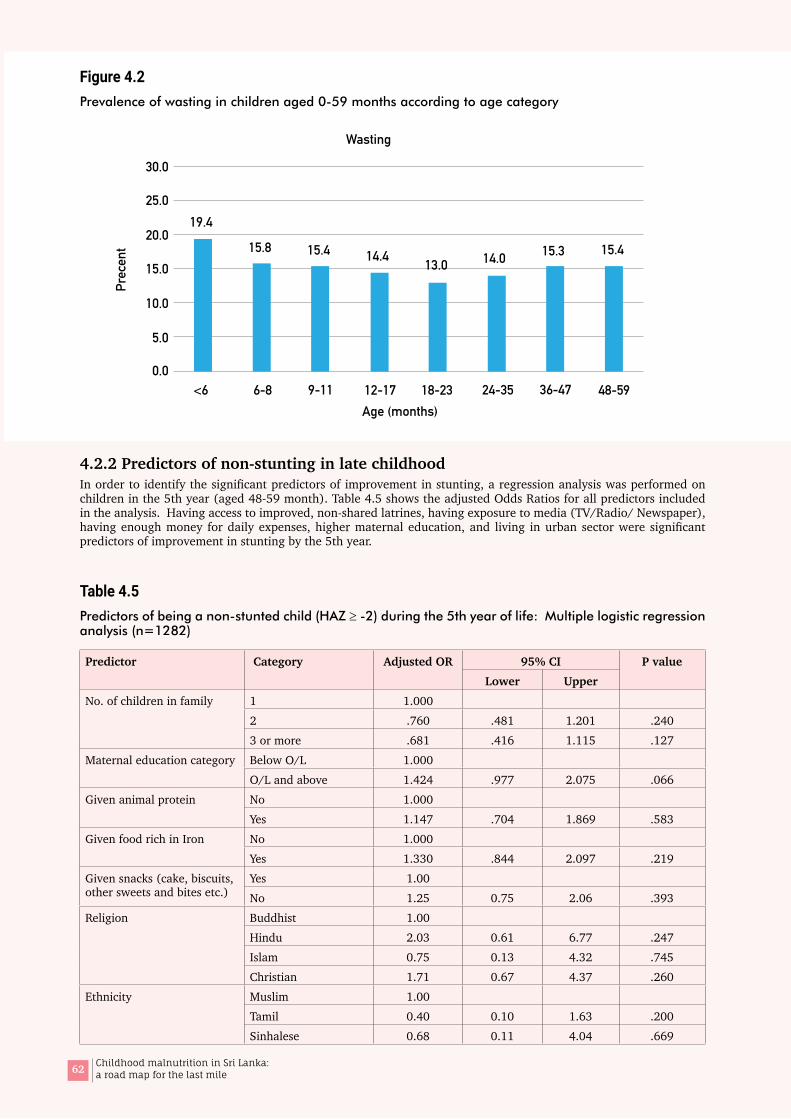
62 Childhood malnutrition in Sri Lanka: a road map for the last mile
Figure 4.2Prevalence of wasting in children aged 0-59 months according to age category
4.2.2 Predictors of non-stunting in late childhoodIn order to identify the significant predictors of improvement in stunting, a regression analysis was performed on children in the 5th year (aged 48-59 month). Table 4.5 shows the adjusted Odds Ratios for all predictors included in the analysis. Having access to improved, non-shared latrines, having exposure to media (TV/Radio/ Newspaper), having enough money for daily expenses, higher maternal education, and living in urban sector were significant predictors of improvement in stunting by the 5th year.
Table 4.5Predictors of being a non-stunted child (HAZ ≥ -2) during the 5th year of life: Multiple logistic regression analysis (n=1282)
Predictor Category Adjusted OR 95% CI P valueLower Upper
No. of children in family 1 1.0002 .760 .481 1.201 .2403 or more .681 .416 1.115 .127
Maternal education category Below O/L 1.000O/L and above 1.424 .977 2.075 .066
Given animal protein No 1.000Yes 1.147 .704 1.869 .583
Given food rich in Iron No 1.000Yes 1.330 .844 2.097 .219
Given snacks (cake, biscuits, other sweets and bites etc.)
Yes 1.00 No 1.25 0.75 2.06 .393
Religion Buddhist 1.00 Hindu 2.03 0.61 6.77 .247Islam 0.75 0.13 4.32 .745Christian 1.71 0.67 4.37 .260
Ethnicity Muslim 1.00 Tamil 0.40 0.10 1.63 .200Sinhalese 0.68 0.11 4.04 .669
0.0
5.0
10.0
15.0
20.0
25.0
30.0
Prec
ent
19.4
15.8 15.4 14.4 13.0 14.0 15.3 15.4
<6 6-8 9-11 12-17 18-23 24-35 36-47 48-59Age (months)
Wasting
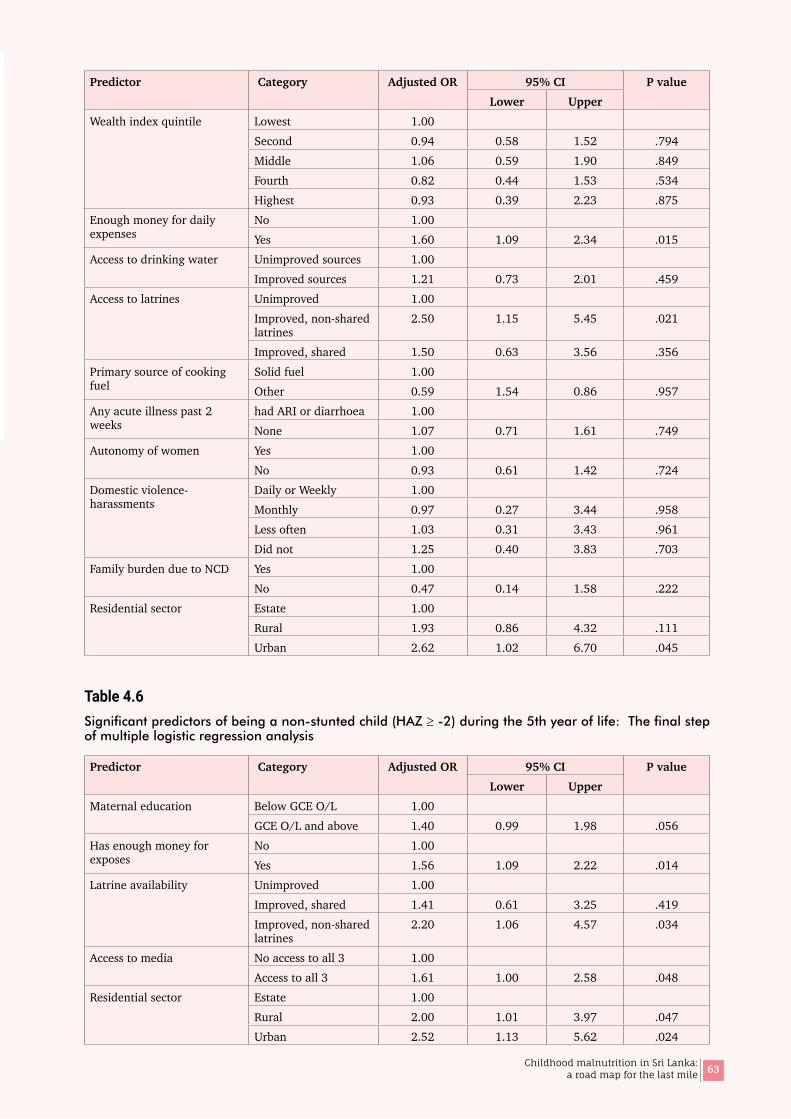
63Childhood malnutrition in Sri Lanka: a road map for the last mile
Predictor Category Adjusted OR 95% CI P valueLower Upper
Wealth index quintile Lowest 1.00 Second 0.94 0.58 1.52 .794Middle 1.06 0.59 1.90 .849Fourth 0.82 0.44 1.53 .534Highest 0.93 0.39 2.23 .875
Enough money for daily expenses
No 1.00 Yes 1.60 1.09 2.34 .015
Access to drinking water Unimproved sources 1.00 Improved sources 1.21 0.73 2.01 .459
Access to latrines Unimproved 1.00 Improved, non-shared latrines
2.50 1.15 5.45 .021
Improved, shared 1.50 0.63 3.56 .356Primary source of cooking fuel
Solid fuel 1.00 Other 0.59 1.54 0.86 .957
Any acute illness past 2 weeks
had ARI or diarrhoea 1.00 None 1.07 0.71 1.61 .749
Autonomy of women Yes 1.00 No 0.93 0.61 1.42 .724
Domestic violence-harassments
Daily or Weekly 1.00 Monthly 0.97 0.27 3.44 .958Less often 1.03 0.31 3.43 .961Did not 1.25 0.40 3.83 .703
Family burden due to NCD Yes 1.00 No 0.47 0.14 1.58 .222
Residential sector Estate 1.00 Rural 1.93 0.86 4.32 .111Urban 2.62 1.02 6.70 .045
Table 4.6Significant predictors of being a non-stunted child (HAZ ≥ -2) during the 5th year of life: The final step of multiple logistic regression analysis
Predictor Category Adjusted OR 95% CI P valueLower Upper
Maternal education Below GCE O/L 1.00 GCE O/L and above 1.40 0.99 1.98 .056
Has enough money for exposes
No 1.00 Yes 1.56 1.09 2.22 .014
Latrine availability Unimproved 1.00 Improved, shared 1.41 0.61 3.25 .419Improved, non-shared latrines
2.20 1.06 4.57 .034
Access to media No access to all 3 1.00 Access to all 3 1.61 1.00 2.58 .048
Residential sector Estate 1.00 Rural 2.00 1.01 3.97 .047Urban 2.52 1.13 5.62 .024

64 Childhood malnutrition in Sri Lanka: a road map for the last mile
As shown in Table 4.6, the key predictors for improvement of stunting during the 5th year of life that remained significant in the final step of the analysis are:
• Availability of improved non-shared latrine (AOR=2.20), in contrast to unimproved latrines
• Having access to all 03 media (AOR=1.61)
• Having enough money for daily expenses (AOR=1.56)
• Maternal education level of having passed GCE (O/L) or above (AOR=1.40)
• Living in rural (AOR=1.01) urban (AOR=1.13) sector in contrast to estate sector
All above except the last one, are modifiable factors.
4.3 Part C: Probable areas for intervention
4.3.1 Effect of improving birth weight on nutritional statusThe present analysis confirmed that the birthweight is the most significant and strongest predictor of child nutritional status and is consistent with previous literature. Distribution of birth weights in children < 2 years shows that 39.2% of children had a birth weight between 2.5-2.9 kg and 46.0%, 3.0 kg and higher (Table 4.7). When birth weight was less than 3.0 kg, the prevalence of stunting exceeded the ‘high’ level (≥20%) of public health significance, and wasting the ‘very high’ level (≥15.0%) (Table 4.8).
Table 4.7Distribution of birth weights of children aged 0-23 months, DHS 2016
Birth weight (Kg) Count (unweighted) Percent (weighted)
<2.0 68 2.52.0-2.49 328 12.32.5-2.99 1085 39.23.00 & above 1243 46.0Total 2724 100.0
Mean=3078 g; Median 2930 g; SD=1126 g (weighted analysis of 0-23 months children)
Table 4.8Stunting and wasting according to birth weight categories
Birth weight Stunting (%) Wasting (%)< 2000 g 39.0 29.82000-2499 g 30.0 22.42500-2999 g 20.4 15.4≥3000 g 12.2 11.3
Projected stunting and wasting on hypothetical increase of birth weight of every birthUsing DHS 2016 data, hypothetical birth weights were generated by adding 100 g to every birth weight of children less than 2 years. Then, the number stunted was re-calculated using the birth weight specific stunting rates. The stunting rates were projected for every 100 g increment. Similar analysis was performed on wasting.
Table 4.9 shows projections of the expected prevalence of stunting and wasting for each 100 grams increment of birthweight. The analysis was based on children less than 2 years of age.
The projections indicate that nearly 6% reduction of stunting from its current value of 18.3% to 17.1% would be possible if the birthweight of every newborn is increased by 100 g from the current birth weight. The reduction is not linear with every additional 100 g (Figure 4.3). However, birth weight is a consistent predictor though the percentage gain would be marginal. The very slow increase in birthweights over time probably is the reason for stagnation of rates of undernutrition in children.
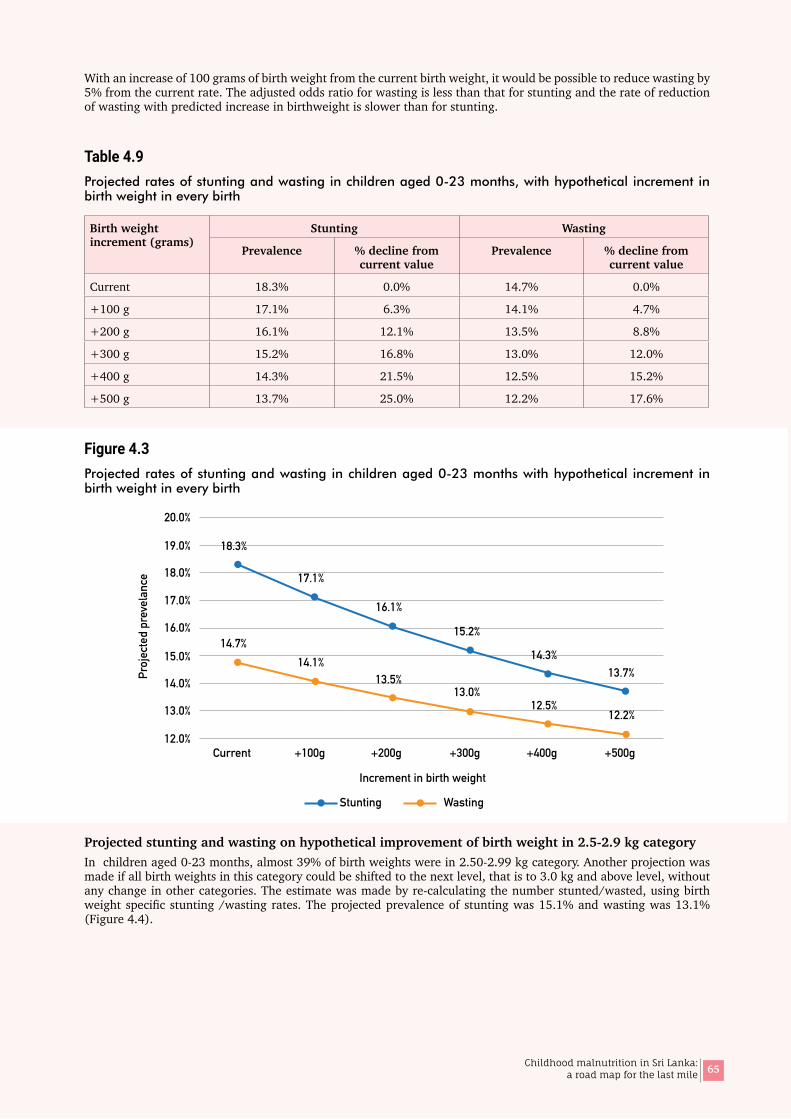
65Childhood malnutrition in Sri Lanka: a road map for the last mile
With an increase of 100 grams of birth weight from the current birth weight, it would be possible to reduce wasting by 5% from the current rate. The adjusted odds ratio for wasting is less than that for stunting and the rate of reduction of wasting with predicted increase in birthweight is slower than for stunting.
Table 4.9Projected rates of stunting and wasting in children aged 0-23 months, with hypothetical increment in birth weight in every birth
Birth weight increment (grams)
Stunting Wasting
Prevalence % decline from current value
Prevalence % decline from current value
Current 18.3% 0.0% 14.7% 0.0%
+100 g 17.1% 6.3% 14.1% 4.7%
+200 g 16.1% 12.1% 13.5% 8.8%
+300 g 15.2% 16.8% 13.0% 12.0%
+400 g 14.3% 21.5% 12.5% 15.2%
+500 g 13.7% 25.0% 12.2% 17.6%
Figure 4.3Projected rates of stunting and wasting in children aged 0-23 months with hypothetical increment in birth weight in every birth
Projected stunting and wasting on hypothetical improvement of birth weight in 2.5-2.9 kg categoryIn children aged 0-23 months, almost 39% of birth weights were in 2.50-2.99 kg category. Another projection was made if all birth weights in this category could be shifted to the next level, that is to 3.0 kg and above level, without any change in other categories. The estimate was made by re-calculating the number stunted/wasted, using birth weight specific stunting /wasting rates. The projected prevalence of stunting was 15.1% and wasting was 13.1% (Figure 4.4).
Current +100g +200g +300g +400g +500g
Increment in birth weight
12.0%
13.0%
14.0%
15.0%
16.0%
17.0%
18.0%
19.0%
20.0%
18.3%
17.1%
16.1%
15.2%
14.3%13.7%
12.2%12.5%
13.0%13.5%
14.1%14.7%
Proj
ecte
d pr
evel
ance
Stunting Wasting
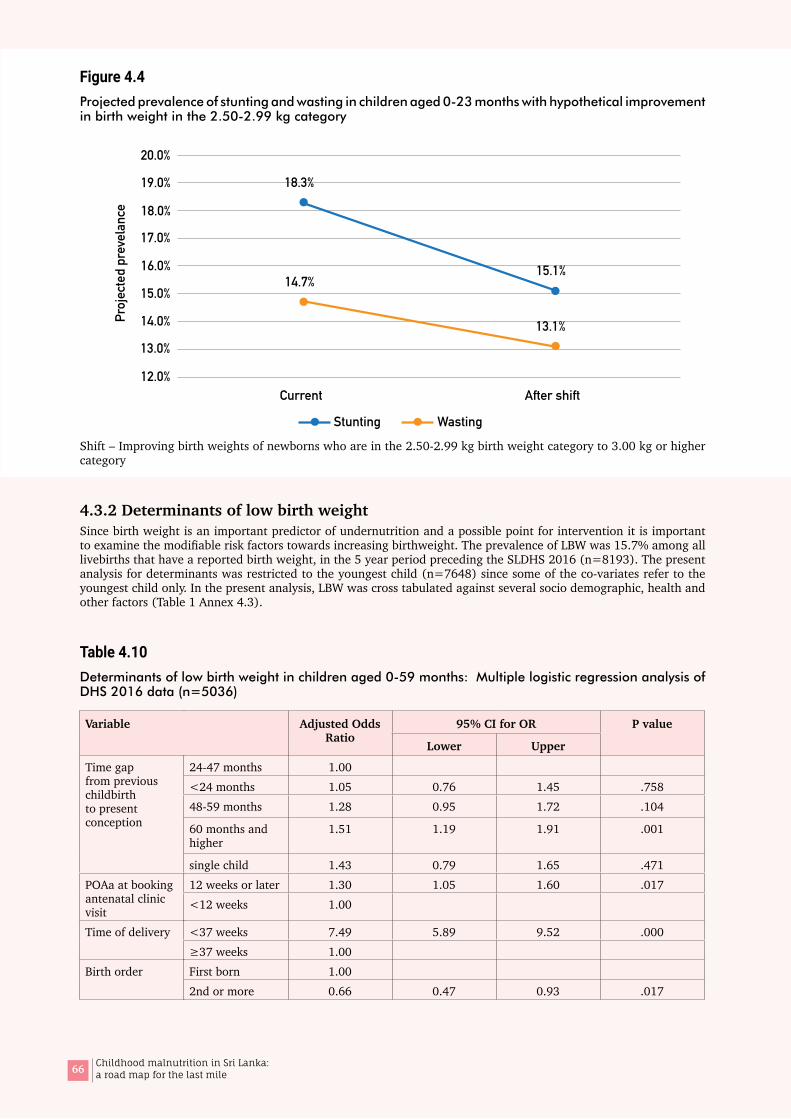
66 Childhood malnutrition in Sri Lanka: a road map for the last mile
Figure 4.4Projected prevalence of stunting and wasting in children aged 0-23 months with hypothetical improvement in birth weight in the 2.50-2.99 kg category
Shift – Improving birth weights of newborns who are in the 2.50-2.99 kg birth weight category to 3.00 kg or higher category
4.3.2 Determinants of low birth weightSince birth weight is an important predictor of undernutrition and a possible point for intervention it is important to examine the modifiable risk factors towards increasing birthweight. The prevalence of LBW was 15.7% among all livebirths that have a reported birth weight, in the 5 year period preceding the SLDHS 2016 (n=8193). The present analysis for determinants was restricted to the youngest child (n=7648) since some of the co-variates refer to the youngest child only. In the present analysis, LBW was cross tabulated against several socio demographic, health and other factors (Table 1 Annex 4.3).
Table 4.10Determinants of low birth weight in children aged 0-59 months: Multiple logistic regression analysis of DHS 2016 data (n=5036)
Variable Adjusted Odds Ratio
95% CI for OR P value
Lower Upper
Time gap from previous childbirth to present conception
24-47 months 1.00<24 months 1.05 0.76 1.45 .75848-59 months 1.28 0.95 1.72 .104
60 months and higher
1.51 1.19 1.91 .001
single child 1.43 0.79 1.65 .471POAa at booking antenatal clinic visit
12 weeks or later 1.30 1.05 1.60 .017<12 weeks 1.00
Time of delivery <37 weeks 7.49 5.89 9.52 .000≥37 weeks 1.00
Birth order First born 1.002nd or more 0.66 0.47 0.93 .017
Current After shift12.0%
13.0%
14.0%
15.0%
16.0%
17.0%
18.0%
19.0%
20.0%
14.7%
18.3%
15.1%
13.1%Proj
ecte
d pr
evel
ance
Stunting Wasting
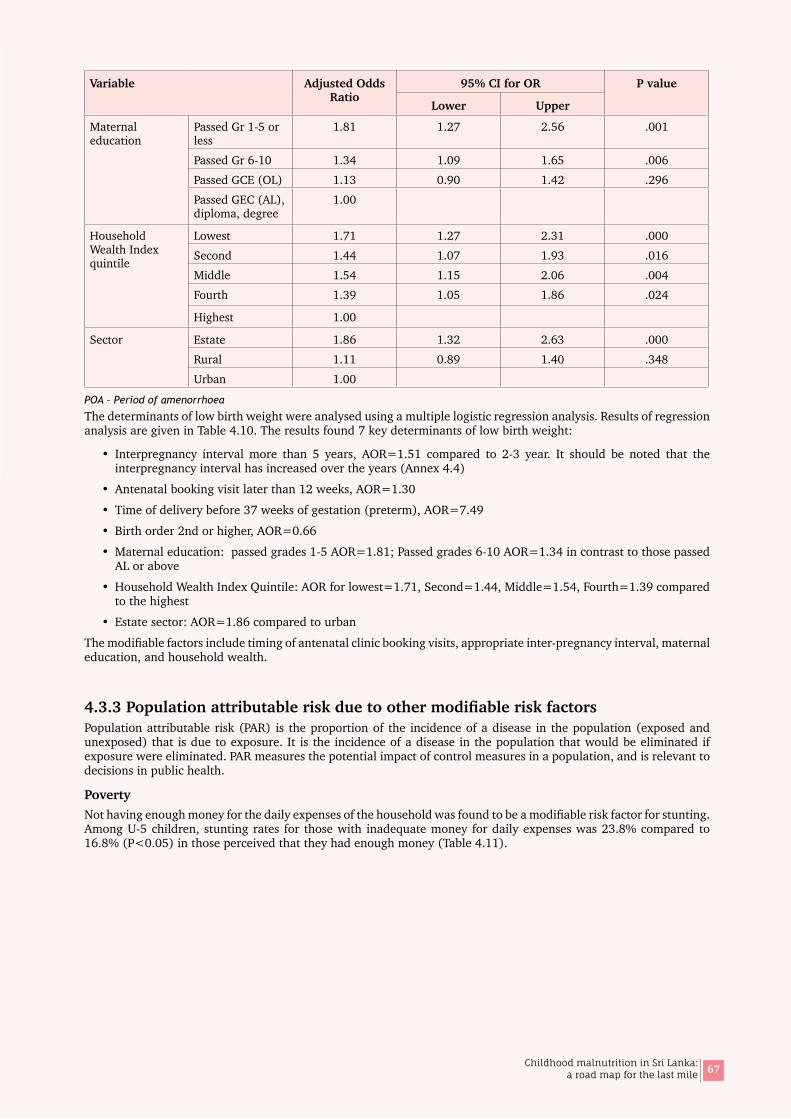
67Childhood malnutrition in Sri Lanka: a road map for the last mile
Variable Adjusted Odds Ratio
95% CI for OR P value
Lower Upper
Maternal education
Passed Gr 1-5 or less
1.81 1.27 2.56 .001
Passed Gr 6-10 1.34 1.09 1.65 .006Passed GCE (OL) 1.13 0.90 1.42 .296Passed GEC (AL), diploma, degree
1.00
Household Wealth Index quintile
Lowest 1.71 1.27 2.31 .000Second 1.44 1.07 1.93 .016Middle 1.54 1.15 2.06 .004Fourth 1.39 1.05 1.86 .024
Highest 1.00
Sector Estate 1.86 1.32 2.63 .000Rural 1.11 0.89 1.40 .348Urban 1.00
POA – Period of amenorrhoea
The determinants of low birth weight were analysed using a multiple logistic regression analysis. Results of regression analysis are given in Table 4.10. The results found 7 key determinants of low birth weight:
• Interpregnancy interval more than 5 years, AOR=1.51 compared to 2-3 year. It should be noted that the interpregnancy interval has increased over the years (Annex 4.4)
• Antenatal booking visit later than 12 weeks, AOR=1.30
• Time of delivery before 37 weeks of gestation (preterm), AOR=7.49
• Birth order 2nd or higher, AOR=0.66
• Maternal education: passed grades 1-5 AOR=1.81; Passed grades 6-10 AOR=1.34 in contrast to those passed AL or above
• Household Wealth Index Quintile: AOR for lowest=1.71, Second=1.44, Middle=1.54, Fourth=1.39 compared to the highest
• Estate sector: AOR=1.86 compared to urban
The modifiable factors include timing of antenatal clinic booking visits, appropriate inter-pregnancy interval, maternal education, and household wealth.
4.3.3PopulationattributableriskduetoothermodifiableriskfactorsPopulation attributable risk (PAR) is the proportion of the incidence of a disease in the population (exposed and unexposed) that is due to exposure. It is the incidence of a disease in the population that would be eliminated if exposure were eliminated. PAR measures the potential impact of control measures in a population, and is relevant to decisions in public health.
PovertyNot having enough money for the daily expenses of the household was found to be a modifiable risk factor for stunting. Among U-5 children, stunting rates for those with inadequate money for daily expenses was 23.8% compared to 16.8% (P<0.05) in those perceived that they had enough money (Table 4.11).
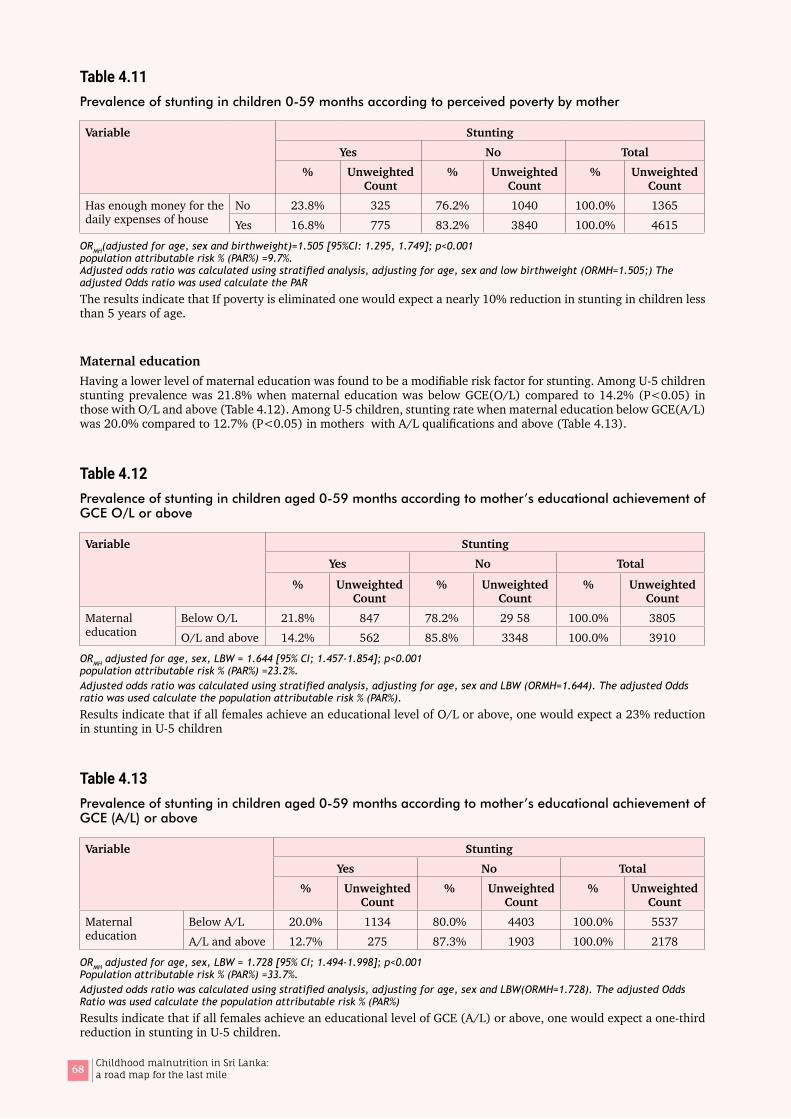
68 Childhood malnutrition in Sri Lanka: a road map for the last mile
Table 4.11Prevalence of stunting in children 0-59 months according to perceived poverty by mother
Variable StuntingYes No Total
% Unweighted Count
% Unweighted Count
% Unweighted Count
Has enough money for the daily expenses of house
No 23.8% 325 76.2% 1040 100.0% 1365Yes 16.8% 775 83.2% 3840 100.0% 4615
ORMH(adjusted for age, sex and birthweight)=1.505 [95%CI: 1.295, 1.749]; p<0.001 population attributable risk % (PAR%) =9.7%. Adjusted odds ratio was calculated using stratified analysis, adjusting for age, sex and low birthweight (ORMH=1.505;) The adjusted Odds ratio was used calculate the PAR
The results indicate that If poverty is eliminated one would expect a nearly 10% reduction in stunting in children less than 5 years of age.
Maternal educationHaving a lower level of maternal education was found to be a modifiable risk factor for stunting. Among U-5 children stunting prevalence was 21.8% when maternal education was below GCE(O/L) compared to 14.2% (P<0.05) in those with O/L and above (Table 4.12). Among U-5 children, stunting rate when maternal education below GCE(A/L) was 20.0% compared to 12.7% (P<0.05) in mothers with A/L qualifications and above (Table 4.13).
Table 4.12Prevalence of stunting in children aged 0-59 months according to mother’s educational achievement of GCE O/L or above
Variable StuntingYes No Total
% Unweighted Count
% Unweighted Count
% Unweighted Count
Maternal education
Below O/L 21.8% 847 78.2% 29 58 100.0% 3805O/L and above 14.2% 562 85.8% 3348 100.0% 3910
ORMH adjusted for age, sex, LBW = 1.644 [95% CI; 1.457-1.854]; p<0.001 population attributable risk % (PAR%) =23.2%. Adjusted odds ratio was calculated using stratified analysis, adjusting for age, sex and LBW (ORMH=1.644). The adjusted Odds ratio was used calculate the population attributable risk % (PAR%).
Results indicate that if all females achieve an educational level of O/L or above, one would expect a 23% reduction in stunting in U-5 children
Table 4.13Prevalence of stunting in children aged 0-59 months according to mother’s educational achievement of GCE (A/L) or above
Variable StuntingYes No Total
% Unweighted Count
% Unweighted Count
% Unweighted Count
Maternal education
Below A/L 20.0% 1134 80.0% 4403 100.0% 5537A/L and above 12.7% 275 87.3% 1903 100.0% 2178
ORMH adjusted for age, sex, LBW = 1.728 [95% CI; 1.494-1.998]; p<0.001 Population attributable risk % (PAR%) =33.7%. Adjusted odds ratio was calculated using stratified analysis, adjusting for age, sex and LBW(ORMH=1.728). The adjusted Odds Ratio was used calculate the population attributable risk % (PAR%)
Results indicate that if all females achieve an educational level of GCE (A/L) or above, one would expect a one-third reduction in stunting in U-5 children.
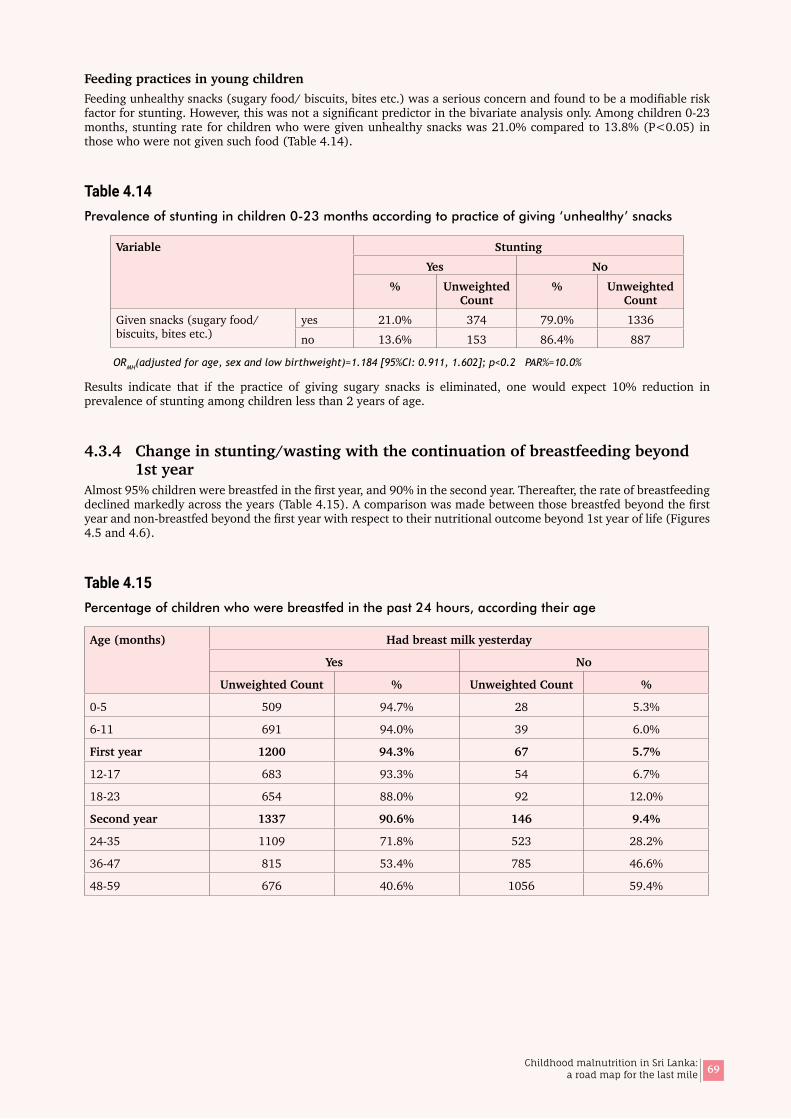
69Childhood malnutrition in Sri Lanka: a road map for the last mile
Feeding practices in young childrenFeeding unhealthy snacks (sugary food/ biscuits, bites etc.) was a serious concern and found to be a modifiable risk factor for stunting. However, this was not a significant predictor in the bivariate analysis only. Among children 0-23 months, stunting rate for children who were given unhealthy snacks was 21.0% compared to 13.8% (P<0.05) in those who were not given such food (Table 4.14).
Table 4.14Prevalence of stunting in children 0-23 months according to practice of giving ‘unhealthy’ snacks
Variable StuntingYes No
% Unweighted Count
% Unweighted Count
Given snacks (sugary food/ biscuits, bites etc.)
yes 21.0% 374 79.0% 1336no 13.6% 153 86.4% 887
ORMH(adjusted for age, sex and low birthweight)=1.184 [95%CI: 0.911, 1.602]; p<0.2 PAR%=10.0%
Results indicate that if the practice of giving sugary snacks is eliminated, one would expect 10% reduction in prevalence of stunting among children less than 2 years of age.
4.3.4 Change in stunting/wasting with the continuation of breastfeeding beyond 1st year
Almost 95% children were breastfed in the first year, and 90% in the second year. Thereafter, the rate of breastfeeding declined markedly across the years (Table 4.15). A comparison was made between those breastfed beyond the first year and non-breastfed beyond the first year with respect to their nutritional outcome beyond 1st year of life (Figures 4.5 and 4.6).
Table 4.15Percentage of children who were breastfed in the past 24 hours, according their age
Age (months) Had breast milk yesterday
Yes No
Unweighted Count % Unweighted Count %
0-5 509 94.7% 28 5.3%
6-11 691 94.0% 39 6.0%
First year 1200 94.3% 67 5.7%
12-17 683 93.3% 54 6.7%
18-23 654 88.0% 92 12.0%
Second year 1337 90.6% 146 9.4%
24-35 1109 71.8% 523 28.2%
36-47 815 53.4% 785 46.6%
48-59 676 40.6% 1056 59.4%
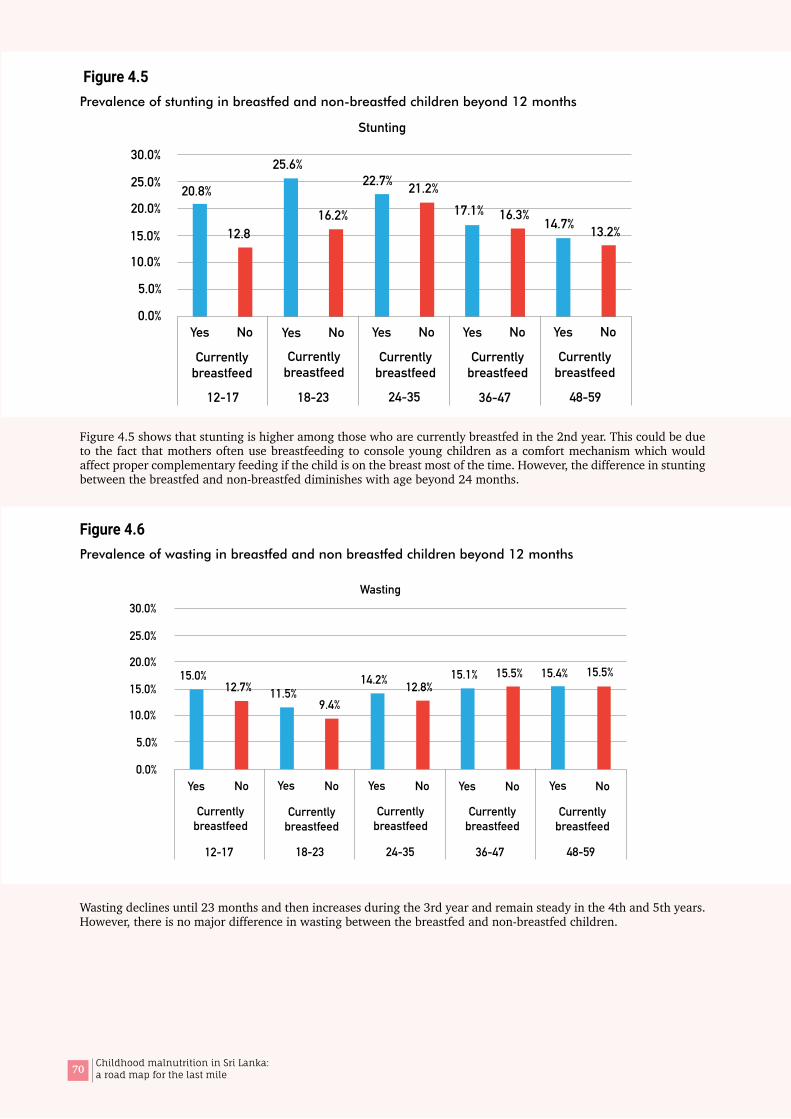
70 Childhood malnutrition in Sri Lanka: a road map for the last mile
Figure 4.5Prevalence of stunting in breastfed and non-breastfed children beyond 12 months
Figure 4.5 shows that stunting is higher among those who are currently breastfed in the 2nd year. This could be due to the fact that mothers often use breastfeeding to console young children as a comfort mechanism which would affect proper complementary feeding if the child is on the breast most of the time. However, the difference in stunting between the breastfed and non-breastfed diminishes with age beyond 24 months.
Figure 4.6Prevalence of wasting in breastfed and non breastfed children beyond 12 months
Wasting declines until 23 months and then increases during the 3rd year and remain steady in the 4th and 5th years. However, there is no major difference in wasting between the breastfed and non-breastfed children.
30.0%
25.0%
20.0%
15.0%
10.0%
5.0%
0.0%
20.8%
12.8
25.6%
16.2%
22.7% 21.2%17.1% 16.3% 14.7% 13.2%
Yes No
Currentlybreastfeed
Currentlybreastfeed
Yes No Yes No
Currentlybreastfeed
Currentlybreastfeed
Currentlybreastfeed
Yes No Yes No
12-17 18-23 24-35 36-47 48-59
Stunting
Yes No
Currentlybreastfeed
Currentlybreastfeed
Yes No Yes No
Currentlybreastfeed
Currentlybreastfeed
Currentlybreastfeed
Yes No Yes No
12-17 18-23 24-35 36-47 48-59
0.0%
5.0%
10.0%
15.0%
20.0%
25.0%
30.0%
15.0%12.7% 11.5%
9.4%
14.2% 12.8%15.1% 15.5% 15.4% 15.5%
Wasting

71Childhood malnutrition in Sri Lanka: a road map for the last mile
05District level correlates of undernutrition

72 Childhood malnutrition in Sri Lanka: a road map for the last mile

73Childhood malnutrition in Sri Lanka: a road map for the last mile
5.1 Part A: Comparison of undernutrition between 2006 and 2016
Figure 5.1Comparison of the prevalence of stunting between 2006 and 2016, according to age of child
Overall prevalence of stunting and wasting in children less than 5 years of age has not changed between 2006 and 2016. However, disaggregation of the rates by age showed an increase in stunting rates in the first 8 months (Figure 5.1).
Figure 5.2Comparison of the prevalence of wasting between 2006 and 2016, according to age of child
05District level correlates of undernutrition
0.0
5.0
10.0
15.0
20.0
25.0
30.0
<6 6-8 9-11 12-17 18-23 24-35 36-47 48-59 0-59
DHS 2006 DHS 2016
Stunting
Age (months)
Perc
ent
DHS 2006 DHS 2016
0.0
5.0
10.0
15.0
20.0
25.0
30.0
<6 6-8 9-11 12-17 18-23 24-35 36-47 48-59 0-59Age (months)
Wasting
Perc
ent

74 Childhood malnutrition in Sri Lanka: a road map for the last mile
Disaggregation of wasting by age between the two time periods showed a pattern, where the rates were somewhat higher in 2016 than 2006 from birth until 18 months of age, and lower from 18 months onwards (Figure 5.2). The change in the first 6 months is high (almost 5%) and the gap declines from the first 6 months to 18 months.
Early commencement of feeding and exclusive breastfeeding rates according to the DHS data have improved from 2006 to 2016. Mean birthweight between the two periods of time has remained the same (Table 5.1) but sex disaggregated data shows that the percentage low birthweight in females has increased marginally though not statistically significant.
Table 5.1Mean birth weight and prevalence of low birth weight, in 2006 and 2016
Variable 2006 2016
Mean birthweight (g) and (SE) 2926.1 (7.151) 2913.5 (7.662)
Low birthweight % and (SE) 16.08 (0.533) 16.18 (0.468)
Male 14.62 (0.726) 14.05 (0.601)
Female 17.61 (0.779) 18.47 (0.686)
SE – Standard error
Stratification of proportion of low birthweight by age group shows that those in the first year of life show a marginal increase in LBW compared to those born during the two years previous to that (current age 12-23 months and 24-35 months) though not statistically significant. Between the two surveys, the proportion low birthweight has remained more or less the same in the urban and rural sectors, but the estate sector shows a decline of 5.4 percentage points.
Figure 5.3Comparison of the prevalence of stunting in children aged 0-59 months between 2006 and 2016 by district
2006 2016
05
10152025 30354045
Kega
lle
Galle
Ham
bant
ota
mat
ara
Ratn
apur
a
Mat
ale
Nuw
ara
Eliya
Ampa
ra
Mul
lativ
u
Kalu
tara
Batti
calo
a
Man
nar
Gam
paha
Badu
lla
Kuru
nega
la
Anur
adha
pura
Kand
y
Colo
mbo
Vavu
niya
Jaffn
a
Putta
lam
Polo
nnar
uwa
Trin
com
alee
Mon
arag
ala
Kilin
ochc
hi
Prev
alen
ce (%
)
Stunting
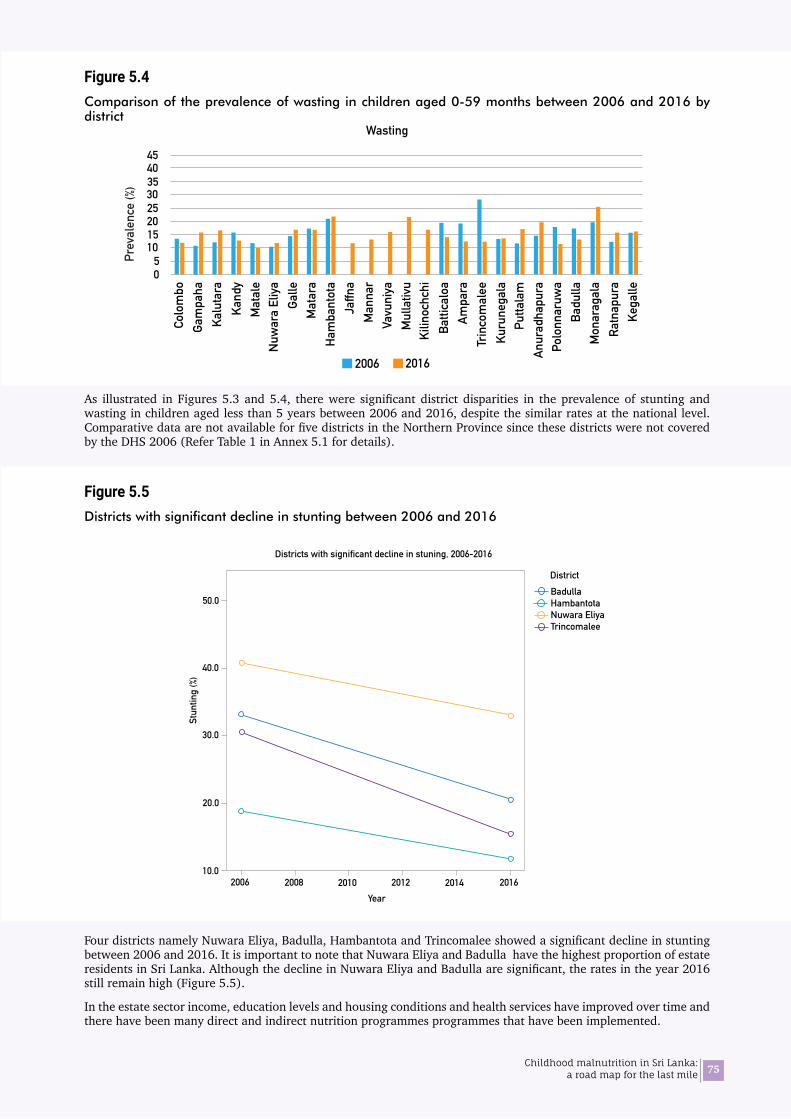
75Childhood malnutrition in Sri Lanka: a road map for the last mile
Figure 5.4Comparison of the prevalence of wasting in children aged 0-59 months between 2006 and 2016 by district
As illustrated in Figures 5.3 and 5.4, there were significant district disparities in the prevalence of stunting and wasting in children aged less than 5 years between 2006 and 2016, despite the similar rates at the national level. Comparative data are not available for five districts in the Northern Province since these districts were not covered by the DHS 2006 (Refer Table 1 in Annex 5.1 for details).
Figure 5.5Districts with significant decline in stunting between 2006 and 2016
Four districts namely Nuwara Eliya, Badulla, Hambantota and Trincomalee showed a significant decline in stunting between 2006 and 2016. It is important to note that Nuwara Eliya and Badulla have the highest proportion of estate residents in Sri Lanka. Although the decline in Nuwara Eliya and Badulla are significant, the rates in the year 2016 still remain high (Figure 5.5).
In the estate sector income, education levels and housing conditions and health services have improved over time and there have been many direct and indirect nutrition programmes programmes that have been implemented.
2006 2016
Kega
lle
Galle
Ham
bant
ota
Mat
ara
Ratn
apur
a
Mat
ale
Nuw
ara
Eliya
Ampa
ra
Mul
lativ
u
Kalu
tara
Batti
calo
a
Man
nar
Gam
paha
Badu
lla
Kuru
nega
la
Anur
adha
pura
Kand
y
Colo
mbo
Vavu
niya
Jaffn
a
Putta
lam
Polo
nnar
uwa
Trin
com
alee
Mon
arag
ala
Kilin
ochc
hi
05
10152025 30354045
Prev
alen
ce (%
)Wasting
10.0
20.0
30.0
40.0
2006 2008 2010 2012 2014 2016Year
Stun
ting
(%)
Districts with significant decline in stuning, 2006-2016
DistrictBadullaHambantotaNuwara EliyaTrincomalee
50.0
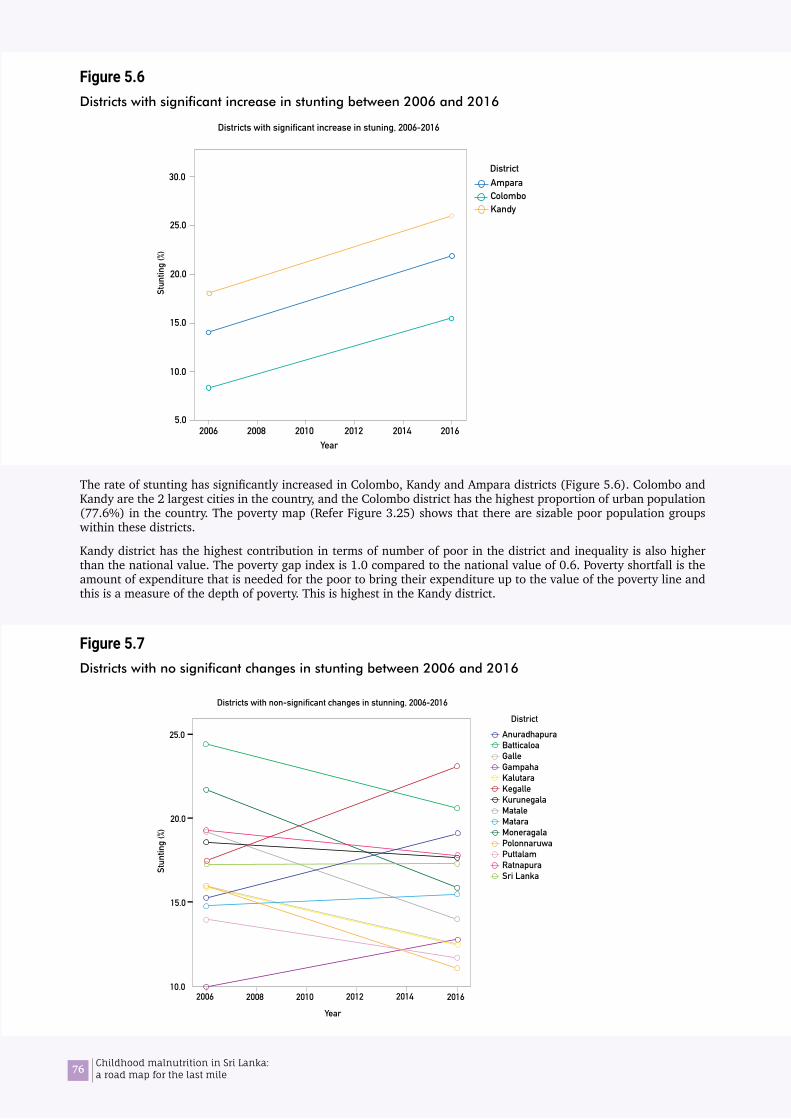
76 Childhood malnutrition in Sri Lanka: a road map for the last mile
Figure 5.6Districts with significant increase in stunting between 2006 and 2016
The rate of stunting has significantly increased in Colombo, Kandy and Ampara districts (Figure 5.6). Colombo and Kandy are the 2 largest cities in the country, and the Colombo district has the highest proportion of urban population (77.6%) in the country. The poverty map (Refer Figure 3.25) shows that there are sizable poor population groups within these districts.
Kandy district has the highest contribution in terms of number of poor in the district and inequality is also higher than the national value. The poverty gap index is 1.0 compared to the national value of 0.6. Poverty shortfall is the amount of expenditure that is needed for the poor to bring their expenditure up to the value of the poverty line and this is a measure of the depth of poverty. This is highest in the Kandy district.
Figure 5.7Districts with no significant changes in stunting between 2006 and 2016
5.0
10.0
15.0
20.0
2006 2008 2010 2012 2014 2016Year
Stun
ting
(%)
Districts with significant increase in stuning, 2006-2016
25.0
30.0District AmparaColomboKandy
2006 2008 2010 2012 2014 2016
Year
10.0
15.0
20.0
25.0
Stun
ting
(%)
Districts with non-significant changes in stunning, 2006-2016
Anuradhapura BatticaloaGalleGampahaKalutaraKegalleKurunegalaMataleMataraMoneragalaPolonnaruwaPuttalamRatnapuraSri Lanka
District
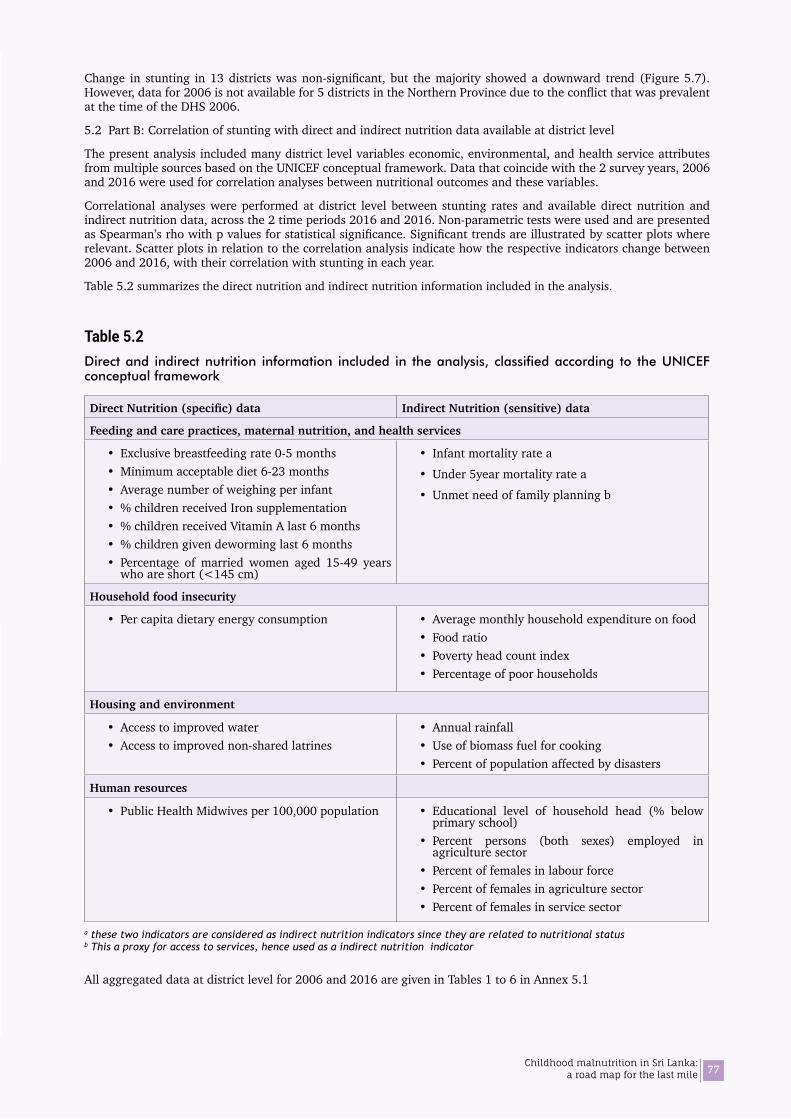
77Childhood malnutrition in Sri Lanka: a road map for the last mile
Change in stunting in 13 districts was non-significant, but the majority showed a downward trend (Figure 5.7). However, data for 2006 is not available for 5 districts in the Northern Province due to the conflict that was prevalent at the time of the DHS 2006.
5.2 Part B: Correlation of stunting with direct and indirect nutrition data available at district level
The present analysis included many district level variables economic, environmental, and health service attributes from multiple sources based on the UNICEF conceptual framework. Data that coincide with the 2 survey years, 2006 and 2016 were used for correlation analyses between nutritional outcomes and these variables.
Correlational analyses were performed at district level between stunting rates and available direct nutrition and indirect nutrition data, across the 2 time periods 2016 and 2016. Non-parametric tests were used and are presented as Spearman’s rho with p values for statistical significance. Significant trends are illustrated by scatter plots where relevant. Scatter plots in relation to the correlation analysis indicate how the respective indicators change between 2006 and 2016, with their correlation with stunting in each year.
Table 5.2 summarizes the direct nutrition and indirect nutrition information included in the analysis.
Table 5.2Direct and indirect nutrition information included in the analysis, classified according to the UNICEF conceptual framework
DirectNutrition(specific)data Indirect Nutrition (sensitive) data
Feeding and care practices, maternal nutrition, and health services
• Exclusive breastfeeding rate 0-5 months• Minimum acceptable diet 6-23 months• Average number of weighing per infant• % children received Iron supplementation • % children received Vitamin A last 6 months• % children given deworming last 6 months • Percentage of married women aged 15-49 years
who are short (<145 cm)
• Infant mortality rate a
• Under 5year mortality rate a
• Unmet need of family planning b
Household food insecurity
• Per capita dietary energy consumption • Average monthly household expenditure on food• Food ratio• Poverty head count index• Percentage of poor households
Housing and environment
• Access to improved water• Access to improved non-shared latrines
• Annual rainfall • Use of biomass fuel for cooking• Percent of population affected by disasters
Human resources
• Public Health Midwives per 100,000 population • Educational level of household head (% below primary school)
• Percent persons (both sexes) employed in agriculture sector
• Percent of females in labour force• Percent of females in agriculture sector• Percent of females in service sector
a these two indicators are considered as indirect nutrition indicators since they are related to nutritional status b This a proxy for access to services, hence used as a indirect nutrition indicator
All aggregated data at district level for 2006 and 2016 are given in Tables 1 to 6 in Annex 5.1
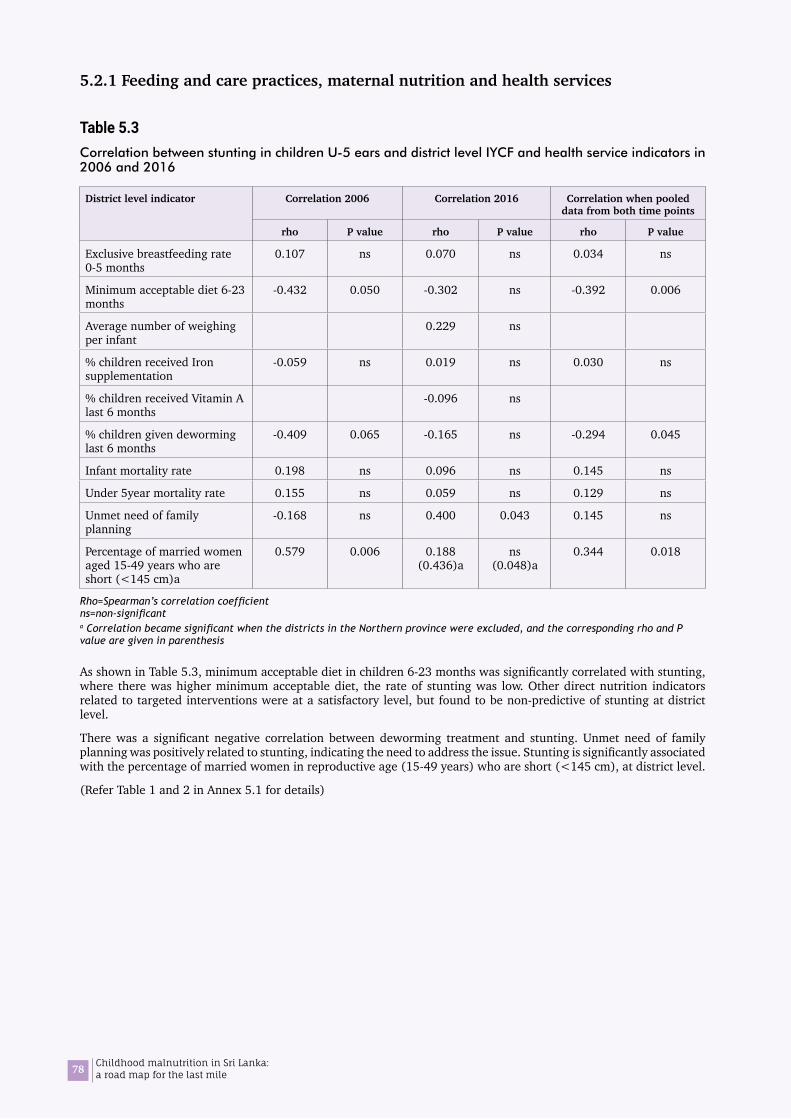
78 Childhood malnutrition in Sri Lanka: a road map for the last mile
5.2.1 Feeding and care practices, maternal nutrition and health services
Table 5.3Correlation between stunting in children U-5 ears and district level IYCF and health service indicators in 2006 and 2016
District level indicator Correlation 2006 Correlation 2016 Correlation when pooled data from both time points
rho P value rho P value rho P value
Exclusive breastfeeding rate 0-5 months
0.107 ns 0.070 ns 0.034 ns
Minimum acceptable diet 6-23 months
-0.432 0.050 -0.302 ns -0.392 0.006
Average number of weighing per infant
0.229 ns
% children received Iron supplementation
-0.059 ns 0.019 ns 0.030 ns
% children received Vitamin A last 6 months
-0.096 ns
% children given deworming last 6 months
-0.409 0.065 -0.165 ns -0.294 0.045
Infant mortality rate 0.198 ns 0.096 ns 0.145 ns
Under 5year mortality rate 0.155 ns 0.059 ns 0.129 ns
Unmet need of family planning
-0.168 ns 0.400 0.043 0.145 ns
Percentage of married women aged 15-49 years who are short (<145 cm)a
0.579 0.006 0.188 (0.436)a
ns (0.048)a
0.344 0.018
Rho=Spearman’s correlation coefficient ns=non-significanta Correlation became significant when the districts in the Northern province were excluded, and the corresponding rho and P value are given in parenthesis
As shown in Table 5.3, minimum acceptable diet in children 6-23 months was significantly correlated with stunting, where there was higher minimum acceptable diet, the rate of stunting was low. Other direct nutrition indicators related to targeted interventions were at a satisfactory level, but found to be non-predictive of stunting at district level.
There was a significant negative correlation between deworming treatment and stunting. Unmet need of family planning was positively related to stunting, indicating the need to address the issue. Stunting is significantly associated with the percentage of married women in reproductive age (15-49 years) who are short (<145 cm), at district level.
(Refer Table 1 and 2 in Annex 5.1 for details)

79Childhood malnutrition in Sri Lanka: a road map for the last mile
Figure 5.8Scatter plot illustrating district level correlation between stunting and minimum acceptable diet in children aged 6-23 months, between 2006 and 2016
The percentage of children receiving the minimum acceptable diet has increased in most districts, between the 2 survey periods, however the corresponding change in stunting was not marked (Figure 5.8). Minimum acceptable diet rates in districts in the Northern and Eastern provinces were low. This is probably due to the way in which the variable is measured. Information on portion sizes is not included in the measure.
10.0
20.0
30.0
40.0
Trincomalee
Badulla
Nuwara-Eliya
BatticaloaMonaragala
Kurunegala
Kalutara
Colombo
GampahaMatara
Kegalle
GalleSri Lanka
Kandy MataleRatnapura
Hambantota
Polonnaruwa
Ampara PuttalamAnuradhapura
Vavuniya BatticaloaMullativu
10.0
20.0
30.0
40.0
JaffnaMannar
Kilinochchi Ampara
Kandy
Badulla
KurunegalaSri Lanka
Trincomalee Moneragala
Polonnaruwa Puttalam Kalutara
Hambantota
GalleMatale
MataraColombo
Ratnapura
Kegalle
Nuwra-Eliya
20.0 40.0 60.0 80.0
20062016
Year
Minimum acceptable diet in 6-23 months aged
Stun
ting
(%)
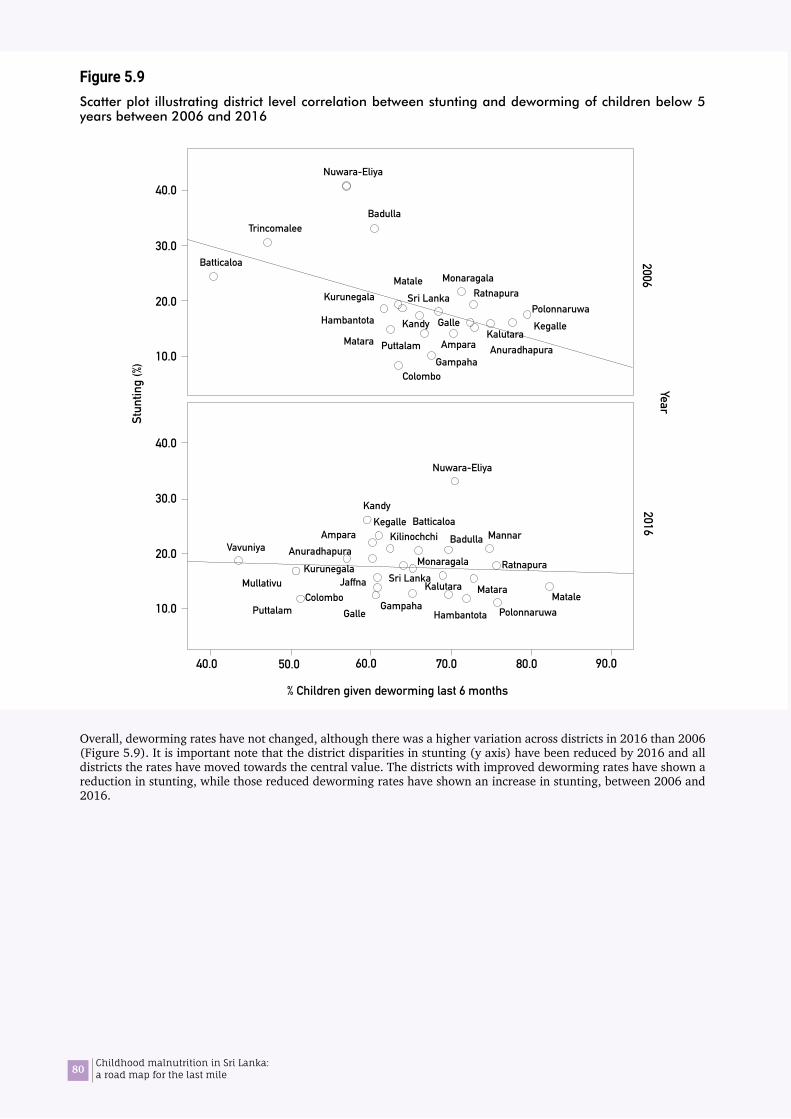
80 Childhood malnutrition in Sri Lanka: a road map for the last mile
Figure 5.9Scatter plot illustrating district level correlation between stunting and deworming of children below 5 years between 2006 and 2016
Overall, deworming rates have not changed, although there was a higher variation across districts in 2016 than 2006 (Figure 5.9). It is important note that the district disparities in stunting (y axis) have been reduced by 2016 and all districts the rates have moved towards the central value. The districts with improved deworming rates have shown a reduction in stunting, while those reduced deworming rates have shown an increase in stunting, between 2006 and 2016.
TrincomaleeBadulla
Badulla
Nuwara-Eliya
Nuwara-Eliya
Batticaloa
Batticaloa
Monaragala
Monaragala
Kurunegala
Kurunegala
Kalutara
Kalutara
Colombo
Colombo
Gampaha
Gampaha
Matara
Matara
Kegalle
Kegalle
Galle
Galle
Sri Lanka
Sri Lanka
Kandy
Kandy
Matale
Matale
Ratnapura
Ratnapura
Hambantota
Hambantota
Polonnaruwa
Polonnaruwa
Ampara
Ampara
Puttalam Anuradhapura
Anuradhapura
10.0
20.0
30.0
40.0
2006
10.0
20.0
30.0
40.0
Vavuniya
Mullativu Jaffna
Kilinochchi Mannar
Puttalam
40.0 60.0 80.050.0 70.0 90.0
% Children given deworming last 6 months
2016Year
Stun
ting
(%)
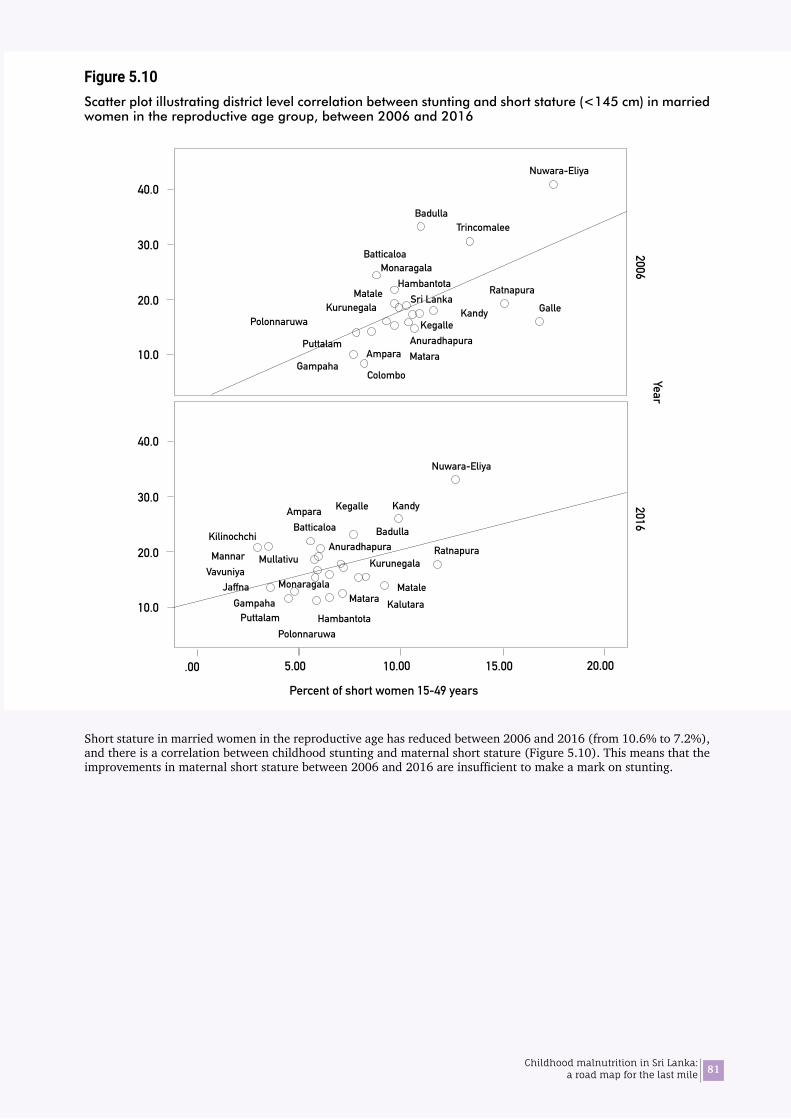
81Childhood malnutrition in Sri Lanka: a road map for the last mile
Figure 5.10Scatter plot illustrating district level correlation between stunting and short stature (<145 cm) in married women in the reproductive age group, between 2006 and 2016
Short stature in married women in the reproductive age has reduced between 2006 and 2016 (from 10.6% to 7.2%), and there is a correlation between childhood stunting and maternal short stature (Figure 5.10). This means that the improvements in maternal short stature between 2006 and 2016 are insufficient to make a mark on stunting.
10.0
20.0
30.0
40.0
TrincomaleeBadulla
Badulla
Nuwara-Eliya
Nuwara-Eliya
Batticaloa
Batticaloa
Monaragala
Monaragala
Kurunegala
Kurunegala
ColomboGampaha
Gampaha
Matara
Matara
Kegalle
Kegalle
Sri LankaKandy
Kandy
Matale Ratnapura
Ratnapura
Hambantota
Hambantota
Polonnaruwa
Polonnaruwa
Ampara
Ampara
Puttalam Anuradhapura
Anuradhapura
10.0
20.0
30.0
40.0
VavuniyaMullativu
Kilinochchi
Puttalam
Galle
MataleKalutara
Jaffna
Mannar
.00 10.00 20.005.00 15.00
Percent of short women 15-49 years
20062016
Year
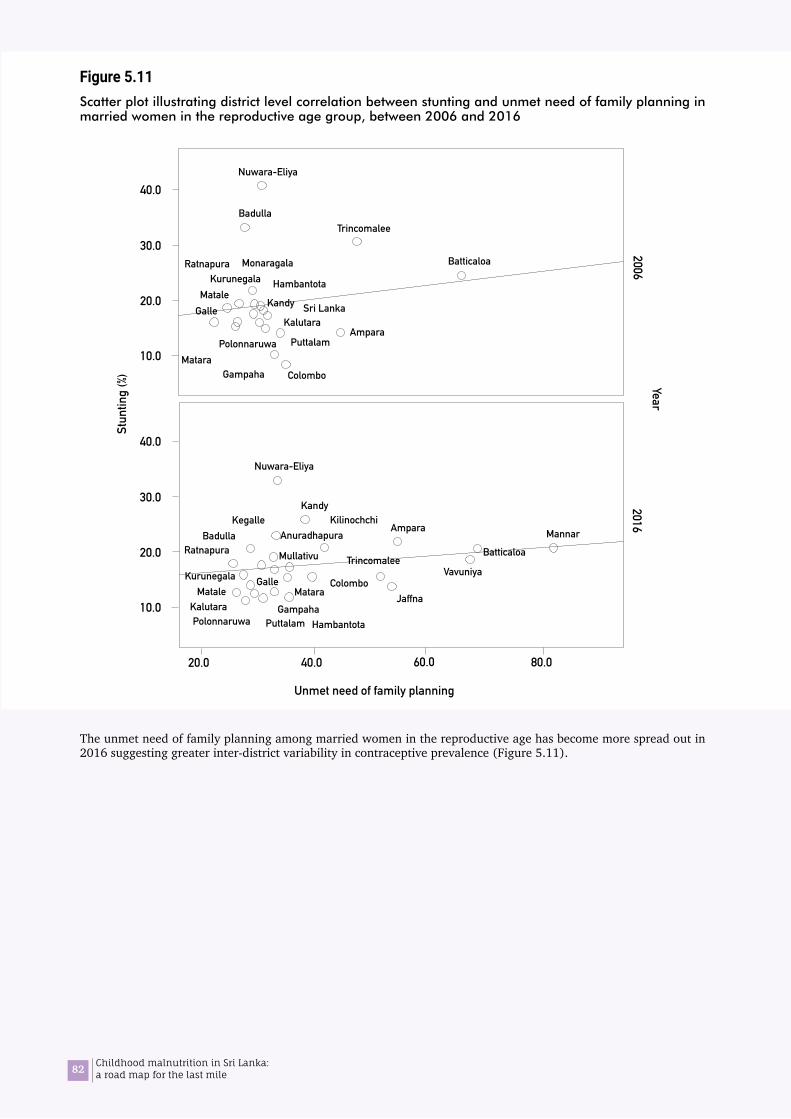
82 Childhood malnutrition in Sri Lanka: a road map for the last mile
Figure 5.11Scatter plot illustrating district level correlation between stunting and unmet need of family planning in married women in the reproductive age group, between 2006 and 2016
The unmet need of family planning among married women in the reproductive age has become more spread out in 2016 suggesting greater inter-district variability in contraceptive prevalence (Figure 5.11).
TrincomaleeBadulla
Badulla
Batticaloa
Batticaloa
Monaragala
Colombo
Colombo
Gampaha
Gampaha
Matara
Matara
Sri LankaKandy
Kandy
Ratnapura
Hambantota
Hambantota
Polonnaruwa
Polonnaruwa
Ampara
Ampara
Puttalam
Puttalam
Galle
Galle
Kurunegala
Kurunegala
Matale
Matale
Kalutara
Kalutara
10.0
20.0
30.0
40.0Nuwara-Eliya
Nuwara-Eliya
Vavuniya
Kilinochchi
Jaffna
Mannar
Trincomalee
KegalleAnuradhapura
Ratnapura Mullativu
10.0
20.0
30.0
40.0
20.0 60.040.0 80.0
Unmet need of family planning
20062016
YearSt
untin
g (%
)
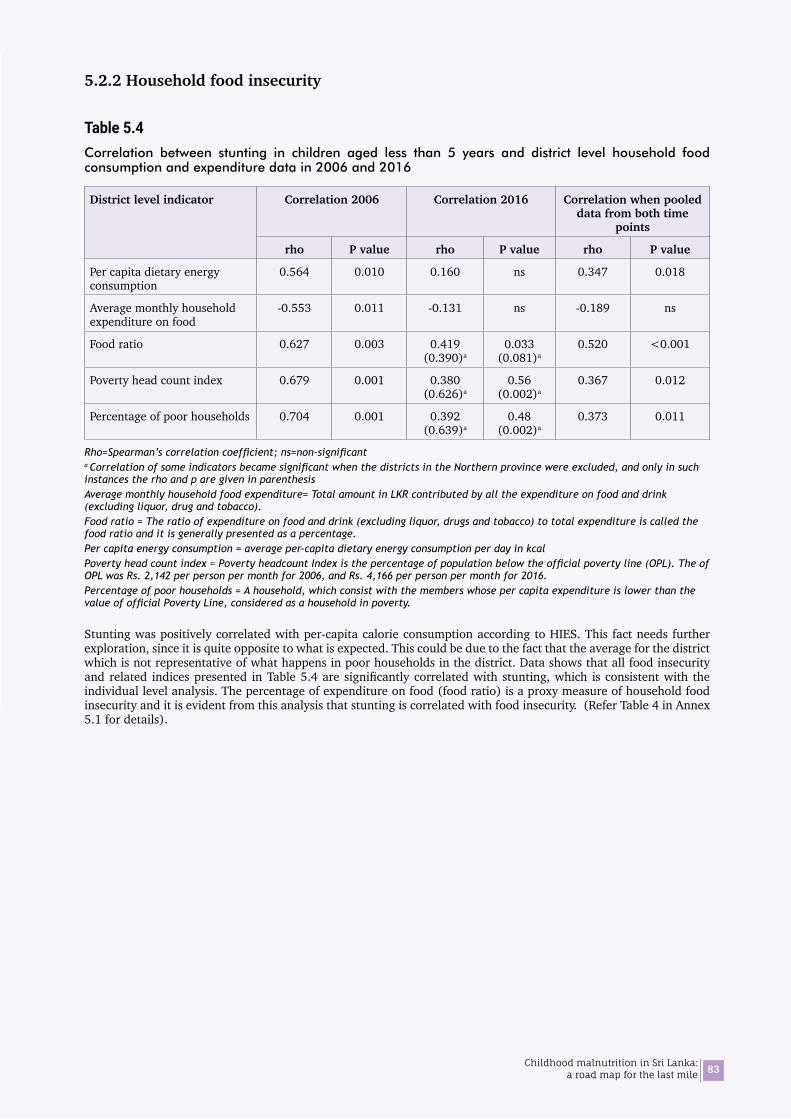
83Childhood malnutrition in Sri Lanka: a road map for the last mile
5.2.2 Household food insecurity
Table 5.4 Correlation between stunting in children aged less than 5 years and district level household food consumption and expenditure data in 2006 and 2016
District level indicator Correlation 2006 Correlation 2016 Correlation when pooled data from both time
points
rho P value rho P value rho P value
Per capita dietary energy consumption
0.564 0.010 0.160 ns 0.347 0.018
Average monthly household expenditure on food
-0.553 0.011 -0.131 ns -0.189 ns
Food ratio 0.627 0.003 0.419 (0.390)a
0.033 (0.081)a
0.520 <0.001
Poverty head count index 0.679 0.001 0.380 (0.626)a
0.56 (0.002)a
0.367 0.012
Percentage of poor households 0.704 0.001 0.392 (0.639)a
0.48 (0.002)a
0.373 0.011
Rho=Spearman’s correlation coefficient; ns=non-significanta Correlation of some indicators became significant when the districts in the Northern province were excluded, and only in such instances the rho and p are given in parenthesisAverage monthly household food expenditure= Total amount in LKR contributed by all the expenditure on food and drink (excluding liquor, drug and tobacco).Food ratio = The ratio of expenditure on food and drink (excluding liquor, drugs and tobacco) to total expenditure is called the food ratio and it is generally presented as a percentage.Per capita energy consumption = average per-capita dietary energy consumption per day in kcalPoverty head count index = Poverty headcount Index is the percentage of population below the official poverty line (OPL). The of OPL was Rs. 2,142 per person per month for 2006, and Rs. 4,166 per person per month for 2016.Percentage of poor households = A household, which consist with the members whose per capita expenditure is lower than the value of official Poverty Line, considered as a household in poverty.
Stunting was positively correlated with per-capita calorie consumption according to HIES. This fact needs further exploration, since it is quite opposite to what is expected. This could be due to the fact that the average for the district which is not representative of what happens in poor households in the district. Data shows that all food insecurity and related indices presented in Table 5.4 are significantly correlated with stunting, which is consistent with the individual level analysis. The percentage of expenditure on food (food ratio) is a proxy measure of household food insecurity and it is evident from this analysis that stunting is correlated with food insecurity. (Refer Table 4 in Annex 5.1 for details).
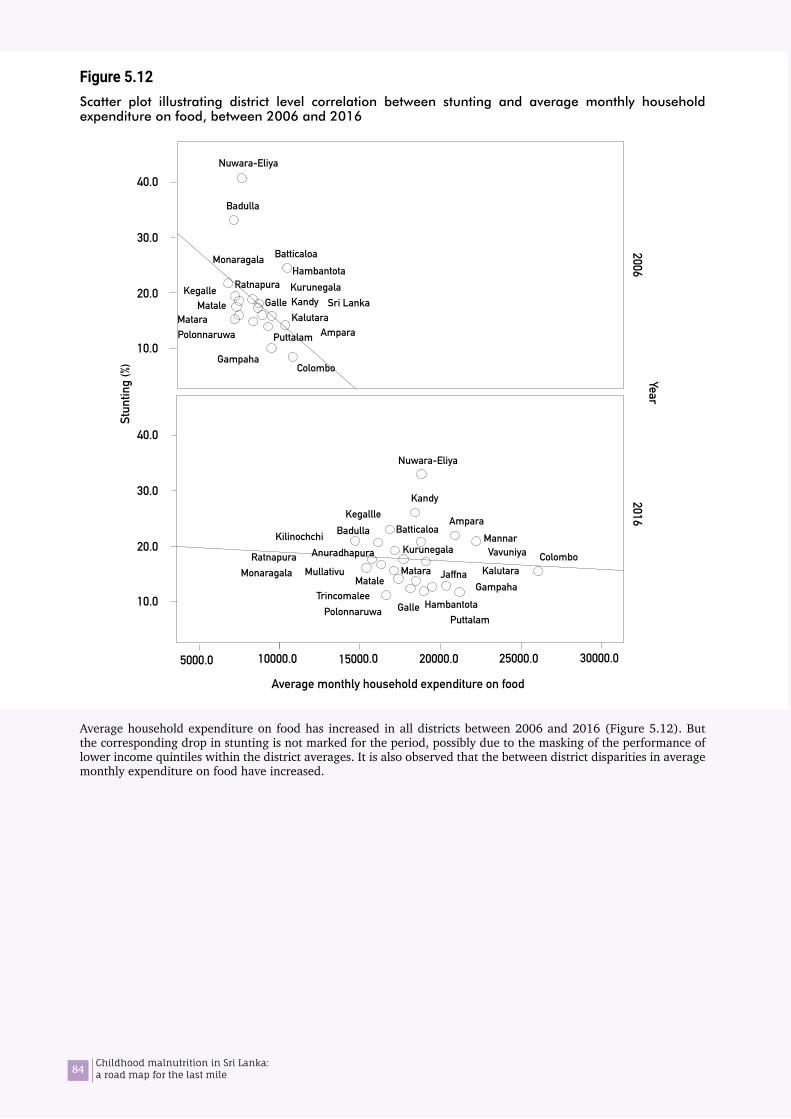
84 Childhood malnutrition in Sri Lanka: a road map for the last mile
Figure 5.12Scatter plot illustrating district level correlation between stunting and average monthly household expenditure on food, between 2006 and 2016
Average household expenditure on food has increased in all districts between 2006 and 2016 (Figure 5.12). But the corresponding drop in stunting is not marked for the period, possibly due to the masking of the performance of lower income quintiles within the district averages. It is also observed that the between district disparities in average monthly expenditure on food have increased.
10.0
20.0
30.0
40.0
Badulla
Badulla
BatticaloaMonaragala
Colombo
Colombo
Gampaha
Gampaha
Sri LankaKandy
Kandy
RatnapuraHambantota
Hambantota
Polonnaruwa
Polonnaruwa
Ampara
Ampara
Puttalam
Puttalam
Galle
Galle
Kurunegala
Kurunegala
Matale
Matale
Kalutara
Kalutara
Nuwara-Eliya
Nuwara-Eliya
Matara
Matara
Kegalle
Kegallle
Monaragala
VavuniyaKilinochchi
Anuradhapura
Mullativu
Batticaloa
Jaffna
Trincomalee
Ratnapura
Mannar
10.0
20.0
30.0
40.0
20062016
YearSt
untin
g (%
)
5000.0 15000.010000.0 20000.0 25000.0 30000.0
Average monthly household expenditure on food
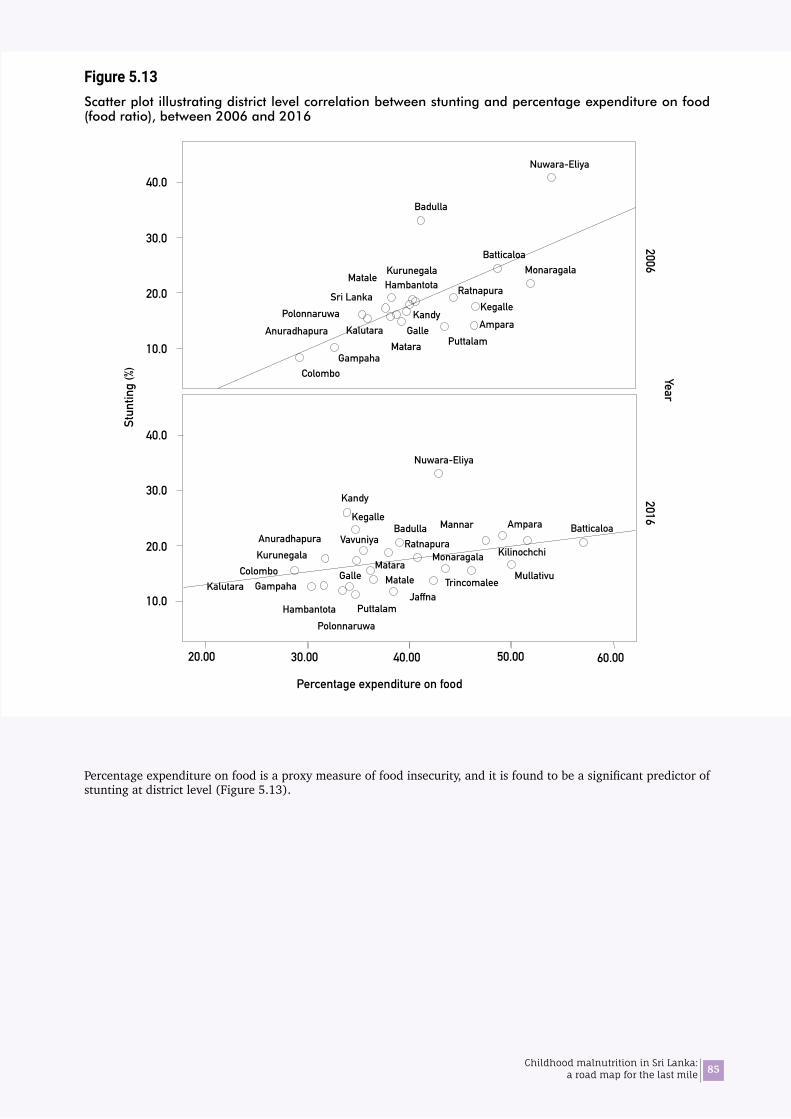
85Childhood malnutrition in Sri Lanka: a road map for the last mile
Figure 5.13Scatter plot illustrating district level correlation between stunting and percentage expenditure on food (food ratio), between 2006 and 2016
Percentage expenditure on food is a proxy measure of food insecurity, and it is found to be a significant predictor of stunting at district level (Figure 5.13).
10.0
20.0
30.0
40.0
10.0
20.0
30.0
40.0
Badulla
BatticaloaMonaragala
ColomboGampaha
Sri LankaKandy
RatnapuraHambantota
PolonnaruwaAmpara
PuttalamGalle
KurunegalaMatale
Kalutara
Nuwara-Eliya
Matara
Kegalle
Anuradhapura
Badulla
ColomboGampaha
HambantotaPolonnaruwa
Ampara
MataleKalutara
MonaragalaVavuniya
KilinochchiAnuradhapura
MullativuTrincomalee
Ratnapura
Mannar
Kandy
Puttalam
Kegalle
Nuwara-Eliya
Batticaloa
Jaffna
Galle
KurunegalaMatara
20.00 60.00 40.0030.00 50.00
20062016
YearSt
untin
g (%
)
Percentage expenditure on food

86 Childhood malnutrition in Sri Lanka: a road map for the last mile
Figure 5.14Scatter plot illustrating district level correlation between stunting and the poverty head count index, between 2006 and 2016]
The poverty head count index in every district has declined and come closer to each other by 2016 (Figure 5.14). Correlation analyses showed that stunting is predicted by the poverty, and the effect was more pronounced in 2006 than 2016.
10.0
20.0
30.0
40.0
10.0
20.0
30.0
40.0
Badulla
BatticaloaMonaragala
Colombo Gampaha
MataraSri Lanka
KandyRatnapura
HambantotaPolonnaruwa
Ampara
GalleKurunegala Matale
Kalutara
Nuwara-Eliya
Puttalam
Kegalle
Badulla Batticaloa
Colombo
Kandy
Hambantota
Ampara
Puttalam
Kurunegala
MataleKalutara
Nuwara-Eliya
VavuniyaKilinochchi
Jaffna
Mannar
Trincomalee
Kegalle
Anuradhapura Ratnapura
Galle
Mullativu
.0 10.0 20.0 30.0 40.0
Poverty Head Count index
20062016
YearSt
untin
g (%
)

87Childhood malnutrition in Sri Lanka: a road map for the last mile
5.2.3 Housing and environment
Table 5.5Correlation between stunting/wasting in children aged less than 5 years and district level housing and environmental indicators in 2006 and 2016
District level indicator Correlation 2006a Correlation 2016 Correlation when pooled data from both time points
rho P value rho P value Rho P valueAnnual rainfall a -0.481 0.032 -0.074 ns -0.224 nsPercent of population affected by disasters a - - 0.114 ns - -Use of biomass fuel for cooking a - - 0.174 ns - -Access to improved water b - - -0.555 0.003 - -Access to improved non-shared latrines b - - -0.157 ns - -
Rho=Spearman’s correlation coefficient ns=non-significant a Correlation was tested for wasting b Correlation was tested for stunting
Wasting was negatively correlated with annual average rainfall in the district, which was more evident in 2006 (Figure 5.15). However, this relationship is not obvious in 2016, despite no major change in rainfall. There was a high and significant negative correlation between stunting rates and access to improved water for drinking at the district level (Figure 5.16). There was no correlation with percentage of population affected by disasters or use of biomass fuel (Table 5.5).
(Refer Table 5 in Annex 5.1 for details)
Figure 5.15Scatter plot illustrating district level correlation between wasting and annual average rainfall, between 2006 and 2016
10.0
20.0
30.0
25.0
15.0
5.0
10.0
30.0
25.0
15.0
5.0
20.0
Trincomalee
Badulla
Batticaloa Monaragala
Colombo
Gampaha
MataraKandy
Ratnapura
Hambantota
Polonnaruwa Ampara
Puttalam GalleKurunegala
Matale
Kalutara
Nuwara-Eliya
KegalleAnuradhapura
Badulla
Batticaloa
Colombo
Matara
Kandy
Hambantota
Polonnaruwa
Ampara
Puttalam Galle
Kurunegala
Matale
Kalutara
Nuwara-Eliya
Vavuniya
Kilinochchi
Jaffna
Kegalle
Anuradhapura
Ratnapura
Mullativu
Trincomalee
Gampaha
Monaragala
500 15001000 2000 2500 3000 3500
Annual rainfall
20062016
Year
Was
ting
(%)
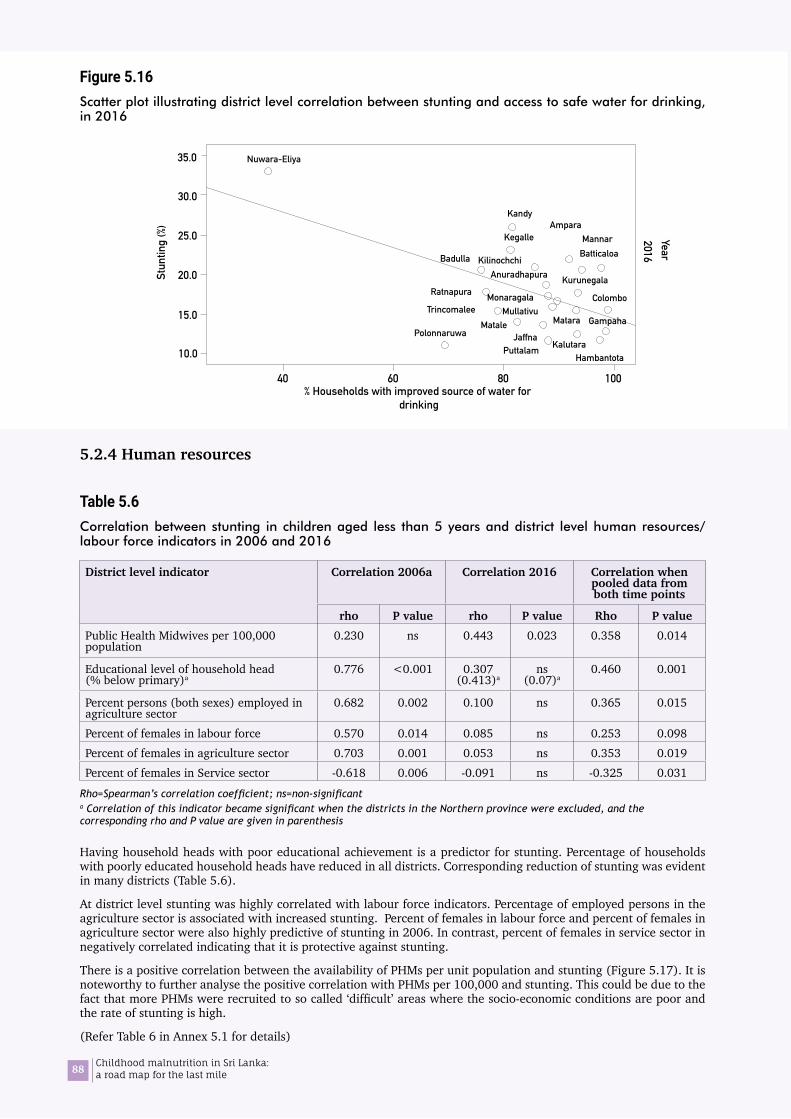
88 Childhood malnutrition in Sri Lanka: a road map for the last mile
Figure 5.16Scatter plot illustrating district level correlation between stunting and access to safe water for drinking, in 2016
5.2.4 Human resources
Table 5.6Correlation between stunting in children aged less than 5 years and district level human resources/ labour force indicators in 2006 and 2016
District level indicator Correlation 2006a Correlation 2016 Correlation when pooled data from both time points
rho P value rho P value Rho P valuePublic Health Midwives per 100,000 population
0.230 ns 0.443 0.023 0.358 0.014
Educational level of household head (% below primary)a
0.776 <0.001 0.307 (0.413)a
ns (0.07)a
0.460 0.001
Percent persons (both sexes) employed in agriculture sector
0.682 0.002 0.100 ns 0.365 0.015
Percent of females in labour force 0.570 0.014 0.085 ns 0.253 0.098Percent of females in agriculture sector 0.703 0.001 0.053 ns 0.353 0.019Percent of females in Service sector -0.618 0.006 -0.091 ns -0.325 0.031
Rho=Spearman’s correlation coefficient; ns=non-significanta Correlation of this indicator became significant when the districts in the Northern province were excluded, and the corresponding rho and P value are given in parenthesis
Having household heads with poor educational achievement is a predictor for stunting. Percentage of households with poorly educated household heads have reduced in all districts. Corresponding reduction of stunting was evident in many districts (Table 5.6).
At district level stunting was highly correlated with labour force indicators. Percentage of employed persons in the agriculture sector is associated with increased stunting. Percent of females in labour force and percent of females in agriculture sector were also highly predictive of stunting in 2006. In contrast, percent of females in service sector in negatively correlated indicating that it is protective against stunting.
There is a positive correlation between the availability of PHMs per unit population and stunting (Figure 5.17). It is noteworthy to further analyse the positive correlation with PHMs per 100,000 and stunting. This could be due to the fact that more PHMs were recruited to so called ‘difficult’ areas where the socio-economic conditions are poor and the rate of stunting is high.
(Refer Table 6 in Annex 5.1 for details)
10.0
30.0
35.0
25.0
20.0
15.0
Badulla Batticaloa
Colombo
GampahaMatara
Kandy
Hambantota
Polonnaruwa
Ampara
Puttalam
Matale
Kalutara
Nuwara-Eliya
Kilinochchi
Jaffna
Mannar
Trincomalee
Kegalle
Anuradhapura
Ratnapura
MullativuMonaragala
Kurunegala
40 60 80 100 % Households with improved source of water for
drinking
Stun
ting
(%)
2016Year

89Childhood malnutrition in Sri Lanka: a road map for the last mile
Figure 5.17Scatter plot illustrating district level correlation between stunting and availability of Public Health Midwives, between 2006 and 2016
40.0
30.0
20.0
10.0
40.0
30.0
20.0
10.0
Trincomalee
Badulla
BatticaloaMonaragala
ColomboGampaha
Matara
Sri Lanka
Kandy
RatnapuraHambantotaPolonnaruwa
AmparaPuttalam Galle
Kurunegala Matale
Kalutara
Nuwara-Eliya
Kegalle
Anuradhapura
BadullaBatticaloa
Colombo
GampahaMatara
Kandy
HambantotaPolonnaruwa
Ampara
PuttalamMatale Kalutara
Nuwara-Eliya
VavuniyaKilinochchi
Mannar
Trincomalee
Kegalle
AnuradhapuraRatnapura
Galle
Kurunegala
Jaffna Mullativu
10.0 20.0 30.0 40.0 50.0 60.0 70.0
PHM per 100,000
20062016
Year
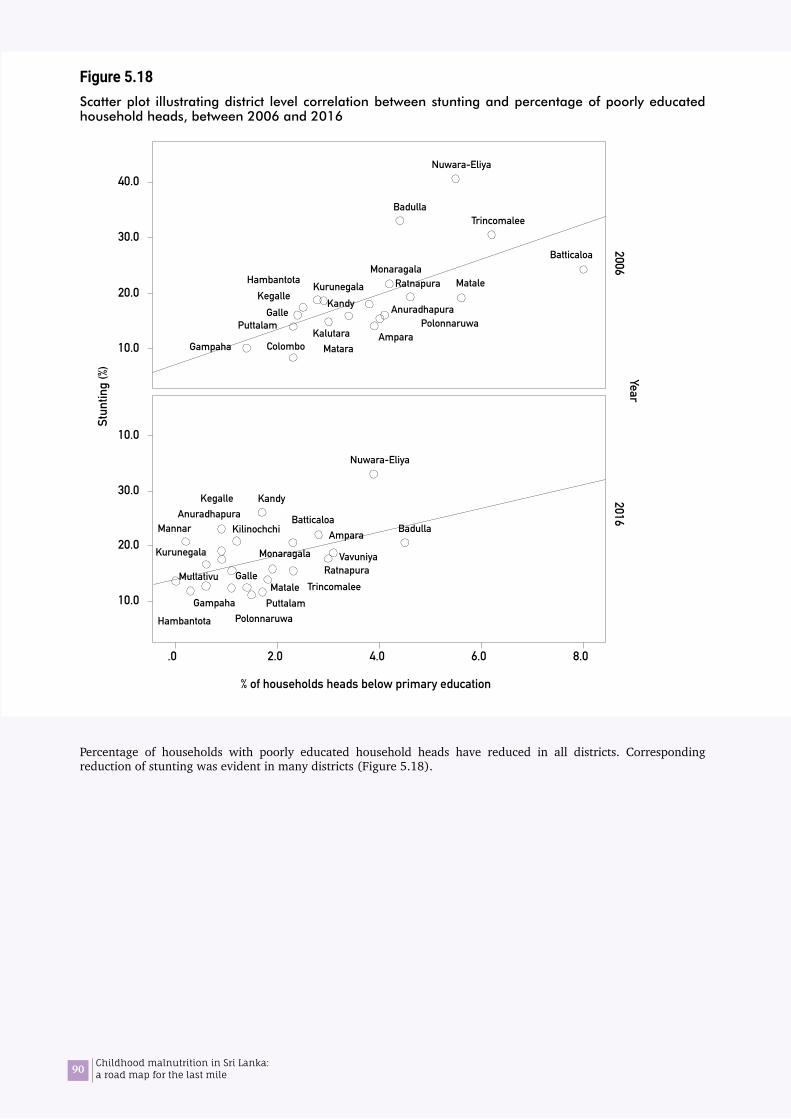
90 Childhood malnutrition in Sri Lanka: a road map for the last mile
Figure 5.18Scatter plot illustrating district level correlation between stunting and percentage of poorly educated household heads, between 2006 and 2016
Percentage of households with poorly educated household heads have reduced in all districts. Corresponding reduction of stunting was evident in many districts (Figure 5.18).
40.0
30.0
20.0
10.0
10.0
30.0
20.0
10.0
TrincomaleeBadulla
BatticaloaMonaragala
ColomboGampaha Matara
Kandy
RatnapuraHambantota
PolonnaruwaAmpara
PuttalamGalle
Kurunegala Matale
Kalutara
Nuwara-Eliya
KegalleAnuradhapura
BadullaBatticaloa
Gampaha
Kandy
Hambantota Polonnaruwa
Ampara
Puttalam
Galle
Kurunegala
Matale
Nuwara-Eliya
Vavuniya
KilinochchiMannar
KegalleAnuradhapura
RatnapuraMullativu
Monaragala
Trincomalee
.0 2.0 4.0 6.0 8.0
% of households heads below primary education
20062016
Year
Stun
ting
(%)
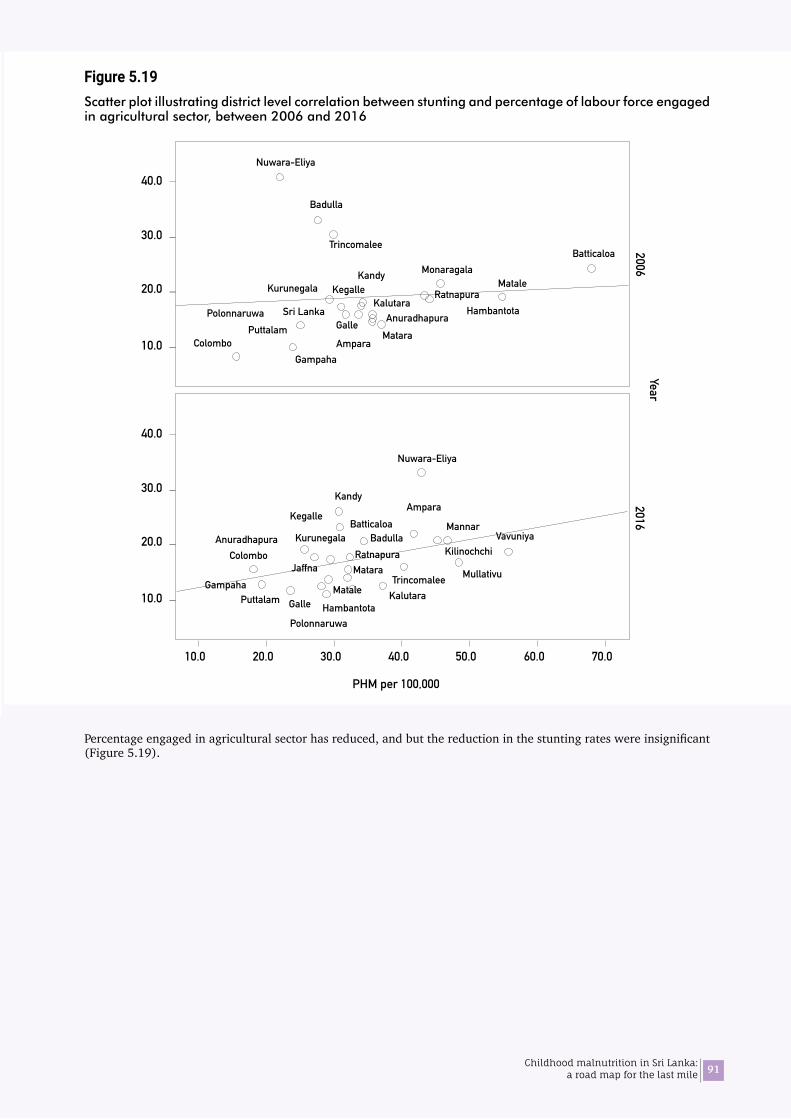
91Childhood malnutrition in Sri Lanka: a road map for the last mile
Figure 5.19Scatter plot illustrating district level correlation between stunting and percentage of labour force engaged in agricultural sector, between 2006 and 2016
Percentage engaged in agricultural sector has reduced, and but the reduction in the stunting rates were insignificant (Figure 5.19).
40.0
30.0
20.0
10.0
40.0
30.0
20.0
10.0
Trincomalee
Badulla
BatticaloaMonaragala
ColomboGampaha
Matara
Sri Lanka
Kandy
RatnapuraHambantotaPolonnaruwa
AmparaPuttalam Galle
Kurunegala Matale
Kalutara
Nuwara-Eliya
Kegalle
Anuradhapura
BadullaBatticaloa
Colombo
GampahaMatara
Kandy
HambantotaPolonnaruwa
Ampara
PuttalamMatale Kalutara
Nuwara-Eliya
VavuniyaKilinochchi
Mannar
Trincomalee
Kegalle
AnuradhapuraRatnapura
Galle
Kurunegala
Jaffna Mullativu
10.0 20.0 30.0 40.0 50.0 60.0 70.0
PHM per 100,000
20062016
Year
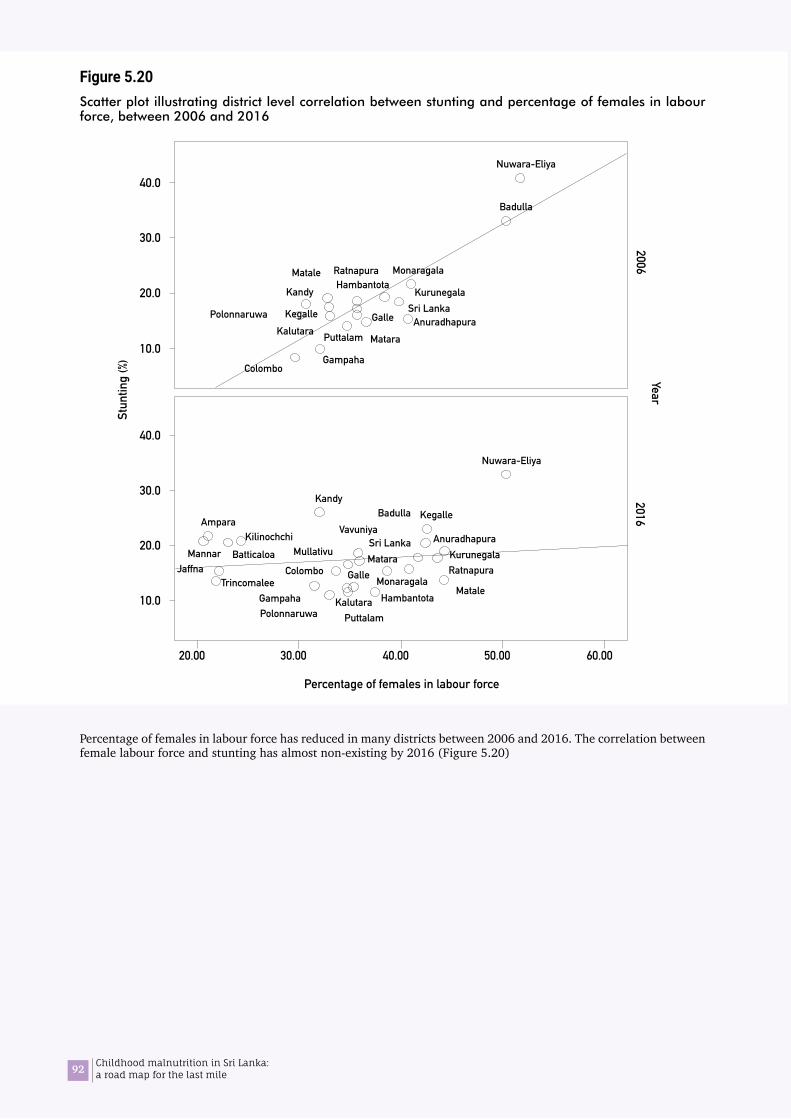
92 Childhood malnutrition in Sri Lanka: a road map for the last mile
Figure 5.20Scatter plot illustrating district level correlation between stunting and percentage of females in labour force, between 2006 and 2016
Percentage of females in labour force has reduced in many districts between 2006 and 2016. The correlation between female labour force and stunting has almost non-existing by 2016 (Figure 5.20)
40.0
30.0
20.0
10.0
40.0
30.0
20.0
10.0
Badulla
Monaragala
ColomboGampaha
Sri LankaKandy
RatnapuraHambantota
Polonnaruwa
Puttalam
Galle
Kurunegala
Matale
Kalutara
Nuwara-Eliya
Matara
KegalleAnuradhapura
Badulla
Colombo
Gampaha
Kandy
HambantotaPolonnaruwa
Ampara
Puttalam
Galle
Kurunegala
MataleKalutara
Nuwara-Eliya
Sri LankaMatara
Kegalle
Monaragala
VavuniyaKilinochchi Anuradhapura
MullativuBatticaloaJaffna
TrincomaleeRatnapura
Mannar
20.00 30.00 40.00 50.00 60.00
Percentage of females in labour force
20062016
YearSt
untin
g (%
)
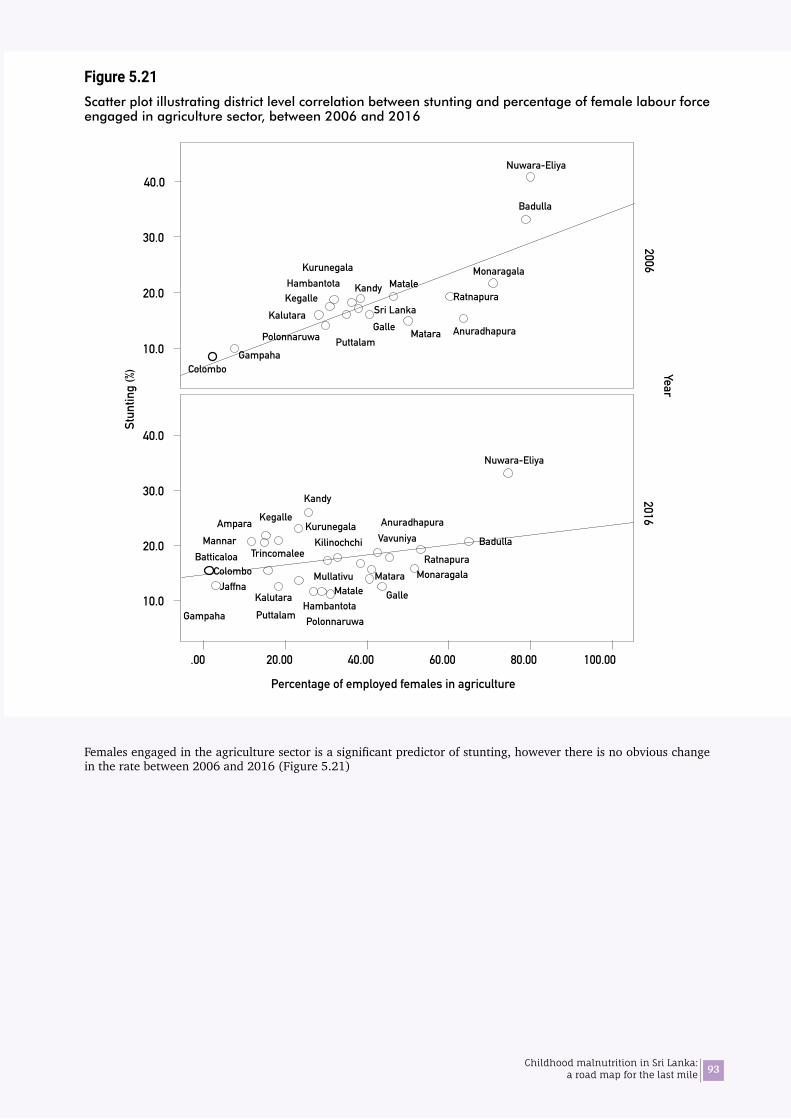
93Childhood malnutrition in Sri Lanka: a road map for the last mile
Figure 5.21Scatter plot illustrating district level correlation between stunting and percentage of female labour force engaged in agriculture sector, between 2006 and 2016
Females engaged in the agriculture sector is a significant predictor of stunting, however there is no obvious change in the rate between 2006 and 2016 (Figure 5.21)
40.0
30.0
20.0
10.0
40.0
30.0
20.0
10.0
Badulla
Badulla
Monaragala
ColomboGampaha
Sri Lanka
KandyRatnapura
Hambantota
Polonnaruwa PuttalamGalle
KurunegalaMatale
Kalutara
Nuwara-Eliya
Matara
Kegalle
Anuradhapura
Colombo
Gampaha
Kandy
HambantotaPolonnaruwaPuttalam
Galle
Kurunegala
MataleKalutara
Nuwara-Eliya
Matara
Kegalle
Monaragala
VavuniyaKilinochchi
Anuradhapura
Mullativu
Batticaloa
Jaffna
MannarAmpara
Trincomalee Ratnapura
.00 20.00 40.00 60.00 80.00 100.00
20062016
YearSt
untin
g (%
)
Percentage of employed females in agriculture
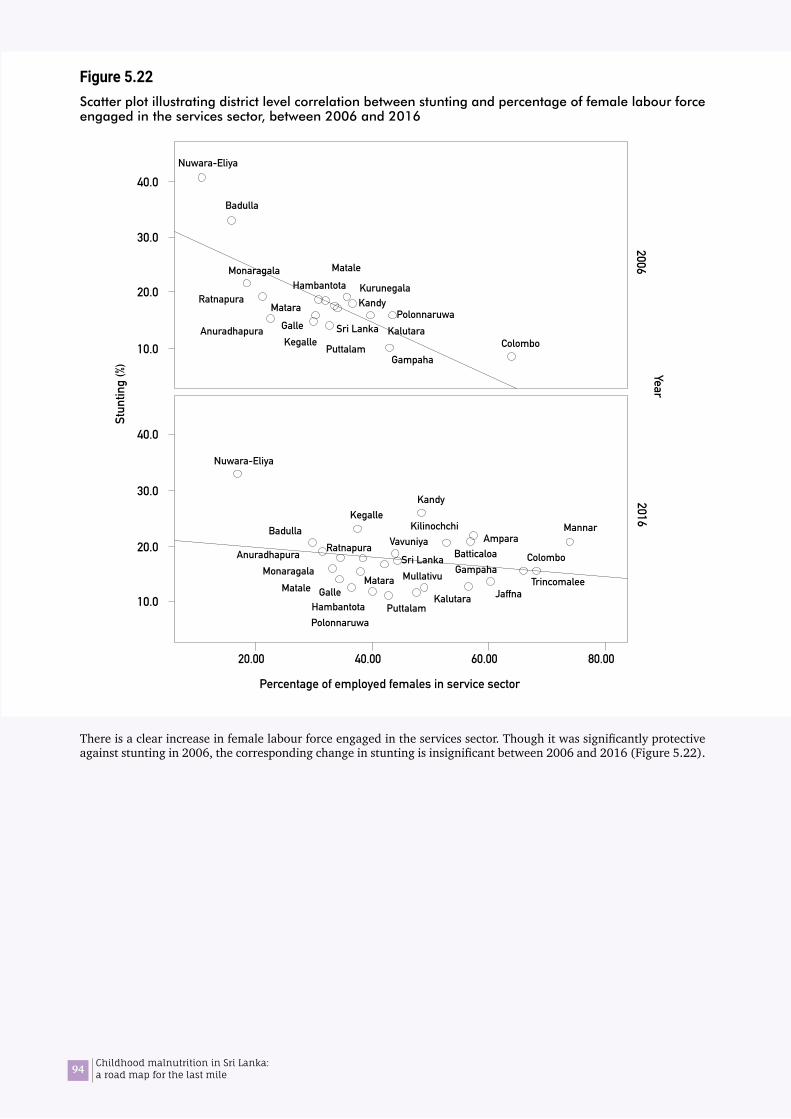
94 Childhood malnutrition in Sri Lanka: a road map for the last mile
Figure 5.22Scatter plot illustrating district level correlation between stunting and percentage of female labour force engaged in the services sector, between 2006 and 2016
There is a clear increase in female labour force engaged in the services sector. Though it was significantly protective against stunting in 2006, the corresponding change in stunting is insignificant between 2006 and 2016 (Figure 5.22).
40.0
30.0
20.0
10.0
40.0
30.0
20.0
10.0
Badulla
Monaragala
ColomboGampaha
Sri Lanka
KandyRatnapuraHambantota
Polonnaruwa
Puttalam
Galle
Kurunegala
Matale
Kalutara
Nuwara-Eliya
Nuwara-Eliya
KegalleAnuradhapura
Matara
Badulla
ColomboGampaha
HambantotaPolonnaruwa
PuttalamGalleMatale
Kalutara
Matara
Kegalle
Monaragala
VavuniyaKilinochchi
Anuradhapura
Mullativu
Batticaloa
Jaffna
MannarAmpara
Trincomalee
RatnapuraSri Lanka
Kandy
40.00 60.00 80.00 20.00
Percentage of employed females in service sector
20062016
YearSt
untin
g (%
)

95Childhood malnutrition in Sri Lanka: a road map for the last mile
06Findings of the qualitative study

96 Childhood malnutrition in Sri Lanka: a road map for the last mile
97Childhood malnutrition in Sri Lanka: a road map for the last mile
The qualitative study explored practices and behaviours that may influence nutritional status among families through FGDs with mothers/care givers and IDI with district and divisional level stakeholders. The positive deviance approach was adopted in the FGD with mothers/ care givers. The positive deviance is the observation that in most settings a few at risk individuals follow uncommon, beneficial practices and consequently experience better outcomes than their neighbours who share similar risks (Marsh 2004). Such behaviours are likely to be affordable, acceptable, and sustainable because they are already practised by at risk people, and they do not conflict with local culture.
6.1 Part A: Practices and behaviours revealed through FGD with mothers
FGDs were conducted with mothers who have U-5 children e in 5 districts as per protocol, but in the Colombo district, in-depth interviews were conducted due to feasibility. In each district 2 FGDs, i.e., mothers of children with adequate growth (well-nourished), and mothers of children with poor growth (undernourished) were carried out separately by a team of qualitative data collectors. FGDs were conducted in a health centre or suitable venue with adequate privacy. In addition, a series of IDIs were conducted through home visits covering both types of families in one MOH area in Hambantota district with a view of obtained more detailed information.
6.1.1 Background of the participantsTable 6.1 summarizes the background details of the participants. The participants represented the spectrum of Sri Lankan mothers in general, though this exercise was not meant to generalize findings via a representative sample. Approximately 6 mothers (4 to 7) who have children aged from 4 months to 5 years were present in each FGD. Most participants were from rural sector, and few from urban and estate sectors. All three ethnicities Sinhalese, Tamil and Muslim were represented in the sample. The majority of the participants were housewives. A great majority of participants from Hambantota, Ampara, and Kilinochchi districts was non-working women. The mothers from Colombo district were employed women in government, private or informal sectors, while mothers from Nuwara Eliya were either tea-pluckers or housewives. The majority of mothers from the Ratnapura district was employed in the government sector. About half of the families were nuclear families, while remaining were extended families. There were few mothers from the upper socio-economic class, while the majority was in the middle and lower socio-economic classes. Most have either studied up to or passed CGE (O/L) examination, while very few have achieved tertiary education.
06Findings of the qualitative study
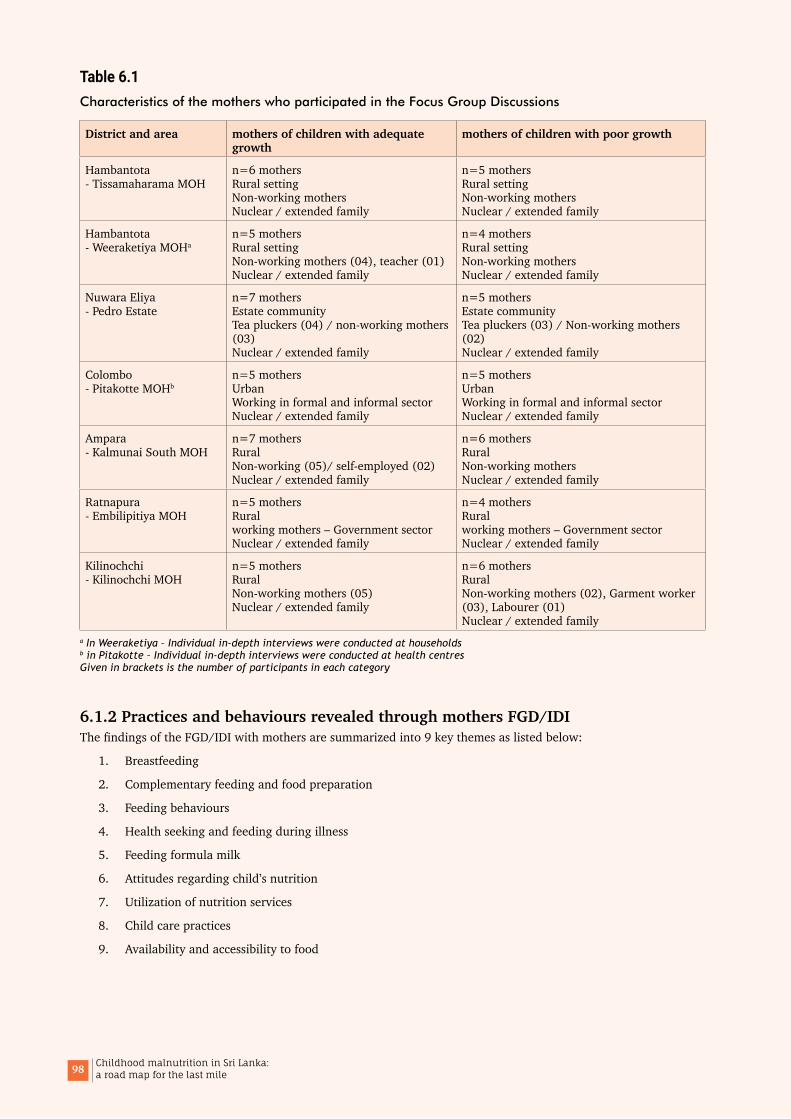
98 Childhood malnutrition in Sri Lanka: a road map for the last mile
Table 6.1Characteristics of the mothers who participated in the Focus Group Discussions
District and area mothers of children with adequate growth
mothers of children with poor growth
Hambantota - Tissamaharama MOH
n=6 mothers Rural setting Non-working mothers Nuclear / extended family
n=5 mothers Rural setting Non-working mothers Nuclear / extended family
Hambantota - Weeraketiya MOHa
n=5 mothers Rural setting Non-working mothers (04), teacher (01) Nuclear / extended family
n=4 mothers Rural setting Non-working mothers Nuclear / extended family
Nuwara Eliya - Pedro Estate
n=7 mothers Estate community Tea pluckers (04) / non-working mothers (03) Nuclear / extended family
n=5 mothers Estate community Tea pluckers (03) / Non-working mothers (02) Nuclear / extended family
Colombo - Pitakotte MOHb
n=5 mothers Urban Working in formal and informal sector Nuclear / extended family
n=5 mothers Urban Working in formal and informal sector Nuclear / extended family
Ampara - Kalmunai South MOH
n=7 mothers Rural Non-working (05)/ self-employed (02) Nuclear / extended family
n=6 mothers Rural Non-working mothers Nuclear / extended family
Ratnapura - Embilipitiya MOH
n=5 mothers Rural working mothers – Government sector Nuclear / extended family
n=4 mothers Rural working mothers – Government sector Nuclear / extended family
Kilinochchi - Kilinochchi MOH
n=5 mothers Rural Non-working mothers (05) Nuclear / extended family
n=6 mothers Rural Non-working mothers (02), Garment worker (03), Labourer (01) Nuclear / extended family
a In Weeraketiya – Individual in-depth interviews were conducted at households b in Pitakotte – Individual in-depth interviews were conducted at health centres Given in brackets is the number of participants in each category
6.1.2 Practices and behaviours revealed through mothers FGD/IDIThe findings of the FGD/IDI with mothers are summarized into 9 key themes as listed below:
1. Breastfeeding
2. Complementary feeding and food preparation
3. Feeding behaviours
4. Health seeking and feeding during illness
5. Feeding formula milk
6. Attitudes regarding child’s nutrition
7. Utilization of nutrition services
8. Child care practices
9. Availability and accessibility to food
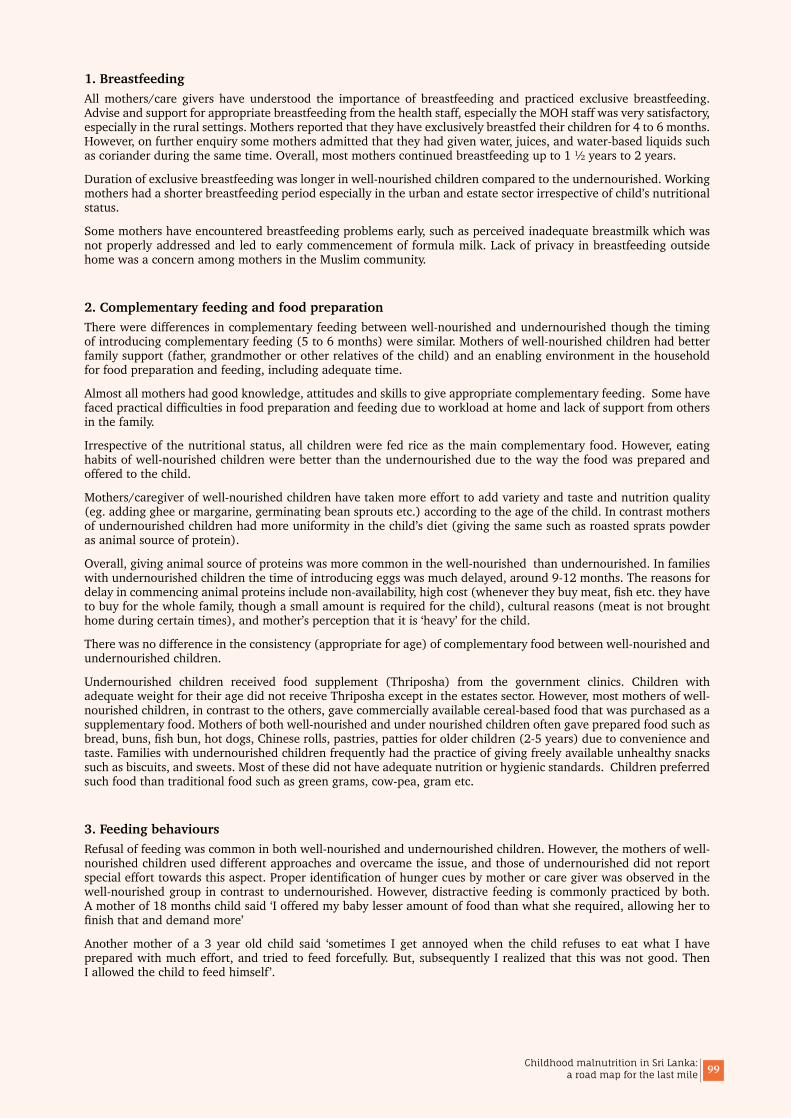
99Childhood malnutrition in Sri Lanka: a road map for the last mile
1. Breastfeeding All mothers/care givers have understood the importance of breastfeeding and practiced exclusive breastfeeding. Advise and support for appropriate breastfeeding from the health staff, especially the MOH staff was very satisfactory, especially in the rural settings. Mothers reported that they have exclusively breastfed their children for 4 to 6 months. However, on further enquiry some mothers admitted that they had given water, juices, and water-based liquids such as coriander during the same time. Overall, most mothers continued breastfeeding up to 1 ½ years to 2 years.
Duration of exclusive breastfeeding was longer in well-nourished children compared to the undernourished. Working mothers had a shorter breastfeeding period especially in the urban and estate sector irrespective of child’s nutritional status.
Some mothers have encountered breastfeeding problems early, such as perceived inadequate breastmilk which was not properly addressed and led to early commencement of formula milk. Lack of privacy in breastfeeding outside home was a concern among mothers in the Muslim community.
2. Complementary feeding and food preparation There were differences in complementary feeding between well-nourished and undernourished though the timing of introducing complementary feeding (5 to 6 months) were similar. Mothers of well-nourished children had better family support (father, grandmother or other relatives of the child) and an enabling environment in the household for food preparation and feeding, including adequate time.
Almost all mothers had good knowledge, attitudes and skills to give appropriate complementary feeding. Some have faced practical difficulties in food preparation and feeding due to workload at home and lack of support from others in the family.
Irrespective of the nutritional status, all children were fed rice as the main complementary food. However, eating habits of well-nourished children were better than the undernourished due to the way the food was prepared and offered to the child.
Mothers/caregiver of well-nourished children have taken more effort to add variety and taste and nutrition quality (eg. adding ghee or margarine, germinating bean sprouts etc.) according to the age of the child. In contrast mothers of undernourished children had more uniformity in the child’s diet (giving the same such as roasted sprats powder as animal source of protein).
Overall, giving animal source of proteins was more common in the well-nourished than undernourished. In families with undernourished children the time of introducing eggs was much delayed, around 9-12 months. The reasons for delay in commencing animal proteins include non-availability, high cost (whenever they buy meat, fish etc. they have to buy for the whole family, though a small amount is required for the child), cultural reasons (meat is not brought home during certain times), and mother’s perception that it is ‘heavy’ for the child.
There was no difference in the consistency (appropriate for age) of complementary food between well-nourished and undernourished children.
Undernourished children received food supplement (Thriposha) from the government clinics. Children with adequate weight for their age did not receive Thriposha except in the estates sector. However, most mothers of well-nourished children, in contrast to the others, gave commercially available cereal-based food that was purchased as a supplementary food. Mothers of both well-nourished and under nourished children often gave prepared food such as bread, buns, fish bun, hot dogs, Chinese rolls, pastries, patties for older children (2-5 years) due to convenience and taste. Families with undernourished children frequently had the practice of giving freely available unhealthy snacks such as biscuits, and sweets. Most of these did not have adequate nutrition or hygienic standards. Children preferred such food than traditional food such as green grams, cow-pea, gram etc.
3. Feeding behavioursRefusal of feeding was common in both well-nourished and undernourished children. However, the mothers of well-nourished children used different approaches and overcame the issue, and those of undernourished did not report special effort towards this aspect. Proper identification of hunger cues by mother or care giver was observed in the well-nourished group in contrast to undernourished. However, distractive feeding is commonly practiced by both. A mother of 18 months child said ‘I offered my baby lesser amount of food than what she required, allowing her to finish that and demand more’
Another mother of a 3 year old child said ‘sometimes I get annoyed when the child refuses to eat what I have prepared with much effort, and tried to feed forcefully. But, subsequently I realized that this was not good. Then I allowed the child to feed himself’.

100 Childhood malnutrition in Sri Lanka: a road map for the last mile
4. Health seeking and feeding during illness The frequent illnesses were fever, respiratory illness such as cough, running nose and wheezing, and the diarrhoeal diseases were reported occasionally. Undernourished children had more frequent episodes of illness including diarrheal diseases than well-nourished children. The first contact person for non-severe illness was the general practitioner (usually a government doctor who runs a private dispensary out of working hours). Mothers who are in the upper or middle socio-economic class sought advice from a paediatrician in a channelled consultation service.
Feeding practices were compromised during illness, some foods were restricted depending on the nature of illness. Some mothers tried to maintain feeding during illness by altering the food preparation, i.e., adding honey etc.
Some mothers attributed growth faltering due to a severe episode of illness and said that they failed to achieve catch-up growth. In the well-nourished group there were children who had growth faltering but improved subsequently through proper feeding and regular follow-up.
5. Feeding formula milkPractice of giving formula feeding was low. However, some mothers, especially who are employed used to commence formula feeding with return to work. They rarely practiced expressed breastmilk due to difficulties in implementation such as inadequate safe storage facilities and reluctance of caregivers to use a cup and spoon etc.
Some have commenced formula milk during 4-5 months. This practice was more prevalent in the undernourished mothers. These mothers have encountered some breastfeeding problems early, such as perceived inadequate breastmilk which was not properly addressed and led to early commencement of formula milk.
Working mothers in urban settings exclusively breastfed only up to 4 months, irrespective of whether their children are well-nourished or undernourished. Thereafter these children were given formula milk during the working hours via feeding bottle while continuing breastfeeding at night. Early commencement of complementary feeding was a practice found among working mothers. Few working mothers, who are in the rural settings had the practice of giving expressed breastmilk.
6. Attitudes regarding child’s nutritionAll mothers expressed interest in their children’s nutrition status and were aware that good nutrition would ensure adequate growth and brain development. Grooming a more intelligent child with better educational achievement was their ambition. All mothers were quite positive and receptive to the feeding advises and services provided by the MOH staff. Father’s attitude and active involvement were found to be high in the families having well-nourished children than undernourished. In the estate communities, some mothers admitted that addiction to alcohol by the father of the child affected child care, especially growth. In families with undernourished children inadequate money to purchase nutritious food was a concern that was often expressed.
7. Utilization of nutrition servicesMothers were educated about breastfeeding during their pregnancy through special educational programs. They gained knowledge and skills about complementary feeding through a special programme on complementary feeding when the infant was around 4 to 5 months. In addition, they have obtained knowledge on child nutrition via media (newspapers, magazines, and television), from their parents and peers in the community.
Participation in educational programmes during pregnancy was good in rural areas but not by working mothers in urban areas. There is no difference in utilization of health services between mothers of well-nourished and undernourished children. However, there is a distinct difference in making use of the knowledge that was obtained at the clinics between these two categories. The well-nourished group had applied most of the knowledge in contrast to the others, as they had necessary family support and resources to do so.
In Hambantota district there was a special nutrition programme implemented in all MOH areas according to a schedule with identified themes. The programme is well organized and was initiated and monitored by the Medical Officer – Maternal and Child Health in the district. Investigators had the opportunity to observe one such programme on complementary feeding during the field visits. During IDIs in the same area, all mothers said that they participated in the nutrition programme. Though mothers have been advised and shown food demonstrations in nutrition clinics some failed to practice them at home. One mother with an undernourished child from a rural community said ‘although I went to the nutrition programme at the MOH, we could not practice all that was taught due to financial difficulties’
However, many mothers practiced the food preparation and feeding as per demonstrations done at the nutrition programmes.
All mothers were interested on growth monitoring and brought children for weighing to the centres.

101Childhood malnutrition in Sri Lanka: a road map for the last mile
8. Child care practicesMothers with well-nourished children had more family support from other members of the family especially the father of child. They also received support from other care givers (mostly mother or mothers-in-law). It was revealed that having an extended family is very helpful in child care and IYCF. However, it is important to educate such members so that they have a good knowledge about the current recommendations of IYCF to avoid conflicting situations such as giving formula milk, snacks and sweets irrationally.
Working mothers in the estate community resumed work when the child was around 3 months while keeping their children in a Child Development Centre (Creche) under the care of a CDO during working hours. They were allowed to come and breastfeed the child while at work. However, such facilities were not available for working mothers in urban or rural areas, who usually resumed work around 4months after child birth. Babies of these mothers were looked after by grandparents, relative, domestic helper or a paid child care provider.
9. Availability and accessibility to foodNone of the mothers/ care givers reported about any long-term food shortage or starvation at family level. However, they were of the opinion that, if economic situation is better, they could have given better / more nutritious food to the child. Some families with malnourished children informed that their child care practices and feeding were compromised due to financial difficulties.
6.2 Part B: Nutrition interventions at district and divisional level
The KII with district and divisional level stakeholders provided information about existing services, interventions and areas for improvement. The stakeholders represented health and ‘non-health’ (refers to sectors other than health services) sectors. The health sector stakeholders included officers at district level (Medical Officer Maternal and Child Health (MOMCH), Regional Supervising Public Health Nursing Officer (RSPHNO)), and divisional level (Medical Officer of Health (MOH), Pubic Health Nursing Sister (PHNS), and Public Health Midwife (PHM)) and other medical professionals (Paediatrician). The ‘non-health’ sectors included officials from the District Secretariat, Plantation Human Development Trust (PHDT), Department of Agriculture, Divisional Secretariat, estate Child Development Center (CDC) and International Non-governmental Organization.
The information is summarized according to the key discussion points:
1. Status of nutrition of under 5 year children, and trends All stakeholders were of the opinion that nutritional status of children has been improving gradually in their respective areas. Health sector stakeholders supported this trend with routinely collected statistics.
2. Reasons for poor growth and malnutrition The participants expressed multiple reasons for malnutrition in children. The reasons were prioritized according to the number of persons mentioned a given reason and are summarized in Figure 6.1.
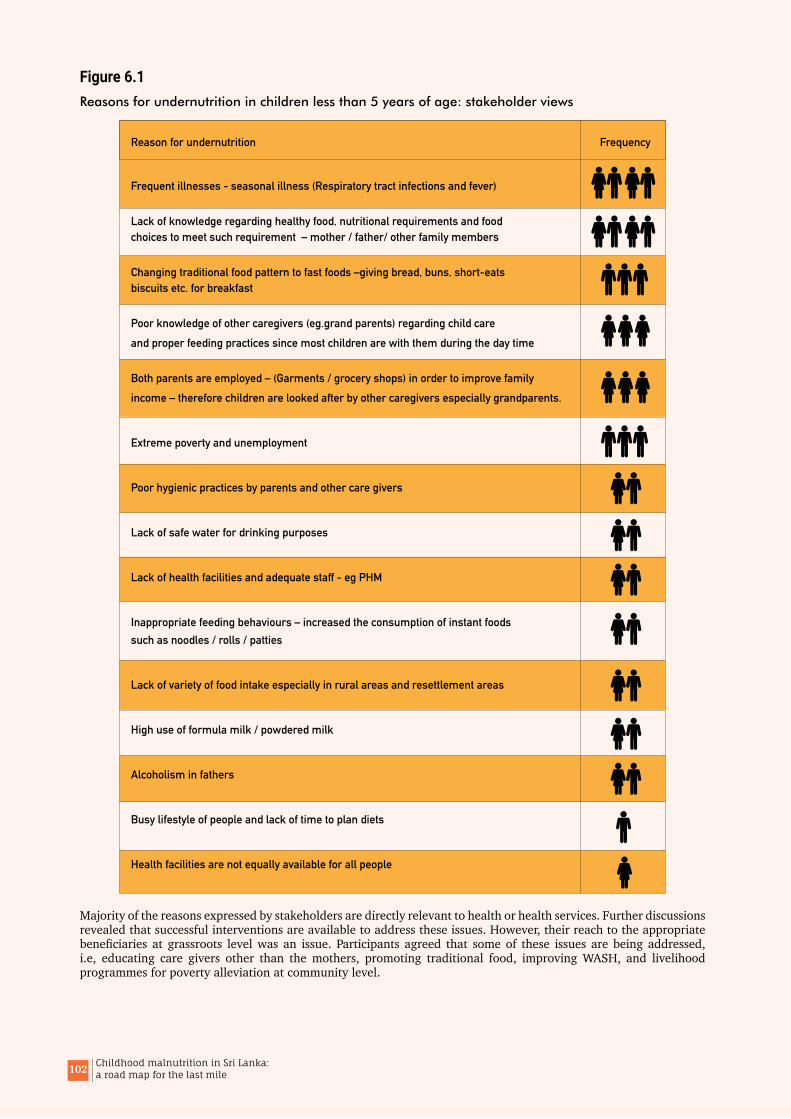
102 Childhood malnutrition in Sri Lanka: a road map for the last mile
Figure 6.1Reasons for undernutrition in children less than 5 years of age: stakeholder views
Majority of the reasons expressed by stakeholders are directly relevant to health or health services. Further discussions revealed that successful interventions are available to address these issues. However, their reach to the appropriate beneficiaries at grassroots level was an issue. Participants agreed that some of these issues are being addressed, i.e, educating care givers other than the mothers, promoting traditional food, improving WASH, and livelihood programmes for poverty alleviation at community level.
Frequent illnesses - seasonal illness (Respiratory tract infections and fever)
Lack of knowledge regarding healthy food, nutritional requirements and foodchoices to meet such requirement – mother / father/ other family members
Changing traditional food pattern to fast foods –giving bread, buns, short-eatsbiscuits etc. for breakfast
Poor knowledge of other caregivers (eg.grand parents) regarding child careand proper feeding practices since most children are with them during the day time
Both parents are employed – (Garments / grocery shops) in order to improve familyincome – therefore children are looked after by other caregivers especially grandparents.
Extreme poverty and unemployment
Poor hygienic practices by parents and other care givers
Lack of safe water for drinking purposes
Lack of health facilities and adequate staff - eg PHM
Inappropriate feeding behaviours – increased the consumption of instant foodssuch as noodles / rolls / patties
Lack of variety of food intake especially in rural areas and resettlement areas
High use of formula milk / powdered milk
Alcoholism in fathers
Busy lifestyle of people and lack of time to plan diets
Health facilities are not equally available for all people
Reason for undernutrition Frequency

103Childhood malnutrition in Sri Lanka: a road map for the last mile
3. Consequences of malnutrition All stakeholders foresee the common consequence of malnutrition – impaired growth and development, poor school performance, and vulnerability for infections. Reduction in economic productivity due to malnutrition was mentioned only by 2 non-health stakeholders at managerial level, i.e., from the PHDT and District Secretariat.
4. Nutrition interventions that are being carried out in the areasThere are number of existing interventions for promoting nutrition in the areas studied. However, the stakeholders did not categorically identify them as ‘direct nutrition’ and ‘indirect nutrition’ interventions. Instead they are familiar with the classification according to ‘health’ and ‘non-health’. Some of them are routine services while others are special programmes or projects. Some are very generic, and others are very specific such a micronutrient supplementation. During the analysis of IDI, the interventions were classified as ‘direct’ and ‘indirect’ nutrition interventions.
Direct nutrition interventions• Pre pregnancy counselling sessions for newly married couples
• Antenatal care package (includes screening, food and micronutrient supplementation, monitoring of maternal weight gain and foetal growth through antenatal clinics, antenatal classes, and nutrition counselling during home visits)
• Food basket (poshanamalla) for pregnant and lactating mothers
• Breastfeeding promotion programme during pregnancy
• Programme on complementary feeding with practical demonstrations, for mothers with 4-5 months old infants
• Health staff training on lactation management, IYCF and nutrition counselling, growth monitoring and promotion and communication skills
• Growth monitoring and promotion for children under 5 years
• Food supplementation (Thriposha) for undernourished, micronutrient supplementation (Vitamin A, MMN powder) and deworming for children under 5 years
• Nutrition clinic at MOH for malnourished
• Referral to Paediatiatric clinics/ Nutrition Clinics (secondary and tertiary care hospitals) for severely malnourished
• Training of pre-school teachers on feeding children
• Weekly demonstrations about making of different types of food in Child Development Centers (Creche’s) in the estates
• Community outreach programmes – eg. Breastfeeding walk, exhibitions, food demonstrations
• Mother support groups
• Promoting home based food supplements – eg.jeevaposha, saththuma (energy powder)
• Commercially available food supplements in the market– Suposha (same as Thriposha) marketed by the Ministry of Health since 2 years ago, and other similar products in the market by private food industries
• School health nutrition programmes – screening for nutrition deficiencies and referral during school medical inspection, nutrition education sessions, nutrition exhibitions
• Micronutrient supplementation and deworming for school children
• School mid-day meal programme
• Display and distribution of IEC material on a wide range of nutrition topics
• Nutrition reviews at district level
According to health sector stakeholders, the programme on complementary feeding with food demonstrations at MOH level with participation of mothers of infants aged 4-5 months, was the most successful and effective intervention. This was initiated in Hambantotoa district during 2015, and now being scaled-up to other districts as well. In Hambantota district, the programme is conducted once in 2 months in all MOH areas simultaneously according to an annual plan. The programme is closely monitored and supervised by the MO.MCH. This programme was not dependent on government funds, and participants bring food items for food demonstration. The programme implementation was directly observed by the investigators in one MOH area. Further, the mother’s feedback and routine data confirmed its positive impact on children’s nutrition.
104 Childhood malnutrition in Sri Lanka: a road map for the last mile
Another positive feature observed in Hambantota was the fact that the MOH could identify the groups of people within his area who had higher rates of undernutrition and who could not be reached through the routine processes. Special innovative efforts to involve them in the routine programmes and also specific efforts to involve them in the processes that are currently underway in the programs had been taken.
Indirect nutrition interventionsa) Livelihood programmesObjective of these programmes is to improve economic and nutritional status of the family members
• Divineguma programme
• Samurdhi benefits (financial) for families below the poverty line
• Facilitate bank loans to start small scale farming of cattle, goat and poultry
• Collaboration with NGOs to improve the health and economy of the people
b) Livestock Objective is to reduce food insecurity / increase animal protein consumption through milk and other products.
c) Home gardening interventions in the community and schools• Promote home gardening, provide coconut seedlings and paddy cultivation through ‘Divi Neguma’
programme.
• Develop and implement home garden models in schools
d) Agricultural support• Subsidy for inorganic fertilizer
• Provide seeds / compost fertilizers
• Promote home gardening,
• Demonstrate preparation of organic fertilizer
e) Promote the traditional foods• Prepare and demonstrate variety of traditional food in the community and school programmes and provide
free food samples for participants and school children.
• Empower the participant to prepare traditional foods in their home
• Empower school children to request their parents to prepare traditional foods in their home
• “Ammachi” food shop in the Northern province is market for selling traditional foods at a low cost and to promote consuming nutrition foods which are locally available.
f) Facilitating community groups • Establishment of local community groups (mothers clubs / mother support groups / self-help groups)
• Cash management training for estate community – newly developed
g) Positive deviance approach – This was observed in Kilinochchi district and 2 selected estates in Nuwara Eliya
• Sharing success stories of mother who have improved the weight of children
• Promote nutritious food appropriate for the local community via demonstrations for preparing such food
h) WaSSIP – Water Supply and Sanitation Improvement Project implemented by the Ministry of City Planning and Water Supply provide grants to construct toilets in the plantation sector.
i) District Nutrition Committee – is chaired by the District Secretary with the participation of several sectors including the Health, Public Administration, Education, Agriculture, Samurdhi, Social Services, Women and Children affairs, and relevant NGO. This is a multi-sectoral platform, and usually meets once in 3 months and operates according to a district nutrition action plan. Similar multi-sectoral committees are available at the divisional level under the chair of the Divisional Secretary.

105Childhood malnutrition in Sri Lanka: a road map for the last mile
5. Perceived Outcome of such interventions The stakeholders claimed that their respective programme was successfully implemented. Most stakeholder agreed that multi-sectoral coordination was poor at district, divisional and grass-root level. In some areas district nutrition committees were functioning successfully under the coordination of the District Secretary, while in some districts stakeholders said that were they were not functioning properly.
Outcomes of direct nutrition interventions are available / can be measured through routine MCH information system (RHMIS).
Some of the perceived outcomes of indirect nutrition interventions are:
• Increased family income
• Mothers practicing traditional food preparations
• Home gardening increased
• Doing home gardening without use of pesticide or inorganic fertilizers
6. Successes of such interventions Almost all stakeholders were confident that their interventions have contributed to reducing levels of malnutrition. This was supported with data by the health sector for direct nutrition interventions. The outcomes such as pregnancy weight gain, birth weight, stunting, wasting, underweight, anaemia, have improved over time in certain areas.
7. Drawbacks of such interventions • Despite the impressive programme on complementary feeding, still there are families who do not practice
appropriate complementary feeding due to extreme poverty, lack of family support, and lack of motivation.
• According to some health authorities, the multi-sector action plan for nutrition is a failure in their districts. Although the multisectoral approach is viewed as a very important concept, it is not properly implemented in some districts. For example, it is a failure in Hambantota district due to poor coordination and lack of commitment by the different stakeholders. The funds were allocated to the Divisional Secretariats to run various indirect nutrition interventions (such as prevention of alcohol and narcotics, animal husbandry, home gardening, etc.), however most funds were utilized to conduct nutrition awareness sessions which are already present in the health services package provided by the MOH. Such duplications resulted in wastage of resources. Furthermore, activities were not supervised adequately by the District Secretariat.
• There is a lack of priority given for nutrition in some families. More investment is made on items such as household appliances, cloths, education etc.
• Samurdhi financial benefits are not used for nutrition. There is no essential food provisions through this programme.
• The allocation for the supply of mid-day meal is grossly inadequate to provide a nutritious meal. The contract is given for Samurdhi beneficiary families, and they don’t pay much attention to provide a nutritious or hygienic meal for school children.
• The impact of multi-sector interventions on the nutritional status of the family and children was not assessed objectively. It is also difficult to assess outcome when there are multiple interventions by different stakeholders.
• Poor coordination at district level – some key stakeholders are missed out in the District Nutrition Committee, for example, PHDT, Ministry of Hill Country and Rural Development were not members of the committee in Nuwara Eliya district
• Seasonality and weather changes - participants can’t do home gardening in dry seasons – (May to September in the dry zone) due to lack of rain, lack of water and hot weather
• Human resource issues in the health sector – There were vacant PHM areas, disabling most of the health sector nutrition services. In addition, there were language and cultural barriers and staff retention issues when newly recruited PHMs are from a totally different area. This issue was prominent in the estate sector where the newly recruited PHMs were from a rural setting.
106 Childhood malnutrition in Sri Lanka: a road map for the last mile
8. Other issues• There is a problem of ensuring that the IYCF and maternal care packages reach the needy. Rural poverty
contributes to a large burden of undernutrition in the community. There are families or households which are left out of the systems of social protection. Poverty itself is a barrier to access the services. In the rural settings the poor is dispersed within middle social class and doing targeted intervention is difficult.
• There is a delay in implementing the decisions made at district nutrition committees due to complex administrative and financial procedure
• There is duplication of activities by different sectors due to poor coordination between sectors
• Workload of the PHM has increased due to increased non-health activities such as meetings at the DS office, and non MCH work such as NCD and Dengue control work.
• Cultural and language barriers faced by the newly recruited PHMs and high staff turnover.
9. Food scarcityFood scarcity has been reported in some pockets of poor areas. It is more common during floods, droughts and natural disasters.
10. Suggestions for improvement proposed by stakeholder• Introduce low cost, high nutritious foods to be grown locally
• Promote traditional food practices
• Identify vulnerable families and support them to improve the economical status of the family.
• Ensure food availability to poor people with special attention to climatic or other exposures that may compromise their food security
• Consumption barriers due to religious belief should be considered
• Promote home gardening within available space, farming and poultry
• Provide employment for young men and women
• Encourage community participation and cooperation in community farming
• Increase the school-based programmes regarding healthy food
• Work together with other organizations/ create committee with other organization (Ex: Health/ irrigation/ Divisional Secretariat)
• Regularize the mid-day meal programme for school children. A realistic allocation to provide a nutritious meal should be estimated and provided to the suitable contractors. The mid-day meal should be monitored for both nutritious value and hygienic standards.
• Re-energize the multi-sector district nutrition committee (in areas this is not functioning properly) and provide the specific responsibilities to different stakeholders as per multi sector action plan. Activities should be closely monitored. This coordination should be practiced at Divisional level and village level too. Measures should be taken to avoid duplicating the work and overloading the PHMs with non-health work.
• Suggest formulating regulations to recruit PHMs from the local area, with some leverage to adjust the minimum qualifications.
• Make PHM areas coincide with Grama Niladhari Divisions
• Enhance counselling skills and language barriers of the PHM.
• Enhance motivation of PHMs through increased allowances and appraisal of services, official quarters, and offices facilities.
107Childhood malnutrition in Sri Lanka: a road map for the last mile
07Opportunities for intervention

108 Childhood malnutrition in Sri Lanka: a road map for the last mile
109Childhood malnutrition in Sri Lanka: a road map for the last mile
7.1Summaryofthefindings
The present analysis identified several key determinants of undernutrition. Table 7.1 summarizes the adjusted OR which were found to be significant in multivariate regression analyses described in Tables 4.3, 4.6, 4.8 and 4.11 in Chapter 4.
The modifiable determinants of stunting in the first 2 years identified through the analysis of DHS data included low birth weight, inadequate money for daily expenses, and limited access to information by mother. The modifiable determinants of wasting in the first 2 years are low birth weight and poor maternal education.
In the 5th year, the modifiable factors that would prevent stunting are: having improved non-shared latrines, mother having exposure to all 3 media (newspaper, radio, television), mother’s education level being O/L or above and having adequate money for daily expenses.
Table 7.2 summarizes the significant district level indicators based on correlational analyses described in Tables 5.3 to 5.6 in Chapter 5. District level correlational analysis identified not having a minimum acceptable diet in 6-23 months old, certain health service indicators such as poor coverage of deworming, and unmet need of family planning as significant correlates of stunting in children less than 5 years of age. Access to improved source of water was associated with lower rate of stunting. Of the indirect nutrition indicators, inadequate education of household head, and proxy indicators that reflect food insecurity and poverty were significantly correlated with stunting. Women’s participation in labour force and their engagement in the agriculture sector were predictive of high stunting rates, while women’s participation in service sector was preventive against stunting.
The present district level analysis of DHS 2006 and 2016 data identified maternal short stature (height less than 145 cm) as a significant determinant of birthweight and of stunting. Similar findings were reported by Anuranga et al (2012) and Rannan-Eliya et al (2013).
Table 7.3 summarizes significant determinants of birth weight, stunting and wasting found through the literature review. It has been highlighted that persistent and large economic inequality exists in the incidence of low birth weight. Poverty and food insecurity were identified as major amenable risk factors of low birth weight and stunting.
07Opportunities for intervention
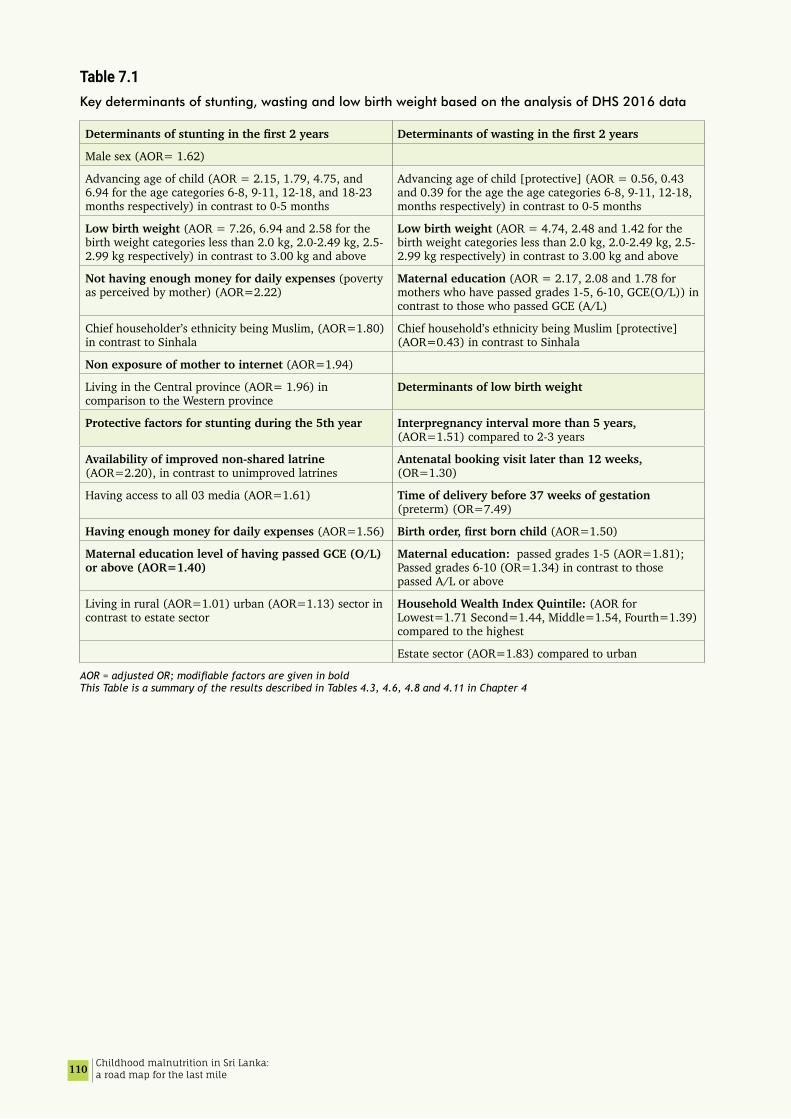
110 Childhood malnutrition in Sri Lanka: a road map for the last mile
Table 7.1Key determinants of stunting, wasting and low birth weight based on the analysis of DHS 2016 data
Determinantsofstuntinginthefirst2years Determinantsofwastinginthefirst2years
Male sex (AOR= 1.62)
Advancing age of child (AOR = 2.15, 1.79, 4.75, and 6.94 for the age categories 6-8, 9-11, 12-18, and 18-23 months respectively) in contrast to 0-5 months
Advancing age of child [protective] (AOR = 0.56, 0.43 and 0.39 for the age the age categories 6-8, 9-11, 12-18, months respectively) in contrast to 0-5 months
Low birth weight (AOR = 7.26, 6.94 and 2.58 for the birth weight categories less than 2.0 kg, 2.0-2.49 kg, 2.5-2.99 kg respectively) in contrast to 3.00 kg and above
Low birth weight (AOR = 4.74, 2.48 and 1.42 for the birth weight categories less than 2.0 kg, 2.0-2.49 kg, 2.5-2.99 kg respectively) in contrast to 3.00 kg and above
Not having enough money for daily expenses (poverty as perceived by mother) (AOR=2.22)
Maternal education (AOR = 2.17, 2.08 and 1.78 for mothers who have passed grades 1-5, 6-10, GCE(O/L)) in contrast to those who passed GCE (A/L)
Chief householder’s ethnicity being Muslim, (AOR=1.80) in contrast to Sinhala
Chief household’s ethnicity being Muslim [protective] (AOR=0.43) in contrast to Sinhala
Non exposure of mother to internet (AOR=1.94)
Living in the Central province (AOR= 1.96) in comparison to the Western province
Determinants of low birth weight
Protective factors for stunting during the 5th year Interpregnancy interval more than 5 years, (AOR=1.51) compared to 2-3 years
Availability of improved non-shared latrine (AOR=2.20), in contrast to unimproved latrines
Antenatal booking visit later than 12 weeks, (OR=1.30)
Having access to all 03 media (AOR=1.61) Time of delivery before 37 weeks of gestation (preterm) (OR=7.49)
Having enough money for daily expenses (AOR=1.56) Birthorder,firstbornchild(AOR=1.50)
Maternal education level of having passed GCE (O/L) or above (AOR=1.40)
Maternal education: passed grades 1-5 (AOR=1.81); Passed grades 6-10 (OR=1.34) in contrast to those passed A/L or above
Living in rural (AOR=1.01) urban (AOR=1.13) sector in contrast to estate sector
Household Wealth Index Quintile: (AOR for Lowest=1.71 Second=1.44, Middle=1.54, Fourth=1.39) compared to the highest
Estate sector (AOR=1.83) compared to urban
AOR = adjusted OR; modifiable factors are given in bold This Table is a summary of the results described in Tables 4.3, 4.6, 4.8 and 4.11 in Chapter 4

111Childhood malnutrition in Sri Lanka: a road map for the last mile
Table 7.2Summary of district level correlates of stunting which were significant at least one of the time periods concerned
District level indicator Correlation 2006 Correlation 2016 Correlation when pooled data from both time points
rho P value Rho P value rho P value
Percentage of 6-23 months children having minimum acceptable diet
-0.432 0.050 -0.302 ns -0.392 0.006
Percentage of children given deworming treatment in last 6 months
-0.409 0.065 -0.165 ns -0.294 0.045
Unmet need of family planning -0.168 ns 0.400 0.043 0.145 ns
Percentage of married women aged 15-49 years who are short (<145 cm)
0.579 0.006 (0.436)a (0.048)a 0.344 0.018
Average monthly household expenditure on food
-0.553 0.011 -0.131 ns -0.189 ns
Food ratio 0.627 0.003 0.419 0.033 0.520 <0.001
Poverty head count index 0.679 0.001 (0.626)a (0.002)a 0.367 0.012
Percentage of poor households 0.704 0.001 (0.639)a (0.002)a 0.373 0.011
Annual rainfall b -0.481 0.032 -0.074 ns -0.224 ns
Access to improved water - - -0.555 0.003 - -
Educational level of household head (% below primary)
0.776 <0.001 (0.413)a (0.07)a 0.460 0.001
Percent persons (both sexes) employed in agriculture sector
0.682 0.002 0.100 ns 0.365 0.015
Percent of females in labour force 0.570 0.014 0.085 ns 0.253 0.098
Percent of females in agriculture sector 0.703 0.001 0.053 ns 0.353 0.019
Percent of females in Service sector -0.618 0.006 -0.091 ns -0.325 0.031a Correlation of some indicators became significant when the districts in the Northern province were excluded, and only in such instances the rho and p are given in parenthesis b Correlation was found significant for wasting but not for stunting This Table gives a summary results of correlational analyses described in Tables 5.3 to 5.6 in Chapter 5
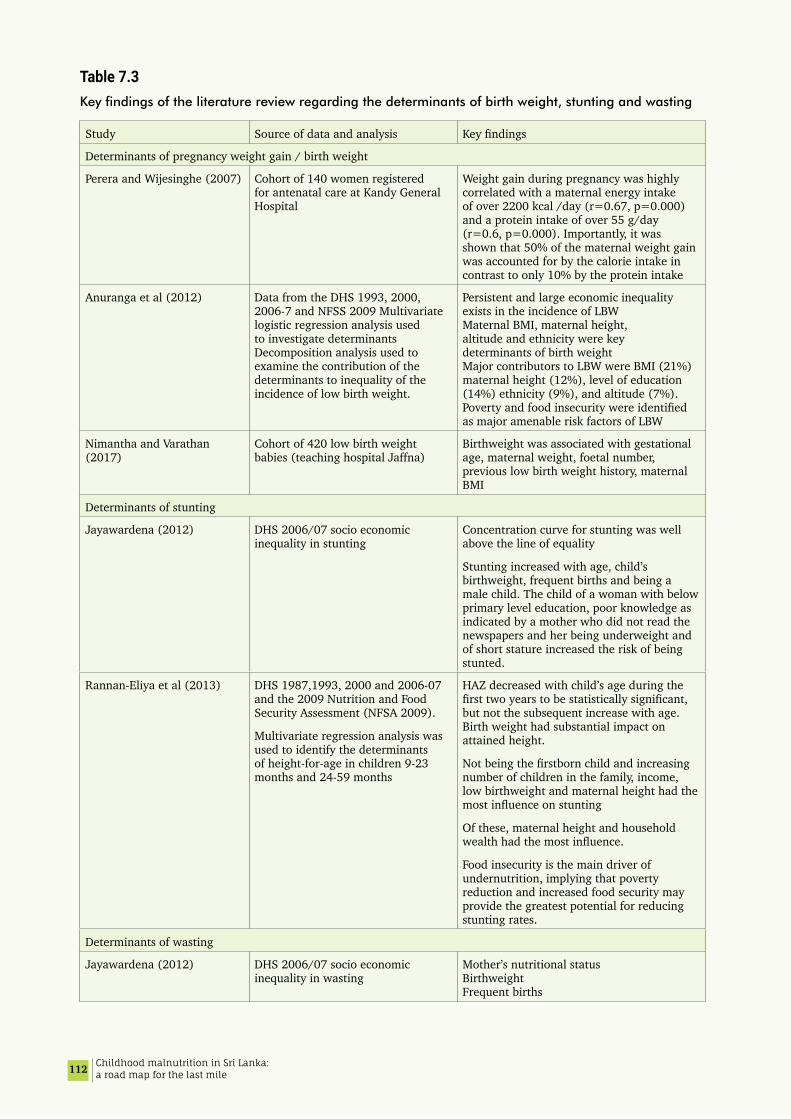
112 Childhood malnutrition in Sri Lanka: a road map for the last mile
Table 7.3Key findings of the literature review regarding the determinants of birth weight, stunting and wasting
Study Source of data and analysis Key findings
Determinants of pregnancy weight gain / birth weight
Perera and Wijesinghe (2007) Cohort of 140 women registered for antenatal care at Kandy General Hospital
Weight gain during pregnancy was highly correlated with a maternal energy intake of over 2200 kcal /day (r=0.67, p=0.000) and a protein intake of over 55 g/day (r=0.6, p=0.000). Importantly, it was shown that 50% of the maternal weight gain was accounted for by the calorie intake in contrast to only 10% by the protein intake
Anuranga et al (2012) Data from the DHS 1993, 2000, 2006-7 and NFSS 2009 Multivariate logistic regression analysis used to investigate determinants Decomposition analysis used to examine the contribution of the determinants to inequality of the incidence of low birth weight.
Persistent and large economic inequality exists in the incidence of LBW Maternal BMI, maternal height, altitude and ethnicity were key determinants of birth weight Major contributors to LBW were BMI (21%) maternal height (12%), level of education (14%) ethnicity (9%), and altitude (7%). Poverty and food insecurity were identified as major amenable risk factors of LBW
Nimantha and Varathan (2017)
Cohort of 420 low birth weight babies (teaching hospital Jaffna)
Birthweight was associated with gestational age, maternal weight, foetal number, previous low birth weight history, maternal BMI
Determinants of stunting
Jayawardena (2012) DHS 2006/07 socio economic inequality in stunting
Concentration curve for stunting was well above the line of equality
Stunting increased with age, child’s birthweight, frequent births and being a male child. The child of a woman with below primary level education, poor knowledge as indicated by a mother who did not read the newspapers and her being underweight and of short stature increased the risk of being stunted.
Rannan-Eliya et al (2013) DHS 1987,1993, 2000 and 2006-07 and the 2009 Nutrition and Food Security Assessment (NFSA 2009).
Multivariate regression analysis was used to identify the determinants of height-for-age in children 9-23 months and 24-59 months
HAZ decreased with child’s age during the first two years to be statistically significant, but not the subsequent increase with age. Birth weight had substantial impact on attained height.
Not being the firstborn child and increasing number of children in the family, income, low birthweight and maternal height had the most influence on stunting
Of these, maternal height and household wealth had the most influence.
Food insecurity is the main driver of undernutrition, implying that poverty reduction and increased food security may provide the greatest potential for reducing stunting rates.
Determinants of wasting
Jayawardena (2012) DHS 2006/07 socio economic inequality in wasting
Mother’s nutritional status Birthweight Frequent births

113Childhood malnutrition in Sri Lanka: a road map for the last mile
7.2 Recommendations
Based on the findings of the analysis, review of literature and information from the qualitative inquiry, we suggest the following opportunities for intervention, which are presented under the following headings:
A. Interventions through the health sector (mostly direct nutrition interventions)
B. Interventions through other sectors (mostly indirect nutrition interventions
C. Research priorities
7.2.1 Interventions through the health sectorRecommendations focussed on birth weight Birthweight is the most important modifiable predictor of malnutrition in Sri Lanka. Based on the expected median on the CHDR, the median birth weight of Sri Lanka DHS 2016, and other studies (Attanayake et al. 2018), our analysis estimated the effect of birthweight less than 3000g on stunting and wasting. The results indicated that even those with a birth weight 2.50-2.99 kg had a higher risk for stunting (OR=2.58) and wasting (OR=1.42). Figures 4.3 and 4.4 illustrates the projected decline in stunting and wasting if birth weight is improved.
Recommendation 1The focus on birthweight should be shifted from 2500 g to 3000 g. An analysis of nutrition month data (Table 3.8) shows that improving birthweight would be possible if a large majority of mothers achieved the recommended weight gain irrespective of their BMI at booking visit. Achieving the desired birth weight is more feasible when the prepregnant BMI was normal. Ramachandra (2016) and Guruge et al. (2018) have demonstrated interventions that may be scaled up to achieve this increase (Refer Table 3.10).
Recommendation 2Measures should be taken to help women achieve a pre-pregnancy BMI of ≥18 kgm-2 and that the majority of pregnant women achieve the recommended weight gain in pregnancy.
Towards this end it is recommended that:
• The nutrition components in the pre-pregnancy care and maternal care packages are strengthened.
• Protocols to optimise pre-pregnancy BMI and weight gain during pregnancy be made available.
• Women at risk of low birthweight be identified in the pre-pregnancy and early in the antenatal period so that extra attention and supplementation could be provided. Characteristics identified as increasing the risk of low birth weight are: birth interval over 5 years, antenatal booking visit later than 12 weeks, women with low educational attainment and of low socioeconomic backgrounds. Literature identifies women with a height less than 145 cm, living in high altitude, Tamil ethnicity and previous history of low birthweight as having an increased risk of low birthweight delivery.
• Ensure optimum spacing between children, avoid prolonged interpregnancy interval and address the issue of unmet need of family planning.
• Promote early registration for antenatal care.
Recommendation 3 Minimise preterm births Since preterm delivery is strongly associated with low birth weight, every effort must be taken to minimise preterm deliveries and help the foetus grow uncompromised up to 38-40 weeks. We recommend that interventions needed to minimise preterm deliveries be identified in consultation with the College of Obstetricians and Gynaecologists. Methodologies for implementation of identified interventions, training and necessary tools and systems for monitoring and evaluation be developed.
Recommendation 4Address nutritional needs during the secondary growth spurt through special programs. Maternal short stature (height less than 145 cm) is a significant determinant of low birthweight and parental height is a predictor of adult height of children. As such we recommend that programs be developed and implemented to optimise the secondary growth spurt in both girls and boys. Improving the mid-day meal programme is suggested as one area of action.
114 Childhood malnutrition in Sri Lanka: a road map for the last mile
Recommendation 5Help women achieve optimum BMI postpartumTaking into consideration the increasing prevalence of overweight observed in women with increasing age reported in the DHS 2016, NNMS 2912, NFSA 2009, (Section 3.6.1) and advise given for women towards increased weight gain, it is suggested that programs to help women to shed weight gained during pregnancy be made a part of the postnatal services provided. Healthy Life Style Centres may be utilised for this purpose while progress could be actively monitored by the PHM.
Recommendations focussed on feeding practices
Recommendation 6 infant and young child feeding practices be further improved •Community-oriented,tailoredinterventionsforIYCFMalnutrition and poverty both are unevenly distributed within districts and even within a Divisional Secretary division or MOH area. Sometimes these pockets of malnutrition form subcultures within the larger identity of the district or sector. It may be that the national programmes have come to a point that further benefits can only be gained through locally designed and customized interventions. Furthermore; overall community structure, lifestyles, technologies, and markets have changed rapidly in the country especially in urban settings.
In these circumstances, the flexibility and opportunity to adapt innovative approaches to suit the community served should be promoted within the overarching framework of the national guidelines.
•StrengthenIYCFtrainingandeducationalprogrammesDuring IYCF training and educational sessions the following areas need to be highlighted.
• Reduce the practice of feeding formula milk by promoting and providing active support for breastfeeding. This is important with special reference to working women who should be helped to maintain lactation after resuming employment.
• Promote proper breastfeeding practices during the 2nd year, especially by avoiding the practice of breastfeeding as a comfort mechanism, which often affects adequate complementary feeding.
• Ensure a sufficient intake of foods of animal origin and iron rich food
• Enhance skills of service providers to use 24-hr dietary recall as a tool for diagnosing dietary inadequacy and form the basis for routine nutrition counselling of young children.
• Develop service provider skills necessary for the promotion of responsive feeding.
Recommendation 7 Scale up of interventions that have been shown to improve nutritional statusTable 3.10 and Section 3.9.3 identify recently published interventions that have been successful in improving birthweight and growth of U-5 children. Selected successful interventions can be considered for scaling up:.
For example, use of a family and community centred health promotion approaches that empower families with pregnant women to identify and address the potential indirect nutrition determinants of low birth weight (Guruge, 2018), and intervention on responsive feeding (Jayawickrama 2006) could be scaled-up. Workshops for mothers and care givers on breastfeeding and complementary feeding with food demonstrations by the field health staff (Rajapaksa, 2015, Sujendran 2016) could be integrated to the routine services.
Recommendation 8 Improve access to nutrition informationIt is recommended that information on healthy diets, meal plans and recipes using easily available produce in season be made available towards improving nutrition through multiple media, especially user-friendly communication platforms such as social media etc. in addition to the conventional paper-based methods. Well-designed interactive m-health interventions with voice or text messaging services could also be a potential solution.
Women who do not have access to such resources and information should be provided the services through information booths made available in the clinic settings or in the community such as through community libraries and Vidatha centres.

115Childhood malnutrition in Sri Lanka: a road map for the last mile
Recommendation 9 Making available the services of health personnel trained on nutrition /dieteticsServices of a health personnel trained on nutrition/dietetics be made available at health facilities where clinics are held for prepregnant, pregnant and postnatal mothers and children, and especially at MOH clinics for prompt attention to problems detected by the field health staff and those found resistant to interventions initiated by them.
Recommendation 10 Special efforts to reach the vulnerable•IdentifyhouseholdswithfoodinsecurityThe field staff should be trained in the use of the Household Food Insecurity Access Scale - Sri Lanka to identify families in need of additional supplementation as well as closer follow-up of nutritional status. Such families may be referred for income generating activities etc. through the Divisional or District Nutrition Committees. The tool (in Sinhala) has been validated in a Sri Lankan population (Section 3.11.5). This allows the identification of food insecure households and the severity of food insecurity categorised as mild moderate and severe. The tool will have to be translated into the Tamil language and validated for the program to be implemented nationwide.
•Identifychildrenatriskofstuntingandwastingforextraattentionandsupplementation.All LBW babies, infants of mothers with low educational status, limited access to information, low income households and households identified as food insecure and mothers working in the agricultural sector are identified as at risk and need extra attention to optimise their growth.
•Identifyfamiliesthatdonotaccessservicesregularlyanddevelopmethodologiesandspecialefforts to reach out to them.
Recommendation 11 Supervision, monitoring and evaluation of all nutrition programs for women and children delivered by the Ministry of Health and other sectors
We recommend that:• the Ministry of Health revisits the current indicators used for monitoring and evaluation with a view to identify
a comprehensive list of indicators which will include all areas of maternal and child nutrition
• the current supervision processes be updated to accommodate changes in programs that may take place
• the present national program of provision of a basket of food (poshana malla) to all pregnant women be evaluated against pregnancy weight gain and improvements in birthweights and assess its impact on maternal nutrition especially in food compromised households with a view to maximising available resources.
• the percentage of women with a low BMI at the booking visit, percentage of women who do not gain the expected weight during pregnancy and percentage low birth weight per quarter per PHM area and MOH area be included as indicators for monitoring of progress.
• the RHMIS should contain birthweight data together with length at birth and the best estimate of gestational age at birth, for every birth. It is suggested that the period of amenorrhoea on admission based on the mother’s last regular menstrual period and ultrasonography should be recorded on the bed head ticket as assessed by the Obstetrician / Senior Registrar, and the period of amenorrhea at birth derived from this entered the RHMIS.
• supervision of the measurement and recording process be strengthened to improve accuracy of data recorded. It is suggested that the accuracy of data available is validated through a representative sample of institutions serving as sentinel reporting stations where the measuring and recording process would be closely supervised and monitored
Recommendation 12 EnhanceservicedeliveryfornutritionthroughretoolingoffieldstaffThe nutrition interventions at MOH level that have been described above are very human resource intensive and it is recognised that the implementation of the above will necessitate improvements in knowledge and skills of all levels of staff of the MOH. It is recognised that enhancing nutrition services provided by the MOH would increase the workload of the PHM.
• Therefore, we recommend that roles and responsibilities of the PHM, her workload and norms, the population to be served, be reviewed with a view to identifying responsibilities that can be taken off / passed on to other field staff, so that her focus on nutrition can be improved.
116 Childhood malnutrition in Sri Lanka: a road map for the last mile
• The knowledge and skills of the PHM/PHNS/MOH for nutrition interventions through the life cycle be improved, with special attention to pre-pregnant women, pregnant women and the first 1000 days of life. This would include:
• Skills needed to monitor individual progress, identify nutritional problems and intervene promptly to arrest further deterioration and to restore the individual to his/her growth trajectory.
• Nutrition counselling skills that would enable providers to respond to individual needs taking into consideration personal preferences, socio economic and cultural circumstances etc,
• Skills necessary to use health promotion approaches towards improving maternal and child nutrition.
• An adequate number of PHMs per MOH area should receive special training in these aspects in the first instance, and later extended to include all staff.
7.2.2 Interventions through other sectors indirect nutrition interventions)
Recommendation 13 Uplift educational attainment in femalesThe importance of and improvements in health and nutrition literacy especially among young women prior to marriage, and prior to pregnancy are stressed. The feasibility of using the present school system and alternative innovative methods to involve school dropouts have to be planed.
In view of the importance of maternal education in child nutrition and health it is recommended that efforts be made to keep girls in school until the completion of the GCE A levels and be encouraged to proceed to further tertiary education.
Recommendation 14 Improve Water Sanitation and Hygienic (WaSH)
• Water sources for drinking (unprotected well/stream/river/tank/spring) should be protected from contamination due to diffused pollution and human activities
• Enhance proper purification and chlorination of water from all “unimproved” sources
• Provide funds/ technical support for latrine construction for the households that does not have improved non-shared latrines
Recommendation 15 Improve multi-sectoral nutrition programming Multisectoral nutritional programming has the potential to improve nutrition since several indirect nutrition interventions can be integrated into the action plan. Vulnerable families can be identified and tailor-made interventions could be provided through poverty alleviation and income generation programs that are operating in the area.
Thus, we suggest
• To re-energize the multi-sector district nutrition committee and assign the specific responsibilities to different stakeholders as per multi sector action plan.
• Activities be closely monitored. This coordination should be optimised at Divisional and village levels. Measures should be taken to avoid duplicating the work and overloading the PHM with non-health work.
Recommendation 16 Ensure food security and special nutrition plans during disasters
•FoodsecurityThis is an area that needs urgent national attention. Some areas that may need attention are: improvements in research and development in agriculture, enhancing adaptive capacities to climate change, resilience plans such as buffer stocks and in the short-term safety nets for the poorer segments of society. The health sector can help identify vulnerable households using validated tools so as to ensure effective targeting.
We suggest that the cost of a nutritious diet analysis carried out by the Hector Kobbekaduwa Agrarian Research and Training Institute (HARTI) be utilized to identify the extent of the food insecure populations in each district (both nutrition and calorie). This will also help identify a nutrition poverty line and a calorie poverty line. These could be used for nutrition planning.

117Childhood malnutrition in Sri Lanka: a road map for the last mile
•SpecialnutritionplansduringdisastersAt national level there is an urgent need to address the problem of having a large percentage of people who cannot afford a minimum nutritious diet or even meet their calorie requirements and the increase in such numbers in disaster situations.
Since there is a large population just above the poverty line who are likely to slip back into poverty during disaster situations and experience food insecurity, we suggest that there should be special nutrition plans for mothers and children during disasters. Such interventions should be implemented early to prevent negative impacts on nutrition.
Recommendation 17 Special focus on reducing child povertySpecial attention must be available for pregnant mothers and children under 5 years of age in poor households. Poor households may be identified using the occupational classification as described by Nanayakkara (2017) or based on any other validated criteria and special programs implemented to break the cycle of malnutrition and poverty. Although the rate of stunting is lower in the rural sector than the urban and estate sectors, the total number of stunted children are highest in the rural sector indicating the need of addressing the poverty in the rural settings.
7.2.3 Research priorities
Recommendation 18 • Currently almost all data on growth are from cross-sectional studies. This has serious limitations for the study of
the very dynamic process of growth, its determinants and failure. We identify the urgent need for longitudinal studies on all aspects of growth of children (conception up to 18 years of age) in Sri Lanka, at least over the first 1000 days of life, the first 5 years and the secondary growth spurt.
• It is also important to carryout qualitative studies to identify socio-cultural barriers and behavioural challenges to adopting proper IYCF practices, the influence of changing life styles and emerging issues in parenting etc. on nutrition of young children.
• Studies of children over 5 years have suggested that children who are classified as growing normally based on weight, may have the wrong body compositions. This needs early attention if morbidity in later life is to be avoided. As such it is necessary to study the body composition of well-nourished children under 5 years of age so that nutrition messages could be tailored to achieve optimum body composition.
• Most studies on anaemia have shown high levels of prevalence of the condition at national and subnational levels. In one study of the anaemic children 12.8% had haemoglobinopathies, 4.3% had evidence of acute infections and 52.3% were iron deficient. In the other 30.6% of anaemic children the causes of anaemia could not be ascertained. It is important to understand the underlying aetiology of anaemia in different population groups as well as the role of anaemia in malnutrition.
• Parental heights especially maternal height is another factor that affects birth weight and growth during childhood both. However, it is not a factor that can be addressed in the short term. There is paucity of data on secular trends in growth among Sri Lankans.
• We recommend that current status and determinants, of the secondary growth spurt be studied including sociological and behavioural factors that affect nutrition during this period and identify interventions aimed at optimizing gain in height during the secondary growth spurt with a special focus on increased height of girls.
• Feasibility studies and effectiveness of internet-based or mobile phone-based communications that are aiming to improve nutrition outcomes or related behaviour should be investigated through interventional studies

118 Childhood malnutrition in Sri Lanka: a road map for the last mile
Acknowledgements
The following officials and organizations are acknowledged
• Dr. Anil Jasinghe, Director General of Health Services, Ministry of Health, Nutrition and Indigenous Medicine
• Dr. Angela De Silva, Regional Adviser - Nutrition and Health for Development, WHO SEARO
• Dr.Nilmini Hemachandra, and Dr Virginie Mallawarachchi - World Health Organization, Sri Lanka
• Dr.Chithramalee de Silva, Director Maternal and Child Health, Dr. Hiranya S. Jayawickrama (CCP), Dr.Kaushalya Kasturiarachchi (CCP), Dr.Nethmini Thenuwara (CCP), Dr. Irosha Nilaweera (CCP) of the Family Health Bureau of the Ministry of Health, Nutrition and Indigenous Medicine
• Department of Census and Statistics
• Mr. Laksiri Nanayakkara, World Food Programme
• Regional Directors of Health Services - Nuwaraeliya, Hambantota, Colombo, Kalmunai, Kilinochchi, and Ratnapura RDHS areas
• Medical Officers Maternal and Child Health - Nuwaraeliya, Hambantota, Colombo, Kalmunai, Kilinochchi, and Ratnapura RDHS areas
• Regional Manager, Plantation Human Development Trust Nuwara Eliya
• General Manager and Assistant Manager Welfare, and PHM Mahagastota– Pedro Estate, Nuwara Eliya
• Medical Officers of Health – Weeraketiya, Tissamaharama, Kalmuanai South, Kilinochchi, Embilipitiya, and Pitakotte
• RSPHNO Nuwara Eliya andRSPHNO Hambantota, PHNS Lindula
• Public Health Midwives of Weeraketiya, Tissamaharama, Kalmuanai, Kilinochchi, Embilipitiya, Pitakotte
• Divisional Secretaries of Embilipitiya, Kalmunai
• District Secretary Ampara
• World Vision Lanka – Ms Dilka Peiris and Mr. Raveendran, Kilinochchi Office
• Department of Agriculture - Kilinochchi and Kalmunai
119Childhood malnutrition in Sri Lanka: a road map for the last mile
References
1. Agampodi, T., Chathurani, H. and Agampodi, S., (2013). Infant feeding behaviors in Nuwaragam-Palatha-Central (NPC) Medical Officer of Health (MOH) area; a qualitative study. Anuradhapura Medical Journal, 6(1), p.33. DOI:http://doi.org/10.4038/amj.v6i1.5767
2. Anuranga, C., Wickramasinghe, R., Rannan-Eliya, R., Hossain, S. M. M., & Abeykoon, A. T. P. L. (2012). Trends, inequalities and determinants of low birth weight in Sri Lanka. Ceylon Medical Journal, 57(2).
3. Attanayake K, Munasinghe S, Goonewardene M, Widanapathirana P, Sandeepani I,
Available at: http://www.ips.lk/talkingeconomics/2019/03/18/alleviating-poverty-in-sri-lanka-take-a-broader-look-at-poverty-measures/
4. Average height for women, 2016. Available at: http://www.averageheight.co/average-female-height-by-country. Accessed 1st March 2019.
5. Barker, D.J.P. (1995). Fetal origins of coronary heart disease, British Medical Journal, vol 311, pp. 171-174.
6. Barker, D.J.P., Winter, P.D., Osmond, C., Margetts, B., and Simmonds, S.J., (1989). Weight in infancy and death from ischaemic heart disease, Lancet, vol 2, pp. 577-580.
7. de Onis M, Borghi E, Arimond M, Webb P, Croft T, Saha K et al. Prevalence thresholds for wasting, overweight and stunting in children under 5 years. Public Health Nutrition. 2018; 1–5. doi:10.1017/S1368980018002434.
8. De Silva, JKMC., Wickramasooriya, KP., Alahakoone, KS., 1992. Study on low birth weight and neonatal morbidity and mortality.
9. De Silva, N., Wijerathna, K., Kahatapitiya, S., Silva, P., Herath, I.,Perera, R. and Gunawardena, S. (2015) Factors associated with growth faltering in Sri Lankan infants; A case-control study in selected child welfare clinics in Sri Lanka. Journal of the Postgraduate Institute of Medicine. (2) pp.E19:1–E19:9.
10. Department of Census and Statistics (2008). Household Income and Expenditure Survey, 2006/7 (HIES 2006). Department of Census and Statistics, Ministry of Finance and Planning Sri Lanka.
11. Department of Census and Statistics (2012). Census of Population and Housing Sri Lanka 2012
12. Department of Census and Statistics (2017). Poverty indicators – Household Income and Expenditure Survey 2016. Available at http://www.statistics.gov.lk/poverty/Poverty%20Indicators_2016.pdf
13. Department of Census and Statistics (2018). Household Income and Expenditure Survey, 2016 (HIES 2016). Department of Census and Statistics, Ministry of National Policies and Economic Affairs Sri Lanka.
14. Department of Census and Statistics and Ministry of Health, Nutrition and Welfare (2001). Sri Lanka demographic and health survey 2000(DHS 2000). Colombo, Sri Lanka, 2001.
15. Department of Census and Statistics and Ministry of Health, Nutrition and Indigenous Medicine. (2008). Sri Lanka Demographic and Health Survey 2006-7 (DHS 2006).
16. Department of Census and Statistics and Ministry of Health, Nutrition and Indigenous Medicine. (2017). Sri Lanka Demographic and Health Survey 2016 (DHS 2016).
17. Department of Census and Statistics Sri Lanka. (2017). Statistical data sheet 2017. http://www.statistics.gov.lk
18. Department of Census and Statistics, Ministry of Finance, Planning, Ethnic Affairs and National Integration. (1995). Sri Lanka demographic and health survey 1993(DHS 1993). Colombo, Sri Lanka
19. European Commission. (2017). Sri Lanka: Trend, projection and targets in the prevalence and number of children (under-five) stunted. Available at https://ec.europa.eu/europeaid/sites/devco/files/sri_lanka_2018_child_stunting_trends.pdf
20. Family Health Bureau. (2014). Annual report of the family health bureau, 2014.
21. Family Health Bureau. (2017). National Statistics. http://fhb.health.gov.lk. Accessed 01-10-2017
22. Global Food Security Index. (2016). Available at: http://foodsecurityindex.eiu.com/Country/Details#Sri%20Lanka.
23. Global Hunger Index (2018). Available at https://www.globalhungerindex.org/index.php
24. Guruge NDG, Dharmaratne SD, Gunathunga MW. (2018). Effectiveness of a ‘health promotional’ intervention in enabling lay communities to change determinants of low birth weight. Sri Lanka Journal of Child Health; 47:1-233-241

120 Childhood malnutrition in Sri Lanka: a road map for the last mile
25. Jayatissa R, Fernando DN, De Silva H. (2017). National Nutrition and Micronutrient Survey of Pregnant Women in Sri Lanka 2014 (NNMS Pregnant Women 2014). Medical research Institute, UNICEF and WFP.
26. Jayatissa R., Hossaine S.M.M. (2010). Nutrition and Food Security Assessment in Sri Lanka, 2009 (NFSA 2009). Colombo, Sri Lanka: Medical Research Institute, UNICEF and World Food Programme.
27. Jayatissa, R., Gunathilaka, M. M., & Fernando, D. N. (2012b). National nutrition and micronutrient survey, 2012 (NNMS 2012). Medical Research Institute.
28. Jayatissa, R., Gunathilaka, M.M. and Fernando, D.N. (2014) National Nutrition and Micronutrient Survey. Part II: Iron, Zinc and calcium deficiency among children aged 6-59 months.
29. Jayatissa, R., Hossain, M., Nanayakkara, L. (2012a) Assessment of Nutritional status and associated factors in Northern Province. Ministry of Health Sri Lanka.
30. Jayatissa R, Fernando DN, Herath H, Jayawadana R (2017). National Nutrition Survey of Lactating Women in Sri Lanka 2015 (NNS Lactating Women 2015). Medical research Institute, UNICEF and WFP.
31. Jayawardena, P. (2012). Socio-economic determinants and inequalities in childhood malnutrition in Sri Lanka. Well-Being and Social Policy Journal, 8(1), 1-22.
32. Jayawickrama, H.S. (2006). Impact of responsive feeding on feeding behaviour and growth of young children, 2006, MD Thesis submitted to the Post Graduate Institute of Medicine, University of Colombo, Sri Lanka.
33. Jeyakumaran D. (2012) Complementary Feeding Practices and Associated Factors among Infants and Young Children in the Medical Officer of Health area Sandilipay. MSc in Community Medicine Dissertation. Post graduate Institute of Medicine, University of Colombo, Sri Lanka.
34. Lanerolle et al (2018). Desk review of IYCF practices in Sri Lanka from 2006-2017
35. Malkanthi, R. L. D. K., Silva, K. D. R. R., Chandrasekera, G. A. P., & Jayasinghe, J. M. U. K. (2007). High prevalence of malnutrition and household food insecurity in the rural subsistence paddy farming sector.
36. Marsh, D.R., Schroeder, D.G., Dearden, K.A., Sternin, J. and Sternin, M. 2004. The power of positive deviance. BMJ, 329(7475), pp.1177-1179.
37. Ministry of Health, Nutrition and Indigenous Medicine. (2015). Annual Health Bulletin 2015. MOHNIM, Colombo
38. Ministry of Health, Nutrition and Indigenous Medicine, World Health Organization (2015). Non-communicable disease risk factor survey, Sri Lanka (STEPS 2015).
39. Ministry of Plan Implementation. National nutritional survey 1977-78 (resurvey). Colombo, Sri Lanka; 1979 (and additional analysis).
40. Ministry of Plan Implementation. Sri Lanka demographic and health survey 1987. Demographic and Health Surveys. Colombo, Sri Lanka, 1987.
41. Medical Research Institute, Ministry of Health, Nutrition and Indigenous Medicine. (2017). Nutritional status, dietary practices and pattern of physical activity among school children 6 -12 years, 2017.
42. Nanayakkara, W. (2017). Talking economics. Status of Poverty in Sri Lanka Based on Different Poverty Lines. Available at http://www.ips.lk/talkingeconomics/2017/03/30/status-of-poverty-in-sri-lanka-based-on-different-poverty-lines
43. Nanayakkara, W. (2018). A balancing act: Can Sri Lanka overcome regional income inequalities?
44. Nanayakkara, W. (2019). Alleviating poverty in Sri Lanka: Take a broader look at poverty measures.
45. Nimantha, D. J., & Varathan, N. (2017). Factors associated with low birth weight babies in Jaffna, Sri Lanka. International Research Symposium on Pure and Applied Sciences, 2017 Faculty of Science, University of Kelaniya, Sri Lanka.
46. Perera, M. P. M. S. H., & Wijesinghe, D. G. N. G. (2007). Effect of maternal third trimester energy and protein intake on pregnancy weight gain and newborn birth weight.
47. Rajapaksa S, Fernando D, Jayatissa R, Jabbar S. (2015). Improving the practices of Complementary feeding: experience from a community Based programme In Hambantota District. Ministry of Health and UNICEF Sri Lanka.
48. Rajapaksa, L.C., Arambepola, C., and Gunawardena N. (2012). Nutritional status in Sri Lanka, determinants and interventions: a desk review 2006-2011, UNICEF, June 2011. Available at https://www.res.cmb.ac.lk/community.medicine/carukshi.arambepola/index.php/pubs/nutritional-status-in-sri-lanka-determinants-and-interventions/
121Childhood malnutrition in Sri Lanka: a road map for the last mile
49. Ramachandra, S. (2016). Effectiveness of a nutrition counseling intervention for pregnant women on increasing gestational weight gain in the Kalutara district. Thesis (MD), Postgraduate Institute of Medicine, University of Colombo, 2016
50. Rannan-Eliya, R. P., Hossain, S. M. M., Anuranga, C., Wickramasinghe, R., Jayatissa, R., &Abeykoon, A. T. P. L. (2013). Trends and determinants of childhood stunting and underweight in Sri Lanka. Ceylon Medical Journal, 58(1).
51. Ruel, M. (2013). Food security and nutrition: linkages and complementarities. In The road to good nutrition (pp. 24-38). Karger Publishers.
Sanjeewa L. (2018). Gestational age and birth weight centiles of singleton babies delivered normally following spontaneous labor, in Southern Sri Lanka. Ceylon Med J. Mar 31;63(1):17-23.
52. Senarath et al 2017. Mobile phone counselling to promote infant and young child feeding practices in the plantation sector of Sri Lanka – a pilot study. South Asia Infant Feeding Research Network.
53. Senarath et al 2018. Infant and young child feeding practices in Sri Lanka: an in-depth analysis of the 2006 and 2016 Demographic and Health Surveys (unpublished data)
54. Shekar, M., Kakietek, J., Dayton Eberwein, J., & Walters, D. (2017). An investment framework for nutrition: reaching the global targets for stunting, anemia, breastfeeding, and wasting. The World Bank.
55. Sivashankar, T, Thalagala, N. (2015). The effectiveness of a homemade supplementary food in improving the weight gain of moderately acute malnourished children, aged 3 to 5 years in Kopay Medical Officer of Health area. Annual Academic Sessions of the College of Community Physicians of Sri Lanka.
56. South Asia Policy and Research Institute (SAPRI), Institute of Policy Studies (IPS), Medical Research Institute (MRI), Hector Kobbekaduwa Agrarian Research and Training Institute (HARTI), Department of Census and Statistics (DCS), and World Food Programme (WFP). National strategic review of food security and Nutrition: Towards Zero Hunger (2017).
57. Soysa, P. E., & Jayasuriya, D. S. (1975). Birth weight in Ceylonese. Human biology, 1-15.
58. Stein, A. D., Wang, M., Martorell, R., Norris, S. A., Adair, L. S., Bas, I., &Victora, C. G. (2010). Growth patterns in early childhood and final attained stature: data from five birth cohorts from low‐and middle‐income countries. American Journal of Human Biology, 22(3), 353-359.
59. Sujendran, S. (2016). Effectiveness of a nutrition counseling intervention for mothers or care givers of preschool children aged 6 to 36 months, in the Eastern province of Sri Lanka. Thesis (PhD), Faculty of Medicine, University of Colombo, 2016
60. The World Bank. (2012). Baseline survey to assess the nutritional status among children under 5 years old and pregnant and lactating mothers in the Northern Province (Unpublished data) (2012)
61. The World Bank. (2017a). Multisectoral Nutritional Assessment in Sri Lanka’s Estate Sector. (MNAES 2014) The World Bank, Washington DC. Available at: http://documents.worldbank.org/curated/en/476951491301560797/Multisectoral-nutrition-assessment-in-Sri-Lankas-estate-sector
62. The World Bank. (2018). Improving nutrition outcomes for children in Sri Lanka’s estate sector: the positive deviance approach.
63. The World Bank. Understanding poverty in Sri Lanka. (2017b). Available at (http://www.worldbank.org/en/news/feature/2017/03/02/part1-understanding-poverty-sri-lanka.)
64. Weerasinghe, M.C. &Bandara, S. (2015). Health and socio-economic determinants of malnutrition in the planation sector of Sri Lanka. Colombo: Institute of Policy Studies.
65. WHO (2002). Infant and young child nutrition: Global strategy on infant young child feeding. 55th World Health Assembly (2002).
66. WHO (2019). Global Database on Child Growth and Malnutrition. Available at: https://www.who.int/nutgrowthdb/database/en/
67. WHO Multicentre Growth Reference Study Group (2006). WHO Child Growth Standards: Length/height-for-age, weight-for-age, weight-for-length, weight-for-height and body mass index-for-age: Methods and development. Geneva: World Health Organization, 2006
68. Wijayatilaka, H. V. B. S., & Fernando, D. N. (2014). Validation of household food insecurity access scale-Sri Lanka validation of HFIAS-SL. Journal of the College of Community Physicians of Sri Lanka, 19(2).
69. World Food Programme (WFP) and Hector Kobbekaduwa Agrarian Research and Training Institute (HARTI). Sri Lanka - Minimum Cost of Nutritious Diet (October 2013 - September 2014), (2015). Available at: https://www.wfp.org/content/sri-lanka-minimum-cost-nutritious-diet-october-2013-september-2014-october-2015
*Note: Some national surveys, the survey year and publication year are different. Therefore, the survey year is mentioned in the text.)

122 Childhood malnutrition in Sri Lanka: a road map for the last mile
Annexes
Annex 1.1 WHO cut-off values for public health significance
Annex 2.1 Focus group discussion/ in-depth interview guide used for mothers
Annex 2.2 Discussion guide for Key Informant Interviews (KII) of district/divisional level stakeholders
Annex 3.1 Frequency distribution of WHZ
Annex 3.2 Differentials of severe acute malnutrition in children aged <24 months - DHS 2016
Annex 3.3 Mean birth weight across household wealth quintiles and maternal education levels, DHS 2016
Annex 3.4 Details of poverty
Annex 4.1 Differentials of stunting in children aged <24 months - DHS 2016
Annex 4.2 Differentials of wasting in children aged <24 months - DHS 2016
Annex 4.3 Differentials and risk factors of low birth weight - SLDHS 2016
Annex 4.4 Percentage of mothers having at least 2 childbirths according to their birth intervals, 1993 to 2016
Annex 5.1 District level direct nutrition and indirect nutrition information between 2006 and 2016
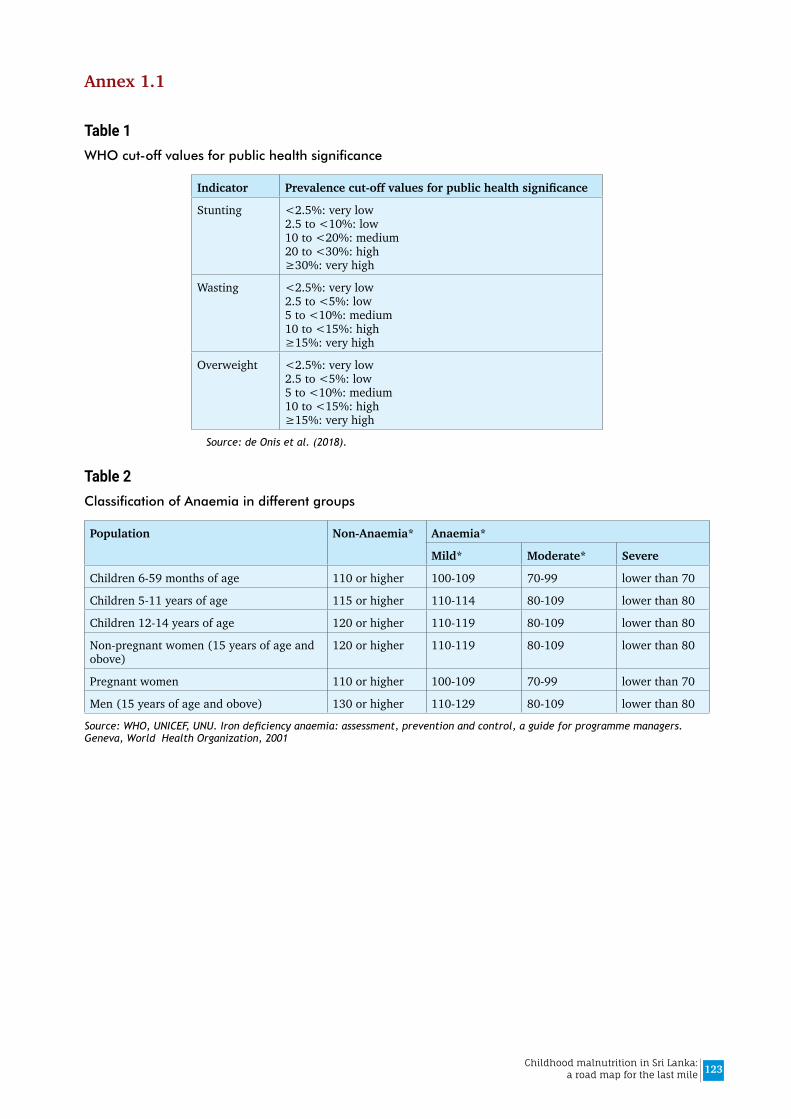
123Childhood malnutrition in Sri Lanka: a road map for the last mile
Annex 1.1
Table 1WHO cut-off values for public health significance
Indicator Prevalencecut-offvaluesforpublichealthsignificance
Stunting <2.5%: very low 2.5 to <10%: low 10 to <20%: medium 20 to <30%: high ≥30%: very high
Wasting <2.5%: very low 2.5 to <5%: low 5 to <10%: medium 10 to <15%: high ≥15%: very high
Overweight <2.5%: very low 2.5 to <5%: low 5 to <10%: medium 10 to <15%: high ≥15%: very high
Source: de Onis et al. (2018).
Table 2Classification of Anaemia in different groups
Population Non-Anaemia* Anaemia*
Mild* Moderate* Severe
Children 6-59 months of age 110 or higher 100-109 70-99 lower than 70
Children 5-11 years of age 115 or higher 110-114 80-109 lower than 80
Children 12-14 years of age 120 or higher 110-119 80-109 lower than 80
Non-pregnant women (15 years of age and obove)
120 or higher 110-119 80-109 lower than 80
Pregnant women 110 or higher 100-109 70-99 lower than 70
Men (15 years of age and obove) 130 or higher 110-129 80-109 lower than 80
Source: WHO, UNICEF, UNU. Iron deficiency anaemia: assessment, prevention and control, a guide for programme managers. Geneva, World Health Organization, 2001

124 Childhood malnutrition in Sri Lanka: a road map for the last mile
Annex 2.1
Focus group discussion/ in-depth interview guide used for mothers Introduction:
Good morning/afternoon.
Proper nutritional practices are important for child’s growth and development. We’re interested in your experience as a mother and how you support a growing, healthy child. The information that you give would be kept strictly confidential and your health care providers would not know. Before we start, I would like to remind you that there are no right or wrong answers in this discussion.
1.Couldyouexplainbrieflyaboutyourfamily?(Thisisanopeningforthediscussion)Probes:
i. How many people are there in your family? Who are they?
ii. Who works in your family and where do they work?
2.Canyoutellmeabouthowyoufedyourchildfrombirthuntilnow?Probes:
This is a brief overview at the beginning
i. What was given just after birth?
ii. How many months of breastfeeding? How many months of exclusive breastfeeding?
iii. At what age solid/semisolid foods were introduced? What was given first?
iv. How was solid/semisolid foods feeding improved?
v. What is the current feeding status? (only breastmilk/ breastmilk and water only / breastmilk and water-based liquids only/ other milks/ solid, semisolid or soft food)
3. Breastfeeding practices of mothers, barriers and methods of overcoming the problems Probes:
i. What was the first feed that you gave your child immediately after birth? Why?
ii. Where did you receive the initial knowledge about breastfeeding?
iii. Did/ do you breastfed your youngest child? If not, why?
iv. When did you start to breast feed your child?
v. If you breastfed your child, Could you explain to me about who (husband/ family / peers/ health workers) helped you to continue breastfeeding successfully?
vi. If breastfed your child, How long have you breastfed?
vii. What factors help you to continue breastfeeding successfully? What were the mechanisms you continue getting such support?
viii. What factors prevented you from continuing breastfeeding successfully? What were the solutions you used?
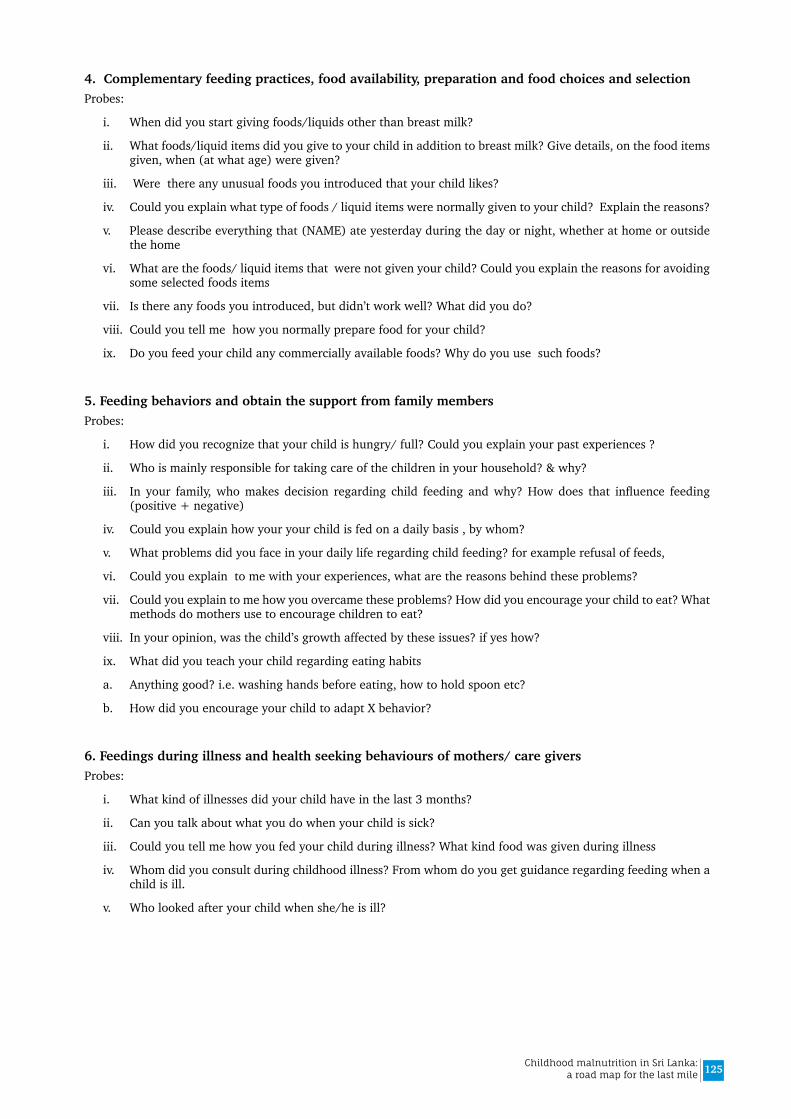
125Childhood malnutrition in Sri Lanka: a road map for the last mile
4. Complementary feeding practices, food availability, preparation and food choices and selection Probes:
i. When did you start giving foods/liquids other than breast milk?
ii. What foods/liquid items did you give to your child in addition to breast milk? Give details, on the food items given, when (at what age) were given?
iii. Were there any unusual foods you introduced that your child likes?
iv. Could you explain what type of foods / liquid items were normally given to your child? Explain the reasons?
v. Please describe everything that (NAME) ate yesterday during the day or night, whether at home or outside the home
vi. What are the foods/ liquid items that were not given your child? Could you explain the reasons for avoiding some selected foods items
vii. Is there any foods you introduced, but didn’t work well? What did you do?
viii. Could you tell me how you normally prepare food for your child?
ix. Do you feed your child any commercially available foods? Why do you use such foods?
5. Feeding behaviors and obtain the support from family members Probes:
i. How did you recognize that your child is hungry/ full? Could you explain your past experiences ?
ii. Who is mainly responsible for taking care of the children in your household? & why?
iii. In your family, who makes decision regarding child feeding and why? How does that influence feeding (positive + negative)
iv. Could you explain how your your child is fed on a daily basis , by whom?
v. What problems did you face in your daily life regarding child feeding? for example refusal of feeds,
vi. Could you explain to me with your experiences, what are the reasons behind these problems?
vii. Could you explain to me how you overcame these problems? How did you encourage your child to eat? What methods do mothers use to encourage children to eat?
viii. In your opinion, was the child’s growth affected by these issues? if yes how?
ix. What did you teach your child regarding eating habits
a. Anything good? i.e. washing hands before eating, how to hold spoon etc?
b. How did you encourage your child to adapt X behavior?
6. Feedings during illness and health seeking behaviours of mothers/ care giversProbes:
i. What kind of illnesses did your child have in the last 3 months?
ii. Can you talk about what you do when your child is sick?
iii. Could you tell me how you fed your child during illness? What kind food was given during illness
iv. Whom did you consult during childhood illness? From whom do you get guidance regarding feeding when a child is ill.
v. Who looked after your child when she/he is ill?

126 Childhood malnutrition in Sri Lanka: a road map for the last mile
7. Formula feedings practices and associated factorsProbe:
i. If any of you have experiences to give formula feeds to your child, why was it introduced?
ii. Could you explain to me how you preparde the formula milk for your child? How did you keep the formula milk before feeding the child? For how long?
iii. Do you think that your child get enough nutrition with this milk? If not, why and what else did you provide to the child? Who influenced your decision to introduce formula feeding?
iv. What do you think about giving formula feed for children?
8. Beliefs and attitudes of mothers/ care givers regarding child nutritional practices and behaviuors Probe:
i. Could you explain to me what feeding and caring practices make your child grow well?
ii. What kind of feeding and caring practices did you change that made your child grow well? Could you explain to me why you changed?
iii. What made it difficultfor you to to adapt that behavior? What is necessary for others to use the same, to make their child grow well?
iv. In your opinion what are the positive and negative beliefs and attitudes of the community regarding child feeding?
v. Which beliefs and attitudes are most difficult to change?
vi. Who influences you regarding the beliefs and attitudes of child feeding practices?
vii. What are your attitudes about any difference in feeding between boys and girls? If so why?
9. Counselling and support obtained from health care providers/ relations and neighbours Probe:
i. Have you ever participated in any discussion regarding child feeding and nutrition with a healthcare provider?
ii. If yes, explain with whom you discussed and and what topic/s.
iii. What type of discussion/ health education/ advice from X helped you feed/care for your child better?
iv. What type of discussion/ health education/ advice advice from X helped you change any other behaviors to make your child grow better?
10. Child care practices such as feeding, teaching rhymes, stories/ songs, playing, bathing, toileting and any other activity by mother/ care givers/ family members
Probe:
i. Can you tell me about the time you spend with your child and what you do with him/her while you are caring for him/her? (Feeding, teaching rhymes, stories/ songs, playing, hygienic practices such as bathing and latrine facilities and any other activity)
ii. Besides you, with whom does your child interact with most? What do they do with the child?
iii. Could you explain to me how does your child play at home? What toys/tools, other objects are use and available at home for the child?
iv. What are the activities you are doing in your day-to-day life to make a child happy?
v. What kind of activities does your child like to do or enjoy most? Could you explain how you help your child to enjoy activities?
vi. What is the role of father/grandmother in daily activities of your child? Could you explain how they help? Tell me some examples.
vii. Do you (mother/father/grandmother) think that you are providing proper care on the daily routine activities of child? If yes how & if not why?
viii. What situations make the child unhappy?
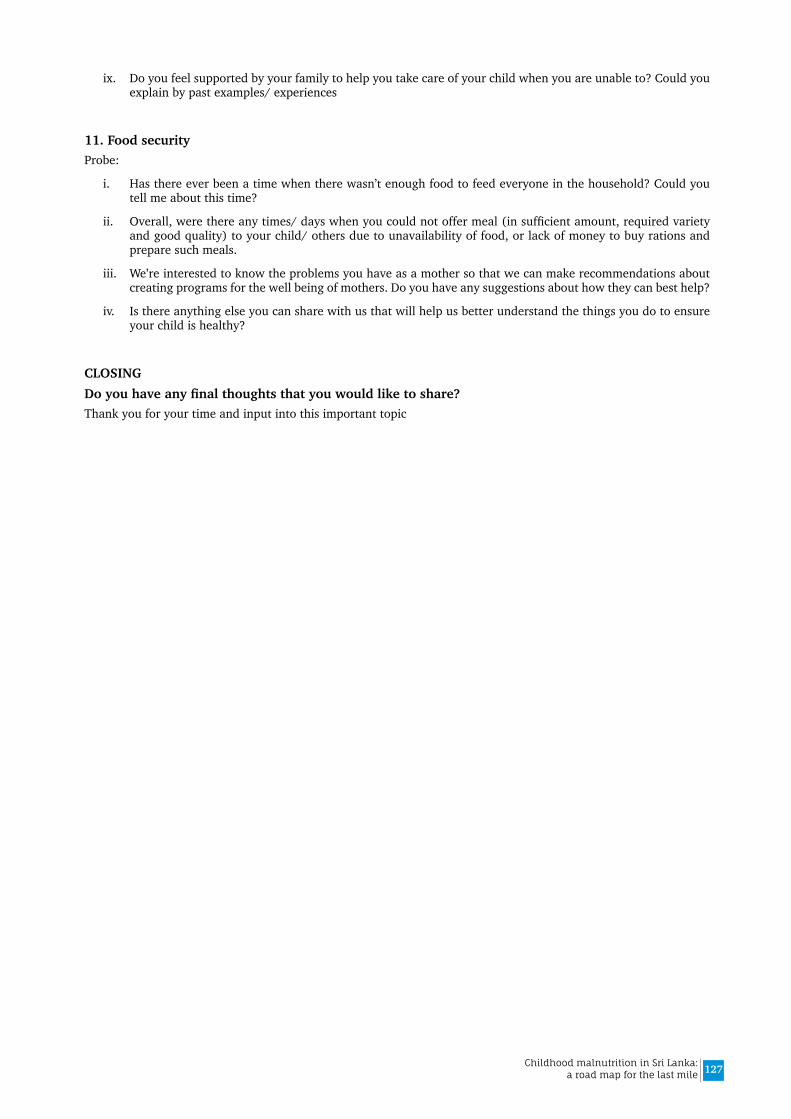
127Childhood malnutrition in Sri Lanka: a road map for the last mile
ix. Do you feel supported by your family to help you take care of your child when you are unable to? Could you explain by past examples/ experiences
11. Food security Probe:
i. Has there ever been a time when there wasn’t enough food to feed everyone in the household? Could you tell me about this time?
ii. Overall, were there any times/ days when you could not offer meal (in sufficient amount, required variety and good quality) to your child/ others due to unavailability of food, or lack of money to buy rations and prepare such meals.
iii. We’re interested to know the problems you have as a mother so that we can make recommendations about creating programs for the well being of mothers. Do you have any suggestions about how they can best help?
iv. Is there anything else you can share with us that will help us better understand the things you do to ensure your child is healthy?
CLOSINGDoyouhaveanyfinalthoughtsthatyouwouldliketoshare?Thank you for your time and input into this important topic
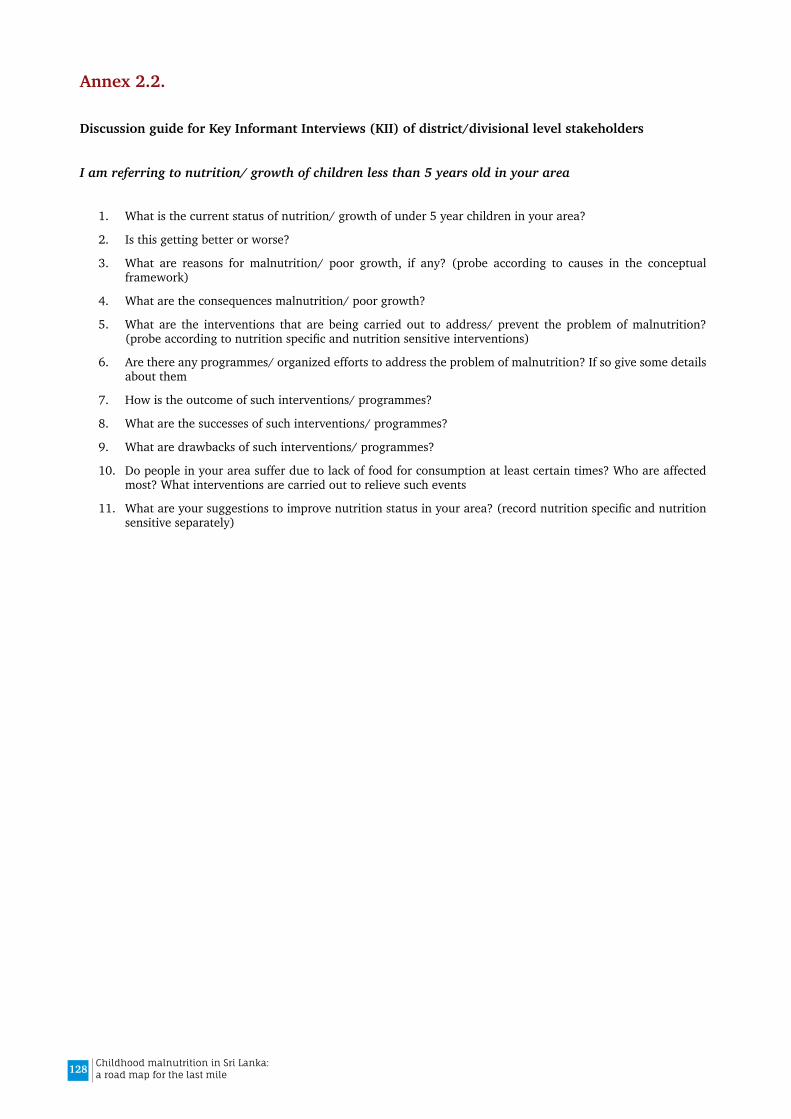
128 Childhood malnutrition in Sri Lanka: a road map for the last mile
Annex 2.2.
Discussion guide for Key Informant Interviews (KII) of district/divisional level stakeholders
I am referring to nutrition/ growth of children less than 5 years old in your area
1. What is the current status of nutrition/ growth of under 5 year children in your area?
2. Is this getting better or worse?
3. What are reasons for malnutrition/ poor growth, if any? (probe according to causes in the conceptual framework)
4. What are the consequences malnutrition/ poor growth?
5. What are the interventions that are being carried out to address/ prevent the problem of malnutrition? (probe according to nutrition specific and nutrition sensitive interventions)
6. Are there any programmes/ organized efforts to address the problem of malnutrition? If so give some details about them
7. How is the outcome of such interventions/ programmes?
8. What are the successes of such interventions/ programmes?
9. What are drawbacks of such interventions/ programmes?
10. Do people in your area suffer due to lack of food for consumption at least certain times? Who are affected most? What interventions are carried out to relieve such events
11. What are your suggestions to improve nutrition status in your area? (record nutrition specific and nutrition sensitive separately)
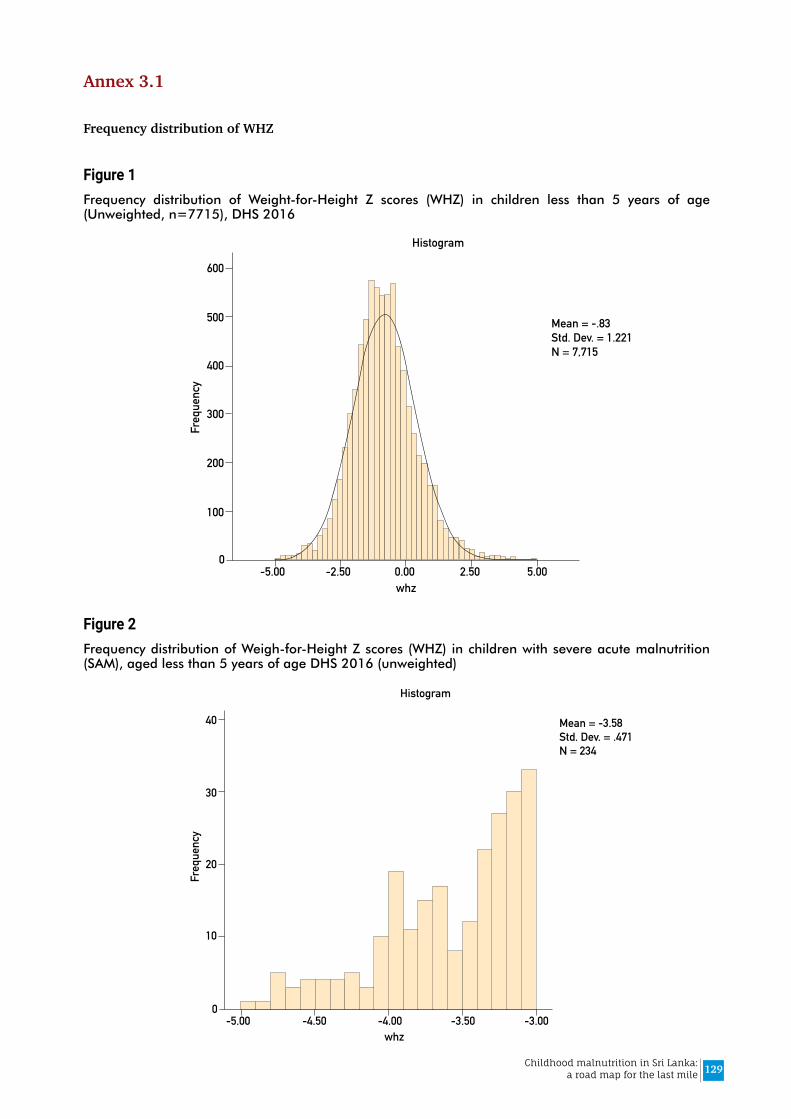
129Childhood malnutrition in Sri Lanka: a road map for the last mile
Annex 3.1
Frequency distribution of WHZ
Figure 1Frequency distribution of Weight-for-Height Z scores (WHZ) in children less than 5 years of age (Unweighted, n=7715), DHS 2016
Figure 2Frequency distribution of Weigh-for-Height Z scores (WHZ) in children with severe acute malnutrition (SAM), aged less than 5 years of age DHS 2016 (unweighted)
0-5.00 5.00-2.50 2.500.00
100
200
300
Mean = -.83Std. Dev. = 1.221N = 7,715
400
500
600
Freq
uenc
y
Histogram
whz
0-5.00 -3.00-4.50 -3.50-4.00
10
20
30
Mean = -3.58Std. Dev. = .471N = 234
40
Freq
uenc
y
Histogram
whz

130 Childhood malnutrition in Sri Lanka: a road map for the last mile
Annex 3.2.
Differentials of severe acute malnutrition (SAM), moderate acute malnutrition (MAM) and overweight in children aged <24 months - DHS 2016
Table 1Prevalence of SAM, MAM, and overweight in children aged <24 months by individual factors
WHZ Category
SAM MAM WHZ -2.00 to <0
WHZ 0 to 1.99
WHZ ≥2.0
Total
Row % Row % Row % Row % Row % Unweighted count
Column %
Age of child (months)
0-5 6.3% 11.4% 49.7% 26.8% 5.8% 537 19.5%
6-11 3.9% 12.4% 54.1% 26.4% 3.1% 730 26.3%
12-17 3.7% 11.1% 57.2% 26.6% 1.4% 737 27.2%
18-23 3.1% 8.2% 66.7% 20.9% 1.1% 746 27.0%
Sex of child
Male 4.6% 10.8% 57.5% 24.5% 2.6% 1375 49.9%
Female 3.6% 10.6% 57.5% 25.6% 2.7% 1375 50.1%
Time of delivery
<37 weeks 10.3% 13.6% 53.6% 22.0% 0.6% 131 5.0%
≥37 weeks 3.8% 10.5% 57.7% 25.2% 2.7% 2619 95.0%
Birth weight (kg)
<2.0 15.3% 14.4% 56.4% 13.8% 0.0% 68 2.5%
2.0-2.49 8.1% 14.3% 54.5% 20.6% 2.6% 328 12.3%
2.5-2.99 3.9% 11.5% 58.6% 23.0% 3.0% 1085 39.2%
3.00 & above 2.6% 8.7% 57.5% 28.6% 2.5% 1243 46.0%
Mode of delivery
Non-caesarean 4.2% 10.9% 58.7% 23.5% 2.7% 1914 69.2%
Caesarean 3.8% 10.3% 54.9% 28.5% 2.5% 836 30.8%
Maternal Age (years)
<20 7.8% 13.3% 49.3% 28.6% 1.0% 60 2.3%
20-24 2.9% 8.8% 56.3% 28.2% 3.7% 472 16.2%
25-29 5.4% 12.3% 57.5% 21.8% 3.0% 813 29.9%
30-34 3.4% 9.5% 58.4% 26.4% 2.2% 840 30.9%
35 & above 3.9% 11.3% 58.0% 24.8% 2.0% 565 20.7%
Birth order First born 4.0% 10.4% 57.1% 25.6% 2.9% 1294 47.1%
2nd or more 4.2% 11.0% 57.8% 24.5% 2.4% 1456 52.9%
Time gap from previous childbirth to present conception
<24 months 4.5% 15.1% 54.3% 23.8% 2.2% 352 13.0%
24-47 months 3.0% 11.0% 59.3% 23.2% 3.6% 590 21.0%
48-59 months 4.5% 12.3% 58.1% 22.7% 2.3% 241 8.3%
60 months and higher
4.1% 7.0% 59.0% 28.3% 1.7% 515 19.3%
single child 4.5% 10.6% 56.8% 25.3% 2.8% 1052 38.5%
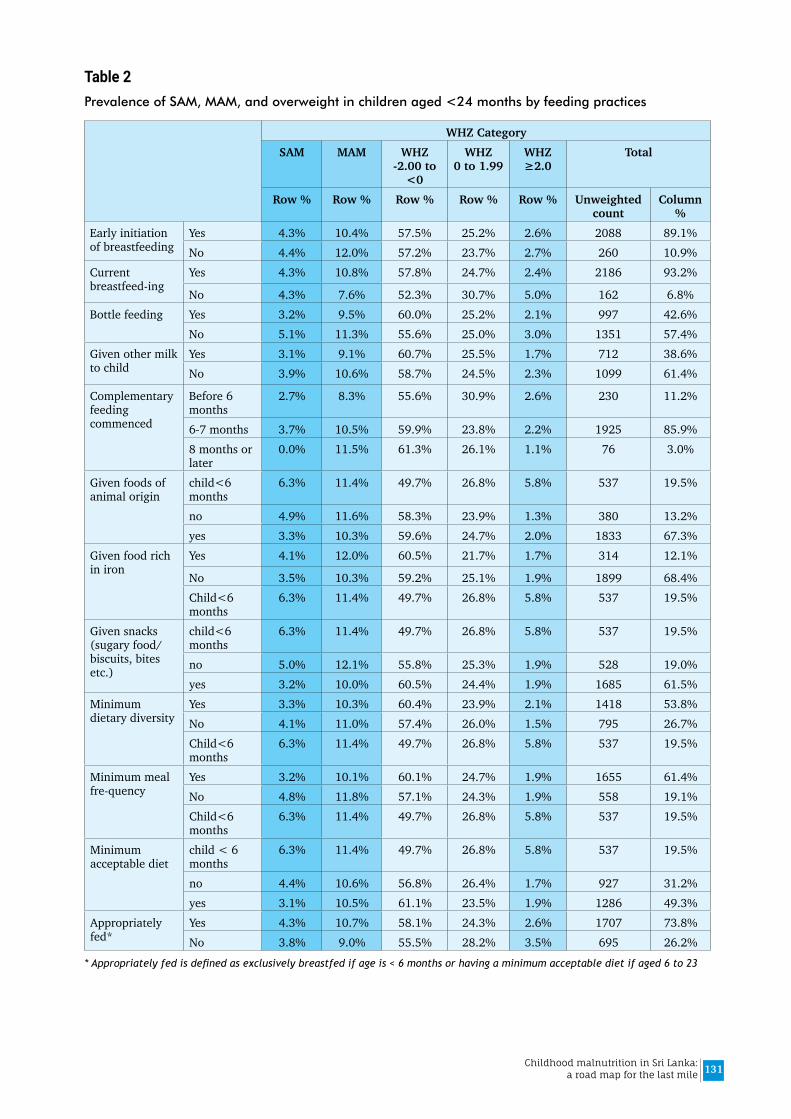
131Childhood malnutrition in Sri Lanka: a road map for the last mile
Table 2Prevalence of SAM, MAM, and overweight in children aged <24 months by feeding practices
WHZ CategorySAM MAM WHZ
-2.00 to <0
WHZ 0 to 1.99
WHZ ≥2.0
Total
Row % Row % Row % Row % Row % Unweighted count
Column %
Early initiation of breastfeeding
Yes 4.3% 10.4% 57.5% 25.2% 2.6% 2088 89.1%No 4.4% 12.0% 57.2% 23.7% 2.7% 260 10.9%
Current breastfeed-ing
Yes 4.3% 10.8% 57.8% 24.7% 2.4% 2186 93.2%
No 4.3% 7.6% 52.3% 30.7% 5.0% 162 6.8%Bottle feeding Yes 3.2% 9.5% 60.0% 25.2% 2.1% 997 42.6%
No 5.1% 11.3% 55.6% 25.0% 3.0% 1351 57.4%Given other milk to child
Yes 3.1% 9.1% 60.7% 25.5% 1.7% 712 38.6%No 3.9% 10.6% 58.7% 24.5% 2.3% 1099 61.4%
Complementary feeding commenced
Before 6 months
2.7% 8.3% 55.6% 30.9% 2.6% 230 11.2%
6-7 months 3.7% 10.5% 59.9% 23.8% 2.2% 1925 85.9%8 months or later
0.0% 11.5% 61.3% 26.1% 1.1% 76 3.0%
Given foods of animal origin
child<6 months
6.3% 11.4% 49.7% 26.8% 5.8% 537 19.5%
no 4.9% 11.6% 58.3% 23.9% 1.3% 380 13.2%yes 3.3% 10.3% 59.6% 24.7% 2.0% 1833 67.3%
Given food rich in iron
Yes 4.1% 12.0% 60.5% 21.7% 1.7% 314 12.1%
No 3.5% 10.3% 59.2% 25.1% 1.9% 1899 68.4%Child<6 months
6.3% 11.4% 49.7% 26.8% 5.8% 537 19.5%
Given snacks (sugary food/ biscuits, bites etc.)
child<6 months
6.3% 11.4% 49.7% 26.8% 5.8% 537 19.5%
no 5.0% 12.1% 55.8% 25.3% 1.9% 528 19.0%yes 3.2% 10.0% 60.5% 24.4% 1.9% 1685 61.5%
Minimum dietary diversity
Yes 3.3% 10.3% 60.4% 23.9% 2.1% 1418 53.8%No 4.1% 11.0% 57.4% 26.0% 1.5% 795 26.7%Child<6 months
6.3% 11.4% 49.7% 26.8% 5.8% 537 19.5%
Minimum meal fre-quency
Yes 3.2% 10.1% 60.1% 24.7% 1.9% 1655 61.4%No 4.8% 11.8% 57.1% 24.3% 1.9% 558 19.1%Child<6 months
6.3% 11.4% 49.7% 26.8% 5.8% 537 19.5%
Minimum acceptable diet
child < 6 months
6.3% 11.4% 49.7% 26.8% 5.8% 537 19.5%
no 4.4% 10.6% 56.8% 26.4% 1.7% 927 31.2%yes 3.1% 10.5% 61.1% 23.5% 1.9% 1286 49.3%
Appropriately fed*
Yes 4.3% 10.7% 58.1% 24.3% 2.6% 1707 73.8%No 3.8% 9.0% 55.5% 28.2% 3.5% 695 26.2%
* Appropriately fed is defined as exclusively breastfed if age is < 6 months or having a minimum acceptable diet if aged 6 to 23

132 Childhood malnutrition in Sri Lanka: a road map for the last mile
months
Table 3Prevalence of SAM, MAM, and overweight in children aged <24 months by common childhood illness
WHZ CategorySAM MAM WHZ
-2.00 to <0
WHZ 0 to 1.99
WHZ ≥2.0
Total
Row % Row % Row % Row % Row % Unweighted count
Column %
Had diarrhea past 2 weeks
Yes 6.6% 8.6% 56.4% 27.4% 1.1% 100 3.4%No 4.0% 10.7% 57.7% 24.9% 2.7% 2641 96.6%DK 0.0% 0.0% 0.0% 0.0% 0.0% 0 0.0%
Has had illness with a cough past 2 weeks
Yes 4.7% 12.5% 56.6% 23.8% 2.5% 431 16.6%No 4.0% 10.3% 57.8% 25.2% 2.7% 2310 83.4%Don't Know 0.0% 0.0% 0.0% 0.0% 0.0% 0 0.0%
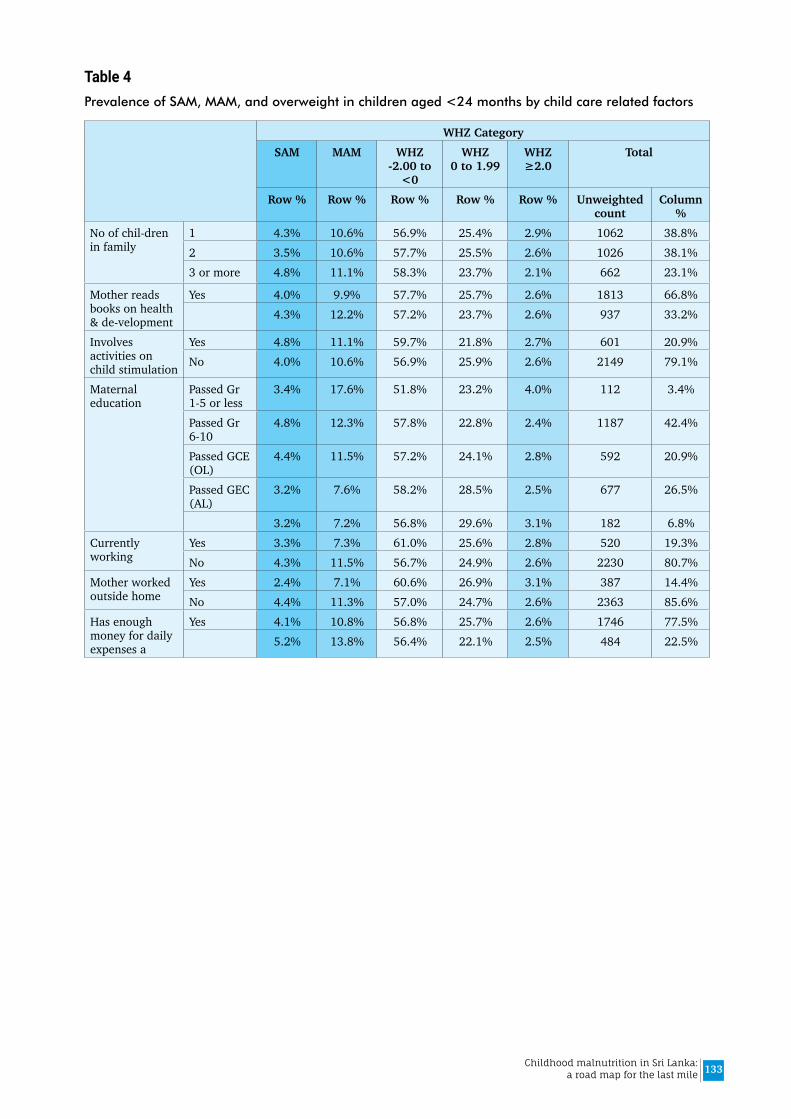
133Childhood malnutrition in Sri Lanka: a road map for the last mile
Table 4Prevalence of SAM, MAM, and overweight in children aged <24 months by child care related factors
WHZ CategorySAM MAM WHZ
-2.00 to <0
WHZ 0 to 1.99
WHZ ≥2.0
Total
Row % Row % Row % Row % Row % Unweighted count
Column %
No of chil-dren in family
1 4.3% 10.6% 56.9% 25.4% 2.9% 1062 38.8%2 3.5% 10.6% 57.7% 25.5% 2.6% 1026 38.1%3 or more 4.8% 11.1% 58.3% 23.7% 2.1% 662 23.1%
Mother reads books on health & de-velopment
Yes 4.0% 9.9% 57.7% 25.7% 2.6% 1813 66.8%4.3% 12.2% 57.2% 23.7% 2.6% 937 33.2%
Involves activities on child stimulation
Yes 4.8% 11.1% 59.7% 21.8% 2.7% 601 20.9%No 4.0% 10.6% 56.9% 25.9% 2.6% 2149 79.1%
Maternal education
Passed Gr 1-5 or less
3.4% 17.6% 51.8% 23.2% 4.0% 112 3.4%
Passed Gr 6-10
4.8% 12.3% 57.8% 22.8% 2.4% 1187 42.4%
Passed GCE (OL)
4.4% 11.5% 57.2% 24.1% 2.8% 592 20.9%
Passed GEC (AL)
3.2% 7.6% 58.2% 28.5% 2.5% 677 26.5%
3.2% 7.2% 56.8% 29.6% 3.1% 182 6.8%Currently working
Yes 3.3% 7.3% 61.0% 25.6% 2.8% 520 19.3%No 4.3% 11.5% 56.7% 24.9% 2.6% 2230 80.7%
Mother worked outside home
Yes 2.4% 7.1% 60.6% 26.9% 3.1% 387 14.4%No 4.4% 11.3% 57.0% 24.7% 2.6% 2363 85.6%
Has enough money for daily expenses a
Yes 4.1% 10.8% 56.8% 25.7% 2.6% 1746 77.5%5.2% 13.8% 56.4% 22.1% 2.5% 484 22.5%
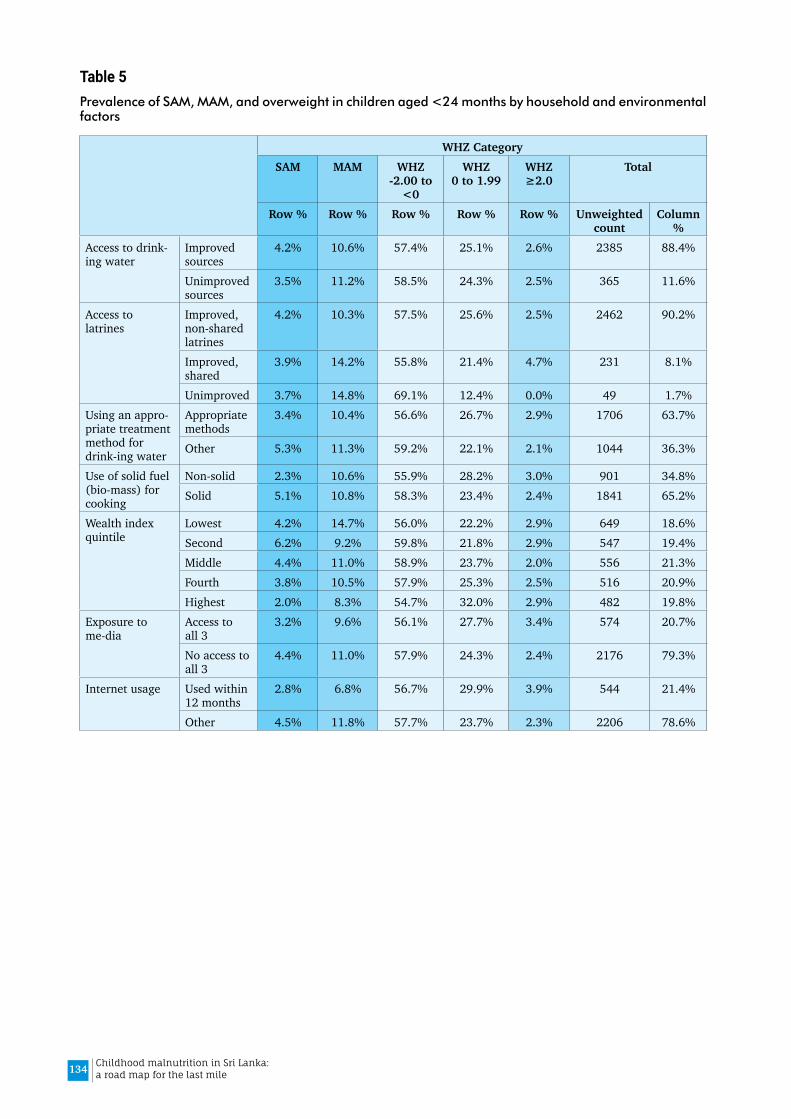
134 Childhood malnutrition in Sri Lanka: a road map for the last mile
Table 5Prevalence of SAM, MAM, and overweight in children aged <24 months by household and environmental factors
WHZ CategorySAM MAM WHZ
-2.00 to <0
WHZ 0 to 1.99
WHZ ≥2.0
Total
Row % Row % Row % Row % Row % Unweighted count
Column %
Access to drink-ing water
Improved sources
4.2% 10.6% 57.4% 25.1% 2.6% 2385 88.4%
Unimproved sources
3.5% 11.2% 58.5% 24.3% 2.5% 365 11.6%
Access to latrines
Improved, non-shared latrines
4.2% 10.3% 57.5% 25.6% 2.5% 2462 90.2%
Improved, shared
3.9% 14.2% 55.8% 21.4% 4.7% 231 8.1%
Unimproved 3.7% 14.8% 69.1% 12.4% 0.0% 49 1.7%Using an appro-priate treatment method for drink-ing water
Appropriate methods
3.4% 10.4% 56.6% 26.7% 2.9% 1706 63.7%
Other 5.3% 11.3% 59.2% 22.1% 2.1% 1044 36.3%
Use of solid fuel (bio-mass) for cooking
Non-solid 2.3% 10.6% 55.9% 28.2% 3.0% 901 34.8%Solid 5.1% 10.8% 58.3% 23.4% 2.4% 1841 65.2%
Wealth index quintile
Lowest 4.2% 14.7% 56.0% 22.2% 2.9% 649 18.6%Second 6.2% 9.2% 59.8% 21.8% 2.9% 547 19.4%Middle 4.4% 11.0% 58.9% 23.7% 2.0% 556 21.3%Fourth 3.8% 10.5% 57.9% 25.3% 2.5% 516 20.9%Highest 2.0% 8.3% 54.7% 32.0% 2.9% 482 19.8%
Exposure to me-dia
Access to all 3
3.2% 9.6% 56.1% 27.7% 3.4% 574 20.7%
No access to all 3
4.4% 11.0% 57.9% 24.3% 2.4% 2176 79.3%
Internet usage Used within 12 months
2.8% 6.8% 56.7% 29.9% 3.9% 544 21.4%
Other 4.5% 11.8% 57.7% 23.7% 2.3% 2206 78.6%
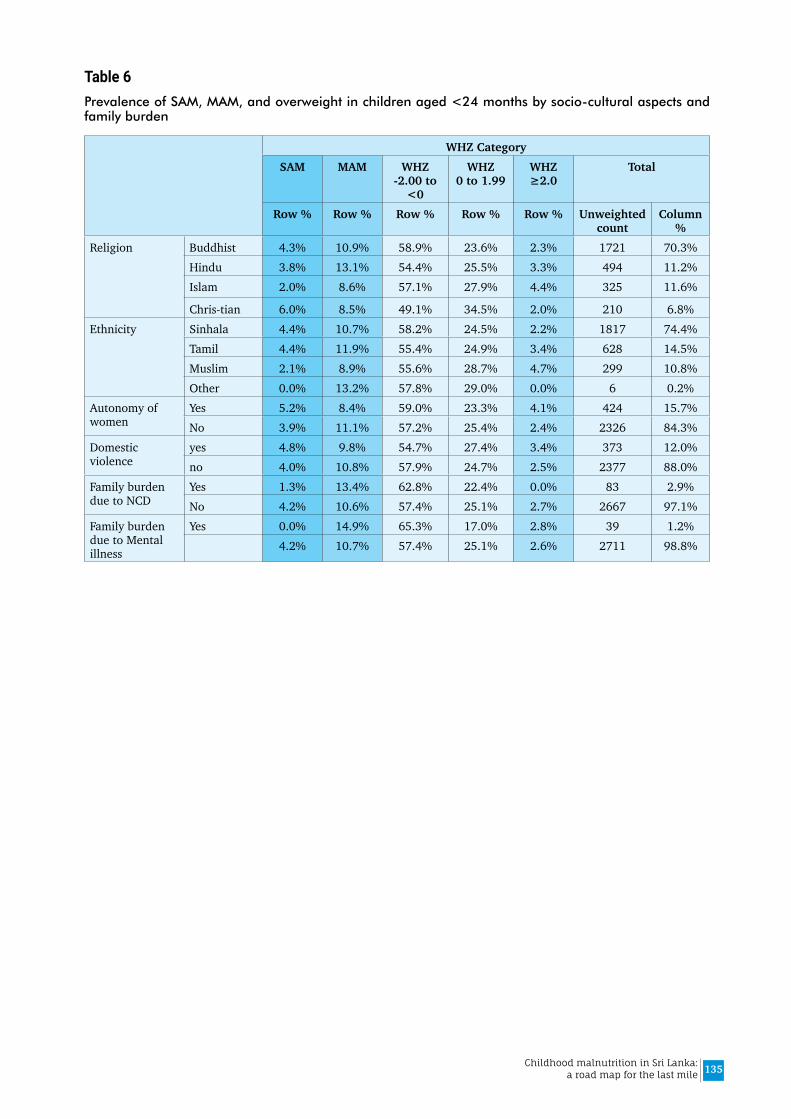
135Childhood malnutrition in Sri Lanka: a road map for the last mile
Table 6Prevalence of SAM, MAM, and overweight in children aged <24 months by socio-cultural aspects and family burden
WHZ CategorySAM MAM WHZ
-2.00 to <0
WHZ 0 to 1.99
WHZ ≥2.0
Total
Row % Row % Row % Row % Row % Unweighted count
Column %
Religion Buddhist 4.3% 10.9% 58.9% 23.6% 2.3% 1721 70.3%Hindu 3.8% 13.1% 54.4% 25.5% 3.3% 494 11.2%Islam 2.0% 8.6% 57.1% 27.9% 4.4% 325 11.6%
Chris-tian 6.0% 8.5% 49.1% 34.5% 2.0% 210 6.8%Ethnicity Sinhala 4.4% 10.7% 58.2% 24.5% 2.2% 1817 74.4%
Tamil 4.4% 11.9% 55.4% 24.9% 3.4% 628 14.5%Muslim 2.1% 8.9% 55.6% 28.7% 4.7% 299 10.8%Other 0.0% 13.2% 57.8% 29.0% 0.0% 6 0.2%
Autonomy of women
Yes 5.2% 8.4% 59.0% 23.3% 4.1% 424 15.7%No 3.9% 11.1% 57.2% 25.4% 2.4% 2326 84.3%
Domestic violence
yes 4.8% 9.8% 54.7% 27.4% 3.4% 373 12.0%no 4.0% 10.8% 57.9% 24.7% 2.5% 2377 88.0%
Family burden due to NCD
Yes 1.3% 13.4% 62.8% 22.4% 0.0% 83 2.9%No 4.2% 10.6% 57.4% 25.1% 2.7% 2667 97.1%
Family burden due to Mental illness
Yes 0.0% 14.9% 65.3% 17.0% 2.8% 39 1.2%4.2% 10.7% 57.4% 25.1% 2.6% 2711 98.8%

136 Childhood malnutrition in Sri Lanka: a road map for the last mile
Table 7Prevalence of SAM, MAM, and overweight in children aged <24 months by community factors
WHZ CategorySAM MAM WHZ
-2.00 to <0
WHZ 0 to 1.99
WHZ ≥2.0
Total
Row % Row % Row % Row % Row % Unweighted count
Column %
Residential sector
Urban 2.0% 10.0% 56.1% 28.2% 3.7% 437 15.6%Rural 4.6% 10.7% 57.9% 24.5% 2.4% 2130 80.3%Estate 3.5% 12.5% 55.7% 24.5% 3.8% 183 4.1%
Province Western 4.1% 11.5% 54.3% 27.9% 2.2% 530 25.1%Central 2.7% 7.4% 55.7% 28.3% 5.9% 350 12.4%Southern 3.2% 13.9% 59.8% 22.0% 1.1% 323 12.5%Northern 5.9% 11.4% 50.4% 30.6% 1.8% 290 4.2%Eastern 3.2% 8.2% 61.2% 24.0% 3.4% 292 9.1%North-western 3.8% 7.7% 63.6% 22.5% 2.4% 325 13.2%North-central 5.5% 12.6% 55.6% 22.6% 3.7% 204 8.0%Uva 4.7% 14.8% 55.2% 24.0% 1.3% 189 6.1%Sabaragamuwa 6.3% 10.7% 59.5% 22.1% 1.4% 247 9.4%
District Colombo 2.0% 10.3% 56.9% 27.1% 3.6% 201 9.7%Gampaha 5.2% 10.8% 49.4% 33.6% 0.9% 192 8.6%Kalutara 5.6% 14.1% 56.9% 21.5% 1.9% 137 6.8%Kandy 2.4% 6.6% 53.5% 29.7% 7.7% 174 6.6%Matale 2.2% 4.2% 69.6% 20.4% 3.6% 68 2.3%Nuwaraeliya 3.6% 11.1% 50.4% 30.9% 4.0% 108 3.5%Galle 5.4% 16.3% 53.1% 23.3% 1.9% 122 5.0%Matara 2.9% 8.8% 62.1% 25.2% 0.9% 123 4.5%Hambantota 0.0% 17.7% 67.5% 14.8% 0.0% 78 3.0%Jaffna 7.8% 12.5% 49.1% 30.1% 0.7% 71 2.2%Mannar 4.3% 6.8% 50.5% 33.0% 5.5% 51 0.4%Vavuniya 0.0% 15.8% 50.4% 32.9% 0.9% 59 0.6%Mullaitivu 3.1% 12.3% 60.0% 21.9% 2.6% 53 0.4%Killinochchi 8.1% 3.8% 47.9% 35.8% 4.4% 56 0.5%Batticaloa 2.2% 9.1% 60.5% 24.9% 3.3% 92 3.1%Ampara 3.6% 5.5% 59.7% 27.1% 4.1% 115 3.7%Trincomalee 3.9% 11.0% 64.5% 17.8% 2.7% 85 2.4%Kurunegala 2.3% 6.7% 64.5% 24.4% 2.1% 229 9.7%Puttalam 8.0% 10.4% 61.1% 17.4% 3.1% 96 3.6%Anuradhapura 8.0% 13.8% 50.8% 23.1% 4.3% 118 5.1%Polonnaruwa 1.1% 10.3% 64.3% 21.8% 2.6% 86 2.8%Badulla 2.3% 10.8% 56.8% 28.6% 1.4% 93 3.0%Monaragala 7.0% 18.9% 53.7% 19.4% 1.1% 96 3.0%Ratnapura 6.6% 10.2% 62.4% 20.8% 0.0% 153 5.9%Kegalle 5.8% 11.5% 54.6% 24.3% 3.8% 94 3.5%
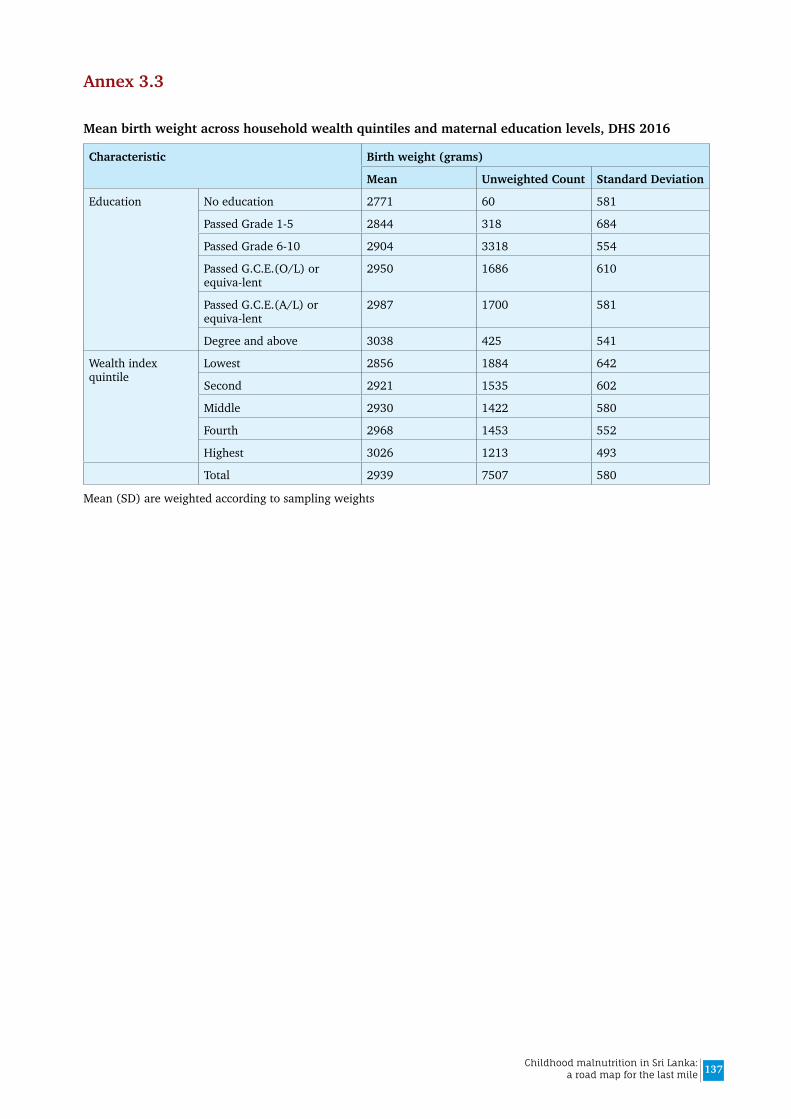
137Childhood malnutrition in Sri Lanka: a road map for the last mile
Annex 3.3
Mean birth weight across household wealth quintiles and maternal education levels, DHS 2016
Characteristic Birth weight (grams)
Mean Unweighted Count Standard Deviation
Education No education 2771 60 581
Passed Grade 1-5 2844 318 684
Passed Grade 6-10 2904 3318 554
Passed G.C.E.(O/L) or equiva-lent
2950 1686 610
Passed G.C.E.(A/L) or equiva-lent
2987 1700 581
Degree and above 3038 425 541
Wealth index quintile
Lowest 2856 1884 642
Second 2921 1535 602
Middle 2930 1422 580
Fourth 2968 1453 552
Highest 3026 1213 493
Total 2939 7507 580
Mean (SD) are weighted according to sampling weights
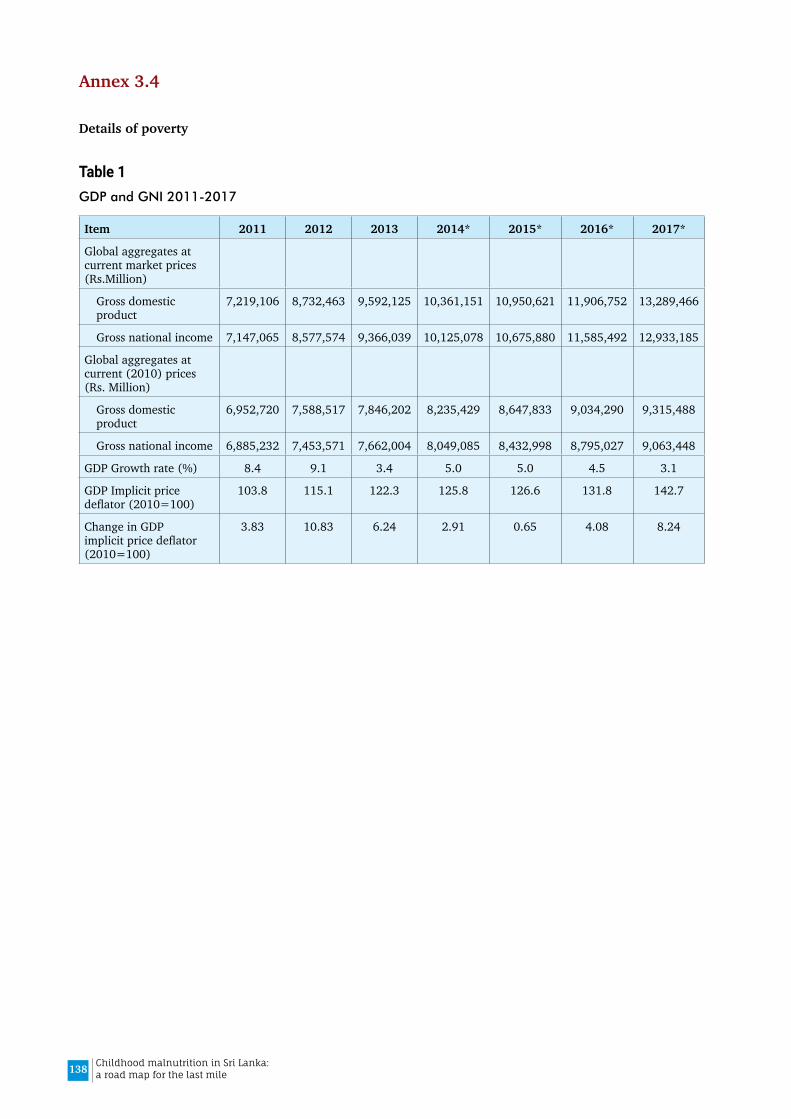
138 Childhood malnutrition in Sri Lanka: a road map for the last mile
Annex 3.4
Details of poverty
Table 1 GDP and GNI 2011-2017
Item 2011 2012 2013 2014* 2015* 2016* 2017*
Global aggregates at current market prices (Rs.Million)
Gross domestic product
7,219,106 8,732,463 9,592,125 10,361,151 10,950,621 11,906,752 13,289,466
Gross national income 7,147,065 8,577,574 9,366,039 10,125,078 10,675,880 11,585,492 12,933,185
Global aggregates at current (2010) prices (Rs. Million)
Gross domestic product
6,952,720 7,588,517 7,846,202 8,235,429 8,647,833 9,034,290 9,315,488
Gross national income 6,885,232 7,453,571 7,662,004 8,049,085 8,432,998 8,795,027 9,063,448
GDP Growth rate (%) 8.4 9.1 3.4 5.0 5.0 4.5 3.1
GDP Implicit price deflator (2010=100)
103.8 115.1 122.3 125.8 126.6 131.8 142.7
Change in GDP implicit price deflator (2010=100)
3.83 10.83 6.24 2.91 0.65 4.08 8.24
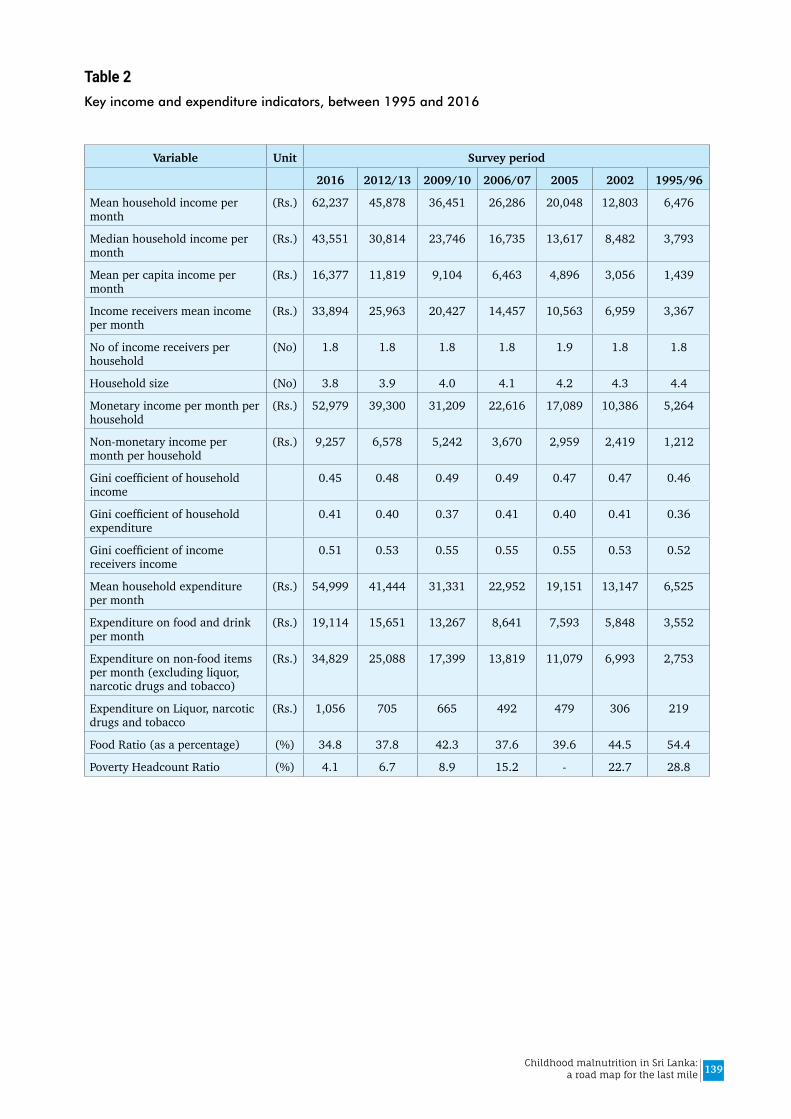
139Childhood malnutrition in Sri Lanka: a road map for the last mile
Table 2Key income and expenditure indicators, between 1995 and 2016
Variable Unit Survey period
2016 2012/13 2009/10 2006/07 2005 2002 1995/96
Mean household income per month
(Rs.) 62,237 45,878 36,451 26,286 20,048 12,803 6,476
Median household income per month
(Rs.) 43,551 30,814 23,746 16,735 13,617 8,482 3,793
Mean per capita income per month
(Rs.) 16,377 11,819 9,104 6,463 4,896 3,056 1,439
Income receivers mean income per month
(Rs.) 33,894 25,963 20,427 14,457 10,563 6,959 3,367
No of income receivers per household
(No) 1.8 1.8 1.8 1.8 1.9 1.8 1.8
Household size (No) 3.8 3.9 4.0 4.1 4.2 4.3 4.4
Monetary income per month per household
(Rs.) 52,979 39,300 31,209 22,616 17,089 10,386 5,264
Non-monetary income per month per household
(Rs.) 9,257 6,578 5,242 3,670 2,959 2,419 1,212
Gini coefficient of household income
0.45 0.48 0.49 0.49 0.47 0.47 0.46
Gini coefficient of household expenditure
0.41 0.40 0.37 0.41 0.40 0.41 0.36
Gini coefficient of income receivers income
0.51 0.53 0.55 0.55 0.55 0.53 0.52
Mean household expenditure per month
(Rs.) 54,999 41,444 31,331 22,952 19,151 13,147 6,525
Expenditure on food and drink per month
(Rs.) 19,114 15,651 13,267 8,641 7,593 5,848 3,552
Expenditure on non-food items per month (excluding liquor, narcotic drugs and tobacco)
(Rs.) 34,829 25,088 17,399 13,819 11,079 6,993 2,753
Expenditure on Liquor, narcotic drugs and tobacco
(Rs.) 1,056 705 665 492 479 306 219
Food Ratio (as a percentage) (%) 34.8 37.8 42.3 37.6 39.6 44.5 54.4
Poverty Headcount Ratio (%) 4.1 6.7 8.9 15.2 - 22.7 28.8
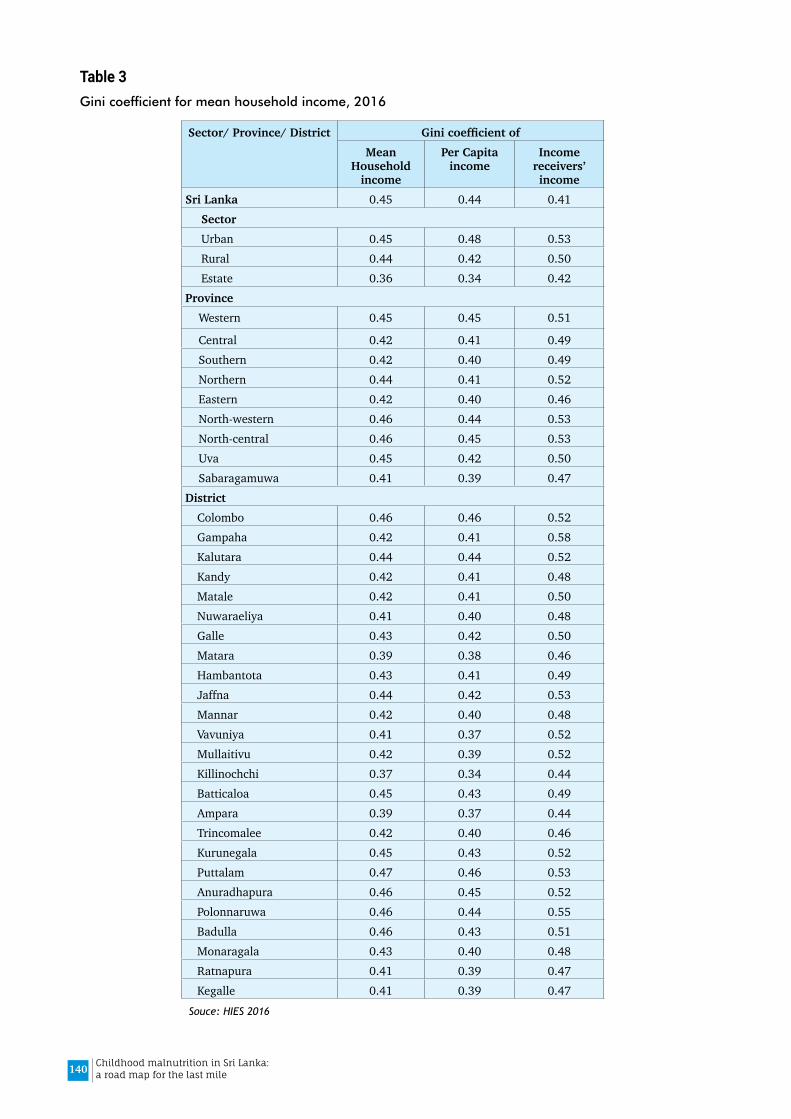
140 Childhood malnutrition in Sri Lanka: a road map for the last mile
Table 3Gini coefficient for mean household income, 2016
Sector/ Province/ District GinicoefficientofMean
Household income
Per Capita income
Income receivers’ income
Sri Lanka 0.45 0.44 0.41SectorUrban 0.45 0.48 0.53Rural 0.44 0.42 0.50Estate 0.36 0.34 0.42
ProvinceWestern 0.45 0.45 0.51
Central 0.42 0.41 0.49Southern 0.42 0.40 0.49Northern 0.44 0.41 0.52Eastern 0.42 0.40 0.46North-western 0.46 0.44 0.53North-central 0.46 0.45 0.53Uva 0.45 0.42 0.50Sabaragamuwa 0.41 0.39 0.47
District Colombo 0.46 0.46 0.52Gampaha 0.42 0.41 0.58Kalutara 0.44 0.44 0.52Kandy 0.42 0.41 0.48Matale 0.42 0.41 0.50Nuwaraeliya 0.41 0.40 0.48Galle 0.43 0.42 0.50Matara 0.39 0.38 0.46Hambantota 0.43 0.41 0.49Jaffna 0.44 0.42 0.53Mannar 0.42 0.40 0.48Vavuniya 0.41 0.37 0.52Mullaitivu 0.42 0.39 0.52Killinochchi 0.37 0.34 0.44Batticaloa 0.45 0.43 0.49Ampara 0.39 0.37 0.44Trincomalee 0.42 0.40 0.46Kurunegala 0.45 0.43 0.52Puttalam 0.47 0.46 0.53Anuradhapura 0.46 0.45 0.52Polonnaruwa 0.46 0.44 0.55Badulla 0.46 0.43 0.51Monaragala 0.43 0.40 0.48Ratnapura 0.41 0.39 0.47Kegalle 0.41 0.39 0.47
Souce: HIES 2016
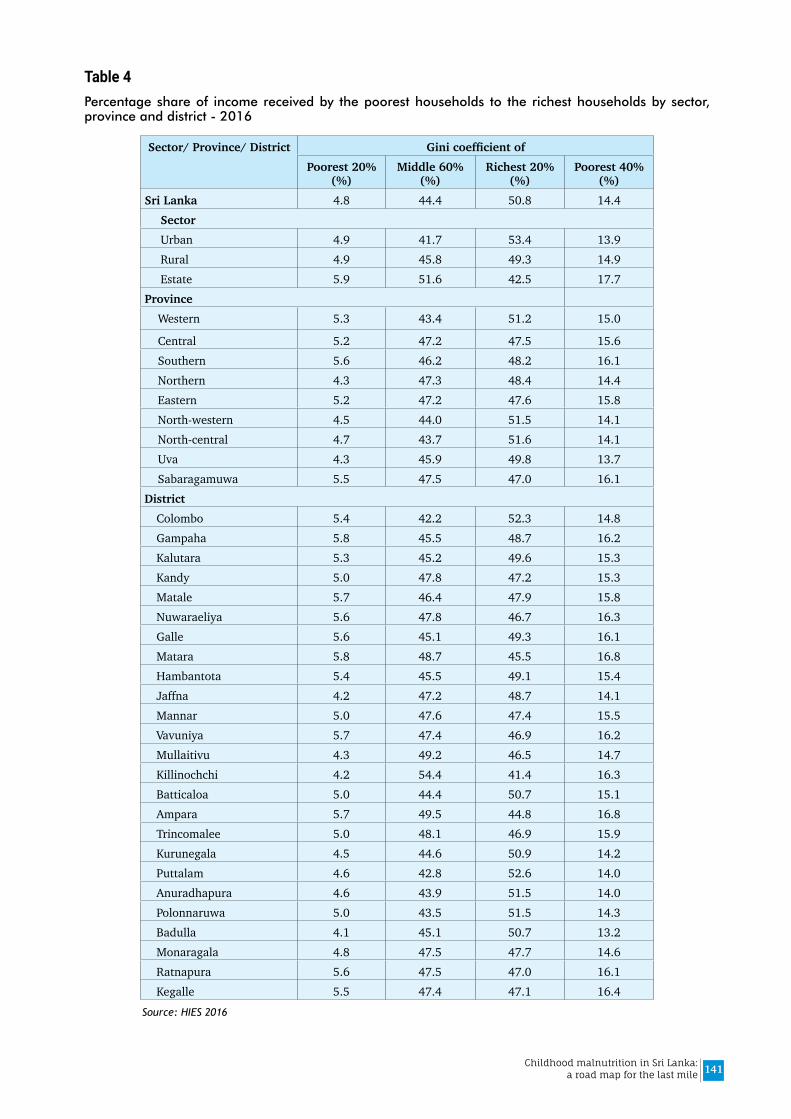
141Childhood malnutrition in Sri Lanka: a road map for the last mile
Table 4Percentage share of income received by the poorest households to the richest households by sector, province and district - 2016
Sector/ Province/ District GinicoefficientofPoorest 20%
(%)Middle 60%
(%)Richest 20%
(%)Poorest 40%
(%)Sri Lanka 4.8 44.4 50.8 14.4
SectorUrban 4.9 41.7 53.4 13.9Rural 4.9 45.8 49.3 14.9Estate 5.9 51.6 42.5 17.7
ProvinceWestern 5.3 43.4 51.2 15.0
Central 5.2 47.2 47.5 15.6Southern 5.6 46.2 48.2 16.1Northern 4.3 47.3 48.4 14.4Eastern 5.2 47.2 47.6 15.8North-western 4.5 44.0 51.5 14.1North-central 4.7 43.7 51.6 14.1Uva 4.3 45.9 49.8 13.7Sabaragamuwa 5.5 47.5 47.0 16.1
District Colombo 5.4 42.2 52.3 14.8Gampaha 5.8 45.5 48.7 16.2Kalutara 5.3 45.2 49.6 15.3Kandy 5.0 47.8 47.2 15.3Matale 5.7 46.4 47.9 15.8Nuwaraeliya 5.6 47.8 46.7 16.3Galle 5.6 45.1 49.3 16.1Matara 5.8 48.7 45.5 16.8Hambantota 5.4 45.5 49.1 15.4Jaffna 4.2 47.2 48.7 14.1Mannar 5.0 47.6 47.4 15.5Vavuniya 5.7 47.4 46.9 16.2Mullaitivu 4.3 49.2 46.5 14.7Killinochchi 4.2 54.4 41.4 16.3Batticaloa 5.0 44.4 50.7 15.1Ampara 5.7 49.5 44.8 16.8Trincomalee 5.0 48.1 46.9 15.9Kurunegala 4.5 44.6 50.9 14.2Puttalam 4.6 42.8 52.6 14.0Anuradhapura 4.6 43.9 51.5 14.0Polonnaruwa 5.0 43.5 51.5 14.3Badulla 4.1 45.1 50.7 13.2Monaragala 4.8 47.5 47.7 14.6Ratnapura 5.6 47.5 47.0 16.1Kegalle 5.5 47.4 47.1 16.4
Source: HIES 2016
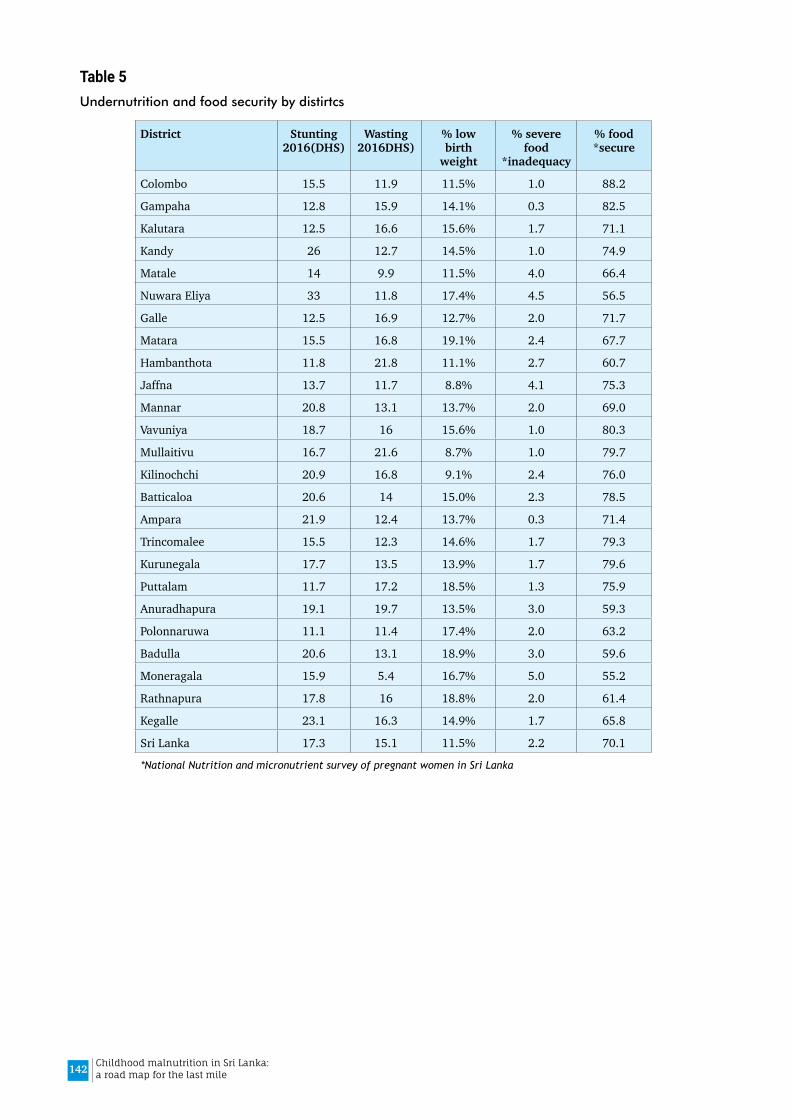
142 Childhood malnutrition in Sri Lanka: a road map for the last mile
Table 5Undernutrition and food security by distirtcs
District Stunting 2016(DHS)
Wasting 2016DHS)
% low birth
weight
% severe food
*inadequacy
% food *secure
Colombo 15.5 11.9 11.5% 1.0 88.2
Gampaha 12.8 15.9 14.1% 0.3 82.5
Kalutara 12.5 16.6 15.6% 1.7 71.1
Kandy 26 12.7 14.5% 1.0 74.9
Matale 14 9.9 11.5% 4.0 66.4
Nuwara Eliya 33 11.8 17.4% 4.5 56.5
Galle 12.5 16.9 12.7% 2.0 71.7
Matara 15.5 16.8 19.1% 2.4 67.7
Hambanthota 11.8 21.8 11.1% 2.7 60.7
Jaffna 13.7 11.7 8.8% 4.1 75.3
Mannar 20.8 13.1 13.7% 2.0 69.0
Vavuniya 18.7 16 15.6% 1.0 80.3
Mullaitivu 16.7 21.6 8.7% 1.0 79.7
Kilinochchi 20.9 16.8 9.1% 2.4 76.0
Batticaloa 20.6 14 15.0% 2.3 78.5
Ampara 21.9 12.4 13.7% 0.3 71.4
Trincomalee 15.5 12.3 14.6% 1.7 79.3
Kurunegala 17.7 13.5 13.9% 1.7 79.6
Puttalam 11.7 17.2 18.5% 1.3 75.9
Anuradhapura 19.1 19.7 13.5% 3.0 59.3
Polonnaruwa 11.1 11.4 17.4% 2.0 63.2
Badulla 20.6 13.1 18.9% 3.0 59.6
Moneragala 15.9 5.4 16.7% 5.0 55.2
Rathnapura 17.8 16 18.8% 2.0 61.4
Kegalle 23.1 16.3 14.9% 1.7 65.8
Sri Lanka 17.3 15.1 11.5% 2.2 70.1
*National Nutrition and micronutrient survey of pregnant women in Sri Lanka
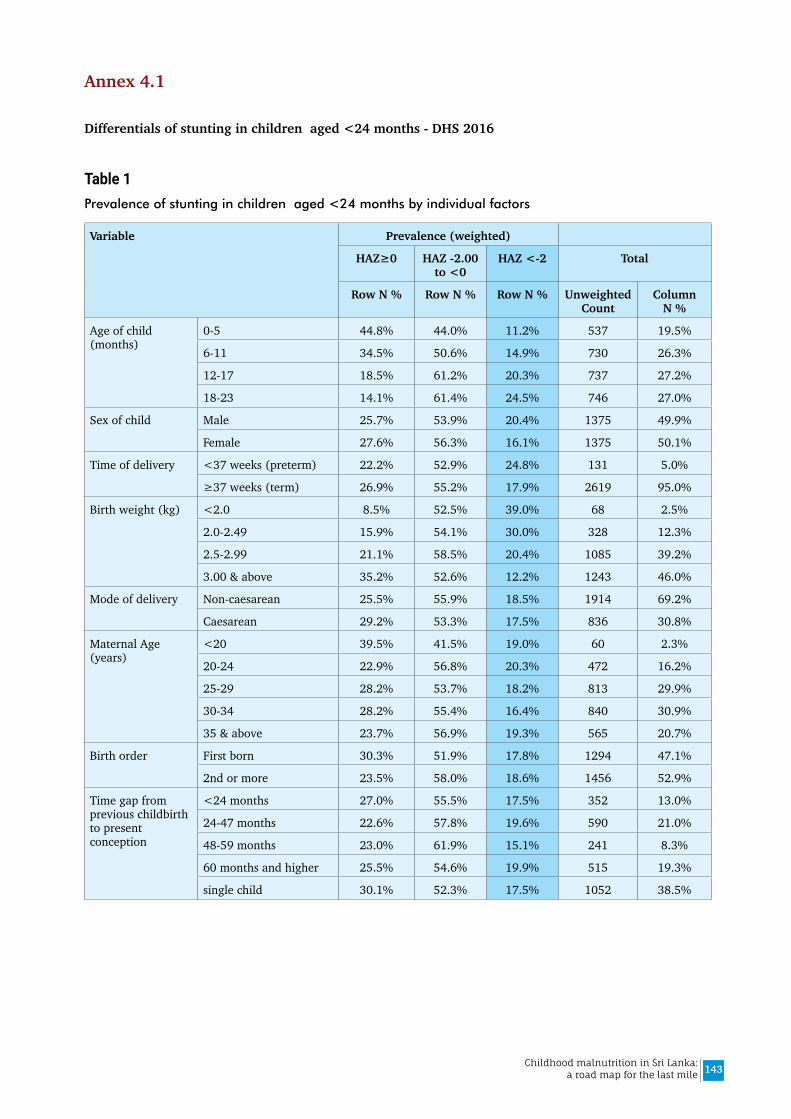
143Childhood malnutrition in Sri Lanka: a road map for the last mile
Annex 4.1
Differentials of stunting in children aged <24 months - DHS 2016
Table 1Prevalence of stunting in children aged <24 months by individual factors
Variable Prevalence (weighted)
HAZ≥0 HAZ -2.00 to <0
HAZ <-2 Total
Row N % Row N % Row N % Unweighted Count
Column N %
Age of child (months)
0-5 44.8% 44.0% 11.2% 537 19.5%
6-11 34.5% 50.6% 14.9% 730 26.3%
12-17 18.5% 61.2% 20.3% 737 27.2%
18-23 14.1% 61.4% 24.5% 746 27.0%
Sex of child Male 25.7% 53.9% 20.4% 1375 49.9%
Female 27.6% 56.3% 16.1% 1375 50.1%
Time of delivery <37 weeks (preterm) 22.2% 52.9% 24.8% 131 5.0%
≥37 weeks (term) 26.9% 55.2% 17.9% 2619 95.0%
Birth weight (kg) <2.0 8.5% 52.5% 39.0% 68 2.5%
2.0-2.49 15.9% 54.1% 30.0% 328 12.3%
2.5-2.99 21.1% 58.5% 20.4% 1085 39.2%
3.00 & above 35.2% 52.6% 12.2% 1243 46.0%
Mode of delivery Non-caesarean 25.5% 55.9% 18.5% 1914 69.2%
Caesarean 29.2% 53.3% 17.5% 836 30.8%
Maternal Age (years)
<20 39.5% 41.5% 19.0% 60 2.3%
20-24 22.9% 56.8% 20.3% 472 16.2%
25-29 28.2% 53.7% 18.2% 813 29.9%
30-34 28.2% 55.4% 16.4% 840 30.9%
35 & above 23.7% 56.9% 19.3% 565 20.7%
Birth order First born 30.3% 51.9% 17.8% 1294 47.1%
2nd or more 23.5% 58.0% 18.6% 1456 52.9%
Time gap from previous childbirth to present conception
<24 months 27.0% 55.5% 17.5% 352 13.0%
24-47 months 22.6% 57.8% 19.6% 590 21.0%
48-59 months 23.0% 61.9% 15.1% 241 8.3%
60 months and higher 25.5% 54.6% 19.9% 515 19.3%
single child 30.1% 52.3% 17.5% 1052 38.5%
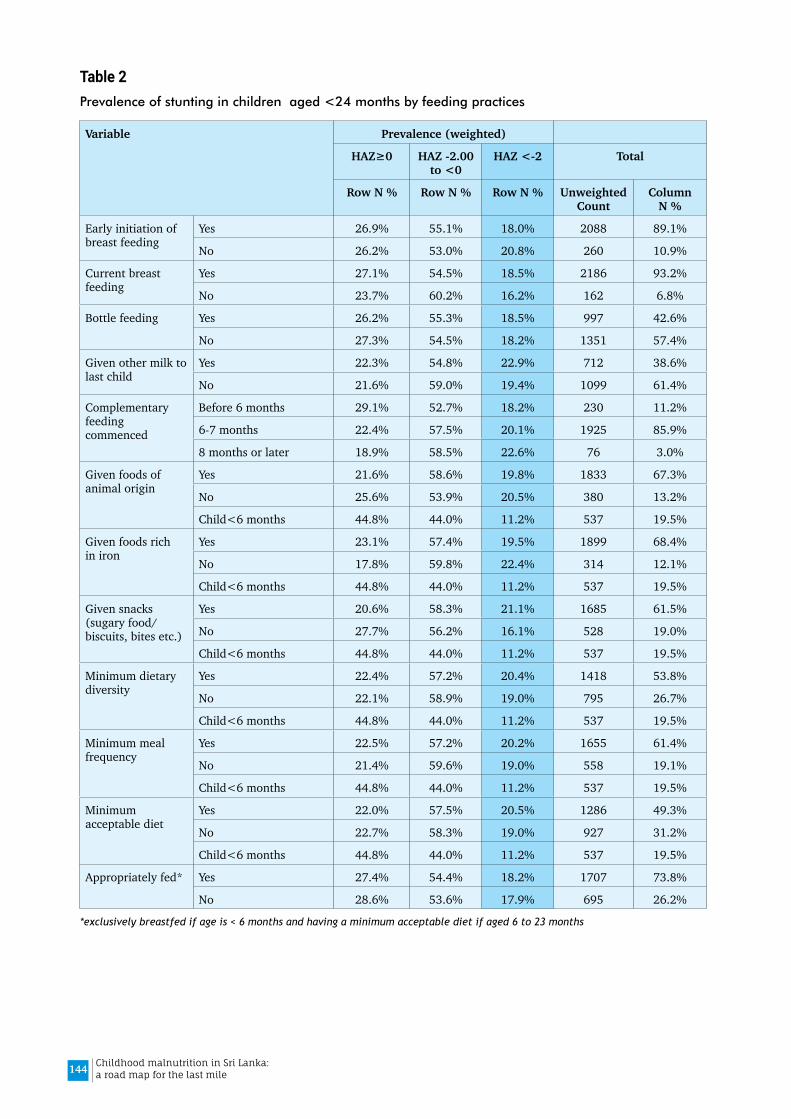
144 Childhood malnutrition in Sri Lanka: a road map for the last mile
Table 2Prevalence of stunting in children aged <24 months by feeding practices
Variable Prevalence (weighted)
HAZ≥0 HAZ -2.00 to <0
HAZ <-2 Total
Row N % Row N % Row N % Unweighted Count
Column N %
Early initiation of breast feeding
Yes 26.9% 55.1% 18.0% 2088 89.1%
No 26.2% 53.0% 20.8% 260 10.9%
Current breast feeding
Yes 27.1% 54.5% 18.5% 2186 93.2%
No 23.7% 60.2% 16.2% 162 6.8%
Bottle feeding Yes 26.2% 55.3% 18.5% 997 42.6%
No 27.3% 54.5% 18.2% 1351 57.4%
Given other milk to last child
Yes 22.3% 54.8% 22.9% 712 38.6%
No 21.6% 59.0% 19.4% 1099 61.4%
Complementary feeding commenced
Before 6 months 29.1% 52.7% 18.2% 230 11.2%
6-7 months 22.4% 57.5% 20.1% 1925 85.9%
8 months or later 18.9% 58.5% 22.6% 76 3.0%
Given foods of animal origin
Yes 21.6% 58.6% 19.8% 1833 67.3%
No 25.6% 53.9% 20.5% 380 13.2%
Child<6 months 44.8% 44.0% 11.2% 537 19.5%
Given foods rich in iron
Yes 23.1% 57.4% 19.5% 1899 68.4%
No 17.8% 59.8% 22.4% 314 12.1%
Child<6 months 44.8% 44.0% 11.2% 537 19.5%
Given snacks (sugary food/ biscuits, bites etc.)
Yes 20.6% 58.3% 21.1% 1685 61.5%
No 27.7% 56.2% 16.1% 528 19.0%
Child<6 months 44.8% 44.0% 11.2% 537 19.5%
Minimum dietary diversity
Yes 22.4% 57.2% 20.4% 1418 53.8%
No 22.1% 58.9% 19.0% 795 26.7%
Child<6 months 44.8% 44.0% 11.2% 537 19.5%
Minimum meal frequency
Yes 22.5% 57.2% 20.2% 1655 61.4%
No 21.4% 59.6% 19.0% 558 19.1%
Child<6 months 44.8% 44.0% 11.2% 537 19.5%
Minimum acceptable diet
Yes 22.0% 57.5% 20.5% 1286 49.3%
No 22.7% 58.3% 19.0% 927 31.2%
Child<6 months 44.8% 44.0% 11.2% 537 19.5%
Appropriately fed* Yes 27.4% 54.4% 18.2% 1707 73.8%
No 28.6% 53.6% 17.9% 695 26.2%
*exclusively breastfed if age is < 6 months and having a minimum acceptable diet if aged 6 to 23 months

145Childhood malnutrition in Sri Lanka: a road map for the last mile
Table 3Prevalence of stunting in children aged <24 months by common childhood illnesses
Variable Prevalence (weighted)
HAZ≥0 HAZ -2.00 to <0
HAZ <-2 Total
Row N % Row N % Row N % Unweighted Count
Column N %
Had diarrhea past 2 weeks
Yes 27.8% 53.9% 18.2% 100 3.4%
No 26.6% 55.1% 18.2% 2641 96.6%
Had illness with a cough past 2 weeks
Yes 24.1% 58.3% 17.6% 431 16.6%
No 27.2% 54.5% 18.4% 2310 83.4%
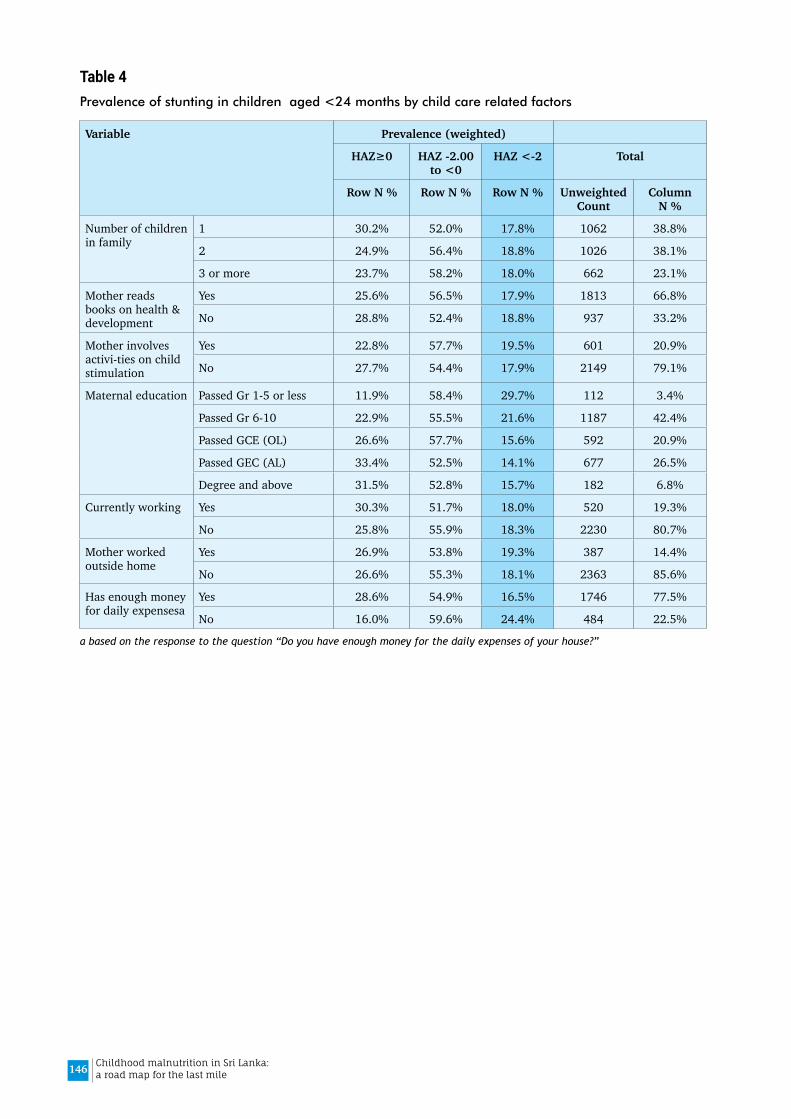
146 Childhood malnutrition in Sri Lanka: a road map for the last mile
Table 4Prevalence of stunting in children aged <24 months by child care related factors
Variable Prevalence (weighted)
HAZ≥0 HAZ -2.00 to <0
HAZ <-2 Total
Row N % Row N % Row N % Unweighted Count
Column N %
Number of children in family
1 30.2% 52.0% 17.8% 1062 38.8%
2 24.9% 56.4% 18.8% 1026 38.1%
3 or more 23.7% 58.2% 18.0% 662 23.1%
Mother reads books on health & development
Yes 25.6% 56.5% 17.9% 1813 66.8%
No 28.8% 52.4% 18.8% 937 33.2%
Mother involves activi-ties on child stimulation
Yes 22.8% 57.7% 19.5% 601 20.9%
No 27.7% 54.4% 17.9% 2149 79.1%
Maternal education Passed Gr 1-5 or less 11.9% 58.4% 29.7% 112 3.4%
Passed Gr 6-10 22.9% 55.5% 21.6% 1187 42.4%
Passed GCE (OL) 26.6% 57.7% 15.6% 592 20.9%
Passed GEC (AL) 33.4% 52.5% 14.1% 677 26.5%
Degree and above 31.5% 52.8% 15.7% 182 6.8%
Currently working Yes 30.3% 51.7% 18.0% 520 19.3%
No 25.8% 55.9% 18.3% 2230 80.7%
Mother worked outside home
Yes 26.9% 53.8% 19.3% 387 14.4%
No 26.6% 55.3% 18.1% 2363 85.6%
Has enough money for daily expensesa
Yes 28.6% 54.9% 16.5% 1746 77.5%
No 16.0% 59.6% 24.4% 484 22.5%
a based on the response to the question “Do you have enough money for the daily expenses of your house?”
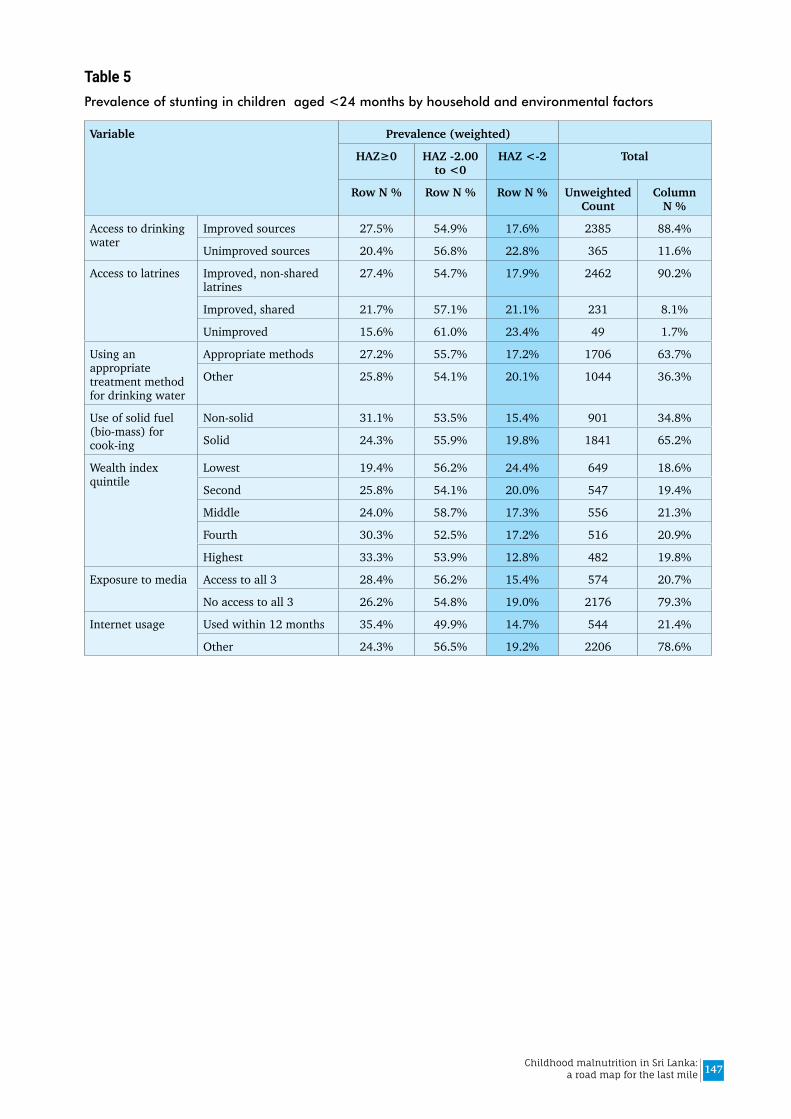
147Childhood malnutrition in Sri Lanka: a road map for the last mile
Table 5Prevalence of stunting in children aged <24 months by household and environmental factors
Variable Prevalence (weighted)
HAZ≥0 HAZ -2.00 to <0
HAZ <-2 Total
Row N % Row N % Row N % Unweighted Count
Column N %
Access to drinking water
Improved sources 27.5% 54.9% 17.6% 2385 88.4%
Unimproved sources 20.4% 56.8% 22.8% 365 11.6%
Access to latrines Improved, non-shared latrines
27.4% 54.7% 17.9% 2462 90.2%
Improved, shared 21.7% 57.1% 21.1% 231 8.1%
Unimproved 15.6% 61.0% 23.4% 49 1.7%
Using an appropriate treatment method for drinking water
Appropriate methods 27.2% 55.7% 17.2% 1706 63.7%
Other 25.8% 54.1% 20.1% 1044 36.3%
Use of solid fuel (bio-mass) for cook-ing
Non-solid 31.1% 53.5% 15.4% 901 34.8%
Solid 24.3% 55.9% 19.8% 1841 65.2%
Wealth index quintile
Lowest 19.4% 56.2% 24.4% 649 18.6%
Second 25.8% 54.1% 20.0% 547 19.4%
Middle 24.0% 58.7% 17.3% 556 21.3%
Fourth 30.3% 52.5% 17.2% 516 20.9%
Highest 33.3% 53.9% 12.8% 482 19.8%
Exposure to media Access to all 3 28.4% 56.2% 15.4% 574 20.7%
No access to all 3 26.2% 54.8% 19.0% 2176 79.3%
Internet usage Used within 12 months 35.4% 49.9% 14.7% 544 21.4%
Other 24.3% 56.5% 19.2% 2206 78.6%
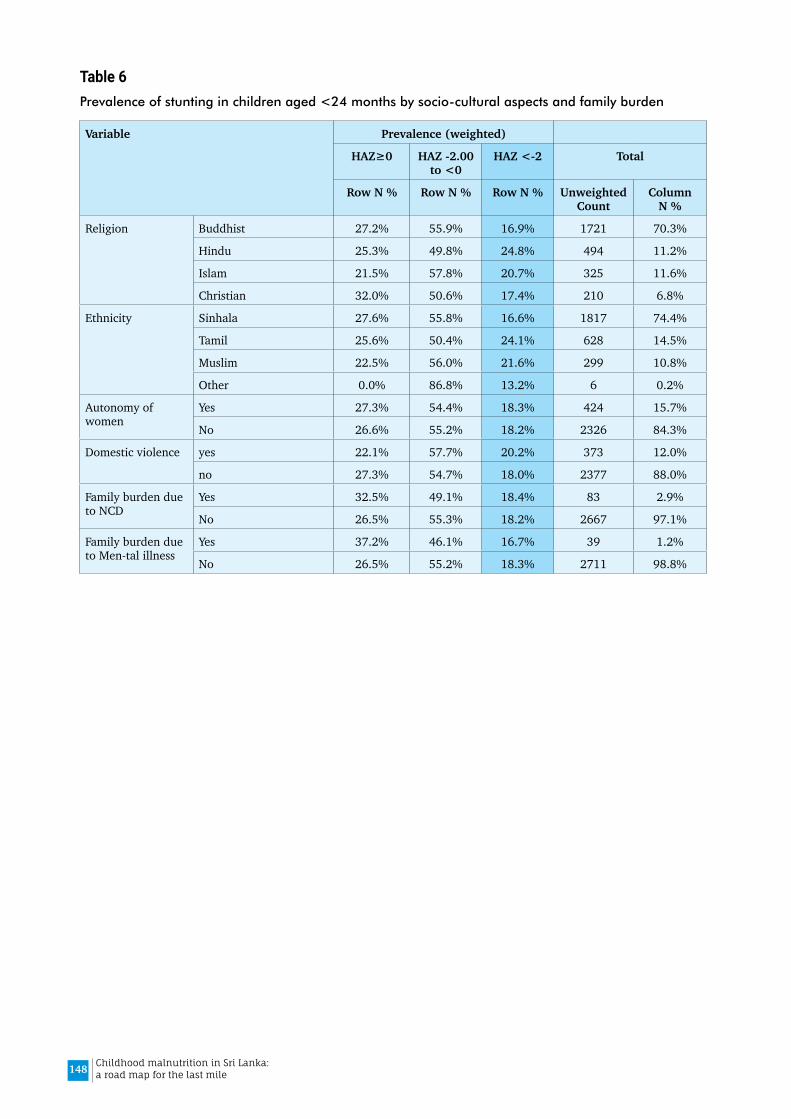
148 Childhood malnutrition in Sri Lanka: a road map for the last mile
Table 6Prevalence of stunting in children aged <24 months by socio-cultural aspects and family burden
Variable Prevalence (weighted)
HAZ≥0 HAZ -2.00 to <0
HAZ <-2 Total
Row N % Row N % Row N % Unweighted Count
Column N %
Religion Buddhist 27.2% 55.9% 16.9% 1721 70.3%
Hindu 25.3% 49.8% 24.8% 494 11.2%
Islam 21.5% 57.8% 20.7% 325 11.6%
Christian 32.0% 50.6% 17.4% 210 6.8%
Ethnicity Sinhala 27.6% 55.8% 16.6% 1817 74.4%
Tamil 25.6% 50.4% 24.1% 628 14.5%
Muslim 22.5% 56.0% 21.6% 299 10.8%
Other 0.0% 86.8% 13.2% 6 0.2%
Autonomy of women
Yes 27.3% 54.4% 18.3% 424 15.7%
No 26.6% 55.2% 18.2% 2326 84.3%
Domestic violence yes 22.1% 57.7% 20.2% 373 12.0%
no 27.3% 54.7% 18.0% 2377 88.0%
Family burden due to NCD
Yes 32.5% 49.1% 18.4% 83 2.9%
No 26.5% 55.3% 18.2% 2667 97.1%
Family burden due to Men-tal illness
Yes 37.2% 46.1% 16.7% 39 1.2%
No 26.5% 55.2% 18.3% 2711 98.8%
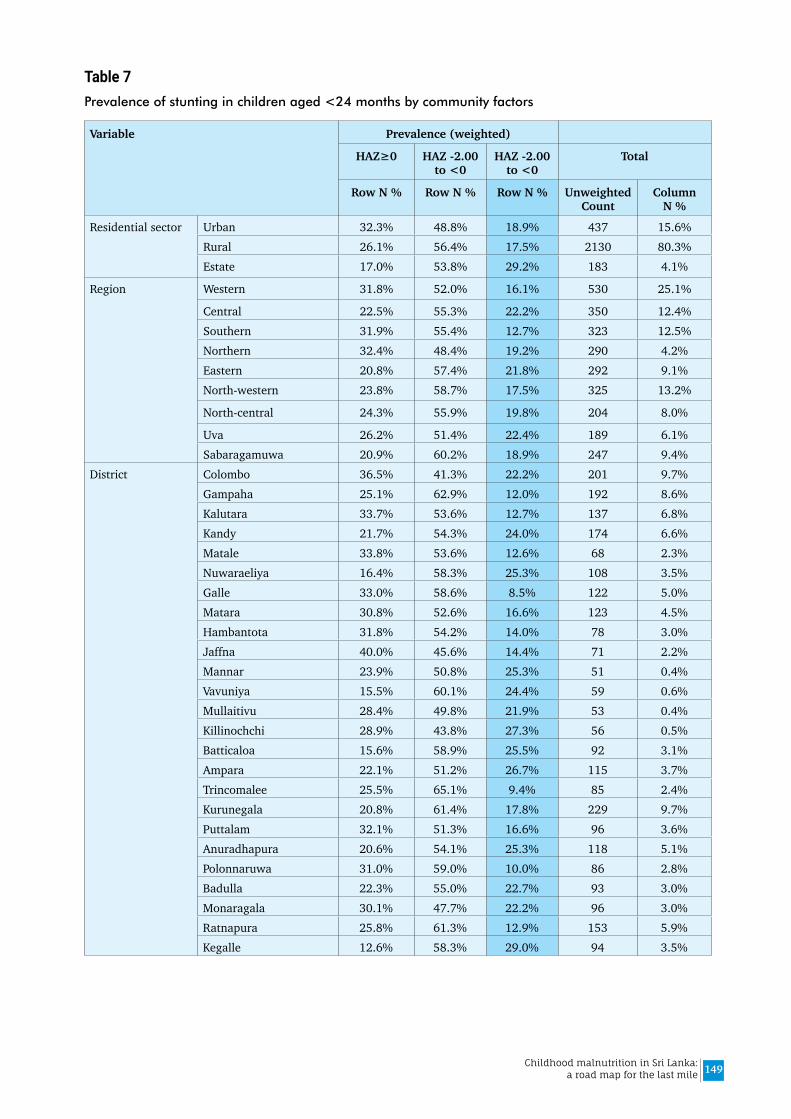
149Childhood malnutrition in Sri Lanka: a road map for the last mile
Table 7Prevalence of stunting in children aged <24 months by community factors
Variable Prevalence (weighted)
HAZ≥0 HAZ -2.00 to <0
HAZ -2.00 to <0
Total
Row N % Row N % Row N % Unweighted Count
Column N %
Residential sector Urban 32.3% 48.8% 18.9% 437 15.6%Rural 26.1% 56.4% 17.5% 2130 80.3%Estate 17.0% 53.8% 29.2% 183 4.1%
Region Western 31.8% 52.0% 16.1% 530 25.1%
Central 22.5% 55.3% 22.2% 350 12.4%Southern 31.9% 55.4% 12.7% 323 12.5%Northern 32.4% 48.4% 19.2% 290 4.2%Eastern 20.8% 57.4% 21.8% 292 9.1%North-western 23.8% 58.7% 17.5% 325 13.2%
North-central 24.3% 55.9% 19.8% 204 8.0%
Uva 26.2% 51.4% 22.4% 189 6.1%Sabaragamuwa 20.9% 60.2% 18.9% 247 9.4%
District Colombo 36.5% 41.3% 22.2% 201 9.7%Gampaha 25.1% 62.9% 12.0% 192 8.6%Kalutara 33.7% 53.6% 12.7% 137 6.8%Kandy 21.7% 54.3% 24.0% 174 6.6%Matale 33.8% 53.6% 12.6% 68 2.3%Nuwaraeliya 16.4% 58.3% 25.3% 108 3.5%Galle 33.0% 58.6% 8.5% 122 5.0%Matara 30.8% 52.6% 16.6% 123 4.5%Hambantota 31.8% 54.2% 14.0% 78 3.0%Jaffna 40.0% 45.6% 14.4% 71 2.2%Mannar 23.9% 50.8% 25.3% 51 0.4%Vavuniya 15.5% 60.1% 24.4% 59 0.6%Mullaitivu 28.4% 49.8% 21.9% 53 0.4%Killinochchi 28.9% 43.8% 27.3% 56 0.5%Batticaloa 15.6% 58.9% 25.5% 92 3.1%Ampara 22.1% 51.2% 26.7% 115 3.7%Trincomalee 25.5% 65.1% 9.4% 85 2.4%Kurunegala 20.8% 61.4% 17.8% 229 9.7%Puttalam 32.1% 51.3% 16.6% 96 3.6%Anuradhapura 20.6% 54.1% 25.3% 118 5.1%Polonnaruwa 31.0% 59.0% 10.0% 86 2.8%Badulla 22.3% 55.0% 22.7% 93 3.0%Monaragala 30.1% 47.7% 22.2% 96 3.0%Ratnapura 25.8% 61.3% 12.9% 153 5.9%Kegalle 12.6% 58.3% 29.0% 94 3.5%

150 Childhood malnutrition in Sri Lanka: a road map for the last mile
Table 8Unadjusted Odds Ratios for the determinants of stunting in children than 2 years in contrast to those with normal height (HAZ≥0): Results of bivariate regression analysis
Variable Category Unadjusted OR
95% CI P value
Lower Upper
Age Category (months) 0-5 1.00
6-8 1.58 1.01 2.46 .043
9-11 1.73 1.11 2.71 .016
12-18 4.26 2.89 6.28 .000
18-23 5.42 3.65 8.04 .000
Sex of child Male 1.31 1.05 1.65 .017
Female 1.00
Time of delivery <37 weeks 1.84 1.10 3.08 .020
≥ 37 weeks 1.00
Birth weight (kg) <2.0 11.50 4.63 28.56 .000
2.0-2.49 5.68 3.89 8.32 .000
2.5-2.99 2.91 2.25 3.77 .000
3.00 & above 1.00
Appropriately feda Yes 1.00
No 1.01 0.77 1.31 .967
Given snacks (sugary food/ biscuits, bites etc.)
Yes 2.59 2.04 3.29 .000
No 1.00
Any acute illness past 2 weeks
Had ARI or diarrhoea 1.10 0.81 1.51 .543
None 1.00
Maternal education Passed Gr 1-5 or less 5.13 2.70 9.75 .000
Passed Gr 6-10 2.26 1.73 2.96 .000
Passed GCE (OL) 1.42 1.02 1.97 .036
Passed GEC (AL), diploma, degree 1.00
Has enough money for daily expensesb
No 2.41 1.76 3.31 .000
yes 1.00
Access to drinking wa-ter
Improved sources 1.00
Unimproved sources 1.62 1.17 2.25 .004
Access to latrines Improved, non-shared latrines 1.00
Improved, shared 1.46 0.98 2.18 .064
Unimproved 1.59 0.64 3.95 .316
Use of solid fuel (biomass) for cooking
solid 1.75 1.37 2.24 .000
non solid 1.00
Wealth index quintile Lowest 3.27 2.26 4.74 .000
Second 2.03 1.39 2.98 .000
Middle 1.82 1.23 2.69 .003
Fourth 1.47 0.99 2.17 .054
Highest 1.00
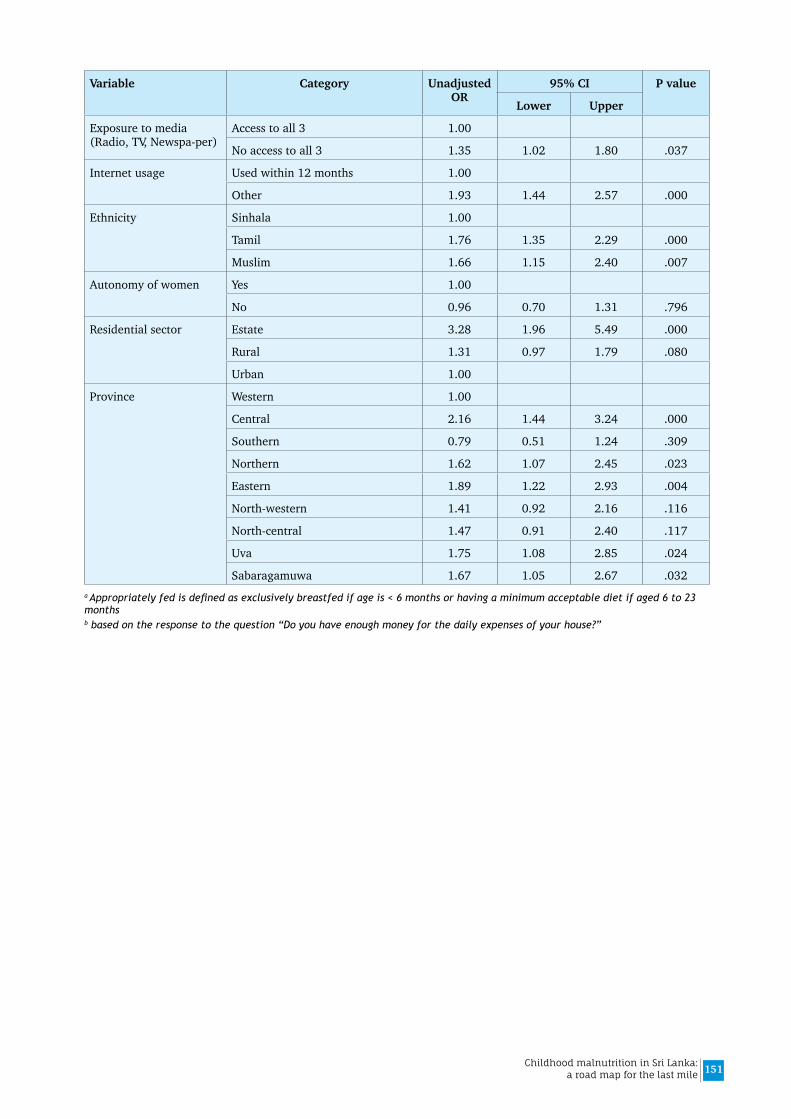
151Childhood malnutrition in Sri Lanka: a road map for the last mile
Variable Category Unadjusted OR
95% CI P value
Lower Upper
Exposure to media (Radio, TV, Newspa-per)
Access to all 3 1.00
No access to all 3 1.35 1.02 1.80 .037
Internet usage Used within 12 months 1.00
Other 1.93 1.44 2.57 .000
Ethnicity Sinhala 1.00
Tamil 1.76 1.35 2.29 .000
Muslim 1.66 1.15 2.40 .007
Autonomy of women Yes 1.00
No 0.96 0.70 1.31 .796
Residential sector Estate 3.28 1.96 5.49 .000
Rural 1.31 0.97 1.79 .080
Urban 1.00
Province Western 1.00
Central 2.16 1.44 3.24 .000
Southern 0.79 0.51 1.24 .309
Northern 1.62 1.07 2.45 .023
Eastern 1.89 1.22 2.93 .004
North-western 1.41 0.92 2.16 .116
North-central 1.47 0.91 2.40 .117
Uva 1.75 1.08 2.85 .024
Sabaragamuwa 1.67 1.05 2.67 .032a Appropriately fed is defined as exclusively breastfed if age is < 6 months or having a minimum acceptable diet if aged 6 to 23 monthsb based on the response to the question “Do you have enough money for the daily expenses of your house?”
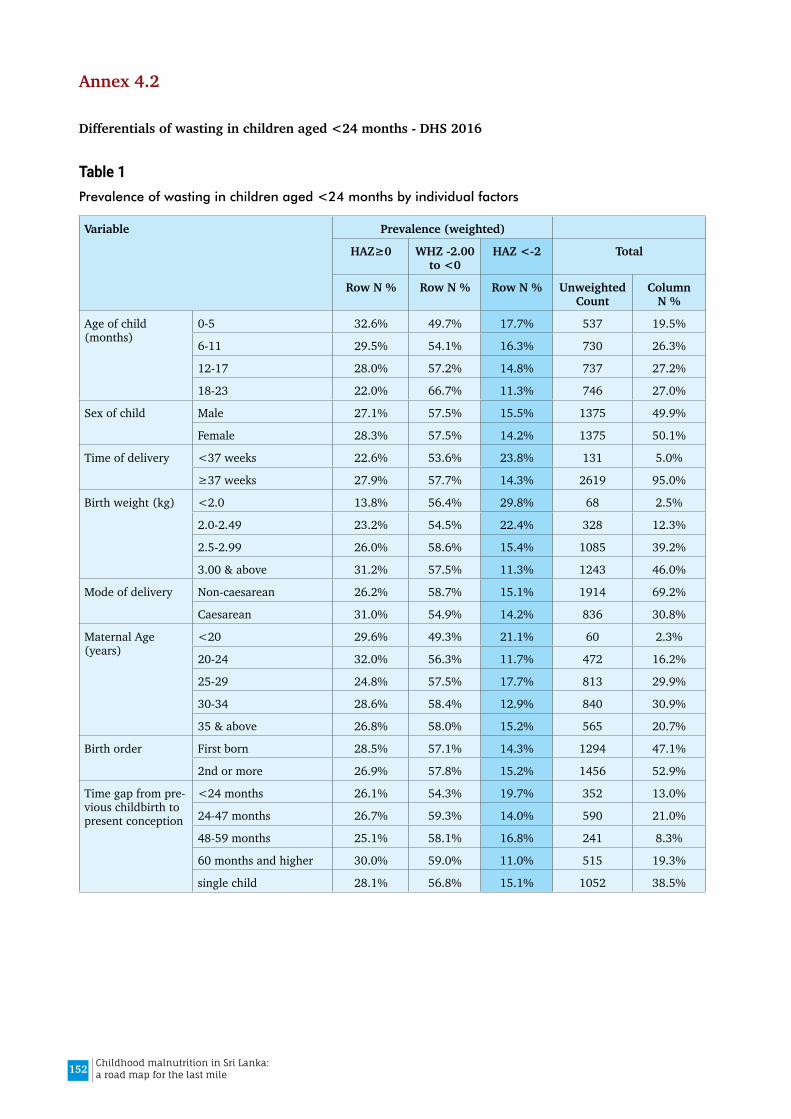
152 Childhood malnutrition in Sri Lanka: a road map for the last mile
Annex 4.2
Differentials of wasting in children aged <24 months - DHS 2016
Table 1Prevalence of wasting in children aged <24 months by individual factors
Variable Prevalence (weighted)
HAZ≥0 WHZ -2.00 to <0
HAZ <-2 Total
Row N % Row N % Row N % Unweighted Count
Column N %
Age of child (months)
0-5 32.6% 49.7% 17.7% 537 19.5%
6-11 29.5% 54.1% 16.3% 730 26.3%
12-17 28.0% 57.2% 14.8% 737 27.2%
18-23 22.0% 66.7% 11.3% 746 27.0%
Sex of child Male 27.1% 57.5% 15.5% 1375 49.9%
Female 28.3% 57.5% 14.2% 1375 50.1%
Time of delivery <37 weeks 22.6% 53.6% 23.8% 131 5.0%
≥37 weeks 27.9% 57.7% 14.3% 2619 95.0%
Birth weight (kg) <2.0 13.8% 56.4% 29.8% 68 2.5%
2.0-2.49 23.2% 54.5% 22.4% 328 12.3%
2.5-2.99 26.0% 58.6% 15.4% 1085 39.2%
3.00 & above 31.2% 57.5% 11.3% 1243 46.0%
Mode of delivery Non-caesarean 26.2% 58.7% 15.1% 1914 69.2%
Caesarean 31.0% 54.9% 14.2% 836 30.8%
Maternal Age (years)
<20 29.6% 49.3% 21.1% 60 2.3%
20-24 32.0% 56.3% 11.7% 472 16.2%
25-29 24.8% 57.5% 17.7% 813 29.9%
30-34 28.6% 58.4% 12.9% 840 30.9%
35 & above 26.8% 58.0% 15.2% 565 20.7%
Birth order First born 28.5% 57.1% 14.3% 1294 47.1%
2nd or more 26.9% 57.8% 15.2% 1456 52.9%
Time gap from pre-vious childbirth to present conception
<24 months 26.1% 54.3% 19.7% 352 13.0%
24-47 months 26.7% 59.3% 14.0% 590 21.0%
48-59 months 25.1% 58.1% 16.8% 241 8.3%
60 months and higher 30.0% 59.0% 11.0% 515 19.3%
single child 28.1% 56.8% 15.1% 1052 38.5%
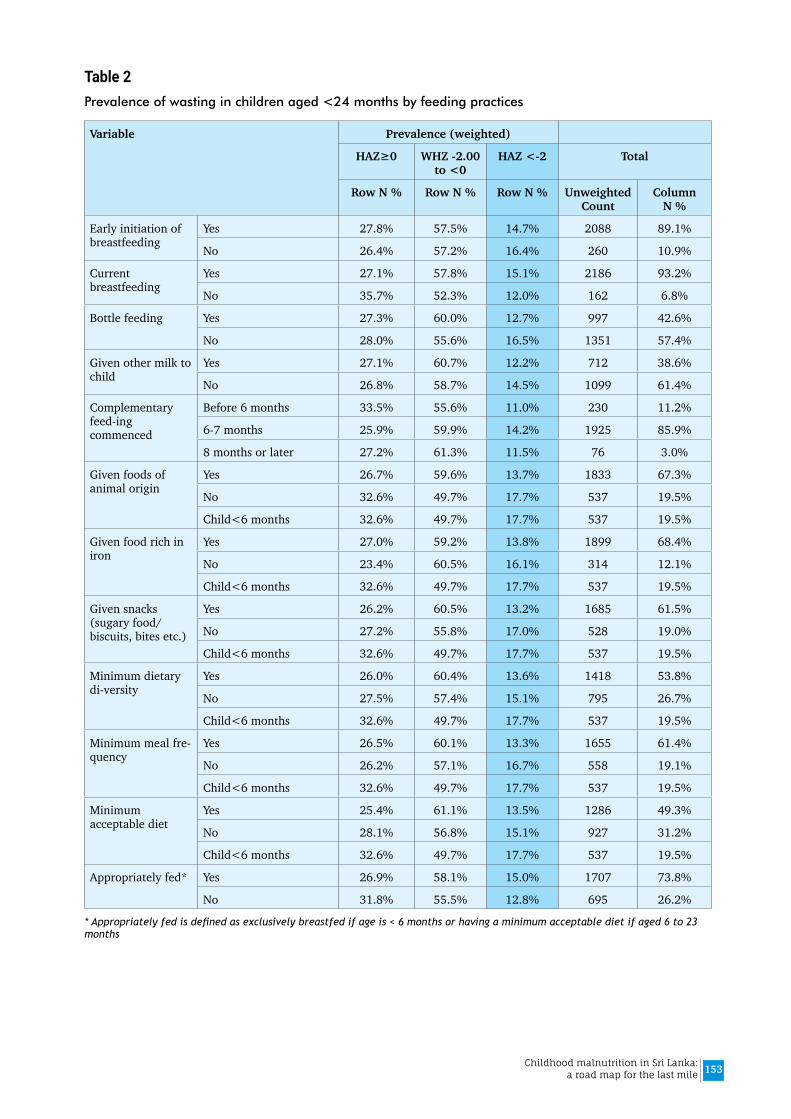
153Childhood malnutrition in Sri Lanka: a road map for the last mile
Table 2Prevalence of wasting in children aged <24 months by feeding practices
Variable Prevalence (weighted)
HAZ≥0 WHZ -2.00 to <0
HAZ <-2 Total
Row N % Row N % Row N % Unweighted Count
Column N %
Early initiation of breastfeeding
Yes 27.8% 57.5% 14.7% 2088 89.1%
No 26.4% 57.2% 16.4% 260 10.9%
Current breastfeeding
Yes 27.1% 57.8% 15.1% 2186 93.2%
No 35.7% 52.3% 12.0% 162 6.8%
Bottle feeding Yes 27.3% 60.0% 12.7% 997 42.6%
No 28.0% 55.6% 16.5% 1351 57.4%
Given other milk to child
Yes 27.1% 60.7% 12.2% 712 38.6%
No 26.8% 58.7% 14.5% 1099 61.4%
Complementary feed-ing commenced
Before 6 months 33.5% 55.6% 11.0% 230 11.2%
6-7 months 25.9% 59.9% 14.2% 1925 85.9%
8 months or later 27.2% 61.3% 11.5% 76 3.0%
Given foods of animal origin
Yes 26.7% 59.6% 13.7% 1833 67.3%
No 32.6% 49.7% 17.7% 537 19.5%
Child<6 months 32.6% 49.7% 17.7% 537 19.5%
Given food rich in iron
Yes 27.0% 59.2% 13.8% 1899 68.4%
No 23.4% 60.5% 16.1% 314 12.1%
Child<6 months 32.6% 49.7% 17.7% 537 19.5%
Given snacks (sugary food/ biscuits, bites etc.)
Yes 26.2% 60.5% 13.2% 1685 61.5%
No 27.2% 55.8% 17.0% 528 19.0%
Child<6 months 32.6% 49.7% 17.7% 537 19.5%
Minimum dietary di-versity
Yes 26.0% 60.4% 13.6% 1418 53.8%
No 27.5% 57.4% 15.1% 795 26.7%
Child<6 months 32.6% 49.7% 17.7% 537 19.5%
Minimum meal fre-quency
Yes 26.5% 60.1% 13.3% 1655 61.4%
No 26.2% 57.1% 16.7% 558 19.1%
Child<6 months 32.6% 49.7% 17.7% 537 19.5%
Minimum acceptable diet
Yes 25.4% 61.1% 13.5% 1286 49.3%
No 28.1% 56.8% 15.1% 927 31.2%
Child<6 months 32.6% 49.7% 17.7% 537 19.5%
Appropriately fed* Yes 26.9% 58.1% 15.0% 1707 73.8%
No 31.8% 55.5% 12.8% 695 26.2%
* Appropriately fed is defined as exclusively breastfed if age is < 6 months or having a minimum acceptable diet if aged 6 to 23 months
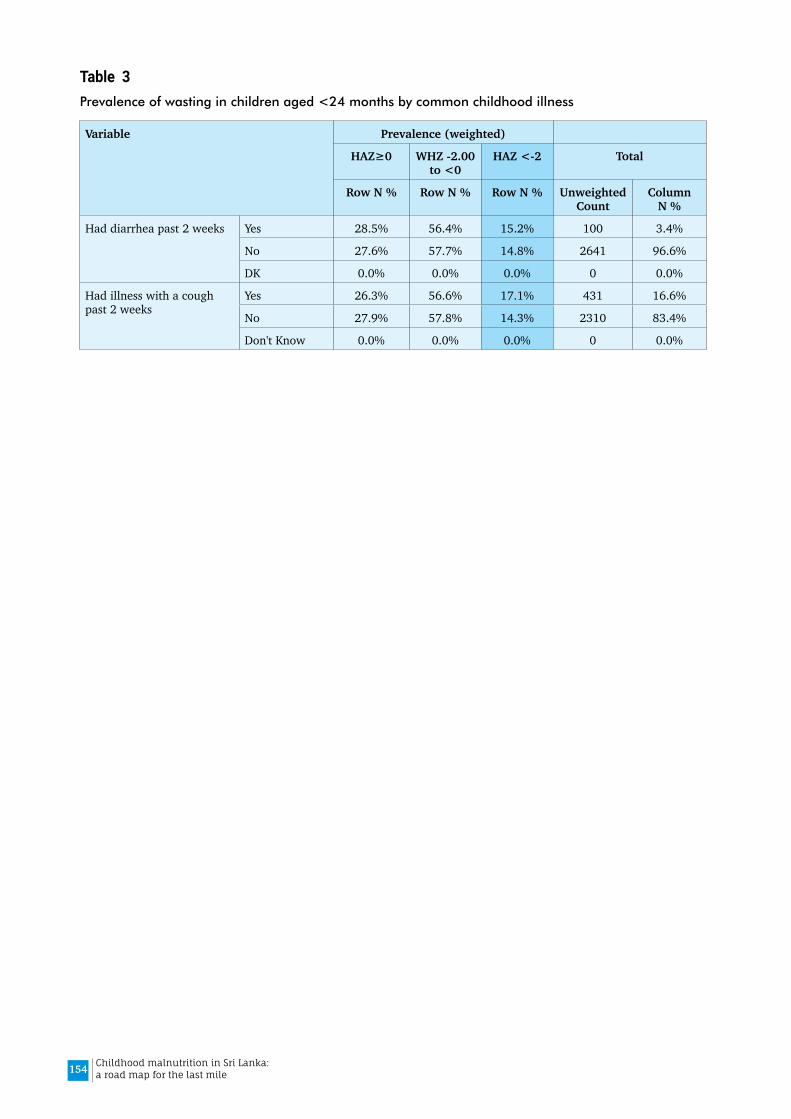
154 Childhood malnutrition in Sri Lanka: a road map for the last mile
Table 3Prevalence of wasting in children aged <24 months by common childhood illness
Variable Prevalence (weighted)
HAZ≥0 WHZ -2.00 to <0
HAZ <-2 Total
Row N % Row N % Row N % Unweighted Count
Column N %
Had diarrhea past 2 weeks Yes 28.5% 56.4% 15.2% 100 3.4%
No 27.6% 57.7% 14.8% 2641 96.6%
DK 0.0% 0.0% 0.0% 0 0.0%
Had illness with a cough past 2 weeks
Yes 26.3% 56.6% 17.1% 431 16.6%
No 27.9% 57.8% 14.3% 2310 83.4%
Don't Know 0.0% 0.0% 0.0% 0 0.0%

155Childhood malnutrition in Sri Lanka: a road map for the last mile
Table 4Prevalence of wasting in children aged <24 months by child care related factors
Variable Prevalence (weighted)
HAZ≥0 WHZ -2.00 to <0
HAZ <-2 Total
Row N % Row N % Row N % Unweighted Count
Column N %
Number of children in family
1 28.3% 56.9% 14.9% 1062 38.8%
2 28.2% 57.7% 14.1% 1026 38.1%
3 or more 25.8% 58.3% 15.9% 662 23.1%
Mother reads books on health & development
Yes 28.3% 57.7% 14.0% 1813 66.8%
No 26.3% 57.2% 16.5% 937 33.2%
Mother involves activi-ties on child stimulation
Yes 24.5% 59.7% 15.9% 601 20.9%
No 28.5% 56.9% 14.5% 2149 79.1%
Maternal education Passed Gr 1-5 or less 27.2% 51.8% 21.0% 112 3.4%
Passed Gr 6-10 25.2% 57.8% 17.0% 1187 42.4%
Passed GCE (OL) 26.9% 57.2% 15.9% 592 20.9%
Passed GEC (AL) 31.0% 58.2% 10.8% 677 26.5%
Degree and above 32.7% 56.8% 10.4% 182 6.8%
Currently working Yes 28.4% 61.0% 10.6% 520 19.3%
No 27.5% 56.7% 15.8% 2230 80.7%
Mother worked outside home
Yes 30.0% 60.6% 9.5% 387 14.4%
No 27.3% 57.0% 15.7% 2363 85.6%
Has enough money for daily expensesa
Yes 28.3% 56.8% 14.9% 1746 77.5%
No 24.6% 56.4% 19.0% 484 22.5%
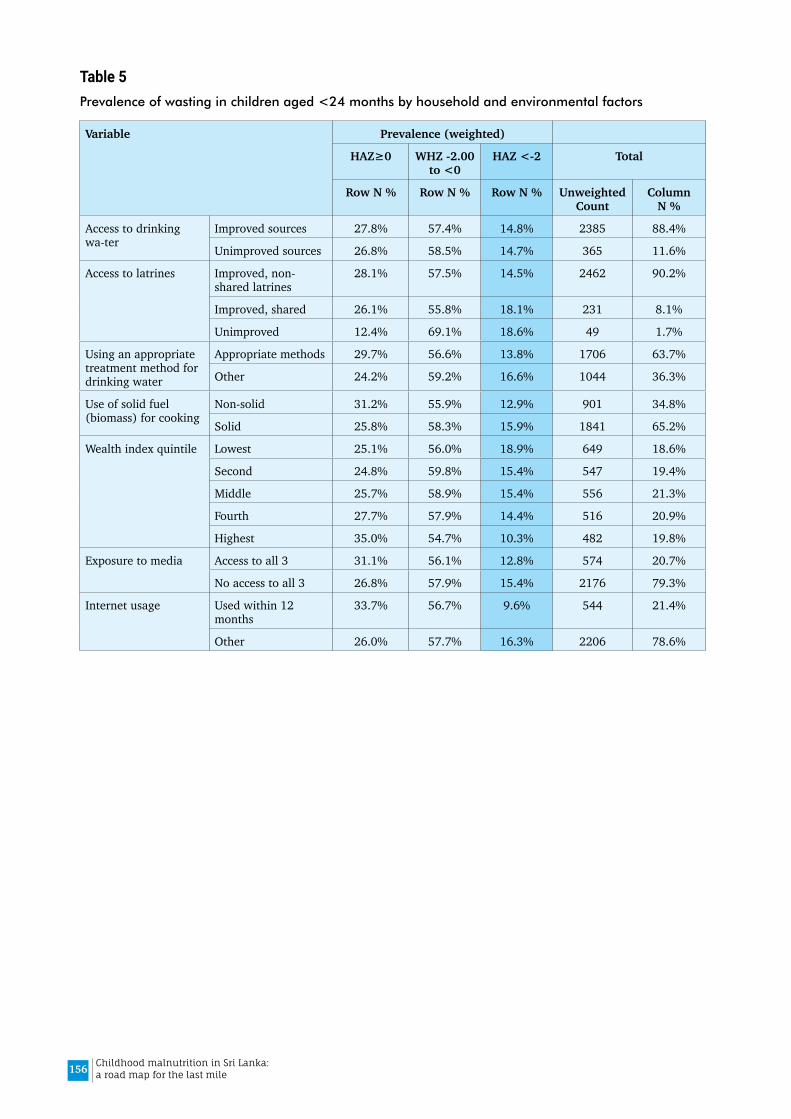
156 Childhood malnutrition in Sri Lanka: a road map for the last mile
Table 5Prevalence of wasting in children aged <24 months by household and environmental factors
Variable Prevalence (weighted)
HAZ≥0 WHZ -2.00 to <0
HAZ <-2 Total
Row N % Row N % Row N % Unweighted Count
Column N %
Access to drinking wa-ter
Improved sources 27.8% 57.4% 14.8% 2385 88.4%
Unimproved sources 26.8% 58.5% 14.7% 365 11.6%
Access to latrines Improved, non-shared latrines
28.1% 57.5% 14.5% 2462 90.2%
Improved, shared 26.1% 55.8% 18.1% 231 8.1%
Unimproved 12.4% 69.1% 18.6% 49 1.7%
Using an appropriate treatment method for drinking water
Appropriate methods 29.7% 56.6% 13.8% 1706 63.7%
Other 24.2% 59.2% 16.6% 1044 36.3%
Use of solid fuel (biomass) for cooking
Non-solid 31.2% 55.9% 12.9% 901 34.8%
Solid 25.8% 58.3% 15.9% 1841 65.2%
Wealth index quintile Lowest 25.1% 56.0% 18.9% 649 18.6%
Second 24.8% 59.8% 15.4% 547 19.4%
Middle 25.7% 58.9% 15.4% 556 21.3%
Fourth 27.7% 57.9% 14.4% 516 20.9%
Highest 35.0% 54.7% 10.3% 482 19.8%
Exposure to media Access to all 3 31.1% 56.1% 12.8% 574 20.7%
No access to all 3 26.8% 57.9% 15.4% 2176 79.3%
Internet usage Used within 12 months
33.7% 56.7% 9.6% 544 21.4%
Other 26.0% 57.7% 16.3% 2206 78.6%
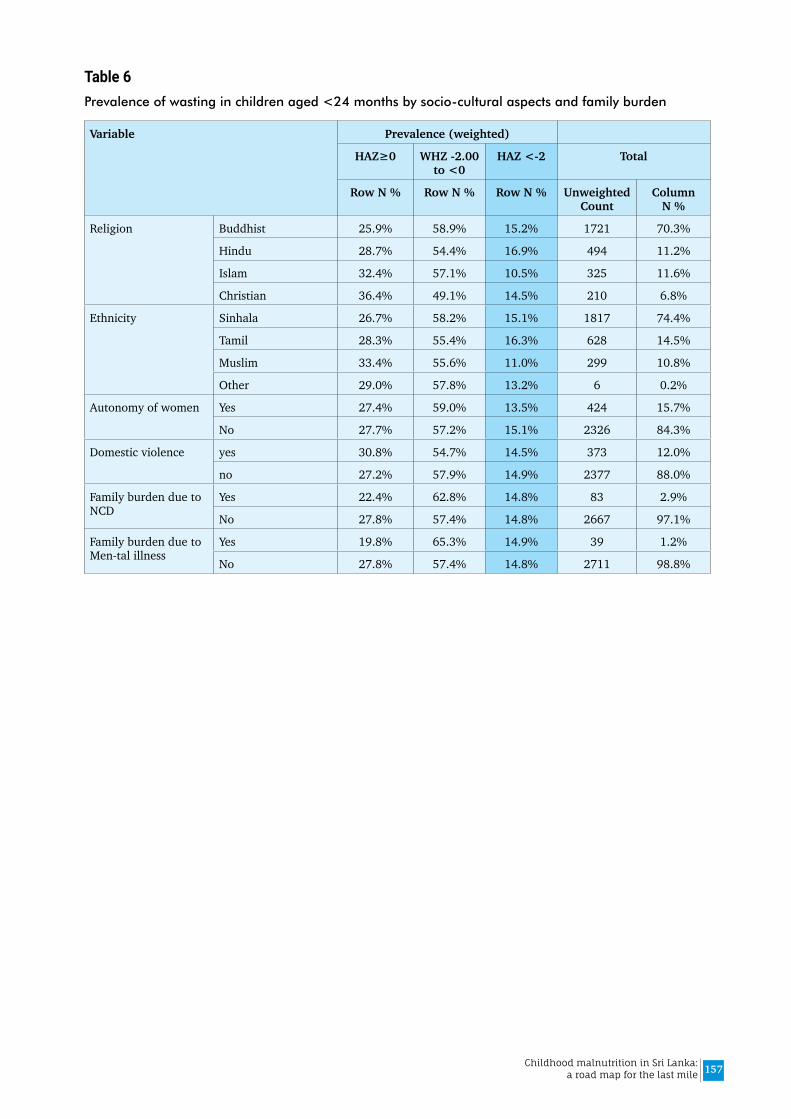
157Childhood malnutrition in Sri Lanka: a road map for the last mile
Table 6Prevalence of wasting in children aged <24 months by socio-cultural aspects and family burden
Variable Prevalence (weighted)
HAZ≥0 WHZ -2.00 to <0
HAZ <-2 Total
Row N % Row N % Row N % Unweighted Count
Column N %
Religion Buddhist 25.9% 58.9% 15.2% 1721 70.3%
Hindu 28.7% 54.4% 16.9% 494 11.2%
Islam 32.4% 57.1% 10.5% 325 11.6%
Christian 36.4% 49.1% 14.5% 210 6.8%
Ethnicity Sinhala 26.7% 58.2% 15.1% 1817 74.4%
Tamil 28.3% 55.4% 16.3% 628 14.5%
Muslim 33.4% 55.6% 11.0% 299 10.8%
Other 29.0% 57.8% 13.2% 6 0.2%
Autonomy of women Yes 27.4% 59.0% 13.5% 424 15.7%
No 27.7% 57.2% 15.1% 2326 84.3%
Domestic violence yes 30.8% 54.7% 14.5% 373 12.0%
no 27.2% 57.9% 14.9% 2377 88.0%
Family burden due to NCD
Yes 22.4% 62.8% 14.8% 83 2.9%
No 27.8% 57.4% 14.8% 2667 97.1%
Family burden due to Men-tal illness
Yes 19.8% 65.3% 14.9% 39 1.2%
No 27.8% 57.4% 14.8% 2711 98.8%
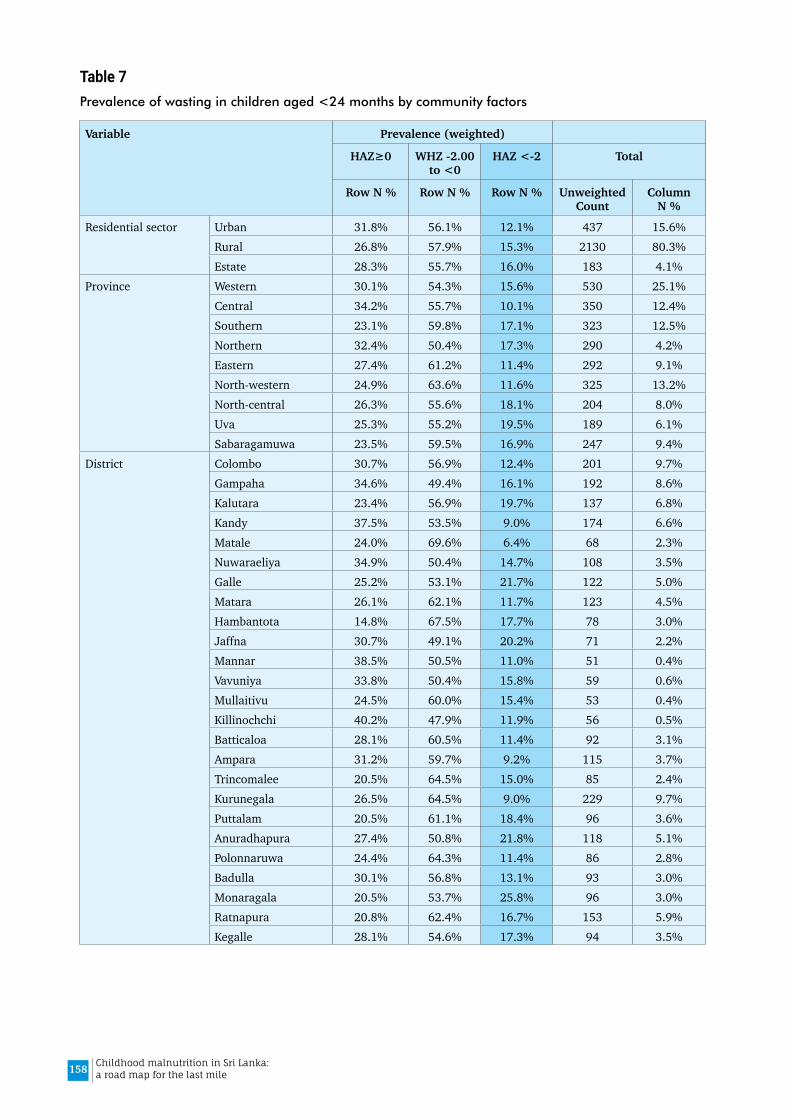
158 Childhood malnutrition in Sri Lanka: a road map for the last mile
Table 7Prevalence of wasting in children aged <24 months by community factors
Variable Prevalence (weighted)
HAZ≥0 WHZ -2.00 to <0
HAZ <-2 Total
Row N % Row N % Row N % Unweighted Count
Column N %
Residential sector Urban 31.8% 56.1% 12.1% 437 15.6%Rural 26.8% 57.9% 15.3% 2130 80.3%Estate 28.3% 55.7% 16.0% 183 4.1%
Province Western 30.1% 54.3% 15.6% 530 25.1%Central 34.2% 55.7% 10.1% 350 12.4%Southern 23.1% 59.8% 17.1% 323 12.5%Northern 32.4% 50.4% 17.3% 290 4.2%Eastern 27.4% 61.2% 11.4% 292 9.1%North-western 24.9% 63.6% 11.6% 325 13.2%North-central 26.3% 55.6% 18.1% 204 8.0%Uva 25.3% 55.2% 19.5% 189 6.1%Sabaragamuwa 23.5% 59.5% 16.9% 247 9.4%
District Colombo 30.7% 56.9% 12.4% 201 9.7%Gampaha 34.6% 49.4% 16.1% 192 8.6%Kalutara 23.4% 56.9% 19.7% 137 6.8%Kandy 37.5% 53.5% 9.0% 174 6.6%Matale 24.0% 69.6% 6.4% 68 2.3%Nuwaraeliya 34.9% 50.4% 14.7% 108 3.5%Galle 25.2% 53.1% 21.7% 122 5.0%Matara 26.1% 62.1% 11.7% 123 4.5%Hambantota 14.8% 67.5% 17.7% 78 3.0%Jaffna 30.7% 49.1% 20.2% 71 2.2%Mannar 38.5% 50.5% 11.0% 51 0.4%Vavuniya 33.8% 50.4% 15.8% 59 0.6%Mullaitivu 24.5% 60.0% 15.4% 53 0.4%Killinochchi 40.2% 47.9% 11.9% 56 0.5%Batticaloa 28.1% 60.5% 11.4% 92 3.1%Ampara 31.2% 59.7% 9.2% 115 3.7%Trincomalee 20.5% 64.5% 15.0% 85 2.4%Kurunegala 26.5% 64.5% 9.0% 229 9.7%Puttalam 20.5% 61.1% 18.4% 96 3.6%Anuradhapura 27.4% 50.8% 21.8% 118 5.1%Polonnaruwa 24.4% 64.3% 11.4% 86 2.8%Badulla 30.1% 56.8% 13.1% 93 3.0%Monaragala 20.5% 53.7% 25.8% 96 3.0%Ratnapura 20.8% 62.4% 16.7% 153 5.9%Kegalle 28.1% 54.6% 17.3% 94 3.5%

159Childhood malnutrition in Sri Lanka: a road map for the last mile
Table 8Unadjusted Odds Ratios for the determinants of wasting in children than 2 years in contrast to those without wasting (WHZ≥0): Results of bivariate regression analysis
Variable Category Unadjusted OR
95% CI P value
Lower Upper
Age Category (months) 0-5 1.00
6-8 0.58 0.38 0.89 .013
9-11 0.73 0.47 1.14 .168
12-18 0.76 0.53 1.09 .133
18-23 0.78 0.53 1.15 .207
Sex of child Female 1.00
Male 1.11 0.87 1.41 .397
Time of delivery <37 weeks 2.25 1.33 3.80 .003
≥ 37 weeks 1.00
Birth weight (kg) <2.0 5.19 2.36 11.43 .000
2.0-2.49 2.62 1.79 3.83 .000
2.5-2.99 1.48 1.13 1.95 .004
3.00 & above 1.00
Appropriately fed a Yes 1.00
No 0.77 0.58 1.03 .082
Given foods of animal origin
Yes 1.00
No 1.13 0.84 1.51 .429
Child <6 months 1.31 0.92 1.87 .131
Given snacks (sugary food/ biscuits, bites etc.)
Yes 0.83 0.65 1.06 .134
No 1.00
Any acute illness past 2 weeks
Had ARI or diarrhoea 1.20 .87 1.67 0.27
None 1.00
Maternal education Passed Gr 1-5 or less 1.87 1.03 3.39 .040
Passed Gr 6-10 1.92 1.43 2.59 .000
Passed GCE (OL) 1.52 1.07 2.15 .019
Passed GEC (AL), di-ploma, degree 1.00
Has enough money for daily expenses b
No 1.48 1.08 2.03 .014
Yes 1.00
Access to drinking water Improved sources 1.00
Unimproved sources 0.96 0.67 1.37 .808
Access to latrines Improved, non-shared latrines 1.00
Improved, shared 1.34 0.88 2.04 .169
Unimproved 2.01 0.79 5.12 .141
Use of solid fuel (biomass) for cooking
Solid 1.44 1.10 1.87 .007
Non-solid 1.00
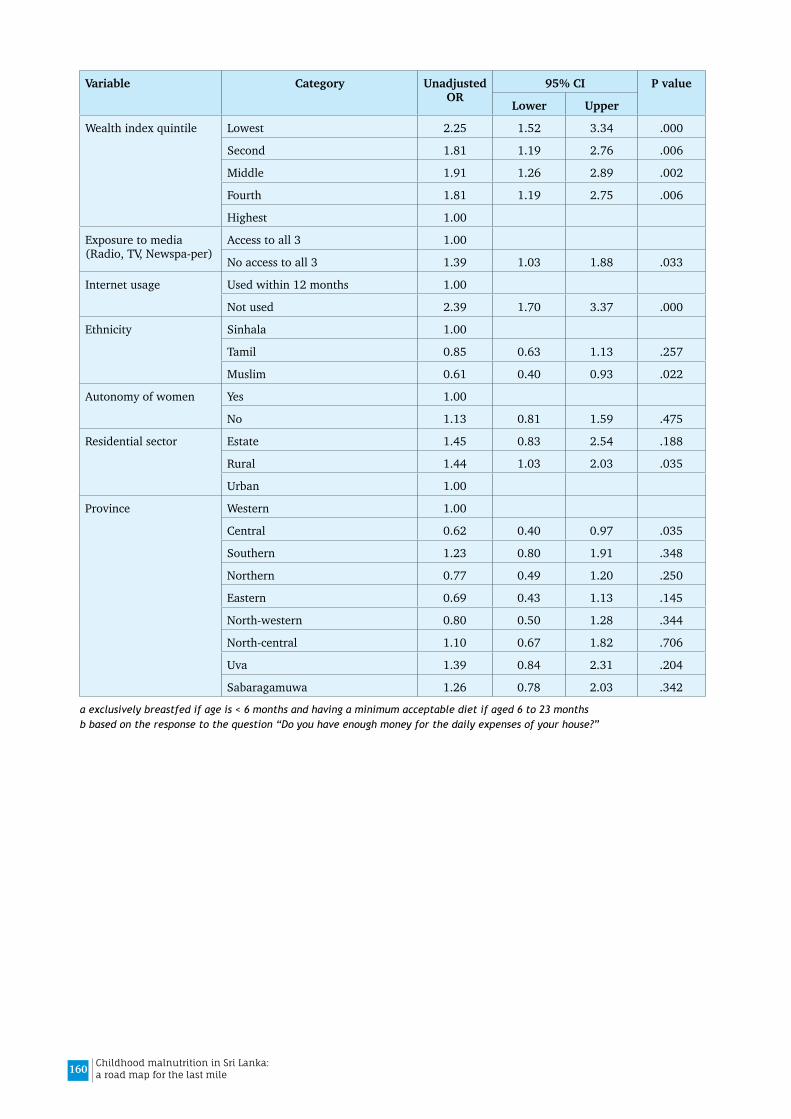
160 Childhood malnutrition in Sri Lanka: a road map for the last mile
Variable Category Unadjusted OR
95% CI P value
Lower Upper
Wealth index quintile Lowest 2.25 1.52 3.34 .000
Second 1.81 1.19 2.76 .006
Middle 1.91 1.26 2.89 .002
Fourth 1.81 1.19 2.75 .006
Highest 1.00
Exposure to media (Radio, TV, Newspa-per)
Access to all 3 1.00
No access to all 3 1.39 1.03 1.88 .033
Internet usage Used within 12 months 1.00
Not used 2.39 1.70 3.37 .000
Ethnicity Sinhala 1.00
Tamil 0.85 0.63 1.13 .257
Muslim 0.61 0.40 0.93 .022
Autonomy of women Yes 1.00
No 1.13 0.81 1.59 .475
Residential sector Estate 1.45 0.83 2.54 .188
Rural 1.44 1.03 2.03 .035
Urban 1.00
Province Western 1.00
Central 0.62 0.40 0.97 .035
Southern 1.23 0.80 1.91 .348
Northern 0.77 0.49 1.20 .250
Eastern 0.69 0.43 1.13 .145
North-western 0.80 0.50 1.28 .344
North-central 1.10 0.67 1.82 .706
Uva 1.39 0.84 2.31 .204
Sabaragamuwa 1.26 0.78 2.03 .342
a exclusively breastfed if age is < 6 months and having a minimum acceptable diet if aged 6 to 23 monthsb based on the response to the question “Do you have enough money for the daily expenses of your house?”

161Childhood malnutrition in Sri Lanka: a road map for the last mile
Annex 4.3
Differentials of low birth weight – SLDHS 2016The present analysis was restricted to the youngest child (n=7648) since some of the co-variates refer to the youngest child. However, the corresponding table in the DHS 2016 report used all live-born children (n=8193) which gives the prevalence estimate of 15.7%.
Table 1Differentials of Low birth weight in children 0-59 age (n=7648), SLDHS 2016
Birth weight Total
<2500 g ≥2500g
Row N % Row N % Unweighted Count
Column N %
Mother’s age at birth (years)
<20 17.9% 82.1% 74 1.0%
20-34 14.2% 85.8% 5433 70.7%
35-49 14.2% 85.8% 2141 28.3%
Child's year of birth 2011 12.7% 87.3% 816 10.5%
2012 12.8% 87.2% 1567 20.5%
2013 14.9% 85.1% 1670 21.7%
2014 14.6% 85.4% 1494 19.7%
2015 14.7% 85.3% 1465 19.3%
2016 15.9% 84.1% 636 8.3%
Time gap from previous childbirth to present conception
<24 months 11.5% 88.5% 872 10.9%
24-47 months 11.9% 88.1% 1684 21.6%
48-59 months 14.2% 85.8% 700 9.0%
60 months and longer 16.4% 83.6% 1373 18.7%
single child 15.2% 84.8% 3019 39.8%
Wanted pregnancy at that time
Yes 15.1% 84.9% 265 82.7%
No 13.1% 86.9% 54 17.3%
POAa at booking ANC visit
<12 weeks 13.8% 86.2% 5741 88.9%
12 weeks or later 18.1% 81.9% 793 11.1%
Birth order First born 15.8% 84.2% 2966 39.2%
2nd or more 13.2% 86.8% 4682 60.8%
Time of delivery <37 weeks 50.4% 49.6% 355 4.9%
≥37 weeks 12.4% 87.6% 7293 95.1%
Maternal education Passed Gr 1-5 or less 23.1% 76.9% 388 4.3%
Passed Gr 6-10 16.2% 83.8% 3386 43.7%
Passed GCE (OL) 13.5% 86.5% 1718 22.2%
Passed GEC (AL), di-ploma, degree
10.7% 89.3% 2156 29.8%
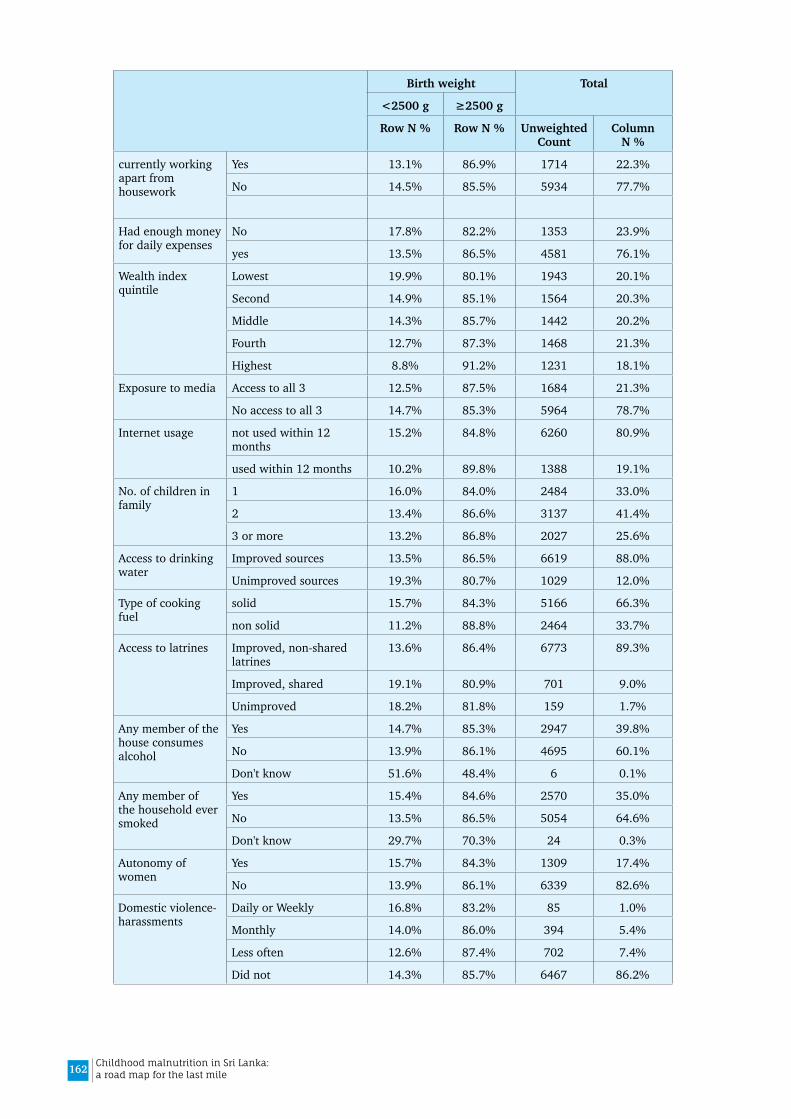
162 Childhood malnutrition in Sri Lanka: a road map for the last mile
Birth weight Total
<2500 g ≥2500g
Row N % Row N % Unweighted Count
Column N %
currently working apart from housework
Yes 13.1% 86.9% 1714 22.3%
No 14.5% 85.5% 5934 77.7%
Had enough money for daily expenses
No 17.8% 82.2% 1353 23.9%
yes 13.5% 86.5% 4581 76.1%
Wealth index quintile
Lowest 19.9% 80.1% 1943 20.1%
Second 14.9% 85.1% 1564 20.3%
Middle 14.3% 85.7% 1442 20.2%
Fourth 12.7% 87.3% 1468 21.3%
Highest 8.8% 91.2% 1231 18.1%
Exposure to media Access to all 3 12.5% 87.5% 1684 21.3%
No access to all 3 14.7% 85.3% 5964 78.7%
Internet usage not used within 12 months
15.2% 84.8% 6260 80.9%
used within 12 months 10.2% 89.8% 1388 19.1%
No. of children in family
1 16.0% 84.0% 2484 33.0%
2 13.4% 86.6% 3137 41.4%
3 or more 13.2% 86.8% 2027 25.6%
Access to drinking water
Improved sources 13.5% 86.5% 6619 88.0%
Unimproved sources 19.3% 80.7% 1029 12.0%
Type of cooking fuel
solid 15.7% 84.3% 5166 66.3%
non solid 11.2% 88.8% 2464 33.7%
Access to latrines Improved, non-shared latrines
13.6% 86.4% 6773 89.3%
Improved, shared 19.1% 80.9% 701 9.0%
Unimproved 18.2% 81.8% 159 1.7%
Any member of the house consumes alcohol
Yes 14.7% 85.3% 2947 39.8%
No 13.9% 86.1% 4695 60.1%
Don't know 51.6% 48.4% 6 0.1%
Any member of the household ever smoked
Yes 15.4% 84.6% 2570 35.0%
No 13.5% 86.5% 5054 64.6%
Don't know 29.7% 70.3% 24 0.3%
Autonomy of women
Yes 15.7% 84.3% 1309 17.4%
No 13.9% 86.1% 6339 82.6%
Domestic violence-harassments
Daily or Weekly 16.8% 83.2% 85 1.0%
Monthly 14.0% 86.0% 394 5.4%
Less often 12.6% 87.4% 702 7.4%
Did not 14.3% 85.7% 6467 86.2%

163Childhood malnutrition in Sri Lanka: a road map for the last mile
Birth weight Total<2500 g ≥2500gRow N % Row N % Unweighted
CountColumn
N %
Ethnicity other 6.2% 93.8% 25 0.3%Muslim 10.9% 89.1% 848 10.9%Tamil 15.7% 84.3% 1826 14.9%Sinhalese 14.4% 85.6% 4949 73.8%
Religion Buddhist 14.6% 85.4% 4655 69.3%Hindu 16.6% 83.4% 1420 11.7%Islam 10.8% 89.2% 913 11.6%Christian 12.4% 87.6% 660 7.4%
sector Estate 23.6% 76.4% 485 4.1%Rural 14.3% 85.7% 5959 80.2%Urban 11.5% 88.5% 1204 15.6%
Province Western 12.8% 87.2% 1443 24.8%Central 15.3% 84.7% 983 13.2%Southern 13.7% 86.3% 853 11.9%Northern 9.1% 90.9% 929 4.8%Eastern 13.8% 86.2% 862 9.8%North-western 14.2% 85.8% 831 12.1%North-central 14.6% 85.4% 525 7.6%Uva 15.5% 84.5% 543 6.6%Sabaragamuwa 18.9% 81.1% 679 9.2%
District Colombo 11.2% 88.8% 505 8.8%Gampaha 13.1% 86.9% 578 9.5%Kalutara 14.5% 85.5% 360 6.4%Kandy 13.9% 86.1% 489 7.1%Matale 13.3% 86.7% 203 2.8%Nuwaraeliya 19.9% 80.1% 291 3.4%Galle 12.1% 87.9% 351 5.1%Matara 17.7% 82.3% 302 4.1%Hambantota 10.7% 89.3% 200 2.7%Jaffna 6.4% 93.6% 216 2.5%Mannar 11.6% 88.4% 189 0.5%Vavuniya 17.0% 83.0% 187 0.8%Mullaitivu 8.0% 92.0% 162 0.5%Killinochchi 8.9% 91.1% 175 0.6%Batticaloa 14.8% 85.2% 267 3.1%Ampara 13.8% 86.2% 363 4.3%Trincomalee 12.7% 87.3% 232 2.4%Kurunegala 12.8% 87.2% 567 8.6%Puttalam 17.6% 82.4% 264 3.5%Anuradhapura 14.1% 85.9% 328 5.2%Polonnaruwa 15.7% 84.3% 197 2.4%Badulla 15.2% 84.8% 290 3.6%Monaragala 16.0% 84.0% 253 3.0%Ratnapura 20.4% 79.6% 402 5.6%Kegalle 16.6% 83.4% 277 3.6%
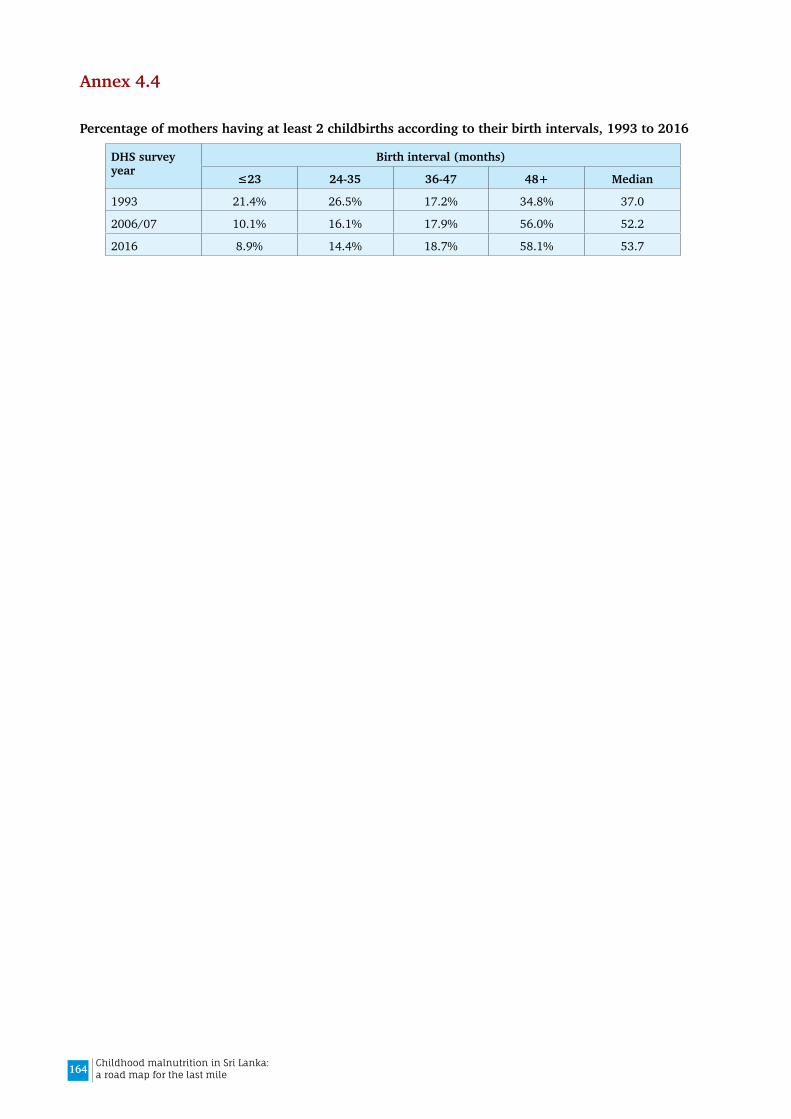
164 Childhood malnutrition in Sri Lanka: a road map for the last mile
Annex 4.4
Percentage of mothers having at least 2 childbirths according to their birth intervals, 1993 to 2016
DHS survey year
Birth interval (months)
≤23 24-35 36-47 48+ Median
1993 21.4% 26.5% 17.2% 34.8% 37.0
2006/07 10.1% 16.1% 17.9% 56.0% 52.2
2016 8.9% 14.4% 18.7% 58.1% 53.7
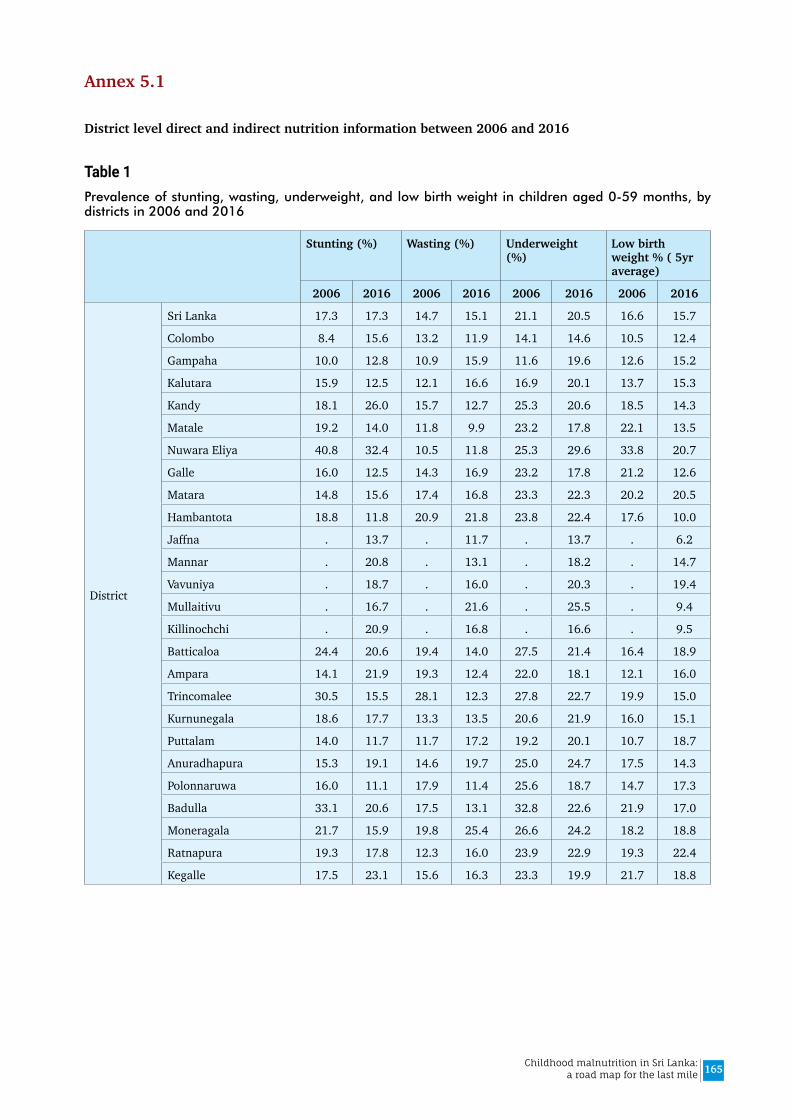
165Childhood malnutrition in Sri Lanka: a road map for the last mile
Annex 5.1
District level direct and indirect nutrition information between 2006 and 2016
Table 1Prevalence of stunting, wasting, underweight, and low birth weight in children aged 0-59 months, by districts in 2006 and 2016
Stunting (%) Wasting (%) Underweight (%)
Low birth weight % ( 5yr average)
2006 2016 2006 2016 2006 2016 2006 2016
District
Sri Lanka 17.3 17.3 14.7 15.1 21.1 20.5 16.6 15.7
Colombo 8.4 15.6 13.2 11.9 14.1 14.6 10.5 12.4
Gampaha 10.0 12.8 10.9 15.9 11.6 19.6 12.6 15.2
Kalutara 15.9 12.5 12.1 16.6 16.9 20.1 13.7 15.3
Kandy 18.1 26.0 15.7 12.7 25.3 20.6 18.5 14.3
Matale 19.2 14.0 11.8 9.9 23.2 17.8 22.1 13.5
Nuwara Eliya 40.8 32.4 10.5 11.8 25.3 29.6 33.8 20.7
Galle 16.0 12.5 14.3 16.9 23.2 17.8 21.2 12.6
Matara 14.8 15.6 17.4 16.8 23.3 22.3 20.2 20.5
Hambantota 18.8 11.8 20.9 21.8 23.8 22.4 17.6 10.0
Jaffna . 13.7 . 11.7 . 13.7 . 6.2
Mannar . 20.8 . 13.1 . 18.2 . 14.7
Vavuniya . 18.7 . 16.0 . 20.3 . 19.4
Mullaitivu . 16.7 . 21.6 . 25.5 . 9.4
Killinochchi . 20.9 . 16.8 . 16.6 . 9.5
Batticaloa 24.4 20.6 19.4 14.0 27.5 21.4 16.4 18.9
Ampara 14.1 21.9 19.3 12.4 22.0 18.1 12.1 16.0
Trincomalee 30.5 15.5 28.1 12.3 27.8 22.7 19.9 15.0
Kurnunegala 18.6 17.7 13.3 13.5 20.6 21.9 16.0 15.1
Puttalam 14.0 11.7 11.7 17.2 19.2 20.1 10.7 18.7
Anuradhapura 15.3 19.1 14.6 19.7 25.0 24.7 17.5 14.3
Polonnaruwa 16.0 11.1 17.9 11.4 25.6 18.7 14.7 17.3
Badulla 33.1 20.6 17.5 13.1 32.8 22.6 21.9 17.0
Moneragala 21.7 15.9 19.8 25.4 26.6 24.2 18.2 18.8
Ratnapura 19.3 17.8 12.3 16.0 23.9 22.9 19.3 22.4
Kegalle 17.5 23.1 15.6 16.3 23.3 19.9 21.7 18.8

166 Childhood malnutrition in Sri Lanka: a road map for the last mile
Table 2IYCF and health service indicators by districts in 2006 and 2016
Exclusive breastfeeding
rate 0-5 months
Minimum acceptable diet in 6-23
months aged
Average number of weighing per infant
% children received Iron
supplementation last 2 weeks
% children received Vit A last 6 months
% children given deworming last
6 months
2006 2016 2006 2016 2006 2016 2006 2016 2006 2016 2006 2016
District
Sri Lanka 75.8 82.2 66.3 72.3 . 10.7 7.6 7.5 . 55.2 66.1 65.2
Colombo 75.4 84.4 74.1 81.2 . 8.0 10.9 9.0 . 39.3 63.4 60.8
Gampaha 76.4 89.3 74.3 74.5 . 10.3 7.5 5.2 . 56.9 67.6 65.3
Kalutara 58.4 88.0 77.2 78.8 . 10.5 6.7 4.2 . 34.6 74.9 69.6
Kandy 85.5 78.0 65.3 65.7 . 10.4 6.0 4.5 . 45.7 68.4 59.6
Matale 89.9 95.3 65.6 79.1 . 10.9 7.4 5.3 . 74.6 63.5 82.3
Nuwara Eliya 57.2 96.4 61.1 66.1 . 11.1 7.4 4.2 . 50.0 57.0 70.5
Galle 64.6 78.2 73.6 84.0 . 10.6 9.0 5.2 . 47.8 72.4 60.6
Matara 60.6 87.5 77.1 84.3 . 10.8 2.6 5.1 . 76.1 62.4 72.9
Hambantota 89.9 86.4 58.5 77.8 . 11.0 4.1 1.5 . 66.9 63.9 72.0
Jaffna . 69.5 41.2 . 11.9 . 14.4 . 53.8 . 60.8
Mannar . 74.1 56.6 . 10.8 . 4.1 . 40.4 . 74.8
Vavuniya . 75.1 20.3 . 11.6 . 11.0 . 39.2 . 43.5
Mullaitivu . 97.3 49.3 . 10.2 . 1.6 . 68.7 . 50.6
Killinochchi . 78.7 46.7 . 11.0 . 13.3 . 64.9 . 62.4
Batticaloa 78.9 72.0 64.6 40.1 . 11.0 21.6 42.9 . 63.7 40.2 66.0
Ampara 38.0 90.4 61.0 59.2 . 11.2 15.8 9.9 . 70.0 70.3 60.2
Trincomalee 71.7 60.5 23.0 50.6 . 10.1 5.6 19.0 . 43.2 47.1 66.1
Kurnunegala 76.2 86.4 73.0 73.3 . 12.1 6.9 5.3 . 37.8 61.6 64.1
Puttalam 100.0 82.2 58.8 70.5 . 10.9 5.6 10.0 . 64.7 66.7 51.2
Anuradhapura 84.8 90.1 52.6 78.2 . 10.8 1.5 5.9 . 53.3 72.8 60.2
Polonnaruwa 89.9 72.2 67.3 66.3 . 10.6 10.7 5.4 . 70.1 77.7 75.7
Badulla 84.8 72.8 44.0 70.7 . 11.1 8.2 4.9 . 61.7 60.4 69.7
Moneragala 82.9 59.3 72.7 75.2 . 11.8 3.5 7.8 . 69.1 71.3 69.0
Ratnapura 77.5 73.4 66.3 78.9 . 10.8 5.8 3.7 . 79.6 72.8 75.7
Kegalle 81.1 86.4 76.1 80.5 . 10.6 2.2 6.9 . 65.3 79.5 61.0

167Childhood malnutrition in Sri Lanka: a road map for the last mile
Table 3Total population, infant and under 5 year mortality and unmet need of family planning by district, 2006 and 2016
Total population(000)
Infant mortality rate
Under 5 mortality rate
Unmet need of family planning
2006 2016 2006 2016 2006 2016 2006 2016
District
Sri Lanka 19886.0 21203.0 . . . . 31.6 35.4
Colombo 2421.0 2395.0 15.0 9.0 16.0 9.0 34.8 39.5
Gampaha 2125.0 2372.0 14.0 5.0 15.0 7.0 32.7 32.7
Kalutara 1102.0 1261.0 6.0 16.0 9.0 16.0 30.2 26.2
Kandy 1361.0 1434.0 22.0 9.0 25.0 12.0 30.9 38.2
Matale 471.0 508.0 26.0 14.0 31.0 14.0 29.3 28.6
Nuwara Eliya 735.0 748.0 19.0 9.0 22.0 9.0 30.5 33.4
Galle 1040.0 1102.0 18.0 8.0 24.0 10.0 26.4 29.4
Matara 804.0 845.0 14.0 7.0 18.0 7.0 31.2 35.0
Hambantota 547.0 637.0 19.0 8.0 19.0 8.0 30.5 35.5
Jaffna 595.0 602.0 . 10.0 . 15.0 . 53.4
Mannar 100.0 122.0 . 3.0 . 4.0 . 81.6
Vavuniya 164.0 106.0 . 15.0 . 15.0 . 67.0
Mullaitivu 145.0 182.0 . 22.0 . 22.0 . 32.8
Killinochchi 142.0 95.0 . 28.0 . 44.0 . 41.6
Batticaloa 556.0 550.0 5.0 10.0 8.0 10.0 65.5 68.5
Ampara 627.0 691.0 27.0 17.0 54.0 17.0 44.3 54.3
Trincomalee 395.0 404.0 21.0 25.0 26.0 26.0 47.2 51.4
Kurnunegala 1511.0 1676.0 29.0 10.0 32.0 12.0 24.5 30.5
Puttalam 745.0 801.0 23.0 19.0 32.0 22.0 33.9 30.7
Anuradhapura 791.0 905.0 27.0 10.0 29.0 12.0 26.0 32.8
Polonnaruwa 382.0 425.0 5.0 .0 13.0 3.0 22.2 27.7
Badulla 837.0 854.0 31.0 10.0 33.0 13.0 27.6 28.7
Moneragala 420.0 479.0 21.0 6.0 28.0 6.0 28.9 27.3
Ratnapura 1073.0 1140.0 16.0 17.0 20.0 17.0 26.6 25.6
Kegalle 797.0 869.0 18.0 6.0 19.0 7.0 29.1 33.1

168 Childhood malnutrition in Sri Lanka: a road map for the last mile
Table 4Household food consumption and expenditure data by districts, 2006 and 2016
Per capita dietary energy consumption
Percent of short women 15-49 years
Average monthly household
expenditure on food
Percentage expenditure
on food
Poverty Head Count
Index
Percentage of poor
household
2006 2016 2006 2016 2006 2016 2006 2016 2006 2016 2006 2016
District
Sri Lanka 2118.0 2095.0 10.60 7.20 8641.0 19114.0 37.60 34.80 15.2 4.1 12.60 3.10
Colombo 1920.0 1948.0 8.20 5.80 10795.0 26066.0 29.20 28.70 5.4 .9 3.90 .60
Gampaha 1985.0 1961.0 7.70 4.80 9487.0 20392.0 32.60 31.60 8.7 2.0 7.20 1.30
Kalutara 2075.0 1951.0 10.40 7.20 9484.0 19521.0 38.10 30.40 13.0 2.9 10.30 2.30
Kandy 2137.0 2033.0 11.60 9.90 8709.0 18457.0 40.00 33.90 17.0 5.5 13.90 4.20
Matale 2144.0 2111.0 9.70 9.20 7277.0 17371.0 38.20 36.40 18.9 3.9 15.70 3.20
Nuwara Eliya 2383.0 2323.0 17.50 12.70 7665.0 18837.0 53.90 42.80 33.8 6.3 27.50 4.50
Galle 2077.0 2007.0 16.80 7.10 8935.0 18171.0 38.70 34.10 13.7 2.9 10.70 2.00
Matara 2137.0 2094.0 10.70 8.30 8372.0 17117.0 39.20 36.20 14.7 4.4 11.70 3.70
Hambantota 2309.0 2343.0 10.30 6.50 8293.0 18981.0 40.30 33.40 12.7 1.2 10.50 1.10
Jaffna . 2164.0 . 3.70 . 18479.0 . 42.40 . 7.7 . 6.00
Mannar . 2230.0 . 3.00 . 22241.0 . 47.50 . 1.0 . .90
Vavuniya . 2315.0 . 5.80 . 19621.0 . 37.90 . 2.0 . 1.50
Mullaitivu . 2167.0 . 5.90 . 16281.0 . 50.00 . 12.7 . 11.20
Killinochchi . 2018.0 . 3.50 . 14688.0 . 51.60 . 18.2 . 15.00
Batticaloa 2109.0 2002.0 8.80 6.10 10499.0 18721.0 48.60 57.10 10.7 11.3 9.50 8.10
Ampara 2223.0 2141.0 8.60 5.60 10330.0 20936.0 46.30 49.10 10.9 2.6 8.70 2.10
Trincomalee . 1959.0 13.40 8.00 . 18112.0 . 46.10 . 10.0 . 6.80
Kurnunegala 2162.0 2179.0 9.90 7.10 7478.0 17670.0 40.50 31.70 15.4 2.9 12.90 2.30
Puttalam 2140.0 2069.0 7.80 4.50 9254.0 21196.0 43.40 38.50 13.1 2.1 10.60 1.60
Anuradhapura 2207.0 2245.0 9.70 6.00 7254.0 17139.0 35.80 35.50 14.9 3.8 12.70 2.70
Polonnaruwa 2249.0 2250.0 9.30 5.90 7477.0 16618.0 35.30 34.70 12.7 2.2 10.00 1.70
Badulla 2240.0 2326.0 11.00 8.70 7132.0 16130.0 41.10 39.10 23.7 6.8 21.00 5.90
Moneragala 2313.0 2302.0 9.70 6.50 6820.0 15445.0 51.80 43.50 33.2 5.8 29.20 4.40
Ratnapura 2238.0 2192.0 15.10 11.80 7279.0 15732.0 44.30 40.80 26.6 6.5 21.50 4.80
Kegalle 2006.0 2041.0 10.90 7.70 7332.0 16835.0 46.50 34.70 21.0 7.1 18.40 5.40
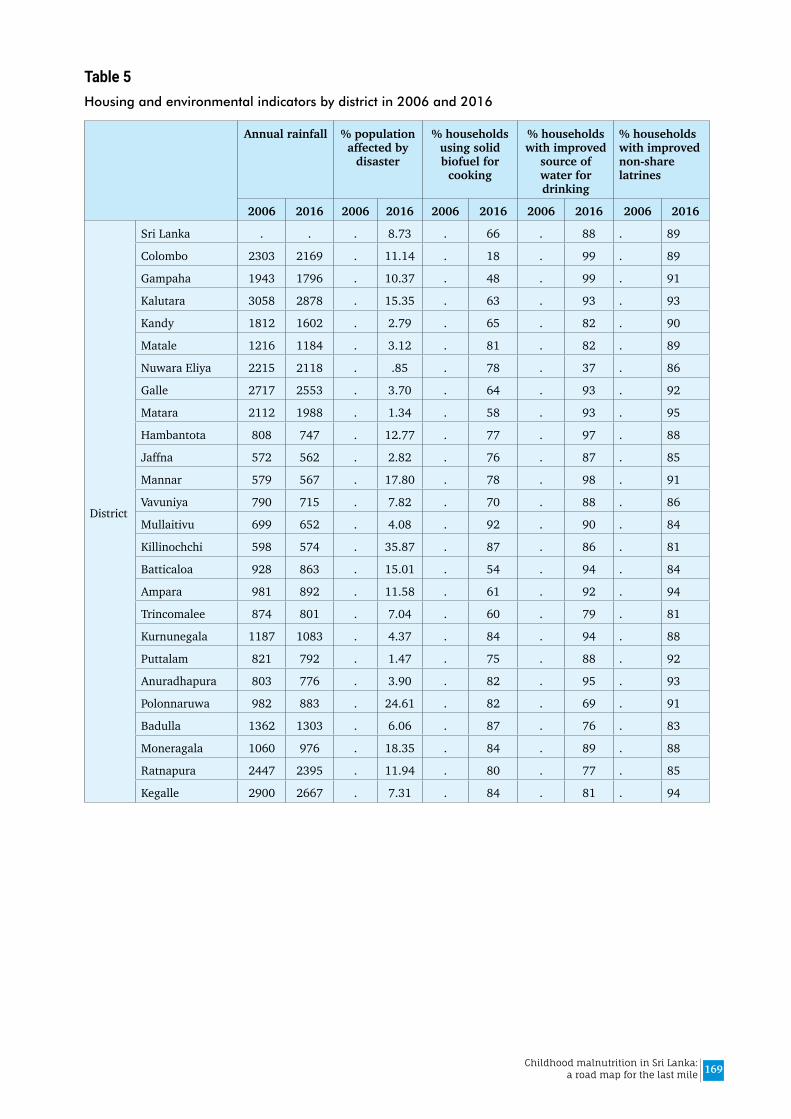
169Childhood malnutrition in Sri Lanka: a road map for the last mile
Table 5Housing and environmental indicators by district in 2006 and 2016
Annual rainfall % population affected by
disaster
% households using solid biofuel for
cooking
% households with improved
source of water for drinking
% households with improved non-share latrines
2006 2016 2006 2016 2006 2016 2006 2016 2006 2016
District
Sri Lanka . . . 8.73 . 66 . 88 . 89
Colombo 2303 2169 . 11.14 . 18 . 99 . 89
Gampaha 1943 1796 . 10.37 . 48 . 99 . 91
Kalutara 3058 2878 . 15.35 . 63 . 93 . 93
Kandy 1812 1602 . 2.79 . 65 . 82 . 90
Matale 1216 1184 . 3.12 . 81 . 82 . 89
Nuwara Eliya 2215 2118 . .85 . 78 . 37 . 86
Galle 2717 2553 . 3.70 . 64 . 93 . 92
Matara 2112 1988 . 1.34 . 58 . 93 . 95
Hambantota 808 747 . 12.77 . 77 . 97 . 88
Jaffna 572 562 . 2.82 . 76 . 87 . 85
Mannar 579 567 . 17.80 . 78 . 98 . 91
Vavuniya 790 715 . 7.82 . 70 . 88 . 86
Mullaitivu 699 652 . 4.08 . 92 . 90 . 84
Killinochchi 598 574 . 35.87 . 87 . 86 . 81
Batticaloa 928 863 . 15.01 . 54 . 94 . 84
Ampara 981 892 . 11.58 . 61 . 92 . 94
Trincomalee 874 801 . 7.04 . 60 . 79 . 81
Kurnunegala 1187 1083 . 4.37 . 84 . 94 . 88
Puttalam 821 792 . 1.47 . 75 . 88 . 92
Anuradhapura 803 776 . 3.90 . 82 . 95 . 93
Polonnaruwa 982 883 . 24.61 . 82 . 69 . 91
Badulla 1362 1303 . 6.06 . 87 . 76 . 83
Moneragala 1060 976 . 18.35 . 84 . 89 . 88
Ratnapura 2447 2395 . 11.94 . 80 . 77 . 85
Kegalle 2900 2667 . 7.31 . 84 . 81 . 94
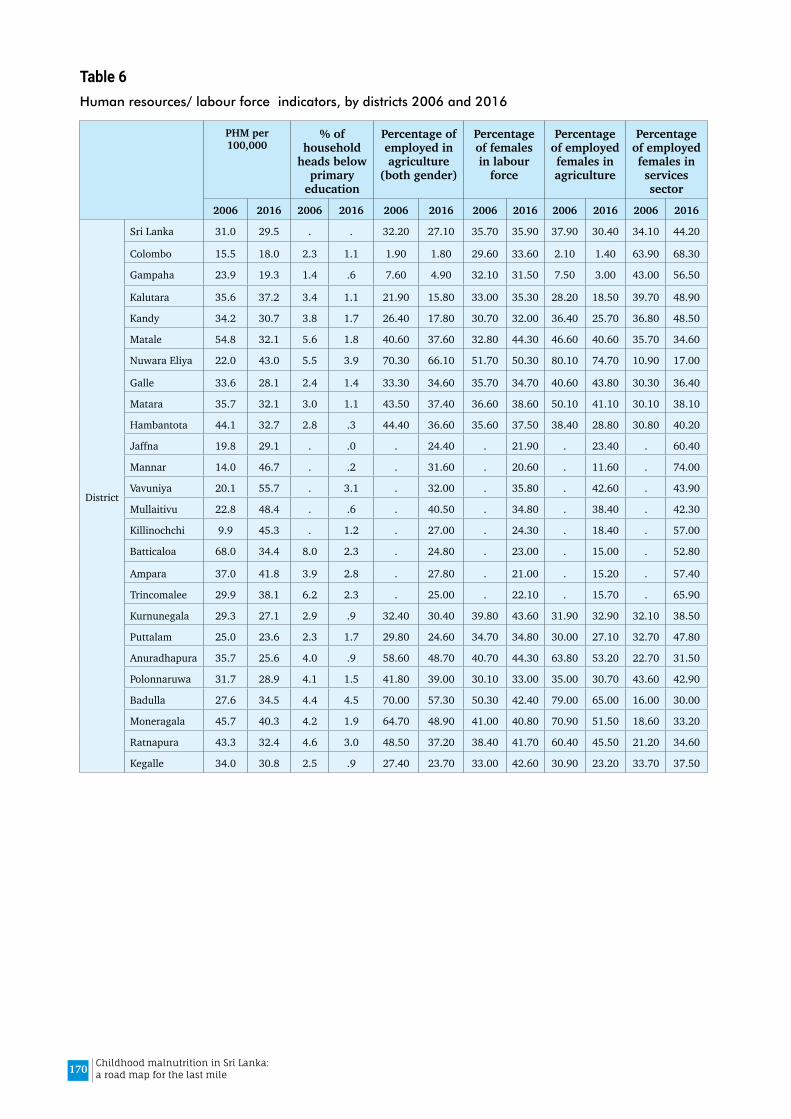
170 Childhood malnutrition in Sri Lanka: a road map for the last mile
Table 6Human resources/ labour force indicators, by districts 2006 and 2016
PHM per 100,000
% of household
heads below primary
education
Percentage of employed in agriculture
(both gender)
Percentage of females in labour
force
Percentage of employed females in agriculture
Percentage of employed females in services sector
2006 2016 2006 2016 2006 2016 2006 2016 2006 2016 2006 2016
District
Sri Lanka 31.0 29.5 . . 32.20 27.10 35.70 35.90 37.90 30.40 34.10 44.20
Colombo 15.5 18.0 2.3 1.1 1.90 1.80 29.60 33.60 2.10 1.40 63.90 68.30
Gampaha 23.9 19.3 1.4 .6 7.60 4.90 32.10 31.50 7.50 3.00 43.00 56.50
Kalutara 35.6 37.2 3.4 1.1 21.90 15.80 33.00 35.30 28.20 18.50 39.70 48.90
Kandy 34.2 30.7 3.8 1.7 26.40 17.80 30.70 32.00 36.40 25.70 36.80 48.50
Matale 54.8 32.1 5.6 1.8 40.60 37.60 32.80 44.30 46.60 40.60 35.70 34.60
Nuwara Eliya 22.0 43.0 5.5 3.9 70.30 66.10 51.70 50.30 80.10 74.70 10.90 17.00
Galle 33.6 28.1 2.4 1.4 33.30 34.60 35.70 34.70 40.60 43.80 30.30 36.40
Matara 35.7 32.1 3.0 1.1 43.50 37.40 36.60 38.60 50.10 41.10 30.10 38.10
Hambantota 44.1 32.7 2.8 .3 44.40 36.60 35.60 37.50 38.40 28.80 30.80 40.20
Jaffna 19.8 29.1 . .0 . 24.40 . 21.90 . 23.40 . 60.40
Mannar 14.0 46.7 . .2 . 31.60 . 20.60 . 11.60 . 74.00
Vavuniya 20.1 55.7 . 3.1 . 32.00 . 35.80 . 42.60 . 43.90
Mullaitivu 22.8 48.4 . .6 . 40.50 . 34.80 . 38.40 . 42.30
Killinochchi 9.9 45.3 . 1.2 . 27.00 . 24.30 . 18.40 . 57.00
Batticaloa 68.0 34.4 8.0 2.3 . 24.80 . 23.00 . 15.00 . 52.80
Ampara 37.0 41.8 3.9 2.8 . 27.80 . 21.00 . 15.20 . 57.40
Trincomalee 29.9 38.1 6.2 2.3 . 25.00 . 22.10 . 15.70 . 65.90
Kurnunegala 29.3 27.1 2.9 .9 32.40 30.40 39.80 43.60 31.90 32.90 32.10 38.50
Puttalam 25.0 23.6 2.3 1.7 29.80 24.60 34.70 34.80 30.00 27.10 32.70 47.80
Anuradhapura 35.7 25.6 4.0 .9 58.60 48.70 40.70 44.30 63.80 53.20 22.70 31.50
Polonnaruwa 31.7 28.9 4.1 1.5 41.80 39.00 30.10 33.00 35.00 30.70 43.60 42.90
Badulla 27.6 34.5 4.4 4.5 70.00 57.30 50.30 42.40 79.00 65.00 16.00 30.00
Moneragala 45.7 40.3 4.2 1.9 64.70 48.90 41.00 40.80 70.90 51.50 18.60 33.20
Ratnapura 43.3 32.4 4.6 3.0 48.50 37.20 38.40 41.70 60.40 45.50 21.20 34.60
Kegalle 34.0 30.8 2.5 .9 27.40 23.70 33.00 42.60 30.90 23.20 33.70 37.50


ISBN 978-92-9022-784-7
Des
igne
d by
011
2509
070