Socio-cultural determinants of infant malnutrition in Cameroon
Upload
healthfoodinnovationmanagementCategory
view
0download
0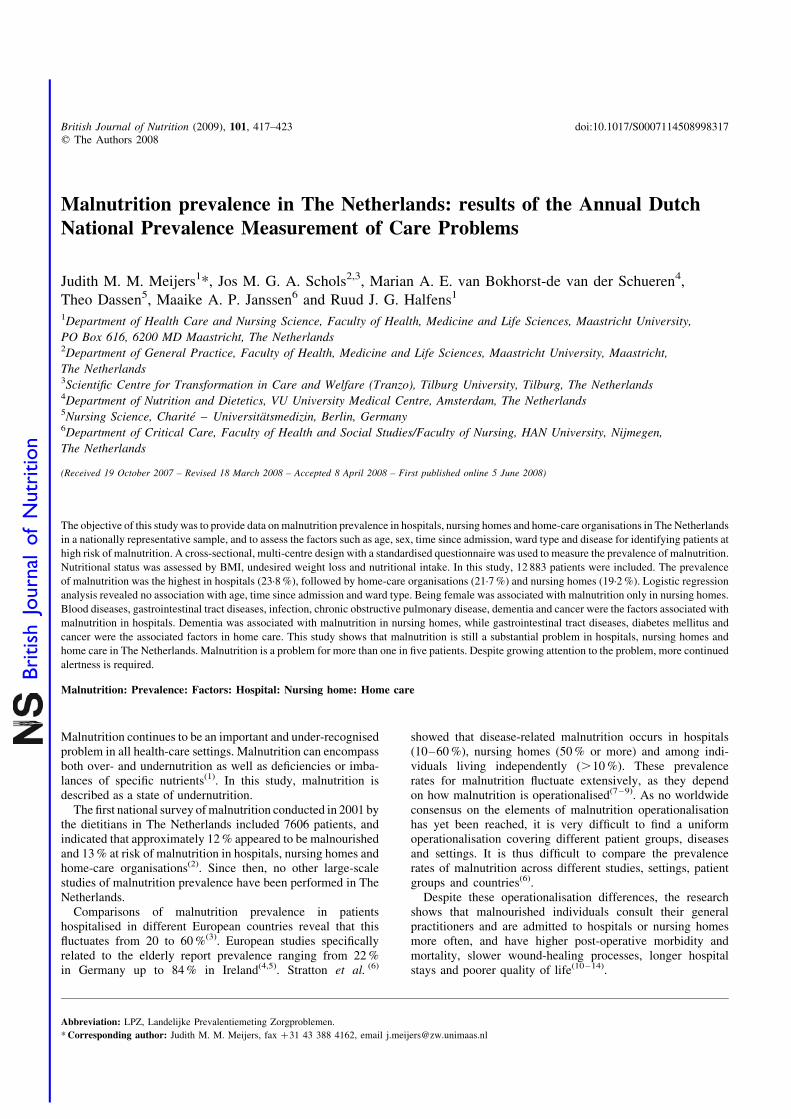
Malnutrition prevalence in The Netherlands: results of the Annual Dutch
National Prevalence Measurement of Care Problems
Judith M. M. Meijers1*, Jos M. G. A. Schols2,3, Marian A. E. van Bokhorst-de van der Schueren4,
Theo Dassen5, Maaike A. P. Janssen6 and Ruud J. G. Halfens1
1Department of Health Care and Nursing Science, Faculty of Health, Medicine and Life Sciences, Maastricht University,
PO Box 616, 6200 MD Maastricht, The Netherlands2Department of General Practice, Faculty of Health, Medicine and Life Sciences, Maastricht University, Maastricht,
The Netherlands3Scientific Centre for Transformation in Care and Welfare (Tranzo), Tilburg University, Tilburg, The Netherlands4Department of Nutrition and Dietetics, VU University Medical Centre, Amsterdam, The Netherlands5Nursing Science, Charite – Universitatsmedizin, Berlin, Germany6Department of Critical Care, Faculty of Health and Social Studies/Faculty of Nursing, HAN University, Nijmegen,
The Netherlands
(Received 19 October 2007 – Revised 18 March 2008 – Accepted 8 April 2008 – First published online 5 June 2008)
The objective of this study was to provide data on malnutrition prevalence in hospitals, nursing homes and home-care organisations in The Netherlands
in a nationally representative sample, and to assess the factors such as age, sex, time since admission, ward type and disease for identifying patients at
high risk of malnutrition. A cross-sectional, multi-centre design with a standardised questionnaire was used to measure the prevalence of malnutrition.
Nutritional status was assessed by BMI, undesired weight loss and nutritional intake. In this study, 12 883 patients were included. The prevalence
of malnutrition was the highest in hospitals (23·8 %), followed by home-care organisations (21·7 %) and nursing homes (19·2 %). Logistic regression
analysis revealed no association with age, time since admission and ward type. Being female was associated with malnutrition only in nursing homes.
Blood diseases, gastrointestinal tract diseases, infection, chronic obstructive pulmonary disease, dementia and cancer were the factors associated with
malnutrition in hospitals. Dementia was associated with malnutrition in nursing homes, while gastrointestinal tract diseases, diabetes mellitus and
cancer were the associated factors in home care. This study shows that malnutrition is still a substantial problem in hospitals, nursing homes and
home care in The Netherlands. Malnutrition is a problem for more than one in five patients. Despite growing attention to the problem, more continued
alertness is required.
Malnutrition: Prevalence: Factors: Hospital: Nursing home: Home care
Malnutrition continues to be an important and under-recognisedproblem in all health-care settings. Malnutrition can encompassboth over- and undernutrition as well as deficiencies or imba-lances of specific nutrients(1). In this study, malnutrition isdescribed as a state of undernutrition.
The first national survey of malnutrition conducted in 2001 bythe dietitians in The Netherlands included 7606 patients, andindicated that approximately 12 % appeared to be malnourishedand 13 % at risk of malnutrition in hospitals, nursing homes andhome-care organisations(2). Since then, no other large-scalestudies of malnutrition prevalence have been performed in TheNetherlands.
Comparisons of malnutrition prevalence in patientshospitalised in different European countries reveal that thisfluctuates from 20 to 60 %(3). European studies specificallyrelated to the elderly report prevalence ranging from 22 %in Germany up to 84 % in Ireland(4,5). Stratton et al. (6)
showed that disease-related malnutrition occurs in hospitals(10–60 %), nursing homes (50 % or more) and among indi-viduals living independently (.10 %). These prevalencerates for malnutrition fluctuate extensively, as they dependon how malnutrition is operationalised(7 – 9). As no worldwideconsensus on the elements of malnutrition operationalisationhas yet been reached, it is very difficult to find a uniformoperationalisation covering different patient groups, diseasesand settings. It is thus difficult to compare the prevalencerates of malnutrition across different studies, settings, patientgroups and countries(6).
Despite these operationalisation differences, the researchshows that malnourished individuals consult their generalpractitioners and are admitted to hospitals or nursing homesmore often, and have higher post-operative morbidity andmortality, slower wound-healing processes, longer hospitalstays and poorer quality of life(10 – 14).
*Corresponding author: Judith M. M. Meijers, fax þ31 43 388 4162, email [email protected]
Abbreviation: LPZ, Landelijke Prevalentiemeting Zorgproblemen.
British Journal of Nutrition (2009), 101, 417–423 doi:10.1017/S0007114508998317q The Authors 2008
British
Journal
ofNutrition

Obtaining insight into factors for malnutrition should makeit possible to identify subgroups of patients at risk. This mayhave a positive effect on preventing malnutrition and its con-sequences(6). The main risk factor, especially in hospitals,home care and nursing homes, is disease(15). There are numer-ous reasons for this; Stratton et al. (6), for example, highlighteda diversity of disease-related aspects that decrease food intakeeven when food is available, including loss of appetite, anor-exia, nausea, psychological problems and difficulties in chew-ing, tasting, swallowing and digestion. Furthermore, theydemonstrated that nutrient requirements are increased by dise-ase, which indicates that even normal intake could be insuffi-cient for such patients.
Another factor influencing malnutrition is age. Higher ageis associated with increased risk of malnutrition, as diseaseprevalence in this group increases and body compositionchanges(4,16 – 20).
Sex, too, is another possible factor that could influence mal-nutrition as body composition changes occur differently inmen and women in the various ageing phases, thus influencingthe assessment and screening of malnutrition(21). Perissinottoet al. (19) found an adjusted malnutrition prevalence rate thatwas higher for women than for men in the elderly. Pirlichet al. (20), however, found no such sex influence.
Due to increasing awareness in developed countries of theimportance of recognising malnutrition in health care andthe fact that only one extensive study on malnutrition preva-lence has been performed in The Netherlands, this studyaimed to investigate malnutrition prevalence in Dutch hospi-tals, nursing homes and home-care organisations on a largerepresentative scale, and to draw more attention from health-care professionals to the problem of malnutrition. Addition-ally, the association of factors such as age, sex, disease,ward type and time since admission was assessed to identifypatients at risk of malnutrition.
Methods
Design
This study is part of the Annual National Prevalence Measure-ment of Care Problems of Maastricht University (LandelijkePrevalentiemeting Zorgproblemen (LPZ)), which startedmeasuring malnutrition in 2004. The design involves across-sectional, multi-centre point prevalence measurement.
Instrument
A standardised questionnaire was used to register data on theorganisation itself, wards included and individual patients,including demographic data, reason for admission (registeredin the medical records) and nutritional items such as amountof undesirable weight loss (6 kg in the previous 6 months or3 kg in the previous month) and nutritional intake (none for3 d or reduced for more than 10 d). These items were obtainedby having trained professionals measure the patients’ heightand weight. When being weighed, the patients wore lightindoor clothes and no shoes, and sat or stood on a calibratedscale. BMI was calculated later by the research group.The nutritional item ‘undesired weight loss’ was measuredin kilograms, as this is faster and simpler for the nurses than
calculating the weight-loss percentage. Weight loss wasassessed from earlier recorded weights in the charts, or, ifmissing, from recalled weight.
The large LPZ population is heterogeneous and incorporatespatients from different age groups (range: 18–104 years) andsettings, further complicating the operationalisation of malnu-trition. Based on the literature and consultation with Dutchexperts in the field, malnutrition was defined according toone of the three following criteria: (1) BMI less than18·5 kg/m2; (2) unintentional weight loss (6 kg in the previous6 months or 3 kg in the previous month) or (3) BMI between18·5 and 20 kg/m2 in combination with no nutritional intakefor 3 d or reduced intake for more than 10 d(6,9,21 – 24).
Sample
For the LPZ study, all health-care organisations in TheNetherlands were invited by mail to participate voluntarily.Fifty-seven university and general hospitals (60·6 % of theDutch total of 94), thirty-nine nursing homes (11·3 % of theDutch total of 345) and nineteen home-care organisations(12·6 % of the Dutch total of 150) were included. Onlypatients of age 18 years and above were included, as thecriteria for defining malnutrition in patients younger than18 years are complex(9) and vary from the adult population.The LPZ received ethical approval from the University Hospi-tal Maastricht’s (azM) Medical Ethical Committee. Likewise,participating organisations were required to obtain approvalfrom their own ethical committees. All patients or their rela-tives gave informed consent.
Data collection
The annual LPZ study took place on 4 April 2005. In each par-ticipating organisation, one coordinator was responsible forthe measurement. The coordinators were trained collectivelyby the research group on how to manage the survey withinthe organisation, and how to use the printed standardised ques-tionnaire and specially designed Internet data-entry program.The coordinators also received a protocol and training packageto support them in training the health-care professionals whowould perform the measurement within the organisations.
To achieve an objective judgment for every patient, twohealth-care professionals (nurses, dietitians or doctors, oneof whom worked in the patient’s ward and the other indepen-dent) assessed each patient in the hospitals and nursing homes.For practical reasons, the measurements in home-care organis-ations were spread over 4 d, and the health-care professionalprimarily responsible for the patient’s care filled out thequestionnaire during a home visit. To ensure that thesemeasurements were consistent, another independent health-care professional revisited a random sample of twenty patientsper home-care organisation (Cohen’s kappa of 0·87).
LPZ participants could find all the information needed forthe measurements and data entry on a purpose-built website.
Data analysis
Statistical analyses were performed using SPSS version 13.0(SPSS Inc., Chicago, IL) including descriptive frequency dis-tributions for all variables. Differences between groups were
J. M. M. Meijers et al.418
British
Journal
ofNutrition

tested using Student’s t-tests, x2 tests or ANOVA (with posthoc analysis using the Bonferroni method). Additionally, ORwith 95 % CI were calculated.
To confirm associations found in the univariate analysis, a mul-tivariate binary logistic regression analysis was performed separ-ately for hospitals, nursing homes and home-care organisations,where OR with 95 % CI were calculated once again. The indepen-dent variable was malnourished/well nourished. Prior to analysis,data were assessed for congruence with regression assumption.The independent variables were checked for possible interaction,confounding and multicollinearity. Variables that remained sig-nificant at the 0·01 level were presented. This level was seen assignificant due to the large sample size. When a group was ana-lysed separately, it had to consist of more than 100 patients forthe findings to be of statistical value.
Results
As we were rigid in requiring complete nutritional datasets(BMI (weight and height), weight loss and data on intake),patients with partial datasets and those younger than 18years (n 394) were excluded from the analysis. This resultedin the total exclusion of 12 459 patients due to missing dataon BMI (n 7516) and weight loss (n 4549) of the original25 342 participants. The remaining 12 883 (8028 hospitalpatients, 2061 nursing home patients and 2794 home-carepatients) were analysed in the present study.
Excluded patient characteristics (time since admission, sex,age, disease type and comorbidity), stratified by setting andthe ward types, were not significantly different from thoseof the included patients.
Table 1 shows the included patients’ characteristics separ-ately for hospitals, nursing homes and home-care organisations.
Compared with those in hospitals, patients in nursing homesand home care were significantly older, and more oftenfemales. In hospitals, sex was more equally divided. In hospi-tals and home care, most patients had heart and coronary dise-ases and significantly higher BMI, while more patients innursing homes had dementia.
Malnutrition prevalence
Table 2 shows malnutrition prevalence and malnourishedpatients’ characteristics in hospitals, nursing homes andhome-care organisations. It reveals significant differences inprevalence rates between the three. Hospitals had the highestmalnutrition prevalence rate (23·8 %), followed by home-care organisations (21·7 %) and nursing homes (19·2 %).Fig. 1 presents malnutrition prevalence per ward type for hos-pitals and nursing homes. Home care was omitted as it has noidentifiable wards.
Fig. 1 also shows that the highest malnutrition prevalencerates occur in psychogeriatric wards in nursing homes, andin geriatric wards in hospitals. In nursing homes, the preva-lence rate varied from 13·3 % in somatic wards to 22·8 % inpsychogeriatric wards (with P,0·001 difference), and in hos-pitals from 10·3 % in coronary care wards to 32·9 % in thegeriatric wards (with P,0·001 difference).
Characteristics of malnourished patients (univariate analysis)
As shown in Table 2, a significant difference regarding sexwas found only in nursing homes. Malnourished patients inhospitals and nursing homes were older than well-nourishedpatients, unlike in home care. Similarly, time since admissionwas significantly higher for malnourished than well-nourishedpatients in hospitals and nursing homes, while in home carethis trend was the opposite.
Table 1. Patient characteristics
Hospital Nursing home Home care
Organisations, n (%) 57 (49·5 ) 39 (34·0 ) 19 (16·5 )Patients, n (%) 8028 (62·3 ) 2061 (16·0 ) 2794 (21·7 )Sex
Women, n (%) 4199 (52·3 ) 1407 (68·3 ) 1754 (62·8 )Men, n (%) 3829 (47·7 ) 654 (31·7 *) 1040 (37·2 *)
Age in years (SD) 65·2 (16·0ab) 80·3 (10·0c) 76·2 (12·0)BMI (SD) 25·8 (4·9a) 24·1 (5·1c) 25·9 (5·3)Undesired weight loss (%) 19·6 6·8 13·7Time since admission in days (SD) 34·7 (5·9) 829·9 (435·1) 879·2 (310·3)Diseases
Infection (%) 682 (8·5 ab) 44 (2·1 ) 60 (2·1 )Cancer (%) 1087 (13·5 ab) 88 (4·3 c) 366 (13·1 )Diabetes mellitus (%) 1009 (12·6 b) 285 (13·8 c) 585 (20·9 )Blood diseases (%) 303 (3·8 ) 48 (2·3 ) 66 (2·4 )Dementia (%) 301 (3·7 ab) 1262 (61·3 c) 339 (12·1 )Heart and coronary diseases (%) 2606 (32·5 ab) 425 (20·6 c) 743 (26·6)Stroke (CVA, %) 512 (6·4 a) 512 (24·9 c) 338 (8·5 )COPD (%) 1554 (19·4 ab) 147 (7·1 c) 377 (13·5 )Diseases of the gastrointestinal tract (%) 1554 (18·4 ab) 133 (6·5 ) 262 (9·4 )Musculoskeletal disorders (%) 1478 (18·4 ) 280 (13·6 c) 606 (21·7 )Mean number of prevalent diseases (SD) 1·64a (0·5) 2·96b (0·8) 2·13 (0·7)
CVA, cerebrovascular accident; COPD, chronic obstructive pulmonary disease.aSignificant difference between hospitals and nursing homes.bSignificant difference between hospitals and home carecSignificant difference between nursing homes and home care.*Significant difference between men and women.
Malnutrition prevalence in The Netherlands 419
British
Journal
ofNutrition

Table 2. Prevalence rates of malnutrition and characteristics of malnourished and not malnourished patients
Hospital (n 8028) Nursing homes (n 2061) Home care (n 2794)
Mþ M 2 P value Mþ M 2 P value Mþ M 2 P value
Prevalence (%) 23·8 76·2 19·2 80·8 21·7 78·3,0·001ab* ,0·001c* ,0·001*
Sex (%)Women 23·2 % 21·2 % 21·7 %Men 24·5 % 0·088 15·0 % ,0·001 21·7 % 0·507
Age in years (SD) 66·2 (16·0) 64·8 (16·0) ,0·060 81·2 (10·0) 80·0 (11·0) ,0·070 75·4 (13·0) 77·0 (11·0) ,0·060Time since admission in days (SD) 38·3 (6·1) 33·6 (5·5) 0·100 843·6 (433·1) 826·6 (436·1) ,0·001 696·3 (210·3) 930·5 (290·3) ,0·001Disease
Infection 33·1 % 66·9% ,0·001 – – – – – –Cancer 40·7 % 59·3 % 0·004 – – – 51·1 % 48·9 % 0·009Diabetes mellitus 21·9 % 78·1 % ,0·001 10·9 % 89·1 % ,0·001 15·4 % 84·6 % ,0·001Blood diseases 37·6 % 62·4 % ,0·001 – – – – – –Dementia 29·2 % 70·8 % ,0·001 22·1 % 77·9 % ,0·001 20·4 % 79·6 % ,0·001Heart and coronary 20·9 % 79·1 % ,0·001 17·9 % 82·1 % ,0·001 20·1 % 79·9 % ,0·001Stroke (CVA) 19·7 % 80·3 % ,0·001 15·4 % 84·6 % ,0·001 12·6 % 87·4 % ,0·001COPD 29·6 % 70·4 % ,0·001 23·1 % 76·9 % ,0·001 22·8 % 77·2 % ,0·001Gastrointestinal tract 37·3 % 62·7 % ,0·001 20·3 % 79·6 % ,0·001 32·4 % 67·6 % ,0·001Musculoskeletal disorders 15·3 % 84·7 % ,0·001 20·4 % 79·6 % ,0·001 18·8 % 81·2 % ,0·001
Mean number of prevalent diseases (SD) 1·89 (0·6) 1·56 (0·5) 0·157 3·09 (0·8) 2·93 (0·8) 0·268 2·27 (0·7) 2·10 (0·7) 0·271
M þ , malnourished; M 2 , well nourished; –, ,100 participants and no further analysis performed; CVA, cerebrovascular accident; COPD, chronic obstructive pulmonary disease. P,0·01 is significant.a Significant difference between hospitals and nursing homes.b Significant difference between hospitals and home care.c Significant difference between nursing homes and home care.* ANOVA between types of organisations.
J.M
.M
.M
eijerset
al.
42
0
British Journal of Nutrition

In hospitals, blood diseases, gastrointestinal tract diseasesand cancer correlated more often with malnutrition. In nursinghomes, dementia and chronic obstructive pulmonary diseasewere more often associated with malnutrition, while inhome-care organisations patients with cancer and gastrointes-tinal tract diseases were more often malnourished.
Fig. 2 shows that malnutrition is associated with increa-sing age, especially in nursing homes. Fig. 3 shows increasingmalnutrition prevalence in hospitals with increasing comorbidity.
Factors associated with malnutrition (multivariate analysis)
To confirm associations found in univariate analysis, amultivariate logistic regression analysis was performed forhospitals, nursing homes and home-care organisations sepa-rately. The factors sex, age, ward type, disease and timesince admission were analysed as dependent variables, withmalnourished/well nourished as the independent variable.Table 3 shows the analysis results per institution type (hospi-tals, nursing homes or home-care organisations). Only factorssignificantly related to malnutrition are shown.
In the multivariate analysis, no association with age, agegroup, ward type or time since admission was found in hospi-tals, nursing homes or home-care organisations. An associationwith being female was found only in nursing homes. In hospi-tals, particularly blood diseases, gastrointestinal tract diseases,
cancer, dementia, infection and chronic obstructive pulmonarydisease were associated with malnutrition. In nursing homes,patients with dementia were more often malnourished, whilein home care, cancer, gastrointestinal tract diseases and diabetesmellitus were again most often associated with malnutrition.Patients in home care with diabetes mellitus had a significantlyreduced chance of malnutrition. Interactions were tested butfound not significant.
Discussion
LPZ is one of the first large-scale, multi-centre prevalencestudies focusing on health-care problems carried out annuallyin The Netherlands. The purpose of this study was to investi-gate the prevalence of malnutrition, and to assess theassociation between relevant influencing factors in Dutchhospitals, nursing homes and home-care organisations andthe prevalence of malnutrition.
Malnutrition prevalence
Our study showed a malnutrition prevalence rate ranging from19·2 % in nursing homes to 23·8 % in hospitals. Comparingthese rates to other studies in the field is a real challenge asthey are largely dependent on the operationalisation of malnu-trition (most studies use different screening tools andelements) as well as the population and setting investigated.Yet, a general comparison of our results with these studiesshows that our prevalence rates are within the higher rangeof Stratton et al.’s(6) reviews, and higher than that indicatedby the first Dutch national survey conducted by dietitians in2001(2). Still, comparing this LPZ prevalence study with theearlier national survey is difficult, as in 2001 malnutritionwas operationalised only by weight loss. In this study,we included a much larger sample of patients and focusedon BMI, weight loss and intake. A recent German study byPirlich et al. (20), however, showed hospital results comparableto ours, while a large study by Waitzberg et al. (17) of 4000hospital patients in Brazil showed a much larger percentage(48·1 %) of malnourished patients.
Geriatric wards in hospitals and psychogeriatric wardsin nursing homes exhibited the highest malnutrition preva-lence rates, a finding that is again comparable to otherstudies(2,14,18). These other studies, however, explained their
Fig. 1. Malnutrition prevalence in different hospital and nursing home wards:
1, surgical wards ( ); 2, internal medicine wards ( ); 3, intensive care unit
wards ( ); 4, coronary care wards ( ); 5, geriatric wards ( ); 6, somatic
wards ( ); 7, somatic rehabilitation wards ( ); 8, psychogeriatric wards ( ).
Fig. 2. Malnutrition prevalence in different age groups: age 31–45 years ( );
age 45–60 years ( ); age 61–75 ( ); age 76–90 years ( ); age above 90
years ( ); Chi-square for trend: P,0·01 for nursing homes, P¼0·02 for
home care and P¼0·06 for hospitals.
Fig. 3. Malnutrition prevalence with increasing comorbidity: one to two
diseases ( ); three to four diseases ( ); five to six diseases ( ). x2 for trend:
P ¼ 0·01 for hospitals, P ¼ 0·06 for nursing homes and P ¼ 0·08 for home
care. Home care: group five to six diseases to small n , 100.
Malnutrition prevalence in The Netherlands 421
British
Journal
ofNutrition

high prevalence rates by the higher age and vulnerability ofthe patient groups; in this study, no influence of or interactionwith age was found in the logistic regression analysis oradditional analysis for the different wards.
Factors associated with the prevalence of malnutrition
As mentioned, the literature shows that higher age is a riskfactor for developing malnutrition(4,17 – 20). In this study, anage effect was found in the univariate analysis within the nur-sing homes and home care (Fig. 1), but this effect disappearedin the multivariate analysis (Table 3). The age effect revealedin other studies as well as in our univariate analysis may bedue to the fact that higher age is associated with an overallincrease in disease prevalence(4,17).
Fig. 2 shows a trend of increasing age with increasing mal-nutrition prevalence in the univariate analysis of nursinghomes. In home care, this trend was opposite; with increasingage, malnutrition prevalence decreased. This contradictioncould be explained by the fact that sicker older persons areprobably more often admitted to nursing homes, thus leavinga healthier population in the home-care setting. This wouldalso fit with the time since admission (receiving care) forhome care in Table 2; in home care, well-nourished patientshad a longer mean ‘time since admission’ than malnourishedpatients.
Perissinotto et al. (19) found that body composition changesoccurred differently in men and women in the various phasesof ageing, and thus influenced the assessment and screening ofmalnutrition. Their study indicated that in nursing homeswomen had a higher chance of becoming malnourishedthan men. However, like Pirlich et al. (18), we found norelationship between sex and malnutrition in hospitals.
Disease and malnutrition are related. Table 2 shows thatmalnourished patients have a higher mean number of diseasesper patient than those who are well nourished. Furthermore,patients with cancer showed a very high risk of beingmalnourished both in hospitals and home-care organisations,a result also identified in other studies(2,6,18 – 29).
In nursing homes, patients with dementia had a higherrisk of malnutrition; this finding is consistent with other
studies in nursing homes(28,29). However, patients with dia-betes mellitus in home care had a significantly reducedchance of malnutrition, a finding not supported by otherstudies. A possible reason for this could be that diabetesmellitus patients are expected to be overweight rather thanunderweight.
Limitations of this national screening
Although our study sample was large (n 25 342), manypatients were excluded if their nutritional data were incom-plete; we felt it very important to have complete and reliabledata. Datasets, in particular, for elderly patients were oftenincomplete as caregivers found it difficult to actually weighpatients and measure their height. Likewise, Strattonet al. (30) indicated that measuring height and weight, particu-larly in elderly patients, is difficult; in their study, only 56 %of the elderly patients could be weighed.
Nevertheless, the group included in our analysis is a repre-sentative sample, with no significant differences in patientcharacteristics (time since admission, age, sex and numberand type of disease) and type of ward compared with theexcluded group, which makes the results robust and thesample quite unique.
A particular difficulty with cross-sectional studies focusingon correlations is the fact that the progression over time ofcertain disorders and their possible risk factors cannot bemeasured by one-time measurement. As the dependent andindependent variables are selected at one and the same time,causality cannot be drawn. For example, disease and malnu-trition interact such that the disease may cause secondary mal-nutrition, or malnutrition may adversely influence underlyingdisease.
The large LPZ population is heterogeneous and incorporatespatients from different age groups (range: 18–104 years) andhealth-care settings, making the operationalisation of malnu-trition extremely difficult as there is no consensus on a validand reliable instrument for quick and easy measurement thatsuits the whole group at once. However, based on the litera-ture and consultation with experts in the malnutrition fieldin The Netherlands, we did achieve consensus on our defi-nition. We realise, though, that the BMI cut-off points andfurther operationalisation used are debatable, may not betotally appropriate for all age groups, and could possiblyresult in an underestimation of malnutrition prevalence.
In our operationalisation, undesired weight loss in kilogramswas used instead of percentage of weight loss. We do believe itwould have been preferable to use absolute percentages; yet,fixed cut-off points were easier for the nurses who filled outthe questionnaires than having to calculate percentage ofweight loss. Still, we had to deal with a large number of missingvalues in the dataset.
As LPZ was measured on a large scale and to make it easierfor the nurses to fill out the questionnaire, questions on dise-ases were clustered per disease group. Thus, our data do notspecify the disease type each patient had at the time ofmeasurement. We realise that this limits further analysis onthe disease variable.
An annual, large-scale, multi-centre study like LPZ focus-ing on health-care problems such as malnutrition is unique inEurope. This study shows that malnutrition is still a substantial
Table 3. Factors related to malnutrition, assessed by multivariate logis-tic regression analysis per type of health-care organisation*
Variables in the model P value OR 95 % CI
HospitalsInfection ,0·001 1·70 1·43, 2·03Cancer ,0·001 2·74 2·39, 3·15Dementia ,0·001 1·53 1·17, 2·85Blood diseases ,0·001 2·22 1·73, 2·85COPD ,0·001 1·58 1·40, 1·80Diseases of the gastrointestinal tract ,0·001 2·46 2·16, 2·78
Nursing homeSex: female 0·004 1·45 1·13, 1·87Dementia ,0·001 1·55 1·21, 1·97
Home careCancer ,0·001 4·19 3·32, 5·29Diabetes mellitus ,0·001 0·67 0·52, 0·87Diseases of the gastrointestinal tract 0·003 1·58 1·18, 2·11
COPD, chronic obstructive pulmonary disease.*Only variables that remain significant (P,0·01) are presented.
J. M. M. Meijers et al.422
British
Journal
ofNutrition

problem in hospitals, nursing homes and home care in TheNetherlands. Despite growing attention to the problem, morecontinued alertness is required. Therefore, in The Netherlandsthe LPZ’s prevalence measurement of malnutrition will berepeated annually to achieve structural and ongoing awarenessof the problem within health-care organisations, as well as toraise national awareness of its approach.
Acknowledgements
We thank Nutricia Netherlands for providing an unrestrictedgrant to perform this study. There are no conflicts of interest toreport. J. M., J. S., M. B., T. D., M. J. and R. H. contributed tothe design of the study. J. M., M. J. and R. H. helped in datacollection. Data analysis was done by J. M. and R. H. The manu-script was written by J. M. J. M., J. S., M. B., T. D. and R. H. pro-vided significant advice or consultation. Final manuscriptapproval was done by J. M., J. S., M. B., T. D., M. J. and R. H.
References
1. Chen CC, Schilling LS & Lyder CH (2001) A concept analysis
of malnutrition in the elderly. J Adv Nurs 36, 131–142.
2. Kruizenga HM, Wierdsma NJ, van Bokhorst-de van der Schue-
ren MA, Hollander HJ, Jonkers-Schuitema CF, Van der Heijden
E, Melis GC & Van Staveren WA (2003) Screening of nutri-
tional status in The Netherlands. Clin Nutr 22, 147–152.
3. Lochs H & Dervenis C (2003) Malnutrition – the ignored risk
factor. Dig Dis 21, 196–197.
4. Volkert D, Kruse W, Oster P & Schlierf G (1992) Malnutrition
in geriatric patients: diagnoses and prognostic significance of
nutritional parameters. Ann Nutr Metab 36, 97–112.
5. Charles R, Mulligan S & O’Neill D (1999) The identification
and assessment of undernutrition in patients admitted to the
age-related health care unit of an acute Dublin General Hospital.
Ir J Med Sci 168, 180–185.
6. Stratton RJ, Green CJ & Elia M (2003) Disease-Related Malnu-
trition: An Evidence-Based Approach to Treatment. Cambridge:
CABI Publishing.
7. Detsky AS, Baker JP, O’Rourke K, Johnston N, Whitwell J,
Mendelson RA & Jeejeebhoy KN (1987) Predicting nutrition-
associated complications for patients undergoing gastrointesti-
nal surgery. J Parenter Enteral Nutr 11, 440–446.
8. Bokkerink S & Coenen C (2002) Assessment of the SROZ through
dietetics in research. Identifying the validity and reliability of the
undernutrition risk screening instrument (SROZ) in hospital
patients. Universitair Medisch Centrum ST Radboud.
9. Elia M (2000). Guidelines for Detection and Management of
Malnutrition. Maidenhead: Malnutrition Advisory Group
(MAG), Standing Committee of BAPEN.
10. Correia MI & Waitzberg DL (2003) The impact of malnutrition on
morbidity, mortality, length of hospital stay and costs evaluated
through a multivariate model analysis. Clin Nutr 22, 235–239.
11. Sullivan DH & Walls RC (1995) The risk of life-threatening
complications in a select population of geriatric patients, the
impact of nutritional status. J Am Coll Nutr 14, 29–36.
12. Tucker HN & Miguel SG (1996) Cost containment through
nutritional intervention. Nutr Rev 54, 111–121.
13. Vellas BJ, Hunt WC, Romero LJ, Koehler KM, Baumgartner
RN & Garry PJ (1997) Changes in nutritional status and patterns
of morbidity among free-living elderly persons: a 10-year longi-
tudinal study. Nutrition 13, 515–519.
14. Martyn CN, Winter PD, Coles SJ & Edington J (1998) Effect of
nutritional status on use of health care resources by patients with
chronic disease living in the community. Clin Nutr 17,
119–123.
15. National Audit Office (2000) Inpatient Admissions and Bed
Management in NHS Acute Hospitals. London: The Stationery
Office.
16. Correia MI & Campos AC (2003) The prevalence of hospital
malnutrition in Latin America: the multicenter ELAN study.
Nutrition 19, 823–825.
17. Waitzberg DL, Caiaffa WT & Correia MI (2001) Hospital mal-
nutrition: the Brazilian National Survey (IBRANUTRI): a study
of 4000 patients. Nutrition 17, 573–580.
18. Pirlich M, Schutz T, Norman K, et al. (2006) The German hos-
pital malnutrition study. Clin Nutr 25, 563–572.
19. Perissinotto E, Pisent C, Sergi G, Grigoletto F & Enzi G (2002)
Anthropometric measurements in the elderly, age and gender
differences. Br J Nutr 87, 177–186.
20. Pirlich M, Schutz T, Kemps M, Luhman N, Minko N,
Lubke HJ, Rossnagel K, Willich S & Lochs H (2005)
Social risk factors for hospital malnutrition. Nutrition 21,
295–300.
21. World Health Organization (2000) Obesity: Preventing and
Managing the Global Epidemic. Report of a WHO Consultation
on Obesity No. 894. Geneva: WHO.
22. ASPEN Board of Clinical Directors (1987) Guidelines for the
use of enteral nutrition in adult patient. J Parenter Enteral
Nutr 11, 435–439.
23. British Dietetic Association (1999) Nutritional Screening Tools.
Professional Development Committee Briefing Paper No. 9.
Birmingham: British Dietetic Association.
24. Elia M & Lunn PG (1997) Biological markers of protein-energy
malnutrition. Clin Nutr 16, 11–17.
25. van Bokhorst-de van der Schueren MA, Van Leeuwen PA,
Sauerwein HP, Kuik DJ, Snow GB & Quak JJ (1997) Assess-
ment of malnutrition parameters in head and neck cancer and
their relation to postoperative complications. Head Neck 19,
419–425.
26. Laviano A, Renvyle T & Yang Z (1996) From laboratory to
bedside: new strategies in the treatment of malnutrition in
cancer patients. Nutrition 12, 112–122.
27. Lipman TO (1991) Clinical trials of nutritional support in
cancer. Parenteral and enteral therapy. Hematol Oncol Clin
North Am 5, 91–102.
28. Vetta F, Ronzoni S, Taglieri G & Bollea MR (1999) The impact
of malnutrition on the quality of life in the elderly. Clin Nutr 18,
259–267.
29. Suominen M, Muurinen S, Routasalo P, Soini H, Suur-Uski I,
Peiponen A, Finne-Soveri H & Pitkala KH (2005)
Malnutrition and associated factors among aged residents
in all nursing homes in Helsinki. Eur J Clin Nutr 59,
578–583.
30. Stratton RJ, King CL, Stroud MA, Jackson AA & Elia M (2006)
‘Malnutrition Universal Screening Tool’ predicts mortality and
length of hospital stay in acutely ill elderly. Br J Nutr 95,
325–330.
Malnutrition prevalence in The Netherlands 423
British
Journal
ofNutrition
Copyright © 2022 FDOKUMEN