Executive Remuneration in the Netherlands 2021 - EY
36
Facts and Insights about Board Remuneration Executive Remuneration in the Netherlands 2021
-
Upload
khangminh22 -
Category
Documents
-
view
1 -
download
0
Transcript of Executive Remuneration in the Netherlands 2021 - EY

Facts and Insights about Board Remuneration
Executive Remuneration in the Netherlands 2021

1. The average salary increase at board level (+4.1%) is above the average CLA increase in 2020 (+2.9%).
2. In response to COVID-19, 1 out of 5 companies temporarily reduced (between 10% and 50%) the fixed salary of Management Board members.
3. Similarly, 1 out of 6 companies decided not to pay out any STI over 2020; for the majority of the Dutch listed companies the impact of COVID-19 on Board remuneration is negligible.
4. For more than half of the observations, target LTI % is higher for the CEO than for the CFO. This is in line with last year.
This report presents executive remuneration policies and practices at the major Dutch listed companies. It also provides insight into how companies have dealt with COVID-19 in relation to Board remuneration.
In this report we have also highlighted a couple of companies that reported transparently on specific Shareholder Rights Directive (hereafter: SRD2) elements. By pointing out good examples of transparent reporting, EY aspires to bring guidance into remuneration practices and reporting.
Our 10 main findings give an impression of how Dutch listed companies paid their executives in a year when the world was heavily impacted by COVID-19 measures.
2 | Executive Remuneration in the Netherlands 2021

5. The most predominant KPI in LTI plans is still (relative) TSR. A growing emphasis on sustainability is visible.
6. In line with the trend, shareholding guidelines are used more often. This year the increase is a remarkable 15%.
7. The highest increase of target remuneration levels over the past 3 years is observed for CEOs in AMX companies.
8. Despite a slight improvement compared to last year, gender diversity in the Management Board is still very low. An effect of the new legislation on gender diversity is expected for the upcoming years.
9. Out of 66 companies, only 23 companies explain in their 2020 remuneration report how the advisory vote over 2019 has been taken into account (as required by SRD2).
10. ASR shows how companies can use internal pay ratios to properly balance internal and external perspectives in board remuneration.
3Executive Remuneration in the Netherlands 2021 |
OutlookFrom an executive remuneration perspective, 2020 has been a remarkable year. Shareholders have casted a binding vote on remuneration policies which had to be updated in line with SRD2. Almost 20% of the AEX, AMX and AScX companies did not receive a required 75% favorable votes and had to make further amendments to their remuneration policies.
Next to that, 2020 was marked by a significant number of (temporary) salary reductions and unpaid annual bonuses in relation to COVID-19. In a number of cases 2020 remuneration reports describe these bonuses as having been waived by the Management Board. However, in most of these cases companies have failed to transparently explain how the company actually performed against KPI targets. This left it unclear whether and to what extent Board members actually waived their annual bonus. Nonetheless, for the majority of the Dutch listed companies the impact of COVID-19 on Board remuneration is negligible.
Looking ahead to reporting year 2021, we expect that remuneration committees will still spend significant time discussing how COVID-19 could or should be reflected in variable pay, including how to deal with Long-Term Incentives in this respect. We further elaborate on this topic in Chapter 2.4. Furthermore, we expect that both the new legislation on gender diversity in the Board room as well as Dutch Corporate Governance Code (hereafter: Governance Code) guidance on internal pay ratio reporting will be important agenda items.
Implications of COVID-19
More than one third of the companies in our dataset have either reduced salaries or decided not to pay out annual bonuses over 2020. With respect to 2021, no companies have indicated to impose new (temporary) salary reductions for their Management Board members nor has any company in our dataset explicitly stated that there will be no annual bonus payout over 2021. Only three companies announced changes to their 2021 LTI award due to COVID-19. Therefore, it seems that companies do not expect as much impact from COVID-19 on company performance compared to 2020.
Nevertheless, the NOW governmental aid program is still relevant. Companies who make use of the second and third NOW support program are not allowed to pay out bonuses to their executives over 2020 (NOW 2 and 3.1) or 2021 (NOW 3.2 and 3.3) if the NOW support they receive is at least EUR 125,000.
4 | Executive Remuneration in the Netherlands 2021

Gender diversity legislation
On 11 February 2021, the Dutch House of Representatives voted in favor of the bill for more gender balance in the Management and Supervisory Boards of big companies. The bill regulates that the composition of the Supervisory Board of big public and private companies should consist out of at least one third males and one third females. As long as this is not the case, an individual cannot be appointed as member of the Supervisory Board if this does not improve the male – female balance (except for a reappointment within 8 years). Furthermore, companies are obliged to set appropriate and ambitious targets to improve gender diversity in not only the Supervisory Board, but in the Management Board and Senior Management as well. A plan should be drafted to achieve the aforementioned targets, and the results of the endeavor should be reported to the Socio-Economic Council (SER).
Following the favorable vote in the House of Representatives, at the moment of writing this report, the bill is still under revision in the Dutch Senate.
Pay ratio interpretation
According to the Governance Code, listed companies in the Netherlands are required to take the internal pay ratios into consideration when formulating the remuneration policy. Moreover, the remuneration report should describe the internal pay ratios within the company and any changes in these ratios in comparison with the previous financial year. The monitoring committee of the Governance Code noted that interpretation of this internal pay ratio differs a lot between companies. This does not support the comparability and, therefore, the monitoring committee advises that the internal pay ratio should be understood to mean: the ratio between the total annual remuneration of the CEO and the average annual remuneration of the employees in which:
• The total annual remuneration of the CEO includes all remuneration components (such as base salary, variable compensation in both cash and shares, social premiums, pension, expense allowances, etc.).
• The average annual remuneration of employees is the total wage costs divided by the average number of FTEs during the year.
• The value of the share-based remuneration is determined at the moment of grant.
The monitoring committee advises companies to use this interpretation of the internal pay ratios from reporting year 2021 onwards.
With the impact of COVID-19, further implementation of SRD2 in policies and reporting, the legal pressure on gender diversity and increased clarity in the use of the pay ratio, there are challenging tasks ahead for Remuneration Committees.
5Executive Remuneration in the Netherlands 2021 |

Reward team
EY’s Reward team advises companies on executive compensation, variable pay plans, the people side of M&A and provides interim C&B solutions.
Our team consists of reward professionals with a background in consultancy and in-house C&B roles. Through our work we help clients improve their performance, effectiveness and maintain compliancy in their HR and reward strategies. Read more about our services in Chapter 4.
With special thanks to Jolien Timmers.
Jan van Duren +31 (0)6 5544 2484 [email protected] LinkedIn page
Lennart Cox +31 (0)6 2908 3271 [email protected] LinkedIn page
Stephan van de Groep +31 (0)6 2125 1204 [email protected] LinkedIn page
Melina Vinberg Hjalmarsson +31 (0)6 2906 3545 [email protected] LinkedIn page
Nienke Weijers +31 (0)6 2125 1167 [email protected] LinkedIn page
Floris Grootenboer +31 (0)6 2908 3094 [email protected] LinkedIn page Cont
ents
6 | Executive Remuneration in the Netherlands 2021
Cont
ents 1 About this report 8
1.1 Management Board demographics 9
2 Remuneration levels and design 10
2.1 Total Direct Compensation 10
2.2 Fixed salary 14
2.3 Short-Term Incentives 18
2.4 Long-Term Incentives 23
2.5 Internal pay ratios 27
2.6 Supervisory Board remuneration 29
3 Shareholder Rights Directive 31
3.1 EY findings from the audit season 31
3.2 Examples of transparent disclosure 32
3.3 Voting results from the 2021 AGMs 33
4 Our services 34
4.1 Executive remuneration 34
4.2 HR transactions 34
4.3 Variable pay plans 34
4.4 Other specialty services 34
5 Appendix: included companies 35
7Executive Remuneration in the Netherlands 2021 |

1. About this report
The analyses in this report are based on data from remuneration reports of companies listed on the AEX, AMX and AScX indices. Findings presented in this report are also based on our observations from support of EY audit teams, which involves reviewing the quality of remuneration reports in relation to the SRD2 legislation as well as the Governance Code. Furthermore, we have analyzed the outcomes of the Shareholders’ advisory vote on the remuneration reports in line with SRD2.
This year’s report contains two main chapters; one chapter on remuneration levels and design and one chapter on the quality of reporting in line with the Governance Code and SRD2. For the analyses conducted in the chapter on remuneration levels and design we have chosen to exclude financial sector companies because of the impact the bonus cap has had on remuneration levels and design. We have included a separate paragraph on financial sector remuneration in Chapter 2.2.
All tables and graphs are based on all available data points, i.e. not excluding observations where executives replaced their predecessors and/or where the index composition changed. Therefore, all reported data by position and index include the effects of remuneration changes for existing executives and for successors and the effects of different index composition on remuneration. Note that when two people filled a position at a specific company during the year, the average remuneration of these two people is used for that position.
Furthermore, this year is the first year in which several companies temporarily reduced fixed salaries as response to COVID-19. For consistency purposes with respect to previous years, policy level base salary is used in all tables and graphs unless indicated otherwise.
8 | Executive Remuneration in the Netherlands 2021

Index PositionMale Female
Count Age Tenure Count Age Tenure
AEX
CEO 29 57.5 7.4 2 54.5 9.1
CFO 22 54.1 5.7 4 49.3 2.8
OM 24 51.8 4.6 7 50.0 1.6
AMX
CEO 22 55.0 7.4 2 53.0 8.7
CFO 18 51.3 3.8 4 46.0 2.7
OM 18 55.6 6.2 4 49.5 4.0
AScX
CEO 21 56.3 7.1 0
CFO 21 52.7 4.5 2 44.5 2.6
OM 11 54.8 6.3 0
1.1 Management Board demographics
The table below shows by gender the number of Management Board members including ageand tenure. The number of female MB members is still very low although the number increasedcompared to last year. In 2020, four CEO positions (Intertrust, DSM, PostNL and Wolters Kluwer) and ten CFO positions (Ahold Delhaize, Arcadis (2), ASR, Fagron, Heineken, Nedap, NSI, Ordina and Shell) were fulfilled by women.
Despite a slight improvement compared to last year, gender diversity in the Management Board is still very
low. An effect of the new legislation on gender diversity is expected for the upcoming years.
9Executive Remuneration in the Netherlands 2021 |

2.1 Total Direct Compensation
The table below shows 2020 Target Total Direct Compensation (TTDC) levels per index for the CEO and CFO position. TTDC is the sum of policy level base salary, target Short-Term Incentive (STI) and target Long-Term Incentive (LTI). The table also shows statistical values for revenue and full-time equivalents (FTE).
2. Remuneration levels and design
Index Position & scoping Q1 Median Q3
AEX
CEO € 2,757,000 € 3,430,000 € 6,114,000
CFO € 1,815,000 € 2,591,000 € 2,980,000
Revenue (EUR m) 2,775 8,784 23,007
FTE 8,955 29,407 83,694
AMX
CEO € 1,478,000 € 1,762,000 € 2,165,000
CFO € 952,000 € 1,075,000 € 1,285,000
Revenue (EUR m) 556 1,928 3,255
FTE 1,895 5,527 9,913
AScX
CEO € 650,000 € 867,000 € 1,132,000
CFO € 447,000 € 579,000 € 812,000
Revenue (EUR m) 220 528 1,297
FTE 766 2,502 3,139
The spread of the data is shown at the first quartile (Q1), median and third quartile (Q3). The median represents the value that separates the higher half from the lower half of the observations. Q1 is the middle number between the lowest observation and the median, while Q3 is the middle number between the median and the highest observation.
10 | Executive Remuneration in the Netherlands 2021

Remuneration levels by revenue Management board remuneration tends to be higher at bigger companies. In benchmark exercises certain factors are used to determine an appropriate peer group such as revenue, market cap, number of FTE, business complexity and geographical spread. This section shows 2020 median target remuneration levels for different revenue categories.
The tables above show that the majority of companies in our dataset (financial sector companies excluded) have a revenue between €1 billion and €5 billion. The tables also show that the median remuneration values increase with revenue. Note that median TDC values are not equal to the sum of median salary, median STI and median LTI (no sum of medians, but median of sums).
CEO median target remuneration levels
Revenue in EUR bn Companies Fixed salary STI LTI TDC
0.0 to 0.5 16 € 445,000 € 215,000 € 331,000 € 860,000
0.5 to 1.0 5 € 550,000 € 447,000 € 676,000 € 1,560,000
1.0 to 5.0 21 € 666,000 € 399,000 € 660,000 € 1,739,000
5.0 to 10.0 6 € 919,000 € 754,000 € 1,059,000 € 2,684,000
10.0 to 50.0 5 € 1,201,000 € 1,325,000 € 1,122,000 € 3,244,000
50.0 to above 3 € 1,508,000 € 1,985,000 € 3,677,000 € 6,043,000
CFO median target remuneration levels
Revenue in EUR bn Companies Fixed salary STI LTI TDC
0.0 to 0.5 14 € 292,000 € 118,000 € 135,000 € 500,000
0.5 to 1.0 6 € 403,000 € 256,000 € 403,000 € 1,036,000
1.0 to 5.0 21 € 487,000 € 247,000 € 359,000 € 1,197,000
5.0 to 10.0 5 € 675,000 € 405,000 € 608,000 € 1,688,000
10.0 to 50.0 5 € 785,000 € 628,000 € 759,000 € 2,591,000
50.0 to above 3 € 1,035,000 € 1,242,000 € 2,034,000 € 3,869,000
Other Member median target remuneration levels
Revenue in EUR bn Companies Fixed salary STI LTI TDC
0.0 to 0.5 5 € 350,000 € 140,000 € 235,000 € 792,000
0.5 to 1.0 3 € 430,000 € 353,000 € 411,000 € 1,430,000
1.0 to 5.0 11 € 450,000 € 269,000 € 262,000 € 1,102,000
5.0 to 10.0 2 € 596,000 € 358,000 € 507,000 € 1,461,000
10.0 to 50.0 3 € 690,000 € 483,000 € 801,000 € 2,103,000
50.0 to above 1 € 836,000 € 836,000 € 1,659,000 € 3,331,000
11Executive Remuneration in the Netherlands 2021 |

Development of target remuneration levelsRemuneration levels tend to be higher at companies with a bigger market cap (share price times shares outstanding). Market cap is the factor which determines on which index a company will be listed. This section shows the development of median target remuneration levels per index over the last 3 years for CEO and CFO positions.
2018
2019
2020
20182019
2020
CFO
CEO
52%
53%
51%
49%
51%
51%
23%
24%
23%
25%
22%
23%
25%
22%
25%
26%
27%
26%
€ 0 € 250,000 € 500,000 € 750,000 € 1,000,000
Fixed salary STI LTIMedian target remuneration levels – AScX
34% 28%
29%
30%
38%
37%
36%
38%
35%
€ 0 € 1,000,000 € 2,000,000 € 3,000,000 € 4,000,000
2018
2019
2020
2018
2019
2020
CFO
CEO 32%
32% 32%
35%
31%
33%
31%
34%
34%
Fixed salary STI LTIMedian target remuneration levels – AEX
2018
2019
2020
2018
2019
2020
CFO
CEO
43%
43%
46%
39%
40%
39%
23%
23%
22%
23%
25%
25%
35%
35%
32%
38%
35%
36%
€ 0 € 1,000,000 € 1,500,000 € 2,000,000€ 500,000
Fixed salary STI LTIMedian target remuneration levels – AMX
12 | Executive Remuneration in the Netherlands 2021

The graphs show a noticeable increase for CEOs in the AMX over the last 3 years. Other remuneration levels stayed relatively stable for AEX, AMX and AScX companies. Note the difference in scale on the horizontal axis. Also note that the graphs do not display median TDC levels, but just give an impression of median salary, STI and LTI development which would normally not be added up.
“The highest increase of target remuneration levels over the past 3 years is observed for
CEOs in AMX companies.
13Executive Remuneration in the Netherlands 2021 |

2.2 Fixed salary
As shown in the previous section fixed salary constitutes a minor part of target total direct compensation at AEX and AMX companies. At AScX companies it constitutes about half of target total direct compensation.
The table below shows 2020 target fixed salary levels per index for the CEO and CFO position. This table also shows statistical values for revenue and number of FTE.
Index Position & scoping Q1 Median Q3
AEX
CEO € 890,000 € 1,068,000 € 1,359,000
CFO € 675,000 € 727,000 € 833,000
Revenue (EUR m) 2,775 8,784 23,007
FTE 8,955 29,407 83,694
AMX
CEO € 588,000 € 691,000 € 810,000
CFO € 419,000 € 500,000 € 537,000
Revenue (EUR m) 556 1,928 3,255
FTE 1,895 5,527 9,913
AScX
CEO € 387,000 € 495,000 € 552,000
CFO € 277,000 € 315,000 € 402,000
Revenue (EUR m) 220 528 1,297
FTE 766 2,502 3,139
14 | Executive Remuneration in the Netherlands 2021

Index Companies Average reduction
AEX 3 € 89,730 8.1%
AMX 6 € 45,770 7.4%
AScX 5 € 31,970 6.8%
Fixed salary changes due to COVID-19As mentioned earlier, several companies paid reduced fixed salaries to the Management Board members in relation to COVID-19. The table below shows the number of companies per index where Management Board members’ fixed salary was temporarily reduced in 2020, including the average absolute and relative decrease over the full year.
In our dataset, 14 companies temporarily reduced (between 10% and 50% on a monthly basis) the fixed salary of Management Board members. Basic-Fit applied the highest salary reduction of 50% for 3 months. The majority of the companies started in May 2020 with the salary reductions. ArcelorMittal, Heineken, Van Lanschot and VastNed applied the salary reduction for 8 months. Furthermore, Basic-Fit, Fagron and Signify reduced the fixed fee of Supervisory Board members as well, while Fagron did not reduce the fixed salary of Management Board members.
“In response to COVID-19, 1 out of 5 companies temporarily reduced (between 10% and 50%) the fixed
salary of Management Board members.
15Executive Remuneration in the Netherlands 2021 |
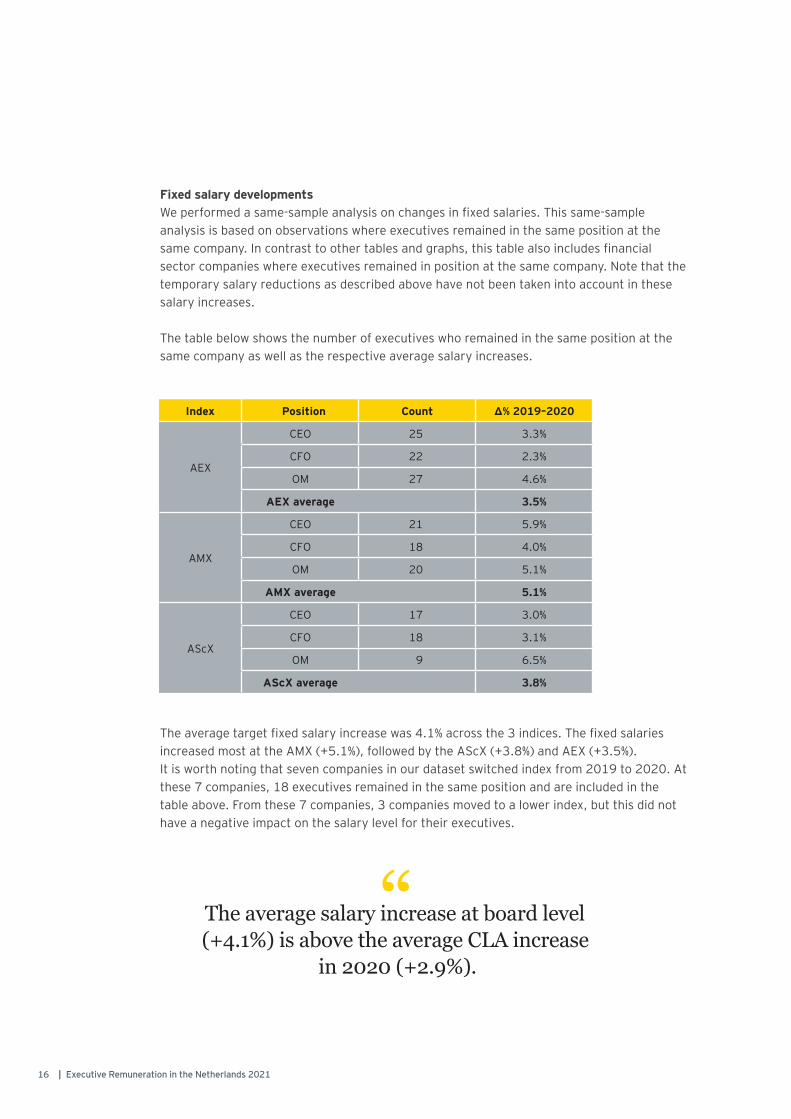
Fixed salary developmentsWe performed a same-sample analysis on changes in fixed salaries. This same-sample analysis is based on observations where executives remained in the same position at the same company. In contrast to other tables and graphs, this table also includes financial sector companies where executives remained in position at the same company. Note that the temporary salary reductions as described above have not been taken into account in these salary increases.
The table below shows the number of executives who remained in the same position at the same company as well as the respective average salary increases.
The average target fixed salary increase was 4.1% across the 3 indices. The fixed salaries increased most at the AMX (+5.1%), followed by the AScX (+3.8%) and AEX (+3.5%).It is worth noting that seven companies in our dataset switched index from 2019 to 2020. At these 7 companies, 18 executives remained in the same position and are included in the table above. From these 7 companies, 3 companies moved to a lower index, but this did not have a negative impact on the salary level for their executives.
Index Position Count Δ% 2019–2020
AEX
CEO 25 3.3%
CFO 22 2.3%
OM 27 4.6%
AEX average 3.5%
AMX
CEO 21 5.9%
CFO 18 4.0%
OM 20 5.1%
AMX average 5.1%
AScX
CEO 17 3.0%
CFO 18 3.1%
OM 9 6.5%
AScX average 3.8%
“The average salary increase at board level (+4.1%) is above the average CLA increase
in 2020 (+2.9%).
16 | Executive Remuneration in the Netherlands 2021

Position & scoping Q1 Median Q3
CEO € 760,000 € 988,000 € 1,406,000
CFO € 645,000 € 718,000 € 941,000
Revenue (EUR m) 532 5,300 17,637
FTE 1,701 4,059 19,234
Fixed salary levels at financial sector companiesSince the introduction of the Dutch bonus cap legislation in 2015, the variable pay levels at financial sector companies have decreased significantly. At the same time salaries have been increased to (partly) compensate for the loss of variable pay. Therefore, the remuneration packages of financial sector companies are not comparable to non-financial sector companies, which is why we present some observations on financial sector companies separately in this section.
The table below shows the 2020 target fixed salary levels for the CEO and CFO as well as revenue and number of FTE at first quartile (Q1), median and third quartile (Q3) level. The data are based on the nine financial sector companies in the dataset in 2020.
Some financial sector companies have decided to stop using variable pay altogether. This is partly due to the limited impact that a maximum variable pay of 20% has on the behavior of Management Board members, but also due to the relatively high administrative burden that comes with the bonus cap legislation. In 2020, five out of the nine financial sector companies (ABN Amro, Adyen, ASR, NIBC Holding and Van Lanschot) do not offer variable pay to Management Board members. From these five companies, Van Lanschot does offer shares or share-based payments as part of target fixed salary.
17Executive Remuneration in the Netherlands 2021 |
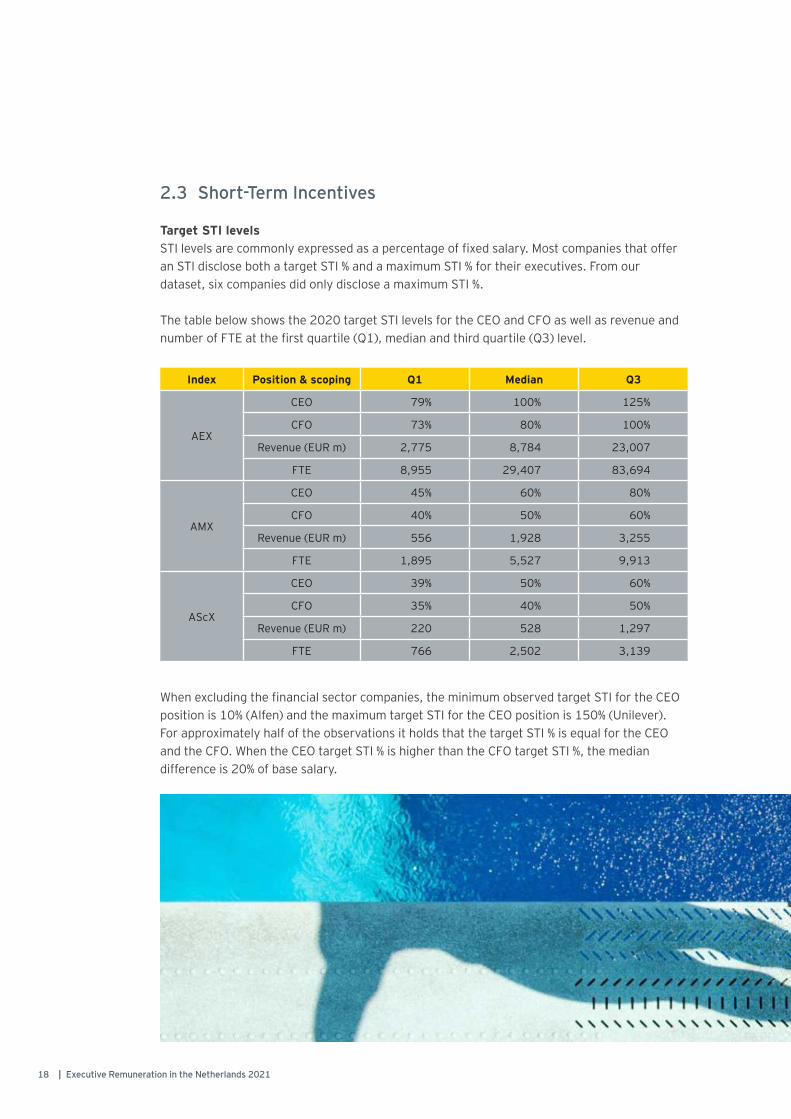
2.3 Short-Term Incentives
Target STI levelsSTI levels are commonly expressed as a percentage of fixed salary. Most companies that offer an STI disclose both a target STI % and a maximum STI % for their executives. From our dataset, six companies did only disclose a maximum STI %.
The table below shows the 2020 target STI levels for the CEO and CFO as well as revenue and number of FTE at the first quartile (Q1), median and third quartile (Q3) level.
When excluding the financial sector companies, the minimum observed target STI for the CEO position is 10% (Alfen) and the maximum target STI for the CEO position is 150% (Unilever). For approximately half of the observations it holds that the target STI % is equal for the CEO and the CFO. When the CEO target STI % is higher than the CFO target STI %, the median difference is 20% of base salary.
Index Position & scoping Q1 Median Q3
AEX
CEO 79% 100% 125%
CFO 73% 80% 100%
Revenue (EUR m) 2,775 8,784 23,007
FTE 8,955 29,407 83,694
AMX
CEO 45% 60% 80%
CFO 40% 50% 60%
Revenue (EUR m) 556 1,928 3,255
FTE 1,895 5,527 9,913
AScX
CEO 39% 50% 60%
CFO 35% 40% 50%
Revenue (EUR m) 220 528 1,297
FTE 766 2,502 3,139
18 | Executive Remuneration in the Netherlands 2021

0% 50% 100% 150% 200% 250%
CFO
CEO
CFO
CEO
CFO
CEO
ASc
XAMX
AEX
Actual STI as % of target STIIn this section we show how actual STI payout over 2020 compared to the target STI payout. Please note that the data presented here does not include any STI payouts over 2020 that were zero, waived or cancelled due to the impact of COVID-19.
The box plot chart below shows the spread in actual STI as percentage of target STI. The X-axis shows the actual STI expressed as % of target STI, e.g. 100% means that the actual STI payout was equal to the target STI payout. The median values can be found at the intersection of the grey and yellow boxes.
Over the last years, the average actual STI payout has generally been around and slightly above 100% of target STI. For 2020, this is still true for the CEO and CFO positions at AEX companies (113% and 120% respectively). The average actual payout for the CEO and the CFO positions at AMX and AScX companies ranged between 89% and 97% of target STI payout.
Actual STI as percentage of target STIQ2 - Q3
Q1 - Q2
19Executive Remuneration in the Netherlands 2021 |

The effect of COVID-19 on STI payoutWithin our dataset, 11 companies decided not to pay out any STI over 2020 due to COVID-19. Only six of these companies disclosed end-of-the-year actual performance on the predetermined KPIs for 2020. Out of these six companies, in four cases the right to a bonus was waived where the performance actually would have permitted a payout. In the other two cases the Management Board declined the right to their annual bonus payout, even though the performance would not have resulted in a payout. At the remaining five companies it is unclear whether the Management Board was entitled to a bonus payout, as no KPI performance was disclosed.
The Supervisory Board of two companies in our dataset decided to alter (part of) the KPIs for the 2020 STI, so that these KPIs were related to the companies’ response to COVID-19. At one company the Supervisory Board decided that the individual qualitative targets set at the beginning of the year were no longer appropriate. The performance on the qualitative part was therefore based on the health and safety of employees, progress and continuity of the business and order intake, and on the focus on cash management. The Supervisory Board of the other company did not replace, but set additional objectives during the year with respect to the continuity of the supply chain, production and customer deliveries, installation and service amidst unprecedented disruptions caused by the pandemic.
Shell is an example of a company that chose not to pay out STI, but where the impact of COVID-19 was still taken into account in a measurable way. After agreeing on the KPI scorecard for 2020 in the beginning of the year, targets quickly became obsolete when the gravity of the impact of COVID-19 became clear. The decision was made not to reset targets but to set them aside. It was communicated that there would be no bonus payout over 2020. The focus for reflection on performance shifted to a combination of ‘care, continuity and cash’.
“In relation to COVID-19, 1 out of 6 companies decided not to pay out any STI over 2020; for the majority of the Dutch
listed companies the impact of COVID-19 on Board remuneration is negligible.
20 | Executive Remuneration in the Netherlands 2021

Weight: 14%
Weight: 17%
Weight: 26%
Weight: 17%
Weight: 19%
Weight: 17%
Weight: 23%
Weight: 25%
Weight: 29%
Weight: 34%
0% 10% 20% 30% 40% 50% 60% 70% 80% 90% 100%
Financing
Working Capital
ROC/ROE/ROIC
Efficiency
Sustainability
People, Health & Safety
Strategy
Cashflow
Revenue
Profit/EPS
KPIs used in STI plansThe chart below shows the percentage of companies that use one of the ten listed KPI categories in their STI plan for the AEX, AMX and AScX indices combined. The chart also shows the average weight companies placed on each KPI category.
Short-term performance is often seen as the company’s annual level of profit. Companies largely adopt this view in their STI plans, with 74% of the companies using some kind of profit or EPS measure to determine annual bonus payouts. Besides the high use of profit related KPIs, the weight on these KPIs is also the highest with 34% on average.
Note that we excluded the KPI category ‘other’ from the chart for which the bar would be comparable to the one for Profit/EPS. Examples of these other KPIs include personal targets, customer metrics and other unspecified qualitative or quantitative measures. Due to SRD2 legislation companies are moving towards more transparent disclosure, but our analysis of KPIs used shows that a significant number of companies is still vague about (some of) their KPIs.
The focus on maximizing annual profits can have adverse consequences for sustainable performance. Therefore, most companies combine various financial and non-financial measures to reduce this risk, besides of course balancing short-term and long-term incentives. In 2020 STI plans included on average 4 to 5 different KPIs, which is higher than a couple of years ago but the same as last year.
“Profit related KPIs are most predominant in STI plans, both in use and in weight.
KPIs used in STI plans
21Executive Remuneration in the Netherlands 2021 |

Share matching plansShare matching plans offer executives the opportunity to invest in company shares for which the company will grant the executives free shares after a certain vesting period.
In most cases executives have to invest at least a part of their STI in company shares and have the opportunity to invest up to a maximum part of their STI. After the vesting period a percentage of the shares purchased, will be matched by the company. In some cases, the percentage of shares that will be matched depends on performance against KPIs in which case the maximum matching can be higher than the target matching.
Eight companies in our dataset offer their executives a share matching plan. These plans can be seen as a hybrid between STI and LTI plans. The table below shows the characteristics of these eight share matching plans.
These plans can be quite effective in aligning interests of executives and shareholders, especially since executives invest in the shares with their own money.
Company Index Min % of STI Max % of STI Vesting Performance Target match Max match
Avantium AScX 50% 100% 3 years No 100% 100%
Heijmans AScX 0% 50% 3 years No 100% 100%
Heineken AEX 25% 50% 5 years No 100% 100%
ICT AScX 33% 66% 3 years Yes 100% 150%
DSM AEX 25% 50% 3 years Yes 67% 100%
Nedap AScX 50% 100% 4 years No 25% 25%
Randstad AEX 25% 50% 3 years Yes 100% 100%
Unilever AEX 33% 67% 4 years Yes 150% 300%
22 | Executive Remuneration in the Netherlands 2021

2.4 Long-Term Incentives
Target LTI levelsLTI levels are commonly expressed as a percentage of salary. Most companies that offer an LTI disclose both a target LTI % and a maximum LTI % for their executives. From our dataset, five companies did only disclose a maximum LTI %.
The table below shows the 2020 target LTI levels for the CEO and CFO as well as revenue and number of FTE at first quartile (Q1), median and third quartile (Q3) level.
When excluding the financial sector companies, the minimum observed target LTI for the CEO position is 22.5% (Neways Electronics) and the maximum target LTI for the CEO position is 300% (Pharming Group and Shell).
For more than half of the observations it holds that the target LTI % is higher for the CEO than for the CFO. When the CEO target LTI % is higher than the CFO target LTI %, the median difference is 28.4% of policy level base salary. This means in general that companies put more emphasis on long-term performance for the CEO then they do for the CFO.
Index Position & scoping Q1 Median Q3
AEX
CEO 100% 150% 213%
CFO 100% 125% 169%
Revenue (EUR m) 2,775 8,784 23,007
FTE 8,955 29,407 83,694
AMX
CEO 63% 100% 108%
CFO 50% 71% 93%
Revenue (EUR m) 556 1,928 3,255
FTE 1,895 5,527 9,913
AScX
CEO 43% 55% 60%
CFO 40% 50% 58%
Revenue (EUR m) 220 528 1,297
FTE 766 2,502 3,139
“For more than half of the observations, target LTI % is higher for the CEO than for the CFO.
This is in line with last year.
23Executive Remuneration in the Netherlands 2021 |

Weight: 21%
Weight: 10%
Weight: 28%
Weight: 30%
Weight: 35%
Weight: 31%
Weight: 19%
Weight: 43%
Weight: 45%
0% 10% 20% 30% 40% 50% 60% 70% 80% 90% 100%
Financing
People, Health & Safety
Cashflow
Strategy
Revenue
ROC/ROE/ROIC
Sustainability
Profit/EPS
TSR (relative)
KPIs used in LTI plansThe chart below shows the percentage of companies that uses one of the nine listed KPI categories in their LTI plan for the AEX, AMX and AScX indices combined. The chart also shows the average weight companies placed on each KPI category.
Long-term performance can be defined as the company’s ability to create value in the long run leading to sustainable profitability. LTI plans typically have a 3-year performance period which leads to a focus on the longer term, but does not necessarily drive sustainable profitability. One way companies try to prevent the performance horizon from becoming shorter is by granting LTIs every year, which ensures continuous longer term focus. In order to extend the performance horizon, more and more companies have implemented a shareholding guideline for their executives which requires them to hold a certain amount of company shares as long as they are in position and often a couple of years beyond that.
Since the share price reflects the company’s ability to generate profits in the coming years, the most commonly used KPI in LTI plans is Total Shareholder Return (TSR) which measures the share price increase plus the dividends paid over the performance period. The weight on the TSR KPI is also the highest with 45% on average. The vast majority of companies who use TSR also compare the TSR performance of their company to the TSR performance of a peer group, which is intended to accommodate pay for true performance. However, this approach can and does still lead to unfair outcomes, mainly because of poor peer group selection.
KPIs used in LTI plans
24 | Executive Remuneration in the Netherlands 2021

On average, LTI plans include 2 to 4 performance measures. Over the past years, the use of sustainability measures has increased. This year 35% of companies used sustainability measures in their LTI plans. The weight of these sustainability measures remained approximately 20%. This is in part due to the increased focus of investors and proxy advisors on broader sustainability goals.
Changes to ongoing LTI plans in relation to COVID-19Within our dataset, ten companies have reported a change to their ongoing LTI plans. At three companies, the Supervisory Board used its discretionary authority and decided to reduce the LTI payout either in part or entirely for the 2018-2020 cycle. At three other companies the Board of Management themselves decided to waive any of their LTI payout in relation to the performance year 2020.
One of the companies that reported a change, Basic-Fit, has changed the payout calculation for their LTI plan 2018-2020 due to the NOW support they received during the final year of the performance cycle. One of the conditions of the NOW support program is that no bonus payouts can occur over the years in which the company received NOW support. This is a simple condition in case of an annual bonus, but is somewhat more complex for LTI plans: bonus payouts are possible for multi-year plans, but only in case no part of the bonus is based on the performance year in which the company received NOW support.
To be able to still reward performance in the years 2018 and 2019, Basic-Fit has therefore opted to exclude 2020 and apply pro-rata vesting. This means that instead of evaluating the full 3-year performance period, each year is considered on its own and vesting for 2020 is considered to be zero. To illustrate, vesting of respectively 100% and 150% in 2018 and 2019 would result in vesting of 83.3% (= 250% / 3). Basic-Fit also announced that this alternative payout calculation will apply to any other ongoing and future LTI plans including years in which NOW support was received.
The approach of Basic-Fit is understandable in their situation and received a positive shareholder vote. At companies where no NOW support has been received and company performance has decreased in relation to COVID-19, this may not be the case. Decisions by Remuneration Committees such as revisiting performance periods or changing performance measures mid-way should be considered carefully in light of the objective of the plan, fairness and shareholder support. At the same time however, Remuneration Committees do need to decide what to do in case performance levels become unachievable or pre-defined performance measures are no longer relevant, as well as contemplating what the best approach will be for future LTI plans.
“The most predominant KPI in LTI plans is still (relative) TSR. A growing emphasis on
sustainability is visible.
25Executive Remuneration in the Netherlands 2021 |

Index Position % Use Q1 Median Q3
AEXCEO 63% 275% 300% 400%
CFO 61% 163% 200% 300%
AMXCEO 62% 200% 200% 300%
CFO 68% 100% 150% 150%
AScXCEO 42% 175% 200% 300%
CFO 40% 138% 175% 200%
Shareholding guidelinesMost companies offer LTI grants every year in order to continuously provide long-term incentives. This prevents loss of focus on the longer term in the event that performance targets of previous grants become or begin to appear unattainable. Another way to strengthen the executives’ focus on the longer term and to increase the performance horizon, is the use of shareholding guidelines.
These guidelines can be seen as part of the trend towards more shareholder commitment, long-term value creation and commitment to institutional investors, who are strong supporters of the idea that management has skin in the game to play fairly with controllable risks.
Shareholding guidelines are usually expressed as a % of fixed salary. The table below shows the usage and levels of shareholding guidelines in 2020.
In 2020 both the usage and levels of shareholding guidelines increased compared to last year, which is in line with the trend we have seen over the years 2014 to 2020 when the average usage increased from 24% to 58%.
“In line with the trend, shareholding guidelines are used more often. This year
the increase is a remarkable 15%.
26 | Executive Remuneration in the Netherlands 2021

0 20 40 60 80 100 120 140
AScX
AMX
AEX
2.5 Internal pay ratios
Internal pay ratios are described in the Governance Code as the ratios between the remuneration of the Management Board members and that of a representative reference group determined by the company for the financial year as well as for the previous financial year. As indicated in the Outlook, the Monitoring Committee advises to use one uniform way to calculate internal pay ratios as of 2021.
The box plot chart below shows the spread of the reported pay ratios in the three indices, including financial sector companies. The X-axis shows the pay ratio level, e.g. 100 means that the CEO or Management Board remuneration was 100 times the remuneration level of the reference group as chosen by the company.
The median value at AEX companies was 32.6, at AMX companies it was 25.0 and at AScX companies is was 11.6. Still, we would like to point out that absolute pay ratio levels are not useful to compare between companies because of differences in build-up and geographic location of companies’ workforces.
Spread of reported internal pay ratiosQ2 - Q3
Q1 - Q2
27Executive Remuneration in the Netherlands 2021 |

Impact on the remuneration policy Based on the Governance Code, listed companies in the Netherlands were required to mention that internal pay ratios have been taken into account when formulating the remuneration policy. With the implementation of SRD2 in Dutch law, companies have to explain how internal pay ratios have been taken into account in their remuneration policies as of 2020.
We noticed that companies struggled fulfilling this requirement. Companies often mentioned that internal pay ratios were taken into account, but rarely provide a proper explanation as to how it was taken into account. Most companies have chosen to use CEO remuneration or Management Board remuneration to compare with the remuneration of all other employees. In our view, it is mainly for this reason that most companies still struggle to meaningfully take internal pay ratios into account in the remuneration policies for their executives.
Taking internal pay ratios into account serves to justify pay differences from an internal perspective as well. Therefore, more meaningful internal pay ratios are ratios between the CEO and the level of managers below the Management Board and between other Board Members (incl. CFO) and the level of managers below the board. This is because the level below the Management Board often is included in the internal grading and remuneration structure. By setting appropriate policy ranges for these pay ratios, the company is able to balance Management Board remuneration also from the internal perspective. Next to this, the internal pay ratios give meaningful information when their development is transparently disclosed which is an important requirement from governance and SRD2 perspective.
28 | Executive Remuneration in the Netherlands 2021

Annual fee levels moderately increased across the indices compared to last year. Pay differences for SB members are significant between AEX and the other two indices.
The table below shows the 2020 Audit Committee fees at first quartile (Q1), median and third quartile (Q3) level.
2.6 Supervisory Board remuneration
This section provides insight into the remuneration levels for Supervisory Board (SB) members at AEX, AMX and AScX companies in 2020.
The table below shows the 2020 annual fee levels for the Supervisory Board Chairman and Member positions at first quartile (Q1), median and third quartile (Q3) level.
Index Position Q1 Median Q3
AEXChairman € 94,000 € 111,000 € 204,000
Member € 60,000 € 70,000 € 100,000
AMXChairman € 63,000 € 75,000 € 98,000
Member € 45,000 € 50,000 € 65,000
AScXChairman € 50,000 € 60,000 € 75,000
Member € 36,000 € 41,000 € 52,000
Index Position Q1 Median Q3
AEXChairman € 15,150 € 20,000 € 26,500
Member € 10,000 € 14,250 € 18,000
AMXChairman € 10,000 € 10,000 € 15,000
Member € 7,100 € 7,500 € 8,250
AScXChairman € 7,690 € 9,880 € 10,550
Member € 5,000 € 6,160 € 7,090
29Executive Remuneration in the Netherlands 2021 |

The table below shows the 2020 Remuneration Committee fees at first quartile (Q1), median and third quartile (Q3) level.
While the committee fees for audit committees stayed relatively stable across all indices since last year, the committee fees for remuneration committees increased across all indices since last year, with the biggest increase at AEX companies where the median fee level increased by 18.9% and 17.5% for the Chairman and Member respectively. However, our analysis shows that the committee fees for Audit Committee work still exceed those for Remuneration Committee work although the absolute gap decreased last year.
We found that most companies in our sample disclose detailed information on the remuneration of their individual SB members and reported additional fixed committee fees in 2020. With the implementation of SRD2 companies are also required to report the development of SB members remuneration over the last 5 years. We found a significant improvement in companies complying to this requirement compared to last year.
Index Position Q1 Median Q3
AEXChairman € 12,880 € 17,260 € 20,000
Member € 7,500 € 11,750 € 14,750
AMXChairman € 7,430 € 10,000 € 10,000
Member € 5,000 € 7,000 € 7,350
AScXChairman € 6,560 € 7,340 € 8,660
Member € 4,880 € 5,000 € 5,690
30 | Executive Remuneration in the Netherlands 2021
3.1 EYfindingsfromtheauditseason
The implementation of SRD2 in Dutch law and the outbreak of COVID-19 made 2020 a special reporting year. Aimed to enhance long-term shareholder engagement, the directive requires companies to be more transparent in their reporting on executive remuneration.
The impact of this new legislation on remuneration reports of Dutch listed companies was already observable last year. The two audit seasons since the implementation of SRD2 have shown that several SRD2 requirements are open to interpretation, especially when only the Dutch Civil Code text is taken into account. The ‘problem’ has been that the guidance from the European Committee on how to comply to SRD2 is non-binding and more importantly, is still a draft document. Nonetheless, this draft guidance clarifies the intention of the SRD2 legislation.
Since reporting year 2020, the remuneration policy of Dutch listed companies has to comply to SRD2 as well. We found that few companies fully comply with the intention of the new reporting requirements.
Disclosure on how the internal pay ratios are taken into accountAccording to SRD2 the company should explain in the remuneration policy how the internal pay ratios have been taken into account. We observed that most companies mention that the internal pay ratios are taken into account but do not explain how. Companies could however for example specify which ratio(s) are referred to in the policy (e.g. CEO vs median employee or Board vs Board level -1) and explain within which range these ratios should be and why these ranges are considered appropriate as well as how the Supervisory Board will act if ratios are outside the appropriate ranges.
Disclosure on how the advisory vote is taken into account Another much-debated topic was the advisory vote on the remuneration report during the AGM. Within the remuneration report the company should explain how the previous AGM vote on the remuneration report was taken into account in this year’s report. While the majority of the companies in our dataset mention in the remuneration report that the advisory vote took place (49 out of 66 companies), less than half of the companies explain how the result of this vote has been taken into account (23 out of 49 companies). Companies could, for example, explain the content of shareholder criticism on the remuneration report and what the company changed to provide more insight.
3. Shareholder Rights Directive
31Executive Remuneration in the Netherlands 2021 |

“ASR shows how companies can use internal pay ratios to properly balance internal and external
perspectives in board remuneration.
3.2 Examples of transparent disclosure
Last year we discussed how companies had reported on some of the key requirements from SRD2, such as transparent disclosure on KPIs used in variable pay plans. This year we highlight two topics that were new for 2020. Firstly, the explanation on how the internal pay ratios have been taken into account in the new remuneration policy and secondly, the explanation of how the advisory vote on the previous remuneration report has been taken into account in this year’s report.
In our view, no company provided a truly transparent explanation of how the internal pay ratios were taken into account in the remuneration policy. We consider Philips and Signify as two examples who transparently disclosed the considerations of the Supervisory Board in determining whether the internal pay ratio is appropriate. However, we believe ASR can serve as an example of how a company can use internal pay ratios to properly balance internal and external perspectives in board remuneration.
In addition, we feel that ASR also serves as a good example of explaining how the result of the advisory vote on last year’s remuneration report was taken into account in this year’s report. They mention the reasons why some shareholders issued a negative voting advice and discuss the decisions of the Supervisory Board with respect to this topic.
32 | Executive Remuneration in the Netherlands 2021

3.3 Voting results from 2021 AGMs
The implementation of SRD2 into Dutch law last year prescribes two voting items related to executive remuneration on the AGM. First, the remuneration policy has to be re-submitted to the AGM for adoption at least every 4 years. Dutch SRD2 legislation requires a 75% majority of votes casted to accept changes to the remuneration policy, except if the company’s by-laws state otherwise. The second voting item during the AGM concerns an advisory vote on the remuneration report.
Last year, the remuneration policy of 6 out of the 66 companies in our dataset had been rejected. At the moment of writing this report, 61 of the 66 companies in our dataset have held their 2021 AGM. Of these 61 companies, 16 companies resubmitted their remuneration policy to the AGM for adoption. Of these 16 companies, 13 companies have obtained the majority of 75% of votes casted for approval of the updated remuneration policies during the 2021 AGM. Of the remaining three companies, one did not publish the voting results online. The remuneration policies of the other two companies have been rejected for the second year in a row. One of the rejected policies was primarily voted against because of the dominating discretionary power of the Supervisory Board as well as the high value of the total remuneration package. Unfavorable voting results for the other company were mainly due to the poor performance of the Management Board as perceived by a large shareholder.
Notable is that multiple companies of which the remuneration policy was rejected last year proposed a more restrained remuneration policy this year. Furthermore, seven companies revised their reference group that will be used for the company’s market positioning, often including more European companies.
During the 2021 AGMs, most companies received a favorable advisory vote on their remuneration report. So far, two companies received a negative advice on their remuneration report for reasons unknown yet. Another three companies did not publish any voting results.
33Executive Remuneration in the Netherlands 2021 |

4.1 Executive remuneration
Being transparent and compliant is imperative these days. Our team supports Remuneration Committees and HR/C&B directors to design appropriate remuneration packages for their executives. We help our clients to write transparent and compliant remuneration policies. We support listed clients with writing their remuneration report and preparing them for their shareholder meeting. Furthermore, our team assists companies with the design and implementation of management participation plans and short- and long-term incentive plans.
4.2 HR transactions
Most companies are trying to achieve synergies from a merger or acquisition, but often fail to do so. We help clients to succeed by supporting them with their due diligence and guiding them through the process towards and beyond closing a deal. Our teams support clients with the planning process and execution of different work streams, such as total rewards integration, labor relations, organizational design & talent retention, employee experience and HR operations.
4.3 Variable pay plans
Many employees perceive variable pay as a dissatisfier. Although companies spend a lot of time and money on their variable pay programs, they often do not achieve the desired result at the right cost. Our reward team understands this contradicting outcome. We help our clients overcome this by improving transparency and fairness and by reducing complexity and executional difficulties of their variable pay programs.
4.4 Other specialty services
Other specialty services our Reward team provides are:• Interim in-house C&B management and operations• Reward strategy design• Salary structuring and merit systems• Management Incentive Plan design in Private Equity Deals
Please feel free to contact us at [email protected]. We are always more than happy to think along and help you navigate your Reward challenges!
4. Our services
34 | Executive Remuneration in the Netherlands 2021

* Financial Sector company** Some companies were not included due to insufficient disclosure on remuneration or deviating reporting periods
AEX** AMX** AScX**
ABN AMRO* Aalberts Industries Accell Group
Adyen* Aperam AMG
Aegon* Arcadis Alfen
Ahold Delhaize Basic-Fit Amsterdam Commodities
AkzoNobel BE Semiconductor Industries Avantium
ArcelorMittal Corbion B&S Group
ASM International Fagron Brunel International
ASML Holding Fugro ForFarmers
ASR* Grandvision Heijmans
Galápagos Intertrust* ICT Group
Heineken Koninklijke BAM Groep Kendrion
IMCD Koninklijke Boskalis Nedap
ING Groep* Koninklijke Vopak Neways Electronics
Just Eat Takeaway.com NSI NIBC Holding*
Koninklijke DSM OCI Ordina
Koninklijke KPN Pharming Group Sif Holding
Koninklijke Philips PostNL Sligro Food Group
NN Group* SBM Offshore TomTom
Randstad Holding Signify Van Lanschot*
RELX Group TKH Group VastNed Retail
Royal Dutch Shell WDP Wereldhave
Unibail-Rodamco
Unilever
Wolters Kluwer
5 Appendix: included companies
35Executive Remuneration in the Netherlands 2021 |

EY | Building a better working world
EY exists to build a better working world, helping to create long-term value for clients, people and society and build trust in the capital markets.
Enabled by data and technology, diverse EY teams in over 150 countries provide trust through assurance and help clients grow, transform and operate.
Working across assurance, consulting, law, strategy, tax and transactions, EY teams ask better questions to find new answers for the complex issues facing our world today.
EY refers to the global organization, and may refer to one or more, of the member firms of Ernst & Young Global Limited, each of which is a separate legal entity. Ernst & Young Global Limited, a UK company limited by guarantee, does not provide services to clients. Information about how EY collects and uses personal data and a description of the rights individuals have under data protection legislation are available via ey.com/privacy. EY member firms do not practice law where prohibited by local laws. For more information about our organization, please visit ey.com.
This news release has been issued by EYGM Limited, a member of the global EY organization that also does not provide any services to clients.
About EY’s People Advisory Services
In today’s market, people make the difference between success and failure. As your organization grows, getting the right people in the right place when you need them is what gives you competitive advantage. Our performance and reward professionals help you design compensation programs and equity incentives that really engage your key people. Our global mobility team advises many of the world’s largest global employers — as well as those just venturing into their first foreign country. We help you meet your executive tax compliance obligations, stay on top of regulatory change, manage your global talent effectively and improve your function’s strategic alignment. Let us help your organization achieve its potential by turning complexity into competitive advantage. It’s how EY makes a difference.
© 2021 Ernst & Young Belastingadviseurs LLP. All Rights Reserved.
ED None
This material has been prepared for general informational purposes only and is not intended to be relied upon as accounting, tax, legal or other professional advice. Please refer to your advisors for specific advice.
ey.com/nl