Decreasing prevalence of obesity among young children in Massachusetts from 2004 to 2008
9
Decreasing Prevalence of Obesity Among Young Children in Massachusetts From 2004 to 2008 WHAT’S KNOWN ON THIS SUBJECT: Following a rapid increase from 1980 to 2001, the prevalence of obesity among school-age children and adolescents in the United States has plateaued. Few studies have examined obesity trends among younger children in the past decade, and findings are inconsistent. WHAT THIS STUDY ADDS: Among children aged ,6 years at this multisite pediatric practice, the prevalence of obesity was fairly stable during 1999–2003, but substantially decreased during 2004–2008. This decrease was smaller among children insured by Medicaid than children insured by non-Medicaid health plans. abstract OBJECTIVE: To examine whether the obesity prevalence is increasing, level, or decreasing among young US children (aged ,6 years) in the past decade; and to compare regional data to those of 2 national databases. METHODS: We analyzed data from 108 762 well-child visits (36 827 children) at a multisite pediatric practice in eastern Massachusetts during 1999–2008. By using the Centers for Disease Control and Prevention 2000 gender-specific growth charts, we defined obesity as weight-for-length $95th percentile for children aged ,24 months and BMI $95th percentile for children aged 24 to ,72 months. By using multivariable logistic regression, we estimated gender-specific obesity trends in 2 separate periods, 1999–2003 and 2004–2008, adjusting for age group, race/ethnicity, health insurance, and practice site. RESULTS: From 1999 to 2003, the obesity prevalence was fairly stable among both boys and girls. From 2004 to 2008, the obesity prevalence substantially decreased among both boys and girls. The decline in obe- sity prevalence during 2004–2008 was more pronounced among chil- dren insured by non-Medicaid health plans than among those insured by Medicaid. CONCLUSIONS: Among children aged ,6 years at this multisite pe- diatric practice, obesity prevalence decreased during 2004–2008, which is in line with national data showing no increase in prevalence during this time period. The smaller decrease among Medicaid-insured children may portend widening of socioeconomic disparities in childhood obesity. Pediatrics 2012;129:823–831 AUTHORS: Xiaozhong Wen, MD, PhD, a Matthew W. Gillman, MD, SM, a Sheryl L. Rifas-Shiman, MPH, a Bettylou Sherry, PhD, RD, b Ken Kleinman, ScD, a and Elsie M. Taveras, MD, MPH a a Obesity Prevention Program, Department of Population Medicine, Harvard Medical School and Harvard Pilgrim Health Care Institute, Boston, Massachusetts; and b Obesity Prevention and Control Branch, Division of Nutrition, Physical Activity, and Obesity, Centers for Disease Control and Prevention, Atlanta, Georgia KEY WORDS obesity, BMI, child, infant, prevalence, trends, epidemiology ABBREVIATIONS CENTURY—Collecting Electronic Nutrition Trajectory Data Using e-Records of Youth CI—confidence interval GEE—generalized estimating equation HVMA—Harvard Vanguard Medical Associates OR—odds ratio PedNSS—Pediatric Nutrition Surveillance System Dr Wen contributed to the development of study aims, led the analytic plan, conducted all data analyses, and wrote the manuscript; Dr Gillman contributed to the development of study aims and the analytic plan, interpreted the results, and made major contributions to revising the manuscript; Ms Rifas- Shiman contributed to the development of study aims, prepared the data set, checked SAS programming, and revised the manuscript; Dr Sherry contributed to the development of study aims, result interpretation, and revision of the manuscript; Dr Kleinman contributed to the development of study aims and the analytic plan, guided data analysis, and revised the manuscript; Dr Taveras was the principal investigator of this study and contributed to the development of the study aims and the analytic plan, result interpretation, and revision of the manuscript; Dr Wen has full access to the data and takes responsibility for its integrity and the accuracy of the data analysis. This work is solely the responsibility of the authors and does not represent official views of the Centers for Disease Control and Prevention. www.pediatrics.org/cgi/doi/10.1542/peds.2011-1833 doi:10.1542/peds.2011-1833 Accepted for publication Oct 28, 2011 Address correspondence to Xiaozhong Wen, MD, PhD, Obesity Prevention Program, Department of Population Medicine, Harvard Medical School and Harvard Pilgrim Health Care Institute, 133 Brookline Ave, 3rd Floor, Boston, MA 02215. E-mail: [email protected] (Continued on last page) PEDIATRICS Volume 129, Number 5, May 2012 823 ARTICLE
-
Upload
populationmedicine -
Category
Documents
-
view
1 -
download
0
Transcript of Decreasing prevalence of obesity among young children in Massachusetts from 2004 to 2008

Decreasing Prevalence of Obesity Among YoungChildren in Massachusetts From 2004 to 2008
WHAT’S KNOWN ON THIS SUBJECT: Following a rapid increasefrom 1980 to 2001, the prevalence of obesity among school-agechildren and adolescents in the United States has plateaued. Fewstudies have examined obesity trends among younger children inthe past decade, and findings are inconsistent.
WHAT THIS STUDY ADDS: Among children aged ,6 years at thismultisite pediatric practice, the prevalence of obesity was fairlystable during 1999–2003, but substantially decreased during2004–2008. This decrease was smaller among children insured byMedicaid than children insured by non-Medicaid health plans.
abstractOBJECTIVE: To examine whether the obesity prevalence is increasing,level, or decreasing among young US children (aged ,6 years) inthe past decade; and to compare regional data to those of 2 nationaldatabases.
METHODS: We analyzed data from 108 762 well-child visits (36 827children) at a multisite pediatric practice in eastern Massachusettsduring 1999–2008. By using the Centers for Disease Control andPrevention 2000 gender-specific growth charts, we defined obesity asweight-for-length $95th percentile for children aged ,24 months andBMI $95th percentile for children aged 24 to ,72 months. Byusing multivariable logistic regression, we estimated gender-specificobesity trends in 2 separate periods, 1999–2003 and 2004–2008,adjusting for age group, race/ethnicity, health insurance, and practicesite.
RESULTS: From 1999 to 2003, the obesity prevalence was fairly stableamong both boys and girls. From 2004 to 2008, the obesity prevalencesubstantially decreased among both boys and girls. The decline in obe-sity prevalence during 2004–2008 was more pronounced among chil-dren insured by non-Medicaid health plans than among those insuredby Medicaid.
CONCLUSIONS: Among children aged ,6 years at this multisite pe-diatric practice, obesity prevalence decreased during 2004–2008, whichis in line with national data showing no increase in prevalence duringthis time period. The smaller decrease among Medicaid-insured childrenmay portend widening of socioeconomic disparities in childhood obesity.Pediatrics 2012;129:823–831
AUTHORS: Xiaozhong Wen, MD, PhD,a Matthew W. Gillman,MD, SM,a Sheryl L. Rifas-Shiman, MPH,a Bettylou Sherry,PhD, RD,b Ken Kleinman, ScD,a and Elsie M. Taveras, MD,MPHa
aObesity Prevention Program, Department of PopulationMedicine, Harvard Medical School and Harvard Pilgrim HealthCare Institute, Boston, Massachusetts; and bObesity Preventionand Control Branch, Division of Nutrition, Physical Activity, andObesity, Centers for Disease Control and Prevention, Atlanta,Georgia
KEY WORDSobesity, BMI, child, infant, prevalence, trends, epidemiology
ABBREVIATIONSCENTURY—Collecting Electronic Nutrition Trajectory Data Usinge-Records of YouthCI—confidence intervalGEE—generalized estimating equationHVMA—Harvard Vanguard Medical AssociatesOR—odds ratioPedNSS—Pediatric Nutrition Surveillance System
Dr Wen contributed to the development of study aims, led theanalytic plan, conducted all data analyses, and wrote themanuscript; Dr Gillman contributed to the development of studyaims and the analytic plan, interpreted the results, and mademajor contributions to revising the manuscript; Ms Rifas-Shiman contributed to the development of study aims, preparedthe data set, checked SAS programming, and revised themanuscript; Dr Sherry contributed to the development of studyaims, result interpretation, and revision of the manuscript; DrKleinman contributed to the development of study aims and theanalytic plan, guided data analysis, and revised the manuscript;Dr Taveras was the principal investigator of this study andcontributed to the development of the study aims and theanalytic plan, result interpretation, and revision of themanuscript; Dr Wen has full access to the data and takesresponsibility for its integrity and the accuracy of the dataanalysis.
This work is solely the responsibility of the authors and does notrepresent official views of the Centers for Disease Control andPrevention.
www.pediatrics.org/cgi/doi/10.1542/peds.2011-1833
doi:10.1542/peds.2011-1833
Accepted for publication Oct 28, 2011
Address correspondence to Xiaozhong Wen, MD, PhD, ObesityPrevention Program, Department of Population Medicine,Harvard Medical School and Harvard Pilgrim Health CareInstitute, 133 Brookline Ave, 3rd Floor, Boston, MA 02215.E-mail: [email protected]
(Continued on last page)
PEDIATRICS Volume 129, Number 5, May 2012 823
ARTICLE

After a rapid increase from 1980 to2001,1,2 recent reports indicate that theprevalence of childhood obesity in theUnited States may have reached a pla-teau or even started to decline.3–7 Mostof these reports have included school-age US children and adolescents,whereas few focus on obesity amonginfants, toddlers, and preschool-agechildren. Weight status is more modi-fiable, and thus obesity is more pre-ventable in early childhood than atlater ages,8 because children’s behav-iors and lifestyles are developing9 anddominantly influenced by parents andfamily environments.10 Furthermore,evidence suggests that early treatmentof obesity is often more effective thanstarting at later age.8,11 Thus, there isa need for additional study of the trendsin obesity prevalence among youngchildren.
The NHANES2–4,12,13 and the Pediatric Nu-trition Surveillance System (PedNSS)14,15
are 2 main national data sources formonitoring obesity trends among chil-dren aged,6 years. However, NHANEShas a small sample size of young chil-dren, especially for those aged ,2years,2–4,12,13 limiting its ability to ex-amine reliable obesity trends amongyoung children, particularly withinage, racial/ethnic, and socioeconomicsubgroups. The PedNSS14,15 primarilycomprises low-income children whoparticipate in federally funded supple-mental nutrition programs, limiting itsgeneralizability. These limitations maylead to inconsistencies in observedobesity trends among young children inthese 2 national samples. For example,NHANES data showed that the obesityprevalence among children aged 2 to 5years was 13.9% in 2003–2004, 11.0% in2005–2006, and 10.4% in 2007–2008,3,4
whereas in PedNSS, the obesity preva-lence was fairly stable.7,16–18 Thesefindings raise the possibility that de-creases in obesity prevalence are be-ginning to appear among children of
higher, but not lower, socioeconomicstatus, which has not been examined ineither NHANES or PedNSS data. Alter-natively, by using data from clinicalrecords of well-child visits at a large,diverse pediatric practice, our researchteam previously reported a continuousincrease in obesity prevalence amongchildren aged ,6 years from 1980through 2001,19 largely paralleling thetrends reported by NHANES13 andPedNSS7,14 during similar periods. Inthis study, we report current trendsduring the past decade (1999–2008).
Wehad3purposes in theseanalyses: (1)to assess trends in obesity amongyoung children (aged,6 years) during1999–2008 by using our CENTURY data;(2) to examine gender, age, race/ethnicity,and socioeconomic differences in thesetrends; and (3) to compare thesetrends with those based on NHANESand PedNSS.
METHODS
Sample
By using the Collecting Electronic Nu-trition Trajectory Data Using e-Recordsof Youth (CENTURY) Study data, weextracted length/height, weight, anddemographics from electronic medicalrecords of 312 857 children seen at2 121 511 well-child visits from 1980
through 2008 at Harvard VanguardMedical Associates (HVMA), a multisitegroup pediatric practice in easternMassachusetts. We have previouslypublished details of data collectionmethods in our analysis of obesitytrends from 1980 through 2001.19 Forthe purposes of this analysis, weinitially restricted visits in whichchildren were ,72 months of age andgrouped children’s ages into 5 inter-vals: 0 to,6, 6 to,12, 12 to,24, 24 to,36, and 36 to ,72 months. Then werandomly chose 1 visit within each ageinterval for each child to allow for es-timated prevalence and logistic re-gression within the same data set,similar to the method used by TheCenters for Disease Control and Pre-vention (CDC) in PedNSS reports.7 Weexcluded 1 HVMA practice site becausepediatric service was unavailableat this site after 2000. Among theremaining sample, we included 159196 visits by 56 169 children betweenJanuary 1, 1999, and December 31,2008. Given the importance of race/ethnicity, we further excluded 50 434visits by 19 342 children with missingdata on race/ethnicity. Thus, the finalanalysis was conducted among 108762 visits by 36 827 children. Figure 1shows the participant flowchart forthis analysis.
FIGURE 1Flowchart of the analytic sample, CENTURY Study data, 1999–2008.
824 WEN et al

Compared with the sample excludedbecause of missing race/ethnicity data,the analytic sample did not differ sub-stantially in gender (female partici-pants, 48.8% in the excluded samplevs 49.1% in the analytic sample), age(mean, 21.2 vs 21.7months), Medicaidinsurance (12.7% vs 14.1%), or the pre-valence of obesity (8.5% vs 8.6%). How-ever, the analytic sample containedgreater proportions of recent visitsduring 2006–2008.
Measures
At each well-child visit, children’sweight and length/height were mea-sured by medical assistants accordingto the written protocol of HVMA. An-thropometric equipments are cali-brated annually at HVMA, and a mastertrainer conducts periodic qualitychecks for anthropometric measuresby medical assistants. Weight withoutheavy clothes and shoes was measuredwith pediatric scales and rounded to thenearest 0.25 pound. Length withoutshoes was measured in recumbent po-sition by using a paper-and-penciltechnique for children ,24 monthsand height without shoes in standingposition for those aged $24 months.
In a validation study among 0- to 24-month-old infants conducted at 1 of ourpediatric practice sites, we found thatthe paper-and-pencil method systemati-cally overestimated children’s lengthcompared with a reference method.Thus, as in our previous work, we useda regression correction factor to par-tially adjust for this systematic over-estimation: [(0.953 3 length measuredby paper-and-pencilmethod) + 1.8 cm].20
Using the CDC 2000 growth charts, wecalculated weight-for-length percentilespecific to gender and age for childrenaged ,24 months and BMI (BMI =weight in kilograms/height in meters2)percentile by genderand age for childrenaged $24 months.21 To be consistentregarding reference population, we did
not use World Health Organizationcharts for children aged .24 months.We defined obesity as weight-for-lengthor BMI $95th percentile in this analy-sis,22 assuming that both measurescould indirectly reflect body adiposityto a similar extent. However, we recog-nize slight differences between these2 measures due to the use of supinelength for weight-for-length assessmentof ,24-month-olds versus the use ofstanding height for BMI assessment ofchildren$24 months of age.
Race and ethnicity of children werereported by parents. We recoded theoriginal categories into non-Hispanicwhite, non-Hispanic African American,Hispanic, Asian American, and otherrace/ethnicity. Health insurance type(Medicaid versus non-Medicaid) wasretrieved from medical records.
Statistical Analysis
Given gender differences in childhoodgrowth, we conducted all analysesseparately forboys andgirls. To examinetrends in the prevalence of obesity overtime, we first estimated obesity preva-lence in each year (visualized in Fig 2)and then performed multivariable lo-gistic regression to adjust for potentialchanges in demographics (ie, age, race/ethnicity, types of health insurance) andpractice sites across years.
Because initial observation of obesityprevalences and 2-slope tests of trends(data not shown, P value ,.01 for boysand P value = .07 for girls) suggesteda turning point between 2003 and 2004,we fit multivariable logistic regressionmodels during two 5-year periods sepa-rately: from 1999 to 2003 and from 2004to 2008. We conducted linear trend testsby including calendar year as a contin-uous independent variable in logisticregression models with obesity as thebinary dependent variable. The esti-mated odds ratios (ORs) and their con-fidence intervals (CIs) corresponded tothe change in odds of obesity per year
during each 5-year period. To accountfor the correlation between multiplevisits by the same child, we used gen-eralized estimating equations (GEEs) tofit logistic regression models. To exam-ine interactions between time trend anddemographics (ie, age, race/ethnicity,and health insurance), we conductedstratified analyses among the 5 agesubgroups, the 5 race/ethnicity sub-groups, and the 2 health insurancesubgroups. We used ordinary logisticregression (instead of GEEs) for age-stratified analysis, because there wasnomore than 1 visit for each child withineach age group.
In addition,weanalyzed trends among2broader age subgroups (0 to ,24 and24 to ,72 months) and also groupedvisit years into 5 biannual periods(1999–2000, 2001–2002, 2003–2004,2005–2006, and 2007–2008) to facili-tate external comparison of obesityprevalence to 2 national samples ofNHANES and PedNSS data during 1999–2008. For simplicity, we report com-parisons across these 3 samples onlyduring 3 biannual periods: 1999–2000,2003–2004, and 2007–2008. We obtainedsample size, obesity prevalences, andstandard errors in 1999–2000, 2003–2004, and 2007–2008 NHANES frompublished articles2,3,4,12 and onlineupdates,23 and supplemental detailson age ,24 months were obtainedthrough personal communication withthe lead author (Dr Cynthia L. Ogden,September 27, 2010) of these articles.We obtained sample size and obesityprevalences in 2000, 2003, 2004, 2007,and 2008 PedNSS from summarytables16 publishedonline (http://www.cdc.gov/pednss/pednss_tables/tables_health_indicators.htm). For PedNess,we used the year of 2000 as the proxyfor 1999–2000, collapsed 2003 and 2004as 2003–2004, and collapsed 2007 and2008 as 2007–2008. We included all avail-able samples in PedNSS summary tables,reasoning that the slight variation in
ARTICLE
PEDIATRICS Volume 129, Number 5, May 2012 825
participating states/tribal governments/territories during 1999–2008 (46 vs 52)should not substantially impact theoverall estimates. We did not calculatestandard errors of prevalence in PedNSS,because it can be viewed as a censussample. We completed all analyses in SASversion 9.2 (SAS Institute Inc., Cary, NC).
RESULTS
Sample Characteristics
Table 1 shows the sample character-istics by visit years. Approximately 50%
of the children were boys, a proportionthat was stable over the study period.Likewise, the age distribution was simi-lar across the study period. In contrast,we observed substantial changes in thedistribution of race/ethnicity from 1999through 2008, with decreasing percen-tages of non-Hispanic white (63.6% in1999–2000 vs 57.7% in 2007–2008) andnon-Hispanic African Americans (18.3%vs 13.5%) but an increasing percentageof Asian Americans (5.7% vs 12.8%).HVMA did not acceptMedicaid insurancebefore 1999 and part of 2000, leading
to a dramatic increase in the pro-portion of Medicaid-insured childrenfrom 1999–2000 to 2001–2002; it in-creased slowly afterward. The distribu-tion of well-child visits by young childrenacross HVMA pediatric practice siteswas fairly stable during the study period,except for a decline in percentages ofwell-child visits by young children (thenumber at each site divided by the totalnumber at all sites) occurred at site 6and an increase at site 8.
Trend in Prevalences of Obesity
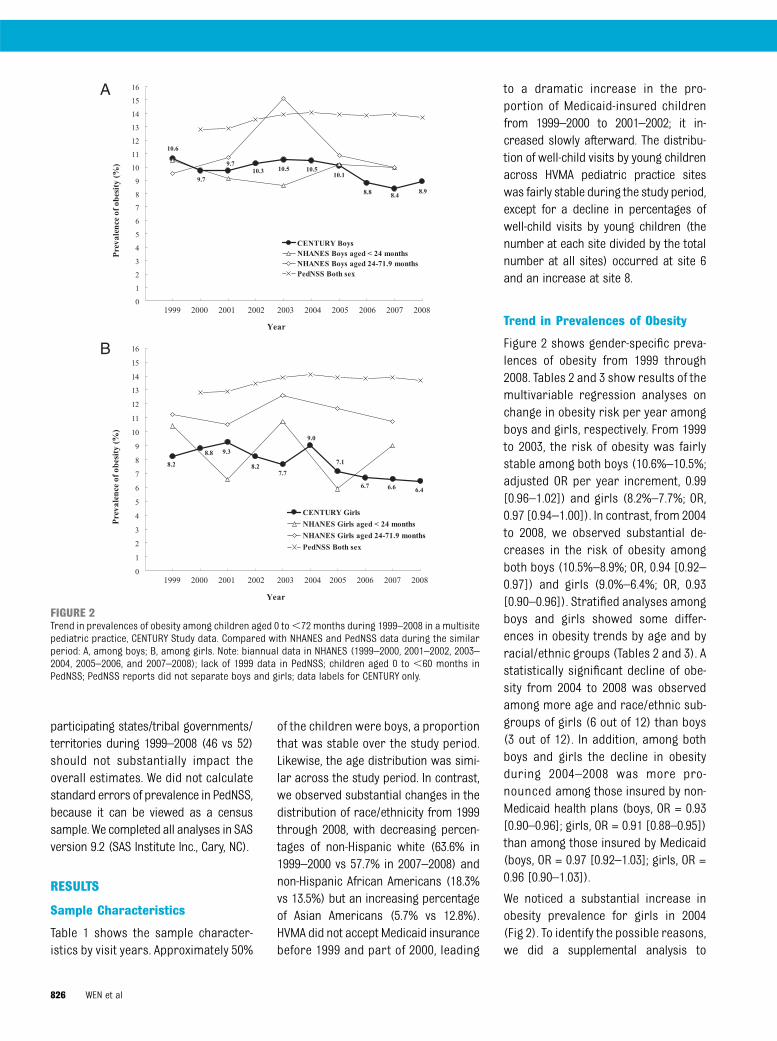
Figure 2 shows gender-specific preva-lences of obesity from 1999 through2008. Tables 2 and 3 show results of themultivariable regression analyses onchange in obesity risk per year amongboys and girls, respectively. From 1999to 2003, the risk of obesity was fairlystable among both boys (10.6%–10.5%;adjusted OR per year increment, 0.99[0.96–1.02]) and girls (8.2%–7.7%; OR,0.97 [0.94–1.00]). In contrast, from 2004to 2008, we observed substantial de-creases in the risk of obesity amongboth boys (10.5%–8.9%; OR, 0.94 [0.92–0.97]) and girls (9.0%–6.4%; OR, 0.93[0.90–0.96]). Stratified analyses amongboys and girls showed some differ-ences in obesity trends by age and byracial/ethnic groups (Tables 2 and 3). Astatistically significant decline of obe-sity from 2004 to 2008 was observedamong more age and race/ethnic sub-groups of girls (6 out of 12) than boys(3 out of 12). In addition, among bothboys and girls the decline in obesityduring 2004–2008 was more pro-nounced among those insured by non-Medicaid health plans (boys, OR = 0.93[0.90–0.96]; girls, OR = 0.91 [0.88–0.95])than among those insured by Medicaid(boys, OR = 0.97 [0.92–1.03]; girls, OR =0.96 [0.90–1.03]).
We noticed a substantial increase inobesity prevalence for girls in 2004(Fig 2). To identify the possible reasons,we did a supplemental analysis to
FIGURE 2Trend in prevalences of obesity among children aged 0 to,72 months during 1999–2008 in a multisitepediatric practice, CENTURY Study data. Compared with NHANES and PedNSS data during the similarperiod: A, among boys; B, among girls. Note: biannual data in NHANES (1999–2000, 2001–2002, 2003–2004, 2005–2006, and 2007–2008); lack of 1999 data in PedNSS; children aged 0 to ,60 months inPedNSS; PedNSS reports did not separate boys and girls; data labels for CENTURY only.
826 WEN et al

compare the distribution of age, race/ethnicity, and health insurance plan in2004 with that in 2003 or 2005, and didnot find significant differences in anyof these characteristics (data notshown). Interestingly, a similar “blip”in 2003–2004 also appeared in NHANESdata (Fig 2).
Comparison of CENTURY ResultsWith NHANES and PedNSS
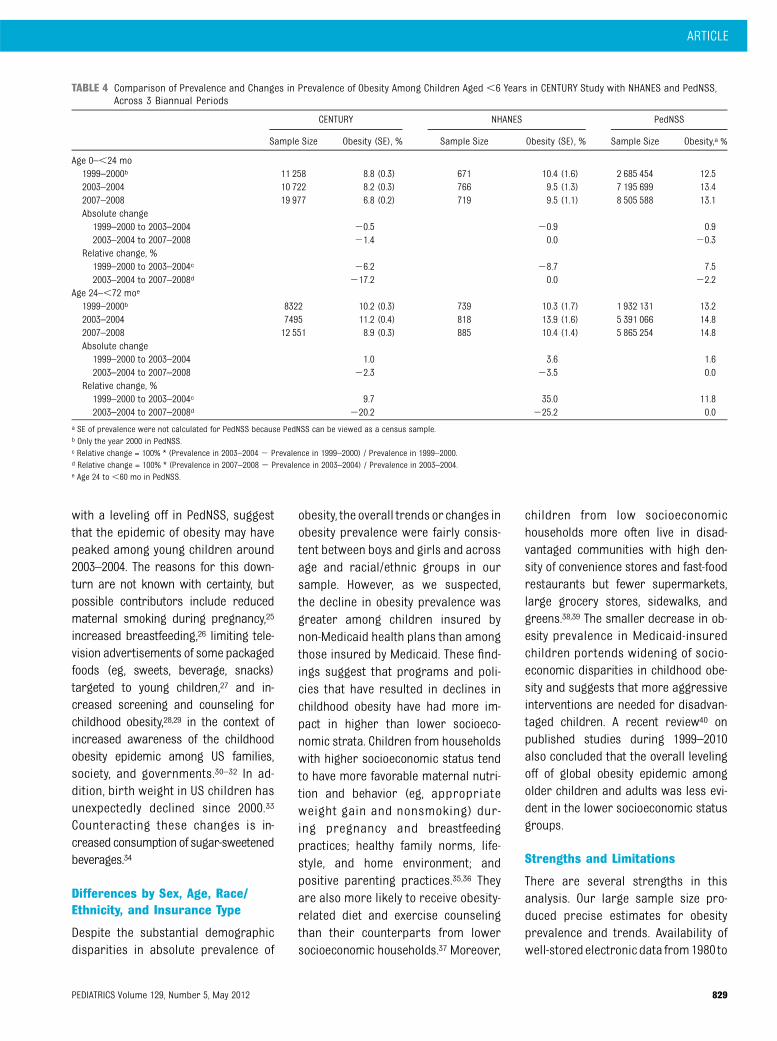
Table 4 shows the comparison of trendsin prevalences of obesity in CENTURY,NHANES, and PedNSS samples across3 cycles: 1999–2000, 2003–2004, and2007–2008; Fig 2 shows gender-stratified
data across more years. Among childrenaged 0 to ,24 months, the prevalenceof obesity decreased from 1999–2000 to2003–2004 in both CENTURY (relativechange, –6.2%) and NHANES (–8.7%)samples but increased in PedNSS (7.5%).From 2003–2004 to 2007–2008, the cor-responding prevalence leveled off inNHANES (0.0%) and PedNSS (–2.2%),whereas the prevalence continued todecrease in CENTURY (–17.2%). Amongchildren aged 24 to ,72 months, theprevalence of obesity increased during1999–2004 in all three samples: CENTURY(relative change, 9.7%), NHANES (35.0%),and PedNSS (11.8%). From 2003–2004
to 2007–2008, the corresponding preva-lence decreased in CENTURY (–20.2%)and NHANES (–25.2%), whereas lev-eled off in PedNSS (0.0%).
DISCUSSION
In a large sample of well-child visitsamong children aged ,6 years froma multisite group practice, we foundthat from 1999 to 2003, the overallprevalence of obesity was fairly sta-ble. From 2004 to 2008, however, therewas a substantial decrease in the prev-alence of obesity among both genders.The declines in obesity were apparentacross more age and race/ethnicitysubgroups of girls than of boys andsteeper among children insured by non-Medicaid health plans than among chil-dren insured by Medicaid.
Comparison With NHANES andPedNSS
Many methodological issues, such assampling strategies, response rate,age group, measure accuracy, shouldbe considered when comparing obe-sity prevalences and secular trendsfrom different data sources.24 Overall,our prevalence of obesity in 2007–2008 was somewhat lower than thosein NHANES3 and PedNSS7,16–18 duringthe same periods. This difference maybe explained partially by the facts thatCENTURY data contains a higher pro-portion of Asian American children aswell as a potentially higher socioeco-nomic status in contrast to NHANES,which is nationally representative;PedNSS is a predominantly low-incomesample; and all CENTURY Study childrenhave some form of health insurance. Inaddition, the obesity prevalence esti-mates in NHANES, and thus trend data,are relatively insensitive to detect mod-erate secular changes as the samplesizes of young children in NHANES aremuch smaller than in CENTURY Studyand PedNSS. Nevertheless, an increasingtrend in obesity prevalence among
TABLE 1 Characteristics of the Analytic Sample, CENTURY Study Data, by Biannual Years of Visit
1999–2000 2001–2002 2003–2004 2005–2006 2007–2008
Total number of visits 19 580 16 927 18 217 21 510 32 528Gender, %Boys 51.1 50.2 50.8 51.1 51.2Girls 48.9 49.8 49.2 48.9 48.8
Age group, %0–,6 mo 17.0 17.9 19.6 21.4 20.96–,12 mo 18.9 17.7 19.1 20.2 19.912–,24 mo 21.5 18.9 20.1 19.7 20.624–,36 mo 18.9 18.7 17.5 17.5 15.336–,72 mo 23.6 26.9 23.7 21.2 23.3
Race/ethnicity, %Non-Hispanic white 63.6 62.4 62.1 61.1 57.7Non-Hispanic African American 18.3 17.6 15.6 13.8 13.5Hispanic 5.9 6.2 6.3 6.3 6.8Asian 5.7 7.3 8.7 10.5 12.8Others 6.5 6.6 7.3 8.3 9.2
Health insurance, %Medicaid 0.3a 14.1 16.4 17.5 18.7Non-Medicaid 99.7 85.9 83.6 82.5 81.3
Pediatric practice site,b %Boston downtownSite 1 10.6 8.8 7.6 7.1 8.1Site 2 10.7 11.4 10.9 10.1 10.3Site 3 3.7 3.9 4.0 4.2 5.5
North of BostonSite 4 4.7 3.5 3.0 3.4 2.6Site 5 3.0 3.9 6.4 6.3 6.4Site 6 10.2 8.6 6.9 6.0 6.3Site 7 5.5 5.6 4.9 4.0 3.8
Northwest of BostonSite 8 3.2 3.5 6.3 11.2 10.0Site 9 10.7 12.1 12.8 12.1 12.4
West of BostonSite 10 6.3 5.1 4.8 5.1 5.2Site 11 6.6 5.5 4.6 4.1 5.4
South of BostonSite 12 6.1 8.0 8.7 9.0 9.3Site 13 18.6 20.1 19.0 17.6 14.6
a No children with Medicaid in 1999; the practice did not accept Medicaid insurance until late 2000.b The number of visits at each site / the total number at all sites.
ARTICLE
PEDIATRICS Volume 129, Number 5, May 2012 827

children aged 24 to ,72 months dur-ing 1999–2003 was apparent in all 3
samples, although the magnitude of
increase differed. Regarding the decline
in obesity prevalence during 2004–2008
in this age group, our sample wassomewhat similar to NHANES report, in
contrast to the stabilization observed
in PedNSS. We also observed that obe-
sity prevalence decreased substantially
among children aged 0 to,24 months,trends not observed in NHANES orPedNSS in 2003–2008.
The declines in obesity in our sampleand possibly in NHANES as well, along
TABLE 2 Obesity Prevalence and Adjusted ORs of Change in Obesity Risk Among Boys Aged ,6 Years During 1999–2008, CENTURY Study
1999–2003 2004–2008
Obesity Prevalence, % Adjusted OR (95% CI)b
per year incrementObesity Prevalence, % Adjusted OR (95% CI)b per
year increment1999 2003 Relative
Changea2004 2008 Relative
Changec
All sample 10.6 10.5 21.0 0.99 (0.96,1.02) 10.5 8.9 214.7 0.94 (0.92,0.97)d
Stratified by age group (mo)0–,6 5.6 4.8 215.7 0.97 (0.88,1.07) 5.3 4.0 224.1 0.94 (0.87,1.03)6–,12 11.6 8.8 224.0 0.93 (0.87,0.99)d 10.7 9.5 210.9 0.97 (0.91,1.03)12–,24 11.5 13.2 15.6 1.02 (0.96,1.08) 13.4 11.1 217.1 0.94 (0.90,1.00)24–,36 7.8 7.1 28.2 0.93 (0.85,1.01) 7.8 4.6 240.7 0.88 (0.82,0.96)d
36–,72 15.2 16.8 10.8 1.03 (0.98,1.09) 14.2 13.1 28.0 0.96 (0.91,1.00)Stratified by race/ethnicityNon-Hispanic white 9.7 9.6 21.2 0.98 (0.95,1.02) 9.8 8.5 213.6 0.95 (0.91,0.98)d
Non-Hispanic African American 13.2 13.8 4.5 1.02 (0.95,1.10) 12.2 11.7 23.9 0.97 (0.91,1.03)Hispanic 13.9 13.1 26.2 0.96 (0.86,1.07) 13.9 12.9 27.5 0.95 (0.87,1.04)Asian 6.8 5.5 219.1 0.97 (0.84,1.12) 7.1 5.0 230.3 0.91 (0.82,1.01)Others 12.9 15.1 16.6 1.04 (0.92,1.17) 13.3 10.2 223.2 0.91 (0.84,1.00)
Stratified by health insuranceMedicaid —e 13.6 — 0.97 (0.83,1.13) 12.3 11.5 26.2 0.97 (0.92,1.03)Non-Medicaid 10.6 9.9 26.8 1.00 (0.96,1.03) 10.1 8.3 217.3 0.93 (0.90,0.96)d
a Relative change = 100% * (Prevalence in 2003 2 Prevalence in 1999) / Prevalence in 1999.b Adjusted for age group, race / ethnicity, health insurance, and pediatric practice site in all sample; adjusted for other socio-demographics and pediatric practice site in stratified samples.c Relative change = 100% * (Prevalence in 2008 2 Prevalence in 2004) / Prevalence in 2004.d Significant adjusted OR.e No sample with Medicaid in 1999.
TABLE 3 Obesity Prevalence and Adjusted ORs of Change in Obesity Risk Among Girls Aged ,6 Years During 1999–2008, CENTURY Study
1999–2003 2004–2008
Obesity prevalence, % Adjusted OR (95% CI)b
per year incrementObesity prevalence, % Adjusted OR (95% CI)b
per year increment1999 2003 Relative
Changea2004 2008 Relative
Changec
All sample 8.2 7.7 27.0 0.97 (0.94,1.00) 9.0 6.4 228.5 0.93 (0.90,0.96)d
Stratified by age group (mo)0–,6 4.7 3.3 229.7 0.92 (0.83,1.03) 3.9 2.4 238.9 0.90 (0.80,1.01)6–,12 7.4 6.5 212.1 0.94 (0.86,1.02) 9.7 6.7 230.4 0.92 (0.85,0.98)d
12–,24 10.0 8.7 213.4 0.96 (0.89,1.02) 9.8 7.5 223.6 0.92 (0.86,0.98)d
24–,36 6.7 6.0 211.6 0.90 (0.82,0.99)d 5.6 4.1 226.3 0.92 (0.84,1.01)36–,72 11.0 12.3 11.7 1.02 (0.96,1.07) 14.7 10.0 231.9 0.92 (0.87,0.97)d
Stratified by race/ethnicityNon-Hispanic white 6.9 6.3 28.3 0.98 (0.93,1.02) 8.0 6.2 223.1 0.96 (0.92,1.00)Non-Hispanic African American 11.7 12.2 3.8 0.98 (0.91,1.05) 13.7 8.9 234.9 0.87 (0.81,0.93)d
Hispanic 13.7 13.5 21.8 0.98 (0.87,1.11) 12.9 11.8 28.6 0.99 (0.90,1.09)Asian 5.7 6.0 5.0 0.98 (0.83,1.15) 6.2 3.3 246.5 0.87 (0.75,1.00)Others 9.6 6.3 233.9 0.96 (0.85,1.08) 8.6 5.1 240.6 0.84 (0.75,0.93)d
Stratified by health insuranceMedicaid —e 10.8 — 0.85 (0.71,1.01) 12.7 10.0 221.3 0.96 (0.90,1.03)Non-Medicaid 8.2 7.1 214.2 0.98 (0.94,1.01) 8.3 5.6 232.3 0.91 (0.88,0.95)d
a Relative change = 100% * (Prevalence in 2003 2 Prevalence in 1999) / Prevalence in 1999.b Adjusted for age group, race/ethnicity, health insurance, and pediatric practice site in all sample; adjusted for other socio-demographics and pediatric practice site in stratified samples.c Relative change = 100% * (Prevalence in 2008 2 Prevalence in 2004) / Prevalence in 2004.d Significant adjusted OR.e No sample with Medicaid in 1999.
828 WEN et al
with a leveling off in PedNSS, suggestthat the epidemic of obesity may havepeaked among young children around2003–2004. The reasons for this down-turn are not known with certainty, butpossible contributors include reducedmaternal smoking during pregnancy,25
increased breastfeeding,26 limiting tele-vision advertisements of some packagedfoods (eg, sweets, beverage, snacks)targeted to young children,27 and in-creased screening and counseling forchildhood obesity,28,29 in the context ofincreased awareness of the childhoodobesity epidemic among US families,society, and governments.30–32 In ad-dition, birth weight in US children hasunexpectedly declined since 2000.33
Counteracting these changes is in-creased consumptionof sugar-sweetenedbeverages.34
Differences by Sex, Age, Race/Ethnicity, and Insurance Type
Despite the substantial demographicdisparities in absolute prevalence of
obesity, the overall trends or changes inobesity prevalence were fairly consis-tent between boys and girls and acrossage and racial/ethnic groups in oursample. However, as we suspected,the decline in obesity prevalence wasgreater among children insured bynon-Medicaid health plans than amongthose insured by Medicaid. These find-ings suggest that programs and poli-cies that have resulted in declines inchildhood obesity have had more im-pact in higher than lower socioeco-nomic strata. Children from householdswith higher socioeconomic status tendto have more favorable maternal nutri-tion and behavior (eg, appropriateweight gain and nonsmoking) dur-ing pregnancy and breastfeedingpractices; healthy family norms, life-style, and home environment; andpositive parenting practices.35,36 Theyare also more likely to receive obesity-related diet and exercise counselingthan their counterparts from lowersocioeconomic households.37 Moreover,
children from low socioeconomichouseholds more often live in disad-vantaged communities with high den-sity of convenience stores and fast-foodrestaurants but fewer supermarkets,large grocery stores, sidewalks, andgreens.38,39 The smaller decrease in ob-esity prevalence in Medicaid-insuredchildren portends widening of socio-economic disparities in childhood obe-sity and suggests that more aggressiveinterventions are needed for disadvan-taged children. A recent review40 onpublished studies during 1999–2010also concluded that the overall levelingoff of global obesity epidemic amongolder children and adults was less evi-dent in the lower socioeconomic statusgroups.
Strengths and Limitations
There are several strengths in thisanalysis. Our large sample size pro-duced precise estimates for obesityprevalence and trends. Availability ofwell-storedelectronicdata from1980 to
TABLE 4 Comparison of Prevalence and Changes in Prevalence of Obesity Among Children Aged ,6 Years in CENTURY Study with NHANES and PedNSS,Across 3 Biannual Periods
CENTURY NHANES PedNSS
Sample Size Obesity (SE), % Sample Size Obesity (SE), % Sample Size Obesity,a %
Age 0–,24 mo1999–2000b 11 258 8.8 (0.3) 671 10.4 (1.6) 2 685 454 12.52003–2004 10 722 8.2 (0.3) 766 9.5 (1.3) 7 195 699 13.42007–2008 19 977 6.8 (0.2) 719 9.5 (1.1) 8 505 588 13.1Absolute change1999–2000 to 2003–2004 20.5 20.9 0.92003–2004 to 2007–2008 21.4 0.0 20.3
Relative change, %1999–2000 to 2003–2004c 26.2 28.7 7.52003–2004 to 2007–2008d 217.2 0.0 22.2
Age 24–,72 moe
1999–2000b 8322 10.2 (0.3) 739 10.3 (1.7) 1 932 131 13.22003–2004 7495 11.2 (0.4) 818 13.9 (1.6) 5 391 066 14.82007–2008 12 551 8.9 (0.3) 885 10.4 (1.4) 5 865 254 14.8Absolute change1999–2000 to 2003–2004 1.0 3.6 1.62003–2004 to 2007–2008 22.3 23.5 0.0
Relative change, %1999–2000 to 2003–2004c 9.7 35.0 11.82003–2004 to 2007–2008d 220.2 225.2 0.0
a SE of prevalence were not calculated for PedNSS because PedNSS can be viewed as a census sample.b Only the year 2000 in PedNSS.c Relative change = 100% * (Prevalence in 2003–2004 2 Prevalence in 1999–2000) / Prevalence in 1999–2000.d Relative change = 100% * (Prevalence in 2007–2008 2 Prevalence in 2003–2004) / Prevalence in 2003–2004.e Age 24 to ,60 mo in PedNSS.
ARTICLE
PEDIATRICS Volume 129, Number 5, May 2012 829

2008 allowed us to examine trends inchildhoodobesityover thepast3decades(in this and previous analyses) whenthere have been shifts in obesity noted innationalstudies.Althoughwedidnothaveadditional informationonsocioeconomicstatus beyond health insurance type, ourstudy sample contained relatively largesubsamples of nonwhite race/ethnicityincluding Asians who are not specifi-cally analyzed in NHANES. In addition, weused GEEs to account for correlationbetweendifferent visits of the samechild,and we used multivariable logistic re-gression to account for changes in de-mographics and practice sites over time.
One limitation of this analysis is thequality of the clinical length/heightmeasures. Although we have used sta-tistical regression to partially correctthe systematic errors in measuringinfants’ length based on the paper-and-pencil protocol, these measurement
errors cannot be eliminated. This limi-tation might bias our estimated preva-lence of obesity for each year but is lesslikely to impact the trends across 1999–2008 because the clinical practicesconsistently used the paper-and-pencilmethod throughout the period. In ad-dition, in any pediatric practice, it ispossible that demographic distribu-tions change over time, given self-selection into practice. However, ourresults suggest that demographics ofanalyzed well-child visits were fairlystable during 1999–2008. It should benoted that all included HVMA pediat-ric offices were located in easternMassachusetts. Therefore, our mainfinding of decreasing obesity preva-lence after 2004 may be generalizableto young insured children living inthe northeastern United States, butcaution is appropriate for broadergeneralization.
CONCLUSIONS
In this analysis, we found a substantialdecline in obesity prevalence amongyoung children during 2004–2008.However, the smaller decrease inobesity prevalence in Medicaid-insuredchildren suggests that the coming yearsmay see a widening of socioeconomicdisparities in childhood obesity. Con-tinued routine surveillance by usingwell-child visit records will be 1 impor-tant method to gauge the success ofongoing policies and programs to de-crease obesity rates overall and amongyoung disadvantaged and minoritychildren, among whom the prevalenceof obesity remains especially high.
ACKNOWLEDGMENTSWethankDrCynthiaL.Ogdenforprovidingdetailed data on obesity prevalences forchildren aged ,2 years in the NationalHealth and Nutrition Examination Survey.
REFERENCES
1. Troiano RP, Flegal KM, Kuczmarski RJ,Campbell SM, Johnson CL. Overweightprevalence and trends for children andadolescents. The National Health and Nu-trition Examination Surveys, 1963 to 1991.Arch Pediatr Adolesc Med. 1995;149(10):1085–1091
2. Ogden CL, Flegal KM, Carroll MD, JohnsonCL. Prevalence and trends in overweightamong US children and adolescents, 1999-2000. JAMA. 2002;288(14):1728–1732
3. Ogden CL, Carroll MD, Curtin LR, Lamb MM,Flegal KM. Prevalence of high body massindex in US children and adolescents,2007–2008. JAMA. 2010;303(3):242–249
4. Ogden CL, Carroll MD, Flegal KM. High bodymass index for age among US children andadolescents, 2003–2006. JAMA. 2008;299(20):2401–2405
5. Singh GK, Kogan MD, van Dyck PC. Changesin state-specific childhood obesity andoverweight prevalence in the United Statesfrom 2003 to 2007. Arch Pediatr AdolescMed. 2010;164(7):598–607
6. Hu WT, Foley TA, Wilcox RA, Kozera RM,Morgenstern BZ, Juhn YJ. Childhood obe-sity among Head Start enrollees in south-eastern Minnesota: prevalence and riskfactors. Ethn Dis. 2007;17(1):23–28
7. Centers for Disease Control and Prevention(CDC). Obesity prevalence among low-income, preschool-aged children—UnitedStates, 1998–2008. MMWR Morb MortalWkly Rep. 2009;58(28):769–773
8. Epstein LH, Myers MD, Raynor HA, SaelensBE. Treatment of pediatric obesity. Pediat-rics. 1998;101(3 pt 2):554–570
9. Gillman MW, Rifas-Shiman SL, Kleinman K,Oken E, Rich-Edwards JW, Taveras EM. De-velopmental origins of childhood overweight:potential public health impact. Obesity (Sil-ver Spring). 2008;16(7):1651–1656
10. Golan M, Crow S. Targeting parents exclu-sively in the treatment of childhood obesity:long-term results. Obes Res. 2004;12(2):357–361
11. Davis K, Christoffel KK. Obesity in preschooland school-age children. Treatment early
and often may be best. Arch Pediatr Ado-lesc Med. 1994;148(12):1257–1261
12. Ogden CL, Carroll MD, Curtin LR, McDowellMA, Tabak CJ, Flegal KM. Prevalence ofoverweight and obesity in the UnitedStates, 1999–2004. JAMA. 2006;295(13):1549–1555
13. Ogden CL, Troiano RP, Briefel RR, KuczmarskiRJ, Flegal KM, Johnson CL. Prevalence ofoverweight among preschool children in theUnited States, 1971 through 1994. Pediatrics.1997;99(4). Available at: www.pediatrics.org/cgi/content/full/99/4/e1
14. Mei Z, Scanlon KS, Grummer-Strawn LM,Freedman DS, Yip R, Trowbridge FL. In-creasing prevalence of overweight amongUS low-income preschool children: theCenters for Disease Control and Preventionpediatric nutrition surveillance, 1983 to1995. Pediatrics. 1998;101(1). Available at:www.pediatrics.org/cgi/content/full/101/1/e12
15. Sherry B, Mei Z, Scanlon KS, Mokdad AH,Grummer-Strawn LM. Trends in state-specific
830 WEN et al

prevalence of overweight and underweightin 2- through 4-year-old children from low-income families from 1989 through 2000.Arch Pediatr Adolesc Med. 2004;158(12):1116–1124
16. Centers for Disease Control and Pre-vention. 2009 Pediatric Nutrition Surveil-lance System: National Summary of Trendsin Growth Indicators by Age. Available at:www.cdc.gov/pednss/pednss_tables/table-s_health_indicators.htm. Accessed Sep-tember 13, 2010
17. Polhamus B, Dalenius KBE, Mackintosh H,et al. Pediatric Nutrition Surveillance 2007Report. Atlanta, GA: U.S. Department ofHealth and Human Services, Centers forDisease Control and Prevention; 2009
18. Polhamus B, Dalenius KBE, Mackintosh H,et al. Pediatric Nutrition Surveillance 2008Report. Atlanta, GA: U.S. Department ofHealth and Human Services, Centers forDisease Control and Prevention; 2009
19. Kim J, Peterson KE, Scanlon KS, et al. Trendsin overweight from 1980 through 2001among preschool-aged children enrolled ina health maintenance organization. Obesity(Silver Spring). 2006;14(7):1107–1112
20. Rifas-Shiman SL, Rich-Edwards JW, ScanlonKS, Kleinman KP, Gillman MW. Misdiagnosis ofoverweight and underweight children youn-ger than 2 years of age due to length mea-surement bias. MedGenMed. 2005;7(4):56
21. Kuczmarski RJ, Ogden CL, Grummer-StrawnLM, et al. CDC growth charts: United States.Adv Data. 2000; (314):1–27
22. Krebs NF, Himes JH, Jacobson D, Nicklas TA,Guilday P, Styne D. Assessment of child andadolescent overweight and obesity. Pediat-rics. 2007;120(suppl 4):S193–S228
23. Centers for Disease Control/National Cen-ter for Health Statistics. Prevalence ofoverweight, infants and children less than2 years of age: United States, 2003–2004.Available at: www.cdc.gov/nchs/data/hestat/overweight/overweight_child_under02.htm.Accessed July 16, 2011
24. Yanovski SZ, Yanovski JA. Obesity prevalencein the United States—up, down, or side-ways? N Engl J Med. 2011;364(11):987–989
25. Tong VT, Jones JR, Dietz PM, D’Angelo D,Bombard JM; Centers for Disease Controland Prevention (CDC). Trends in smokingbefore, during, and after pregnancy—Pregnancy Risk Assessment MonitoringSystem (PRAMS), United States, 31 sites,2000–2005. MMWR Surveill Summ. 2009;58(4):1–29
26. Ryan AS, Wenjun Z, Acosta A. Breastfeedingcontinues to increase into the new millen-nium. Pediatrics. 2002;110(6):1103–1109
27. Powell LM, Szczypka G, Chaloupka FJ.Trends in exposure to television food ad-vertisements among children and adoles-cents in the United States. Arch PediatrAdolesc Med. 2010;164(9):794–802
28. Sesselberg TS, Klein JD, O’Connor KG,Johnson MS. Screening and counseling forchildhood obesity: results from a nationalsurvey. J Am Board Fam Med. 2010;23(3):334–342
29. van Gerwen M, Franc C, Rosman S, LeVaillant M, Pelletier-Fleury N. Primary carephysicians’ knowledge, attitudes, beliefsand practices regarding childhood obesity:a systematic review. Obes Rev. 2009;10(2):227–236
30. Levi J, Vinter S, Richardson L, Laurent RS,Segal LM. F as in fat: How obesity policiesare failing in America 2009. Washington,DC; Trust for America's Health and theRobert Wood Johnson Foundation, 2009.Available at: http://healthyamericans.org/reports/obesity2009/. Accessed December1, 2010
31. Khan LK, Sobush K, Keener D, et al; Centersfor Disease Control and Prevention. Recom-mended community strategies and measure-ments to prevent obesity in the UnitedStates. MMWR Recomm Rep. 2009;58(RR-7):1–26
32. Barnes M. Childhood Obesity Task Forceunveils action plan: Solving the problem of
childhood obesity within a generation.Washington, DC; Executive Office of thePresident of the United States, 2010. Avail-able at: www.letsmove.gov/white-house-task-force-childhood-obesity-report-president.Accessed December 10, 2010
33. Donahue SM, Kleinman KP, Gillman MW,Oken E. Trends in birth weight and gesta-tional length among singleton term birthsin the United States: 1990–2005. ObstetGynecol. 2010;115(2 pt 1):357–364
34. Wang YC, Bleich SN, Gortmaker SL. In-creasing caloric contribution from sugar-sweetened beverages and 100% fruit juicesamong US children and adolescents, 1988–2004. Pediatrics. 2008;121(6). Available at:www.pediatrics.org/cgi/content/full/121/6/e1604
35. Vereecken CA, Keukelier E, Maes L. In-fluence of mother’s educational level onfood parenting practices and food habits ofyoung children. Appetite. 2004;43(1):93–103
36. Hupkens CL, Knibbe RA, Van Otterloo AH,Drop MJ. Class differences in the food rulesmothers impose on their children: a cross-national study. Soc Sci Med. 1998;47(9):1331–1339
37. Branner CM, Koyama T, Jensen GL. Racialand ethnic differences in pediatric obesity-prevention counseling: national prevalenceof clinician practices. Obesity (Silver Spring).2008;16(3):690–694
38. Galvez MP, Hong L, Choi E, Liao L, Godbold J,Brenner B. Childhood obesity and neigh-borhood food-store availability in an inner-city community. Acad Pediatr. 2009;9(5):339–343
39. Bell JF, Wilson JS, Liu GC. Neighborhoodgreenness and 2-year changes in bodymass index of children and youth. Am JPrev Med. 2008;35(6):547–553
40. Rokholm B, Baker JL, Sørensen TI. Thelevelling off of the obesity epidemic sincethe year 1999—a review of evidence andperspectives. Obes Rev. 2010;11(12):835–846
(Continued from first page)
PEDIATRICS (ISSN Numbers: Print, 0031-4005; Online, 1098-4275).
Copyright © 2012 by the American Academy of Pediatrics
FINANCIAL DISCLOSURE: The authors have indicated they have no financial relationships relevant to this article to disclose.
FUNDING: This work was supported in part by the Centers for Disease Control and Prevention, the National Center for Chronic Disease Prevention and HealthPromotion (contract 200-2008-M-26882). This study was also supported by the National Center on Minority Health and Health Disparities (grant MD 003963). Fundedby the National institutes of Health (NIH).
ARTICLE
PEDIATRICS Volume 129, Number 5, May 2012 831