Cardiorespiratory Fitness in Pediatric Renal Transplant Recipients
17
Cardiorespiratory Fitness in Pediatric Renal Transplant Recipients C.B. Sethna a , A.E. Salerno c , M.G. McBride b , J. Shults d , S.M. Paridon b , N. Sharma a , K.E.C Meyers a , and M.B. Leonard a,d a Department of Pediatrics, Division of Nephrology, The Children’s Hospital of Philadelphia, Philadelphia, PA b Department of Pediatrics, Division of Cardiology, The Children’s Hospital of Philadelphia, Philadelphia, PA c Department of Pediatrics, Division of Nephrology, University of Massachusetts Medical School, Worcester, MA d Department of Biostatistics and Epidemiology, University of Pennsylvania School of Medicine, Philadelphia, PA Abstract Background—The impact of body size, fat-free mass (FFM) and fat mass (FM) on cardiorespiratory fitness in pediatric renal transplant recipients (TX) has not been established. Study objectives were to assess maximal oxygen consumption (VO 2max ) in TX and controls, adjusted for body composition, and to identify risk factors for reduced fitness in TX. Methods—Cycle ergometry and DXA were obtained in 50 TX and 70 controls, ages 8 to 21 yr. Control recruitment was targeted to include obese subjects with body mass index (BMI) Z-scores comparable to TX. Allometric regression models were utilized. Results—TX had significantly lower height Z-scores (p < 0.001) and comparable BMI Z-scores. VO 2max per body weight (ml/kg/min) and per FFM (ml/kgFFM/min) did not differ between groups. However, VO 2max was 13% lower (95% CI 18, 8; p < 0.001) in TX, compared with controls, adjusted for FM, FFM, sex and race. Greater FFM, lower FM, non-black race, and male sex were independently associated with greater VO 2max. Within TX, hemoglobin levels were positively associated with VO 2max (p = 0.04) and sirolimus use was associated with lower VO 2max (p < 0.01). Conclusions—TX had significant VO 2max deficits that were not captured by conventional measures (ml/kg/min). Greater FM was an independent risk factor for low VO 2max . Lower fitness in TX may be related to sirolimus effects on skeletal muscle. Corresponding Author: Mary B. Leonard MD, MSCE, The Children’s Hospital of Philadelphia, CHOP North, Room 1564, Philadelphia, PA 19104, [email protected], Telephone: 215-590-0874, Fax: 215-590-0604. Author Contributions C.B. Sethna participated in performance of the research, data analysis, and writing of the paper. A.E. Salerno participated in research design and writing of the paper. M.G. McBride participated in performance of the research and writing of the paper. J. Shults participated in data analysis. S.M. Paridon participated in research design. N. Sharma participated in performance of the research. K.E.C Meyers participated in data analysis and writing of the paper. M.B. Leonard participated in research design, data analysis, and writing of the paper. Conflict of Interest: None NIH Public Access Author Manuscript Transplantation. Author manuscript; available in PMC 2011 July 14. Published in final edited form as: Transplantation. 2009 August 15; 88(3): 395–401. doi:10.1097/TP.0b013e3181aed7d1. NIH-PA Author Manuscript NIH-PA Author Manuscript NIH-PA Author Manuscript
-
Upload
independent -
Category
Documents
-
view
1 -
download
0
Transcript of Cardiorespiratory Fitness in Pediatric Renal Transplant Recipients

Cardiorespiratory Fitness in Pediatric Renal TransplantRecipients
C.B. Sethnaa, A.E. Salernoc, M.G. McBrideb, J. Shultsd, S.M. Paridonb, N. Sharmaa, K.E.CMeyersa, and M.B. Leonarda,d
aDepartment of Pediatrics, Division of Nephrology, The Children’s Hospital of Philadelphia,Philadelphia, PAbDepartment of Pediatrics, Division of Cardiology, The Children’s Hospital of Philadelphia,Philadelphia, PAcDepartment of Pediatrics, Division of Nephrology, University of Massachusetts Medical School,Worcester, MAdDepartment of Biostatistics and Epidemiology, University of Pennsylvania School of Medicine,Philadelphia, PA
AbstractBackground—The impact of body size, fat-free mass (FFM) and fat mass (FM) oncardiorespiratory fitness in pediatric renal transplant recipients (TX) has not been established.Study objectives were to assess maximal oxygen consumption (VO2max) in TX and controls,adjusted for body composition, and to identify risk factors for reduced fitness in TX.
Methods—Cycle ergometry and DXA were obtained in 50 TX and 70 controls, ages 8 to 21 yr.Control recruitment was targeted to include obese subjects with body mass index (BMI) Z-scorescomparable to TX. Allometric regression models were utilized.
Results—TX had significantly lower height Z-scores (p < 0.001) and comparable BMI Z-scores.VO2max per body weight (ml/kg/min) and per FFM (ml/kgFFM/min) did not differ betweengroups. However, VO2max was 13% lower (95% CI 18, 8; p < 0.001) in TX, compared withcontrols, adjusted for FM, FFM, sex and race. Greater FFM, lower FM, non-black race, and malesex were independently associated with greater VO2max. Within TX, hemoglobin levels werepositively associated with VO2max (p = 0.04) and sirolimus use was associated with lower VO2max(p < 0.01).
Conclusions—TX had significant VO2max deficits that were not captured by conventionalmeasures (ml/kg/min). Greater FM was an independent risk factor for low VO2max. Lower fitnessin TX may be related to sirolimus effects on skeletal muscle.
Corresponding Author: Mary B. Leonard MD, MSCE, The Children’s Hospital of Philadelphia, CHOP North, Room 1564,Philadelphia, PA 19104, [email protected], Telephone: 215-590-0874, Fax: 215-590-0604.Author ContributionsC.B. Sethna participated in performance of the research, data analysis, and writing of the paper.A.E. Salerno participated in research design and writing of the paper.M.G. McBride participated in performance of the research and writing of the paper.J. Shults participated in data analysis.S.M. Paridon participated in research design.N. Sharma participated in performance of the research.K.E.C Meyers participated in data analysis and writing of the paper.M.B. Leonard participated in research design, data analysis, and writing of the paper.Conflict of Interest: None
NIH Public AccessAuthor ManuscriptTransplantation. Author manuscript; available in PMC 2011 July 14.
Published in final edited form as:Transplantation. 2009 August 15; 88(3): 395–401. doi:10.1097/TP.0b013e3181aed7d1.
NIH
-PA Author Manuscript
NIH
-PA Author Manuscript
NIH
-PA Author Manuscript

KeywordsPediatric kidney transplant; exercise; fitness
IntroductionYoung adults with a history of renal transplantation during childhood and adolescence havea greater than ten fold risk of cardiovascular death compared to the general population (1).Although research has focused on minimizing traditional cardiovascular risk factors such ashypertension and obesity, little attention has been paid to the role of physical inactivity andreduced cardiorespiratory fitness in this population. In healthy persons, it is welldocumented that improvements in aerobic fitness ameliorate many cardiovascular riskfactors and decrease overall cardiovascular mortality (2-5). Therefore, further study ofcardiorespiratory fitness in this high-risk population is of paramount importance.
Aerobic fitness is defined as the capacity to deliver oxygen to working skeletal muscles andthe ability of muscles to utilize oxygen through the process of aerobic metabolism (6). Thepoint at which the body reaches its limit for maximal utilization of oxygen is termedmaximal oxygen consumption (VO2max). VO2max is the best single measure of aerobiccapacity (6), and is measured in milliliters of oxygen consumed per minute (ml/min).
One of the greatest challenges in the interpretation of VO2max is normalizing the results fordifferences in body size and body composition (7-10). This is especially important inpediatric renal transplantation which is frequently complicated by poor growth and obesity(11). Traditionally, VO2max is divided by body mass (ml/kg/min) to facilitate comparisonsacross body sizes. The published normal reference data for VO2max in children are based onage or body size [body surface area (BSA) or weight](12-14). The use of such ratios toadjust VO2max for differences in body size assumes that VO2max and body size areisometrically related – that is, VO2max increases as a linear function of body size; thisassumption is not however correct (8). In contrast, allometric scaling techniques, employinglog-transformed regression models in children and adults, have consistently shown thatVO2max increases as a function of body weight to the 0.60 to 0.75 power (e.g. ml/kg0.60/min) (8). Therefore, the expression of traditional measures of VO2max (ml/kg/min) willresult in systematic underestimation of fitness in heavier individuals and overestimation inlighter subjects. Furthermore, scaling VO2max to fat-free mass (FFM) rather than total bodyweight provides better estimates of fitness since the metabolically active body cell mass ispertinent to the expression of oxygen consumption. A study in normal weight childrendemonstrated that log transformed regression models for VO2max relative to FFM eliminatedthe effect of body size (15).
The primary objective of this study was to assess aerobic fitness as measured by maximaloxygen consumption (VO2max) in renal transplant recipients relative to body size and bodycomposition, compared with healthy controls. An additional objective was to identify riskfactors for a lower level of aerobic fitness in renal transplant recipients.
MethodsStudy Subjects
Renal transplant recipients and healthy control subjects were enrolled in this cross-sectionalstudy from November 2005 through February 2008. Renal transplant recipients, ages 8-21years, who were greater than 6 months after transplantation with stable renal function forthree months were eligible. Children with cognitive impairment or orthopedic complications
Sethna et al. Page 2
Transplantation. Author manuscript; available in PMC 2011 July 14.
NIH
-PA Author Manuscript
NIH
-PA Author Manuscript
NIH
-PA Author Manuscript

that limited their ability to perform the exercise protocol, as well as those with significantcardiac or pulmonary co-morbidity (such as restrictive lung disease secondary to obstructiveuropathy) were excluded. Of a total of 160 transplant recipients, 110 were eligible toparticipate in the study. Of the eligible subjects, 50 subjects were enrolled and 11 transplantrecipients declined to participate in the study. Healthy control subjects were recruited fromgeneral pediatric practices in Philadelphia and the surrounding community. Recruitment ofhealthy controls targeted overweight and obese children in order to achieve comparabledistributions of body mass index (BMI, kg/m2) Z-scores in the transplant recipients andcontrols. Control subjects with chronic diseases or medications known to affect growth orbody composition were excluded. All subjects had to be greater than 130 cm in height(minimum height required to perform cycle ergometry) and weigh less than 135 kg to meetdual-energy x-ray absorptiometry (DXA) scanner requirements. This study protocol wasapproved by the Institutional Review Board of The Children’s Hospital of Philadelphia.Informed consent was obtained directly from study participants older than 18 years, andassent along with parental consent from participants less than 18 years of age.
Subject CharacteristicsMedical charts of the transplant recipients were reviewed for information regarding primaryrenal diagnosis, age at transplant, donor source, pre-transplant dialysis duration, intervalsince transplant, current medications and prior medications following transplantation.Laboratory data collected on the day of exercise testing included serum creatinine,phosphorus and hemoglobin levels. Glomerular filtration rate (eGFR) was estimated usingthe Schwartz formula (16).
Anthropometry and MaturationHeight was measured to the nearest 0.1 cm with a stadiometer (Holtain, Crymych, UK) andweight to the nearest 0.1 kg with a digital scale (Scaletronix, White Plains, NY). The stageof pubertal development was determined using a validated self-assessment questionnaire(17) and classified according to the method of Tanner (18). Study participants and theirparents were asked to categorize the participant’s race according to the National Institute ofHealth categories.
DXA ScansDXA scans of the whole body were performed using a Delphi/Discovery (Hologic, Bedford,MA) densitometer with a fan beam in the array mode. All scans were analyzed usingsoftware version 12.3. The scans were analyzed to generate estimates of whole body FFM(kg) and fat mass (FM, kg).
Exercise TestingSubjects were exercised to maximal volition using an electronically braked cycle ergometer(SensorMedics, Yorba Linda, CA). The protocol consisted of three minutes of pedaling in anunloaded state followed by a ramp increase in work rate (Watts) to maximal exercise. Thesteepness of the ramp protocol was determined by subject weight and designed to achievepredicted peak work rate in 10 to 12 minutes of cycling time (6). A 12-lead ECG (MarquetteCase-8000, Milwaukee, WI) was obtained at rest in the supine, sitting, and standingposition. Cardiac rhythm was monitored continuously throughout the study. Blood pressurewas measured at rest and every three minutes during exercise and recovery by auscultation.Systemic arterial oxygen saturation (SaO2) was monitored continuously during exercise bypulse oximetry.
Sethna et al. Page 3
Transplantation. Author manuscript; available in PMC 2011 July 14.
NIH
-PA Author Manuscript
NIH
-PA Author Manuscript
NIH
-PA Author Manuscript
Metabolic data were obtained throughout the exercise study and for the first two minutes ofrecovery on a breath-by-breath basis using a metabolic cart (SensorMedics V29, YorbaLinda, CA). The primary outcome variable measured was VO2max. The respiratoryexchange ratio (RER), defined as CO2 produced divided by O2 consumed, was calculated atpeak exercise to assess effort. RER values greater than 1.10 were considered adequate formaximal effort (19).
Statistical AnalysisDescriptive analyses included means, standard deviation (SD), median and interquartileranges of continuous variables and distributions of categorical variables. Differences inmeans were assessed using Student’s t-test, or the Wilcoxon Rank Sum test if the data werenot normally distributed. Differences in proportions were assessed using the chi-square test.A p-value of < 0.05 was considered statistically significant, and two-sided tests ofhypotheses were used throughout. The SPSS 15.0 (SPSS Inc., Chicago, IL) statisticalpackage was used in the analysis.
Age- and sex-specific Z-scores (standard deviation scores) for height, weight and BMI werecalculated using National Center for Health Statistics 2000 Center for Disease Controlgrowth data (20). Obesity was defined as a BMI greater than the 95th percentile for age andsex (21). Blood pressure index was calculated by dividing the blood pressure of the subjectby the age, sex and height specific 95th percentiles for systolic and diastolic blood pressures(22,23).
Correlations between VO2max and anthropometric measures were evaluated by Pearsoncorrelation analysis, or Spearman rank correlation for non-normally distributed data.Variables with P values < 0.1 on univariate analysis were tested in log-transformedmultivariate linear regression models to determine which measurement or combination ofmeasurements explained the greatest proportion of the variability in VO2max in healthycontrol subjects. All models were adjusted for sex, race (black versus all others) and forTanner stage of pubertal maturation (stage 1 through 3 as the referent group with anindicator variable for Tanner stages 4 and 5). Subsequently, a dummy variable was added tothe model in order to compare VO2max in transplant recipients to that of controls, adjustedfor the significant body composition and demographic factors. The independent effect oftransplantation in the models is presented as the adjusted ratio of the outcome in transplantrecipients divided by the outcome in controls. The adjusted ratios and 95% confidenceintervals (C.I.) were calculated as exponentiated estimates of the regression coefficients forthe transplant dummy variable. Tests for interactions between variables were performedusing multiplicative interaction terms.
A secondary aim of the study was to determine potential transplant risk factors for lowerlevel of fitness (VO2max). The risk factors were tested in the multivariable regression modelin transplant recipients only. These included diagnosis (congenital vs. others), pre-emptivetransplant, duration of end stage renal disease (ESRD), time since transplant, eGFR,hemoglobin, serum phosphorus, and medications.
ResultsSubject Characteristics
Fifty pediatric renal transplant recipients and 70 healthy control subjects were enrolled in thestudy (Table 1). The male predominance in the renal transplant group is consistent with thedemographics of ESRD in childhood (24). A greater proportion of the control subjects wereblack (p = 0.01), consistent with the demographics in the recruitment population. Ascompared with the controls, renal transplant recipients had significantly lower height Z-
Sethna et al. Page 4
Transplantation. Author manuscript; available in PMC 2011 July 14.
NIH
-PA Author Manuscript
NIH
-PA Author Manuscript
NIH
-PA Author Manuscript

scores (p < 0.001) and a smaller proportion were pubertal (p = 0.001). Consistent with theirshorter stature, body weight was significantly lower in the transplant recipients, comparedwith controls. However, BMI Z-scores and the proportion that were obese were comparablebetween groups. Transplant recipients had significantly lower whole body FFM compared tocontrols (p = 0.02). However, log transformed regression models demonstrated that wholebody FFM was not significantly lower in transplant recipients compared with controls (ratio0.99, 95% C.I. 0.93 to 1.05, p = 0.88), adjusted for height, race, pubertal stage and sex.Similarly, whole body fat mass was not significantly greater in the transplant recipientscompared with controls (ratio 1.15, 95% C.I. 0.90 to 1.49, p = 0.25), adjusted for height,race, pubertal stage and sex.
The medical histories of the renal transplant recipients are summarized in Table 2. eGFRranged from 24.7 to 183.2 ml/min/1.73 m2. Only 4 subjects had eGFR less than 50 ml/min/1.73 m2. Of the 50 transplant recipients, 10% had hemoglobin levels below the normal rangefor age and four were on treatment with erythropoietin at the time of the study. All were onprednisone; dosages ranged from 2.5 mg to 10 mg daily or every other day. Ten renaltransplant recipients had a history of treatment with growth hormone prior totransplantation; none were treated with growth hormone following transplantation. Thepercentages of concurrent medications are summarized in the Table.
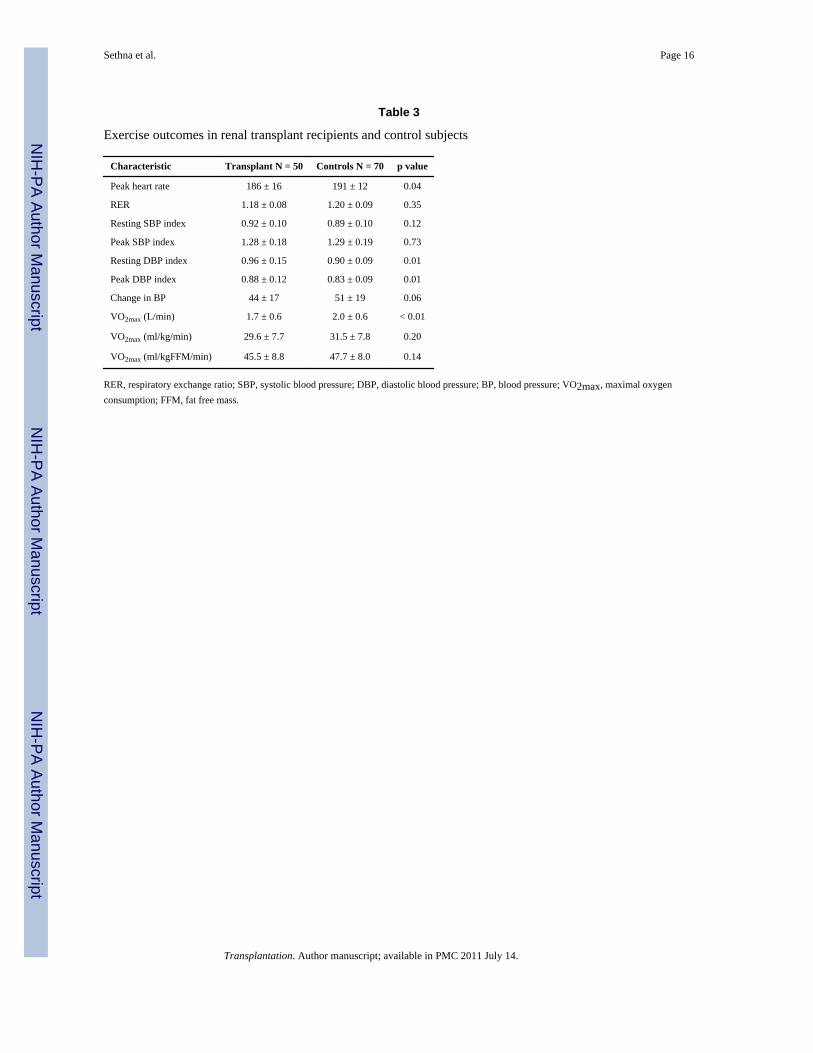
Exercise OutcomesThe results of the exercise testing are summarized in Table 3. Both groups achievedmaximal effort on exercise testing, average RER > 1.10. The control group reached a higherpeak heart rate than the transplant recipients, 96% and 93% of predicted, respectively.Transplant recipients had a higher diastolic blood pressure index compared to controlsduring rest (p = 0.01) and peak exercise (p = 0.01). Absolute VO2max (L/min) wassignificantly lower in the transplant group as compared to the control group (p < 0.01).However, no significant differences were detected between transplant recipients and controlswhen VO2max was divided by body weight (ml/kg/min) or fat free mass (ml/kgFFM/min).There was no significant difference in VO2max in transplant recipients based on chronickidney disease stage.
The relationships between VO2max and anthropometric measures were examined. Thesignificant univariate relationship between log VO2max (ml/min) and log body weight (β =0.72, 95% CI: 0.59 to 0.85; R = 0.71, p < 0.001) is illustrated in Figure 1; the slope issignificantly less than 1.0, illustrating the need for allometric scaling techniques. Thestronger correlation between log VO2max and log FFM (β = 0.87, 95% CI: 0.78 to 0.97; R =0.86, p < 0.001) is illustrated in Figure 2. Other potential confounders of VO2max with p <0.1 in univariate analyses were entered in a log transformed multivariate linear regressionmodel of VO2max within the control subjects only. In the final model (R2 = 0.87), FFM wasindependently associated with greater VO2max, while FM, female sex, and black race wereindependently associated with lower VO2max. Pubertal stage was not associated withVO2max.
Transplant recipients were subsequently added to the above model (Table 4). Ratios for eachcovariate were calculated as exponentiated estimates of the regression coefficients, adjustedfor other covariates in the model. VO2max, adjusted for FFM, FM, gender and race, wassignificantly lower in transplant recipients, compared with healthy controls. The adjustedratio for VO2max in the transplant recipients compared with that in the controls was 0.87(95% C.I. 0.83 to 0.92, p < 0.001), indicating that VO2max was, on average, 13% lower inthe transplant recipients. Although there were insufficient numbers of control subjects togenerate age and sex specific Z-scores (standard deviation scores) for the VO2 measures inthe renal transplant recipients, the effect size was estimated by comparing the standardized
Sethna et al. Page 5
Transplantation. Author manuscript; available in PMC 2011 July 14.
NIH
-PA Author Manuscript
NIH
-PA Author Manuscript
NIH
-PA Author Manuscript

residuals from the regression models in the renal transplant recipients and the controls. Thestandardized residuals differed by 0.72 (95% C.I. 0.38, 1.07; p < 0.0001) suggesting that theVO2 levels were 0.72 SD lower in transplant recipients, compared with controls, adjustedfor body composition, race and gender.
VO2max in black subjects (transplants and controls) was 12% lower compared with all othersubjects (ratio 0.88, 95% C.I. 0.84 to 0.93, p < 0.001). VO2max in female subjects(transplants and controls) was 10% lower compared with male subjects (ratio 0.90, 95% C.I.0.84 to 0.95, p = 0.001). The values for fat free mass and fat mass were log transformed.Therefore, VO2max increases as a function of fat free mass to the power of 0.923, andVO2max decreases as a function of fat mass to the power of 0.093. Tests for interactionbetween transplant status and race, gender or FFM were not significant. Specifically, theVO2max deficits in the transplant recipients compared with controls were of comparablemagnitude within the black and non-black subjects (ratios of 0.86 and 0.84, respectively).
Transplant Risk FactorsEach one-unit increase in hemoglobin was associated with a five percent greater VO2max inthe transplant recipients (ratio = 1.05, 95% C.I. 1.01 to 1.09, p = 0.04), adjusted for sex,race, FM and FFM. Sirolimus use was associated with a lower VO2max (ratio = 0.87, 95%C.I. 0.80 to 0.95, p < 0.01), adjusted for sex, race, FM, and FFM. The effect of sirolimuspersisted after adjustment for hemoglobin in the model. There was no difference inprednisone dose between those on sirolimus (0.0787 mg/kg/day) vs. those not on sirolimus(0.0626 mg/kg/day, p = 0.105). None of the other transplant covariates described in Table 2were significant, independent determinants of VO2max.
DiscussionUsing allometric scaling techniques, we found that cardiorespiratory fitness in children andadolescents with renal transplants was reduced by an average of 13% when compared tohealthy controls, after adjusting for race, sex, FM, and FFM. Assuming that VO2 is at the50th percentile in the controls (standard deviation score = 0) on average, these data wouldindicate that the transplant recipients are at the 24th percentile (standard deviation score =-0.72) on average. This reduction likely represents a clinically significant increase in thenumber of renal transplant recipients below the normal range relative to body composition,race and gender. This VO2max deficit in transplant recipients was not captured byconventional ratios, dividing VO2max by weight or FFM (Table 3). This was likely due tooverestimation of cardiorespiratory fitness in the transplant recipients using the ratio methodbecause they were smaller (lower weight and FFM) than the controls. As such, the use ofratios to express the nonlinear relationship between body weight and VO2max leads toseveral types of statistical error and misinterpretations. Log-linear regression (allometric)analyses in adults have demonstrated that scaled expressions of VO2max are moreappropriate. VO2max in adults increases as body mass raised to the 0.6 - 0.75 power (e.g. ml/kg0.75/min) (8). Our results illustrate similar relations in children and adolescents.
To our knowledge, this is the first study in pediatric transplant recipients to includemeasures of body composition in an allometric analysis of VO2max relative to body size incomparison to control subjects. Earlier studies comparing VO2max in pediatric renaltransplant recipients to controls (25, 26) or reference data (27-29) have yielded a broadrange of VO2max deficits in renal transplant recipients. Different approaches to calculateVO2max utilizing ratios were carried out in these reports. Our data demonstrated a slope of0.72 for log VO2 max relative to log body weight, consistent with adult studies (8).Therefore, we submit that our analysis of VO2max using allometric regression models
Sethna et al. Page 6
Transplantation. Author manuscript; available in PMC 2011 July 14.
NIH
-PA Author Manuscript
NIH
-PA Author Manuscript
NIH
-PA Author Manuscript

instead of conventional ratios more accurately adjusts VO2max for differences in body sizeand composition between transplant recipients and controls.
Furthermore, no prior studies of pediatric renal transplant recipients utilized measures ofFFM in their assessments of cardiorespiratory fitness. FFM has been found to be the bestsingle predictor of VO2max (10, 30, 31). Three previous studies obtained DXA scans intransplant recipients (27, 29, 32), however, body composition measures were not analyzedwith respect to VO2max. Weaver et al. included estimates of FFM that were derived frompredictor equations for FFM based on height and weight that may not be appropriate inchildren with ESRD (26). Our analyses that incorporate DXA measures of whole body FMand FFM in transplant recipients and controls confirmed the strong, positive associationbetween FFM and VO2max, and also demonstrated an additional, independent adverse effectof greater adiposity (FM). Given that transplant recipients have a high incidence of obesityfollowing transplant (33), their cardiorespiratory fitness may be compromised further byincreasing adiposity.
Our findings highlight the importance of adjusting for race in the renal transplantpopulation. No other pediatric transplant studies reported associations between race andVO2max. Our results confirm prior reports in healthy children of lower VO2 max in blackchildren versus white children (34-37). Factors such as physical activity level, bodycomposition and hematologic profile may account for the racial differences in VO2 max (34).However, our study demonstrated racial differences independent of body composition.Furthermore, the high proportion of black subjects in the control group may havecontributed to the lack of difference in VO2max between the transplant group and controlswhen using conventional ratios.
The recruitment of controls targeted overweight and obese children in order to achievesufficiently overlapping distributions of body weight, FM and FFM compared with thetransplant recipients. Given that conventional ratio measures of VO2max (ml/kg/min) resultin an underestimation of fitness in larger individuals (greater absolute body weight), thesemeasures may result in an underestimation of VO2max in obese transplant recipientscompared with non-obese controls. In contrast, if predominantly overweight and obesetransplant recipients weigh less than the non-obese controls due to shorter stature, the ratiomeasures may result in an overestimation of VO2max. Given that transplant recipients havelower height Z-scores and greater BMI Z-score than the general population, it is important touse a control population that allows for adjustment for these variable effects of body sizeand composition.
The mechanism of decreased fitness in the pediatric renal transplant population is likelymulti-factorial. Studies in adults have implicated skeletal muscle weakness due to residualeffects of renal failure on neuromuscular structure and function (38), prednisone effects onskeletal muscle structure and function (39-41), decreased oxygen transport capacity inanemia (42), ventricular dysfunction (43), and sedentary lifestyle (43). Evidencedocumenting the risk factors for low fitness in pediatric renal transplant recipients is sparse.Weaver et al. found that diastolic dysfunction was an independent predictor of lowerVO2max in a group of children with chronic kidney disease and renal transplant recipients. Inagreement with Krull et al., our study showed that hemoglobin was positively associatedwith VO2max although published results are conflicting (28, 29). Our results confirmprevious studies demonstrating no significant relationship between VO2max and duration ofdialysis or time since transplant (28, 29). We also found no relationship between VO2maxand underlying renal disease, pre-emptive transplant, treatment with blood pressuremedication, eGFR or serum phosphorus level.
Sethna et al. Page 7
Transplantation. Author manuscript; available in PMC 2011 July 14.
NIH
-PA Author Manuscript
NIH
-PA Author Manuscript
NIH
-PA Author Manuscript

A novel finding of this study is that sirolimus use was associated with lower fitness in renaltransplant recipients. Animal studies have shown that activation of the mammalian target ofrapamycin (mTOR) signaling pathway is vital in the regulation of skeletal muscle sizethrough an increase in protein synthesis (44). Sirolimus inhibits the ability of mTOR tophosphorylate its downstream targets, resulting in decreased cell growth and disregulation ofcell cycle proliferation and cell cycle progression. Treatment with sirolimus in two week oldrat pups resulted in a 40% reduction in hind leg muscle mass. Treatment at four weeks ofage resulted in a 20-25% reduction and, interestingly, sirolimus had no effect on musclemass of young adult rats (10-12 weeks) (44). Another murine study demonstrated thatmuscle hypertrophy in response to altered mechanical loading is blocked by sirolimus (45).These data suggest that sirolimus inhibits skeletal muscle growth and hypertrophy; however,in our study, we saw an association between sirolimus and VO2max even after adjustment forFFM. Currently, there are no published reports on the effects of sirolimus on muscle mass ormetabolism in humans or the relationship of sirolimus with VO2max.
The present study is limited by the cross-sectional design and heterogeneity of the transplantpopulation. The difficulty in measuring residual confounding factors such as the complexityof ESRD course, past medical histories and fluctuating values of covariates (e.g. recentrejection episode) is also a limitation. Additionally, transplant recipients who agreed toparticipate in the study may be more fit or more interested in physical activity than thosewho declined to participate. However, since lower fitness was found, such a bias would leadto an underestimation of the difference. Given the small control group, we could not fullyadjust for differences in maturation and body composition, but our study has moreconcurrent controls than any prior study. Our study also lacked a measure of physicalactivity in cases and controls, such as accelerometry, which has been shown to have apositive association with VO2max in healthy children (46). Despite the aforementionedlimitations, we believe that our conclusions remain valid. And, our study is strengthened bythe use of allometric scaling techniques, DXA measures of body composition and concurrentcontrols with specific attention to race and obesity.
CONCLUSIONOur findings illustrate the importance of the consideration of race and body size andcomposition in the assessment of cardiorespiratory fitness in pediatric transplant recipients.Our results also highlight the independent relation between greater adiposity and lowercardiorespiratory fitness. Future prospective longitudinal studies are needed that includeaccelerometric measures of physical activity, assessment of cardiovascular disease,including diastolic dysfunction, and measures of concurrent medication exposures.Decreased cardiorespiratory fitness is a cardiovascular risk factor and post-transplant careshould include Interventions to improve physical functioning of pediatric renal transplantrecipients.
AcknowledgmentsFunding Sources: This project was supported by Grants UL1-RR-024134 and R01-HD040714 and by NIH ClinicalResearch Training in Kidney Disease Grant T32-DK07785. The study was supported by the Clinical TranslationalResearch Center under the grant MO1-RR00240. The content is solely the responsibility of the authors and does notnecessarily represent the official views of the National Institutes of Health.
References1. Foley RN, Parfrey PS, Sarnak MJ. Epidemiology of cardiovascular disease in chronic renal disease.
J Am Soc Nephrol. 1998; 9(12 Suppl):S16–23. [PubMed: 11443763]
Sethna et al. Page 8
Transplantation. Author manuscript; available in PMC 2011 July 14.
NIH
-PA Author Manuscript
NIH
-PA Author Manuscript
NIH
-PA Author Manuscript

2. Blair SN, Kohl HW 3rd, Paffenbarger RS Jr, Clark DG, Cooper KH, Gibbons LW. Physical fitnessand all-cause mortality. A prospective study of healthy men and women. JAMA. 1989; 262(17):2395–2401. [PubMed: 2795824]
3. Carnethon MR, Gidding SS, Nehgme R, Sidney S, Jacobs DR Jr, Liu K. Cardiorespiratory fitness inyoung adulthood and the development of cardiovascular disease risk factors. JAMA. 2003; 290(23):3092–3100. [PubMed: 14679272]
4. Ekelund LG, Haskell WL, Johnson JL, Whaley FS, Criqui MH, Sheps DS. Physical fitness as apredictor of cardiovascular mortality in asymptomatic North American men. The Lipid ResearchClinics Mortality Follow-up Study. N Engl J Med. 1988; 319(21):1379–1384. [PubMed: 3185648]
5. Mora S, Redberg RF, Cui Y, Whiteman MK, Flaws JA, Sharrett AR, et al. Ability of exercisetesting to predict cardiovascular and all-cause death in asymptomatic women: a 20-year follow-upof the lipid research clinics prevalence study. JAMA. 2003; 290(12):1600–1607. [PubMed:14506119]
6. Rowland, TW. Pediatric laboratory exercise testing : clinical guidelines. Champaign, IL: HumanKinetics Publishers; 1992.
7. Beunen GP, Rogers DM, Woynarowska B, Malina RM. Longitudinal study of ontogenetic allometryof oxygen uptake in boys and girls grouped by maturity status. Ann Hum Biol. 1997; 24(1):33–43.[PubMed: 9022904]
8. Buresh R, Berg K. Scaling oxygen uptake to body size and several practical applications. J StrengthCond Res. 2002; 16(3):461–465. [PubMed: 12173964]
9. Rogers DM, Olson BL, Wilmore JH. Scaling for the VO2-to-body size relationship among childrenand adults. J Appl Physiol. 1995; 79(3):958–967. [PubMed: 8567540]
10. Toth MJ, Goran MI, Ades PA, Howard DB, Poehlman ET. Examination of data normalizationprocedures for expressing peak VO2 data. J Appl Physiol. 1993; 75(5):2288–2292. [PubMed:7695668]
11. Hanevold CD, Ho PL, Talley L, Mitsnefes MM. Obesity and renal transplant outcome: a report ofthe North American Pediatric Renal Transplant Cooperative Study. Pediatrics. 2005; 115(2):352–356. [PubMed: 15687444]
12. Cooper DM, Weiler-Ravell D, Whipp BJ, Wasserman K. Aerobic parameters of exercise as afunction of body size during growth in children. J Appl Physiol. 1984; 56(3):628–634. [PubMed:6706770]
13. Nagle FJ, Hagberg J, Kamei S. Maximal O2 uptake of boys and girls -- ages 14--17. Eur J ApplPhysiol Occup Physiol. 1977; 36(2):75–80. [PubMed: 837914]
14. Washington RL, van Gundy JC, Cohen C, Sondheimer HM, Wolfe RR. Normal aerobic andanaerobic exercise data for North American school-age children. J Pediatr. 1988; 112(2):223–233.[PubMed: 3339503]
15. Janz KF, Burns TL, Witt JD, Mahoney LT. Longitudinal analysis of scaling VO2 for differences inbody size during puberty: the Muscatine Study. Med Sci Sports Exerc. 1998; 30(9):1436–1444.[PubMed: 9741614]
16. Schwartz GJ, Feld LG, Langford DJ. A simple estimate of glomerular filtration rate in full-terminfants during the first year of life. J Pediatr. 1984; 104(6):849–854. [PubMed: 6726515]
17. Morris N, Udry J. Validation of a self-administered instrument to assess stage of adolescentdevelopment. Journal of Youth and Adolescence. 1980; 9(3):271–280.
18. Tanner, JM. Assessment of skeletal maturity and prediction of adult height (TW2 method).London ; New York: Academic Press; 1975.
19. Paridon SM, Alpert BS, Boas SR, Cabrera ME, Caldarera LL, Daniels SR, et al. Clinical stresstesting in the pediatric age group: a statement from the American Heart Association Council onCardiovascular Disease in the Young, Committee on Atherosclerosis, Hypertension, and Obesityin Youth. Circulation. 2006; 113(15):1905–1920. [PubMed: 16567564]
20. Ogden CL, Kuczmarski RJ, Flegal KM, Mei Z, Guo S, Wei R, et al. Centers for Disease Controland Prevention 2000 growth charts for the United States: improvements to the 1977 NationalCenter for Health Statistics version. Pediatrics. 2002; 109(1):45–60. [PubMed: 11773541]
21. Krebs NF, Jacobson MS. Prevention of pediatric overweight and obesity. Pediatrics. 2003; 112(2):424–430. [PubMed: 12897303]
Sethna et al. Page 9
Transplantation. Author manuscript; available in PMC 2011 July 14.
NIH
-PA Author Manuscript
NIH
-PA Author Manuscript
NIH
-PA Author Manuscript

22. The fourth report on the diagnosis, evaluation, and treatment of high blood pressure in children andadolescents. Pediatrics. 2004; 114(2 Suppl):555–576. 4th Report. [PubMed: 15286277]
23. Sorof JM, Cardwell G, Franco K, Portman RJ. Ambulatory blood pressure and left ventricularmass index in hypertensive children. Hypertension. 2002; 39:903–908. [PubMed: 11967247]
24. Smith JM, Stablein DM, Munoz R, Hebert D, McDonald RA. Contributions of the TransplantRegistry: The 2006 Annual Report of the North American Pediatric Renal Trials and CollaborativeStudies (NAPRTCS). Pediatr Transplant. 2007; 11(4):366–373. [PubMed: 17493215]
25. Bonzel KE, Wildi B, Weiss M, Scharer K. Spiroergometric performance of children andadolescents with chronic renal failure. Pediatr Nephrol. 1991; 5(1):22–28. [PubMed: 2025532]
26. Weaver DJ Jr, Kimball TR, Knilans T, Mays W, Knecht SK, Gerdes YM, et al. Decreasedmaximal aerobic capacity in pediatric chronic kidney disease. J Am Soc Nephrol. 2008; 19(3):624–630. [PubMed: 18184856]
27. Krasnoff JB, Mathias R, Rosenthal P, Painter PL. The comprehensive assessment of physicalfitness in children following kidney and liver transplantation. Transplantation. 2006; 82(2):211–217. [PubMed: 16858284]
28. Krull F, Schulze-Neick I, Hatopp A, Offner G, Brodehl J. Exercise capacity and blood pressureresponse in children and adolescents after renal transplantation. Acta Paediatr. 1994; 83(12):1296–1302. [PubMed: 7734874]
29. Painter P, Krasnoff J, Mathias R. Exercise capacity and physical fitness in pediatric dialysis andkidney transplant patients. Pediatr Nephrol. 2007; 22(7):1030–1039. [PubMed: 17372771]
30. Batterham AM, Vanderburgh PM, Mahar MT, Jackson AS. Modeling the influence of body size onV(O2) peak: effects of model choice and body composition. J Appl Physiol. 1999; 87(4):1317–1325. [PubMed: 10517758]
31. Vanderburgh PM, Katch FI. Ratio scaling of VO2max penalizes women with larger percent bodyfat, not lean body mass. Med Sci Sports Exerc. 1996; 28(9):1204–1208. [PubMed: 8883011]
32. Feber J, Dupuis JM, Chapuis F, Braillon P, Jocteur-Monrozier D, Daudet G, et al. Bodycomposition and physical performance in children after renal transplantation. Nephron. 1997;75(1):13–19. [PubMed: 9031264]
33. Mitsnefes MM, Khoury P, McEnery PT. Body mass index and allograft function in pediatric renaltransplantation. Pediatr Nephrol. 2002; 17(7):535–539. [PubMed: 12172770]
34. Andreacci JL, Robertson RJ, Dube JJ, Aaron DJ, Balasekaran G, Arslanian SA. Comparison ofmaximal oxygen consumption between black and white prepubertal and pubertal children. PediatrRes. 2004; 56(5):706–713. [PubMed: 15319460]
35. Gutin B, Islam S, Manos T, Cucuzzo N, Smith C, Stachura ME. Relation of percentage of body fatand maximal aerobic capacity to risk factors for atherosclerosis and diabetes in black and whiteseven- to eleven-year-old children. J Pediatr. 1994; 125(6 Pt 1):847–852. [PubMed: 7996354]
36. Pivarnik JM, Fulton JE, Taylor WC, Snider SA. Aerobic capacity in black adolescent girls. Res QExerc Sport. 1993; 64(2):202–207. [PubMed: 8341843]
37. Trowbridge CA, Gower BA, Nagy TR, Hunter GR, Treuth MS, Goran MI. Maximal aerobiccapacity in African-American and Caucasian prepubertal children. Am J Physiol. 1997; 273(4 Pt1):E809–814. [PubMed: 9357812]
38. Diesel W, Emms M, Knight BK, Noakes TD, Swanepoel CR, van Zyl Smit R, et al. Morphologicfeatures of the myopathy associated with chronic renal failure. Am J Kidney Dis. 1993; 22(5):677–684. [PubMed: 8238013]
39. Horber FF, Hoppeler H, Herren D, Claassen H, Howald H, Gerber C, et al. Altered skeletal muscleultrastructure in renal transplant patients on prednisone. Kidney Int. 1986; 30(3):411–416.[PubMed: 3537448]
40. Horber FF, Scheidegger JR, Grunig BE, Frey FJ. Thigh muscle mass and function in patientstreated with glucocorticoids. Eur J Clin Invest. 1985; 15(6):302–307. [PubMed: 3938399]
41. Topp KS, Painter PL, Walcott S, Krasnoff JB, Adey D, Sakkas GK, et al. Alterations in skeletalmuscle structure are minimized with steroid withdrawal after renal transplantation.Transplantation. 2003; 76(4):667–673. [PubMed: 12973106]
Sethna et al. Page 10
Transplantation. Author manuscript; available in PMC 2011 July 14.
NIH
-PA Author Manuscript
NIH
-PA Author Manuscript
NIH
-PA Author Manuscript

42. Painter P, Messer-Rehak D, Hanson P, Zimmerman SW, Glass NR. Exercise capacity inhemodialysis, CAPD, and renal transplant patients. Nephron. 1986; 42(1):47–51. [PubMed:3510400]
43. Painter P. Exercise after renal transplantation. Adv Ren Replace Ther. 1999; 6(2):159–164.[PubMed: 10230883]
44. Bodine SC. mTOR signaling and the molecular adaptation to resistance exercise. Med Sci SportsExerc. 2006; 38(11):1950–1957. [PubMed: 17095929]
45. Bodine SC, Stitt TN, Gonzalez M, Kline WO, Stover GL, Bauerlein R, et al. Akt/mTOR pathwayis a crucial regulator of skeletal muscle hypertrophy and can prevent muscle atrophy in vivo. NatCell Biol. 2001; 3(11):1014–1019. [PubMed: 11715023]
46. LeMura LM, Andreacci J, Carlonas R, Klebez JM, Chelland S. Evaluation of physical activitymeasured via accelerometry in rural fourth-grade children. Percept Mot Skills. 2000; 90(1):329–337. [PubMed: 10769919]
Sethna et al. Page 11
Transplantation. Author manuscript; available in PMC 2011 July 14.
NIH
-PA Author Manuscript
NIH
-PA Author Manuscript
NIH
-PA Author Manuscript

Figure 1. Association between log transformed maximal oxygen consumption (VO2max) and logtransformed body weight in renal transplant recipients and control subjectsR = 0.71, β = 0.72, p < 0.001
Sethna et al. Page 12
Transplantation. Author manuscript; available in PMC 2011 July 14.
NIH
-PA Author Manuscript
NIH
-PA Author Manuscript
NIH
-PA Author Manuscript
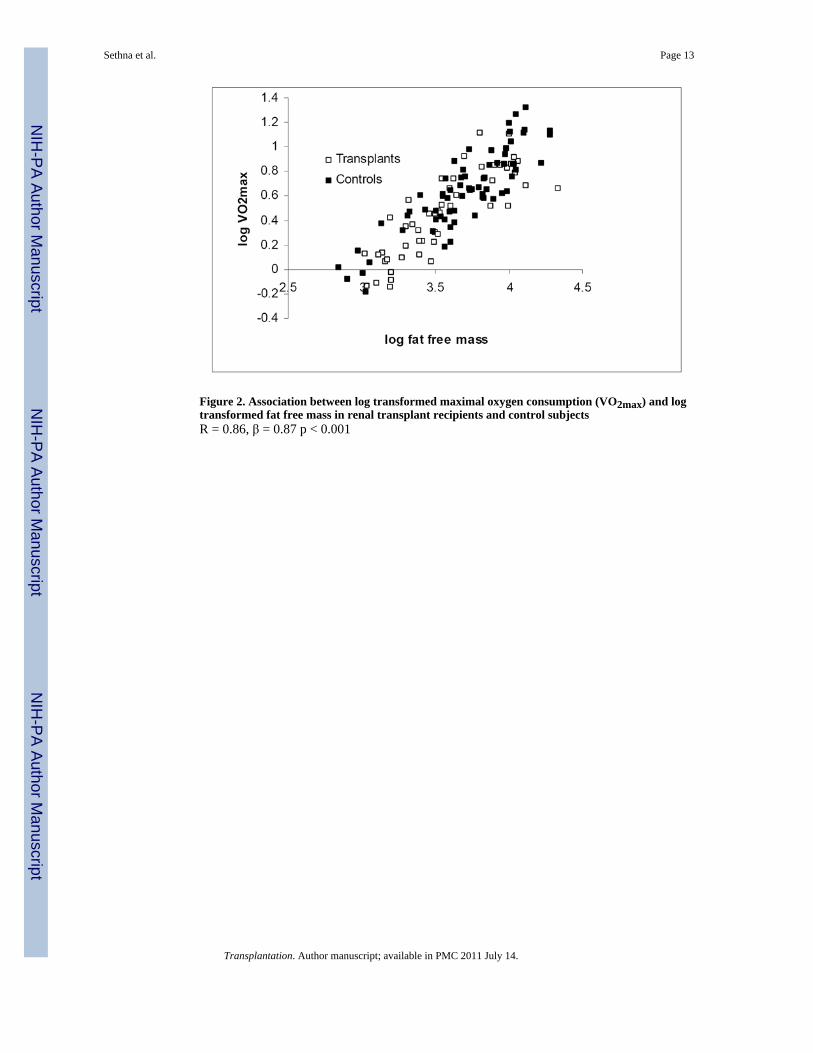
Figure 2. Association between log transformed maximal oxygen consumption (VO2max) and logtransformed fat free mass in renal transplant recipients and control subjectsR = 0.86, β = 0.87 p < 0.001
Sethna et al. Page 13
Transplantation. Author manuscript; available in PMC 2011 July 14.
NIH
-PA Author Manuscript
NIH
-PA Author Manuscript
NIH
-PA Author Manuscript

NIH
-PA Author Manuscript
NIH
-PA Author Manuscript
NIH
-PA Author Manuscript
Sethna et al. Page 14
Table 1
Characteristics of renal transplant recipients and healthy controls
Characteristic Transplant N = 50 Controls N = 70 p value
N (%) or Mean ± SD (Range)
Age (years) 14.5 ± 3.0 14.9 ± 3.7 0.61
Range (8.5 to 20) (8.1 to 21.9)
Male 35 (70%) 28 (40%) 0.001
Black race 15 (30%) 40 (57%) 0.01
Tanner stage 4-5 25 (50%) 55 (79%) 0.001
Body weight (kg) 58.0 ± 21.5 66.2 ± 20.4 0.049
Range (31.0 to 126.7) (25.4 to 126.7)
Weight Z-score 0.5 ± 1.7 1.1 ± 1.2 0.02
Height (cm) 153.2 ± 14.5 160.4 ± 13.0 <0.01
Range (126.2 to 182.3) (129.1 to 182.4)
Height Z-score -1.0 ± 1.2 0.2 ± 1.0 <0.001
BMI (kg/m2) 24.1 ± 6.0 25.4 ± 6.2 0.34
Range (14.7 to 43.2) (14.9 to 44.4)
BMI Z-score 0.9 ± 1.2 1.0 ± 1.1 0.54
Fat-Free Mass (kg) 37.0 ± 13.0 42.5 ± 12.8 0.02
Range (20.5 to 76.1) (17.2 to 72.4)
Fat mass (kg) 16.1 ± 10.2 17.8 ± 10.5 0.40
Range (3.6 to 57.5) (3.6 to 51.5)
Obese 17 (34%) 26 (37%) 0.72
BMI, body mass index
Transplantation. Author manuscript; available in PMC 2011 July 14.

NIH
-PA Author Manuscript
NIH
-PA Author Manuscript
NIH
-PA Author Manuscript
Sethna et al. Page 15
Table 2
Disease characteristics of renal transplant recipients
Characteristic N= 50
N (%) or Median and inter-quartile range (25%-75%)
Diagnosis:
FSGS 9 (18%)
Congenital renal disease 25 (50%)
Other glomerular disease 6 (12%)
Other 10 (20%)
Duration of ESRD (months) 39.2 (24.0-92.4)
Age at transplant (years) 11.1 (6.7-15.1)
Duration since transplant (months) 26.3 (16.2-72.5)
Living related donor 24 (48%)
History of dialysis 29 (58%)
Duration of dialysis (months) 9.8 (3.5-21.8)
eGFR (ml/min/1.73 m2) 87.2 (73.4-96.3)
eGFR ≥90 ml/min/1.73 m2 20 (40%)
eGFR 60 -89 ml/min/1.73 m2 18 (36%)
eGFR 30-59 ml/min/1.73 m2 3 (6%)
eGFR 15 -29 ml/min/1.73 m2 1 (2%)
Hemoglobin (g/dl) 12.6 (11.9-13.4)
Serum phosphorus (g/dl) 4.3 (3.8-4.8)
Current Medications
Antihypertensive 21 (42%)
Calcineurin inhibitor 43 (86%)
Sirolimus 18 (36%)
Mycophenolate mofetil 20 (40%)
Cyclosporine 2 (4%)
Azathioprine 7 (14)
Prednisone, mean daily dose 50 (100%), 0.069 mg/kg/day
FSGS, focal segmental glomerulosclerosis; ESRD, end stage renal disease; eGFR, estimated glomerular filtration rate
Transplantation. Author manuscript; available in PMC 2011 July 14.
NIH
-PA Author Manuscript
NIH
-PA Author Manuscript
NIH
-PA Author Manuscript
Sethna et al. Page 16
Table 3
Exercise outcomes in renal transplant recipients and control subjects
Characteristic Transplant N = 50 Controls N = 70 p value
Peak heart rate 186 ± 16 191 ± 12 0.04
RER 1.18 ± 0.08 1.20 ± 0.09 0.35
Resting SBP index 0.92 ± 0.10 0.89 ± 0.10 0.12
Peak SBP index 1.28 ± 0.18 1.29 ± 0.19 0.73
Resting DBP index 0.96 ± 0.15 0.90 ± 0.09 0.01
Peak DBP index 0.88 ± 0.12 0.83 ± 0.09 0.01
Change in BP 44 ± 17 51 ± 19 0.06
VO2max (L/min) 1.7 ± 0.6 2.0 ± 0.6 < 0.01
VO2max (ml/kg/min) 29.6 ± 7.7 31.5 ± 7.8 0.20
VO2max (ml/kgFFM/min) 45.5 ± 8.8 47.7 ± 8.0 0.14
RER, respiratory exchange ratio; SBP, systolic blood pressure; DBP, diastolic blood pressure; BP, blood pressure; VO2max, maximal oxygenconsumption; FFM, fat free mass.
Transplantation. Author manuscript; available in PMC 2011 July 14.

NIH
-PA Author Manuscript
NIH
-PA Author Manuscript
NIH
-PA Author Manuscript
Sethna et al. Page 17
Table 4
Multiple linear regression analysis of predictors of maximal oxygen consumption (log VO2max)
β 95% Confidence Interval p value
Renal transplant (vs. controls) -0.136 -0.192 to -0.079 p < 0.001
Black race (vs. non-black) -0.128 -0.179 to -0.077 p < 0.001
Female sex (vs. male sex) -0.109 -0.170 to -0.048 p = 0.001
Fat free mass 0.923 0.822 to 1.024 p < 0.001
Fat mass -0.093 -0.144 to -.042 p < 0.001
Constant -2.144
R2 = 0.84. Model is described by VO2max = exp [-2.144 + (-0.128 * Race) + (-0.109 * Sex) + (-0.136 * Renal Transplant)] * Fat Free Mass0.923
* Fat Mass-0.093.
VO2max, fat free mass and fat mass were log transformed.
Transplantation. Author manuscript; available in PMC 2011 July 14.