Assessment of limnological characteristics of a tropical reservoir
10
~ 285 ~ Journal of Entomology and Zoology Studies 2020; 8(6): 285-294 E-ISSN: 2320-7078 P-ISSN: 2349-6800 www.entomoljournal.com JEZS 2020; 8(6): 285-294 © 2020 JEZS Received: 29-08-2020 Accepted: 16-10-2020 D Venkatesh M.F.Sc., Department of Aquatic Environment Management College of Fishery Science, Muthukur, Nellore District, Andhra Pradesh, India K Madhavi Assistant Professor, Department of Aquatic Environment Management, College of Fishery Science, Muthukur, Nellore District, Andhra Pradesh, India C Prabhanjan Kumar Reddy Assistant Professor, Department of Aquatic Environment Management, College of Fishery Science, Muthukur, Nellore District, Andhra Pradesh, India K Dhanapal Professor, Department of Fish Processing Technology, College of Fishery Science, Muthukur, Nellore District, Andhra Pradesh, India N Jesintha Assistant Professor, Department of Fisheries Resource Management, College of Fishery Science, Muthukur, Nellore District, Andhra Pradesh, India K Thriveni Assistant Professor, Department of Fisheries Economics and Statistics College of Fishery Science, Muthukur, Nellore District, Andhra Pradesh, India Corresponding Author: K Madhavi Assistant Professor, Department of Aquatic Environment Management, College of Fishery Science, Muthukur, Nellore District, Andhra Pradesh, India Assessment of limnological characteristics of a tropical reservoir D Venkatesh, K Madhavi, C Prabhanjan Kumar Reddy, K Dhanapal, N Jesintha and K Thriveni Abstract Present study was carried out on Kanigiri reservoir, Nellore Dist., Andhra Pradesh for a period of eight months analyzing selected parameters at fortnightly intervals using standard methods. It is alkaliphilous (pH: 7.70 to 8.45), medium to high productive reservoir (TDS: 131.5 to 227.5 mg/L), experiencing moderate domestic pollution with chlorides (70-129 mg/L) and can promote the growth and survival of fish (D.O of 4.6 to 8.35 mg/L, CO2 of 0 to 6 mg/L &total ammonia of 0.02 to 0.21mg/L). Hence, it can be said that, water from this reservoir is fit for irrigation, agriculture, pisciculture, industrial, domestic purposes and with little treatment with respect to BOD and total hardness can even fit for drinking also. Keywords: Limno chemistry, Tropical reservoir, Kanigiri reservoir, Water quality Introduction The increasing industrialization, urbanization and developmental activities, to cope-up the population explosion have brought inevitable water crisis and the demand for fresh water has already exceeded its supply in different parts of the world. It has become a major problem all over the world, be it a developed, developing or underdeveloped country, though there exists a disparity in the water use pattern of these countries as it is strongly governed by the economic condition of the population. The uneven distribution of water resources on the Earth makes some regions water scarce while others water rich and this is these spatial and temporal variations in water quantity necessitated the storage of water to meet the water demands, and reservoirs are the resultant storage structures of surface waters. The construction of surface reservoirs can lead to major transformations in the spatio-temporal distribution of river runoff and an increase in water resources during the low flow limiting periods and dry seasons. The Ministry of Agriculture, Government of India has classified reservoirs as small (<1000 ha), medium (1,000 to 5,000 ha) and large (>5000 ha) for the purpose of fisheries management [1] . Indian reservoirs are recognized as sleeping giants for fisheries development, and it is clearly evident from the reports of Sugunan that, the present fish production from Indian reservoirs (from 31,53,366 ha) is frustratingly low, i.e., there is only a negligible increase in the actual production from 93,650 tons [2] to 93,700 tons [3] over a period of 16 years, compared to its potential production from 2,45,134 tons [2] to 9,86,000 tons [3] i.e., the difference between actual and potential production has increased by 5.89 fold from 1995 (1,51,484 tons) to 2011 (8,92,300 tons) there by signaling a tremendous scope for enhancing fish production through development and adoption of economically viable and environmentally sustainable management practices. Andhra Pradesh with a total reservoir area of 4, 58, 507 ha stands at second place only after Madhya Pradesh (4, 60, 384 ha) and is contributing to 14.54% of total surface area (31, 53, 366 ha) of Indian reservoirs [4] . Water quality has become a major concern due to ever increasing human developmental activities that over exploit and pollute the water resources. Though water is a renewable resource, reckless usage and improper management of water systems may cause serious problems in availability and quality of water and these water quality interests are closely related to water use pattern. There is an increasing interest in reservoir water quality, in view of multitude of benefits (water supply, flood control, hydropower generation, navigation, fish and wild life conservation, recreation etc.) they offer to the mankind, so, only the present study.
-
Upload
khangminh22 -
Category
Documents
-
view
0 -
download
0
Transcript of Assessment of limnological characteristics of a tropical reservoir

~ 285 ~
Journal of Entomology and Zoology Studies 2020; 8(6): 285-294 E-ISSN: 2320-7078 P-ISSN: 2349-6800 www.entomoljournal.com JEZS 2020; 8(6): 285-294 © 2020 JEZS Received: 29-08-2020 Accepted: 16-10-2020
D Venkatesh M.F.Sc., Department of Aquatic Environment Management College of Fishery Science, Muthukur, Nellore District, Andhra Pradesh, India K Madhavi Assistant Professor, Department of Aquatic Environment Management, College of Fishery Science, Muthukur, Nellore District, Andhra Pradesh, India C Prabhanjan Kumar Reddy Assistant Professor, Department of Aquatic Environment Management, College of Fishery Science, Muthukur, Nellore District, Andhra Pradesh, India K Dhanapal Professor, Department of Fish Processing Technology, College of Fishery Science, Muthukur, Nellore District, Andhra Pradesh, India N Jesintha Assistant Professor, Department of Fisheries Resource Management, College of Fishery Science, Muthukur, Nellore District, Andhra Pradesh, India K Thriveni Assistant Professor, Department of Fisheries Economics and Statistics College of Fishery Science, Muthukur, Nellore District, Andhra Pradesh, India Corresponding Author: K Madhavi Assistant Professor, Department of Aquatic Environment Management, College of Fishery Science, Muthukur, Nellore District, Andhra Pradesh, India
Assessment of limnological characteristics of a tropical reservoir
D Venkatesh, K Madhavi, C Prabhanjan Kumar Reddy, K Dhanapal, N Jesintha and K Thriveni
Abstract Present study was carried out on Kanigiri reservoir, Nellore Dist., Andhra Pradesh for a period of eight months analyzing selected parameters at fortnightly intervals using standard methods. It is alkaliphilous (pH: 7.70 to 8.45), medium to high productive reservoir (TDS: 131.5 to 227.5 mg/L), experiencing moderate domestic pollution with chlorides (70-129 mg/L) and can promote the growth and survival of fish (D.O of 4.6 to 8.35 mg/L, CO2 of 0 to 6 mg/L &total ammonia of 0.02 to 0.21mg/L). Hence, it can be said that, water from this reservoir is fit for irrigation, agriculture, pisciculture, industrial, domestic purposes and with little treatment with respect to BOD and total hardness can even fit for drinking also. Keywords: Limno chemistry, Tropical reservoir, Kanigiri reservoir, Water quality Introduction The increasing industrialization, urbanization and developmental activities, to cope-up the population explosion have brought inevitable water crisis and the demand for fresh water has already exceeded its supply in different parts of the world. It has become a major problem all over the world, be it a developed, developing or underdeveloped country, though there exists a disparity in the water use pattern of these countries as it is strongly governed by the economic condition of the population. The uneven distribution of water resources on the Earth makes some regions water scarce while others water rich and this is these spatial and temporal variations in water quantity necessitated the storage of water to meet the water demands, and reservoirs are the resultant storage structures of surface waters. The construction of surface reservoirs can lead to major transformations in the spatio-temporal distribution of river runoff and an increase in water resources during the low flow limiting periods and dry seasons. The Ministry of Agriculture, Government of India has classified reservoirs as small (<1000 ha), medium (1,000 to 5,000 ha) and large (>5000 ha) for the purpose of fisheries management [1]. Indian reservoirs are recognized as sleeping giants for fisheries development, and it is clearly evident from the reports of Sugunan that, the present fish production from Indian reservoirs (from 31,53,366 ha) is frustratingly low, i.e., there is only a negligible increase in the actual production from 93,650 tons [2] to 93,700 tons [3] over a period of 16 years, compared to its potential production from 2,45,134 tons [2] to 9,86,000 tons [3] i.e., the difference between actual and potential production has increased by 5.89 fold from 1995 (1,51,484 tons) to 2011 (8,92,300 tons) there by signaling a tremendous scope for enhancing fish production through development and adoption of economically viable and environmentally sustainable management practices. Andhra Pradesh with a total reservoir area of 4, 58, 507 ha stands at second place only after Madhya Pradesh (4, 60, 384 ha) and is contributing to 14.54% of total surface area (31, 53, 366 ha) of Indian reservoirs [4]. Water quality has become a major concern due to ever increasing human developmental activities that over exploit and pollute the water resources. Though water is a renewable resource, reckless usage and improper management of water systems may cause serious problems in availability and quality of water and these water quality interests are closely related to water use pattern. There is an increasing interest in reservoir water quality, in view of multitude of benefits (water supply, flood control, hydropower generation, navigation, fish and wild life conservation, recreation etc.) they offer to the mankind, so, only the present study.
Journal of Entomology and Zoology Studies http://www.entomoljournal.com
~ 286 ~
Study area & sampling details Location: Latitude & Longitude (14˚35̍ 21̎ N & 79˚51̍ 28 ̎E), Buchireddypalem. It is the main terminal storage reservoir on the left (northern) side of Sangam anicut having a Full Reservoir Level (FRL) of 6230 ha and total water spread area of 6144 ha. It gets its supplies from not only Sangam anicut but also from its own catchment area. Sampling (surface water) was carried out at fortnightly intervals from the two randomly selected sampling points (here after represented as K1 & K2) in the early hours of the day for a period of eight (08) months covering, south-west monsoon (June to September) north-east monsoon (October to December), winter period/post-monsoon (January to February) and hot weather period/pre-monsoon/summer (March to May) on the basis of the local rainfall conditions. Materials and methods The amount of rainfall received in the study area during the study period was obtained from the Agricultural Research Station (ARS), Nellore. Air and water temperatures were recorded using a standard mercury centigrade thermometer to the nearest 0.1˚ and expressed in degree Celsius. Transparency of water was estimated by using standard secchi disc of 20 cm diameter. pH of water samples was measured potentiometrically using digital pH meter (Digital pH Meter-111, EI). The samples fixed for dissolved oxygen were analyzed following modified Winkler-azide method. Free CO2 content was estimated by the titrimetric method using phenolphthalein indicator and sodium hydroxide. Chloride content was estimated by titrating the water sample with silver nitrate using potassium chromate as indicator and expressed in terms of mg/L. The salinity of water samples was analyzed by following Mohr’s method [5] and expressed as ppt. Total suspended solid content of water samples was analyzed by using Millipore filtration assemblage by employing standard method [6] expressed as mg/L. TDS, TS were estimated Gravimetrically [6] and the results were expressed in mg/L. Total alkalinity was estimated by titrating the water with sulphuric acid using phenolphthalein and methyl orange as indicators and the results are expressed in
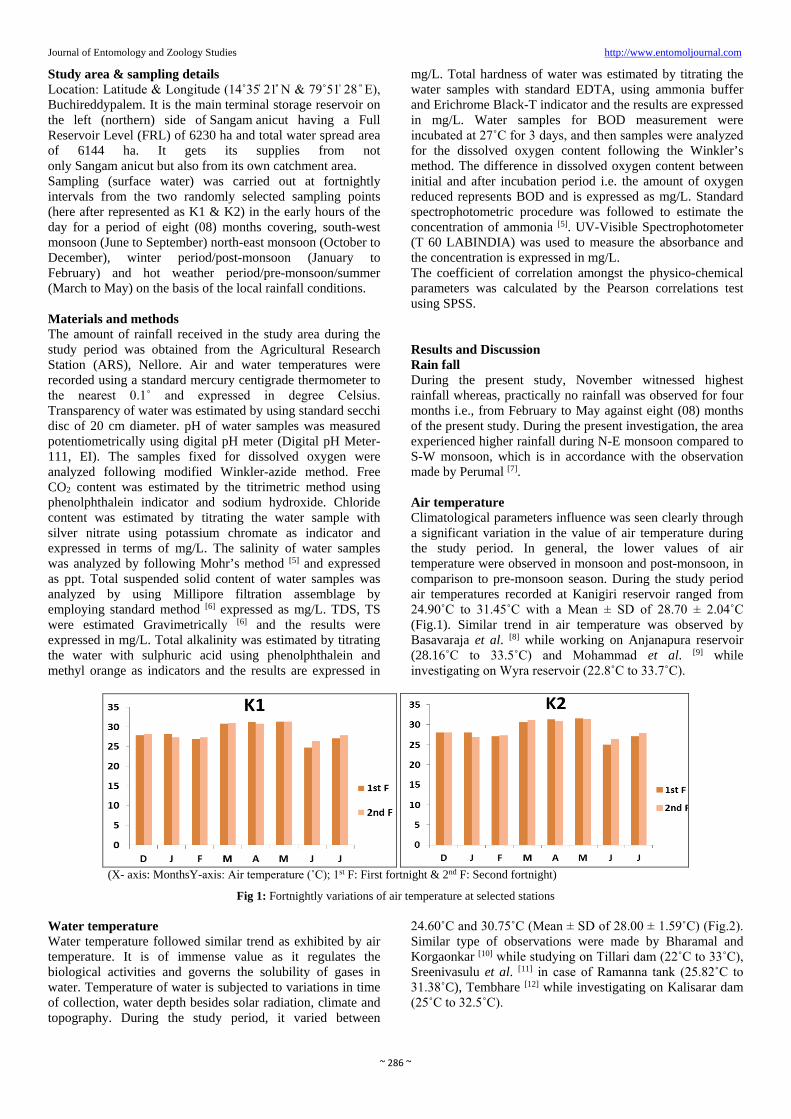
mg/L. Total hardness of water was estimated by titrating the water samples with standard EDTA, using ammonia buffer and Erichrome Black-T indicator and the results are expressed in mg/L. Water samples for BOD measurement were incubated at 27˚C for 3 days, and then samples were analyzed for the dissolved oxygen content following the Winkler’s method. The difference in dissolved oxygen content between initial and after incubation period i.e. the amount of oxygen reduced represents BOD and is expressed as mg/L. Standard spectrophotometric procedure was followed to estimate the concentration of ammonia [5]. UV-Visible Spectrophotometer (T 60 LABINDIA) was used to measure the absorbance and the concentration is expressed in mg/L. The coefficient of correlation amongst the physico-chemical parameters was calculated by the Pearson correlations test using SPSS. Results and Discussion Rain fall During the present study, November witnessed highest rainfall whereas, practically no rainfall was observed for four months i.e., from February to May against eight (08) months of the present study. During the present investigation, the area experienced higher rainfall during N-E monsoon compared to S-W monsoon, which is in accordance with the observation made by Perumal [7]. Air temperature Climatological parameters influence was seen clearly through a significant variation in the value of air temperature during the study period. In general, the lower values of air temperature were observed in monsoon and post-monsoon, in comparison to pre-monsoon season. During the study period air temperatures recorded at Kanigiri reservoir ranged from 24.90˚C to 31.45˚C with a Mean ± SD of 28.70 ± 2.04˚C (Fig.1). Similar trend in air temperature was observed by Basavaraja et al. [8] while working on Anjanapura reservoir (28.16˚C to 33.5˚C) and Mohammad et al. [9] while investigating on Wyra reservoir (22.8˚C to 33.7˚C).
(X- axis: MonthsY-axis: Air temperature (˚C); 1st F: First fortnight & 2nd F: Second fortnight)
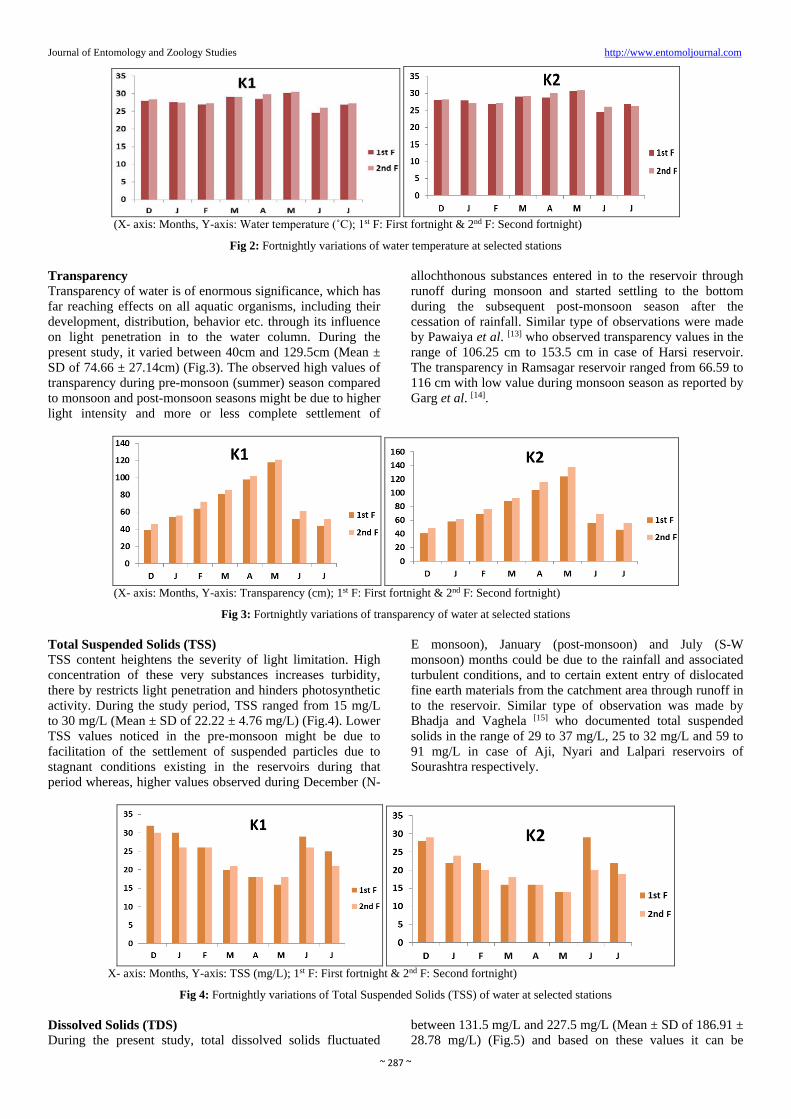
Fig 1: Fortnightly variations of air temperature at selected stations Water temperature Water temperature followed similar trend as exhibited by air temperature. It is of immense value as it regulates the biological activities and governs the solubility of gases in water. Temperature of water is subjected to variations in time of collection, water depth besides solar radiation, climate and topography. During the study period, it varied between
24.60˚C and 30.75˚C (Mean ± SD of 28.00 ± 1.59˚C) (Fig.2). Similar type of observations were made by Bharamal and Korgaonkar [10] while studying on Tillari dam (22˚C to 33˚C), Sreenivasulu et al. [11] in case of Ramanna tank (25.82˚C to 31.38˚C), Tembhare [12] while investigating on Kalisarar dam (25˚C to 32.5˚C).
Journal of Entomology and Zoology Studies http://www.entomoljournal.com
~ 287 ~
(X- axis: Months, Y-axis: Water temperature (˚C); 1st F: First fortnight & 2nd F: Second fortnight)
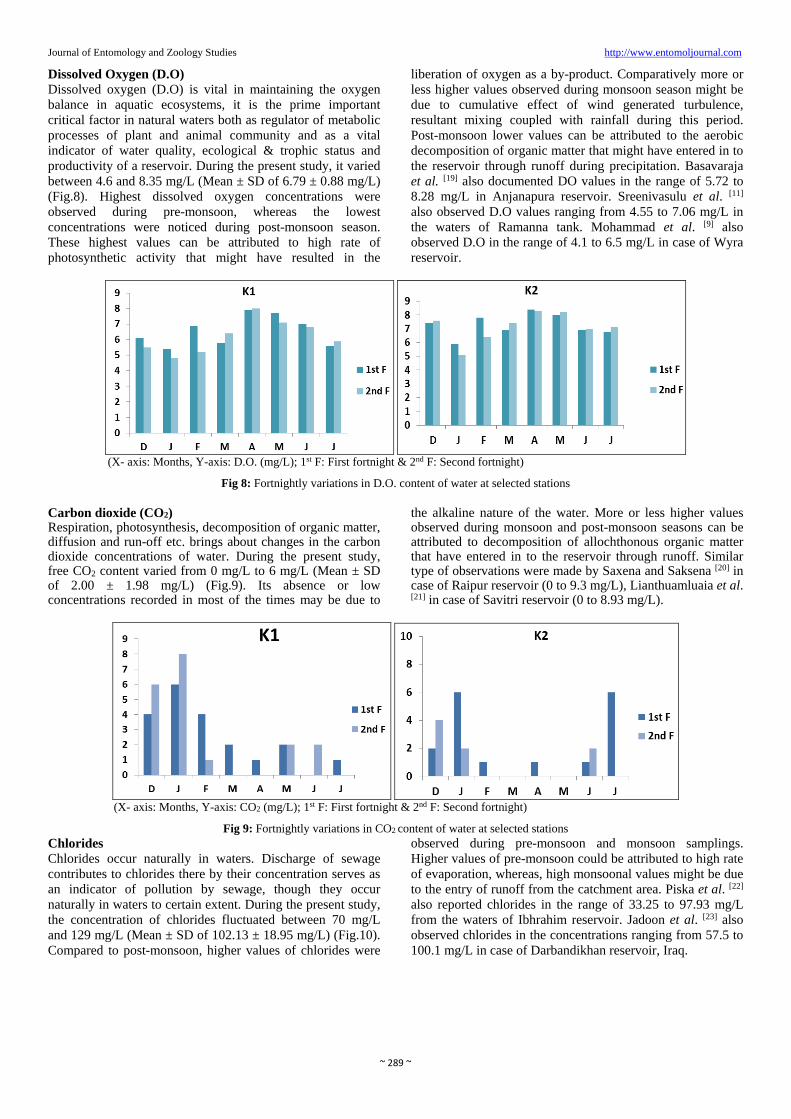
Fig 2: Fortnightly variations of water temperature at selected stations Transparency Transparency of water is of enormous significance, which has far reaching effects on all aquatic organisms, including their development, distribution, behavior etc. through its influence on light penetration in to the water column. During the present study, it varied between 40cm and 129.5cm (Mean ± SD of 74.66 ± 27.14cm) (Fig.3). The observed high values of transparency during pre-monsoon (summer) season compared to monsoon and post-monsoon seasons might be due to higher light intensity and more or less complete settlement of
allochthonous substances entered in to the reservoir through runoff during monsoon and started settling to the bottom during the subsequent post-monsoon season after the cessation of rainfall. Similar type of observations were made by Pawaiya et al. [13] who observed transparency values in the range of 106.25 cm to 153.5 cm in case of Harsi reservoir. The transparency in Ramsagar reservoir ranged from 66.59 to 116 cm with low value during monsoon season as reported by Garg et al. [14].
(X- axis: Months, Y-axis: Transparency (cm); 1st F: First fortnight & 2nd F: Second fortnight)
Fig 3: Fortnightly variations of transparency of water at selected stations Total Suspended Solids (TSS) TSS content heightens the severity of light limitation. High concentration of these very substances increases turbidity, there by restricts light penetration and hinders photosynthetic activity. During the study period, TSS ranged from 15 mg/L to 30 mg/L (Mean ± SD of 22.22 ± 4.76 mg/L) (Fig.4). Lower TSS values noticed in the pre-monsoon might be due to facilitation of the settlement of suspended particles due to stagnant conditions existing in the reservoirs during that period whereas, higher values observed during December (N-
E monsoon), January (post-monsoon) and July (S-W monsoon) months could be due to the rainfall and associated turbulent conditions, and to certain extent entry of dislocated fine earth materials from the catchment area through runoff in to the reservoir. Similar type of observation was made by Bhadja and Vaghela [15] who documented total suspended solids in the range of 29 to 37 mg/L, 25 to 32 mg/L and 59 to 91 mg/L in case of Aji, Nyari and Lalpari reservoirs of Sourashtra respectively.
X- axis: Months, Y-axis: TSS (mg/L); 1st F: First fortnight & 2nd F: Second fortnight)
Fig 4: Fortnightly variations of Total Suspended Solids (TSS) of water at selected stations Dissolved Solids (TDS) During the present study, total dissolved solids fluctuated
between 131.5 mg/L and 227.5 mg/L (Mean ± SD of 186.91 ± 28.78 mg/L) (Fig.5) and based on these values it can be

Journal of Entomology and Zoology Studies http://www.entomoljournal.com
~ 288 ~
considered as medium to high productive reservoir. The observations on TDS clearly indicate that, TDS values were high in summer (pre-monsoon) months followed by winter (post-monsoon) and monsoon months. The highest values observed during summer season might be due to intense solar radiation and associated high rate of evaporation in comparison to cooler periods during monsoon, which might
have diluted the water to certain extent. Similar type of observations were made by Hussain et al. [16] who observed total dissolved solids ranging from 149 to 211.2 mg/L in case of a flood plain reservoir on river Ravi. Pawaiya et al. [13] also noticed TDS in the range of 131.25 to 201 mg/L in case of Harsi reservoir.
(X- axis: Months, Y-axis: TDS (mg/L); 1st F: First fortnight & 2nd F: Second fortnight)
Fig 5: Fortnightly variations of Total Dissolved Solids (TDS) of water at selected stations Total Solids (TS) Total solids of a water sample represent both dissolved and suspended solids. During the present study TS content fluctuated between 151.5mg/L and 244.5 mg/L (Mean ± SD
of 209.13 ± 26.68 mg/L) (Fig.6). Total solids exhibited higher concentrations in pre-monsoon, compared to monsoon and post-monsoon seasons. This can be attributed to the higher concentrations of TDS during this season.
(X- axis: Months, Y-axis: TS (mg/L); 1st F: First fortnight & 2nd F: Second fortnight)
Fig 6: Fortnightly variations of Total Solids (TS) of water at selected stations pH pH of an aquatic system is an important indicator of water quality and the extent of pollution in the watershed area. During the present study it ranged between 7.70 and 8.45 (Mean ± SD of 8.11 ± 0.21) (Fig.7). Though water was alkaline throughout the study period, slightly higher values were noticed during pre-monsoon season compared to monsoon and post-monsoon seasons. Highest values observed during pre-monsoon (summer) might be due to increased photosynthetic activity. The decrease in pH during monsoon may be due to greater inflow of water, while during post-
monsoon (winter) could be due to decreased photosynthetic activity. Besides these, monsoonal and post-monsoonal lower values can be attributable to decomposition of organic matter, which on biological oxidation gives up ‘carbon dioxide’. Similar type of observations were made by Lubal et al. [17] observed pH in the range of 7.2 to 8.6 in case of Mhaswad reservoir. Mathavan and Nambirajan [18] documented pH values ranging from 6.9 to 8.9 in case of Grand anicut. Pawaiya et al. [13] observed a pH range of 8.18 to 9.09 in the waters of Harsi reservoir.
(X- axis: Months, Y-axis: pH; 1st F: First fortnight & 2nd F: Second fortnight)
Fig 7: Fortnightly variations in pH of water at selected stations
Journal of Entomology and Zoology Studies http://www.entomoljournal.com
~ 289 ~
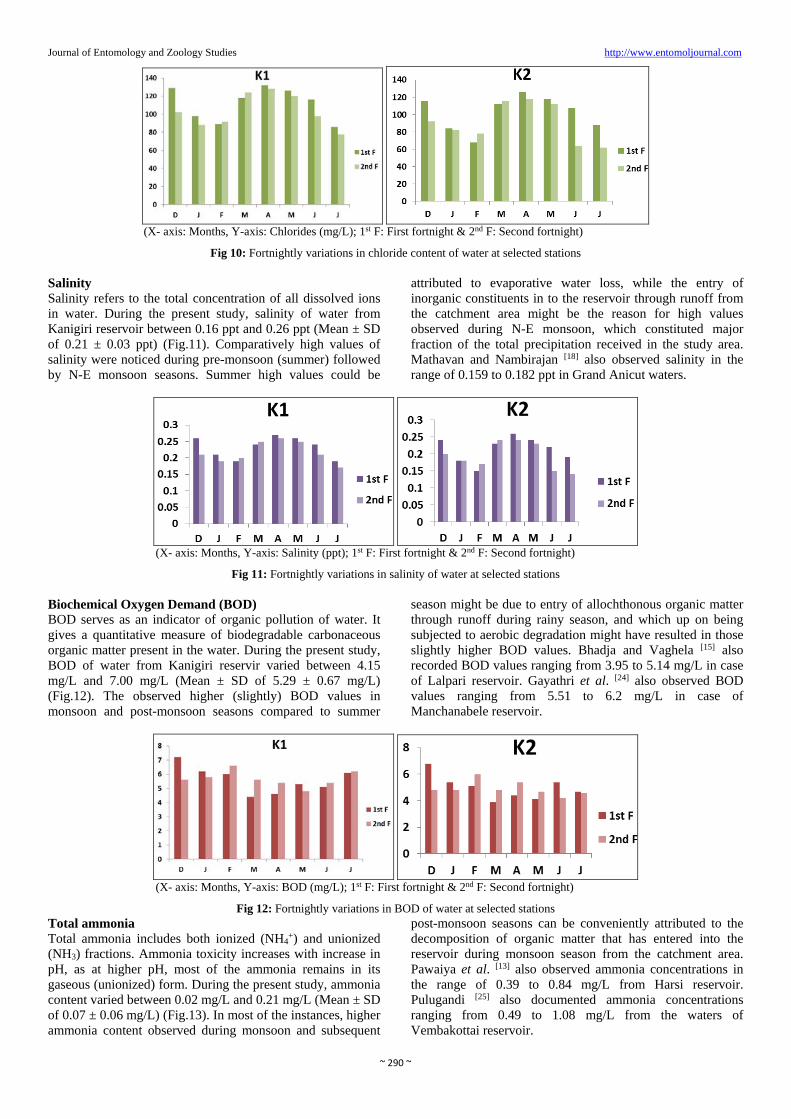
Dissolved Oxygen (D.O) Dissolved oxygen (D.O) is vital in maintaining the oxygen balance in aquatic ecosystems, it is the prime important critical factor in natural waters both as regulator of metabolic processes of plant and animal community and as a vital indicator of water quality, ecological & trophic status and productivity of a reservoir. During the present study, it varied between 4.6 and 8.35 mg/L (Mean ± SD of 6.79 ± 0.88 mg/L) (Fig.8). Highest dissolved oxygen concentrations were observed during pre-monsoon, whereas the lowest concentrations were noticed during post-monsoon season. These highest values can be attributed to high rate of photosynthetic activity that might have resulted in the
liberation of oxygen as a by-product. Comparatively more or less higher values observed during monsoon season might be due to cumulative effect of wind generated turbulence, resultant mixing coupled with rainfall during this period. Post-monsoon lower values can be attributed to the aerobic decomposition of organic matter that might have entered in to the reservoir through runoff during precipitation. Basavaraja et al. [19] also documented DO values in the range of 5.72 to 8.28 mg/L in Anjanapura reservoir. Sreenivasulu et al. [11] also observed D.O values ranging from 4.55 to 7.06 mg/L in the waters of Ramanna tank. Mohammad et al. [9] also observed D.O in the range of 4.1 to 6.5 mg/L in case of Wyra reservoir.
(X- axis: Months, Y-axis: D.O. (mg/L); 1st F: First fortnight & 2nd F: Second fortnight)
Fig 8: Fortnightly variations in D.O. content of water at selected stations Carbon dioxide (CO2) Respiration, photosynthesis, decomposition of organic matter, diffusion and run-off etc. brings about changes in the carbon dioxide concentrations of water. During the present study, free CO2 content varied from 0 mg/L to 6 mg/L (Mean ± SD of 2.00 ± 1.98 mg/L) (Fig.9). Its absence or low concentrations recorded in most of the times may be due to
the alkaline nature of the water. More or less higher values observed during monsoon and post-monsoon seasons can be attributed to decomposition of allochthonous organic matter that have entered in to the reservoir through runoff. Similar type of observations were made by Saxena and Saksena [20] in case of Raipur reservoir (0 to 9.3 mg/L), Lianthuamluaia et al. [21] in case of Savitri reservoir (0 to 8.93 mg/L).
(X- axis: Months, Y-axis: CO2 (mg/L); 1st F: First fortnight & 2nd F: Second fortnight)
Fig 9: Fortnightly variations in CO2 content of water at selected stations Chlorides Chlorides occur naturally in waters. Discharge of sewage contributes to chlorides there by their concentration serves as an indicator of pollution by sewage, though they occur naturally in waters to certain extent. During the present study, the concentration of chlorides fluctuated between 70 mg/L and 129 mg/L (Mean ± SD of 102.13 ± 18.95 mg/L) (Fig.10). Compared to post-monsoon, higher values of chlorides were
observed during pre-monsoon and monsoon samplings. Higher values of pre-monsoon could be attributed to high rate of evaporation, whereas, high monsoonal values might be due to the entry of runoff from the catchment area. Piska et al. [22] also reported chlorides in the range of 33.25 to 97.93 mg/L from the waters of Ibhrahim reservoir. Jadoon et al. [23] also observed chlorides in the concentrations ranging from 57.5 to 100.1 mg/L in case of Darbandikhan reservoir, Iraq.
Journal of Entomology and Zoology Studies http://www.entomoljournal.com
~ 290 ~
(X- axis: Months, Y-axis: Chlorides (mg/L); 1st F: First fortnight & 2nd F: Second fortnight)
Fig 10: Fortnightly variations in chloride content of water at selected stations Salinity Salinity refers to the total concentration of all dissolved ions in water. During the present study, salinity of water from Kanigiri reservoir between 0.16 ppt and 0.26 ppt (Mean ± SD of 0.21 ± 0.03 ppt) (Fig.11). Comparatively high values of salinity were noticed during pre-monsoon (summer) followed by N-E monsoon seasons. Summer high values could be
attributed to evaporative water loss, while the entry of inorganic constituents in to the reservoir through runoff from the catchment area might be the reason for high values observed during N-E monsoon, which constituted major fraction of the total precipitation received in the study area. Mathavan and Nambirajan [18] also observed salinity in the range of 0.159 to 0.182 ppt in Grand Anicut waters.
(X- axis: Months, Y-axis: Salinity (ppt); 1st F: First fortnight & 2nd F: Second fortnight)
Fig 11: Fortnightly variations in salinity of water at selected stations Biochemical Oxygen Demand (BOD) BOD serves as an indicator of organic pollution of water. It gives a quantitative measure of biodegradable carbonaceous organic matter present in the water. During the present study, BOD of water from Kanigiri reservir varied between 4.15 mg/L and 7.00 mg/L (Mean ± SD of 5.29 ± 0.67 mg/L) (Fig.12). The observed higher (slightly) BOD values in monsoon and post-monsoon seasons compared to summer
season might be due to entry of allochthonous organic matter through runoff during rainy season, and which up on being subjected to aerobic degradation might have resulted in those slightly higher BOD values. Bhadja and Vaghela [15] also recorded BOD values ranging from 3.95 to 5.14 mg/L in case of Lalpari reservoir. Gayathri et al. [24] also observed BOD values ranging from 5.51 to 6.2 mg/L in case of Manchanabele reservoir.
(X- axis: Months, Y-axis: BOD (mg/L); 1st F: First fortnight & 2nd F: Second fortnight)
Fig 12: Fortnightly variations in BOD of water at selected stationsTotal ammonia Total ammonia includes both ionized (NH4
+) and unionized (NH3) fractions. Ammonia toxicity increases with increase in pH, as at higher pH, most of the ammonia remains in its gaseous (unionized) form. During the present study, ammonia content varied between 0.02 mg/L and 0.21 mg/L (Mean ± SD of 0.07 ± 0.06 mg/L) (Fig.13). In most of the instances, higher ammonia content observed during monsoon and subsequent
post-monsoon seasons can be conveniently attributed to the decomposition of organic matter that has entered into the reservoir during monsoon season from the catchment area. Pawaiya et al. [13] also observed ammonia concentrations in the range of 0.39 to 0.84 mg/L from Harsi reservoir. Pulugandi [25] also documented ammonia concentrations ranging from 0.49 to 1.08 mg/L from the waters of Vembakottai reservoir.
Journal of Entomology and Zoology Studies http://www.entomoljournal.com
~ 291 ~
(X- axis: Months, Y-axis: Total ammonia (mg/L); 1st F: First fortnight & 2nd F: Second fortnight)
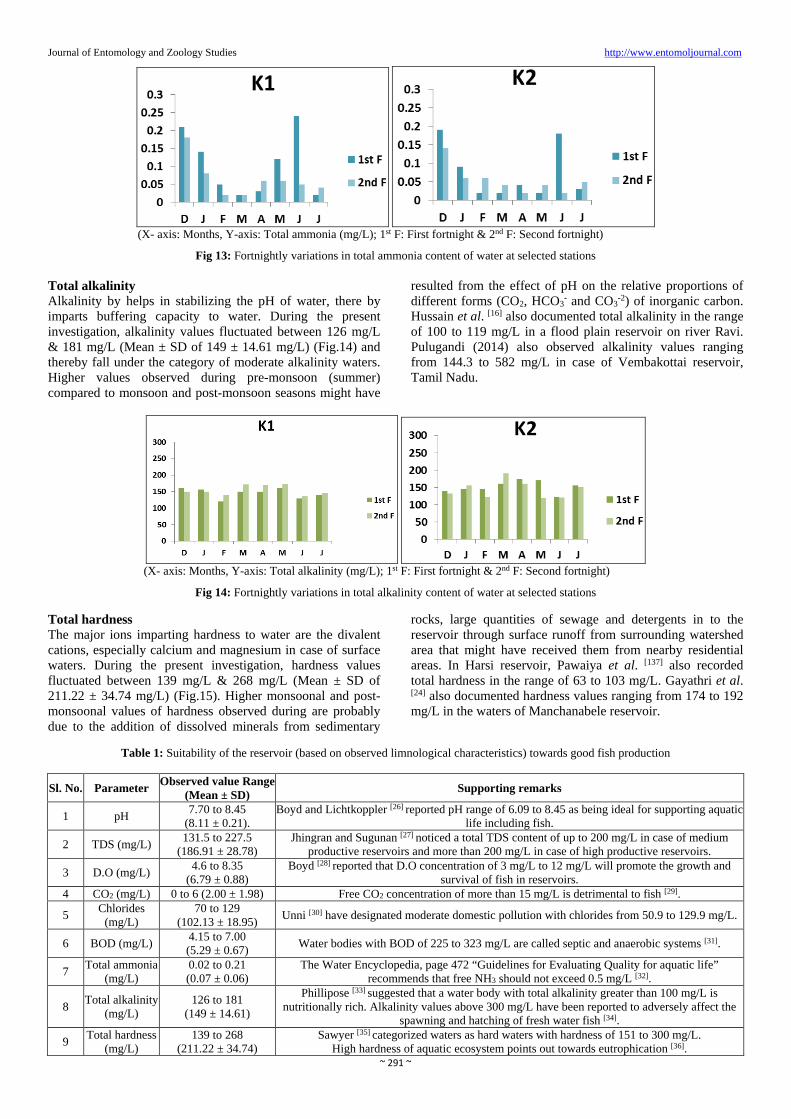
Fig 13: Fortnightly variations in total ammonia content of water at selected stations Total alkalinity Alkalinity by helps in stabilizing the pH of water, there by imparts buffering capacity to water. During the present investigation, alkalinity values fluctuated between 126 mg/L & 181 mg/L (Mean ± SD of 149 ± 14.61 mg/L) (Fig.14) and thereby fall under the category of moderate alkalinity waters. Higher values observed during pre-monsoon (summer) compared to monsoon and post-monsoon seasons might have
resulted from the effect of pH on the relative proportions of different forms (CO2, HCO3
- and CO3-2) of inorganic carbon.
Hussain et al. [16] also documented total alkalinity in the range of 100 to 119 mg/L in a flood plain reservoir on river Ravi. Pulugandi (2014) also observed alkalinity values ranging from 144.3 to 582 mg/L in case of Vembakottai reservoir, Tamil Nadu.
(X- axis: Months, Y-axis: Total alkalinity (mg/L); 1st F: First fortnight & 2nd F: Second fortnight)
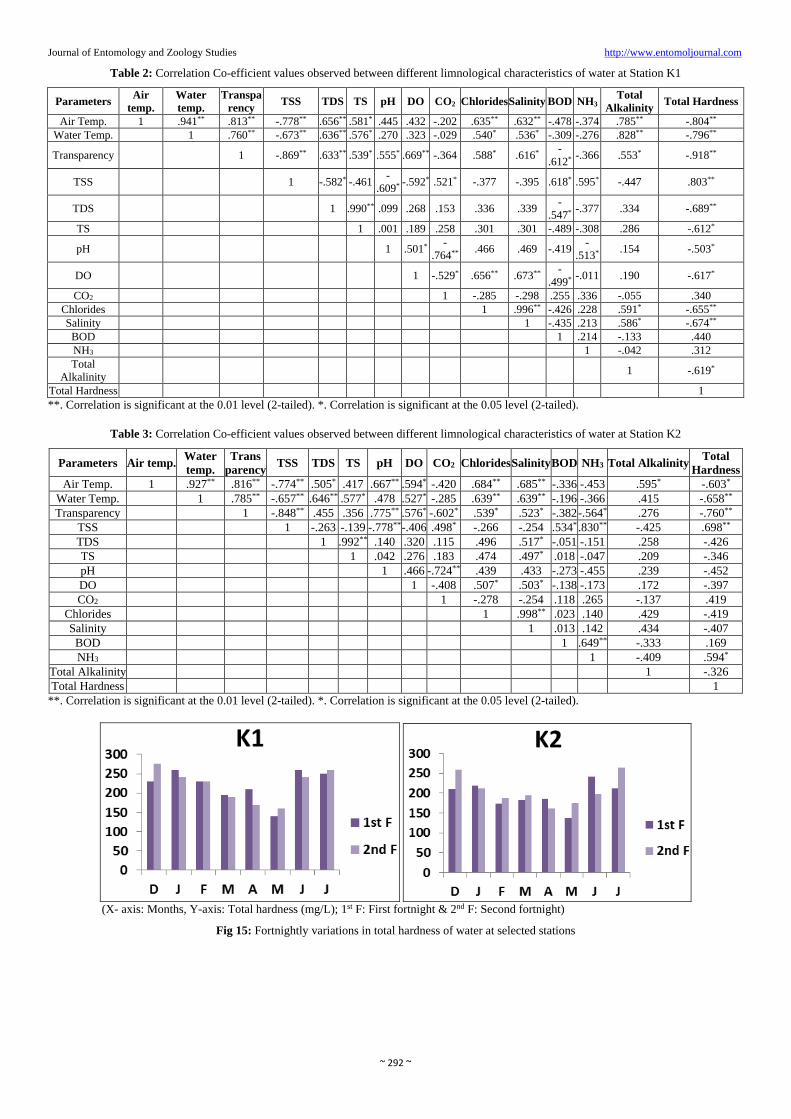
Fig 14: Fortnightly variations in total alkalinity content of water at selected stations Total hardness The major ions imparting hardness to water are the divalent cations, especially calcium and magnesium in case of surface waters. During the present investigation, hardness values fluctuated between 139 mg/L & 268 mg/L (Mean ± SD of 211.22 ± 34.74 mg/L) (Fig.15). Higher monsoonal and post-monsoonal values of hardness observed during are probably due to the addition of dissolved minerals from sedimentary
rocks, large quantities of sewage and detergents in to the reservoir through surface runoff from surrounding watershed area that might have received them from nearby residential areas. In Harsi reservoir, Pawaiya et al. [137] also recorded total hardness in the range of 63 to 103 mg/L. Gayathri et al. [24] also documented hardness values ranging from 174 to 192 mg/L in the waters of Manchanabele reservoir.
Table 1: Suitability of the reservoir (based on observed limnological characteristics) towards good fish production
Sl. No. Parameter Observed value Range (Mean ± SD) Supporting remarks
1 pH 7.70 to 8.45 (8.11 ± 0.21).
Boyd and Lichtkoppler [26] reported pH range of 6.09 to 8.45 as being ideal for supporting aquatic life including fish.
2 TDS (mg/L) 131.5 to 227.5 (186.91 ± 28.78)
Jhingran and Sugunan [27] noticed a total TDS content of up to 200 mg/L in case of medium productive reservoirs and more than 200 mg/L in case of high productive reservoirs.
3 D.O (mg/L) 4.6 to 8.35 (6.79 ± 0.88)
Boyd [28] reported that D.O concentration of 3 mg/L to 12 mg/L will promote the growth and survival of fish in reservoirs.
4 CO2 (mg/L) 0 to 6 (2.00 ± 1.98) Free CO2 concentration of more than 15 mg/L is detrimental to fish [29].
5 Chlorides (mg/L)
70 to 129 (102.13 ± 18.95) Unni [30] have designated moderate domestic pollution with chlorides from 50.9 to 129.9 mg/L.
6 BOD (mg/L) 4.15 to 7.00 (5.29 ± 0.67) Water bodies with BOD of 225 to 323 mg/L are called septic and anaerobic systems [31].
7 Total ammonia (mg/L)
0.02 to 0.21 (0.07 ± 0.06)
The Water Encyclopedia, page 472 “Guidelines for Evaluating Quality for aquatic life” recommends that free NH3 should not exceed 0.5 mg/L [32].
8 Total alkalinity (mg/L)
126 to 181 (149 ± 14.61)
Phillipose [33] suggested that a water body with total alkalinity greater than 100 mg/L is nutritionally rich. Alkalinity values above 300 mg/L have been reported to adversely affect the
spawning and hatching of fresh water fish [34].
9 Total hardness (mg/L)
139 to 268 (211.22 ± 34.74)
Sawyer [35] categorized waters as hard waters with hardness of 151 to 300 mg/L. High hardness of aquatic ecosystem points out towards eutrophication [36].
Journal of Entomology and Zoology Studies http://www.entomoljournal.com
~ 292 ~
Table 2: Correlation Co-efficient values observed between different limnological characteristics of water at Station K1
Parameters Air temp.
Water temp.
Transparency TSS TDS TS pH DO CO2 Chlorides Salinity BOD NH3
Total Alkalinity Total Hardness
Air Temp. 1 .941** .813** -.778** .656** .581* .445 .432 -.202 .635** .632** -.478 -.374 .785** -.804** Water Temp. 1 .760** -.673** .636** .576* .270 .323 -.029 .540* .536* -.309 -.276 .828** -.796**
Transparency 1 -.869** .633** .539* .555* .669** -.364 .588* .616* -.612* -.366 .553* -.918**
TSS 1 -.582* -.461 -.609* -.592* .521* -.377 -.395 .618* .595* -.447 .803**
TDS 1 .990** .099 .268 .153 .336 .339 -.547* -.377 .334 -.689**
TS 1 .001 .189 .258 .301 .301 -.489 -.308 .286 -.612*
pH 1 .501* -.764** .466 .469 -.419 -
.513* .154 -.503*
DO 1 -.529* .656** .673** -.499* -.011 .190 -.617*
CO2 1 -.285 -.298 .255 .336 -.055 .340 Chlorides 1 .996** -.426 .228 .591* -.655** Salinity 1 -.435 .213 .586* -.674** BOD 1 .214 -.133 .440 NH3 1 -.042 .312 Total
Alkalinity 1 -.619*
Total Hardness 1 **. Correlation is significant at the 0.01 level (2-tailed). *. Correlation is significant at the 0.05 level (2-tailed).
Table 3: Correlation Co-efficient values observed between different limnological characteristics of water at Station K2
Parameters Air temp. Water temp.
Trans parency TSS TDS TS pH DO CO2 Chlorides Salinity BOD NH3 Total Alkalinity Total
Hardness Air Temp. 1 .927** .816** -.774** .505* .417 .667** .594* -.420 .684** .685** -.336 -.453 .595* -.603*
Water Temp. 1 .785** -.657** .646** .577* .478 .527* -.285 .639** .639** -.196 -.366 .415 -.658** Transparency 1 -.848** .455 .356 .775** .576* -.602* .539* .523* -.382 -.564* .276 -.760**
TSS 1 -.263 -.139 -.778** -.406 .498* -.266 -.254 .534* .830** -.425 .698** TDS 1 .992** .140 .320 .115 .496 .517* -.051 -.151 .258 -.426 TS 1 .042 .276 .183 .474 .497* .018 -.047 .209 -.346 pH 1 .466 -.724** .439 .433 -.273 -.455 .239 -.452 DO 1 -.408 .507* .503* -.138 -.173 .172 -.397 CO2 1 -.278 -.254 .118 .265 -.137 .419
Chlorides 1 .998** .023 .140 .429 -.419 Salinity 1 .013 .142 .434 -.407 BOD 1 .649** -.333 .169 NH3 1 -.409 .594*
Total Alkalinity 1 -.326 Total Hardness 1
**. Correlation is significant at the 0.01 level (2-tailed). *. Correlation is significant at the 0.05 level (2-tailed).
(X- axis: Months, Y-axis: Total hardness (mg/L); 1st F: First fortnight & 2nd F: Second fortnight)
Fig 15: Fortnightly variations in total hardness of water at selected stations

Journal of Entomology and Zoology Studies http://www.entomoljournal.com
~ 293 ~
Map showing the sampling stations Map showing location of Study area with sampling stations
Conclusion From the present study it can be concluded from fisheries point of view that, the reservoir can support good fish production with respect to many observed parameters as mentioned in table 1. Correlation observed between the parameters under study were represented in table 2 & table3. References 1. Srivastava UK, Desai DK, Gupta VK, Rao SS, Gupta GS,
Raghavachari M. Inland fish marketing in India-Reservoir Fisheries. 4(A&B), Concept Publishing Co., New Delhi 1985:403:1184.
2. Sugunan VV. Reservoir Fisheries in India. FAO Fisheries Technical Paper No. 345, Rome 1995,423.
3. Sugunan VV. Reservoir Fisheries. Handbook of Fisheries and Aquaculture. ICAR, New Delhi 2011.
4. Vass VV, Sugunan KK. Status of Reservoir Fisheries in India. Status of Reservoir Fisheries in Five Asian Countries, NACA, Thailand 2009.
5. Strickland JDH, Parsons, TR. A practical hand book of sea water analysis. Fishery Research Bulletin of Canada 1972;(167):311.
6. APHA (American Public Health Association). Standard methods for the examination of water and waste water (21th ed.). American Public Health Association, Washington, DC 2005.
7. Perumal P. The influence of meteorological phenomena
on the ecosystems of a tropical region, southeast coast of India. A case study. Ciencias Marinas 1993;19:343-351.
8. Basavaraja D, Narayana J, Kiran BR, Puttaiah ET. Fish diversity and abundance in relation to water quality of Anjanapura reservoir, Karnataka, India. International Journal of Current Microbiology and Applied Sciences 2014;3(3):747-757.
9. Mohammad MJ, Krishna PV, Lamma OA, Khan S. Analysis of water quality using limnological studies of Wyra reservoir, Khammam district, Telangana, India. International Journal of Current Microbiology and Applied Sciences 20154(2):880-895.
10. Bharamal DL, Korgaonkar DS. A preliminary investigation on water quality of Tillari dam, dodamarg, Sindhudurg, Maharashtra, India. International Journal of Current Microbiology and Applied Sciences 2014;3(7):369-377.
11. Sreenivasulu K, Hossain K, Daoodharam T. Physico-chemical characteristics of freshwater Ramanna tank (cheruvu), Nellore district, India. Advances in Applied Science Research 2014;5(2):59-65.
12. Tembhare DR. Seasonal study of physico-chemical parameters of Kalisarar dam reservoir of Gondia district. Asian Journal of Animal Sciences 2015;10(1):14-19.
13. Pawaiya N, Sharma DK, Khushwah KS. Analysis of Physico-chemical parameters in Harsi reservoir, Dabra, Gwalior, Madhya Pradesh. International Journal of

Journal of Entomology and Zoology Studies http://www.entomoljournal.com
~ 294 ~
Innovation Science and Research 2014;11(2):248-258. 14. Garg RK, Rao RJ, Saksena DN. Water quality and
conservation management of Ramsagar reservoir, Datia, Madhya Pradesh. Journal of Environmental Biology 2009;30(5):909-916.
15. Bhadja P, Vaghela AK. Assessment of Physico-chemical parameters and Water quality Index of Lalpari reservoir. International Journal of Plant, Animal and Environmental Sciences 2013;3(3):89-95.
16. Hussain A, Sulehria AQK, Ejaz M, Maqbool A. Monthly variations in physico-chemical parameters of a flood plain reservoir on river Ravi near Balloki Head waters (Pakisthan). Biologia 2013;59(2):371-377.
17. Lubal MJ, Sutar AU, Pawar K. Studies on physico-chemical aspects of Mhaswad water reservoir of Satara district (Maharashtra) India. International Journal of Plant, Animal and Environmental Sciences 2012;2(3):12-15.
18. Mathavan N, Nambirajan P. Studies on the physico-chemical parameters of Grant anicut (Kallani), Thanjavur district, Tamil Nadu, India. International Journal of Pharmacy and Biological Sciences 2012;2(4):32-40.
19. Basavaraja D, Narayana J, Kiran BR, Puttaiah ET. Fish diversity and abundance in relation to water quality of Anjanapura reservoir, Karnataka, India. International Journal of Current Microbiology and Applied Sciences 2014;3(3):747-757.
20. Saxena M, Saksena DN. Water quality and trophic status of Raipur reservoir in Gwalior, Madhya Pradesh. Journal of Natural Sciences Research 2012;2(8):82-96.
21. Lianthuuamluaia Langde AT, Purushothaman CS, Deshmukhe G, Ramteke KK. Assessment of seasonal variations of water quality parameters of Savitri reservoir, Poladpur, Raigad, Maharashtra. The Bioscan 2013;8(4):1337-1342.
22. Piska RS, Devi SB, Divakara KC. The present status of Ibrahim, a minor reservoir of Hyderabad. Fishing Chimes 2000;20(2):41-43.
23. Jadoon S, Munir S, Abdulhamid AM. Analyzing water quality in Darbandikhan reservoir, Kurdistan region, Iraq. International Journal of Scientific Research 2015;4(12):761-770.
24. Gayathri S, Latha N, Mohan MR. Water quality status of Manchanabele reservoir: Bangalore west region, Karnataka, India. International Journal of Innovative Researchin Science, Engineering and Technology 2015;2(12):364-372.
25. Pulugandi C. Analysis of water quality parameters in Vembakottai water reservoir, Virudhunagar district, Tamil Nadu. Research Journal of Recent Sciences 2014;3(ISC-2013):242-247.
26. Boyd CE, Lichtkoppler F. Water quality management in pond fish culture. Research and Development series No. 22. Project Ad/DSAN-G0039, Alabama 1979,30.
27. Jhingran AG, Sugunan VV. General guidelines and planning criteria for small reservoir fisheries management. In. Jhingran, AG. and Unnithan, V.K. (eds.). Reservoir fisheries in India. Proceedings of the National workshop on Reservoir Fisheries, 3-4 January, 1990. Special Publication 3, Asian Fisheries Society, Indian Branch, Mangalore, India 18.
28. Boyd CE. Water quality in warm water fish ponds. Craftmaster, Printers Inc. Auburn, Alabama, USA
1979,353. 29. Swingle HS. Standardization of chemical analysis of
waters and pond muds. FAQ. Fish Reproduction 1967;44:397-421.
30. Unni KS. Comparative water chemistry of a plankton dominated and a macrophytic dominated lake in Chhindwara, Madhya Pradesh. Proceedings of the National Academy of Sciences. India. Part 1983;53(b):81-88.
31. Chandrasekhar JS, Babu KL, Somasekar RK. Impact of urbanization on Bellandur Lake, Bangalore-A case study. Journal of Environmental Biology 2003;24(3):223-27.
32. Van der Leeden F, Troise FL, Todd DK. The Water Encyclopedia. 2nd edition (Chelsea, Michigan: Lewis publishers) 1990.
33. Philipose MT. Fresh water phytoplankton of Inland fisheries. Proceedinds of Symposium on Algology, ICAR, New Delhi 1960,272-291.
34. Gupta SK, Gupta RC. General and Applied Ichthyology (Fish and Fisheries) S. Chand and Company Ltd. Ram Nager, New Delhi 2006,1130.
35. Sawyer, CH. Chemistry for Sanitary Engineers. Mc. Graw Hill Book Co., New York 1960.
36. Rai, H. Limnological studies on the river Yamuna at Delhi.Part I. Relation between Chemistry and the state of Pollution. Archiv fuer Hydrobiologie 1971;73:269-393.