limnological survey of dhaka-narayanganj-demra (dnd)
11
Bangladesh J. Zool. 48(1): 93-103, 2020 ISSN: 0304-9027 (print) 2408-8455 (online) LIMNOLOGICAL SURVEY OF DHAKA-NARAYANGANJ-DEMRA (DND) DAM AREA WETLANDS AHM Shafiullah Habib, Mahiuddin Sarker 1 *, Md. Gias Uddin Shimu Akter and M. Niamul Naser 2 Department of Zoology, Jagannath University, Dhaka-1100, Bangladesh Abstract: Present investigation was conducted to assess the physicochemical characteristics of water and its suitability for fish production at Dhaka- Narayanganj-Demra (DND) dam wetlands. Data were collected at eight points of the study area between March 2014and February 2015on temperature, transparency, pH, dissolved oxygen (DO) and free carbon dioxide (CO2) in the water. The average maximum water temperature, transparency, pH, DO, free CO2, hardness were recorded as34.6±0.4°C, 40.3±0.8cm, 7.9±0.06, 7.6±0.4 mgL - 1 ,85.6±6.6 mgL -1 and 491.2±76mgL -1 while minimum average were found as26.3±1.0°C,7.1±0.2 cm, 7.4±0.05, 5.9±0.3 mgL -1 , 11.9±0.8 mgL -1 and 87.6±11.3 mgL -1 respectively.All the water parameters were found in favourable condition for optimum freshwater fish production with some modification. This study can be the baseline data toward fresh fish supply and production prospect in the Dhaka city at wetland of the DND canal area. Keywords: DND canal, physicochemical parameters, limnology, fish culture, Dhaka, Bangladesh INTRODUCTION Water is the main vector for all development activities and is integrated related with all ecological and societal processes (Viessman and Hammer, 1998).Good water denotes the component of water which are essential for optimum growth of aquatic organisms (Ehiagbonare and Ogundiran, 2010).Water quality guidelines include basic scientific information about water quality parameters and ecologically relevant toxicological threshold values to protect specific water uses. Surface water quality of the rivers of Bangladesh becoming highly polluted day by day (DoE, 1993). The human activities release large number of pollutants into the water bodies (Kocaoba and Akcin, 2005). Physical and chemical parameters that influence the aquatic environment are temperature, transparency, pH, dissolved oxygen (DO),free carbon dioxide (CO2) and hardness. In addition, total alkalinity, biochemical oxygen demand (BOD), chemical oxygen demand (COD), total dissolved solids (TDS), total suspended solids (TSS), nitrite, ammonia, hydrogen sulphide (H2S), phosphate etc are also important physicochemical parameters that influence the water quality. These parameters limit the growth and survival of aquatic organisms. Bad water qualities may be caused by low water flow, municipal effluents and industrial discharge etc. Water parameters has great impact on survival, growth, reproduction and distribution of fishes (Deepak and Singh, 2014). Any adverse environmental condition usually affects the life of fishes in the water body. *Author for corresponding:, [email protected], 1 Sejong University, Seoul, South Korea, 2 Department of Zoology, University of Dhaka, Dhaka 1000, Bangladesh ©2020 Zoological Society of Bangladesh DOI: https://doi.org/10.3329/bjz.v48i1.47879
-
Upload
khangminh22 -
Category
Documents
-
view
0 -
download
0
Transcript of limnological survey of dhaka-narayanganj-demra (dnd)

Bangladesh J. Zool. 48(1): 93-103, 2020 ISSN: 0304-9027 (print) 2408-8455 (online)
LIMNOLOGICAL SURVEY OF DHAKA-NARAYANGANJ-DEMRA (DND)
DAM AREA WETLANDS
AHM Shafiullah Habib, Mahiuddin Sarker1*, Md. Gias Uddin
Shimu Akter and M. Niamul Naser2
Department of Zoology, Jagannath University, Dhaka-1100, Bangladesh
Abstract: Present investigation was conducted to assess the physicochemical characteristics of water and its suitability for fish production at Dhaka-Narayanganj-Demra (DND) dam wetlands. Data were collected at eight points of
the study area between March 2014and February 2015on temperature, transparency, pH, dissolved oxygen (DO) and free carbon dioxide (CO2) in the water. The average maximum water temperature, transparency, pH, DO, free CO2, hardness were recorded as34.6±0.4°C, 40.3±0.8cm, 7.9±0.06, 7.6±0.4 mgL-
1,85.6±6.6 mgL-1 and 491.2±76mgL-1while minimum average were found as26.3±1.0°C,7.1±0.2 cm, 7.4±0.05, 5.9±0.3 mgL-1, 11.9±0.8 mgL-1 and 87.6±11.3 mgL-1respectively.All the water parameters were found in favourable condition for optimum freshwater fish production with some modification. This study can be the
baseline data toward fresh fish supply and production prospect in the Dhaka city at wetland of the DND canal area. Keywords: DND canal, physicochemical parameters, limnology, fish culture, Dhaka, Bangladesh
INTRODUCTION
Water is the main vector for all development activities and is integrated related
with all ecological and societal processes (Viessman and Hammer, 1998).Good water denotes the component of water which are essential for optimum growth
of aquatic organisms (Ehiagbonare and Ogundiran, 2010).Water quality
guidelines include basic scientific information about water quality parameters
and ecologically relevant toxicological threshold values to protect specific water
uses. Surface water quality of the rivers of Bangladesh becoming highly polluted
day by day (DoE, 1993). The human activities release large number of pollutants into the water bodies (Kocaoba and Akcin, 2005). Physical and chemical
parameters that influence the aquatic environment are temperature,
transparency, pH, dissolved oxygen (DO),free carbon dioxide (CO2) and
hardness. In addition, total alkalinity, biochemical oxygen demand (BOD),
chemical oxygen demand (COD), total dissolved solids (TDS), total suspended
solids (TSS), nitrite, ammonia, hydrogen sulphide (H2S), phosphate etc are also important physicochemical parameters that influence the water quality. These
parameters limit the growth and survival of aquatic organisms. Bad water
qualities may be caused by low water flow, municipal effluents and industrial
discharge etc. Water parameters has great impact on survival, growth,
reproduction and distribution of fishes (Deepak and Singh, 2014). Any adverse
environmental condition usually affects the life of fishes in the water body.
*Author for corresponding:, [email protected], 1 Sejong University, Seoul, South Korea,
2Department of Zoology, University of Dhaka, Dhaka 1000, Bangladesh
©2020 Zoological Society of Bangladesh DOI: https://doi.org/10.3329/bjz.v48i1.47879

94 Habib et al.
In reality, whole of the aquatic life in any water body is controlled by the
interaction of a number of physical and chemical conditions. Gross physicochemical characteristics of DND canal have been reported by several
workers earlier. It is important for better understand this small sized body of
water especially with regard to changes in water quality as a result of run off or
human activities. Water is the habitation of the fish and
its quality is commonly avoided until it effects on fish production. Canal
habitats can easily be exploited by managing the water parameters for an
optimum environment that yield high amount of fish. DND dam area is located
in the southeast suburb of Dhaka Metropolitan city and is stretched over Demra
and Shampur Thana of Dhaka district and Shiddirganj and Fatullah Thana of Narayanganj district. This dam was started to construct in 1964 and completed
in 1968 aimed to control flood for 4,860 ha land (Banglapedia, 2006). This study
focuses on evaluation of some physicochemical parameters and suitability of
DND canal water bodies for fish production. No such research has been done yet
on fish culture of these places except Habib et al.(2013). This is the further and
extensive study of the previous work.
MATERIAL AND METHODS
Study area and Sampling stations: Dhaka-Chittagong highway passes
through the DND dam area at Jatrabari point to Siddhirganj. Demra road covers
another part of the area and in the south is the Buriganga and the Shitalakshya River in the eastern side. In the monsoon the whole area becomes a vast
waterbody and water stands for 4-6 months temporarily in the area. Most of the
dam is used as a road to communicate Narayanganj with Dhaka city. For the
present study eight sampling spots were selected where the small canal and
huge water body located in the DND dam area. The sampling points were
Council(S1: 23°4256.22N and 90°2742.37E), Ranimohal (S2: 23°4246.05N
and 90°2953.27E),Chittagong Road(S3:23°4157.02 N and 90°3028.20E),
East Mijmiji (S4:23°4141.32N and 90°2955.88E), Signboard(S5:
234144.02N and 902857.27E), Lama Para (S6:23°3903.46N and
90°2932.41E), Afaz Nagar(S7:23°3903.4N and 90°2857.60E) and Pagla (S8:
23°3939.82N and 90°2725.91E). Among the eight spots, three sites (S1, S2
and S5) were under Dhaka district and rest fives were under Narayanganj district (Fig. 1). According to Bangladesh Bureau of Statistics (BBS, 2015), the
study period was divided into three seasons viz. March to June as summer, July
to October as monsoon and November to February as winter.
Sample collection and analyses: Samples were collected from eight
sampling sites between March 2014 and February 2015. In order to get the
information about the quality of water body in DND area samples were usually
collected in the last week of each month between 6 am and 9 am. Water samples were collected in dark coloured bottles with stopper from sub-surface about 10
to 15 cm below the top of the water surface from different sampling points.
Before sample collection, all bottles were washed with dilute acid followed by
distilled water and were dried in sun light. At the time of taking final water

Limnological structure of Dhaka 95
samples, the bottles were again rinsed three times with the water to be collected
from the sites.
The sample bottles were labelled with date and sampling sites. The sample
waters were bottled carefully avoiding air bubble into it. The location of the
sample sites were recorded with a GPS device (GARMIN e-trax) at time of
sampling. Samples were carried from sampling sites to the laboratory by covering with black coloured bag. Six water quality parameters namely
temperature, transparency, pH, free CO2, DO, and hardness have been recorded
for this particular study. Water temperature was determined with the help of a
mercury thermometer. To get the reading of temperature the thermometer was
dipped into the water at consistent surface depth 10 cm and record the value
Fig.1. Map showing eight sampling sites of the DND dam area – Council (S1),Ranimohal
(S2),Chittagong Road(S3),East Mijmiji (S4), Signboard(S5), Lama Para (S6), Afaz Nagar (S7) and Pagla (S8).
directly. The transparency of the water was measured with a Secchi disc of 25
cm in diameter (painted black and white on the upper surface) and calculated by
the following formula:
T=𝑋+𝑌
2
Where, T is the transparency of water in centimetre,
X is the depth of water at which the disc became invisible, and
Y is the depth of water at which the disc reappeared while pulling the rope
upward.
pH of water was measured at the time of sampling site by Hanna Combo
meter(Model HI 98129) and using buffer solution which pH value was 7.0

96 Habib et al.
accordance to standard method. For analysis of DO, water samples were
collected in separate sampling bottles and analyzed in the laboratory. DO and free CO2were measured by titrimetric method. Hardness was measured by
complex metric titration method. Dissolved oxygen (DO, mgL-1) was measured
following Winkler-Azide method. Firstly2 ml of manganese (II) sulfate solution
was added immediatelyto300 ml sample water just below the surface and mixed
carefully without letting in air on spot. Then 2 ml of alkali iodide-azide was
added and again mixed as earlier. A brownish-orange cloud of precipitate or floc was appeared, if oxygen present. Let the floc settle to the bottom and mixed the
sample by turning it upside down several times and let it settled again. After
that 2 ml of concentrated sulphuric acid was added to the sample just above the
surface of the sample with a pipette held. Stopper and invert several times to
dissolve the floc with care. At this point, the sample is ‘fixed’ and can be stored for up to 8 hours if kept in a cool and dark place. In the laboratory,201 ml of the
above sample water was taken to a conical flask and titrate with sodium
thiosulphate until appear a pale straw colour. Now 2 ml of starch solution was
added to it and the sample water turned to blue. This blue sample was titrated
again with thiosulphate until it turned clear. At this point the reading was
recorded and DO was calculated as the burette reading of sodium-thiosulphate used in the whole titration process. Free carbon dioxide (CO2) was measured by
titrimetric method using in N/44 NaOH and phenolphthalein indicator(Hargis,
1988). First, 100 ml of sample water is taken to a conical flask and added 10
drops of phenolphthalein indicator to it. The burette was then filled with NaOH
solution. Sample water was titrate with NaOH until the water turned to light pink colour. The difference in millilitres between the first and second reading of
the burette was used to calculate the CO2 present in the sample water.
Hardness (mgL-1) is the reading of Ethylenediaminetetraacetic acid (EDTA)
solution(HI3812-0), hardness buffer, calamite indicator from HANNA Instrument
(Hardness Test Kit) using standard method (HANNA Instrument, 2009).The
amount of used EDTA was multiplied by 300 to estimate the hardness of water.
Standard deviation and standard error were analyzed by MS Office Excel 2013
programme.
RESULTS AND DISCUSSION
Water temperature: Maximum average water temperature was recorded
34.6±0.4°Cin Lama Para(S6) and minimum, 26.3±1°C in East Mijmiji (S4) among
the eight sites(Table1, Fig.2).Maximum seasonal mean water temperature was
30.75±0.76°C in summer and minimum, 18±1.45°C in winter(Fig. 2).The highest temperature was recorded as 31.88±0.449°C in July and lowest, 22.13±1.754°C
in January (Table 2). The solubility of gases in water are controlled by
temperature and the reaction rate of chemicals, the toxicity of ammonia and of
chemotherapeutics to fish. According to Delince(1992),30 – 35C temperature is
tolerable to fish culture and Bhatnagar et al. (2004) reported that the levels of
temperature as 28 – 32°C is ideal for tropical major carps. The observed water
temperature in the water bodies can be considered as the normal for aquatic life in Council (S1), Ranimohal (S2), Chittagong Road(S3),East Mijmiji (S4),
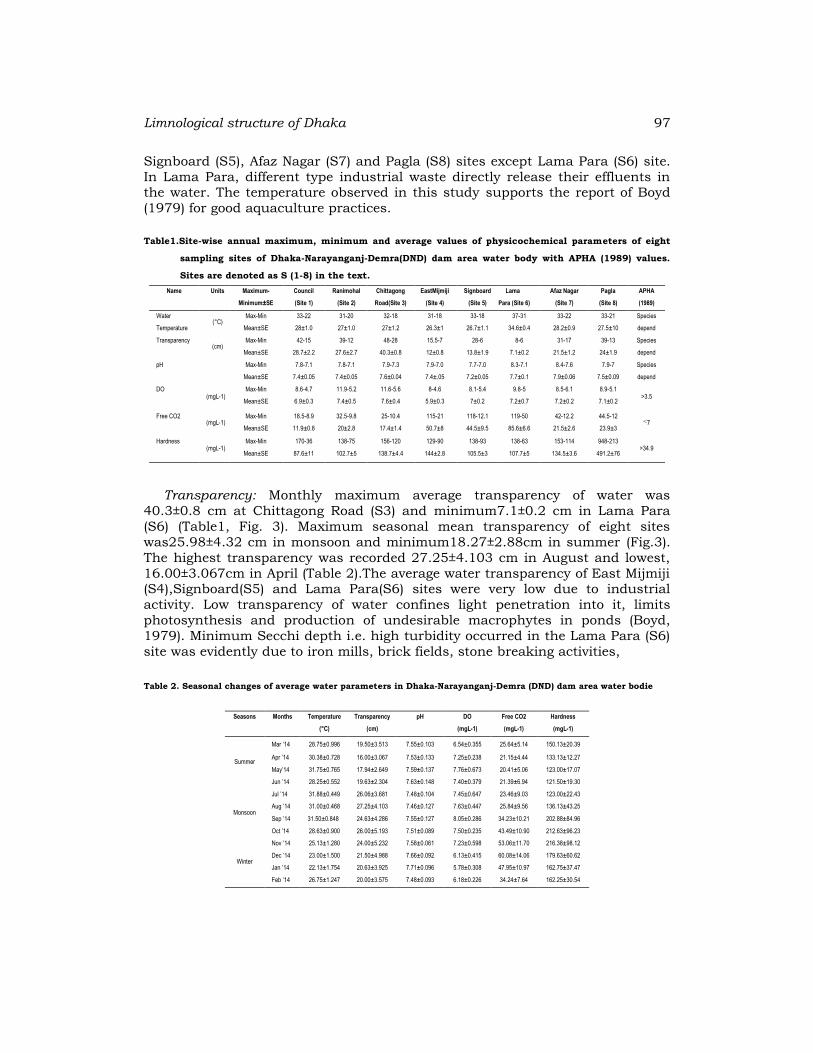
Limnological structure of Dhaka 97
Signboard (S5), Afaz Nagar (S7) and Pagla (S8) sites except Lama Para (S6) site.
In Lama Para, different type industrial waste directly release their effluents in the water. The temperature observed in this study supports the report of Boyd
(1979) for good aquaculture practices.
Table1.Site-wise annual maximum, minimum and average values of physicochemical parameters of eight
sampling sites of Dhaka-Narayanganj-Demra(DND) dam area water body with APHA (1989) values.
Sites are denoted as S (1-8) in the text.
Name Units Maximum-
Minimum±SE
Council
(Site 1)
Ranimohal
(Site 2)
Chittagong
Road(Site 3)
EastMijmiji
(Site 4)
Signboard
(Site 5)
Lama
Para (Site 6)
Afaz Nagar
(Site 7)
Pagla
(Site 8)
APHA
(1989)
Water
Temperature (°C)
Max-Min 33-22 31-20 32-18 31-18 33-18 37-31 33-22 33-21 Species
depend Mean±SE 28±1.0 27±1.0 27±1.2 26.3±1 26.7±1.1 34.6±0.4 28.2±0.9 27.5±10
Transparency (cm)
Max-Min 42-15 39-12 48-28 15.5-7 28-6 8-6 31-17 39-13 Species
depend Mean±SE 28.7±2.2 27.6±2.7 40.3±0.8 12±0.8 13.8±1.9 7.1±0.2 21.5±1.2 24±1.9
pH
Max-Min 7.8-7.1 7.8-7.1 7.9-7.3 7.9-7.0 7.7-7.0 8.3-7.1 8.4-7.6 7.9-7 Species
depend Mean±SE 7.4±0.05 7.4±0.05 7.6±0.04 7.4±.05 7.2±0.05 7.7±0.1 7.9±0.06 7.5±0.09
DO (mgL-1)
Max-Min 8.6-4.7 11.9-5.2 11.6-5.6 8-4.6 8.1-5.4 9.8-5 8.5-6.1 8.9-5.1 >3.5
Mean±SE 6.9±0.3 7.4±0.5 7.6±0.4 5.9±0.3 7±0.2 7.2±0.7 7.2±0.2 7.1±0.2
Free CO2 (mgL-1)
Max-Min 18.5-8.9 32.5-9.8 25-10.4 115-21 118-12.1 119-50 42-12.2 44.5-12 ˂7
Mean±SE 11.9±0.8 20±2.8 17.4±1.4 50.7±8 44.5±9.5 85.6±6.6 21.5±2.6 23.9±3
Hardness (mgL-1)
Max-Min 170-36 138-75 156-120 129-90 138-93 138-63 153-114 948-213 >34.9
Mean±SE 87.6±11 102.7±5 138.7±4.4 144±2.8 105.5±3 107.7±5 134.5±3.6 491.2±76
Transparency: Monthly maximum average transparency of water was
40.3±0.8 cm at Chittagong Road (S3) and minimum7.1±0.2 cm in Lama Para
(S6) (Table1, Fig. 3). Maximum seasonal mean transparency of eight sites
was25.98±4.32 cm in monsoon and minimum18.27±2.88cm in summer (Fig.3).
The highest transparency was recorded 27.25±4.103 cm in August and lowest,
16.00±3.067cm in April (Table 2).The average water transparency of East Mijmiji (S4),Signboard(S5) and Lama Para(S6) sites were very low due to industrial
activity. Low transparency of water confines light penetration into it, limits
photosynthesis and production of undesirable macrophytes in ponds (Boyd,
1979). Minimum Secchi depth i.e. high turbidity occurred in the Lama Para (S6)
site was evidently due to iron mills, brick fields, stone breaking activities,
Table 2. Seasonal changes of average water parameters in Dhaka-Narayanganj-Demra (DND) dam area water bodie
Seasons Months Temperature
(°C)
Transparency
(cm)
pH DO
(mgL-1)
Free CO2
(mgL-1)
Hardness
(mgL-1)
Summer
Mar ’14 28.75±0.996 19.50±3.513 7.55±0.103 6.54±0.355 25.64±5.14 150.13±20.39
Apr ’14 30.38±0.728 16.00±3.067 7.53±0.133 7.25±0.238 21.15±4.44 133.13±12.27
May’14 31.75±0.765 17.94±2.649 7.59±0.137 7.76±0.673 20.41±5.06 123.00±17.07
Jun ’14 28.25±0.552 19.63±2.304 7.63±0.148 7.40±0.379 21.39±6.94 121.50±19.30
Monsoon
Jul ’14 31.88±0.449 26.06±3.681 7.48±0.104 7.45±0.647 23.46±9.03 123.00±22.43
Aug ’14 31.00±0.468 27.25±4.103 7.46±0.127 7.63±0.447 25.84±9.56 136.13±43.25
Sep ’14 31.50±0.848 24.63±4.286 7.55±0.127 8.05±0.286 34.23±10.21 202.88±84.96
Oct ’14 28.63±0.900 26.00±5.193 7.51±0.089 7.50±0.235 43.49±10.90 212.63±96.23
Winter
Nov ’14 25.13±1.280 24.00±5.232 7.58±0.061 7.23±0.598 53.06±11.70 216.38±98.12
Dec ’14 23.00±1.500 21.50±4.988 7.66±0.092 6.13±0.415 60.08±14.06 179.63±60.62
Jan ’14 22.13±1.754 20.63±3.925 7.71±0.096 5.78±0.308 47.95±10.97 162.75±37.47
Feb ’14 26.75±1.247 20.00±3.575 7.48±0.093 6.18±0.226 34.24±7.64 162.25±30.54

98 Habib et al.
garments factory, dying factory situated in this area. Water from the different
spots varies in solids concentrations depending on the volume of mineralization, amount of suspended clay and abundance of plankton (Boyd, 1992). According
to Bhatnagar et al. (2004) transparency range from 30 – 80 cm is good for fish
health; 15 – 40 cm is good for intensive culture system and <12 cm causes
stress. The transparency values in DND canal are within the desirable range for
the fish production.
pH: The maximum average pH of water was recorded 7.9±0.06 at Afaz Nagar
(S7), and the minimum7.2±0.05was in Signboard (S5) (Table 1, Fig. 4).The pH of
water in DND canal areas agrees with the desirable lower limit for aquaculture. The maximum pH was 7.61±0.086 in winter and minimum 7.5±0.11 in
monsoon. The highest pH was recorded 7.71±0.096 in January and lowest,
7.46±0.0127 in August (Table 2). The water in all areas appeared slightly basic
in nature. According to Roule (1930) the largest fish crops are usually produced
in alkaline side of neutrality between pH 7.0 and 8.0. Ohle et al. (1938) reported
that any pH value lower than pH 4.8 or higher than pH 10.8 might bring noxious effects to the aquatic organisms. In the present study it was observed
that the DND canal water had a pH more than 7.0 and most of the canal had a
pH between 7.1 and 7.9. This is generally the normal range of pH in freshwater
canal unless contaminated by base. Huet (1986) observed that pH values of 6.5
to 9.0 are good for fish production, hence the DND canal water are appeared
more conducive.
Dissolved oxygen (DO): The concentration of average DO decreased
gradually from September to January (Table 2). It attained its maximum average
value in Chittagong Road(S3)7.6±0.4 mgL-1 and then decreased till January
when it attained its nearly minimum average value 5.9±0.3 mgL-1 in Mijmiji (S4)
(Table1, Fig. 5). Maximum seasonal mean DO was 7.65±0.40 mgL-1recorded in
monsoon and minimum6.33±0.39 mgL-1 in winter (Fig. 8). The highest amount of DO was recorded 8.05±0.286 mgL-1 in September and lowest 5.78±0.308 mgL-
1was in August (Table 2). There is no remarkable change in Lama Para(S6)
because of industrial waste. According to APHA (1989) 3.5 mgL-1 or above is
suitable for fish culture. All sampling sites had desirable DO level for fish
culture.

Limnological structure of Dhaka 99
Fig. 2. Monthly water temperature
(°C) in different sampling spots.
Fig. 3. Monthly transparency of water (cm) in different sampling spots.
Fig. 4. Monthly pH of water at different sampling spots.
Fig. 5. Monthly dissolved oxygen (mgL-1) of water at different sampling spots.
Fig. 6. Monthly free CO2inwater at different sampling spots.
Fig. 7. Monthly hardness (mgL-1) of water at different sampling spots.
15
20
25
30
35
40
Mar
Ap
r
May Jun
Jul
Au
g
Sep
Oct
No
v
De
c
Jan
Feb
Temperature (°C)
S1S2S3S4
0
10
20
30
40
50
60
Mar
Ap
r
May Jun
Jul
Au
g
Sep
Oct
No
v
De
c
Jan
Feb
Transparency (cm)
S1 S2 S3S4 S5 S6
7
7.2
7.4
7.6
7.8
8
8.2
8.4
8.6
Mar
Ap
r
May Jun
Jul
Au
g
Sep
Oct
No
v
De
c
Jan
Feb
pH
S1 S2 S3S4 S5 S6
456789
10111213
Mar
Ap
r
May Jun
Jul
Au
g
Sep
Oct
No
v
De
c
Jan
Feb
Dissolved Oxygen (mgL-1)
S1 S2 S3
S4 S5 S6
020406080
100120140
Mar
Ap
r
May Jun
Jul
Au
g
Sep
Oct
No
v
De
c
Jan
Feb
Free CO2 (mgL-1)
S1 S2 S3S4 S5 S6
0
200
400
600
800
1000
Mar
Ap
r
May Jun
Jul
Au
g
Sep
Oct
No
v
De
c
Jan
Feb
Hardness (mgL-1) S1 S2 S3S4 S5 S6

100 Habib et al.
Fig. 8. Seasonal fluctuation of average values of water parameters in Dhaka-
Narayanganj-Demra (DND) dam area water bodies (Hardness on secondary axis).
Free carbon dioxide (CO2): Minimum average freeCO2of water at different
sampling sites was 11.9±0.8 mgL-1which was recorded in Council (S1) while the
maximum was 85.6±6.6mgL-1 in Lama Para (S6)(Table1, Figure 6). Seasonally,
maximum mean value of free carbon dioxide was 48.83±11.09mgL-1 in winter and minimum was22.14±5.39mgL-1in summer (Fig. 8). The highest free CO2 was
recorded 60.08±14.06 mgL-1 in December and lowest 20.41±5.06 mgL-1 in May
(Table 2).Most of the sites showed average free CO2 higher than 11.9mgL-
1.Almost throughout the year a gradual increase in free CO2 with decreasing of
water level as well as increasing of sewage, garbage, waste materials of mills and
factories was observed. The free CO2 in water promoting good fish population and the value should be less than 5 mgL-1(Santhosh and Singh, 2007). On the
basis of Boyd and Lichtkoppler (1979) fish stay away from free CO2 levels as low
as 5 mgL-1 but most species can sustain in waters containing up to 60 mg L-
1CO2.According to Ekubo and Abowei (2011) fishes can endure CO2 levels over
100 mgL-1 but the optimum level of CO2 in is less than 10 mgL-1.It may depends upon alkalinity and hardness of water body. The value of CO2 was high in
December. This may be due to the high rate of decomposition in the warmer
months. Khan and Chowdhury (1990) reported that higher CO2 occurred during
winter season (December) due to absence of rain, runoff and flood water as well
as gradual settling of suspended particles. Habib et al. (2013) also reported
similar observation from around DND dam area.
Hardness: Maximum average hardness of water found 491.2±76 mgL-
1atPagla (S8) while the minimum was 87.6±11.3 mgL-1(Table1, Fig. 7) at Council
(S1).The highest value948 mgL-1 of hardness was observed at Pagla (S8) in April
and the lowest 213 mgL-1in November (Fig. 7).Hardness of water at Pagla was
0
50
100
150
200
0
10
20
30
40
50
60
Summer Monsoon Winter
Seasonal fluctuation of water parameters
Temperature (°C) Transparency (cm)
pH DO (mgL-1)

Limnological structure of Dhaka 101
found always at the highest among all other sites. The highest hardness was
recorded 216.38±98.12 mgL-1 in November and lowest121.50±19.30 mgL-1 in June (Table 2). During the study maximum hardness was recorded
180.25±56.69 mgL-1in winter and minimum 131.94±17.26mgL-1 in summer.
Both the values are far away from the standard value of hardness of water for
fish culture. The result is slightly differ with Habib et al(2013) because in recent
years there are many industrial development occurred for example iron mills,
brick fields, stone breaking fields, garments factory, dying factory are established in this area. These mills and factories are releasing different type of
pollutants and active chemicals, debris, dust, wastes to the water. Also the road
and the adjacent area has heavy traffic most time of day which adds black
smoke, harmful gases like CO2, CO, SO2, NO2etc and a remarkable part of this
component back in water body by rain or settling. On the other hand most of the
dwellers of this area are dumping garbage here and there, especially near the
water body. Fish species has their own range of water hardness for existence.
Prospects of fish culture in the wetlands: Good fish culture depends largely on
the quality of water which is a complex interaction of different physical,
chemical and biological, ecological factors of the water body. DND dam is a
much populated area in and adjacent to the capital city. The area is hampered
by the over populated activity. Also tolerance of fish to the factors of the water is
not always equal for all fish. Some could live in even hard and hot water and most fish has their own specific range. Tolerance to a factor is mostly species
dependent. Physical, chemical and biological water parameters influence the
gross production of water bodies. Favourable range of water parameters results
in the high production of aquatic organisms. Fifty percent of the sites were
found in favourable in terms of water temperature. Water temperature at Lama Para found beyond the limit for common fishes. So, temperature may not be an
obstacle for fish culture in the area.30 – 80 cm transparency of water is good for
fish (Bhatnagar et al (2004) which was found in favour in most places at rainy
season and onwards except in Lama Para. The place found industrially rich
compared to other spots. Dry season may not be in favour to fish culture when
most of the area became dry and water is limited to deeper areas only. Transparency found good to fish culture. Another factor is pH.6.5 – 9.0 pH value
is favourable for fish (Huet 1986). None of the studied area was found exceed the
limit of pH. So, in terms of pH value the area is suitable for fish culture.
Probably the most important factor for aquatic organism is DO which was found
in the study area more or less within the limit. Favourable DO values for
fisheries ranged from 4 to 6 mgL-1(Boyd, 1990), below which most cultivable aquatic organisms could not sustain or have good growth. APHA (1989)
recommend 3.5 mgL-1or more is favourable for fish culture. DO level was found
in safe in all the spots of DND area. Ideal level of free CO2 in fish ponds is less
than 10 mgL-1 (Ekubo and Abowei, 2011). But Santhosh and Singh (2007)
reported that the amount of free CO2 in water should be less than 5 mgL-1. Boyd and Lichtkoppler (1979) reported that fish keep away themselves from free CO2
levels as low as 5, but most fishes can tolerate waters containing 60 mgL-1.
Although maximum amount of CO2in all spots exceeds the tolerable limit but

102 Habib et al.
this factor found favourable most of the time in the year. So, free CO2 in the area
except Lama Para is under control for fish culture. APHA (1989) recommended value for hardness of water is higher than 34.9 mgL-1 which was found round
the year in all spots suitable for fish culture in the area. The study suggest the
area is in favour to fish culture.
Other environmental factors needed to be studied in this area before fish culture. The area may regarded as polluted and pollution occurred mostly by
releasing of huge amount of human-produced garbage, litters, trash, debris,
metallic and industrial wastes day by day. Most water parameters in DND canal
were found to be suitable for fish culture but some parameters at a distinct
point was not found healthy for fish culture and it was evident that DND is organically a little bit polluted. But present study suggests that the area is still
in favourable for fish culture. Further extensive investigation on biological,
ecological study with heavy metal pollution may needed this area. Some physical
and chemical water parameters were studied in that area and recommendation
was made only on the result found in the study. Further extensive physical,
chemical and biological aspect of the water bodies should be new horizon to be studied. In addition, the post-harvest meat quality of fish should be considered
for further study.
LITERATURE CITED
APHA-AWWA-WPCF,1989. Standard methods for the examination of water and wastewater. New York: American Public Health Association.
BANGLAPEDIA,2006. National Encyclopaedia of Bangladesh, Asiatic Society of Bangladesh.
BBS, Bangladesh Bureau of Statistics, Annual Report 2015.
BHATNAGAR, A., JANA, S.N., GARG, S.K., PATRA, B.C., SINGH, G. and BARMAN, U.K. 2004. Water quality management in aquaculture, In Course Manual of summer school on development
of sustainable aquaculture technology in fresh and saline waters, CCS Haryana Agricultural, Hisar (India), pp 203-210.
BOYD, C.E and LICHTKOPPLER, F. 1979. Water quality management in fish ponds. Research and development series No. 22, International centre for aquaculture (J.C.A.A) Experimental station Auburn University, Alabama, pp 45-47.
BOYD, C.E. 1990. Water quality in ponds for aquaculture. Ala. Agr. Exp. Sta. Auburn University. 462p.
BOYD, C.E. and TUCKER, C.S. 1992. Water quality and pond soil analyses for aquaculture.
Alabama agricultural experiment station, Auburn University, Alabama, pp.183.
DELINCE, G. 1992. The ecology of the fish pond ecosystem: with special reference to Africa, Kluwer Academic Publishers London, pp 230.
DEEPAK, S. and SINGH,U. N. 2014. The relationship between Physico-chemical Characteristics and Fish Production of Mod Sagar Reservoir of Jhabua District, MP, India,3, pp-82-86.
DoE,1993. Environmental quality standard for Bangladesh, Ministry of Environment and Forestry, Department of Environment, Dhaka, Bangladesh, pp-25.
EHIAGBONARE J.E. and OGUNDIRAN Y.O. 2010. Physico-chemical analysis of fishpond waters in Okada and its environs, Nigeria. African J. Biotech., 9(36), 5922-5928.
EKUBO, A.A. and ABOWEI, J.F.N. 2011. Review of some water quality management principles in
culture fisheries, Research Journal of Applied Sciences, Engineering and Technology, 3(2),pp 1342-1357.
KHAN, M. A. G .and CHOUDHARY S.H. 1990. Physical and chemical limnology of lake Kaptai: Bangladesh, Tropical Ecology, 35(1), pp 35-51.

Limnological structure of Dhaka 103
HABIB, A.H.M SHAFIULLAH., ALAM M. MAHABUB. And NASER, M. NIAMUL. 2013. Suitability of the west led Dhaka-Narayanganj-Demra (DND) dam canal for water the aquaculture
practices, Jagannath University, Journal of Science, Volume-2, Number-1, pp 33-38.
HARGIS, L. G. 1988. Analytical Chemistry; Prentice, New Jersey, pp179-181.
HUET, M. 1986.Textbook of fish culture 2nd Edn. Fish News Book Ltd. England. Vide Study on the
Physico-chemical properties of water of Mouri River, Khulna Bangladesh, Pak. J. Biol. Sci. 10(5), 710-717.
KOCAOBA, S. and AKCIN, G. 2005.Desalination, 180, 151.
OHLE, W. 1938.TeichwirtschafthcheKalkkontrolle und die pH-SBV-Tasche (Control of liming in ponds with an outfit for pH and alkalinity determination). Z. Fisch. 36: 185-191.
PATRA, R.W.R. and AZADI, M.A. 1987. Ecological studies on the planktonic organisms of the Halda River, Bangladesh J. Zool. 15(2):109-123.
ROULE, L. 1930. pH determination in the evaluation of carp ponds. C. R. Acad. Agri. France, 16: 1056-1060.
SANTHOSH, B. and SINGH, N.P. 2007. Guidelines for water quality management for fish culture in
Tripura, ICAR research complex for NEH region, Tripura Center, Publication no.29.
VIESSMAN,W. and HAMMER, M.J. 1998. Water supply and pollution control, 5th edn. Harper Collins College Publishers, New York.
(Manuscript received on 20 November, 2019 revised on 20 February, 2020)