Tropical Reservoir Fisheries; Lake Kainji, Nigeria - CORE
334
THE UNIVERSITY OF HULL Tropical Reservoir Fisheries; Lake Kainji, Nigeria- a case study. being a Thesis submitted for the Degree of PhD In the University of Hull by Timothy Avon du Feu, BSc, MSc. December 2003
-
Upload
khangminh22 -
Category
Documents
-
view
2 -
download
0
Transcript of Tropical Reservoir Fisheries; Lake Kainji, Nigeria - CORE
THE UNIVERSITY OF HULL
Tropical Reservoir Fisheries; Lake Kainji, Nigeria- a case study.
being a Thesis submitted for the Degree of PhD
In the University of Hull
by
Timothy Avon du Feu, BSc, MSc.
December 2003

Table of Contents
Table of Contents
Acknowledgments ...................................................................... II
Foreword ................................................................................. III
Chapter 1: Tropical reservoir fisheries. ........................................ 1
Chapter 2: Physical, sociological and fishery aspects of Lake Kainji, Nigeria. .................................................
41
Chapter 3: Changes in the fish fauna of a reservoir fishery (Lake Kainji, Nigeria) determined using commercial catch data and sampling using differing mesh-sized gill nets. ...............................................
99
Chapter 4: Estimation of population parameters for the six commercial species in Lake Kainji, Nigeria using length frequency data sampled from artisanal fish catches. .............................................
126
Chapter 5: Gaining a quick overview of the Lake Kainji fishery, Nigeria: the use of length frequency data. ........ 156
Chapter 6: The changing fishery of Lake Kainji, Nigeria from impoundment to some 30 years after. ........................
180
Chapter 7: Data collection in a reservoir fishery (Lake Kainji, Nigeria); the trade-off between cost and accuracy. ......................................................
229
Chapter 8: Co-management in reservoir fisheries: Lake Kainji, Nigeria- a case study. ............................
262
Abbreviations ......................................................................... 310
Glossary ............................................................................... 312 Standard conversion factors ....................................................... 319 Internet addresses associated with reservoir fisheries ..................... 320 Lake Kainji showing the location of fishing villages ......................... 321 Images of Lake Kainji ............................................................... 322
Page:

Acknowledgements
Acknowledgments
I would like to thank the following people who have contributed to this thesis:
The Strasser Foundation, Jersey for their generosity in part-funding this thesis.
Professor George Turner, Supervisor of the PhD, Hull University for his practical approach to fisheries management and much valued discussion and support.
Mrs. Marina Mdaihli, GTZ Team Leader, Nigeria for her kindness during the seven years I spent in Nigeria and recognition for the need of fisheries monitoring and evaluation.
Dr. J. S. 0. Ayeni, Director of the National Institute for Fresh water Fisheries
Research (NIFFR), Nigeria who made me feel part of the Institute and supported the research with resources and staff and whose advice of how to work effectively in Nigeria was of great value.
To all staff from NIFFR and Niger and Kebbi State Fisheries Department. Especially Dr. Moses Ibeun, Librarian, NIFFR and the many project counterpart officers who gave their advice, help and friendship.
To the late Emir of Borgu Alhaji Mohammed Kigera III and the Emirs of Kontagora
and Yauri whose support and understanding of the fisherfolk and their families
made working around the lake extremely rewarding and always a pleasure.
And finally to all the Village Heads, Traditional Leaders and fisherfolk who depend on the lake's resources and whose co-operation, discussions and humour made the writing of this thesis a small commitment on my part.
Page: 11
Foreword
Foreword
One of most widespread and long-lasting impacts caused by man to riverine
systems is the creation of areas of artificial still water in places where only rivers or
marshland previously existed. Household ponds and small reservoirs have been
constructed for more than five millennia to provide water for the homestead,
livestock or crops and, particularly within Asia, as a means by which fish can be
reared for home consumption or sale (Petrere, 1996).
In many countries, the 1950s witnessed an increase in industrial activity that was accompanied by a population drift from rural areas into urban centers. For developing countries in the tropics, this transition was more marked than that
of temperate zones. To feed expanding populations, as well as to boost export
earnings from crops, governments encouraged farming over longer seasons and increased areas. This was undertaken through irrigation, drainage or by limiting
the seasonal loss of land from flooding.
Increased electricity production, both for domestic and industrial use, was also needed both by the larger population and enhanced industrial activity. The high
rainfall, large-volume rivers and extensive areas of available land that often could be flooded without controversy in tropical countries caused planners to look to the
creation of reservoirs both for irrigation/ flood control and the generation of electricity. The construction of small-sized domestic reservoirs was quickly overtaken by the building of larger impoundments; the size of which was unmatched within temperate countries. The largest examples are in Africa where the reservoirs are mainly used for hydroelectric generation. In Asia reservoir construction started around the same time, however, these were generally of smaller size.
In 1998, there were an estimated 63,000 large reservoirs (volume greater than 0.1 km3) in the world having a combined water surface area of some 400,000 km2 ([COLD, 1998). Approximately 60% of the world's large river basins are moderately or highly fragmented by dams (WCD, 2000).
Page: III

Foreword
Large reservoirs have rarely been built solely for fish production (De Silva & Amarasinghe, 1996). Furthermore, fish production has often seldom
received the consideration it deserves (for fish supply and employment in rural
areas) by planners, designers and managers who have priorotised objectives of
water use or electricity generation.
After flooding the displaced indigenous fisherfolk, who possessed fishing methods
and knowledge suited to river or swamp fisheries, had rapidly to become
accustomed to the new lake fishery. In many cases, the authorities provided only token assistance and often fisherfolk had to rely on experimentation and through
interaction with the migrant fisherfolk who had fished in lakes elsewhere. The lack
of consultation and assistance during reservoir design and building, as well as for
the fishery, has sometimes caused fisherfolk to consider the lake as being outside
their ownership and control. Further, traditional fishery regulations that were often
used to manage the river fishery were often unsuited to the new lake environment
and were therefore not used. The lack of governmental or traditional intervention
has meant that fisheries in tropical reservoirs have largely remained open access
with few restrictions being placed on gear types or mesh sizes used.
Despite this lack of commitment, there is a growing reliance on inland fisheries to
supply cheap protein to fill the shortfall in per capita intake and as a source of
employment in rural areas (Fernando & Petr, 1994; Sugunan, 1997).
The world population is set to increase from six billion to between 7.8 and
10.9 billion by 2025 (UNEP, 2001). Almost all of the increase is projected to come
from Africa, Asia and Latin America. In the fisheries sector, it is forecast that by
2025 an additional 62 million tonnes of aquatic products will be required annually
to maintain the present 19.1 kg per capita intake (Fernando & Petr, 1994).
Many managers of reservoir fisheries are presently unaware of just how the
required increase in fish production and safeguard of employment might be
achieved.
Page: IV
Foreword
The increasing fishing effort and outside pressure on the reservoir resources
means that the past 'laissez-faire' management approach is no longer effective. Managers are frequently faced with reservoir fisheries that suffer from declining
yields and poor budget allocation from central government. Pressure groups and
recently formed regional networks of dam activists have highlighted environmental
and social concerns of reservoir projects and this has caused delay in their
construction. Just how these concerns can be married to the urgent need for water
and fish protein in developing countries will cause much future debate.
To appreciate the dynamics of reservoir fisheries and to identify common links,
lessons and ways forward, there is a need for researchers to collate and analyse
all available information. Reservoirs that have the benefit of a long time series of documentation will support this approach and assist our understanding through the
examination of the development of 'case' fisheries. Lake Kainji in Nigeria has been
studied since its impoundment in 1968 and is well placed to be such a case fishery. This thesis is based on the re-analysis of the research that was
undertaken as part of the collaboration between Nigerian and UK Universities
(1965 to 1978), the FAO/UNDP assisted Kainji Lake Research Project (1968 to 1974), the Kainji Lake Research Institute (1975 to 1987) and the National Institute for Fresh water Fisheries Research (1987 to 2001). The majority of the thesis is, however, based on data collected by the author during his work as the Fisheries Resource Adviser for the Nigerian-German (GTZ) Kainji Lake Fisheries Promotion Project (KLFPP) between 1993 and 2000.
In the first chapter, I undertake a review of reservoir fisheries in tropical countries. The purpose is to 'set the stage' for the subsequent chapters on Lake Kainji and to
give the reader an understanding of the common developments, issues and problems relating to fisheries in tropical reservoirs.
An important question that I attempt to answer, especially considering the forecast
population increases, is to what extent can reservoir fisheries contribute in solving the anticipated future shortfall of fish protein? Using available information, I have
estimated that the current yield of tropical reservoirs is between 2.2 and 5.8 million t yr '.
Page: V

Foreword
I attempt to assess how yields can be maximised from existing reservoirs. Adaptations in reservoir design, such as control of water flow and drawdown, and fishery enhancement techniques such as fish introductions, stocking or
aquaculture, can result in higher yields. In Asia, enhancement practices are well developed. Yields in reservoirs in Africa and South America can theoretically be
increased by transferring similar enhancement techniques. Many of the Chinese
practices are environmentally unsound. However, if such a transfere were
possible, I estimate that an extra 3.9 million t yr ' might be harvested (6% of the
global shortfall of fish forecast by Fernando & Petr, 1994).
Lake Kainji is one of the most studied reservoirs in Africa and is one of the few that has benefited from a recent program of research. In Chapter Two, I catalogue the
research activities undertaken on the reservoir from before its impoundment in
1968 to some thirty years after. I endeavour to introduce the reader to the
reservoir environment by providing descriptions of the area, the hydrology, flood
regimes, social aspects, fish assemblages and the fishery.
In Chapter Three, the data obtained during gill net sampling of Lake Kainji that took place over a 30 year period are used to describe the changes in the fish
assemblages, mean fish size and trophic levels of catch that occurred as the
aquatic environment and fishery changed from river to lake. The large, but brief,
post impoundment boom was dominated by the Citharinidae, after which abundance and mean fish size quickly declined.
In Chapter Four, I use length frequency data collected from fisherfolk's catches some 30 years after impoundment to estimate the population parameters of the five main commercial species in Lake Kainji. The parameters are plotted onto length frequency graphs in Chapter Five to portray the general pattern of exploitation of these species. Most fish captured were from the first-year cohort and were caught at a size far below their length of maturity and optimal length at capture. The situation implies growth overfishing, suggesting the need for management intervention.
Page: VI

Foreword
A broader perspective is taken in Chapter Six, to describe the development of the
Lake Kainji fishery from pre-impoundment to immediate post-impoundment (when
fisherfolk mainly used large-meshed gill nets), through to the highly diversified and
productive fishery that existed some thirty years later. Following the post impoundment boom in fish catch, yields declined and remained depressed for a
number of years. However, yields have since bounced-back to levels in excess of the first boom period. The main reason was the diversification of fishing methods
used and fish species caught, and in particular, the development of a productive beach seine fishery targeting the pelagic Clupeidae. This suggests that riverine
endemic clupeids are able to support a productive fishery, unlike reservoirs
elsewhere that have relied on species originating from natural lakes. 'Overall,
results indicate increased fishing effort for all gears and a high use of those gears targeting small-sized fish. Fish yield is declining and this further supports the need for management.
The general lack of available data sets and descriptions of fisheries for reservoirs that can be compared with Lake Kainji is partly due to the expensive and complex nature of data collection from reservoir fisheries that are often highly diverse and fragmented (Sugunan, 1997). In Chapter Seven, I therefore endeavor to use the
six years of annual counts of gears (frame survey) and sampling of catch and effort data (catch assessment survey) from Lake Kainji to examine methods by
which the cost of data collection can be reduced, whilst still maintaining reasonable levels of accuracy.
A conclusion, brought about by the spatial diversification of the fishery, is that
greater accuracy may be achieved, and perhaps the number of sampling days
reduced, by sampling many stations. Considering the trade off between accuracy and cost, the minimum sampling intensity, using the current 15 sampling stations, for Lake Kainji was found to be two days sampling (each separated by at least one week) per station per month. This gave an overall sampling intensity of 0.5% of the fishing entrepreneurs for fishing activity and 0.25% for fish catch. A biannual frame survey may also be considered if the annual estimates of gear numbers stabilises.
Page: VII
Foreword
In the final chapter, I consider the lessons learnt and results achieved during the
development and implementation of a fisheries plan for Lake Kainji using
community-based management. Two management measures; a licensing scheme
for fisherfolk and a ban on beach seine fishing are detailed. The Lake Kainji
example is compared with other community-based management approaches in
inland fisheries.
The Lake Kainji example highlighted that the community did not possess all the
political, legal and enforcement capabilities required for full and effective
management of the resource. A system of co-management involving the State
Fisheries Departments, the Traditional Authorities and the fisherfolk was therefore
established.
Underlying questions are whether fisherfolk in reservoirs are able to forgo
individual aspirations and goals to work towards those of the community as a
whole. Complications are the pressing needs of rural folk that often have to be
'solved by oneself today', rather than shared with all tomorrow. The communities living around Lake Kainji were diverse and included numerous immigrant
fisherfolk. These groups were unable to work cohesively together. Despite
extensive discussion, enlightenment and some co-operation of the fisherfolk, the
co-management approach could not enforce all aspects of the management plan
and top-down enforcement by Police units had finally to be used. The government faced similar problems of maintaining logistic and finance necessary for
co-management as they had experienced during the top-down approach of
management.
It is anticipated that by portraying the development of a typical reservoir such as Lake Kainji that the understanding of the fish resource, the fishery and its
management in tropical reservoir fisheries might be increased. Given the need for
such reservoirs to safeguard the future supply of fish protein and employment in
rural areas, this knowledge must ultimately be linked to the sustained or increased
well-being of the lakeside communities. This is a challenge, that I hope the thesis has contributed towards.
Page: VIII

Foreword
REFERENCES
De Silva, S. S. and Amarasinghe, U. S. (1996). Reservoir fisheries in Asia.
In: Perspectives in Asian Fisheries. A volume to commemorate the
10th Anniversary of the Asian Fisheries Society, S. S. De Silva ed. Asian
Fisheries Society, Manila: 189-216.
Fernando, H. and Petr, T. (1994). Reservoir fishery management and tropical limnology. International Revue Gesamten Hydrobiology. 79, (1): 3-5.
ICOLD. (1998). World register of dams 1998. ICOLD-CIGB, 151 Bd Haussmann, Paris 75008, France.
Petrere, M. (1996). Fisheries in large tropical reservoirs in South America. Lakes and Reservoirs, Research and Management. 2: 111-133.
Sugunan, V. V. (1997). Fisheries management of small water bodies in seven
countries in Africa, Asia and Latin America, FAO Fisheries Circular.
No. 933 FIRI/C933.
UNEP. (2002). Global Environment Outlook 3, UNEP, Earthscan Publications. Ltd, London, ISBN: 1853 8384 54.416pp.
ISBN 1 85383 798 9. WCD (World Commission on Dams). (2000). Dams and development: a new framework for decision making. Published by Earthscan Publications Ltd.
Page: IX
Chapter 1
Chapter 1
Tropical reservoir fisheries.
ABSTRACT
Global demand for fish continues to rise, while most major marine stocks are believed to be exploited to maximum capacity or beyond. By 1998, there were an estimated 63,000 large reservoirs having a total surface area of 400,000 km2 as well as numerous smaller dams throughout the world. Construction of reservoirs, mainly for hydroelectricity or irrigation continues, particularly in the developing world. This provides an opportunity to
expand yields of capture fisheries. I estimate' that tropical reservoir fisheries presently yield between 2.2 to 5.8 million t yr' and ask whether they are likely to play a major role in helping to alleviate the expected shortfall of fish protein and to safeguard employment within rural areas. The review examines the development of reservoir fisheries in the tropics. In some reservoirs, there has been evidence of a replacement of riverine fish
assemblages by communities dominated by lake-adapted forms, such as carps, tilapias
and clupeids. In the aftermath of impoundment, some reservoirs have undergone a boom in productivity as decay of terrestrial vegetation has contributed to increased primary production, although in others this has led to deoxygenation and fish kills. Although it had been proposed that reservoir fisheries would then stabilise at relatively low levels after the boom, it appears that fish yield may often increase over time as reservoir ecosystems mature and as the fishery diversifies. Smaller reservoirs generally have higher yields per unit area than larger ones. It is possible that the potential of the larger reservoirs is as yet unfulfilled. Fishery enhancement measures such as the introduction of new species, stocking and cage culture have had some successes. Management of over-exploitation has generally been no more successful than in other types of fisheries. Community-based
management has been successful in a few cases where a homogeneous population has property rights over a small water body. For larger reservoirs, the problems of common- pool resource management may be exacerbated by issues such as the presence of immigrant fisherfolk, and the disruption of traditional community structures following displacement of populations resulting from reservoir construction.
Keywords: artisanal fisheries, fishery management, fish yields, inland fisheries, tropical reservoirs.
Page: 1
Chapter 1
INTRODUCTION
In 1998, there were an estimated 63,000 large reservoirs', having a combined
water surface area of 400,000 km2 and a volume of 6,500 km3 in the world
(Avakyan & lakovleva, 1998). In addition there are numerous smaller sized
impoundments. De Silva & Amarasinghe (1996) calculated that reservoirs
accounted for 40% of the total area of inland water in the world.
Vorosmarty of al. (1997) estimated that the total volume of reservoirs in the world
was approximately seven times greater than the volume of water in rivers.
The WCD (2000) noted that around 60% of the world's largest rivers have been
moderately or heavily fragmented by dams. An estimated 40 to 80 million people
throughout the world, consisting mostly of the poorest and most marginalized
segments of society, have been resettled through the construction of reservoirs
(Avakyan & lakovleva, 1998). Fisheries have become established within almost all
of these reservoirs. Exploitation and management practices are extremely diverse,
ranging from open access artisanal fisheries in Africa to the intensive stocking and
aquaculture practices of China. In this chapter, I ask if reservoir fisheries can make
a substantial contribution to the meeting the demand for fish of an expanding
human population, and if so, how can this contribution be maximised?
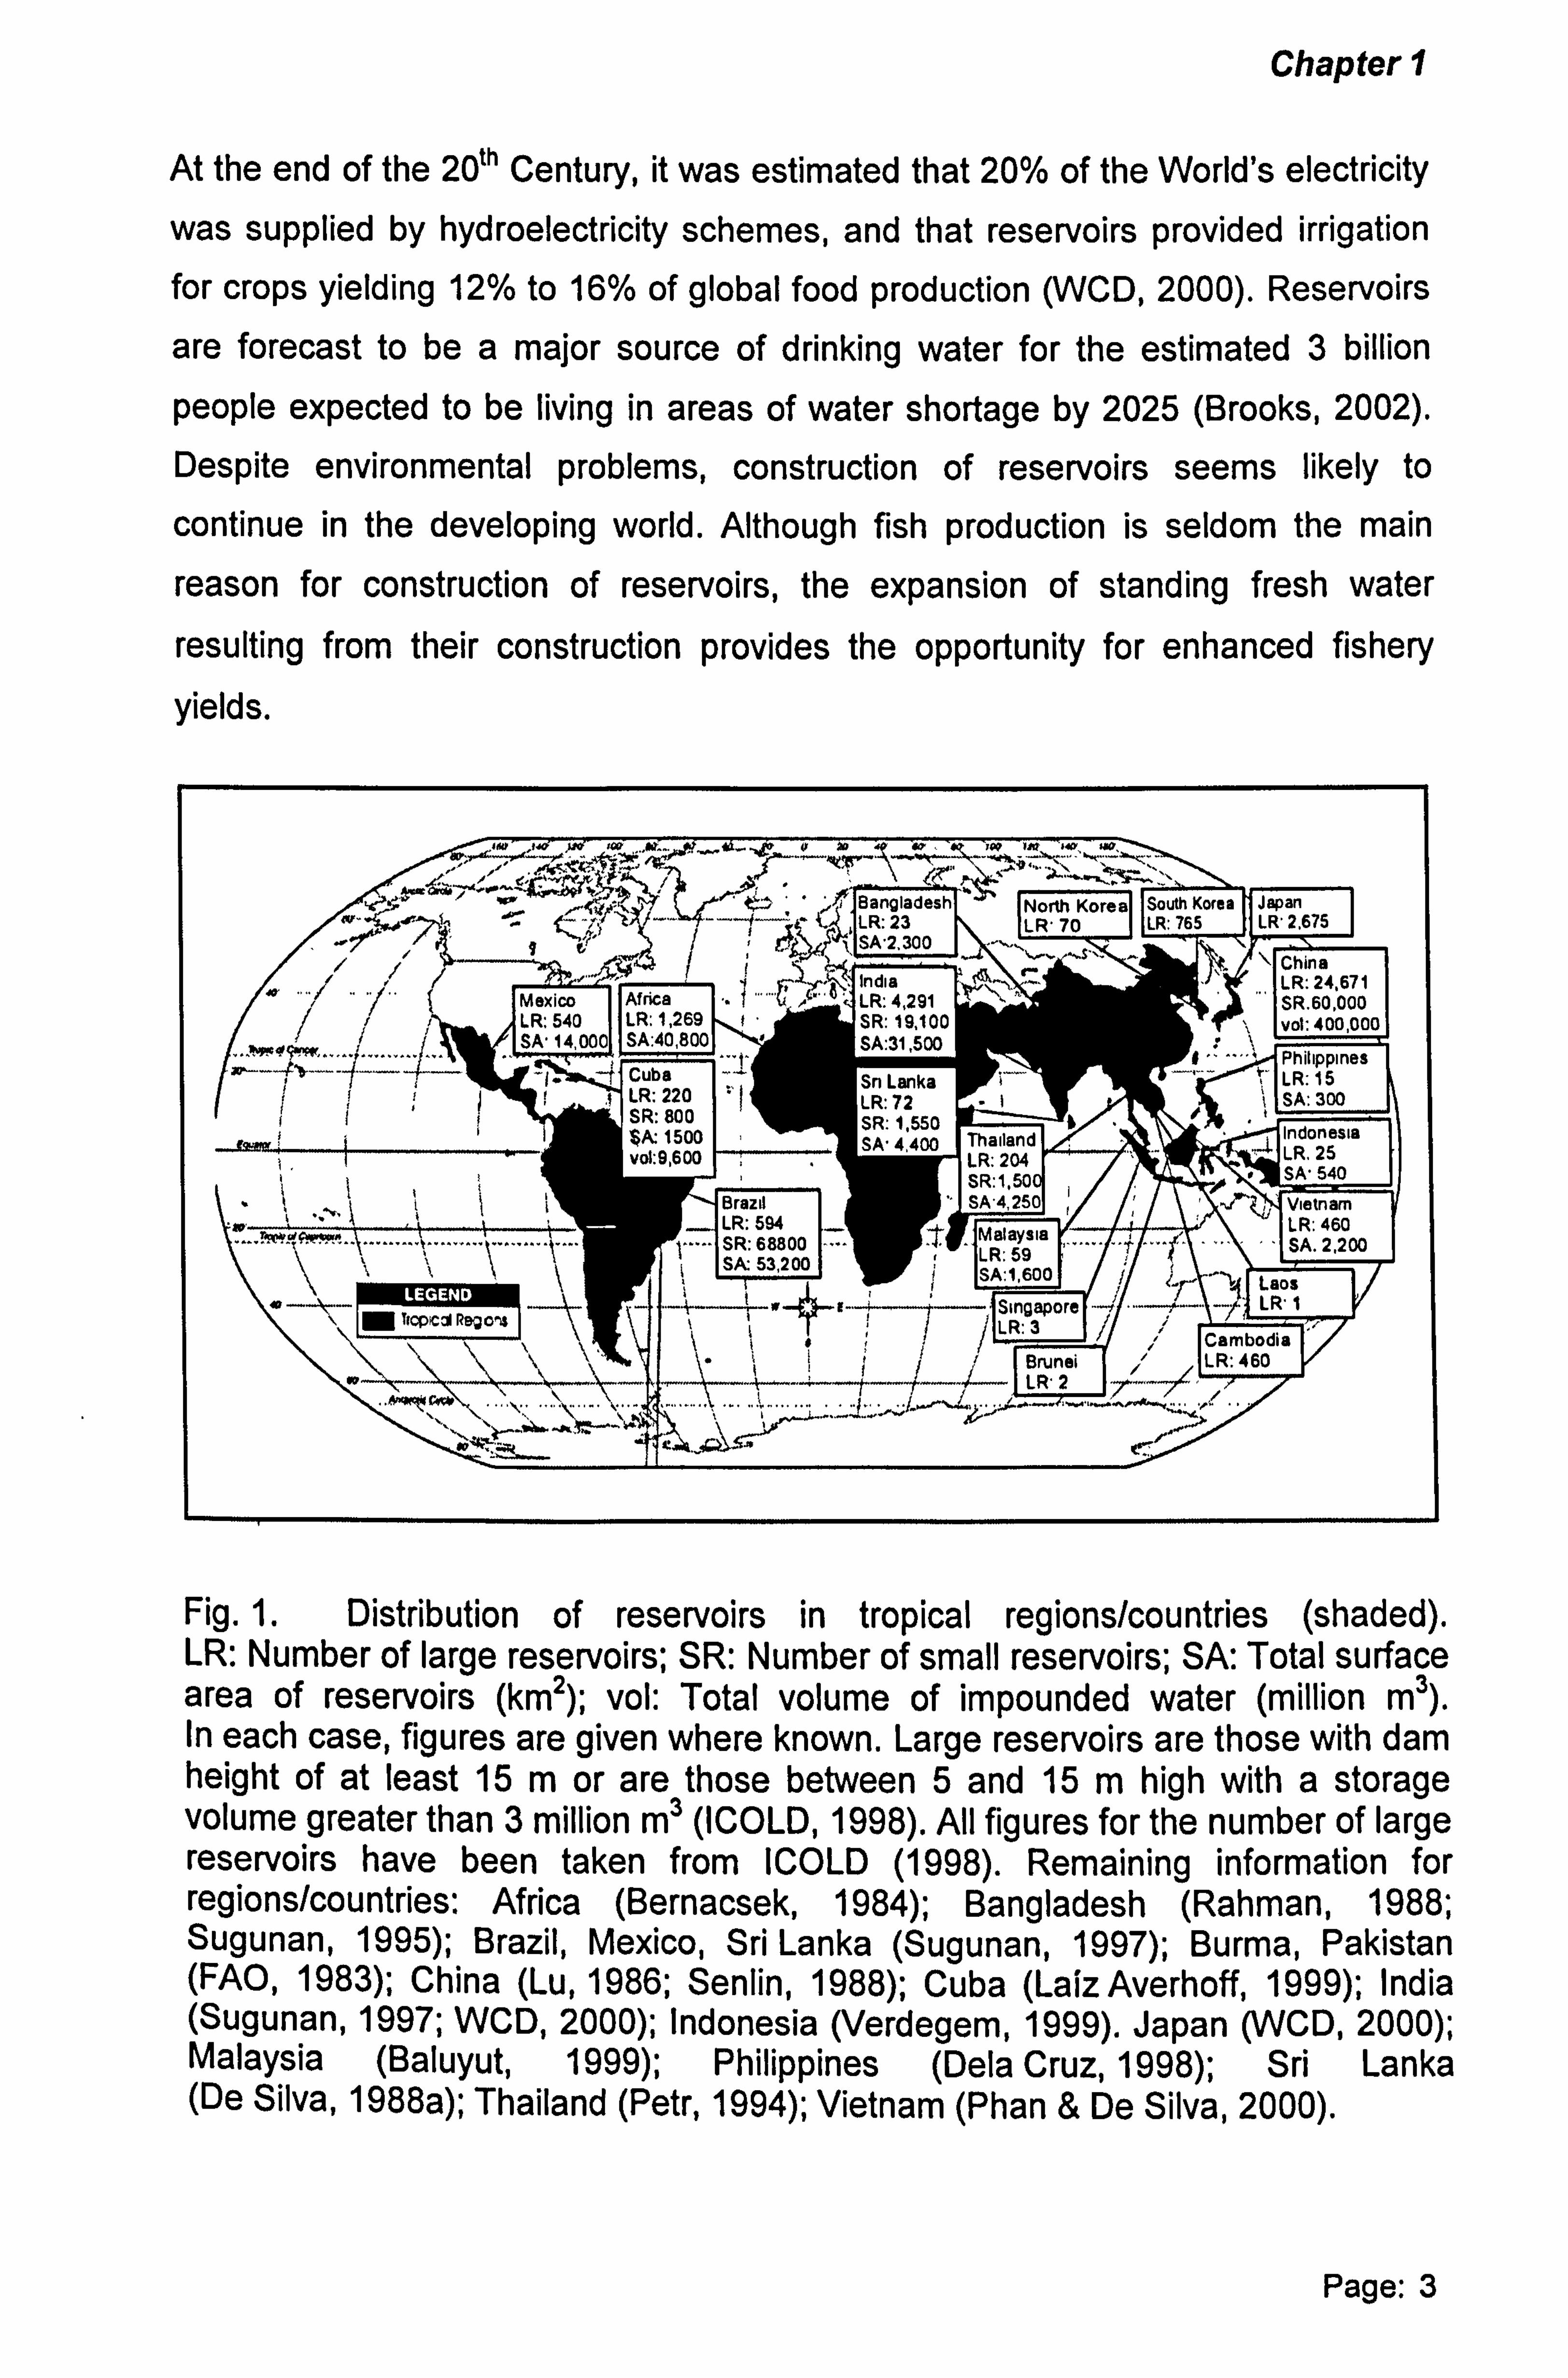
DISTRIBUTION OF RESERVOIRS AND TRENDS IN CONSTRUCTION
The majority of the world's reservoirs occur in the tropics, which account for almost
two-thirds (62%) of the global total volume (ICOLD, 1998). These mainly exist in
Asia, particularly China (Fig. 1). Other countries with high areas of reservoir per
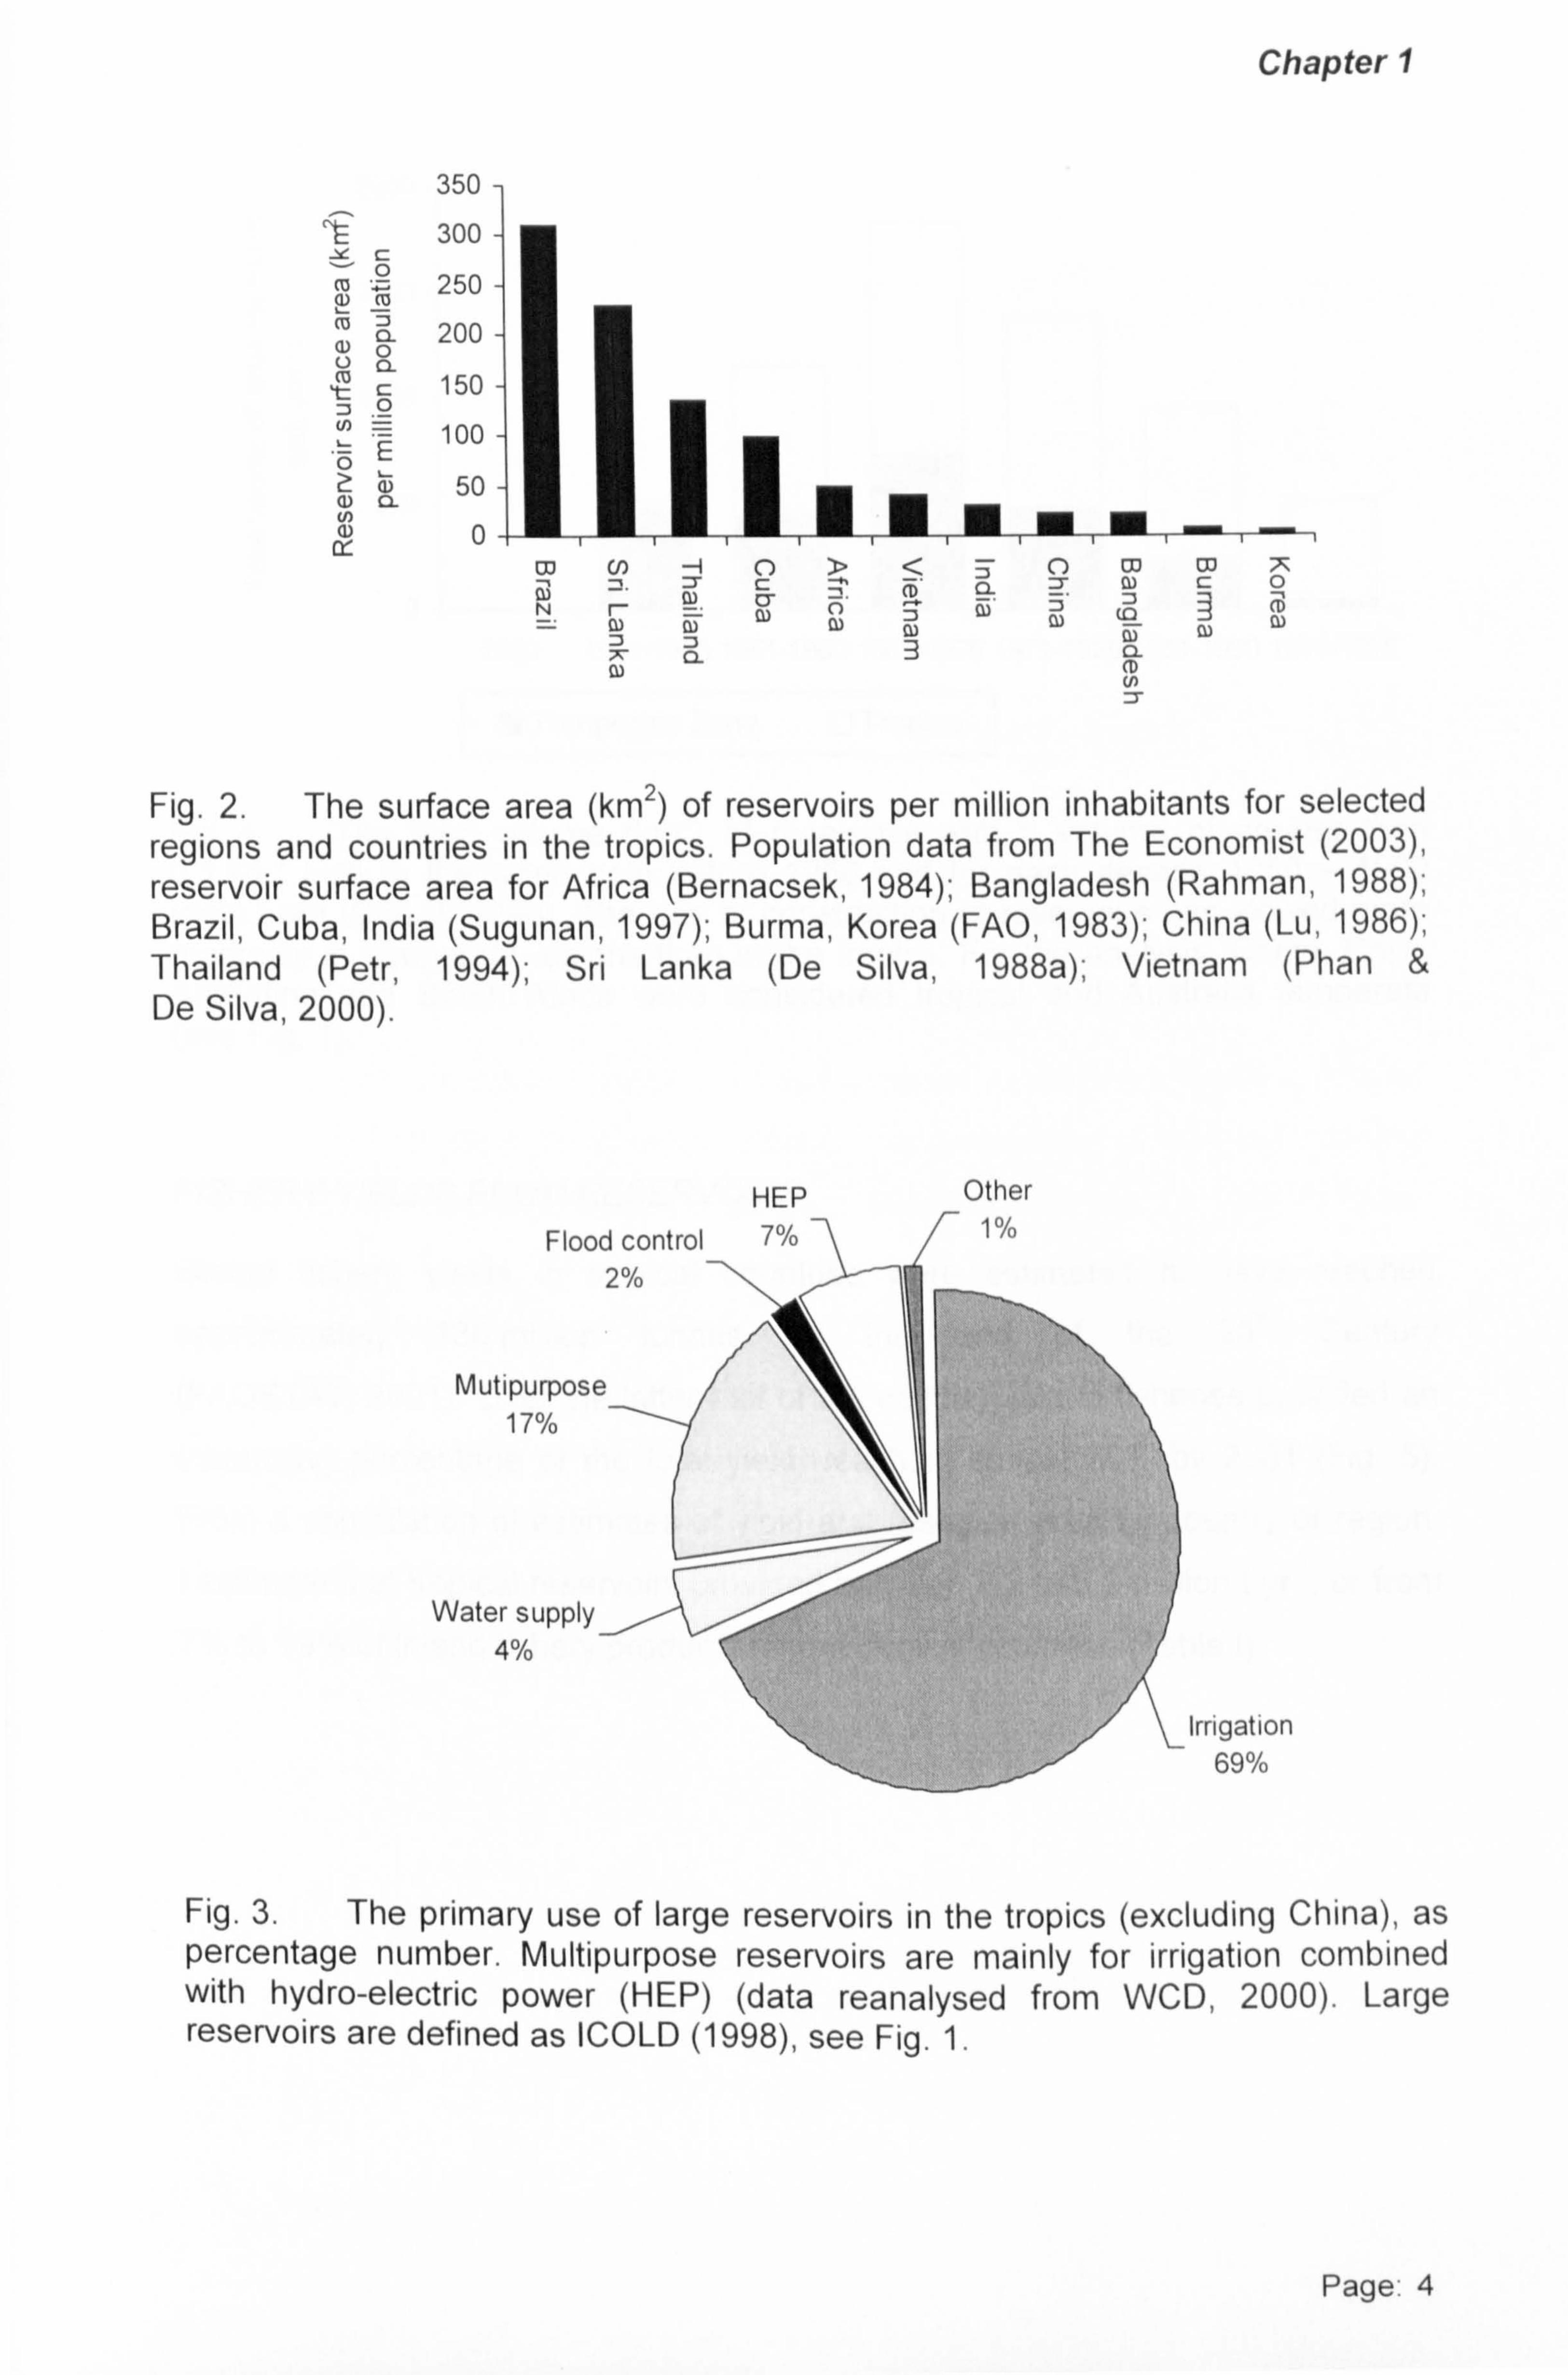
capita population include Brazil, Sri Lanka and Thailand (Fig. 2). Most large
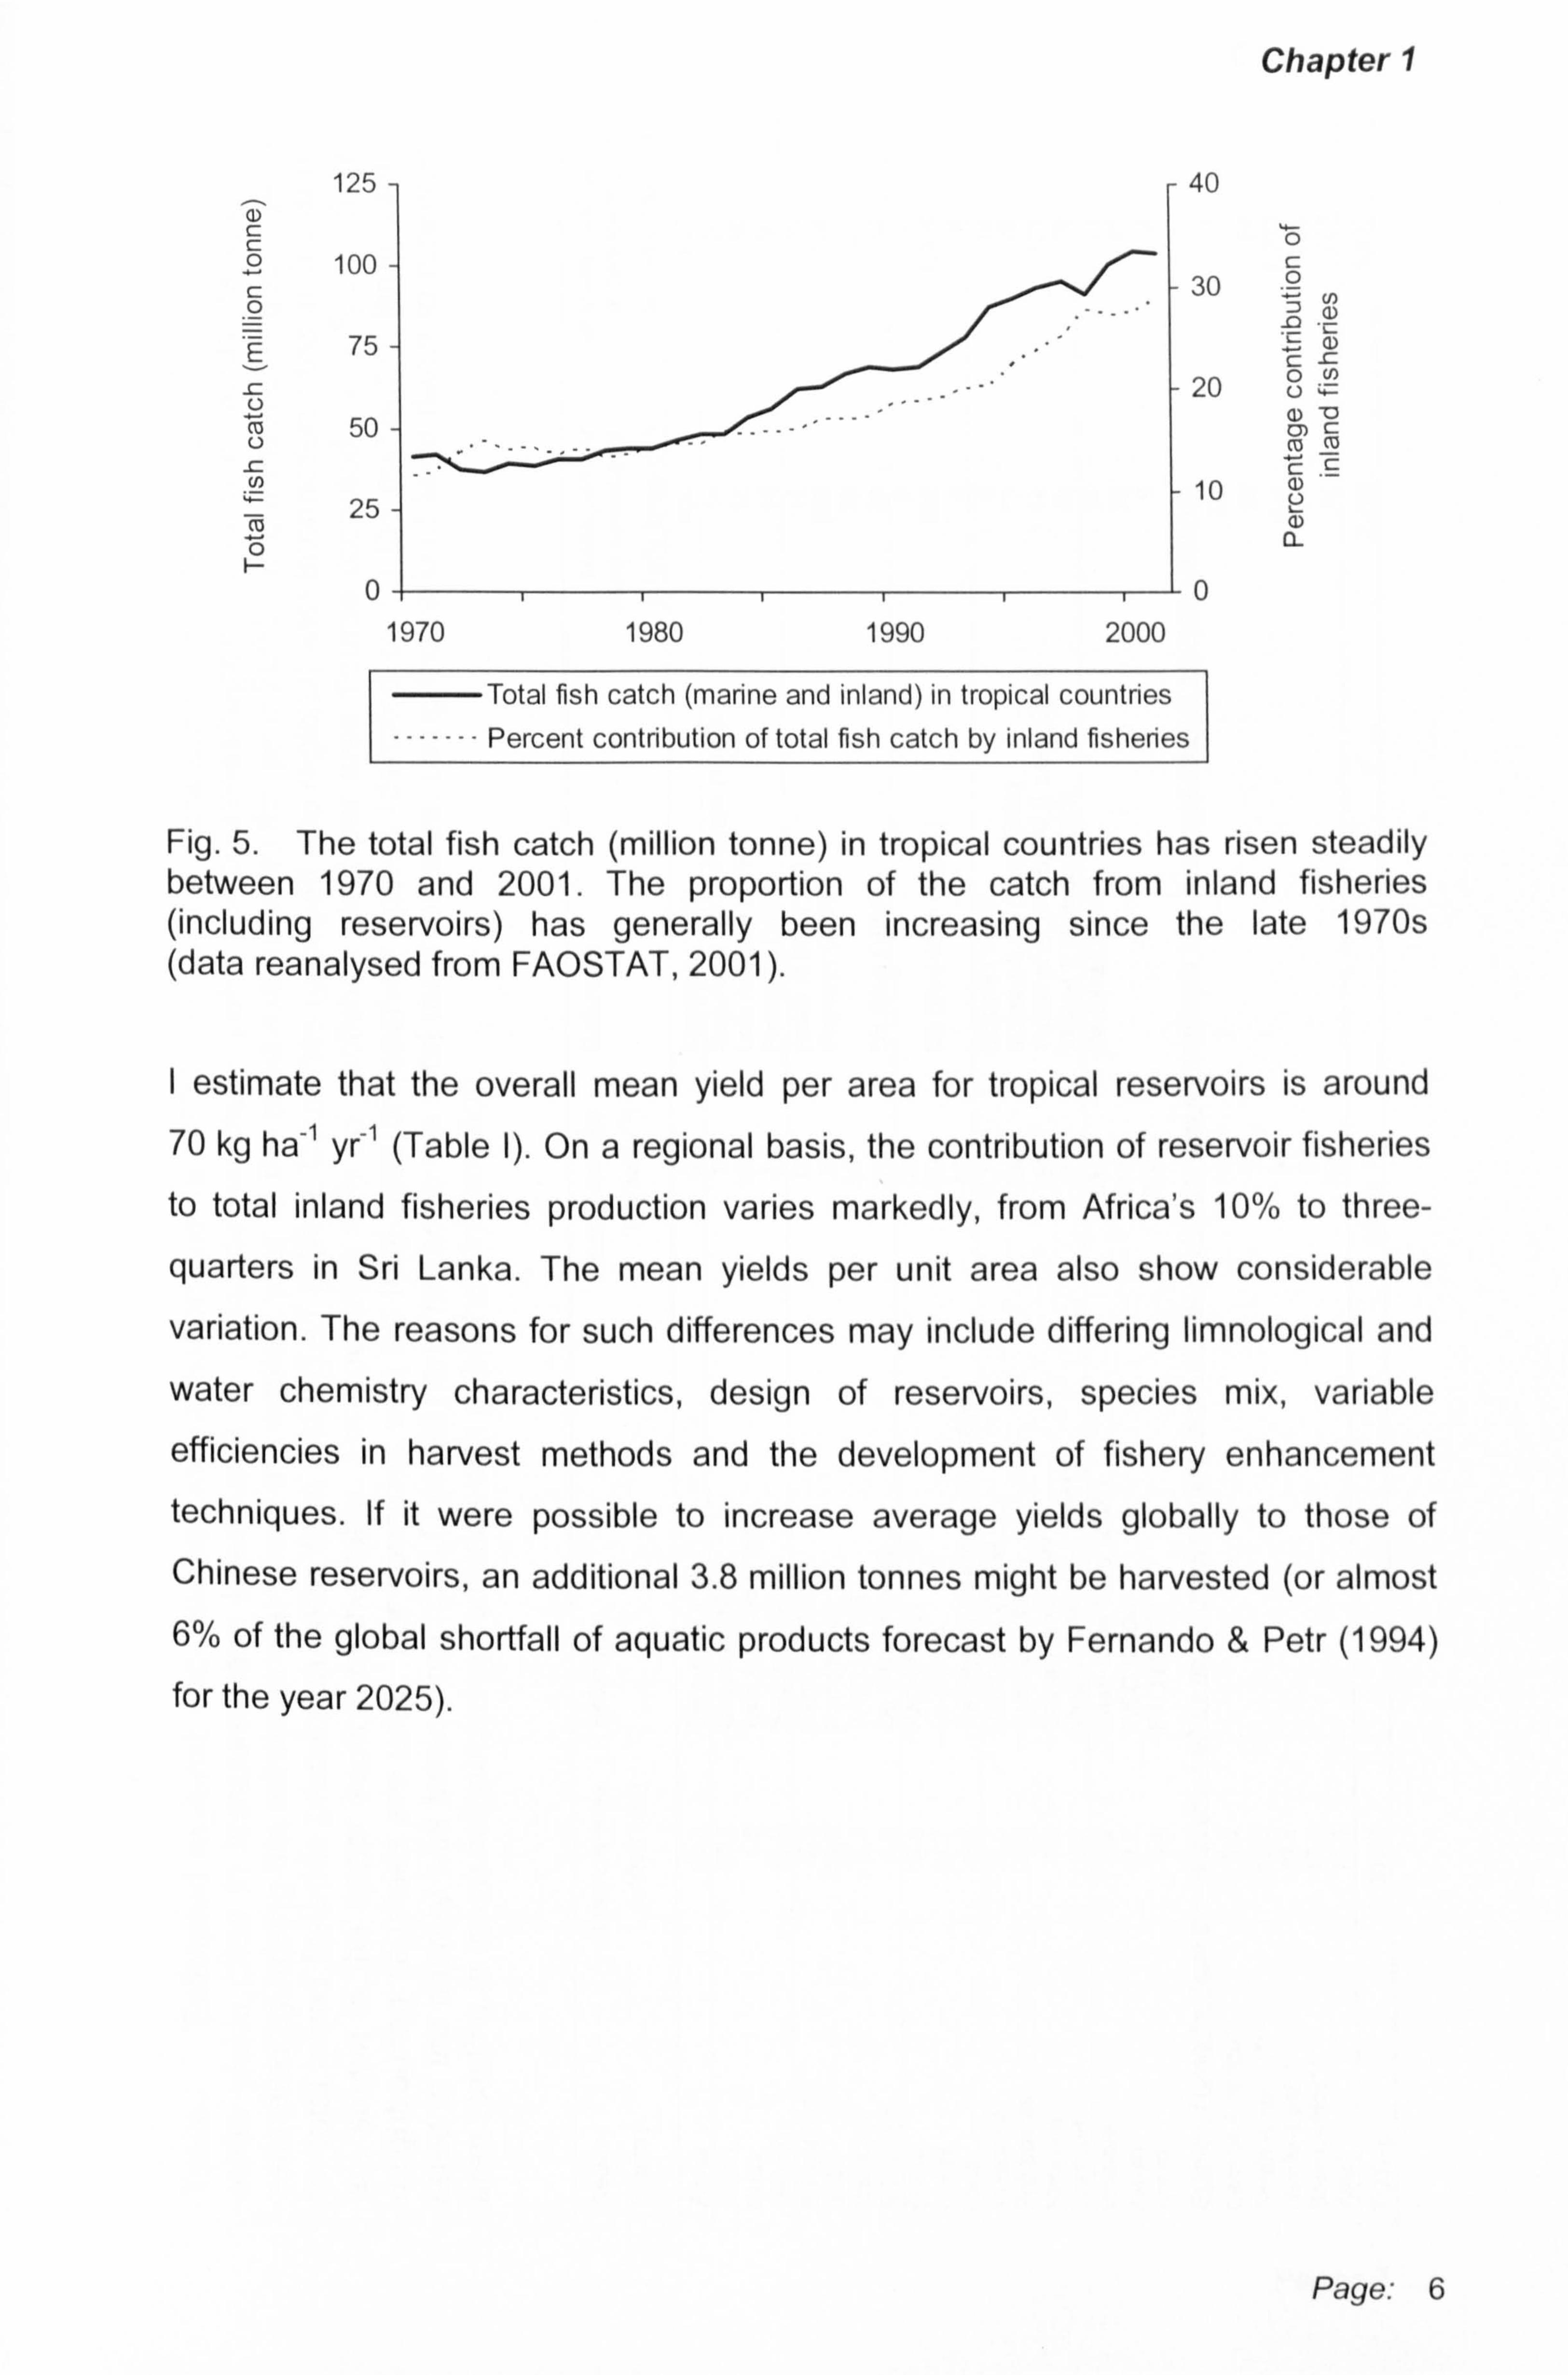
reservoirs are constructed for irrigation or electricity generation (Fig. 3). Reservoir
construction has slowed down since the 1960s peak, but the reduction has been
more marked in temperate than in tropical countries (Fig. 4). Reservoir
construction is still continuing rapidly in the developing economies of Asia and South America. In 2000, China was constructing around 90 dams with walls more than 60 meters high, including the immense 185m high 'Three Gorges Dam' on the Yangtze River (WCD, 2000).
Large reservoirs defined as dams with a height of 15 m or more from the foundation, or dams that are between 5 to 15 m high and have a storage volume greater than 3 million m3. Definition is according to the classification by the International Commission on Large Dams.
Page: 2
Chapter 1
At the end of the 20th Century, it was estimated that 20% of the World's electricity
was supplied by hydroelectricity schemes, and that reservoirs provided irrigation
for crops yielding 12% to 16% of global food production (WCD, 2000). Reservoirs
are forecast to be a major source of drinking water for the estimated 3 billion
people expected to be living in areas of water shortage by 2025 (Brooks, 2002).
Despite environmental problems, construction of reservoirs seems likely to
continue in the developing world. Although fish production is seldom the main
reason for construction of reservoirs, the expansion of standing fresh water
resulting from their construction provides the opportunity for enhanced fishery
yields.
Fig. 1. Distribution of reservoirs in tropical regions/countries (shaded). LR: Number of large reservoirs; SR: Number of small reservoirs; SA: Total surface area of reservoirs (km); vol: Total volume of impounded water (million m3). In each case, figures are given where known. Large reservoirs are those with dam height of at least 15 m or are those between 5 and 15 m high with a storage volume greater than 3 million m3 (ICOLD, 1998). All figures for the number of large reservoirs have been taken from ICOLD (1998). Remaining information for regions/countries: Africa (Bernacsek, 1984); Bangladesh (Rahman, 1988; Sugunan, 1995); Brazil, Mexico, Sri Lanka (Sugunan, 1997); Burma, Pakistan (FAO, 1983); China (Lu, 1986; Senlin, 1988); Cuba (Laiz Averhoff, 1999); India (Sugunan, 1997; WCD, 2000); Indonesia (Verdegem, 1999). Japan (WCD, 2000); Malaysia (Baluyut, 1999); Philippines (Dela Cruz, 1998); Sri Lanka (De Silva, 1988a); Thailand (Petr, 1994); Vietnam (Phan & De Silva, 2000).
Page: 3
Chapter 1
350
It 300 YC
250 ö 200
0o 150
100
2: Q 50
0
Fig. 2. The surface area (km2) of reservoirs per million inhabitants for selected regions and countries in the tropics. Population data from The Economist (2003), reservoir surface area for Africa (Bernacsek, 1984); Bangladesh (Rahman, 1988); Brazil, Cuba, India (Sugunan, 1997); Burma, Korea (FAO, 1983); China (Lu, 1986); Thailand (Petr, 1994); Sri Lanka (De Silva, 1988a); Vietnam (Phan & De Silva, 2000).
Flood control 2%
Mutipurpose 17%
Water supply 4%
HEP Other
7% f 1%
Irrigation 69%
Fig. 3. The primary use of large reservoirs in the tropics (excluding China), as percentage number. Multipurpose reservoirs are mainly for irrigation combined with hydro-electric power (HEP) (data reanalysed from WCD, 2000). Large reservoirs are defined as ICOLD (1998), see Fig. 1.
Page: 4
0o U) - C) >< C) co co T. E3 M. =r c 11)
FD' CL 0 N r- = NN -0v a) CD 0) N
X, ä3a ß) CD
N

Chapter 1
2000 k2 0 Z °' 1500 a>
cý E 1000
0
E -0 500
co ö
0
Fig. 4. The total volume (km3) of reservoirs with a volume of greater than 0.1 km3 built in the world both before 1950 and for each decade 1950 - 1990 (data from ICOLD, 1998). The rate of construction of reservoirs has slowed more markedly in temperate regions than in the tropics. For the analysis, China, Chile, Argentina and South Africa were considered tropical and Australia temperate (see Fig. 1).
FISHERY YIELDS FROM RESERVOIRS
Global fishery yields in tropical countries were estimated to have reached
approximately 130 million tonnes by the end of the 20th Century
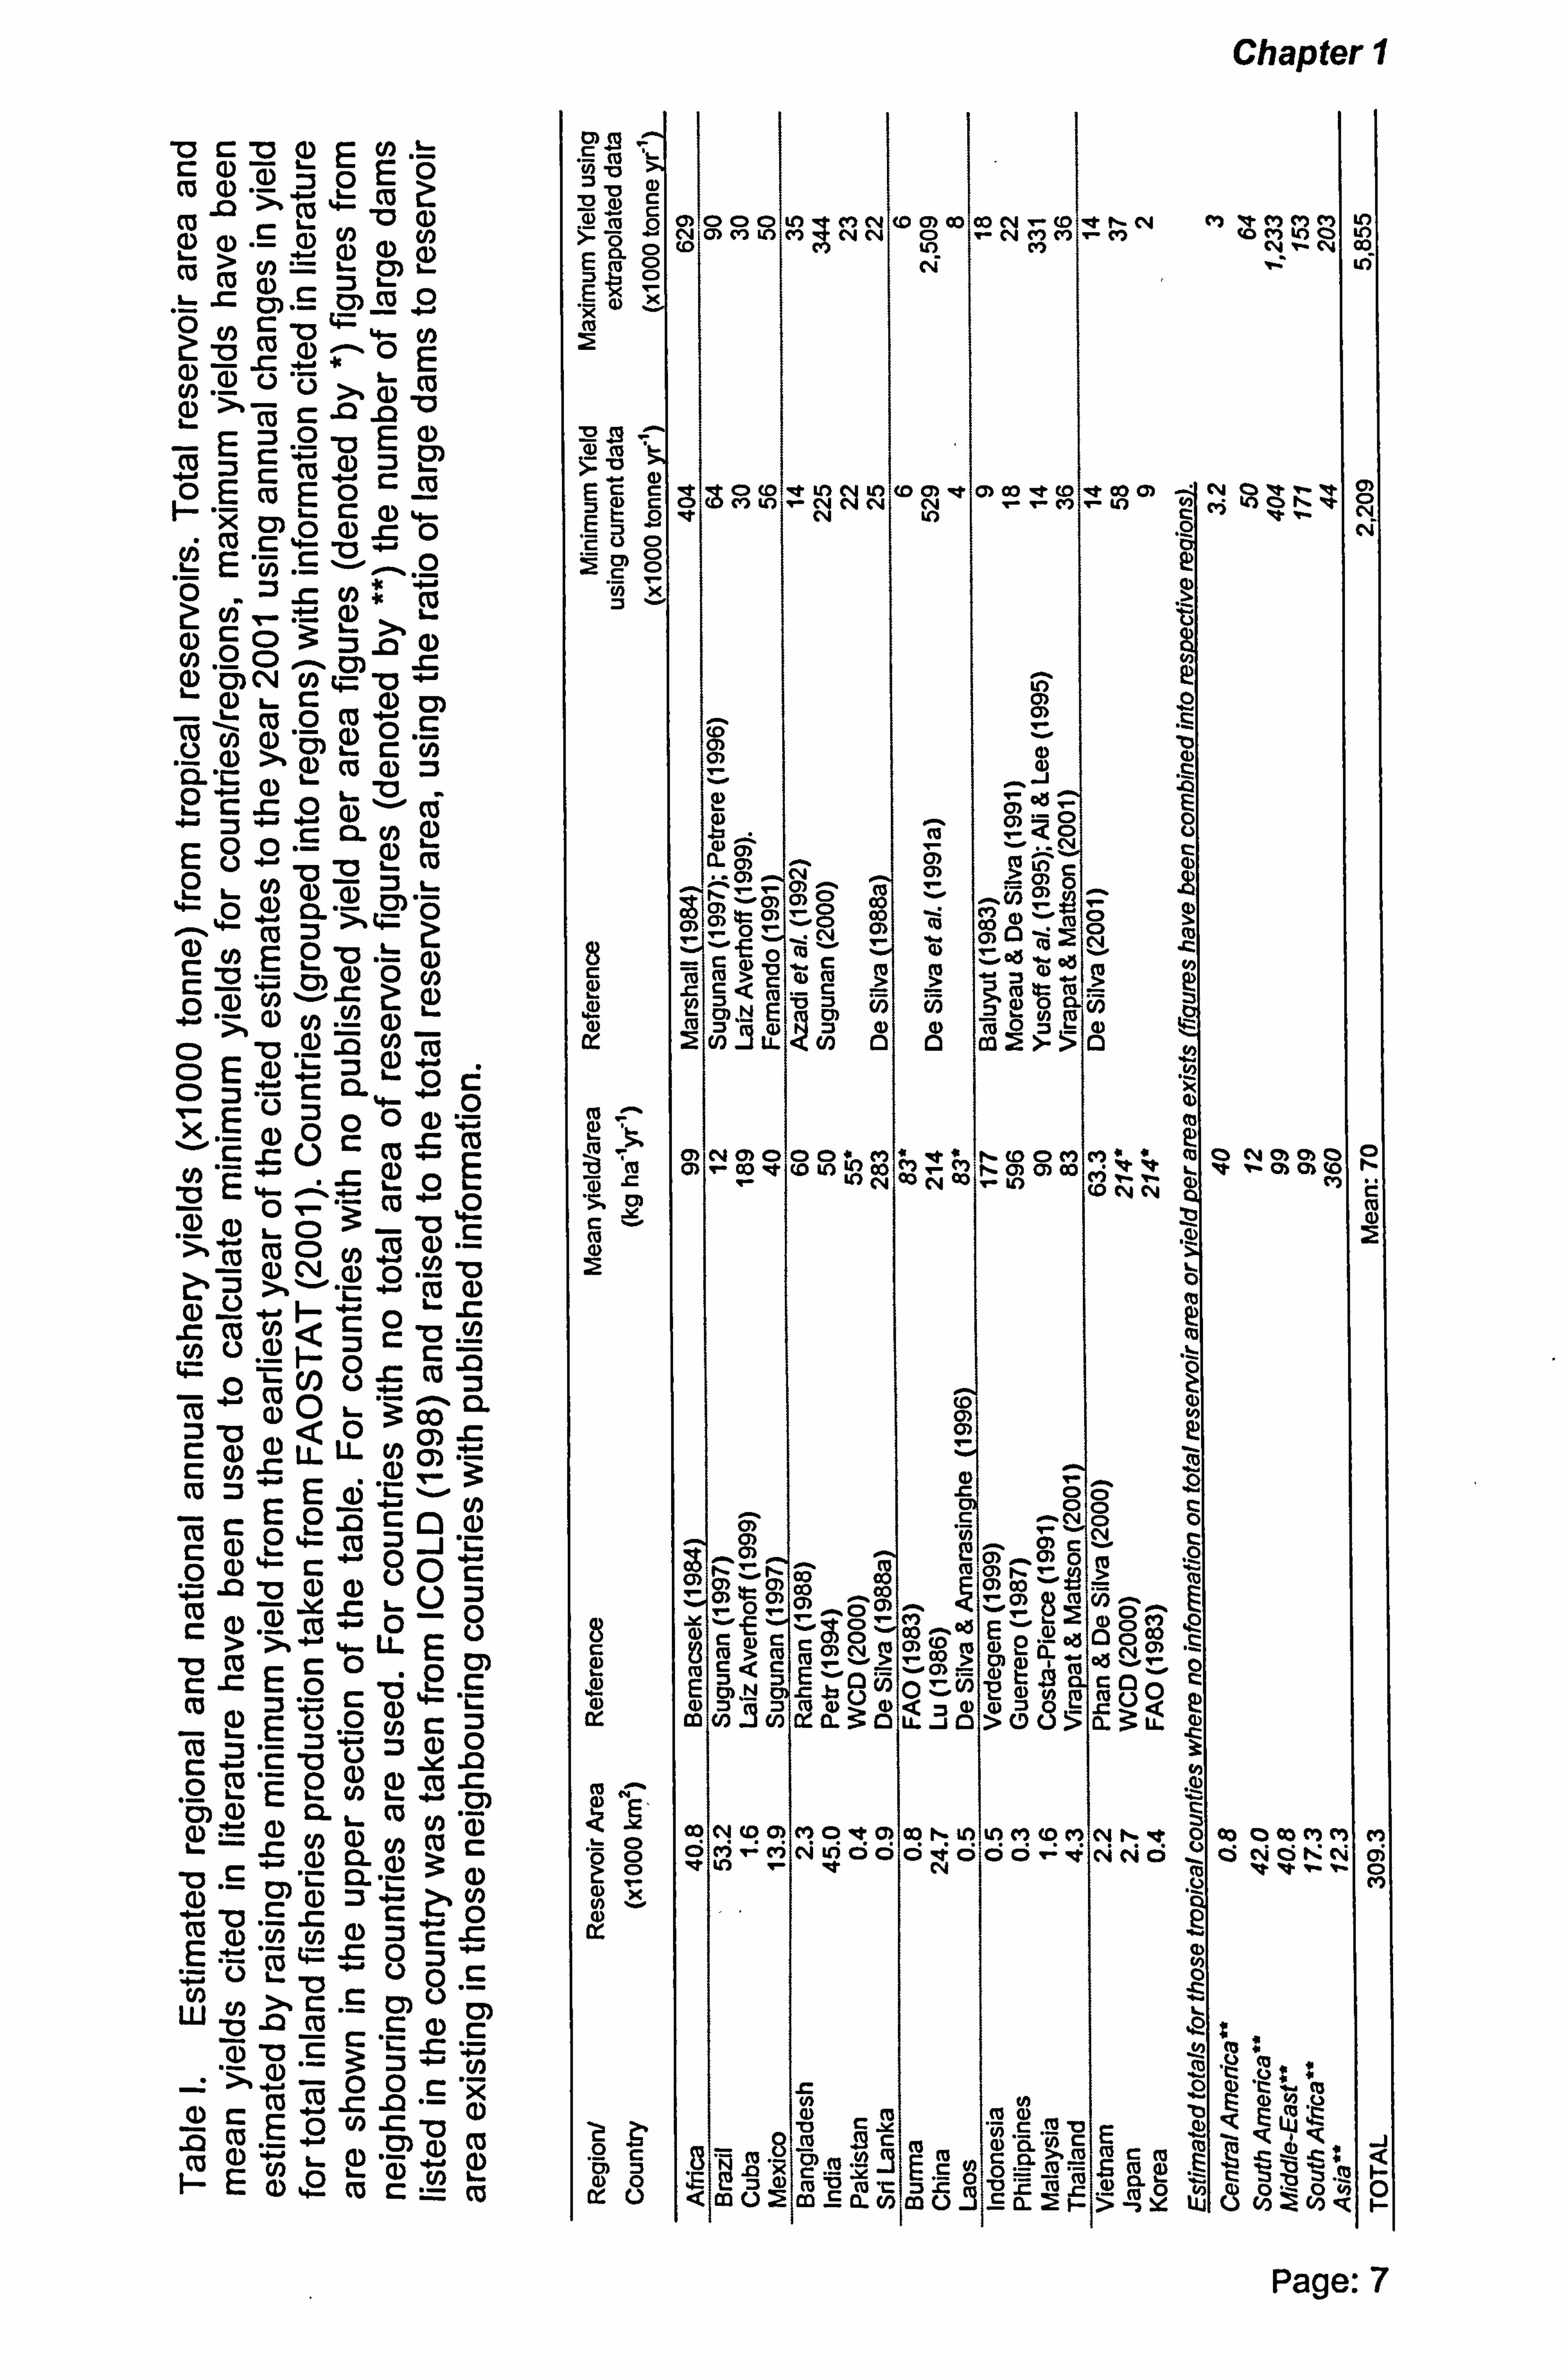
(FAOSTAT, 2001). Over the latter half of the century, inland fisheries provided an increasing percentage of the total yield, reaching almost 30% by 2001 (Fig. 5).
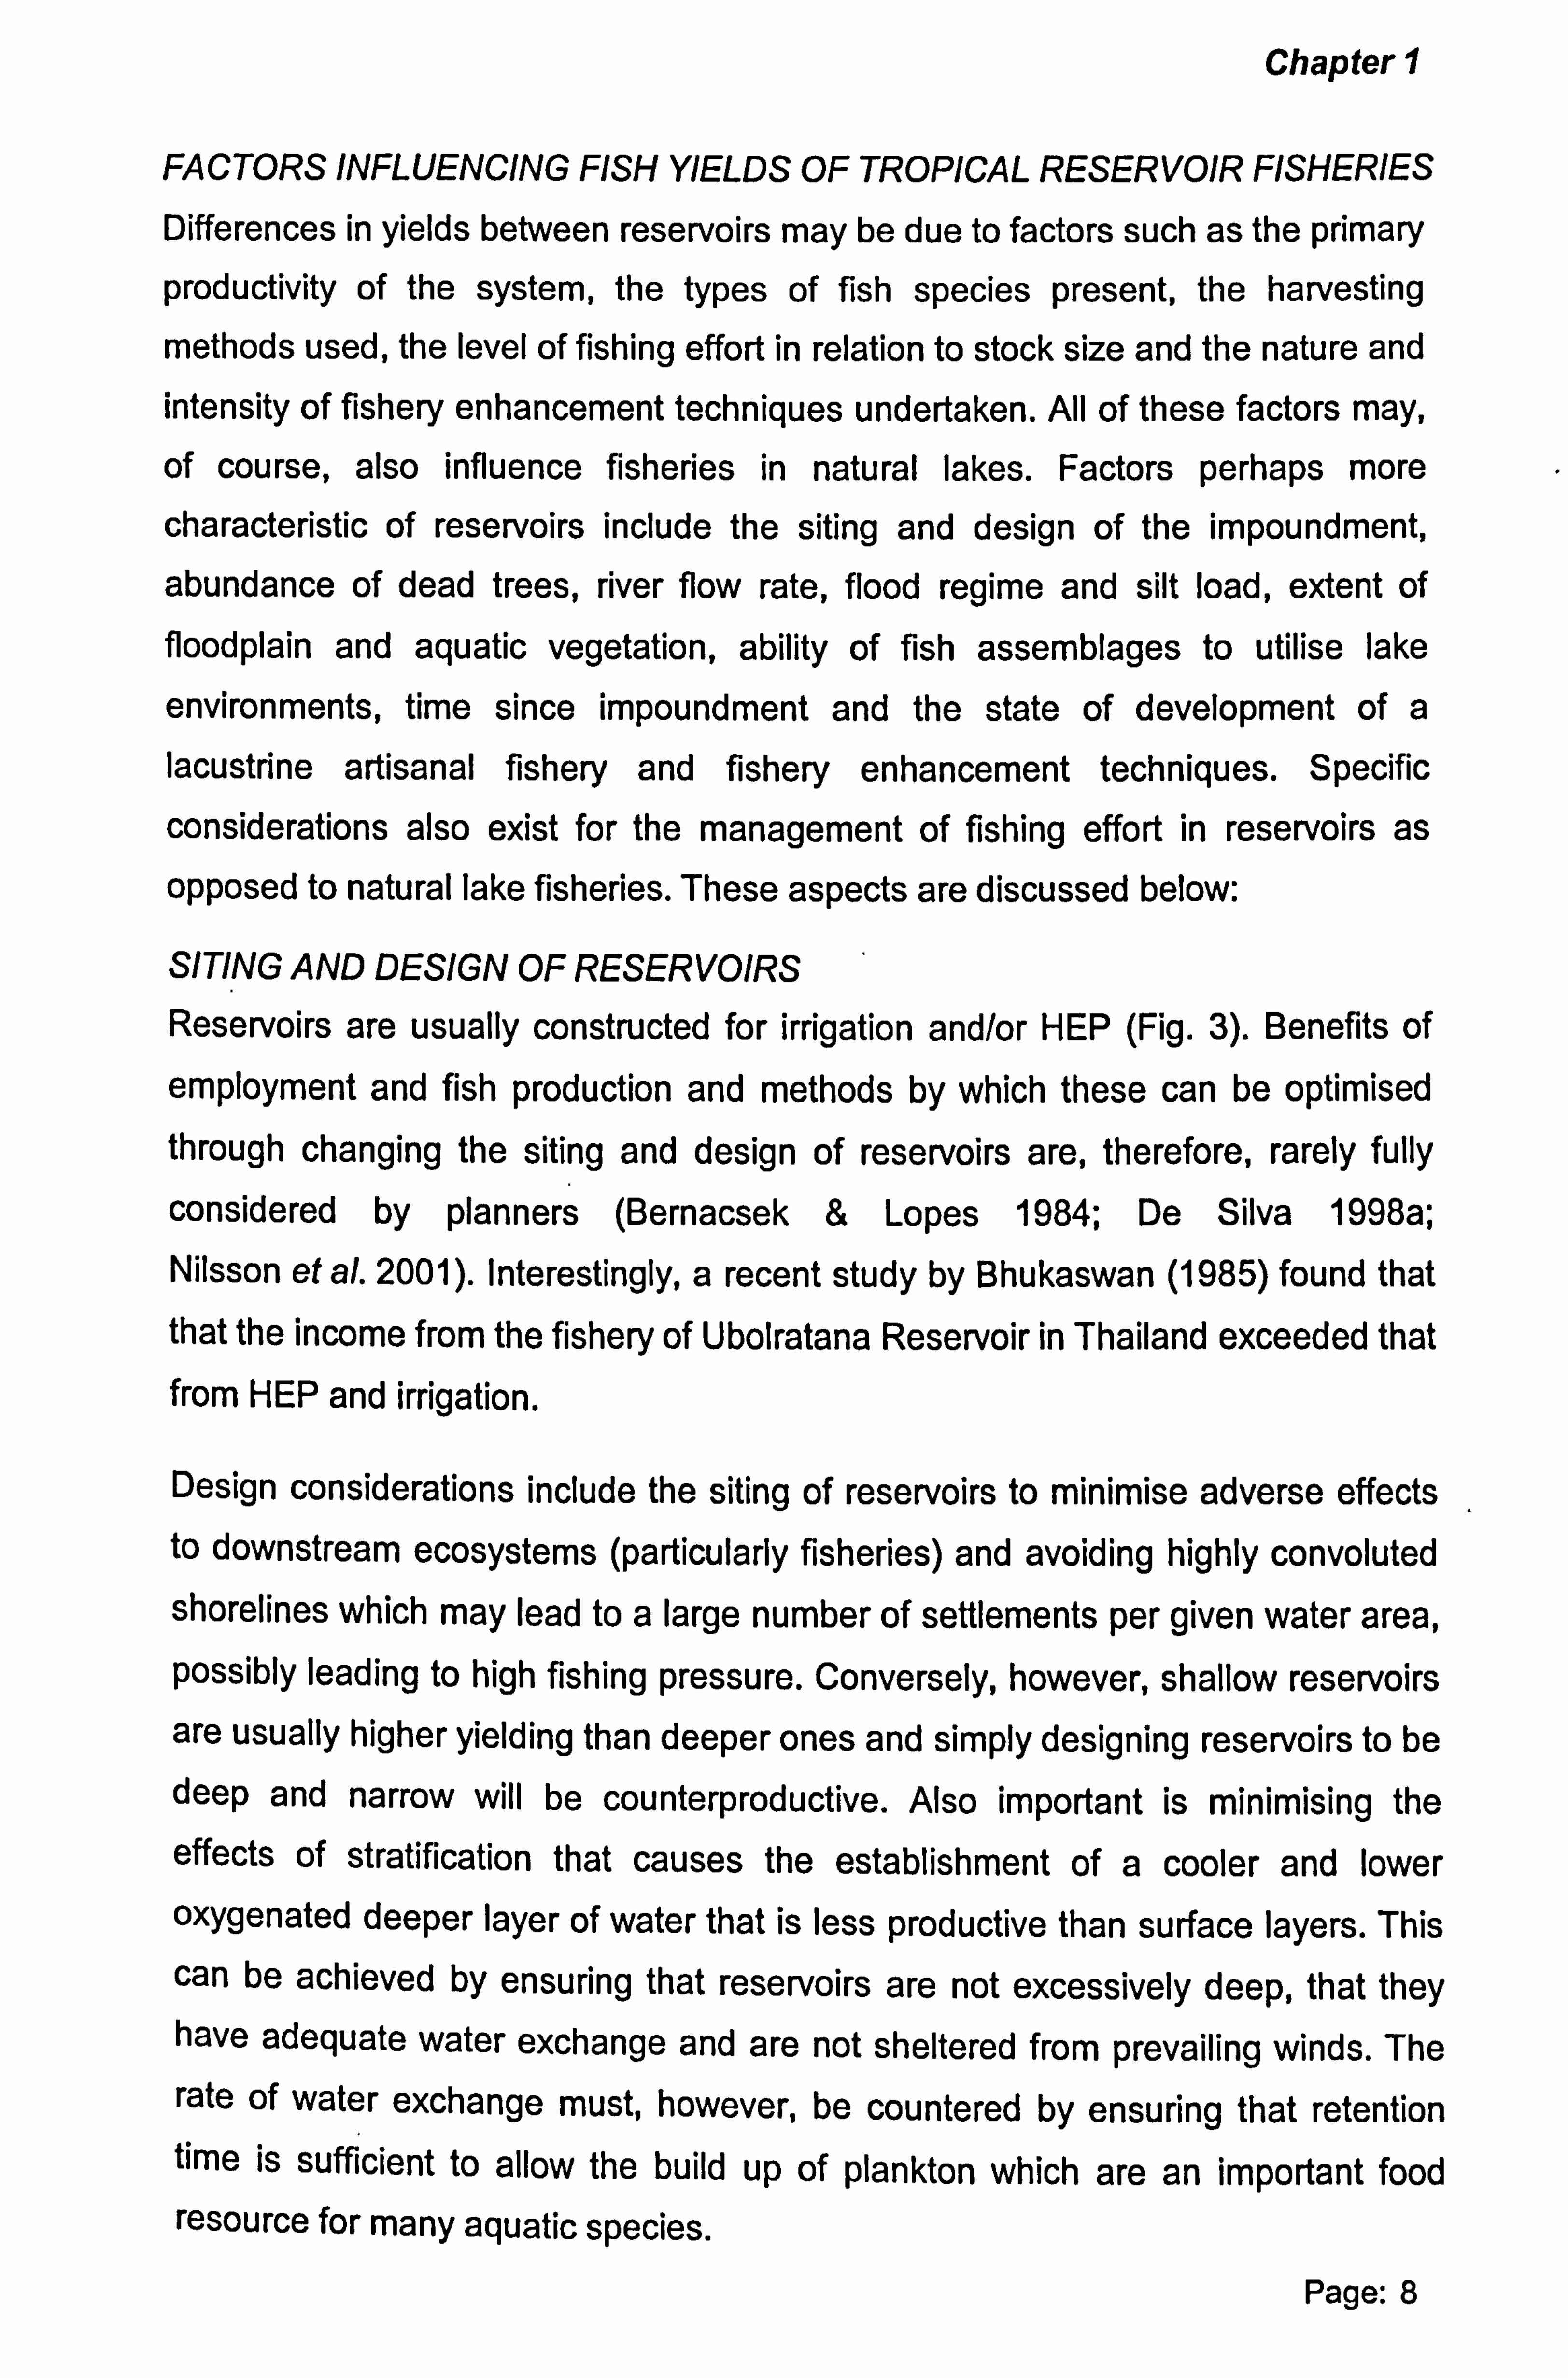
From a compilation of estimates of yield and reservoir area by country or region, I estimate that tropical reservoirs provided between 2.2 to 5.8 million t yr-', or from
7% to 19% of inland fishery production from tropical countries (Table I).
Page: 5
1900 1901-1950 1951-1960 1961-1970 1971-1980 1981-1990 1990-1998
Temperate Zone Q Tropics
125 0
c 0 100 c 0
E 75
U
50
25 0 I-
0
Chapter 1
40
0 c
30 .° :3 cn U, C c a) cL
20 00 w u) o Q) C (ü (ü
C
10 °; L
LL
0
Total fish catch (marine and inland) in tropical countries Percent contribution of total fish catch by inland fisheries
Fig. 5. The total fish catch (million tonne) in tropical countries has risen steadily between 1970 and 2001. The proportion of the catch from inland fisheries (including reservoirs) has generally been increasing since the late 1970s (data reanalysed from FAOSTAT, 2001).
I estimate that the overall mean yield per area for tropical reservoirs is around 70 kg ha-1 yr-' (Table I). On a regional basis, the contribution of reservoir fisheries
to total inland fisheries production varies markedly, from Africa's 10% to three-
quarters in Sri Lanka. The mean yields per unit area also show considerable
variation. The reasons for such differences may include differing limnological and
water chemistry characteristics, design of reservoirs, species mix, variable
efficiencies in harvest methods and the development of fishery enhancement techniques. If it were possible to increase average yields globally to those of Chinese reservoirs, an additional 3.8 million tonnes might be harvested (or almost 6% of the global shortfall of aquatic products forecast by Fernando & Petr (1994) for the year 2025).
Page: 6
1970 1980 1990 2000
'O C 'O OE0 , ý.
Co N
"ý OL
Co >-'O% "0 a)
0NCO U)
I- M Co .2
-0 Co
OON . b-
E
"N U 'V (
O
E .2 -0 E (D rOO
C (ß .-NC MCONO
vi
NCOO .0 4)
in AD C: ) ,m 4) cm C, 4 co q---o - O`CN
tß jN 'O-C) LC
. Cl))
lCLO Q- C
E(jb. -p2N L. L- NN" C) (D CL -0
OO CyE0MN
O 0' ON OE (D OO=C O"
-o
cisca v'c_. CCOc0
oa? ýO ý Z, Ü 5,
N
"ä 'fýü U) r- -0 An
U)°. 22¢ cc
-°C0 -- "a Q) Co
ccn. cL U-0CM= CoZ'Eei vN
Er
iM '0 (D (D YMUO0
C> ">+'ý 4-. LPL E .CE
CO "Lj ,C (D L« NEO
C "C
"71 U =Y. a
NaLm
LNdOOC C_ 'C O'O
"ºý3 U C .ýNOCL
W (0 >CC O) U
0) ' -O CCOC
NCEOUL .0N
�p .. 4... D)
-Em2CC"`ýCo
Chapter 1
NÖ O) 000 U) MN (00)000N. t0 e/- N I") ýtC)C)C) ý) ý- Öý MMLA M NN
IO ý-N
itMM. -M
cfc'ýýý CON10N
Nö N Ni If)
f6
5--o cc 0coetLf (j Lo (D rn v rn ao v cG V aoo) v 'N
N- E CO M LO C14 1N
rr Cl) r In ö ývj 4") aN
'V
C_ VO
fV Cl
Ö
"ý axr
8 C
JD N
w
M co
S, 0) C ý. f0
8 C N
a) N
N
o >ö G) X Nv a)
0) rn rn
(3)
r- Ö
00 ý
ZZ - -E O cu
>C 90 NN 3QNV
rnNE Z m
cä rn rn
a)
m 0
Cl) aý 0
0c) rn rn
m
Öý ýÖ r
.N 0) C OO
OD 0- "0
^ , -" 0
cp ý 16 m2 ö ný
mý: SI13
N 00 O+ MIC * . }" 1-COe (0U)ýOOý
NN
rn rn
CO 00
cS _ _OD
'v ov c
O) o m Co M (» C, 4
:3t: g (Z u5
(n-90 (2 0. ý0
Ö C) -M st If)
1_ to 0M t- C) 0)oD v- 1n
aa n NN
ON C) O) le %- Of O)
0 ti c Co a) 2
C ýN p (2
- 0) Cv
ti r tuC () "" C) 0T
m(0 N 0ECM T- CO o 2ýf Ö00 aN
m 06 0 'u2 1N Lo
cV
LaI. JCID :ý08
.5ý..:, 2. w
mO -t (3)laD 1.: uý M ui 000N0 6Ö -" 't CV NO
Co o Co M cý Ö NciK
,e ern. n
wC týq Ü
_3CNC 'tÄ
CE0eQW. J O_ ýp
Of O º` p'X -m Zlý C, O
aý .S äN ý' M
OO `ý i: 7dNN 'C 3LLO ,_0OnOOOQ U ¢mo2 m =av)ia: w -n >F-5 C; Y w cý v 2(22: 12
Page: 7
Chapter 1
FACTORS INFLUENCING FISH YIELDS OF TROPICAL RESERVOIR FISHERIES
Differences in yields between reservoirs may be due to factors such as the primary
productivity of the system, the types of fish species present, the harvesting
methods used, the level of fishing effort in relation to stock size and the nature and intensity of fishery enhancement techniques undertaken. All of these factors may,
of course, also influence fisheries in natural lakes. Factors perhaps more
characteristic of reservoirs include the siting and design of the impoundment,
abundance of dead trees, river flow rate, flood regime and silt load, extent of floodplain and aquatic vegetation, ability of fish assemblages to utilise lake
environments, time since impoundment and the state of development of a lacustrine artisanal fishery and fishery enhancement techniques. Specific
considerations also exist for the management of fishing effort in reservoirs as
opposed to natural lake fisheries. These aspects are discussed below:
SITING AND DESIGN OF RESERVOIRS Reservoirs are usually constructed for irrigation and/or HEP (Fig. 3). Benefits of employment and fish production and methods by which these can be optimised through changing the siting and design of reservoirs are, therefore, rarely fully
considered by planners (Bernacsek & Lopes 1984; De Silva 1998a; Nilsson eta/. 2001). Interestingly, a recent study by Bhukaswan (1985) found that that the income from the fishery of Ubolratana Reservoir in Thailand exceeded that from HEP and irrigation.
Design considerations include the siting of reservoirs to minimise adverse effects to downstream ecosystems (particularly fisheries) and avoiding highly convoluted shorelines which may lead to a large number of settlements per given water area, possibly leading to high fishing pressure. Conversely, however, shallow reservoirs are usually higher yielding than deeper ones and simply designing reservoirs to be deep and narrow will be counterproductive. Also important is minimising the effects of stratification that causes the establishment of a cooler and lower oxygenated deeper layer of water that is less productive than surface layers. This can be achieved by ensuring that reservoirs are not excessively deep, that they have adequate water exchange and are not sheltered from prevailing winds. The rate of water exchange must, however, be countered by ensuring that retention time is sufficient to allow the build up of plankton which are an important food resource for many aquatic species.
Page: 8
Chapter 1
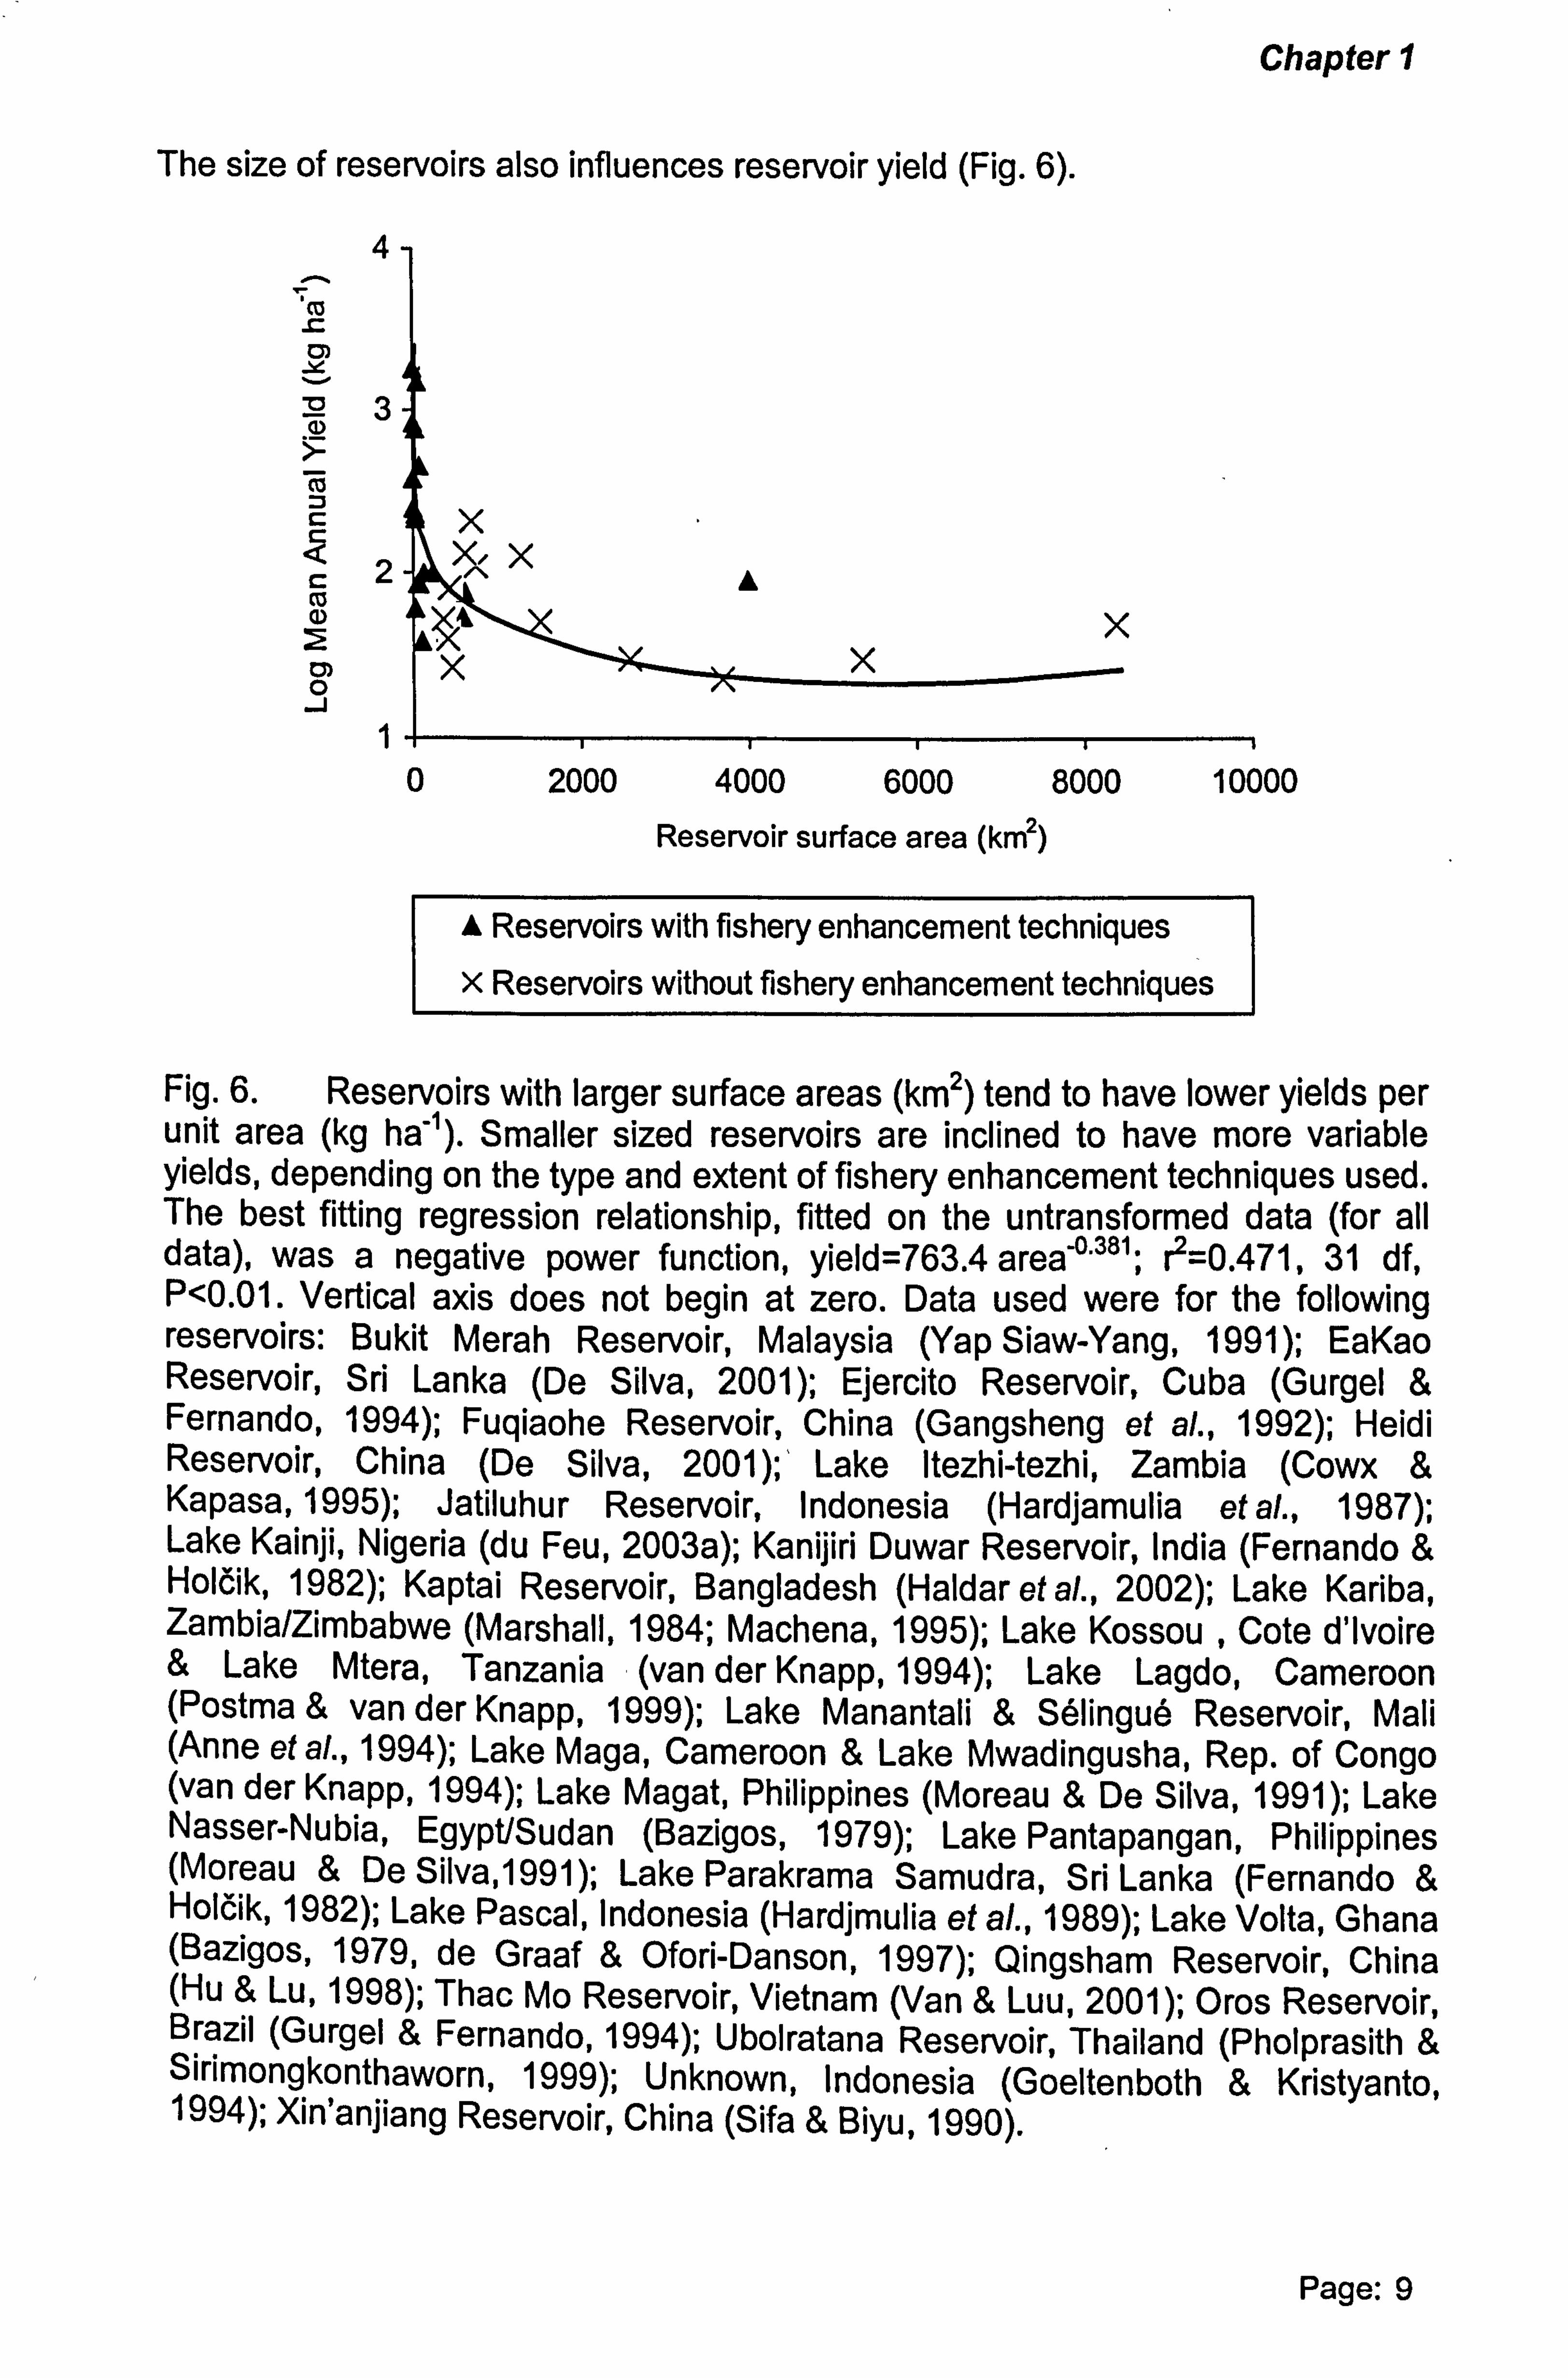
The size of reservoirs also influences reservoir yield (Fig. 6).
4 ýO
cm
: -° 0
co
rn
0 2000 4000 6000 8000 10000 Reservoir surface area (km2)
f Reservoirs with fishery enhancement techniques
x Reservoirs without fishery enhancement techniques
Fig. 6. Reservoirs with larger surface areas (km2) tend to have lower yields per unit area (kg ha-1). Smaller sized reservoirs are inclined to have more variable yields, depending on the type and extent of fishery enhancement techniques used. The best fitting regression relationship, fitted on the untransformed data (for all data), was a negative power function, yield=763.4 area-0 . 381; r2=0.471,31 df, P<0.01. Vertical axis does not begin at zero. Data used were for the following reservoirs: Bukit Merah Reservoir, Malaysia (Yap Siaw-Yang, 1991); EaKao Reservoir, Sri Lanka (De Silva, 2001); Ejercito Reservoir, Cuba (Gurgel & Fernando, 1994); Fuqiaohe Reservoir, China (Gangsheng et al., 1992); Heidi Reservoir, China (De Silva, 2001); ' Lake Itezhi-tezhi, Zambia (Cowx & Kapasa, 1995); Jatiluhur Reservoir, Indonesia (Hardjamulia et al., 1987); Lake Kainji, Nigeria (du Feu, 2003a); Kanijiri Duwar Reservoir, India (Fernando & Holcik, 1982); Kaptai Reservoir, Bangladesh (Haldar et al., 2002); Lake Kariba, Zambia/Zimbabwe (Marshall, 1984; Machena, 1995); Lake Kossou , Cote d'lvoire & Lake Mtera, Tanzania (van der Knapp, 1994); Lake Lagdo, Cameroon (Postma & van der Knapp, 1999); Lake Manantali & Selingue Reservoir, Mali (Anne et al., 1994); Lake Maga, Cameroon & Lake Mwadingusha, Rep. of Congo (van der Knapp, 1994); Lake Magat, Philippines (Moreau & De Silva, 1991); Lake Nasser-Nubia, Egypt/Sudan (Bazigos, 1979); Lake Pantapangan, Philippines (Moreau & De Silva, 1991); Lake Parakrama Samudra, Sri Lanka (Fernando & Holcik, 1982); Lake Pascal, Indonesia (Hardjmulia et al., 1989); Lake Volta, Ghana (Bazigos, 1979, de Graaf & Ofori-Danson, 1997); Qingsham Reservoir, China (Hu & Lu, 1998); Thac Mo Reservoir, Vietnam (Van & Luu, 2001); Oros Reservoir, Brazil (Gurgel & Fernando, 1994); Ubolratana Reservoir, Thailand (Phoiprasith & Sirimongkonthaworn, 1999); Unknown, Indonesia (Goeltenboth & Kristyanto, 1994); Xin'anjiang Reservoir, China (Sifa & Biyu, 1990).
Page: 9
Chapter 1
AMOUNT OF FLOODED VEGETATION
Advantages and disadvantages of clearing vegetation (including trees) prior to
initial flooding of reservoirs has been widely discussed (Bailey & Denny, 1978;
De Silva, 1988b). Remnant trees can increase fish yield by providing a substrate for the colonisation of periphytic algae and invertebrates (Lawson, 1970; Bailey &
Denny, 1978; Entz, 1984; Vanderpuye, 1984; Lowe-McConnell, 1999;
Mattson et al., 2001). Trees may also prevent the use of fishing gears such as beach seines or fishing trawls, thereby reducing excess fishing effort, a condition
perhaps favourable for yields in over capacity fisheries (Vanderpuye, 1984;
du Feu, 2003a).
Vegetation left uncleared may reduce the fish yield immediately after impoundment through fish mortality due to eutrophication and deoxygenation of the water (e. g. Lake Kariba, Beadle (1974); Lake Volta, Vanderpuye (1984)).
Yield from the fishery may also be reduced by piscivorous birds, which stay in partially submerged trees (Winkler, 1983, reported in De Silva &
Amarasinghe, 1996).
In light of the high levels of fishing effort levels assumed for many reservoirs, fish
yield may be maximised by creating corridors through areas of submerged trees to
allow access and the setting of passive fishing gears and to leave them completely uncut within deeper portions of the reservoir.
RIVER FLOW RATE, FLOOD REGIME AND SILT LOAD
Rapid initial filling of reservoirs maximises the chance of high post impoundment fish yields, through enhanced water fertility and encouragement of spawning . activity of riverine fish species. Subsequent yields may also be increased by optimising the seasonal flood regimes to encourage fish spawning (e. g. Lake Kainji, du Feu, 2003a).
Page: 10

Chapter 1
Sedimentation leads to reduced water volume in reservoirs and is a serious
concern globally (WCD, 2000), especially within shallow impoundments in Asia
(Guerrero, 1987; Dela Cruz, 1998). Throughout the world, reservoirs are loosing
an estimated 1% of their storage volume each year (UNEP, 2002). The reduction
of fish yield may be not as severe since some of the 'lost area' is within the deeper
and unproductive hypolimnion layer. However, land degradation is likely to increase in future and lower potential levels of fish yield. Sediments can also reduce water transparency causing lower primary productivity and fish yield.
Sediments can be advantageous and the extra nutrients supplied by them may be
one of the factors causing the higher levels of fish yields as reservoirs become
older (e. g. Lake Volta, De Graaf & Ofori-Danson (1997); Lake Kainji, du Feu (2003a)). Sediments also contribute to floodplain areas that enhance water fertility (Entz, 1984).
EXTENT OF FLOODPLAIN AND AQUATIC VEGETATION
Large seasonal drawdowns of water level are characteristic of many tropical
reservoirs, especially in Asia where they are mainly constructed for irrigation (Pet et a/., 1995; Haider et a/., 2002). Associated floodplains become colonised by
aquatic vegetation leading to increased water fertility, refuge and breeding or nursery areas for young fish (Jackson et al., 1988).
Drawdowns can disturb fish breeding of shallow water and substrate spawners by causing eggs and/or larvae to become exposed both to drying and increased
predation by birds. Fishing mortality may be reduced, however, due to the difficulty of operating fishing gears (e. g. beach seines, trawls) within aquatic vegetation. It may also be lessened by fisherfolk temporarily leaving the fishery to farm floodplain areas. Excessive drawdowns may, however, lead to increased fishing mortality due to fish becoming concentrated in small pools (e. g. Lake Maga, Cameroon; van der Knapp, 1994).
Page: 11
Chapter 1
Many tropical reservoirs have become infested by water hyacinth
(Eichhornia crassipes (Mart) Solms). The hyacinth blocks beaches, floats into and
dislodges fishing gears and harbours snakes. It also reduces the efficiency of HEP
turbines and blocks water inlets and spill ways (Bhukaswan & Chookajorn, 1988;
Ayeni & Mdaihli, 1999). The infestation of hyacinth in South-East Asian reservoirs
has a longer history than Africa and the people living. in lakeside villages are
perhaps more adept at living with and utilising the plant.
Despite these problems, small concentrations of hyacinth can be beneficial for fish
yield. In Lake Victoria, Masifwa et al. (2001) showed that narrow bands of hyacinth
around the shores supported a more diverse and abundant invertebrate
community than areas of extensive vegetation. Njiru et al. (2002) suggested that
catches of catfish species were higher in these areas due to the higher food
availability, the advantages for breeding and lower predation.
PRESENCE OF FISH SPECIES ABLE TO FULLY UTILISE LAKE ENVIRONMENTS
The number of fish species in reservoirs is often around half that of the
pre-impounded river. This is caused by the difficulty of riverine fish species to
adjust to lacustrine conditions (Cowx & Kapasa, 1995; Pholprasith &
Srimongkonthaworn, 1999; Van & Luu, 2001). Fish diversity may improve after flooding of the reservoir through the movement of fish from surrounding river and
swamp areas due to the higher water levels (Pet & Piet, 1993; Cowx &
Kapasa, 1995).
Fernando & Holcik (1982) noted that fish species of riverine origin in reservoirs are generally less productive than species originating from natural lakes. This is
caused by the tendency for the breeding of riverine fish to be dependant on seasonal floods. Such flood regimes may not exist in reservoirs. Riverine fish (excluding the Clupeidae, and some Characidae and Cyprinidae) also mainly inhabit shallow areas around the reservoir margins, thus not fully utilizing the
entire reservoir ecosystem.
Page: 12

Chapter 1
The creation of dams frequently causes a loss of fish biodiversity in downstream
areas (Lelek, 1972). Motwani (1970) and Isaacman & Sneddon (2000) noted that
the breeding of fish downstream is reduced due to the brief and fast water flow not being available for spawning of many riverine species. Impoundments may also
cause a loss of productive floodplains areas downstream.
TIME SINCE IMPOUNDMENT, THE DEVELOPMENT OF THE LAKE FISHERY
Balon (1974) proposed that reservoir productivity undergoes a predictable development. This begins with a relatively productive phase triggered by decay of terrestrial vegetation and leaching of nutrients from soils, followed by a rapid decrease in productivity, and a more gradual alteration of the fish community as species that are able to thrive in a lacustrine environment prosper at the expense of those with adaptations more strictly appropriate for riverine conditions. It might be expected that such drastic changes to fish abundance and species mix will provide a challenge, to an artisanal fishing community accustomed to river conditions and riverine species and initially pre-occupied with the problems of resettlement following filling of the reservoir. Perhaps this may explain why the
expected post-impoundment boom does not always translate into a peak in yields (Fig. 7). Other possible explanations may include lack of organic material, especially in and locations (Lake Nasser/Nubia; Abel-Latif, 1984), fish kills due to deoxygenation caused by excess organic material (Kariba, Volta; Beadle, 1974; Petr, 1974), slow rate of filling (Lagdo: van der Knaap et al. 1991) or the inability of available species to benefit from high productivity (Lake Ubolratana: Pholprasith & Sirimongkonthaworn, 1999).
The collapse of the initial boom may be due to depletion of nutrients of terrestrial origin, overexploitation of the initially dominant fish species or replacement of target fish species with more lacustrine-adapted forms that fisher communities were yet to target to the same extent. Irrespective of whether there has been an early production boom, most reservoir fisheries seem to quickly settle into a period of relatively consistent fish yield and fairly stable fleet size (Fig. 7& 8).
Page: 13
Chapter 1
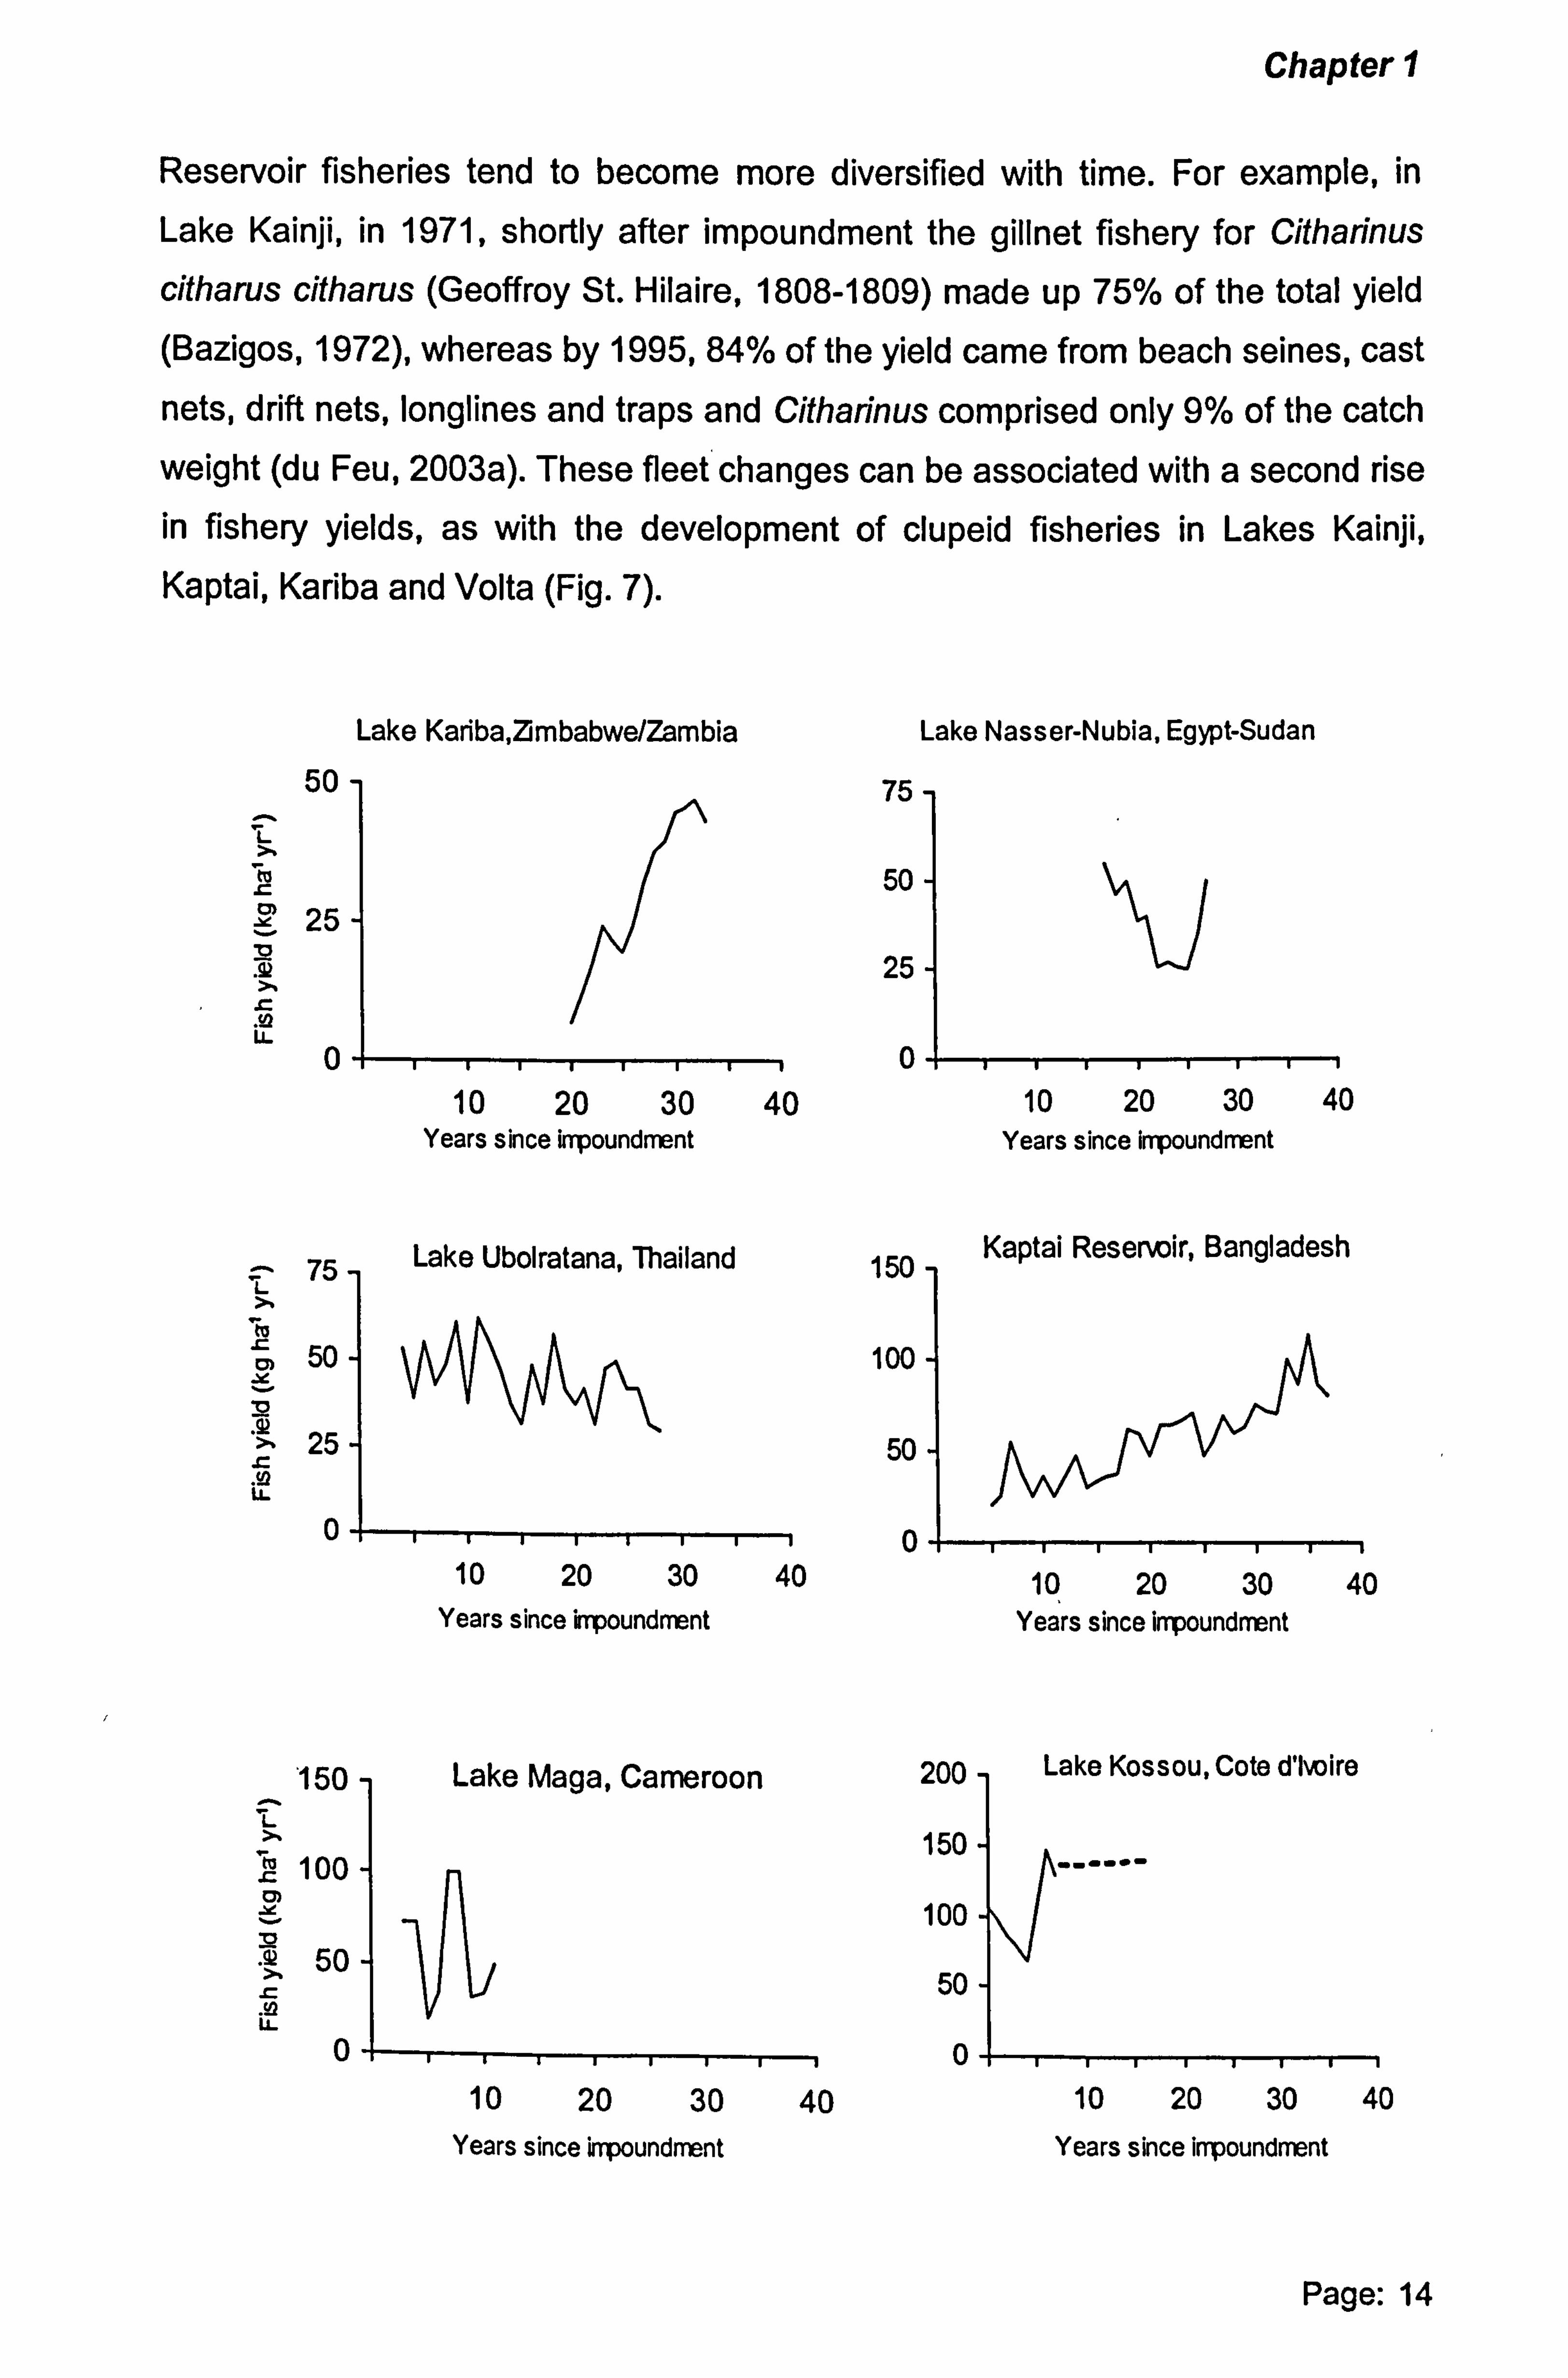
Reservoir fisheries tend to become more diversified with time. For example, in
Lake Kainji, in 1971, shortly after impoundment the gillnet fishery for Citharinus
citharus citharus (Geoffroy St. Hilaire, 1808-1809) made up 75% of the total yield (Bazigos, 1972), whereas by 1995,84% of the yield came from beach seines, cast
nets, drift nets, longlines and traps and Citharinus comprised only 9% of the catch
weight (du Feu, 2003a). These fleet changes can be associated with a second rise in fishery yields, as with the development of clupeid fisheries in Lakes Kainji,
Kaptai, Kariba and Volta (Fig. 7).
Lake Kariba, Zimbabwe/Zambia
50 L
tu
25
0
75 i to
50
> 25
U. 0
150
L 100 cm Y
50
LL
0
Lake Ubolratana, Thailand
AV4\
10 20 30 40
Years since impoundment
Lake Maga, Cameroon
Lake Nasser-Nubia, Egypt-Sudan
75 ,
50
25
0
150
100
50
0
200
150
100
50
0
Kaptai Reservoir, Bangladesh
N/\--P 10 20 30 40
Years since impoundment
Lake Knssnu_ Coin d'koirn
Page: 14
10 20 30 40 Years since impoundment
10 20 30 40 Years since impoundment
10 20 30 40
Years since inpoundment
10 20 30 40 Years since impoundment

Chapter 1
400 Lake Kainji, Nigeria L T
300-
200-
100- L
0 10 20 30
Years since impoundment
300
200
100
0 1 40
Lake Volta. Ghana
Years since impoundment
400 Lake Lagdo,
.M 300-
200-
100-
u. 0
10 20 30 40
Years since impoundment
Fig. 7. Reported yields (kg ha'ys) for each year since impoundment for some tropical reservoir fisheries. Graph axis have differing scales, all vertical axis refer to fish yield (kg ha' yr'). Dashed lines (------) indicate years where no information on annual yield exists. Figures have been ordered by ascending mean annual fish yield. References: Lake Kariba (Marshall, 1984; Machena, 1995); Lake Nasser-Nubia (Bazigos, 1979); Ubolratana Reservoir (Pholprasith & Sirimongkonthaworn, 1999); Kaptai Reservoir (Haider et al., 2002); Lake Volta (Bazigos, 1979; de Graaf & Ofori-Danson, 1997); Lake Maga (van der Knapp, 1994); Lake Kossou (Bazigos, 1979; van der Knapp, 1994); Lake Kainji (du Feu, 2003a).
THE STATE OF DEVELOPMENT OF A LACUSTRINE ARTISANAL FISHERY
Henderson & Welcomme (1974) proposed that the optimal effort level of reservoir fisheries was 1.5 fisherfolk per km2 of lake surface area. Current levels of fishing
effort are often much higher, ranging from Lake Ubolratana in Thailand (six times
this optimum) to almost all reservoirs in Africa that have a concentration of fisherfolk in excess of the optimum (Fig. 8). Such reservoirs are either being
heavily overfished or the optimal concentration of fisherfolks needs revising. One
reason why reservoir yields are not declining as implied by the high levels of fishing effort may be the diversification of fishing methods and mesh sizes to target
more species and fish sizes that has often taken place. This suggests that
reservoir fisheries are now possibly able to support a higher concentration of fisherfolk than originally suggested by Henderson & Welcome.
Page: 15
10 20 30 40

Chapter 1
Different interpretations of the term 'fisherfolk' exist in literature (whether it
includes just fishing entrepreneurs (the owners of the fishing units) or also fishing
assistants (who fish for them). I suggest that it is more accurate to compare past literature on fishing effort between reservoirs in terms of fishing canoes rather than
fisherfolk. This assumes that fishing effort is correlated to the number of fishing
canoes owned (Fig. 9).
E8 a
f0 6
NL ii 4E
Zý
I -I_- "I_ - -- _\1. .
L! _ 8
6
Kncenti Pcccrunir
Mh ra Pacortnir
8 Lake Volta 8 R6,. 6-
42 44 m0
2 21 a60 E
z0 10 20 30 0
Years since Impoundment
E8 ä
ße 6
N 4'
ý" 4
O4 Z a
0
4
2
0
Years since impoundment
Maga Reservoir
10 20 30
Years since Impoundment
8 Lake Kainji
4
0 0 10 20 30
Years since Impoundment Years since Impoundment
Fig. 8. Densities of fishing canoes (number of canoes per km2 lake area) on African reservoirs have tended to show an initial rapid rise after impoundment, followed by period of relative stability. Recent studies on mature reservoirs (Lakes Kainji and Volta) have indicated that higher densities have been building up. Dashed lines (---) are used to join years where no information on canoe density exists. All vertical axis refer to the number of canoes per km2 reservoir area. Graphs ordered by ascending average concentrations of fishing canoes. References: Lake Nasser-Nubia (Bazigos, 1979), Lake Kossou (Bazigos, 1979; van der Knapp, 1994), Lake Volta (Bazigos, 1979; de Graaf & Ofori-Danson, 1997), Lake Maga & Mtera Reservoir (van der Knapp, 1994), Lake Kainji (du Feu, 2003a).
Page: 16
0 10 20 30
Years since impoundment
0 10 20 30
0 10 20 30
Chapter 1
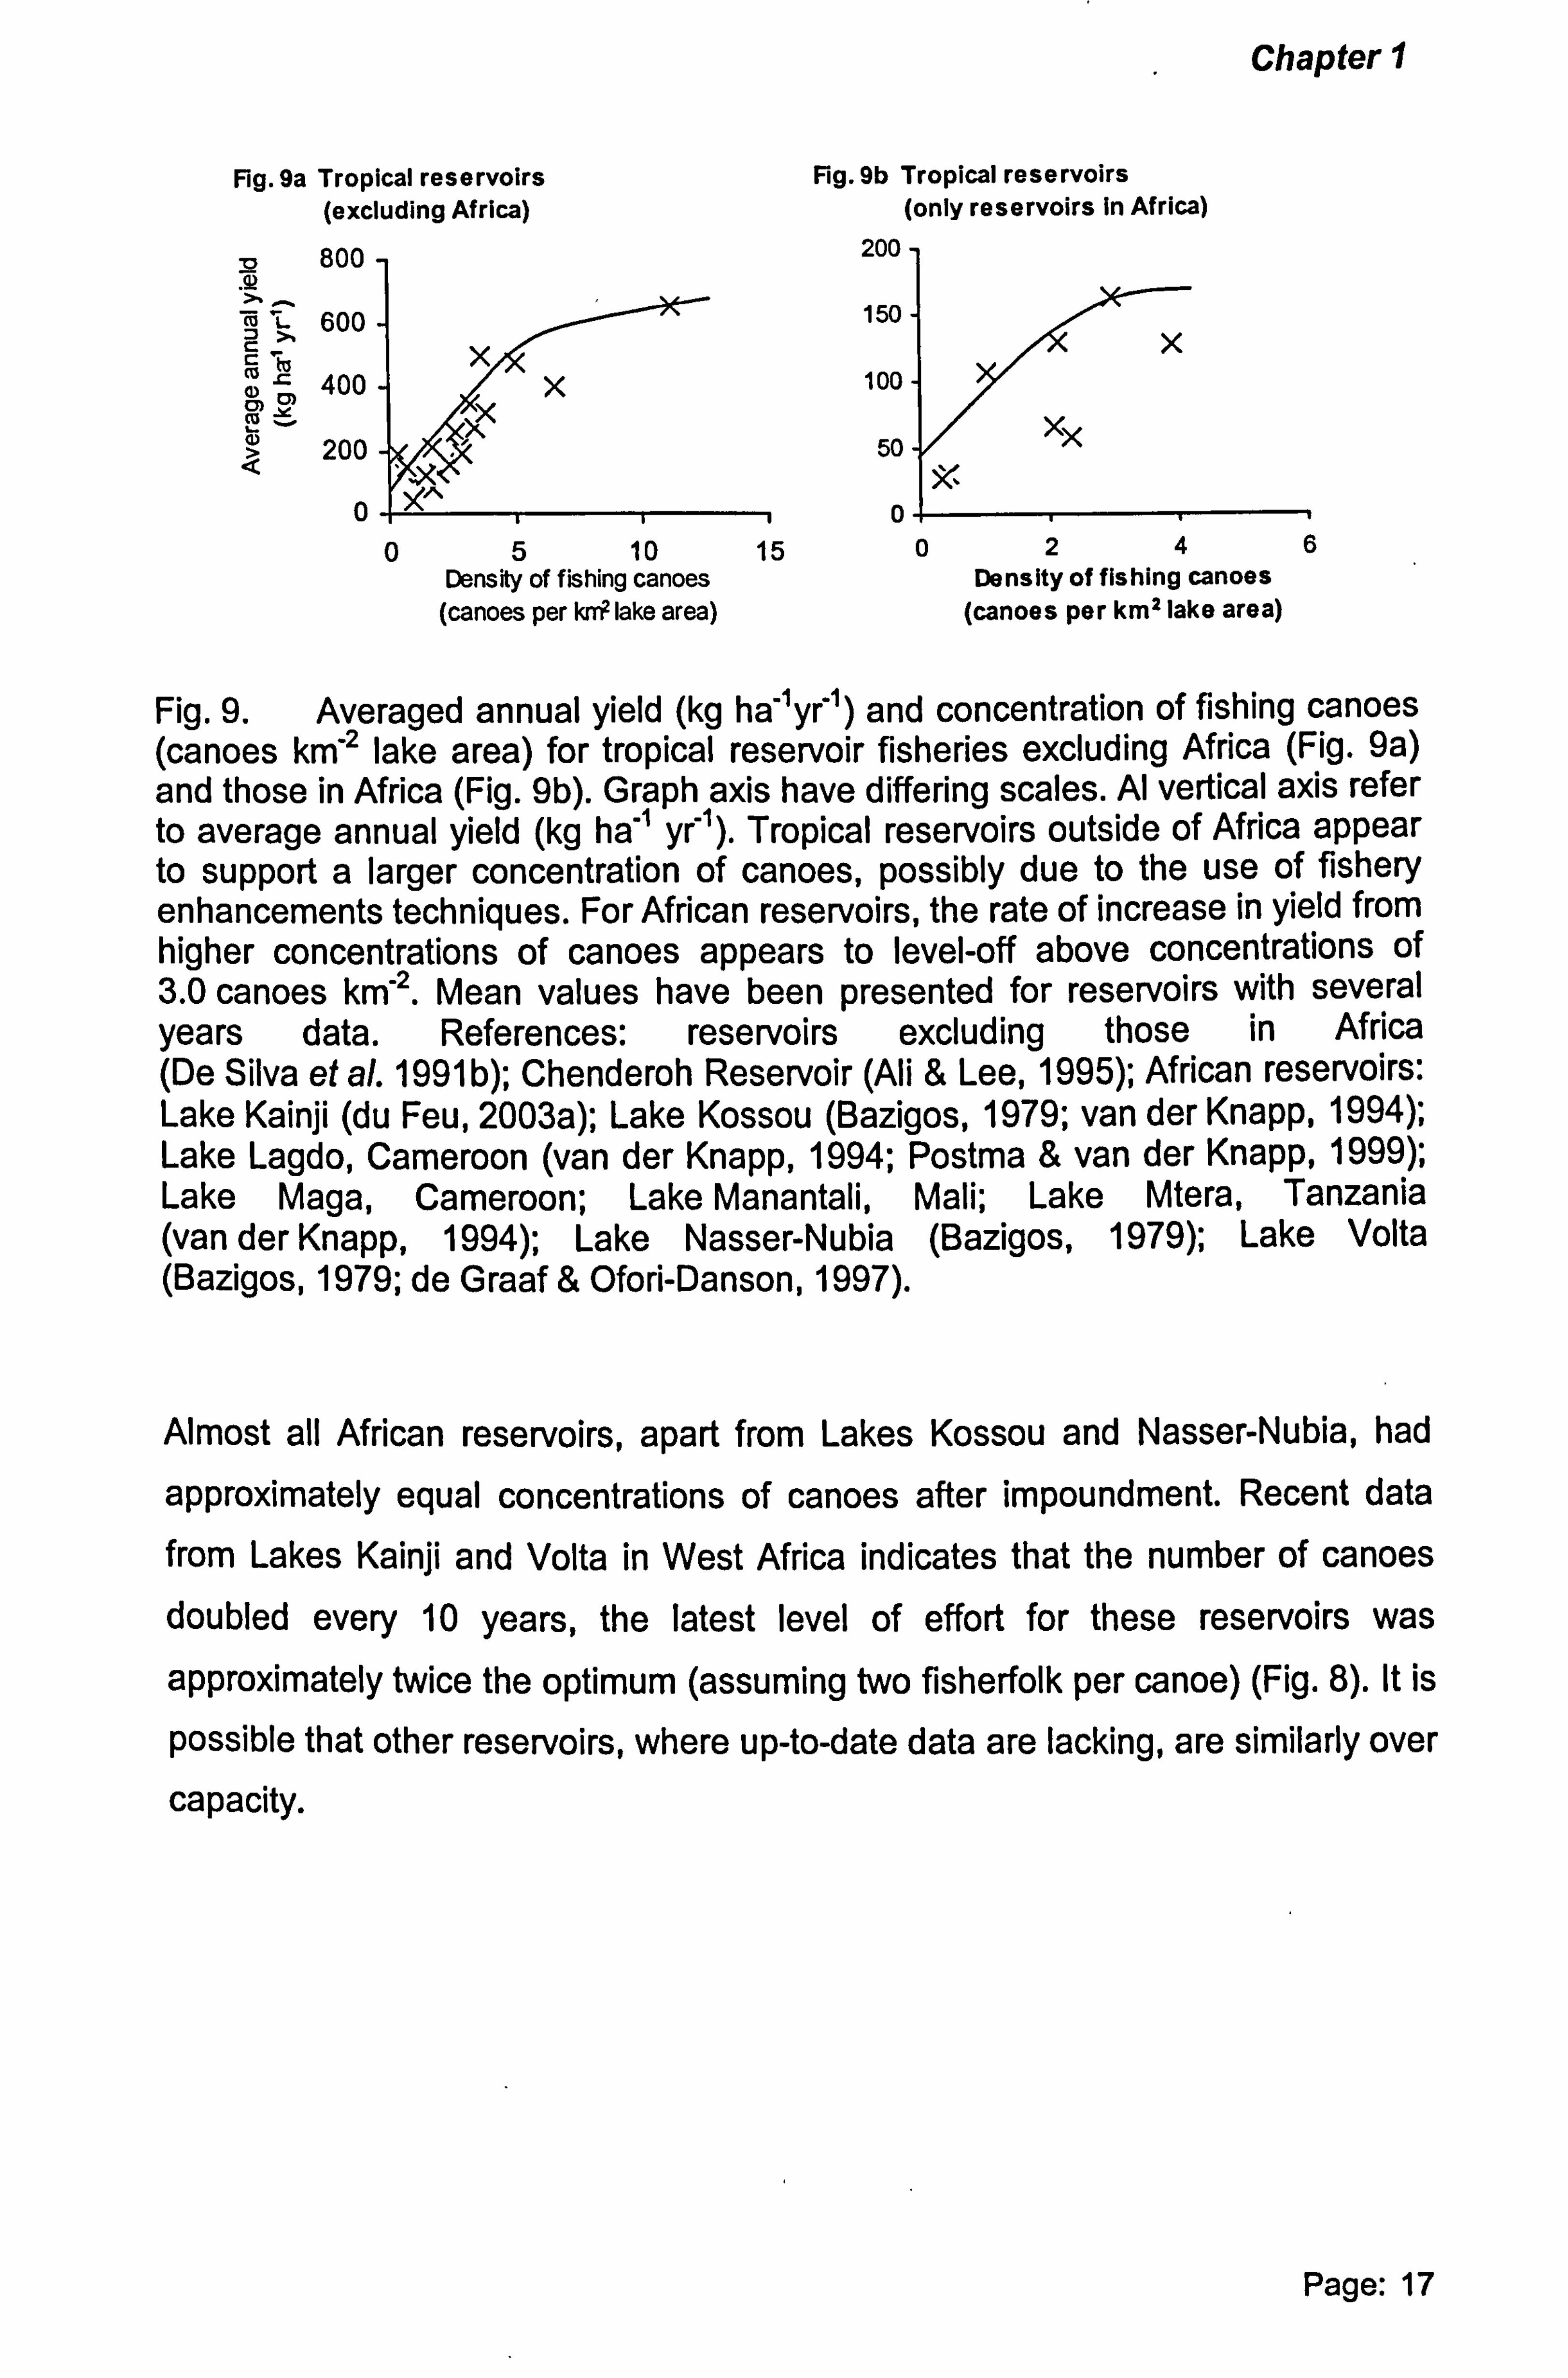
Fig. 9a Tropical reservoirs (excluding Africa)
13 800 T-
L 600 % X
400 ýx
Q 200
4
0
Fig. 9b Tropical reservoirs (only reservoirs in Africa)
200
150
100
50
0
Fig. 9. Averaged annual yield (kg ha lyr ) and concentration of fishing canoes (canoes km 2 lake area) for tropical reservoir fisheries excluding Africa (Fig. 9a) and those in Africa (Fig. 9b). Graph axis have differing scales. Al vertical axis refer to average annual yield (kg ha"' yr ). Tropical reservoirs outside of Africa appear to support a larger concentration of canoes, possibly due to the use of fishery enhancements techniques. For African reservoirs, the rate of increase in yield from higher concentrations of canoes appears to level-off above concentrations of 3.0 canoes km 2. Mean values have been presented for reservoirs with several years data. References: reservoirs excluding those in Africa (De Silva et al. 1991 b); Chenderoh Reservoir (Ali & Lee, 1995); African reservoirs: Lake Kainji (du Feu, 2003a); Lake Kossou (Bazigos, 1979; van der Knapp, 1994); Lake Lagdo, Cameroon (van der Knapp, 1994; Postma & van der Knapp, 1999); Lake Maga, Cameroon; Lake Manantali, Mali; Lake Mtera, Tanzania (van der Knapp, 1994); Lake Nasser-Nubia (Bazigos, 1979); Lake Volta (Bazigos, 1979; de Graaf & Ofori-Danson, 1997).
Almost all African reservoirs, apart from Lakes Kossou and Nasser-Nubia, had
approximately equal concentrations of canoes after impoundment. Recent data
from Lakes Kainji and Volta in West Africa indicates that the number of canoes doubled every 10 years, the latest level of effort for these reservoirs was
approximately twice the optimum (assuming two fisherfolk per canoe) (Fig. 8). It is
possible that other reservoirs, where up-to-date data are lacking, are similarly over
capacity.
Page: 17
0246 Density of fishing canoes
(canoes per km2lake area)
05 10 15 Density of fishing canoes
(canoes per krrr lake area)
Chapter 1
Immigrant fisherfolk often arrive in newly constructed reservoirs, attracted by brief
increases in initial productivity. They may outnumber indigenous fisherfolk
e. g. Lake Lagdo, Cameroon (van der Knapp, 1994), Lake Kainji (Bazigos, 1971).
The number of migrants can be particularly high when the surrounding fisheries
are being overfished, e. g. Itezhi-tezhi Reservoir, Zambia (Cowx & Kapasa, 1995).
Large influxes of migrant fisherfolk can quickly lead to over-capacity, especially
since the time-lag between hearing of large catches and actual arrival means that
many migrants arrive after the peak yields have occurred (Table II).
Table II. Reported years of maximum values of CpUE (kg day'), number of fisherfolk per unit area and yields, for some tropical reservoir fisheries. Maximum yields usually occur later than maximum CpUE per fisherfolk, after numbers of fishers have increased.
Year of maximum
Reservoir/ Country CpUE per Density of Yield Reference fisherfolk fisherfolk
Kossou, CSte d'lvoire
Lake Kainji, Nigeria
Lake Lagdo, Cameroon
Nasser-Nubia, Egypt
Ubolratana, Thailand
-1972 -1974 -1977
1969 1998 1970
1986/87 1991 1985/86
-1982 -1980 1983
-1971 -1992 1976 Pholprasith & Sirimongkonthaworn (1999)
Entz (1984)
du Feu (2003a)
Postma & van der Knapp (1999)
Rashid (1995)
Volta, Ghana -- 1970 -- 1991 1969 Braimah (1995)
ENHANCEMENTS OF FISHERIES IN RESERVOIRS
Fishery enhancement techniques are used, particularly in Asian reservoirs, to increase fish yield. These include:
i. - Introductions/ stocking of fish species
More than 290 fish species have been introduced into global fresh water systems mainly to increase total fish yield (Welcomme & Bartley, 1998). The number of successful transfers is, however, much lower.
Page: 18

Chapter 1
The introduction of species low in the food chain such as the pelagic Clupeidae has resulted in large increases in yield in some reservoirs. An example is the
introduction of Limnothrissa miodon (Boulenger, 1906) in the 1960s to Lake Kariba
(Pitcher, 1995; Lowe-McConnell, 1999) that increased total fish yield to
approximately 60 kg ha" yr' (Losse, 1998).
Introduction of the Cichlidae have led to higher yields; particularly when regular
re-stocking is undertaken (Fernando & Holcik, 1982, Pet et al., 1999). In Sri
Lankan reservoirs, such practices have increased fish yield ten-fold to some 250 kg ha"' yr' (Fernando, 1991; Pet & Piet, 1993, Pet et al., 1999), in north-east Brazil from 44 to 160 kg ha-1 yr' (Gurgel & Fernando, 1994) and in Cuban
reservoirs to around 190 kg ha" yr' (Laiz Averhoff, 1999).
Stocking rates tend to depend on the availability of fingerlings rather than sound management (Jhingran, 1992). In India, Mexico and Brazil this appears due to
poor funding of hatcheries (Sugunan, 1997). Several authors have suggested that
yields can be increased by using optimal stocking rates and sizes at capture (Cowx, 1998; Welcomme & Bartley, 1998; Quirös & Mari, 1999). Stocking
programs can also benefit from the fishing-out of predators (Gangsheng et al., 1992) and fertilisation of water (Jhingran et al., 1992).
Most large reservoirs in Asia have benefited from introductions of Cichlidae and it is considered that limited potential exists to increase yields by such means.
Cowx (1998) and Quirös (1998) noted that the reasons for the need for stocking are often not fully understood and that better understanding of the core problems of the fishery, necessitating stocking, may lead to less costly and more sustainable solutions to providing higher fish yields.
ii. Aquaculture in reservoirs
Aquaculture has a long history within Asia, ranging from the husbandry of fish within enclosed bays, pond culture on banks or near water outlets, through to intensive cage faming.
Page: 19
Chapter 1
In China, improved practices of aquaculture since the 1980s have resulted in the
mean annual yields increasing from 100 kg ha-1 to current levels of around 800 kg ha-1 (Huang et al., 2001). Hu & Lu (1998) noted that half the fish production from large inland water bodies presently derives from cage farming, the area of which has expanded by some 70% per annum in the 18 years up to 1996 and
where annual yields can reach 187 kg m"3.
Outside of China yields are lower and in Cuba average 50 kg m"3 yr' (Sugunan, 1997). Aquaculture practices in Africa are less developed. One reason may be shorter history (and hence different perceptions and socio-setting in which aquaculture operates), as well as, the higher cost of inputs and lack of required infrastructure (du Feu & Mdaihli, 1994).
High yields in China appear to offer scope for other regions in the tropics to increase production. Extrapolating mean production rates of China to the water surface areas in these regions indicates that fish yield from all tropical reservoirs can theoretically increase to just over 6 million t yr' (an increase of 170% above current levels). However, high yields in China are often due to the introduction of alien species, that are tolerant of intensive culture techniques, but which may destroy endemic fish fauna. The intensive culture practices are therefore generally environmentally unsound.
A consideration for possible yield increases through aquaculture, noted by Sugunan (1997) and De la Cruz (1998), is that low income artisanal fisherfolk are not usually involved in high investment aquaculture activities and often find themselves being marginalized by richer and more powerful farm operators.
MANAGEMENT OF THE RESERVOIR FISHERY High fishing mortality of undersized fish and declining catches in tropical reservoir fisheries have been widely reported (Amarasinghe, 1987; Rahman, 1988; Pet et al., 1999; Nilsson et al., 2001). Effective fisheries management is therefore essential to counteract likely future declines in fish yield.
Page: 20
Chapter 1
Previous management approaches in reservoir fisheries were mainly based on
centrally administered and top-down methods, usually involving 'patrol and fine'
type enforcement. Such approaches are normally costly to operate and subject to
bribery and are rarely able to control fishing effort and result in higher fish yield (du Feu, 2003b). Some managers have therefore sought approaches involving
greater participation by the fishing communities, such as community-based fisheries management (CBFM). This requires that the communities are cohesive
and unified (Jentoft, 2000). Smaller reservoirs, with like-minded residents, may
therefore be more suited to CBFM than those of larger size. The increasing
proportion of smaller reservoirs constructed noted by Worthington &
Lowe-McConnell (1994) may favour CBFM.
Larger sized reservoirs tend to be more socially and bureaucratically complex and
appear more suited to a sharing Of responsibilities between the fisherfolk and
relevant institutions (termed co-management). Examples of co-management systems in reservoirs vary from where the communities are consulted (du Feu, 2003b) to where communities almost wholly administer the management process (Amarasinghe & De Silva, 1999). The extent that the communities are involved depends on the types of communities, the management problems, the
number of interested parties and the need for supporting infrastructure and legislation (Cowx & Kapasa, 1995).
Considerations of community-based approaches in reservoir fisheries are that fisheries are often under the jurisdiction and control of national authorities. It may be difficult to reverse this and give communities more control, especially since many traditional management practices that were suited for the riverine fishery
may no longer be used in the reservoir (e. g. defined areas of jurisdiction between
villages). A further aspect is that migrant fisherfolk often consider themselves exempt from the authority by local traditional rulers and may be difficult to control using community approaches (e. g. Lake Kainji; du Feu, 2003b).
Page: 21
Chapter 1
For all management approaches, increases in yields are only possible if the
management undertaken is based on a full understanding of the fishery and is
appropriate (du Feu, 2003c). This implies that accurate and long-term data sets
must be available; a situation that rarely exists for reservoir fisheries (Cowx, 1991;
Petr, 1994; Mandima, 1996; Sugunan, 1997; Verheust, 1998). The general lack of
understanding concerning the status of fisheries makes it difficult to forecast the
increase in yield possible through better management. It must be recognized, however, that management in reservoir fisheries has firstly to overcome potential
problems caused by ever increasing levels of fishing pressure on the resource. It
may therefore be realistic to assume that large increases in yield will be difficult to
achieve and that sustained fish catches are all that can be reasonably expected from enhanced management.
DISCUSSION
World population is set to increase from six billion to between 7.8 and 10.9 billion
by 2025. It is forecast that almost all of the increase will occur in tropical countries in Africa, Asia and Latin America (UNEP, 2001). There are concerns about whether the world's food production systems will be able to feed so many people, especially in the face of stagnant or declining stocks of natural resources (Rosegrant et al., 2001). In the fisheries sector, it is forecast that by 2025 an additional 62 million tonnes of aquatic products will be 'required annually to
maintain the present 19.1 kg yr 1 per capita intake (Fernando & Petr, 1994).
Increasing pressure on aquatic resources caused by growing populations (Welcomme & Bartley, 1998; UNEP, 2002) and degradation of the environment questions whether marine and fresh water fisheries can contribute towards this shortfall. Pauly et al. (2002) have proposed that global fish catch has, in fact, declined by some 0.7 million tonnes per annum since the 1980s.
Page: 22
Chapter 1
Building more reservoirs and increasing yield per area may present opportunities to raise fish production from inland fisheries. It has been suggested that reservoir fisheries may be able, therefore, to reduce the shortfall in per capita fish protein intake and also help secure employment in rural areas (Fernando & Petr, 1994;
Sugunan, 1997), particularly since reservoirs are usually built among the rural
poor.
The building of large reservoirs in the tropics has, however, reduced. Reasons for
this include the lack of finance available, the poor accountability of dam projects, their failure to deliver all expected outputs and the lack of available sites that is in
part due to the increased involvement of pressure groups concerned with the
environmental and social harm caused by reservoirs (WCD, 2000).
The construction of smaller sized reservoirs appears to be continuing. There is
some indication that smaller water bodies have higher yields per unit area than larger sized impoundments and thus higher yields for total reservoir area might be
expected in future. In part, this is due to smaller reservoirs having a lower ratio of
open water areas (which are often not able to be fully exploited by impounded
riverine fish fauna), a greater marginal area which is productive, a lower
prevalence of thermoclines and that fishery enhancement and management systems can be more easily controlled.
The design, construction and management of these small water bodies is
presently largely uncoordinated. Research activities for reservoir fisheries have historically concentrated on larger and more valuable reservoirs (Lowe-McConnell, 1999), thus, limited information exists on how fish production from these small reservoirs can be optimised.
One method by which fish production in reservoirs may be increased is by changing dam design and operation. Fisheries in reservoirs are, however, often considered less important than the valuable outputs of irrigation and HEP generation. To be in a position to dictate such changes, planners must firstly recognise the importance of reservoir fisheries to rural livelihoods as providers of employment and fish protein. International bodies such as the WCD and local interest and environmental groups are well-placed to portray these benefits.
Page: 23

Chapter 1
There is some evidence that a secondary increase in fish yield occurs after the
initial post flooding boom (Singit et al., 1988; De Graff & Ofori-Danson, 1997;
Mattson et al., 2001; du Feu, 2003a). This is possibly caused by a rise in nutrients from sediment build up, establishment of aquatic vegetation, adaptation and
colonisation of fish species and, perhaps most importantly, the increased local
knowledge of the fisherfolk and the associated diversification in fishing methods. In
Lake Kainji the rise has been partly due to the development of a beach seine fishery targeting the endemic clupeidae. This suggests that clupeids, that
previously inhabited the river, are able to support a productive fishery. This is
unlike other reservoirs such as Lakes Kariba and Cahora Bassa where clupeids derived from natural lakes (Pitcher, 1995; Lowe-McConnell, 1999).
Similar secondary rises in fish yield may also have occurred in other reservoirs, but due to the lack of recent fisheries monitoring, have possibly not been recorded. It is possible, therefore, that the contribution by reservoir fisheries, including the
per capita intake of protein, is greater than presently documented. On the negative side, the example of Lake Kainji (du Feu, 2003a) demonstrated that diversification
of the fishing methods, which is a major contributor to this increase, is linked to a rise in fishing effort. It appears therefore that management of fishing effort is
required to prevent such fisheries becoming over exploited.
Large increases in fish yield may be achieved through enhancement techniques. Enhancement practises are mainly confined to Asia. In theory, these can be transferred for use in Africa and South America where similar yield levels may then be possible. This would result in an extra 3.8 million tonne fish yr 1 (some 170% higher than current yields and 6% of the total global shortfall estimated by Fernando & Petr (1994)). Unfortunately, not all regions lend themselves so readily or have the long history and awareness regarding aquaculture as China, which Hu (1994) reported stems back nearly one thousand years. Although limited cases of fishery enhancement techniques exist in South America and Africa, the mass adoption of the techniques outside of Asia is believed to be limited at present. A further social constraint is that such techniques rarely benefit the poorest people and may in fact cause more hardship through competition and conflict concerning the use of reservoir resources.
Page: 24
Chapter 1
One way that catches can be increased, or at least prevented from further
declines, is through effective management of both of the capture fishery and of the
enhancement techniques. The area offers potential to increase yield so long as
good quality data are available by which to formulate appropriate management
recommendations that are tailored for each individual reservoir. Few reservoir
fisheries have ever experienced any control and hence even small measures may
result stabilised or increased fish production. This in turn suggests that designing
and implementing management plans will be a major challenge in fisheries that
have, hitherto, been left to their own devices.
There is a current move away from management approaches that use a top-down
policing policy to those that recognise the role and the sharing of responsibilities
through the participation by the communities in the management process. This
new approach of community-based fisheries management (CBFM) may help solve
some of the problems inherent in many tropical reservoir fisheries and perhaps
lead to an increase in yields. The approach must, however, be examined and
appraised for each individual water body if it is to be effective. There are many
variants of CBFM that depend on the size of reservoir, the support by the
traditional administration and governmental agencies, the size and composition of
the fishing 'community' around the lake and the management needs of the fishery.
In cases where intervention is urgently required to prevent collapse of a stock, an
approach using CBFM that involves protracted negotiations and discussions may
not be the most appropriate.
The lack of literature and understanding of reservoir fisheries and environmental
social changes brought about their creation makes it extremely difficult to calculate
expected future increases in yield. The current slow down in reservoir
construction, increasing levels of fishing effort and pressures on reservoir
resources, and ongoing environmental degradation suggests that any increase
would be limited. More controllable aspects, such as better coordination in
reservoir construction, more research relating to yield increases, the
expansion/intensification of fishery enhancement techniques and greater management of the lake resources does suggest that reservoir fisheries do have the `potential' to increase yields and so make a higher contribution towards global fish production.
vri' ioto! q Page: 25
1
Chapter 1
There is very little work currently being performed to unlock this potential. Of concern, is that for this to be achieved, a radical change in direction and interest among the various players must be realised. There is little evidence of this
happening and unless reservoir designers and operators, fisheries departments
and researchers, and especially the communities, combine efforts under the
common interest of optimising fish yield little production increase can be expected.
REFERENCES
Abdel-Latif, A. F. (1984) Lake Nasser (Egypt). Status of African reservoir fisheries. (eds J. M. Kapetsky and T. Petr). CIFA Technical Paper. 10: 193-246.
Ali, A. B. and Lee, K. Y. (1995) Chenderoh Reservoir, Malaysia: a characteristic of a small scale, multigear and multispecies commercial fishery in the tropics. Fisheries Research. 23: 267-281.
Amarasinghe, U. S. (1987) Recent trends in the inland fishery of Sri Lanka. In: Workshop on Tilapia in capture and culture-enhanced fisheries in the Indo-Pacific Fishery Commission Counties, Bogor, Indonesia, 27-29 June (E. A. Baluyut ed. ). FAO Fisheries Report. 84-102.
Amarasinghe, U. S. and De Silva, S. S. (1999) Sri Lankan reservoir fishery: a case study for introduction of a co-management strategy. Fisheries Management
and Ecology. 6: 387-399.
Anne, I., Lelek, A. and Tobias, W. (1994) Post-impoundment changes in water quality and fish stocks in two large West African reservoirs (Manantali and Selingue, Mali). Intemational Revue Gesamten Hydrobiology, 79, (1): 61-75.
Avakyan, A. B. and lakovleva, V. B. (1998) Status of global reservoirs: the position in the late twentieth century. In: Lakes and Reservoirs, Research and Management. 3: 45-52.
Page: 26

Chapter 1
Ayeni, J. S. O. and Mdaihli, M. (1999) The integrated approach of water hyacinth
control on Kainji Lake: with special regard to the design, construction and installation of a water hyacinth barrier across the River Niger. Kainji Lake
Fisheries Promotion Project Technical Report Series. 15. GTZ, Eschbom,
Germany. ISBN 978 037 014 5.36pp.
Azadi, M. A., Islam, M. A. and Paul, J. G. (1992) Biology and fishery of the Catfish
Mystus aor in the Kaptai Reservoir, Bangladesh. In: Reservoir Fisheries of Asia: Proceedings of the 2 "d Asian Reservoir Fisheries Workshop held in
Hangzhou, People's Republic of China. 15-19 Oct. 1990. Ottawa, Ont.,
S. S. de Silva ed. IDRC. ISBN 0 88936 590 3.16: 125-140.
Bailey, R. G. and Denny, P. (1978) The 1974 biological survey of Nyumba ya Mungu Reservoir, Tanzania, Concluding remarks. Biological Journal of the Linnean Society 10, (1): 151-157.
Balon, E. K. (1974) Fishes of Lake Kariba, Africa, T. F. H. Publications. Neptune City, NJ, 144pp.
Baluyut, E. A. (1983) A review of inland water capture fisheries in South-East Asia
with special reference to fish stocking. In: Indo-Pacific Fisheries Commission (IPFC). Summary Reports and Selected Papers Presented at the 1PFC Workshop on Inland Fisheries for Planners, Manila, Philippines, 2-6 August 1982. FAO Fisheries Report 288. (T. Petr ed. ).
Baluyut, E. A. (1999) Introduction and fish stocking in lakes and reservoirs in Southeast Asia: a review. In: Fish and Fisheries of Lakes and Reservoirs in Southeast Asia and Africa. (eds W. L. T. van Densen, and M. J. Morris). Westbury Publishing, Otley, UK. ISBN 1 84103 004 X: 29-48.
Bazigos, G. P. (1971) Frame survey at Kainji Lake. Statistical Studies No. 1. (FI: SF/MIR 24/). Rome, FAQ. 50pp.
Page: 27
Chapter 1
Bazigos, G. P. (1979) The yield patterns and their implications for fisheries development of some selected man-made lakes and river basins in Africa.
In: Proceedings of the International Conference on Kainji Lake and River
Basin Development in Africa. lbadan, 11-17 Dec. 1977. Published by the
Kainji Lake Research Institute. 2: 296-315.
Beadle, L. C. (1974) The inland waters of tropical Africa, Longman, London. 365pp.
Bemacsek, G. M. (1984) Dam design and operation to optimise fish production in impounded river basins. CIFA Technical Paper. 11.98pp.
Bemacsek, G. M. and Lopes S. (1984) Cahora Bassa. In: Status of African Reservoir Fisheries. (eds J. M. Kapetsky and T. Petr). CIFA Technical Paper, 10: 21-42.
Bhukaswan, T. (1985) The Nam Pong basin (Thailand). FAO Fisheries Technical Paper. Rome, Italy. 265: 55-85.
Bhukaswan, T. and Chookajom, Y. (1988) Reservoir fisheries management in Thailand. In: Reservoir Fishery Management and Development in Asia. Proceedings of a Workshop held in Kathmandu,. Nepal, 23-28 Nov. 1987. S. S. De Silva ed. Ottawa, Canada. The International Development Research Centre (Canada), ISBN: 0 88936 515 6: 154-163.
Braimah, L. I. (1995) Fisheries of Lake Volta. In: Current. Status of the Fisheries and Fish Stocks of the Four Largest African Reservoirs: Kainji, Kariba, Nasser-Nubia and Volta. (ed R. C. M. Crul and F. C. Roest). C/FA Technical Paper, No. 30. Rome, FAO: 112-134.
Brooks, D. B. (2002) Water: local-level Management. In: Focus from Research to Policy. IDRC 2002, ISBN 0-88936-996-8.80pp.
Costa-Pierce, B. A. (1991) Small water bodies for sustainable fisheries production. NAGA, The ICLARM Quarterly, 14: 3-5.
Page: 28

Chapter 1
Cowx, I. G. (1991) Catch effort sampling strategies: conclusions and
recommendations for management. In: Catch Effort Sampling Strategies;
their Application in Fresh water Fisheries Management. (I. G. Cowx ed. ).
Fishing News Books. ISBN 0 85238 177 8: 404-413.
Cowx, I. G. (1998) An appraisal of stocking strategies in the light of developing
country constraints. In: Inland Fishery Enhancements. Papers presented at the FAO/DFID Expert Consultation on Inland Fishery Enhancements Dhaka,
Bangladesh, 7-11 April 1997. (ed T. Petr). FAO Fisheries Technical Paper
No. 374. Rome FAO: 119-152.
Cowx, I. G. and Kapasa. C. K. (1995) Species changes in reservoir fisheries following impoundment: the case of Lake Itezhi-tezhi, Zambia. In: The Impact of Species Changes in African Lakes. (eds T. J. Pitcher and J. B. Hart). Chapman and Hall, London. ISBN 0 412 55050 4,15: 321-332.
De Graaf, G. J. and Ofori-Danson, P. K (1997) Catch and fish stock assessment in
stratum VII of Lake Volta. Integrated Development of Artisanal Fisheries (GHZ/93/008). IDAFiTechnical Reporf/97/1. FAO, Rome. 96pp.
Dela Cruz, C. R. (1998) Social, economic and cultural aspects in implementing inland fishery enhancements in the Philippines. In: Inland Fishery Enhancements. Papers presented at the FAO/DFID Expert Consultation on Inland Fishery Enhancements Dhaka, Bangladesh, 7- 11 April 1997. (ed T. Petr). FAO Fisheries Technical Paper. No. 374. Rome FAO: 323-336.
De Silva S. S. (1988a) Reservoirs of Sri Lanka and their fisheries. FAO. Fisheries Technical Paper. 298.128pp.
De Silva, S. S. (ed. ). (1988b) Reservoir bed preparation in relation to fisheries development: an evaluation. In: Reservoir Fisherv Manaaement and Development in Asia. Proceedings of a Workshop held in Kathmandu, Nepal, 23-28 Nov. 1987. Ottawa, Canada. The International Development Research Centre (Canada), ISBN: 0 88936 515 6: 121-130.
Page: 29

Chapter 1
De Silva, S. S., Zhitang, Y. and Lin-Hu, X. (1991 a) A brief review of the status and
practises of the reservoir fishery in mainland China. Aquaculture and
Fisheries Management. 22: 73-84.
De Silva, S. S., Moreau, J., Amasinghe, U. S. Chookajom, T. and
Guerrero, R. D. (1991b) A comparative assessment of the fisheries in
lacustrine inland waters in three Asian countries based on catch and effort
data. Fisheries Research. 11: 177-189.
De Silva S. S. and Amarasinghe U. S. (1996) Reservoir fisheries in Asia.
In: Perspectives in Asian Fisheries. A volume to commemorate the
10th Anniversary of the Asian Fisheries Society, S. S. De Silva ed. Asian
Fisheries Society, Manila: 189-216.
De Silva, S. S. (2001) Reservoir fisheries: broad based strategies for enhancing
yields. In: Reservoir and Culture Based Fisheries: Biology and Management.
Proceedings of an international workshop held in Bangkok, Thailand,
15-18 Feb. 2000. S. S. De Silva ed. ACIAR Proceedings, No. 98. ISBN 0 642
456941: 7-15.
du Feu, T. A. (2003a) The changing fishery of Lake Kainji, Nigeria from impoundment
to some 30 years after. PhD. Thesis submitted to the University of Hull, UK.
Chapter 6: 180-228.
du Feu, T. A. (2003b) Co-management in reservoir fisheries: Lake Kainji, Nigeria-
a case study. PhD. Thesis submitted to the University of Hull, UK. Chapter 8.262-309.
du Feu, T. A. (2003c) Data collection in a reservoir fishery (Lake Kainji, Nigeria); the trade-off between cost and accuracy. PhD. Thesis submitted to the University of Hull, UK. Chapter 7: 229-261.
Page: 30
Chapter 1
Entz, B. A. G. (1984) A synthesis and evaluation of activities of FAO/UNDP projects
on five African man-made lakes: Kainji, Kariba, Kossou, Nasser-Nubia and Volta. FAO Fisheries Circular. No. 774.34pp.
FAO, (1983) Yearbook of fisheries statistics. Volume 52. FAO, Rome, Italy.
FAOSTAT (2001) CD-ROM. FAO Statistical Databases. FAO, Rome, Italy,
ISBN 9250 045 352.
Fernando, C. H. (1991) Impacts of fish introductions in Tropical Asia and America. Can. Journal Fisheries Aquatic Science. 48, (Suppl. 1). 24-32.
Fernando, C. H. and Holcik, J. (1982) The nature of fish communities: a factor influencing the fishery potential and yields of tropical lakes and reservoirs. Hydrobiolgia. 97: 127-140.
Fernando, H. and Petr, T. (1994) Reservoir fishery management and tropical limnology. International Revue Gesamten Hydrobiology. 79, (1): 3-5.
Gangsheng, T., Zhanpeng, Y. and Boping, L. (1992) Management of the fishery of Fuqiaohe Reservoir, Hubei Province, China. In: Reservoir Fisheries of Asia: Proceedings of the 2 "d Asian Reservoir Fisheries Workshop held in Hangzhou, People's Republic of China. 15-19 Oct. 1990. S. S. De Silva ed. Ottawa, Ont., IDRC. ISBN 0 88936 590 3: 149-154.
Guerrero, III R. D. (1987) The status of reservoir fisheries in the Philippines. In: Reservoir Fishery Management and Development in Asia. Proceedings of a Workshop held in Kathmandu, Nepal, 23-28 Nov. 1987. S. S. De Silva ed. Ottawa, Canada. The International Development Research Centre (Canada), ISBN: 0 88936 515 6: 14-18.
Goeltenboth, F. and Kristyanto, A. I. A. (1994) Fisheries in the Rawa Pening Reservoir, Java, Indonesia. International Revue Gesamten Hydrobiology. 79. (1): 113-129.
Page: 31
Chapter 1
Gurgel, J. J. S. and Fernando, C. H. (1994) Fisheries in semi-arid Northeast Brazil with special reference to the role of tilapia. International Revue Gesamten Hydrobiology. 79: 7-94.
Haldar, G. C., Ahmed, K. K., Alamgir, M., Akhter, J. N. and Rahman, M. K. (2002) Fish
and fisheries of Kaptai Reservoir, Bangladesh. In: Management and Ecology
of Lake and Reservoir Fisheries. (I. G. Cowx ed. ). Fishing News Books.
ISBN: 0 85238 2839.144-158.
Hardjamulia, K., Setiadi, E. and Rabegnatar, N. S. (1987) Some biological aspects of the predominant fish species in the Jatiluhur Reservoir, West Java, Indonesia. In: Reservoir Fishery Management and Development in Asia. Proceedings of a Workshop held in Kathmandu, Nepal, 23-28 Nov. 1987. S. S. De Silva ed. Ottawa, Canada. The International Development Research Centre (Canada), ISBN: 0 88936 515 6: 98-103.
Henderson, H. F. and Welcomme, R. L. (1974) The relationship of yield to
morophoedaphic index and numbers of fishermen in African fisheries. FAO. Rome, CIFA Occasional Paper. No. 1.19pp.
Hu, B. T. (1994) Cage culture development and its role in aquaculture in China, Aquaculture and Fisheries Management. 25: 305-310.
Hu, B. and Lu Y. (1998) The development of cage culture and its role in fishery
enhancement in China. In: Inland Fishery Enhancements. Papers presented at the FAO/DFID Expert Consultation on Inland Fishery Enhancements Dhaka, Bangladesh, 7-11 April 1997. (ed. T. Petr). FAO Fisheries Technical Paper. No. 374. Rome FAO. 255-262.
Huang, D., Liu, J. and Hu, C. (2001) Fish resources in Chinese reservoirs and their untilisation. In: Reservoir and Culture Based Fisheries: Biology and Management. Proceedings of an international workshop held in Bangkok, Thailand, 15-18 Feb. 2000. S. S. De Silva ed. ACIAR Proceedings, No. 98. ISBN 0 642 45694 1: 16-21.
Page: 32
Chapter 1
ICOLD (1998) World register of dams 1998. ICOLD-CIGB, 151 Bd Haussmann,
Paris 75008, France.
Isaacman, A. and Sneddon, C. (2000) Toward a social and environmental history of
the building of Cahora Bassa Dam. Journal of South African Studies. 26, (4):
597-632.
Jackson, P. B. N., Marshall, B. E. and Paugy, D. (1988) Fish communities in man-
made lakes. In: Biology and Ecology of African Fresh water Fish.
(eds P. N. B. Jackson and M. N. Bruton). ISBN 0371 6023: 325-350.
Jentoft, S. (2000) The community: a missing link of fisheries management.
Marine Policy. 24: 53-59.
Jhingran, A. G. (1992) Recent advances in reservoir fisheries management in India. In: Reservoir Fisheries of Asia: Proceedings of the 2nd Asian Reservoir
Fisheries Workshop held in Hangzhou, People's Republic of China,.
15-19 Oct 1990. S. S. De Silva ed. Ottawa, Ont., IDRC. ISBN 0 88936
590 3: 158-175.
Jhingran, A. G., Zhitang, Y. and Zegui, D. (1992) Present status and prospects for
reservoir fisheries in China. In: Reservoir Fisheries of Asia: Proceedings of the 2"d Asian Reservoir Fisheries Workshop held in Hangzhou, People's Republic of China,. 15-19 Oct. 1990. S. S. De Silva ed. Ottawa, Ont., IDRC. ISBN 0 88936 590 3.16: 176-185.
Laiz Averhoff, O. I. (1999) Fish yield in Cuban reservoirs and relationships with some Morphometric and edaphic parameters. Lakes & Reservoir Research and Management. 4: 75-83.
Lawson, G. W. (1970) Lessons of the Volta- a new man-made lake in tropical Africa. Biological Conservation. 2. (2): 90- 97.
Page: 33
Chapter 1
Lelek, A. (1972). Fish populations of Kainji Lake: trends in their development and
utilisation. FI: SF/NIR 24 Technical Report. 2.121 pp.
Losse, G. F. (1998) The small-scale fishery on Lake Kariba in Zambia. Published by
Deutsche Gesellschaft für Technische -Zusammenarbeit (GTZ) GmbH,
Eschbom, Germany. ISBN 3 88085 522 6.310pp.
Lowe-McConnell, R. H. (1999) Lacustrine fish communities in Africa. In: Fish and Fisheries of Lakes and Reservoirs in Southeast Asia and Africa.
(eds W. L. Van Densen and M. J. Morris). Westbury Publishing, Otley, UK.
ISBN 1 84103 004 X: 29-48.
Lu, X. (1986) A review of reservoir fisheries in China. FAO Fisheries Circular. No. 803. Rome. 37pp.
Machena, 'C. (1995) Recent developments in the fisheries of Lake Kariba (Zambia/Zimbabwe). In: Current Status of Fisheries and Fish Stocks of the Four Largest African Reservoirs, Kainji, Kariba, Nasser-Nubia and Volta. (eds R. C. M. Crul and F. C. Roest). CIFA Technical Paper., No. 30. Rome, FAO: 41-80.
Mandima, J. J. (1996) Limitations of catch and effort data collection methods used for inland fisheries in the SADC region, with particular reference to Zimbabwe. In: Stock Assessment in Inland Fisheries. (ed. I. G. Cowx). Fishing News Books, Oxford. ISBN 0 85238 224 3.27: 368-377.
Marshall, B. E. (1984) Predicting ecology and fish yields in African reservoirs from pre-impoundment physico-chemical studies. CIFA. Technical. Paper, 12.1-21.
Masifwa, W. F., Twongo T. and Denny P. (2001) The impact of water hyacinth, Eichhomia crassipes (Mart) Solms on the abundance and diversity of aquatic macro invertebrates along the shores on northern Lake Victoria, Uganda. Hydrobiologia. 452: 79-88.
Page: 34

Chapter 1
Mattson, N. S., Balavong, V., Nilsson, H., Phounsavath, S. and Hartmann, W. D.
(2001) Changes in fisheries yield and catch compostion at the Nam Ngum
Reservoir, Lao PDR. In: Reservoir and Culture Based Fisheries: Biology and Management. Proceedings of an international workshop held in Bangkok,
Thailand, 15-18 Feb. 2000. S. S. De Silva ed. ACIAR Proceedings, No. 98.
ISBN 0 642 45694 1: 48-55.
Mdaihli, M. and du Feu, T. A. (1994) Small-scale cage fish farming -a possible approach for fisheries development in Kainji Lake? An internal report of the Kainji Lake Fisheries Promotion Project. GTZ, Eschbom, Germany. 23pp.
Moreau, J. and De Silva, S. S. (1991) Predictive fish yield models for lakes and reservoirs of the Philippines, Sri Lanka and Thailand. FAO Fisheries Technical Paper. No. 319. Rome, FAO. 41 pp.
Motwani, M. P. (1970) Fishery investigations on the Niger and Benue Rivers in the
northern region and development of a programme of riverine fishery
management and training. UNDP/FAO Technical Report to the Government
of Nigeria. (T. A. 2771). 196pp.
Nilsson, H., Phonsavath, S., Khumsri, M. and Hartmann, W. D. (2001) Fisheries
co-management in two large reservoirs- problems and challenges. In: Reservoir and Culture Based Fisheries: Biology and Management. Proceedings of an international workshop held in Bangkok, Thailand, 15-18 Feb. 2000. S. S. De Silva ed. ACIAR Proceedings, No. 98. ISBN 0 42 45694 1: 314-320.
Njiru M., Othina, A. N., Getabu, A., Tweddle, D. and Cowx, I. G. (2002) Is the invasion of water hyacinth Eichhomia crassipes Solms (Mart. ), a blessing to Lake Victoria fisheries? In: Management and Ecology of Lake and Reservoir Fisheries. (I. G. Cowx ed. ). Fishing News Books. ISBN: 0 85238 2839.21: 255-263.
Page: 35

Chapter 1
Pauly, D. V., Christensen, S., Guenette, S., Pitcher, T. J., Sumaila, U. R., Walters, C. J., Watson R. and Zeller D. (2002). Towards sustainability in
world fisheries. Nature. 418: 689-695.
Pet, J. S. and Piet, G. J. (1993) The consequence of habitat occupation and habitat
overlap of the introduced tilapia Oreochromis mossambicus and indigenous fish species for fishery management in a Sri Lankan reservoir. Journal of
Fisheries Biology. 43 (Supplement A): 193-208.
Pet, J. S., Wijsman, J. W. M., Mous, P. J. and Machiels, M. A. M. (1995) Characteristics
of a Sri Lankan reservoir fishery and consequences for the estimation of
annual yield. Fisheries Research. 24: 9-13.
Pet, J. S., Van Densen, W. L. T. and Vijverberg, J. (1999) Management options for the
exploitation of introduced tilapia and small indigenous cyprinids in Sri Lankan
reservoirs. In: Fish and Fisheries of Lakes and Reservoirs in Southeast Asia
and Africa. (eds W. L. T. van Densen and M. J. Morris). Westbury Publishing, Otley, UK. ISBN 1 84103 004 X: 159-185.
Petr, T. (1974). Distribution, abundance of food of commercial fish in the Black Volta
and Volta man-made lake in Ghana during the filling period (1964-68). 11. Characidae. Hyrobiologia, 45: 303-337.
Petr, T. (1994) Intensification of reservoir fisheries in tropical and subtropical countries. International Revue Gesamten Hydrobiology, 79, (1): 131-138.
Petrere, M. (1996) Fisheries in large tropical reservoirs in South America. Lakes and Reservoirs, Research and Management. 2: 111-133.
Phan, P. D. and De Silva, S. S. (2000) The fishery of the Ea Kao reservoir, southern Vietnam: a fishery based on a combination of stock and recapture, and self-recruiting populations. Fisheries Management and Ecology, 7: 251-264.
Page: 36

Chapter 1
Pholprasith, S and Sirimongkonthaworn, R. (1999) The fish community of Ubolratana
Reservoir, Thailand. In: Fish and Fisheries of Lakes and Reservoirs in
Southeast Asia and Africa. (eds van Densen, W. L. T. and M. J. Morris).
Westbury Publishing, Otley, UK. ISBN 1 84103 004 X: 103-115.
Pitcher, T. J. (1995) Thinking the unthinkable: a candidate model for predicting
sustainable yields of introduced fish species in African lakes. In: The Impact
of Species Changes in African Lakes. (eds. T. J. Pitcher and J. B. Hart).
Chapman and Hall, London. ISBN 0 412 55050,4.23: 495-525.
Postma, D. J. and van der Knapp, M. (1999) Developments in the fishery of Lagdo
Reservoir, Cameroon. In: Fish and Fisheries of Lakes and Reservoirs in
Southeast Asia and Africa. (eds W. L. T. van Densen and M. J. Morris). Westbury Publishing, Otley, UK. ISBN 1 84103 004 X: 311-325.
Quirös, R. (1998) Reservoir stocking in South America, an evaluation. In: Inland
Fishery Enhancements. Papers presented at the FAO/DFID Expert Consultation on Inland Fishery Enhancements Dhaka, Bangladesh, 7-11 April 1997. (ed T. Petr). FAO Fisheries Technical Paper No. 374. Rome FAO: 91-118.
Quirös, R. and Mari, A. (1999) Factors contributing to the outcome of stocking programmes in Cuban reservoirs. Fisheries Management and Ecology. 5: 241-254.
Rahman, M. A. (1988) The need for reservoir fishery management in Bangladesh. In: Reservoir Fishery Management and Development in Asia. Proceedings of a Workshop held in Kathmandu, Nepal, 23-28 Nov. 1987. S. S. De Silva ed. Ottawa, Canada. The International Development Research Centre (Canada), ISBN: 0 88936 515 6: 164-168.
Page: 37
Chapter 1
Rashid, M. M. (1995) Some additional information on limologoy and fisheries of Lakes
Nasser (Egypt) and Nubia (Sudan). In: Current Status of the Fisheries and
Fish Stocks of the Four Largest African Reservoirs: Kainji, Kariba, Nasser-
Nubia and Volta (eds R. C. M. Crul and F. C. Roest). CIFA Technical Paper.
No. 30. Rome, FAO: 81-109.
Rosegrant, M. W., Paisner, M. S., Meijer, S. and Witcover, J. (2001) Global food
outlook: Trends, alternatives and choices. 2002 Vision Food Policy Report.
Washington, D. C., U. S. A. International Food Policy Research
Institute. 206pp.
Senlin, X. (1988) Fishing techniques in Chinese reservoirs. In: Reservoir Fishery
Management and Development in Asia. Proceedings of a Workshop held in
Kathmandu, Nepal, 23-28 Nov. 1987. S. S. De Silva ed. Ottawa, Canada.
The International Development Research Centre (Canada),
ISBN: 0 88936 515 6: 169-175.
Sifa, L. and Biyu, Z. (1990) The yield and growth of major fish species in a large
Chinese reservoir. Asian Fisheries Science. 3: 185-196.
Singit, G. S., Ramamohan, R. and Krishnamaraju, H. V. (1988) Post impoundment
changes and effects of conflicting uses on the fisheries of Tungabhadra Reservoir, India. In: Reservoir Fishery Management and Development in Asia. Proceedings of a Workshop held in Kathmandu, Nepal,
23-28 Nov. 1987. S. S. De Silva ed. Ottawa, Canada. The International Development Research Centre (Canada), ISBN: 0 88936 515 6: 136-144.
Sugunan, V. V. (1995) Reservoir fisheries of India. FAO Fisheries Technical Paper. No. 345. Rome, FAQ. 423pp.
Sugunan, V. V. (1997) Fisheries management of small water bodies in seven countries in Africa, Asia and Latin America, FAO Fisheries Circular No. 933 FIRI/C933.
Page: 38

Chapter 1
Sugunan, V. V. (2000) Ecology and fishery management of reservoirs in India.
Hydrobiologia, 430: 121-147.
The Economist. (2003) World in figures. 2003 edition. Published by the Economist.
Profile Books. UK. ISBN 1 86197 424 8.236pp.
UNEP. (2002) Global Environment Outlook 3, UNEP, Earthscan Publications Ltd,
London, ISBN: 1853 8384 54.416pp.
Van, N. S. and Luu, L. T. (2001) Status of reservoir fisheries in Vietnam. In: Reservoir
and Culture Based Fisheries: Biology and Management. Proceedings of an international workshop held in Bangkok, Thailand, 15-18 Feb. 2000.
S. S. De Silva ed. ACIAR Proceedings, No. 98. ISBN 0 642 45694 1: 29-35.
van der Knaap M., Ngwa W. M., Malam A., Pala A. and Gilbert B. (1991) Production
de peche du lac Lagdo en 1990 et recommendations pour la gestion de
peche, Avril 1991. MEAVSB, Rapport NEB/PECHE/TECH/91/02.
van der Knapp, M. (1994) Status of fish stocks and fisheries of thirteen medium sized African reservoirs, CIFA Technical Paper. No. 26. Rome, FAO. 107pp.
Vanderpuye, C. J. (1984) Fisheries and limnology of Volta Lake. In: Status of African
Reservoir Fisheries. (eds J. M. Kapetsky and Petr, T. ). CIFA Technical
Paper, No. 10: 261-320.
Verdegem, M. C. J. (1999) Lake and reservoirs in Indonesia, Malaysia, the
Philippines, Singapore and Thailand. In: Fish and Fisheries of Lakes and Reservoirs in Southeast Asia and Africa. (eds W. L. T. van Densen and M. J. Morris). Westbury Publishing, Otley, UK. ISBN 1 84103 004 X:
425-432.
Verheust, L. (1998) Obtaining basic information for the enhancement of small water body fisheries: a regional project viewpoint. In: Inland Fishery Enhancements. Papers presented at the FAO/DFID Expert Consultation on Inland Fishery Enhancements Dhaka, Bangladesh, 7-11 April 1997. (ed. T. Petr). FAO Fisheries Technical Paper. No. 374. Rome FAO: 183-203.
Page: 39

Chapter 1
Virapat, C. and Mattson, N. S. (2001) Inventory of reservoir fishery resources in
Thailand. In: Reservoir and Culture Based Fisheries: Biology and Management. Proceedings of an international workshop held in Bangkok,
Thailand, 15-18 Feb. 2000. S. S. De Silva ed. ACIAR Proceedings, No. 98.
ISBN 0 642 45694 1: 43-47.
Vorosmarty, C. J., Sharma, K. P., Fekete, B. M., Copeland, A. H., Holden, J., Marble, J.
and Lough, J. (1997) The storage and ageing of continental runoff and large
reservoir systems of the world. Ambio. 26 (4): 210-219.
WCD (World Commission on Dams). (2000) Dams and development: a new framework for decision making. Published by Earthscan Publications Ltd. ISBN 1 85383 798 9.
Welcomme, R. L. and Bartley, D. M. (1998) An evaluation of present techniques for
the enhancement of fisheries. In: Inland Fishery Enhancements. Papers
presented at the FAO/DFID Expert Consultation on Inland Fishery Enhancements Dhaka, Bangladesh, 7-11 April 1997. (ed. T. Petr). FAO Fisheries Technical Paper. No. 374. Rome FAO: 1-35.
Worthington, E. B. and Lowe-McConnell, R. H. (1994) African lakes reviewed: creation and destruction of biodiversity. Environ. Cons. 21: 199-213.
Yap Siaw-Yang, (1991) Catch effort sampling data involving indigenous gears in Bukit Merah Reservoir, Malaysia: a re-evaluation. In: Catch Effort Sampling Strategies; their Application in Fresh water Fisheries Management. (I. G. Cowx ed. ). Fishing News Books. ISBN 0 85238 177 8: 361-372.
Yusoff, F. M., Zaidi, M. Z. and Ambak, M. A. (1995) Fisheries and environmental management of Lake Kenyir, Malaysia. In: Regional Symposium on Susustainable Development of Inland Fisheries under Environmental Contraints. (eds. T. Petr and M. Morris). FAO Fisheries Report. No. 512: 112-128.
Page: 40

Chapter 2
Chapter 2
Physical, sociological and fishery aspects of Lake Kainji, Nigeria.
ABSTRACT
The physical, sociological and fishery aspects of one of the most studied reservoirs in West Africa are described. Lake Kainji was created in 1968 by impounding the River Niger in north-west Nigeria. The lake is the largest man-made reservoir in Nigeria and has a maximum surface area of 1270 km2, a length of 137 km and is 24 km at the widest point. The Kainji basin has a diverse topography that comprises of a deep lower section, a shallow central basin with large areas of floodplains and a narrow riverine upper area. There are two separate flood regimes; the 'white flood' that is highly turbid and the 'black flood' that has clear water. The former receives water from local rains and coincides with one of the highest annual drawdowns of water in African reservoirs of up to 9.7 m. The lake has a large turnover of water that is equivalent to four times its volume every year. This gives it the characteristics of a large slow moving river. Kainji Dam was built for the generation of hydroelectricity and has secondary benefits of downstream flood control. It also supports an important and diverse artisanal fishery that comprised of around 4500 fishing entrepreneurs (year 2000). In 1998, the fish production from Lake Kainji was amongst the highest of any African impoundment. The annual yield of some 28,850 t (225 kg hä' yr'), provided an important source of protein for the rural population at this time. Numerous studies of the changes to the riverine fish fauna, limnology and the fishery took place after impoundment. Research activity reduced after 1978. Findings were updated by a technical co-operation project that started in 1993. Consequently, Lake Kainji is the most studied impoundment in West Africa and has one of the most comprehensive time series of fisheries data of any African reservoir. The information is used to describe the characteristics of the lake. Aspects of the topography, climate, hydrology, limnology, as well as, social and fishery aspects of Lake Kainji are discussed. A catalogue of important events and research activities is included.
Key words: climate; fishery research; hydrology; Lake Kainji; physical description; reservoir fishery; sociology; tropical reservoir.
Page: 41
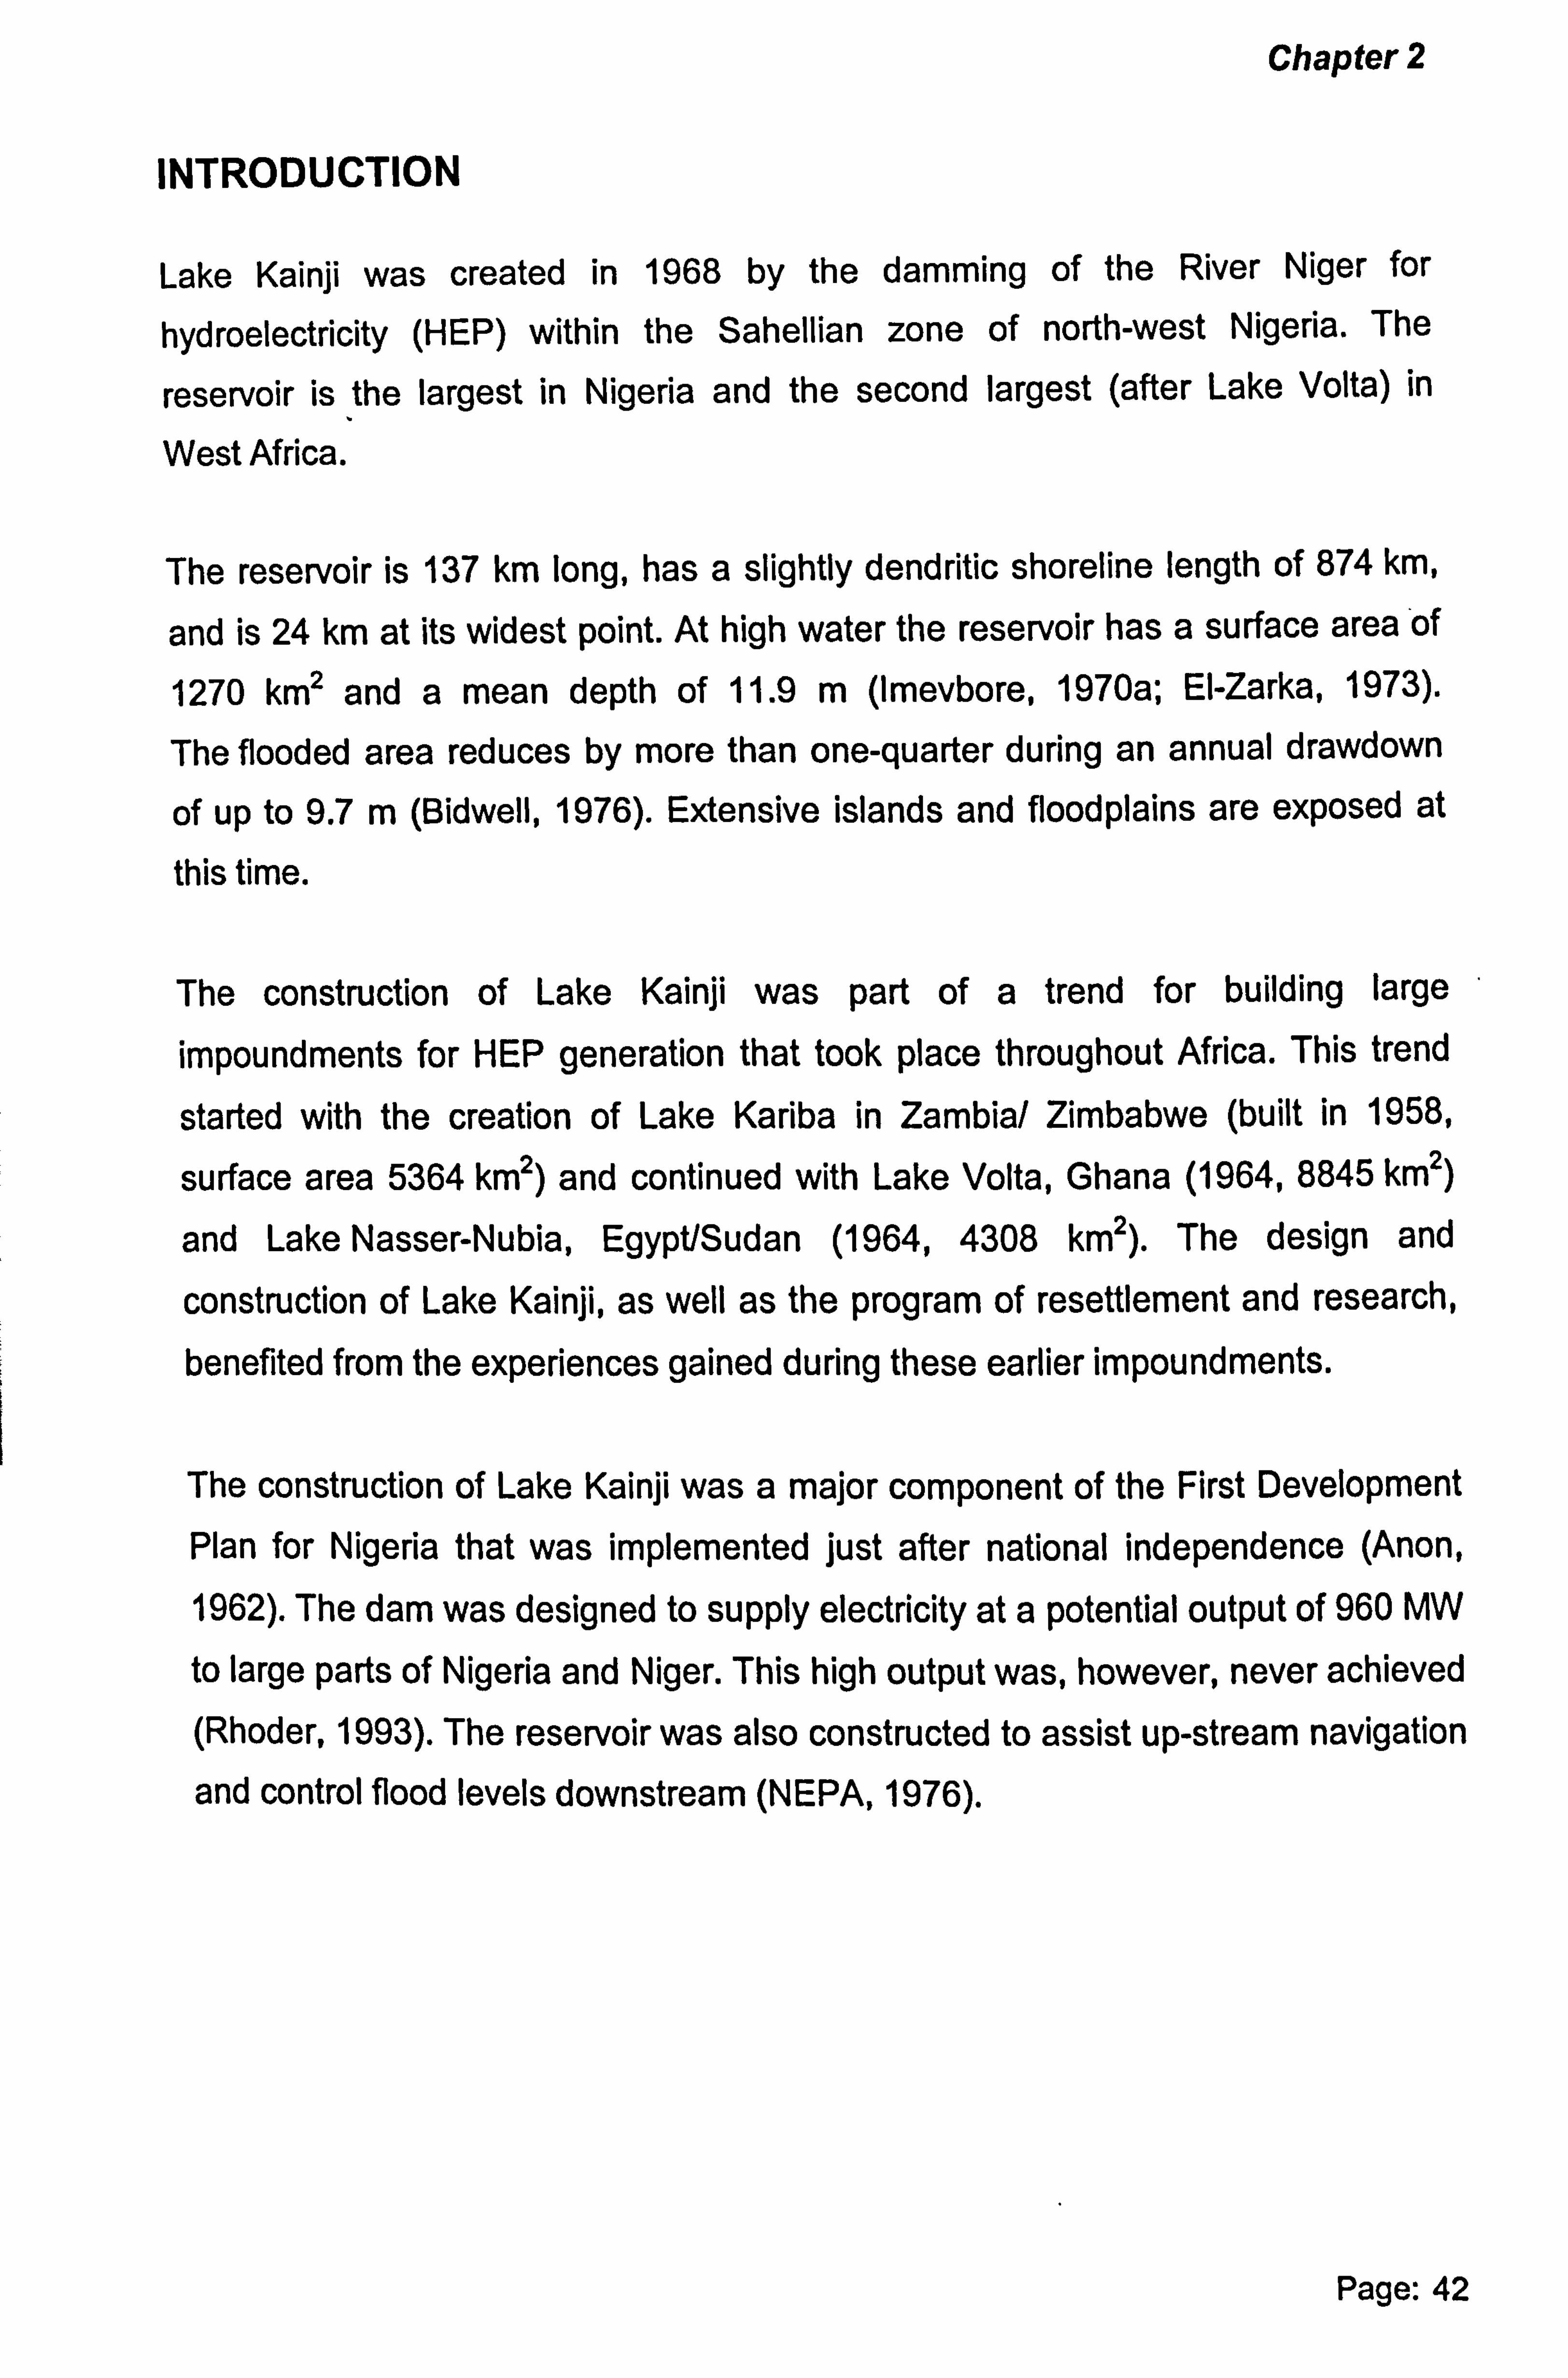
Chapter 2
INTRODUCTION
Lake Kainji was created in 1968 by the damming of the River Niger for
hydroelectricity (HEP) within the Sahellian zone of north-west Nigeria. The
reservoir is the largest in Nigeria and the second largest (after Lake Volta) in
West Africa.
The reservoir is 137 km long, has a slightly dendritic shoreline length of 874 km,
and is 24 km at its widest point. At high water the reservoir has a surface area of
1270 km2 and a mean depth of 11.9 m (Imevbore, 1970a; EI-Zarka, 1973).
The flooded area reduces by more than one-quarter during an annual drawdown
of up to 9.7 m (Bidwell, 1976). Extensive islands and floodplains are exposed at
this time.
The construction of Lake Kainji was part of a trend for building large
impoundments for HEP generation that took place throughout Africa. This trend
started with the creation of Lake Kariba in Zambia/ Zimbabwe (built in 1958,
surface area 5364 km2) and continued with Lake Volta, Ghana (1964,8845 km2)
and Lake Nasser-Nubia, Egypt/Sudan (1964,4308 km2). The design and
construction of Lake Kainji, as well as the program of resettlement and research, benefited from the experiences gained during these earlier impoundments.
The construction of Lake Kainji was a major component of the First Development
Plan for Nigeria that was implemented just after national independence (Anon,
1962). The dam was designed to supply electricity at a potential output of 960 MW
to large parts of Nigeria and Niger. This high output was, however, never achieved (Rhoder, 1993). The reservoir was also constructed to assist up-stream navigation and control flood levels downstream (NEPA, 1976).
Page: 42
Chapter 2
Research activities of Lake Kainji commenced in 1965 (before impoundment)
through a joint co-operation program between Nigerian and UK universities based
at Shagunu (Fig. 1). This was followed in 1968 by the 'UNDP Kainji Lake
Research Project' (KLRP) with its headquarters in New Bussa. In 1975 the KLRP
became the 'Kainji Lake Research Institute' (KLRI), before changing to the
'National Institute for Fresh water Fisheries Research' (NIFFR) in 1987. The
knowledge of Lake Kainji was later updated by research conducted as part of a
nine-year technical co-operation project entitled the 'Nigerian-German (GTZ) Kainji
Lake Fisheries Promotion Project' (KLFPP) which commenced in 1993
(KLFPP, 1996).
A review of the early literature on Lake Kainji was given by Ibeun (1995) who noted that 335 publications, including 100 journal articles, were produced for the lake area. The majority of these were written between 1970 and 1979.
Physical descriptions of the proposed flooded area were included in NEDECO (1959) and NEDECO & Balfour Beatty (1961). The lake basin was detailed by lmevbore (1970a) and EI-Zarka (1973). Ecological studies undertaken before impoundment formed part of reports edited by White (1965) and the first volume of Kainji Lake Studies edited by Visser (1970). Information detailing sociological aspects, including the resettlement program, were included in a second volume of studies edited by Mabogunje (1973).
The hydrology and limnology of the lake was studied by Henderson (1973), Karlman (1973), Adeniji (1975) & Adeniji et al. (2001). Bidwell (1976) assessed the influence that the large drawdown has on lake productivity.
Early studies on the fish resource focused on how the fish communities from the River Niger changed to accommodate the new lacustrine environment (Banks et al., 1965; ' Motwani & Kanwai, 1970; Turner, 1971; Lelek, 1972; Lewis, 1974).
Page: 43
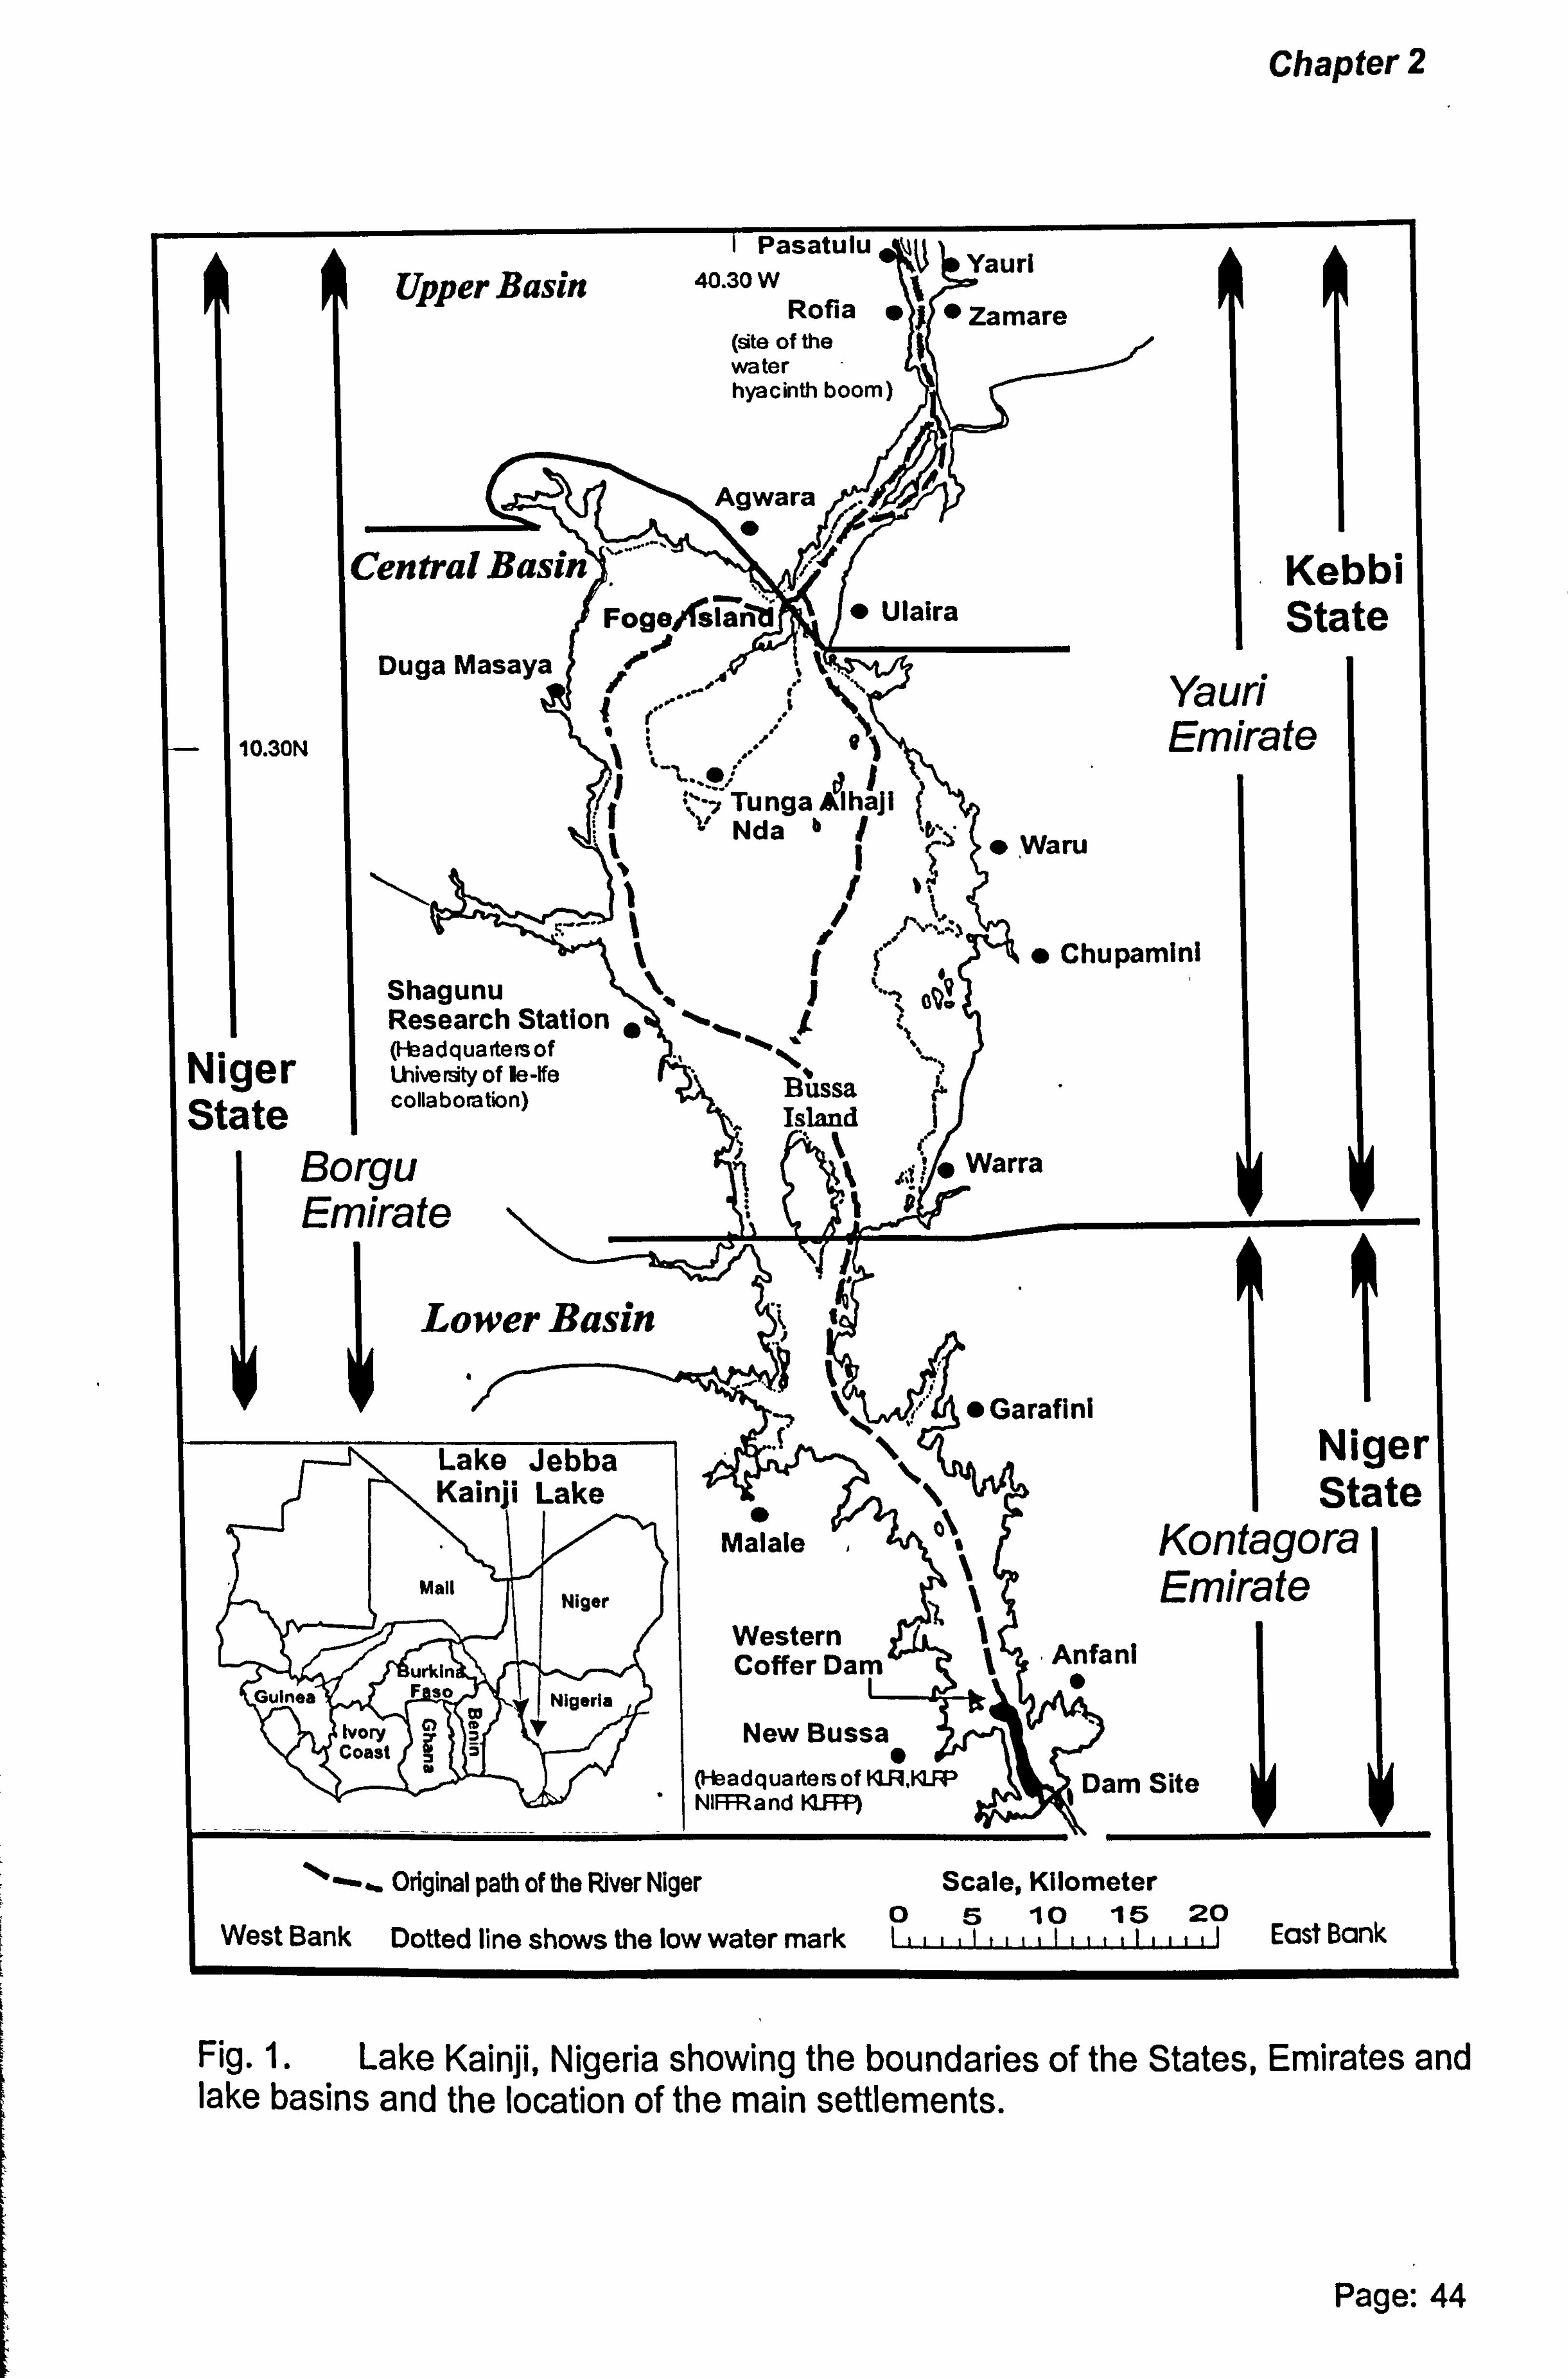
Chapter 2
Upper Basin wKV I*
40.30 W Yaurl
Rofia "" Zamare (site of the water hyacinth boom)
Agwara \"
10.30N
Niger State
Central Basin ý�ýerfQiai " Ulaira
TungaAºIhajl Nda b
Shagunu `""- Research Station (I- adquadersof Wive rsity of le-Ife collaboration)
Bussa
Duga Masaya
Borgu Emirate
isiana
1i
Lower Basin
Lake Jebba Kainji Lake
Mall Niger
urkin
Ivory jr V
be F so Nigeria
Coast 5
" Waru 1
Kebbi State
Yauri Emirate
ý"a " Chupamini
Warra
t
.ý\ ;" Garafini ` Niger
State Malale °\; Kontagora
Emirate Western 1
Anfani Coffer Dam "
New Bussa "
(1- adquaitersof WR, IIW Dam Site NIFFRand W. FF9
Original path of the River Niger Scale, Kilometer 05 10 15 20
West Bank Dotted line shows the low water mark t111tßtI 11 ti IIi I East Bank
Fig. 1. Lake Kainji, Nigeria showing the boundaries of the States, Emirates and lake basins and the location of the main settlements.
Page: 44
Chapter 2
The distinct annual flood periods of the reservoir, the large drawdown and
associated fertile floodplains and the high flow through of water have created an
environment for fish species approximately similar to the pre-impounded river. An estimated 92 species were present within the newly impounded lake
(Lelek, 1972). Many of these have thrived and now support a diverse, but purely
artisanal, fishery. In the year 2000, the fishery comprised of an estimated 7500 fishing entrepreneurs and assistants and had an annual fish yield of around 13,400 t (KLFPP, 2001). The lake fishery supplied much needed protein for people living up to 620 km south of the lake area around this time (Anthonio, 1995).
I endeavor to present the reader with a comprehensive background and description of the lake, so as to set the stage for the subsequent chapters in this thesis that focus on various aspects of the Lake Kainji fishery.
I begin by presenting a catalogue of events, research and fishery development
activities that have taken place around the Lake Kainji basin from pre- impoundment to some 30 years later. Results from the research are then
presented commencing with a physical description of the River Niger, construction of the lake and program of resettlement, and descriptions of the lake basin including climate, hydrology, productivity, aquatic vegetation and the fishery.
CHRONOLOGICAL LISTING OF IMPORTANT EVENTS AND RESEARCH ON LAKE KAINJI (REFERENCES ARE GIVEN IN BRACKETS):
1953 A preliminary assessment of the HEP potential of the River Niger by the Netherlands Engineering Consultants, commissioned by the Federal Government of Nigeria (NEDECO, 1959). The assessment formed part of the First Development Plan for Nigeria (1962 to 1968) (Anon, 1962).
1958 A detailed assessment of the HEP potential of the River Niger close to Jebba by Balfour Beatty, UK. (NEDECO & Balfour Beatty, 1961).
1960 Independence of Nigeria from colonial rule of the United Kingdom.
Page: 45

Chapter 2
1960 Authorisation of financial assistance for the construction of Kainji Dam, north of Jebba, by the International Bank for Reconstruction
and Development (World Bank).
1960 An assessment of fishery potential of the. proposed Lake Kainji area (Daget, 1961 a&b).
1962 Creation of the Niger Dams Authority; mandated to coordinate the
construction of dams and the improvement of navigation, irrigation
and fisheries on the River Niger.
1964 Start of construction work on Kainji Dam by a consortium of three
Italian companies (entitled Impregilo) (Oyebande et a/., 1980).
1965 Start of a three-year research program by the Universities of Ile-Ife (now Obafemi Awolowo University) and Liverpool, funded by the Niger Dams Authority. Studies of the hydrology, the algae, zooplankton and fish assemblages, fishing technology and health
problems in the pre-impounded River Niger (included in White, 1965).
1966 Surveys by the joint university team to forecast the number of fisherfolk, canoes, fishing gears and the fishery technology (Aiyedun & Adegboye, 1967; Reed, 1970) and the value of fish catch (Ahmed, 1966) in the proposed Lake Kainji area. Two year survey of the river fisheries in the north of Nigeria, including the proposed Lake Kainji
area (Motwani, 1967). Sociological studies undertaken by the Nigerian Institute of Social and Economic Research (NISER) (included in Mabogunje, 1973 [ed. ]).
1967-1970 Civil War (Biafran War for Nigerian Unity).
1967 Implementation of the resettlement program prior to the flooding of Lake Kainji (Mabogunje, 1973. [ed. ]).
Page: 46
Chapter 2
Aug. 1968 Dam completed (on schedule) and start of lake filling.
1968 Start of the UNDP KLRP, with the FAO as the executing agency. Aspects of research included limnology, fish biology, fishery
technology, fishery statistics, wildlife ecology, range management, irrigation, agronomy, sociology, economics and public health
(Entz, 1984).
1968 Study of the fish trapped in the western coffer dam that was formed
upstream of the Kainji Dam construction (Fig. 1) (Motwani & Kanwai,
1970). Survey on fish marketing in the upper reaches of Lake Kainji
(Anthonio, 1968).
1968-1971 Study on the biological characteristics of the main commercial fish
species and the factors that affect their production and exploitation. Programme of experimental gill net trial fishing started (June 1969 to
May 1971) (Turner, 1971; Lelek, 1972).
1970 Start of collaboration between the Universities of Ile-Ife (Nigeria) and Southampton (UK) funded by the Overseas Development Administration (UK) to study commercially important species of the lake fishery (Imevbore, 1969). Continuation of gill net trial fishing (October 1970-September 1972) (Lewis, 1974). Frame survey of Lake Kainji (Bazigos, 1971).
1970 Symposium on the development of Lake Kainji at the University of Ile-Ife (Imevbore & Adegoke, 1975).
1970- 1971 Catch assessment survey of Lake Kainji (Bazigos, 1972).
1972 Handover of research activities from Southampton to Reading University (UK) for continued collaboration with the University of Ile-Ife.
Page: 47
Chapter 2
1974 Handover of the UNDP/FAO KLRP to the Federal Government of Nigeria.
1974 Opening of a fisheries technical college in the grounds of the KLRP
headquarters in New Bussa (Fig. 1).
1975 Opening of the KLRI in New Bussa; a centre for multi-disciplinary
research on Lake Kainji.
1975 Creation of Kainji Lake National Park (area 5,500 km2) (Ayeni, 1999).
1975,1978 Frame surveys of Lake Kainji (Ekwemalor, 1975 & 1978).
1976 Catch assessment survey of Lake Kainji (Ekwemalor, 1977).
1978 End of collaborated research between Nigerian and UK universities.
1978 to 1993. Reduced research activity of the Lake Kainji fishery.
1983 Creation of Lake Jebba causing the outward migration of 1025
fishermen (entrepreneurs & assistants) from Lake Kainji
(Balogun, 1985).
1987 Expansion in the mandate of the KLRI from responsibilities for Lake
Kainji to include those for research in fisheries and aquatic resources throughout Nigeria. Name change to the National Institute for Fresh
water Fisheries Research (NIFFR).
1989 National Conference on 'Two Decades of Research on Lake Kainji' (Ayeni & Olatunde, 1992. [eds]).
1991 Transfer of Borgu Local Government Area from Kwara to Niger State.
Page: 48
Chapter 2
1993 Water hyacinth (Eichhornia crassipes (Martius) Solms) plants
observed on Lake Kainji.
1993 Start of a nine-year technical co-operation project the Nigerian-
German Kainji Lake Fisheries Promotion Project (KLFPP). The
project goal was that 'the well-being of the fishing communities
around Lake Kainji is enhanced'. The project objective of the first
three-year 'Orientation phase' was that a management plan is
prepared, tested and partly implemented for the lake fishery
(KLFPP, 1996).
1993-1996 Three-year intensive research program on socio-economic and fisheries aspects undertaken by the KLFPP.
Including:
1993-2000 Annual frame surveys of Lake Kainji by the KLFPP (du Feu, 1993; du Feu & Omorinkoba, 1995; Apeloko & du Feu, 1996; du Feu &
Abayomi, 1997a).
1995-2000 Monthly catch assessment surveys by the KLFPP (Turner, 1994 &
1996; du Feu & Omorinkoba, 1996; du Feu & Abayomi, 1997b).
1995 Start of an aquatic weed program for Niger Grass and Water Hyacinth by NIFFR. Joint collaboration in the communal control of water hyacinth component with the KLFPP (Ayeni et al., 1994; Obot et al., 1995; Ayeni & Mdaihli, 1999; Olokor, 1999).
1996 Replication of the KLRI gill net trial fishing by the KLFPP (Ita, 1998).
1996 Start of the KLFPP 'Implementation phase'. Project objective; 'that a management plan for the natural resources of Lake Kainji is implemented' (KLFPP, 1996).
Page: 49

Chapter 2
1997 Length frequency data collection for 14 months by the KLFPP
(du Feu & Abiodun, 1998).
1997 Revision of the two State Fisheries Edicts and formation of the Kainji
Lake Fisheries Management and Conservation Unit (KLFMCU)
(du Feu, 1996; Olawale, 1996).
1998 Implementation of the licensing of fisherfolk.
1999 Implementation of the ban on fishing with beach seines.
2000 Start of the KLFPP 'Handover phase'. Project objective; 'that the
implementation of the management plan for the resources of Lake
Kainji is sustained by the project counterpart institutions'.
2000 Official opening of the water hyacinth control barrier constructed at
the inlet to the lake (Lahmeyer Int., 1997; Ayeni & Mdaihli, 1999).
2002 Handover of the KLFPP to the project implementation committee.
THE KAINJI LAKE FISHERIES PROMOTION PROJECT
In 1993, reported declines in fish catches from the Traditional Authorities around
Lake Kainji initiated the idea of a joint technical co-operation project between the
Governments of Nigeria and Germany. Entitled 'The Kainji Lake Fisheries
Promotion Project' (KLFPP), it was executed by four implementing agencies:
o The Federal Department of Fisheries, Abuja o NIFFR, New Bussa o The Fisheries Department of Niger State o The Fisheries Department of Kebbi State.
German involvement was planned for nine years; a period divided equally into an
orientation, an implementation and a handover phase.
Three years of intensive research covering the socio-economic and fishery
aspects of the reservoir was undertaken during the orientation phase. The results were used to formulate a fisheries management plan that was appropriate for the lake fishery and which could be easily implemented through an approach that
maximised the participation by the local communities.
Page: 50
Chapter 2
The research results were used to formulate a management plan for the lake
fishery. The management plan was then incorporated into revised State Fisheries
Edicts for Niger and Kebbi States (du Feu, 1996; Olawale, 1996). An innovation of both Edicts was the recognition that interested parties from the lakeside
communities (including those people exploiting the various lake resources and the
Traditional Authorities) could assume some of the managerial responsibilities that
were previously assigned to Government Fisheries Officers. The inclusion
provided the legal backing for the envisaged management of the lake's natural
resources using the approach of community based fisheries management (CBFM).
The structure of the CBFM approach, the key players and their responsibilities best suited to the specific conditions and management needs of Lake Kainji only became apparent after much discussion and a test/orientation phase involving the
communal clearance of water hyacinth (Ayeni, 1997).
An output of this process was the adjustment of CBFM into a co-management approach in 1997. This was coordinated by a 'Kainji Lake Fisheries Management
and Conservation Unit' (KLFMCU). The Unit consisted of members from Niger and Kebbi State Fisheries Departments, the Emirate Councils (Traditional Authorities)
and elected local fisherfolk. The Unit had the responsibility for the management of the lake's natural resources and coordinated the involvement of the communities. Technical support to the Unit was given by seconded staff from the GTZ and NIFFR (KLFPP, 1996).
The priorities identified by the KLFMCU were to establish methods that would stabilise the decline in fish catch, and by which fishing effort on the lake could be
controlled and the KLFMCU could be funded in the long-term. The ban on fishing with beach seines and the licensing of fisherfolk were the envisaged solutions to these problems. The two areas, together with the water hyacinth control component, were the major activities of the KLFMCU during the life-time of the KLFPP.
Page: 51

Chapter 2
THE RIVER NIGER
During the late Pliocene and early Pleistocene eras (approx. 1.8 million years ago)
the river course of the present River Niger flowed westwards from the Guinea-
Sierra Leone border into the Gulf of Senegal. Subsequent periods of droughts
produced a barrier of sand dunes, that 10,000 to 15,000 years ago blocked its
route and diverted the flow into a large closed basin; Lake Araouane north-west of Timbouctou. The lake eventually overflowed some 5000 to 6000 years ago
causing the watercourse to flow eastwards rather than westwards where it joined
the lower River Niger (Beadle, 1974).
The present source of the River Niger is at 800 m altitude in the Fouta Jallon
Highlands; a point that is only 250 km from the closest point on the Atlantic coast (Imevbore, 1969). The river then starts its journey through the and Sahel,
traversing Mali and Niger before emptying into the Gulf of Guinea on the Nigerian
coast (Fig. 2). The river travels along a semi-circular route of some 5,750 km that
makes it the longest river in West Africa and the fourteenth longest in the world (Turner, 1971; Meredith & Malvestuto, 1989).
SAHEL SERI Mauritania Timbouctou
Senegal Mali " Wý" yyý Niger Bamako ? j. ý ý" "+1yyý, Wv ý e Fouts alion Burkina Faso
� Lake Iý I e cnaa Mountai ek Benin Nigeria Sie eone ote D'Ivoire Ghana Jebba B°
Lake Lake OP %r
\` ý Equator
Scale, Kilometer Gulf of Guinea w ý, Swamp area 0 500 1000
Fig. 2. The River Niger, West Africa showing the location of Lake Kainji.
Page: 52
Chapter 2
Malvestuto & Meredith (1989) noted that since the late 1960s, there has been a
change in the annual flood cycle of the River Niger. The change was most
pronounced during the 1983 to 1985 drought in the Sahellian region of West Africa
when the peak and duration of the flood was depressed.
The long-term change to the flood cycle is confirmed by comparing graphs of
monthly lake water levels of Lake Kainji between 1970 and 1971
(from Lelek, 1972) with those from 1997. The comparison indicates that the peak
water level during the flood has started to decline much earlier (reducing in
January rather than March). The minimum water level recorded during the
drawdown in August was also some two meters lower than recorded in 1970 and 1971. The earlier decline in the peak water level reduces the length of time that
newly spawned fingerlings can stay within the submerged flood plain or nursery
area. The lower water levels during the drawdown also result in a greater
concentration of fish and an increased vulnerability to predation and fishing
pressures.
CONSTRUCTION OF LAKE KAINJI
Lake Kainji is located approximately 1000 km from the delta of the River Niger (Turner, 1971). The lake was formed in a large river valley and the dam sited at a point where it narrows at Kainji Island. Kainji Dam was constructed between February 1964 and August 1968 (Oyebande et al., 1980). The project employed a total of 15,000 people and cost £87 million (Roder, 1993).
Jenness (1970) and EI-Zarka (1973) noted that almost 70% of the central basin
area was cleared of bush before impoundment. The clearance is the highest level
achieved for any African reservoir. Prior to the filling of the reservoir, a small lake (cofferdam) developed upstream of the dam wall (Fig. 1) (Imevbore, 1966).
After closure of the dam the lake took just 84 days to fill, with the water level rising by an average of 38.5 cm per day (Turner, 1971). The reservoir failed to reach its maximum level until the second year after impoundment. Halstead (1975) stated that flooding caused all the submerged vegetation to die, except for a few trees that survived for up to a year. Lelek (1972) noted that wave erosion quickly formed banks, particularly on the steeper western margins.
Page: 53

Chapter 2
RESETTLEMENT
Atkinson (1973) reported that during filling some 42,000 people'(density 49 km2
lake area) from 192 settlements were displaced and resettled within 125 newly
created villages and towns. Householders that were resettled were compensated
room for room within the new villages. Cash compensation was given for grain
silos, crops and economic trees that were flooded (Roder, 1993).
Wilson (1975) noted that the people derived from the three Emirates of Yauri,
Borgu and Kontagora and included the ethnic groups of Lopawas, Gungawas, Bussawas and Kamberi. The Lopawas were full time fishermen, the Gungawas
and Bussawas were fishermen and traders, whilst the Kamberi, were predominantly farmers at this time.
Oyedipe (1983) recorded that the largest resettled group were the Gungawas who occupied 111 of the new resettlement villages. Reed (1970) noted that Gungawas
mainly lived in Yauri Emirate, particularly in the upper Basin where almost half (46%) of the total number of fisherfolk were resettled (Roder, 1993).
The concentration of fisherfolk in the upper basin at resettlement was 15 fisherfolk per km2 lake area. This was far higher than the central basin where just 1.7 fisherfolk km2 were resident. The attraction of the north was the good farming land, ease of access and the traditional claim by the Emirate of Yauri to
more shoreline, swamp and land in the river fishery (Reed, 1970). Some 700 migrant fishermen of the Sorkawa and Kyedyawa ethnic groups were also displaced during the resettlement program (Wilson, 1975).
SOCIOLOGICAL STRUCTURES OF THE LAKE KAINJI FISHERFOLK Three Emirates (Traditional Authorities) of Borgu, Kontagora and Yauri border Lake Kainji. Each is administered by His Royal Highness 'The Emir' who heads the Emirate Council. Each Emirate is sub-divided into Districts; 14 of which border the lake. The Districts are administered by District Heads who oversee Village Heads and report directly, to the Emir. Each village is governed by a council of Village Elders and overseen by a Village Head. Some villages also have a head of fishing, or 'Sarkin Ruwa', who is responsible for matters affecting the fishery and the lake (lbeun & Mdaihli, 1994).
Page: 54
Chapter 2
The traditional system was highly respected and appeared effective, being
responsible for the majority of local governance within the Lake Kainji area. It had
less standing among the 'outside' migrant fisherfolk who saw themselves as
somewhat exempt from the Emirates' authority.
The indigenous population around the lake basin are almost all of the Muslim faith
and the Koran guides much of their daily lives. Wives are kept within family
compounds during day time (purdah). Women often have their own income. Most
process and smoke their husband's fish catch (for a fee) and a few fish (Alamu &
Mdaihli, 1995; Rettberg et al., 1995). Although they represent an important target
group, extension activities targeting the women was extremely difficult and had to
be directed through female extension workers (du Feu & Abiodun, 1999).
Traditional savings systems for raising money to buy fishing equipment exist in the
villages. The Adashe system is a administered by a paid leader who looks after
pooled funds from a small group (Roder, 1993).
PHYSICAL DESCRIPTION OF LAKE KAINJI
Lake Kainji, in north-west Nigeria is located on the lower section of the River Niger, 1010 km from its discharge into the Atlantic. The lake is positioned between 9°50' and 10°55'N and longitudes 4°25 to 4°45'E and extends from the Northern Guinea Savannah zone to the Sub-Sudan Vegetation zone in the north (Imevbore, 1970a).
The lake has a surface area at high water of 1270 km2 that reduces by 28% during
an annual drawdown of up to 9.7 m (Bidwell, 1976). When full, the water level
reaches a height of 142 m above sea level (Lelek, 1972). The lake is 137 km long
and 24 km at its widest point. The mean depth is 11.9 m and 7.5 m at the highest and lowest flood levels respectively. The maximum depth of 60 m occurs close to the dam wall (Welcomme, 1972; Karlman, 1973). Lake Kainji has a catchment area of 1.6 million km2 and an annual inflow of 80,000 million m3 (Baton & Coche, 1974).
Page: 55
Chapter 2
Lake Kainji has an exceptionally high exchange of water of 4: 1, giving it the
characteristics of a very slow moving river. The high flow through causes a rapid
exchange of nutrients, a shorter and less pronounced period of thermal
stratification and provides a flood regime for the spawning and early development
of fish similar to that experienced in the river (Karlman, 1982).
The reservoir comprises three basins that differ considerably in physical nature. The upper basin stretches 48 km upstream from Foge Island to Pasatulu village
and has a water surface area of 207 km2 at high water (Motwani, 1970) (Fig. 1).
It is strongly influenced by the River Niger and is characterised by high water
current speeds, numerous islands and interlocking channels. The basin's northern boundary marks the limit of the lake's seasonal floodplain (Imevbore, 1970a).
Prior to the flooding, the central basin possessed many swamps and
criss-crossing channels (Daget, 1961b; Lelek, 1972). Near Agwara, the River Niger split into two before rejoining 30 km downstream at Old Bussa
(Lewis, 1974); the middle island now forms Foge Island. The basin extends from
Bussa Island to Ulaira village. It has a maximum width of 24 km and has a mean depth of only 7.2 m. With a surface area of 977 km2 at high water the basin
constitutes 70% of the total lake area (Karlman, 1982). Floodplains that are some three kilometers wide during the annual drawdown characterise the basin's
eastern margins.
Before lake formation, the River Niger within the lower basin divided forming an island 5 km in length. On either side were small rapids interspersed with islands
and projecting promontories (Imevbore, 1970a; Motwani, 1970). The flooded area in the lower basin is narrow (four to seven kilometers wide) and has a maximum depth of 60 m (Henderson, 1973; Karlman, 1973).
Halstead (1975) reported that the substratum of the lake is composed of sandy and silty alluvium. The substrate was deposited during a period of increased rainfall during the last ice age, when it acted as a sediment trap similar to the present marshes around Timbouctou. Taiwo (1984) suggested that the alluvial sediments signify the existence of a previous water body of approximately the same size as Lake Kainji.
Page: 56
Chapter 2
The fertility of these silts possibly contributed to the initial high lake productivity just after flooding and 'aided the establishment of the littoral zone. Before
impoundment the area was productive and used extensively for naturally irrigated
rice paddies and onion cultivation. The western margins of the lake are composed
of cretaceous rocks and are less fertile, proving a disappointment to those farmers
displaced by the lake (Jenness, 1970; Halstead, 1975).
CLIMATE OF THE LAKE KAINJI AREA
The Lake Kainji area has a savannah climate. March and April are the hottest
months with temperatures reaching 39°C (Imevbore, 1970a). The rainy season occurs during the South-West Monsoon and extends from May to October, with 60% to 70% of the 1000 mm annual total falling between July and September (Fig. 3) (Jenness, 1970). Squalls with strong winds of up to 100 km hr 1 are usual during the start and end of the rains. Winds mainly occur in the evening and deter fisherfolk from fishing or traveling on the lake at night.
The dry season occurs during the remaining six months and is characterised by dry Sahel air (North-East Trades) that blow between November and April. The
winds are laden with harmattan dust and this reduces solar radiation, causing a cooling of air and lake water that in turn lowers the lake primary productivity (Obeng-Asamoa, 1977).
HYDROLOGY OF LAKE KAINJI
Two floods with separate catchment areas some 1600 km apart serve Lake Kainji. The major flood originates from rainfall in the highlands of Fouta Djallon in Guinea (Fig. 2). The water takes six months to travel the 2700 km distance to Lake Kainji (Eaton et al., 1965). During the journey two-thirds of its volume is lost in the deltaic swamp areas around Timbouctou, where slow currents result in the deposition of silt. On reaching Lake Kainji, the water is almost clear apart from small amounts of detrital material (Henderson, 1973; Karlman, 1982). This is called the 'black flood' and it flows into the lake from December to March, has a peak flow of 2,000 m3 second"', and causes the highest lake water level at the time of the local dry season (Lelek, 1972; Bidwell, 1976).
Page: 57
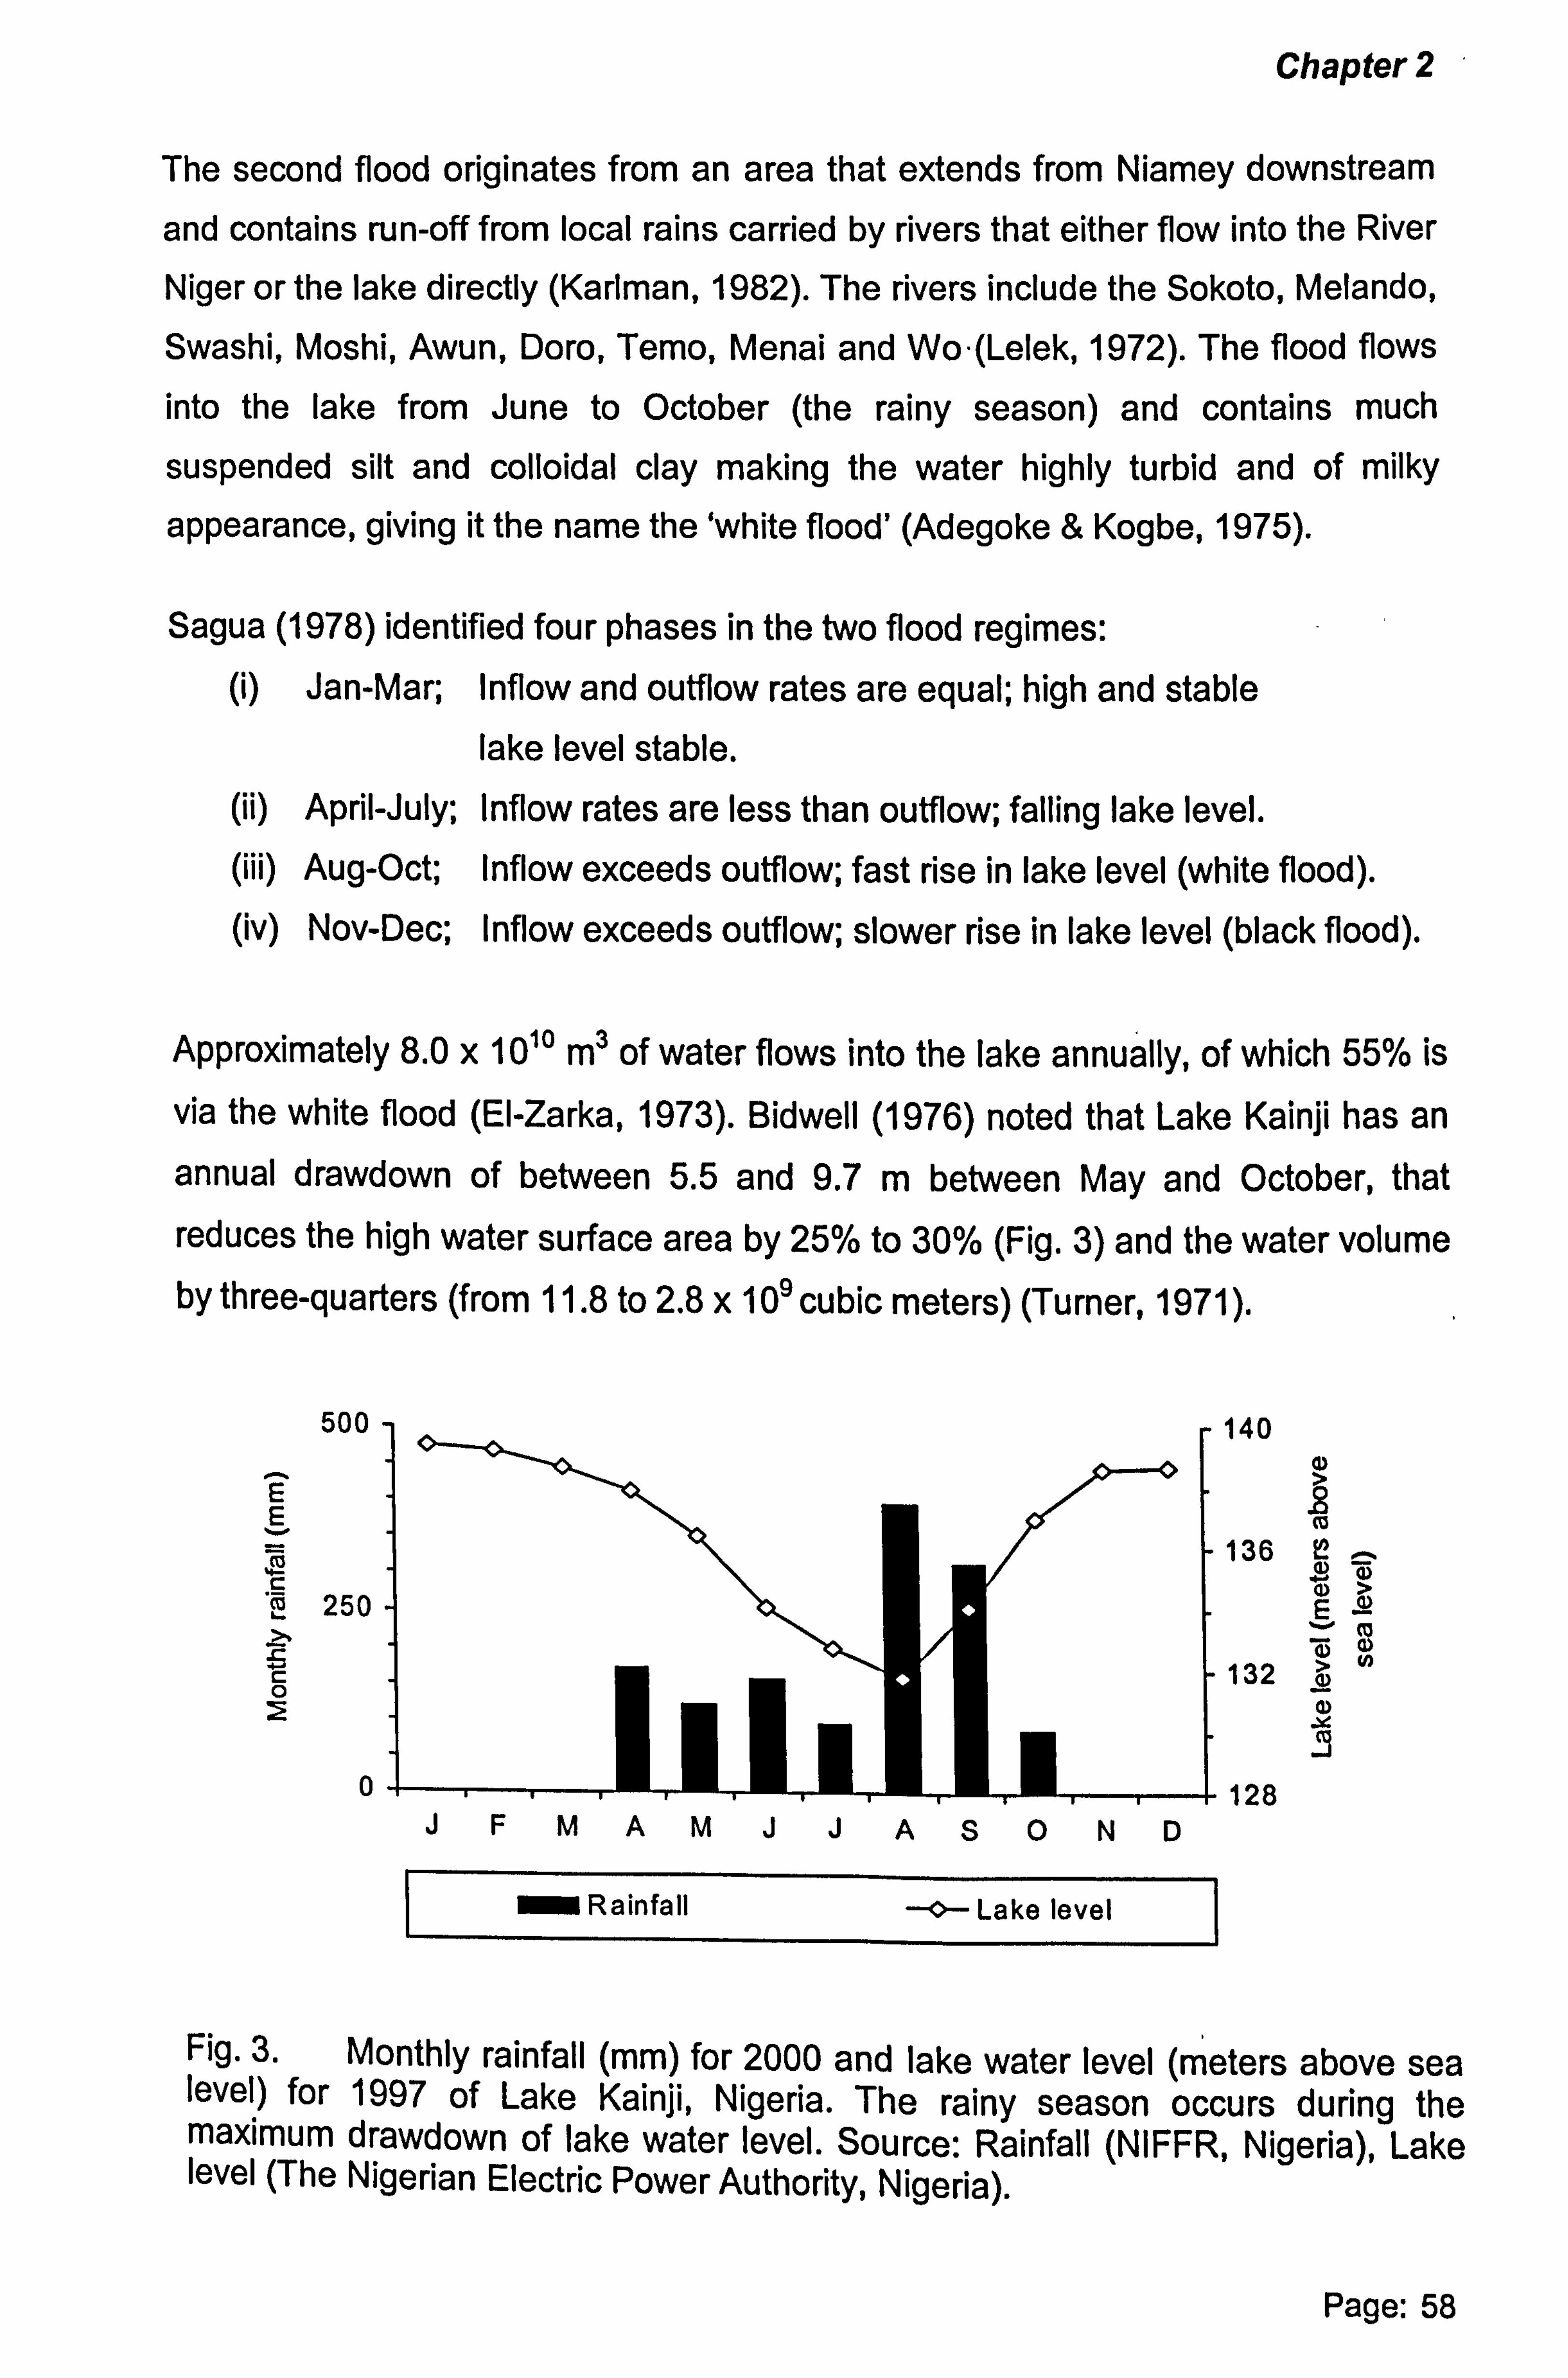
Chapter 2
The second flood originates from an area that extends from Niamey downstream
and contains run-off from local rains carried by rivers that either flow into the River
Niger or the lake directly (Karlman, 1982). The rivers include the Sokoto, Melando,
Swashi, Moshi, Awun, Doro, Temo, Menai and Wo. (Lelek, 1972). The flood flows
into the lake from June to October (the rainy season) and contains much
suspended silt and colloidal clay making the water highly turbid and of milky
appearance, giving it the name the `white flood' (Adegoke & Kogbe, 1975).
Sagua (1978) identified four phases in the two flood regimes: (i) Jan-Mar; Inflow and outflow rates are equal; high and stable
lake level stable. (ii) April-July; Inflow rates are less than outflow; falling lake level. (iii) Aug-Oct; Inflow exceeds outflow; fast rise in lake level (white flood). (iv) Nov-Dec; Inflow exceeds outflow; slower rise in lake level (black flood).
Approximately 8.0 x 10¹⁰ m3 of water flows into the lake annually, of which 55% is
via the white flood (EI-Zarka, 1973). Bidwell (1976) noted that Lake Kainji has an annual drawdown of between 5.5 and 9.7 m between May and October, that
reduces the high water surface area by 25% to 30% (Fig. 3) and the water volume by three-quarters (from 11.8 to 2.8 x 10⁹ cubic meters) (Turner, 1971).
500
E E
42 250
t c 0 m
0
Rainfall -o- Lake level
140
136
132
m
w
E 5 >N
c) Y
`9
128
Fig. 3. Monthly rainfall (mm) for 2000 and lake water level (meters above sea level) for 1997 of Lake Kainji, Nigeria. The rainy season occurs during the maximum drawdown of lake water level. Source: Rainfall (NIFFR, Nigeria), Lake level (The Nigerian Electric Power Authority, Nigeria).
Page: 58
JF MA MJJASOND
Chapter 2
Malvestuto & Meredith (1989) found that the annual flood cycle of the River Niger
had changed since the late 1960s. This was most pronounced during the 1983 to
1985 drought in the Sahellian region of West Africa when the peak and duration of
the flood was much depressed.
The long-term changes of the flood cycle is confirmed by comparing graphs of
monthly lake water levels from 1970 to 1971 (from Lelek, 1972) with those from
1997. This suggests that the peak water level during the flood declined much
earlier (reducing in January rather than March) in 1997 compared to 1970 to 1971.
This would shorten the time that newly spawned fingerlings can stay within the
submerged flood plain or nursery area. The water level during the draw own in August was also some two meters lower than that previously recorded in 1970 and 1971. This would result in a greater concentration of fish and an increased
vulnerability to predation and fishing pressures.
The most notable changes during the drawdown are the enlargement of Foge
Island in the central basin and the exposure of floodplains at the mouths of inflowing rivers and the shorelines of the upper and central-eastern basins. Other
effects are the appearance of submerged trees and the stranding of vegetation
such as Niger Grass (Echinochloa stagnina (Retz)) and Water Hyacinth. Remnant
trees are particularly numerous in the lower and western central lake basin.
The lowering of the water level'is accompanied by a fall in the abundance of invertebrates on areas of steep shoreline, whilst abundance in the shallow central lake basin rises. Taiwo (1984) suggested that this was caused by insects (notably
Chironomid larvae) laying their eggs on the emergent vegetation. As the lake rises the decomposing vegetation becomes a habitat for benthic invertebrates (principally larvae of aquatic insects and aquatic worms). These invertebrates form
an important food source for the fish at this time (Bidwell, 1976).
Page: 59
Chapter 2
The lowest solar radiation and water transparency occurs during the peak of the
white flood in August and September (Karlman, 1982; Adeniji, 1990).
Adeniji et al. (2001) recorded an annual range in transparency between 0.2 and
3.2 m using a 20 cm white Secchi disk. The depth is much shallower than the
transparency observed by Karlman (1973) in 1971. The decrease may be due to
the higher erosion of land due to increased agricultural activity and reduced tree
cover.
Adeniji et al. (2001) noted that the lake water temperature, like the air temperature,
was highest just before the rains (29.5 °C), after which it fell. Lowest temperatures
occurred during the dry season from November to February (24.5°C) when the
dust-laden air decreased the solar radiation.
The annual pattern of thermal stratification of the water column has been
described by Henderson (1975). Lake Kainji becomes stratified in late February
and remains semi-permanently stratified from March to July due to rising
temperatures and a decrease in the inflow of water. Strong winds at the start of the
rainy season cause mixing and a breakdown of the layers. Karlman (1982) noted
that during stratification, oxygen is depleted in the hypolimnion, hydrogen sulphide
develops and pH levels rise from 6.0 to 6.5.
Imevbore (1975) noted that the high water exchange of Lake Kainji limited the
extent of stratification and lead to a greater mixing of nutrients and gases. The
mixing increased productivity. However, Karlman (1982) suggested that the rapid
turnover of water causes much of the resulting phytoplankton/ zooplankton biomass to be lost downstream.
PRIMARY PRODUCTION
lmevbore (1970a) noted that the River Niger has a very low mineral content (especially of phosphate and nitrate) compared with other major African rivers. Karlman (1973) compared the gross pelagic primary production of Lake Kainji with 24 other tropical and sub-tropical lakes in Africa and India. He concluded that the
combined low nutrient content, solar radiation and water transparency resulted in
the daily and annual mean primary production for Lake Kainji being amongst the lowest recorded.
Page: 60
Chapter 2
More recent investigations by Adeniji et al. (2001) supported this, stating that the
primary production in other African reservoirs is between two and ten times higher
than Lake Kainji. They further noted that the production in the upper and central basins in 1996 was lower (1.4 g 02 M-2 day') than recorded by Karlman in 1971
(2.3 g 02 M-2 day"'). This was possibly caused by lower nutrient levels compared
with just after the initial flooding.
Both Adeniji (1975) and Karlman (1982) found that water transparency causes
annual variation in the primary production in Lake Kainji, which is lowest during the
turbid ̀ white flood'; whilst the overall magnitude of production is limited by the lack
of nutrient supply.
FISH SPECIES
Lake Kainji contains 'Nilo-Sudanian' fish communities and comprises of around 30 fish families (Beadle, 1974; Lowe-McConnell, 1999). These include species of the Centropomidae, L. niloticus, the Characidae, the large benthivor Citharinidae, Citharinus and Distichodus sp. and the Cichlidae (Oreochromis niloticus, Sarotherodon galilaeus (Linnaeus, 1758) and Tilapia zillii (Gervais, 1848). A list of fish species recorded for the lake is given in Appendix 1. The fish biology of the
main commercial species is given in Appendix 2.
The formation of the River Niger, outlined above, helps to explain the similarities between fish species within the middle Niger and Senegal Rivers. Of the 112 species recorded by Daget (1961a&b) in the Upper and Middle Niger, 66 are found in the Nile, whilst 52 also occur in the Gambia River.
Within the pre-impounded River Niger, Daget (1961 b) recorded 78 species, whilst 86 species were listed by Bank et al. (1965). In the coffer dam formed prior to the main filling of the lake a total of 83 species belonging to 18 families were recorded (Motwani & Kanwai, 1970).
lmevbore & Okpo (1975) noted that a lower number of fish species existed in the lake compared to the river. However, immediately after the filling of Lake Kainji, Lelek (1972) sampled a total of 95 species from gill net trials between 1968 and 1971. The increase in the number of species compared with that of the river was probably due to more thorough sampling.
Page: 61
Chapter 2
AQUATIC VEGETATION OF LAKE KAINJI
Aquatic plants quickly became established within the floodplain areas following the
flooding of the lake basin. Hall (1975) suggested that this was due to conditions in
riverine floodplains being similar to the drawdown areas in the lake.
An example is Niger Grass (E. stagnina) that was abundant in the river around Foge Island (Imevbore, 1970a). Two years after impoundment Niger Grass had
colonised the margins of both Foge and the eastern lake basin (Lelek, 1972).
'\nother important riverine plant, Polygonum sp., colonised the upper lake area
around Yauri (Lelek, 1972).
Jenness (1970) reported that islands of vegetation became dislodged from
upstream river banks and floated into the lake during the annual high flood;
a process that undoubtedly assisted colonisation. Hall (1975) stated that the rains, which coincide with the time of maximum drawdown and exposure of floodplain,
provide ideal growing conditions for the plants.
Imevbore & Adegoke (1975) estimated that less than 0.5% of the lake surface area was covered by aquatic plants during the first two years after impoundment. Thereafter, colonisation increased and Chachu (1978) noted almost 9% cover in 1980, mainly of Niger Grass. By 1984, the cover had risen to almost 30% (Morton
and Obot, 1984). The cover then increased more gradually until the arrival of floating
mats of water hyacinth in 1993 (Ayeni et a!., 1994).
As well as providing a source of food and shelter for the fish, plants have others benefits. For example, algae attach to the stems of Niger Grass and form an important food source for fish (Jenness, 1970). The potential attachment area is
vast. Chachu (1978) estimated the stems to be 11 m long and according to Morton & Obot (1984) they were often rooted to a depth of some 9.5 m. The presence of the vegetated littoral zone were said to have particularly favoured the tilapiines (Otobo, 1976; Omorinkoba & du Feu, 1994).
Page: 62
Chapter 2
Niger Grass is also an important dry season fodder for cattle. Its collection and
sale represents an important source of income for many lakeside residents. Ayeni et al. (1994) noted that this alleviates some of the pressure on the fishery.
In 2002, the production of Niger Grass appeared to be far below the potential yield
of 0.1 million t yr ' that was estimated by Morton & Obot (1984).
Not all plants are beneficial and the infestation of water hyacinth in Lake Kainji
posed a major concern to HEP generation, fisheries, navigation, irrigation and the daily life of lakeside communities (Ayeni et al., 1994). Fisherfolk consider the weed harmful since it blocks beaches, dislodges and entangles fishing gears, provides a habitat for snakes, is poisonous to livestock and colonises areas of the beneficial Niger Grass (Eichinochloa stagnina (Retz)). The grass is important for breeding,
nursery and feeding of fish (Omorinkoba & du Feu, 1994).
Hyacinth also posed similar threats to the river ecosystem downstream of the dam
along the Rivers Benue and lower Niger. The generating authorities (NEPA) were concerned that the weed would block the turbines and considered spraying the lake with chemicals if it disrupted generating efficiency.
The Presidency of Nigeria was alerted to these dangers in 1993 and requested NIFFR to develop and implement a control program for water hyacinth on Lake Kainji. The KLFPP worked together with NIFFR, particularly on those aspects relating to the control of hyacinth through community participation (Ayeni & Mdaihli, 1999). The activities included the manual removal of the weed by lake-side communities, biological control using weevils and the construction of a fixed and floating barrier to reduce infestation from new plants upstream (Lahmeyer Int., 1997; Ayeni & Mdaihli, 1999). The combined control approach resulted in the lake surface area covered by hyacinth being kept below 1.3% (KLFPP, 2001).
THE LAKE KAINJI FISHERY
No industrial or semi-commercial fishery has ever existed on Lake Kainji. This was possibly due to the large expanse of residual tree stumps that limited the fishable areas.
Page: 63

Chapter 2
Exploitation of the resource is purely by artisanal fisherfolk using paddled or
occasionally motorised small planked canoes. Six main fishing methods are used (see Appendix 3 for gear measurements and operation). These include:
Beach seine
Active gear. A long net rigged with a foot and flotation rope that is set by a canoe in a semi circle from the shore. The two ends of the net are hauled towards the
shore so capturing the fish contained within the enclosed area. Around Lake Kainji
the method uses a mesh size of 2 mm and targets pelagic clupeids. The net is
fished both during the day and night, mainly by teams made up of the fishing
entrepreneur's family (including children).
Cast net
Active gear. The net is circular and has a weighted outer perimeter. The net is cast in shallow water from the front of a canoe or occasionally from the lake bank. Fish
are caught either by gilling or entanglement in the meshes.
Drift net
Active gear. Sheet netting that is rigged with a foot and floatation rope and set between two canoes that are paddled (by sculling) downstream. Drift nets are mainly fished in water currents during the day. Fish are caught either by gilling or entanglement in the meshes.
Fishing trap
Passive gear. A conical trap made of branches and covered with netting material. Fish are attracted by fish bait (usually baked guinea corn) through a non-return entrance at the traps base. Traps are set in the evening and checked every day.
Gill net
Passive gear. Sheet of netting that is normally rigged with a foot and floatation rope and set on the lake surface or bottom between two marker buoys. The Lake Kainji fisherfolk usually set gill nets in the early evening and check them in the morning. Nets are then removed, cleaned and reset the following evening. Fish are caught either by gilling or entanglement in the meshes.
Page: 64
Chapter 2
Longline
Passive gear. Single line with hooks tied along its length. Hooks may be baited
(baited longline) or left unbaited (foul hooking longline). Longlines are usually set
in the evening and checked in the morning.
Before the lake basin was flooded, the government officially resettled 5458 fisherfolk (owners of fishing gears and their assistants) in 125 villages
around the lake (Atkinson, 1973; Jenness, 1973). High levels of productivity and fish catch and the promise of a booming rural economy attracted a further
2000 migrant fisherfolk. The migrants came from Nigeria and neighbouring
countries and established fishing camps around the lake (Bazigos, 1971). These
added to the 700 migrants who were already fishing in the area before the creation
of the lake (Wilson, 1975).
During the first high productivity phase the fisherfolk mainly used large meshed gill nets (178 - 203 mm stretched mesh) to target the larger and higher valued species, particularly Citharinus citharus citharus (Geoffroy St. Hilaire, 1808-1809) that had undergone a high recruitment after flooding (Lelek, 1972).
As catches from the larger species declined and fisherfolk became familiar with the lake fishery, so they diversified their fishing methods and mesh sizes used. A frame survey in 2000 indicated that the number of fishing entrepreneurs had
almost tripled from 1970 (from 1.2 to 3.5 per km2 lake area) and that the gears owned consisted of a mix of approximately 7000 gill nets, 1600 drift nets, 1000
cast nets, 5000 longlines and 19,000 fishing traps. Prior to its ban in 1999 a total of 490 beach seines were also recorded (du Feu, 2001). Following the decline of the initial period of high fish catches, the configuration of gears also changed and there was a decrease as well as a greater diversity of mesh sizes used. In the year 2000, the mean gill net mesh size had reduced to 79 mm (s: 36) (KLFPP, 2001).
After impoundment, fish yield reached 28,600 t yr'(225 kg ha-1), it then declined to around 5000 t some six years later (Bazigos, 1972, Ekwemalor, 1977). Yields have since risen, possibly due to the diversification of the fishery and particularly the development of a beach seine fishery. Production peaked in 1996 at 38,250 t (300 kg ha 1), of which the beach seines contributed 53% (du Feu, 2003a).
Page: 65
Chapter 2
The annual yield from gears other than beach seine fell from 139 to 104 kg ha"
(1996 to 2000). The fall in the price of fish sold at the beach has further reduced
the fisherfolk's daily catch revenue, which in turn resulted in them not being able to
afford new fishing gears causing a lower individual ownership of gears (du Feu, 2001).
FISH PRESERVATION AND MARKETING
The majority of fish caught are hot smoked by the wives of fishermen using
rectangular or circular clay kilns containing a single metal tray and enclosed with a
metal lid (Eyo & Mdaihli, 1997). Each fishing household usually had one kiln. Men
sold their catch to their wives who processed it before passing it to their husbands
for sale in the market. After sale, the money (or goods purchased at the market)
was returned to the wife (Anthonio, 1995).
The small fish were washed and skewered head to tail in preparation for smoking. Larger fish were usually gutted and rinsed before either being cut into steaks or
pressed flat. Proper gutting and cleaning of smaller sized fish was rare. Smoking
might last up to seven days, depending on the size of fish and the preservation time required. During smoking the fire was kept alight and the fish turned frequently. Once smoked, the fish were kept dry in covered cane baskets or
cardboard boxes prior to sale at fish markets (Eyo & Mdaihli, 1997). This method
of fish smoking outlined for the lake fishery is almost identical to descriptions made by Aiyedun & Adegboye (1967); Jenness (1973) & Reed (1970) for the river fishery.
The only other method of preservation practised was sun drying. Small clupeids and bycatch species caught by the beach seine fishery were spread in a single layer to dry on dark polythene sheets. Drying usually took one day during which time the fish lost 50% of their weight (Eyo & Mdaihli, 1997). After drying the fish
were stored in sacks ready for sale. Despite their low value, the clupeids were seldom consumed by communities around the lake basin, but were almost all transported to large cities in the south (Dreschl et al., 1995).
Page: 66

Chapter 2
Most fish were sold in the markets located throughout the lake. Transport to the
markets was mainly by canoe. The markets usually operate every four days.
Friday, being Mosque day, was the favoured day (Anthonio, 1995; Eyo &
Mdaihli, 1997).
Anthonio (1995) noted that large volumes of fish passed through the markets and
that the marketing channels were complex being characterised by numerous intermediary distributors. Fish wholesalers were mostly non-native and transported
fish as far as Lagos (620 km south) and Kaduna (450 km north-east). Wholesalers
often gave interest free loans to fisherfolk, who then purchased gears and sold
their catch direct to that trader. The decline in revenue from fishing has resulted in
more fisherfolk being given loans (du Feu, 2001).
Eyo and Mdaihli (1997) noted that 12% by weight of fish were lost due to
deterioration prior to smoking and a further 16% by weight had signs of spoilage
when marketed. The reasons given included the length of time dead fish were left
in gears such as gill nets, the placing of fish catch in warm water in the bottom of the canoe, the lack of proper gutting and cleaning fish prior to preservation and infestation by insects during storage. Anthonio (1995) noted that wholesalers sometimes packed insect repellents such as insecticides, wood ash, leaves and lemon rinds with the fish to try to limit the loss caused by insects
DISCUSSION Common to almost all large African reservoirs, Lake Kainji was constructed in a major river valley (WCD, 2000). The lake was, however, the first to be created by the damming of such a fast flowing and high volume river as the Niger. Although of benefit for the generation of HEP,. this has resulted in the lake having a rapid turnover of water that is equivalent to four times its volume every year (Karlman, 1982); giving the lake the characteristics of a slow moving river.
Page: 67

Chapter 2
For reservoirs this is the exception rather than the rule. The only other water bodies in Africa with an annual exchange of water greater than the volume stored
are the Kafue system and Sennar, Jebel Auliya and Roseires reservoirs (White, 1969). High rates of water exchange appear more common outside of Africa. The Itaipu Reservoir in Brazil-Paraguay, for example, has a similar size to
Lake Kainji but has twice the exchange rate of water (Miranda et al., 2000).
The high water flow in Lake Kainji meant that lake filling took only three months (Turner, 1971), compared to between four and five years for Lakes Kariba and Volta (Petr, 1975). EI-Zarka (1973) suggested that the rapid filling prevented deoxygenation of the water and fish kills as had occurred in Lakes Kariba
(Beadle, 1974) and Volta (Vanderpuye, 1984).
The high flow rate also favours mixing of the water column and helped prevent the
establishment of thermoclines. The peak flow during the onset of the annual flood
stimulated breeding of most of the species that found conditions in the upper part of lake similar to the pre-impounded river (Imevbore, 1975). Karlman (1975) noted that high water exchange increased the flow of nutrients and sediments into the lake, but lead to a greater loss of resulting phytoplankton biomass downstream.
Another characteristic of Lake Kainji was the large 10 m annual drawdown of water (Bidwell, 1976). Within Asia comparable levels of drawdown exist, although they are mainly confined to smaller water bodies and caused by seasonal take-off for irrigation (Hardjamulia et al., 1987). In Africa the level of drawdown in Lake Kainji is exceeded only by Cahora Bassa in Mozambique, which experiences occasional fluctuations of 12 to 14 m (Isaacman & Sneddon, 2000), and Sennar and Roseires Reservoirs (White, 1969). Unique to Lake Kainji, however, was the timing of the high water level that coincided with the local dry season. This was caused by the length of time for floodwaters of the River Niger at the upper catchment in Guinea to reach the lake (Eaton et al., 1965).
Page: 68

Chapter 2
The drawdown exposed large areas of seasonal floodplain in the central basin and
along the eastern shoreline. The floodplains were extremely fertile and formed an important source of nutrients during annual flooding. Flooded and rotting
vegetation also supplied a temporary food source, as well as shelter for many of the newly spawned fingerlings. The drawdown occurred six months after the main flood at a time when the fingerlings were large enough to move from the shallow
nursery grounds (which then become exposed) into deeper water.
Fish species within Lake Kainji belonged to the diverse 'Nilo-Sudanian' community that has around 30 families represented. Lake Volta shares the same fauna, whilst for Lake Kariba in the 'Zambezian region' the fauna is more limited with only 20 families present (Lowe-McConnell, 1999). Species in Lake Kainji included the
productive Citharinidae and Cichlidae.
The resettlement program for Lake Kainji is considered to be one of the best
planned and successfully executed of any African impoundment (Mabogunje, 1973). This was despite the delay and interruption caused to
planning by the Civil War for Nigerian Unity (Roder, 1993). Oyedipe (1983)
suggested that the success was partly due to the priority of relocating people into
similar surroundings and villages.
This was unlike the case of Lake Volta where fisherfolk were re-housed in agro- villages and where people were subject to mechanised farming and bureaucratic co-operative and marketing systems. The resettlement program also contrasts with the experiences of Kariba Dam (Soils inc., 2000), just 10 years before when cash payments were given to resettle communities and that of Cahora Bassa Dam (Isaacman & Sneddon, 2000) where villagers were often moved by force. Famine resulted around both these lakes due to poor use of the cash by the communities and relocation to barren marginal lands.
Page: 69

Chapter 2
Despite promises made to the resettled Lake Kainji population concerning access
roads, electricity and health facilities, little has been achieved. Only a few of the
larger towns have benefited and most villagers live in conditions similar to those
they experienced before the creation of the dam. Such empty promises seem
common to many dam projects within Africa (Losse, 1998; Soils inc., 2000).
Lake Kainji was one of the last African reservoirs to be studied in detail. The
environment provided a contrast to the previous studies of Lake Kariba that, unlike Lake Kainji, is deep and has limited shoreline, drawdown, macrophyte vegetation
and less diverse fish fauna. Like Lakes Kariba, Volta and Nasser-Nubia, Lake
Kainji also benefited from fishery programs implemented by the FAO/UNDP and joint collaboration of Universities. However, as is common with most of these
reservoirs, much of the regular fisheries monitoring ceased some' 10 years after impoundment (Entz, 1984).
The initial flooding of the fertile land and vegetation resulted in nutrients being
released and abundant food sources and shelter for fish species becoming
available. At this time the Citharinidae experienced a good recruitment and high,
survival rate. The. large numbers of fingerlings contributed to a high productivity phase that occurred two years after impoundment and lasted for just one year (Lelek, 1972). The boom in annual catch rates to 225 kg ha" attracted many migrant fisherfolk to the area who introduced new fishing methods and added to the fishing pressure (Bazigos, 1971).
The rise in fishing pressure and the high use of small meshed gears in Lake Kainji led to verbal reports of declining fish catches by the fisherfolk. To attempt to
counteract this, a system of co-management involving the Fisheries Departments, Traditional Authorities and the fisherfolk has recently been developed and implemented during a nine-year joint technical co- operation program the 'Nigerian-German Kainji Lake Fisheries Promotion Project'.
An initial three-year period of intensive research took place at the start of the project in 1993. The results provided information for both the development and monitoring of the lake management plan. Fishery monitoring activities are planned to continue and presently eight years of continuous data exist (up to 2001).
Page: 70

Chapter 2
Lake Kainji is, possibly, once again one of the most extensively studied reservoirs
in Africa. Analysis of the data may provide insights concerning the development of
the reservoir fisheries in general. Certain aspects of this 'evolutionary process' that
have taken place since impoundment in Lake Kainji will be common to other
impoundments. The information ought therefore to be of interest to researchers
and managers of other reservoirs.
REFERENCES
Adegoke, O. S. and Kogbe, C. A. (1975). Littoral and suspended sediments of Lake Kainji. In: The Ecology of Lake Kainji, the Transition from River to Lake. (eds. A. M. A. Imevbore and O. S. Adegoke). Ile-Ife, Nigeria, University of Ife Press: 57-66.
Adeniji, H. A. (1975). Some aspects of the limnological and the fishery development
of Kainji Lake, Nigeria. Archive Hydrobiology. 75, (2): 253-262.
Adeniji, H. A. (1990). Limnology and biological production in the pelagic zone of Jebba Lake, Nigeria. PhD. Thesis, University of Ibadan, Nigeria. 293pp.
Adeniji, H. A., Ovie, S. A. and Mdaihli, M. (2001). An evaluation of the pelagic primary productivity and potential fish yield of Kainji Lake, Nigeria. Kainji Lake Fisheries Promotion Project Technical Report Series. No. 19. GTZ, Eschbom, Germany. ISBN 978 037 018 8.33pp.
Ahmed, M. (1966). Report on the fisheries survey of Kainji Dam area. Report
submitted to the Ministry of Agriculture, Northern Region, Kaduna.
Aiyedun, B. A. and Adegboye, J. D. (1967) River fisheries surveys in northern Nigeria. Nigerian Field, 32: 160-170.
Page: 71
Chapter 2
Alamu, S. O. and Mdaihli, M. (1995). Socio-economic survey of women in artisanal fisheries in the Kainji Lake area: a case study of Wawu. National Institute for
Fresh water Fisheries Research (NIFFR), Annual Report, 1994.
ISSN 0331-9296: 195-203.
Anon, (1962). National Development Plan, 1962 - 68, Federation of Nigeria, Federal
Ministry of Economic Development, Lagos, Nigeria.
Anthonio, Q. B. O. (1968). The traditional marketing organisation for smoked fish in
the Yelwa Area of the Kainji Lake Basin. In: Kainji- a Man-Made Lake. Kainji Lake Studies. Vol. 2, Socio-economic Conditions. A. L. Mabogunje ed. Published by the Nigerian Institute of Social and Economic Research. lbadan: 71-90.
Anthonio, Q. B. O. (1995). Fish marketing survey in the Kainji Lake basin. An internal
report of the Kainji Lake Fisheries Promotion Project. GTZ, Eschborn, Germany. 134pp.
Apeloko, F. and du Feu, T. A. (1996). Frame survey, Kainji Lake. National Institute for Fresh water Fisheries Research (NIFFR), Annual Report. ISSN 0331 9296: 177-180.
Atkinson, J. R. (1973). Resettlement program in the Kainji Lake Basin. In: Kainji-
a Man-Made Lake, Kainji Lake Studies. Vol. 2, Socio-economic Conditions. A. L. Mabogunje, ed. Published by the Nigerian Institute of Social and Economic Research. I badan: 1-17.
Ayeni, J. S. O. (1997). Management for sustainable exploitation of lakes and reservoirs. The First 1997 Public Lecture for the Fisheries Society of Nigeria (FISON). 24pp.
Page: 72
Chapter 2
Ayeni, J. S. O. (1999). Proposal to enlist community cooperation for wildlife
conservation in the 'support zones' of the Kainji Lake National Park, New
Bussa, Nigeria. A proposal submitted to Kainji Lake National Park by
Environ-Consult Ltd. (Nig. ). 17pp.
Ayeni, J. S. O. and Olatunde, A. A. [eds] (1992). Proceedings of the National
Conference on Two Decades of Research on Lake Kainji. 29th Nov. -1st Dec.
1989. Published by the Nat. Inst. Freshw. Fish. Res. (NIFFR). ISBN 988 177
038 4.589pp.
Ayeni, J. S. O., Daddy, F., Mdaihli, M. and Obot, E. A. (1994) Control and utilisation of
aquatic weeds: water hyacinth and Niger Grass on Lake Kainji. National
Institute for Fresh water Fisheries Research (NIFFR), Annual Report, 1994.
ISSN 0331-9296: 20-25.
Ayeni, J. S. O. and Mdaihli, M. (1999). The integrated approach of water hyacinth
control on Kainji Lake: with special regard to the design, construction and installation of a water hyacinth barrier across the River Niger. Kainji Lake
Fisheries Promotion Project Technical Report Series. No. 15. GTZ,
Eschbom, Germany. ISBN 978 037 014 5.36pp.
Balogun, J. K. (1985). The fisheries of Lake Kainji, past, present and future.
The Nigerian Field, 50: 29-34.
Baton, E. K. and Coche, A. G. (1974). Lake Kariba: a man-made tropical ecosystem in Central Africa. Monogr. Biol., 24.767pp.
Banks, J. W., Holden, M. J. and McConnell, R. H. (1965). Fishery report. In: The First Report of the Kainji Biological Research Team. E. White ed. Liverpool: 21-45.
Bazigos, G. P. (1971). Frame survey at Kainji Lake. Statistical Studies No. 1. (FI: SF/MIR 24/). Rome, FAO. 50pp.
Page: 73
Chapter 2
Bazigos, G. P. (1972). The yield pattern at Kainji Lake (Nigeria). Statistical Studies.
No. 2. UNDP/SF/NIR. 24. Rome, FAQ. 25pp.
Beadle, L. C. (1974). The inland waters of tropical Africa, Longman, London. 365pp.
Bidwell, A. (1976). The effect of water level fluctuations on the biology of Lake Kainji,
Nigeria. The Nigerian Field, 41, (4): 156-165.
Chachu, R. E. O. (1978). The development of weeds in Lake Kainji. Kainji Lake
Research Institute Newsletter. ISSN 0331-0183,4, (1&2): 5-10.
Daget, J. (1961a). "Fisheries", NEDECO and Balfour Beatty and Co. Ltd., Niger
Dams Project Report, 6, (8): 1-14.
Daget, J. (1961b). Rapport sur de projet de barrage de Kainji pecheries. Journal
of Hydrobiologica, 61, (4): 69-76.
Dreschl, S., Alamu, S. O. and Adu, F. (1995). Nutritional habits and food consumption
patterns of fishing communities around Lake Kainji, Nigeria. Kainji Lake
Fisheries Promotion Project Technical Report Series. No. 2. GTZ, Eschbom,
Germany. ISBN 978 037 0013.59pp.
du Feu, T. A. (1993). Frame survey, Kainji Lake Nigeria. An internal report of the
Kainji Lake Fisheries Promotion Project. GTZ, Eschbom, Germany. 27pp.
du Feu, T. A. (1996). A Review of the Niger and Sokoto State Fisheries Edicts and the Inland Fisheries Decree 1992. An internal report of the Kainji Lake Fisheries Promotion Project. GTZ, Eschborn, Germany. 25pp.
du Feu, T. A. (2001). A review of the monitoring and evaluation system and further fisheries statistics of the Kainji Lake fishery. An internal report of the Kainji Lake Fisheries Promotion Project. GTZ, Eschborn, Germany. 59pp.
Page: 74

Chapter 2
du Feu, T. A. (2003a). Gaining a quick overview of Lake Kainji fishery, Nigeria: the
use of length frequency data. PhD. Thesis submitted to the University of Hull, UK. Chapter 5: 156-179.
du Feu, T. A. (2003b). Estimation of population parameters for the six commercial species in Lake Kainji, Nigeria using length frequency data sampled from
artisanal fish catches. PhD. Thesis submitted to the University of Hull, UK.
Chapter 4: 126-155.
du Feu, T. A. & O. S. Abayomi. (1997a). Frame survey of Kainji Lake, Northern Nigeria, 1996. Kainji Lake Fisheries Promotion Project Technical Report Series. No. 7. GTZ, Eschbom, Germany. ISBN 978 037 006 4.37pp.
du Feu, T. A. and Abayomi, O. S. (1997b). Catch assessment survey for Kainji Lake in 1996. National Institute for Fresh water Fisheries Research (NIFFR) Annual Report 1996. ISSN 0331-9296: 210-216.
du Feu, T. A., Abayomi. O. S. and Seisay. M. D. B. (1997). Fishing Gear Survey, Kainji Lake, Northern Nigeria, 1996. Kainji Lake Fisheries Promotion Project Technical Report Series. No. 6. GTZ, Eschbom, Germany. ISBN 978 037 005 6.20pp.
du Feu, T. A. and Abiodun, J. A. (1998). Predictions of fish yields and the status of the Kainji Lake fishery, 1998. Kainji Lake Fisheries Promotion Project Technical Report Series. No. 17. GTZ, Eschbom, Germany. ISBN 978 037 015 3. 56pp.
du Feu, T. A. and Abiodun, J. A. (1999). Fisheries statistics of Kainji Lake, Northern Nigeria. Nov. 1994- Dec. 1998. Kainji Lake Fisheries Promotion Project Technical Report Series. No. 13. ISBN 978 037 012 9.128pp.
GTZ, Eschbom, Germany.
Page: 75

Chapter 2
du Feu, T. A. and Omorinkoba, W. S. O. (1995). Frame survey of Kainji Lake. National
Institute for Fresh water Fisheries Research (NIFFR), Annual Report 1996.
ISSN 0331 9296: 204-211.
du Feu, T. A. and Omorinkoba, W. S. O. (1996). The catch assessment survey, Kainji
Lake. National Institute for Fresh water Fisheries Research (NIFFR), Annual
Report 1997. ISSN 03319296: 173-176.
Eaton, J. W., Lutz, P., Osinowo, A. and White, E. (1965). Water Chemistry. In: The
First Report of the Kainji Biological Research Team. Liverpool.
E. White ed.: 3-7.
Ekwemalor, A. I. (1975). Frame survey at Kainji Lake. Report submitted to the Kainji
Lake Research Institute. Technical Report No. 1/1975.33pp.
Ekwemalor, A. I. (1977). The catch assessment survey (CAS) of Kainji Lake, Nigeria.
(December 1975- May 1976). MSc. Thesis submitted to the University of
New-South Wales, Sydney, Australia. 49pp.
Ekwemalor, A. I. (1978). Frame survey at Kainji Lake, April 1978. Report submitted to
the Kainji Lake Research Institute. 41 pp.
EI-Zarka, E. L. (1973). Kainji Lake Nigeria. In: Man-Made Lakes: Their Problems and Environmental Effects. (eds. W. C. Ackerman, G. F. White and E. B. Worthington). Geophysical Monographs Ser., 17: 197-219.
Entz, B. A. G. (1984). A synthesis and evaluation of activities of FAO/UNDP projects
on five African man-made lakes: Kainji, Kariba, Kossou, Nasser-Nubia and Volta. FAO Fisheries Circular. No. 774.34pp.
Eyo, A. A. and Mdaihli. M. (1997). Studies on post harvest losses in Kainji Lake fisheries, Nigeria. Vieh & Fisch. A publication of the GTZ, Eschbom, Germany. 305-314.
Page: 76
Chapter 2
Hall, J. B. (1975). The vascular flora of Lake Kainji and its shores. In: The Ecology of
Lake Kainji, the Transition from River to Lake. (eds. A. M. A. Imevbore and
0. S. Adegoke). Ile-Ife, Nigeria, University of Ife Press: 149-156.
Halstead, L. B. (1975). The , shoreline of Lake Kainji. In: The Ecology of Lake Kainji,
the Transition from River to Lake. (eds. A. M. A. Imevbore and
0. S. Adegoke). Ile-Ife, Nigeria, University of Ife Press: 3-56.
Hardjamulia, K., Setiadi, E. and Rabegnatar, N. S. (1987). Some biological aspects of
the predominant fish species in the Jatiluhur Reservoir, West Java,
Indonesia. In: Reservoir Fishery Management and Development in Asia.
Proceedings of a Workshop held in Kathmandu, Nepal, 23-28 Nov. 1987.
Ottawa, Canada. The International Development Research Centre
(Canada), ISBN: 0 88936 515 6: 98-103.
Henderson, F. (1973). A limnological description of Kainji Lake 1969-1971. A report
prepared for the Kainji Lake Research Project. FI: DP/NIR 66/524/10.47pp.
Henderson, F. (1975). Thermal stratification in Kainji Lake. In: The Ecology of Lake
Kainji, the Transition from River to Lake. (eds. A. M. A. Imevbore and 0. S. Adegoke). Ile-Ife, Nigeria, University of Ife Press: 75-81.
Ibeun, M. O. (1995). A preliminary bibliography and analysis of Kainji Lake related
publications, 1961-1991. In: Current Status of the Fisheries and Fish Stocks
of the Four Largest African Reservoirs: Kainji, Kariba, Nasser-Nubia and Volta. (eds. R. C. Crul, and F. C. Roest). CIFA Technical Paper. No. 30. Rome, FAO: 19-40.
Imevbore, A. M. A. (1966). Biological research at the Kainji Lake basin, July 1965- September 1966. In: Man-Made Lakes: the Accra Symposium. L. E. Obeng [ed. ]. Accra: Ghana University Press: 30-56.
Page: 77
Chapter 2
Imevbore, A. M. A. (1969). Biological research at the Kainji Lake Basin, Nigeria, July
1965-Sept. 1966. In: Man-Made Lakes, The Accra Symposium. L. E. Obeng,
ed. A Publication of the Council for Scientific & Industrial Research for the
Ghana Academy for Sciences: 50-56.
Imevbore, A. M. A. (1970a). Some general features of the Kainji Reservoir Basin. In: Kainji Lake Studies, Vol. 1, Ecology. S. A. Visser ed. Published by
NISSER, Ibadan: 17-26.
Imevbore, A. M. A, (1970b). Some preliminary observations on the ratio and fecundity
of the fish in River Niger. ln: Kainji Lake Studies, S. A. Visser, ed. Ibadan
press: 87-98.
Imevbore, A. M. A. (1975). The chemistry of Lake Kainji waters August 1968- September 1969. In: The Ecology of Lake Kainji, the Transition from River to Lake. (eds. A. M. A. Imevbore and 0. S. Adegoke). Ile-Ife, Nigeria, University
of Ife Press: 82-102.
Imevbore, A. M. A. and Adegoke, O. S. [eds], (1975). The Ecology of Lake Kainji, the Transition from River to Lake. Ile-ife, Nigeria, University of Ife Press. 209pp.
lmevbore, A. M. A and Okpo, W. S. (1975). Aspects of the biology of the Kainji Lake Fishers. In: The Ecology of Lake Kainji, the Transition from River to Lake. (eds. A. M. A. Imevbore and 0. S. Adegoke). Ile-Ife, Nigeria, University of Ife Press: 163-178.
Isaacman, A. and Sneddon, C. (2000). Toward a social and environmental history of the building of Cahora Bassa Dam. Journal of South African Studies. 26, (4): 597-632.
Ita, E. O. (1998). The current status of fish stocks and fisheries in Kainji Lake, 1996. An internal report of the Kainji Lake Fisheries Promotion Project. GTZ, Eschbom, Germany. 45pp.
Page: 78
Chapter 2
Jenness, J. (1970). Fishermen of the Kainji basin. Kainji Lake Research Project, New Bussa, Nigeria. Working Paper, No. 2. FI/SF/NIR/24.98pp.
Jenness, J. (1973). Fishing and the fishermen of the Kainji Lake Basin. In: Kainji-
a Man-Made Lakes, Kainji Lake Studies. Vol. 2, Socio-economic Conditions.
A. L. Mabogunje ed. Published by the Nigerian Institute of Social and Economic Research. Ibadan: 49-69.
Karlman, S. E. (1973). Pelagic primary production in Kainji Lake. Tech. Rep. No. 3 of UNDP/FAO project, FI: SF/NIR/24. FAO, Rome.
Karlman, S. E. (1982). Annual flood regime as a regulatory mechanism for
phytoplankton production in Kainji Lake, Nigeria. Hydrobiologia, 86, (1-2): 93-97.
KLFPP (Nigerian-German Kainji Lake Fisheries Promotion Project). (1996). Situation Report. An internal report of the Kainji Lake Fisheries Promotion Project. GTZ, Eschborn, Germany. 13pp.
KLFPP (Nigerian-German Kainji Lake Fisheries Promotion Project). (2001). Fisheries statistical bulletin, Kainji Lake, 2000. Kainji Lake Fisheries Promotion Project Technical Report Series. No. 21. GTZ, Eschborn, Germany. ISBN 978 037 020 X. 25pp.
Lahmeyer Int. (1997). Comments on the design of a water hyacinth boom. An internal report of the Kainji Lake Fisheries Promotion Project. GTZ, Eschbom, Germany. 18pp.
Lelek, A. (1972). Fish populations of Kainji Lake: trends in their development and utilisation. FI: SF/NIR 24 Tech. Rep. 2.121 pp.
Page: 79
Chapter 2
Lewis, D. S. C. (1974). The effects of the formation of Kainji Lake (Nigeria) upon the
indigenous fish population. Hydrobiologia, 45: 281-301.
Losse, G. F. (1998). The small-scale fishery on Lake Kariba in Zambia. Published by
Deutsche Gesellschaft für Technische Zusammenarbeit (GTZ) GmbH, Eschbom, Germany. ISBN 3 88085 522 6.310pp.
Lowe-McConnell, R. H. (1999). Lacustrine fish communities in Africa. In: Fish and Fisheries of Lakes and Reservoirs in Southeast Asia and Africa. (eds.
W. L. T. van Densen and M. J. Morris). Westbury Publishing, Otley, UK.
ISBN 1 84103 004 X: 29-48.
Mabogunje; A. L. [ed. ]. (1973). Kainji- a man-made lake, Kainji Lake Studies. Vol. 2, Socio-economic Conditions. Published by the Nigerian Institute of Social and Economic Research. I badan. 185pp.
Malvestuto, S. P. and Meredith, E. K. (1989). Assessment of the Niger River fishery in
Niger (1983-85) with implications for management. In: Proceedings of the International Large River Symposium. D. P. Dodge, ed. Canadian Special Publication of Fisheries and Aquatic Sciences, 106: 533-544.
Miranda, L. E., Agostinho, A. A. and Gomes, L. C. (2000). Appraisal of the selective properties of gill nets and implications for yield and value of the fisheries at the Itaipu Reservoir, ' Brazil-Paraguay. Fishereis Research. 45 Issue 2: 105-116.
Morton, A. J. and Obot, E. A. (1984). The control of Eichinochloa stagnina (Retz. ) P. Beauv. by harvesting for dry-season livestock fodder in Lake Kainji, Nigeria. A modelling approach. Journal of Applied Ecology, 21: 687-694.
Motwani, M. P. (1967). A preliminary report on the fish and fisheries of the right-bank channel of Kainji Dam and their bearing on the future of Kainji Lake. Report submitted to UN/FAO Rome.
Page: 80

Chapter 2
Motwani, M. P. (1970). Fishery investigations on the Niger and Benue Rivers in the
northern region and development of a programme of riverine fishery
management and training. UNDP/FAO Technical Report to the Government
of Nigeria. (T. A. 2771). 196pp.
Motwani, M. P. and Kanwai, Y. (1970). Fish and fisheries of the cofferdam right
channel of the River Niger at Kainji. In: Kainji Lake Studies, Vol. 1, Ecology.
S. A. Visser ed. Published by NISSER, Ibadan: 27-48.
NEDECO. (1959). River studies and recommendations of Niger and Benue.
Amsterdam: North-Holland Publishing Company.
NEDECO & Balfour Beatty. (1961). Niger dams Project. Vol. 2. The Hague:
NEDECO, London: Balfour Beatty.
NEPA. (1976). Kainji Dam. An information leaflet produced by the National Electric
Power Authority, Lagos, Nigeria. 11 pp.
Obot, E. A., Ayeni, J. S. O., Daddy, F. and Olokor, J. (1995). Aquatic vegetation project. Water hyacinth coverage of Kainji Lake: its effects on the uses of the lake resources. National Institute for Fresh water Fisheries Research Annual Report 1995. ISSN 0331 9296: 16-29.
Obeng-Asamoa, E. K. (1977). A limnological survey of the Afram Arm of Volta Lake. Hydrobiologia, 55: 257-264.
Olawale, A. (1996). A Review of fisheries law applicable to Kainji Lake and proposals for the amendment. An internal report of the Kainji Lake Fisheries Promotion Project. GTZ, Eschbom, Germany. 24pp.
Olokor, J. O. (1999). Status of water hyacinth (Eichhornia crassipes) on Kainji Lake, 1994-1999. An internal report of the Kainji Lake Fisheries Promotion Project. GTZ, Eschborn, Germany. 22pp.
Page: 81
Chapter 2
Omorinkoba, W. S. O. and du Feu, T. A. (1994). The identification of breeding grounds
of the commercially important fish species in Lake Kainji. National Institute
for Fresh water Fisheries Research (NIFFR), Annual Report. 1994.
ISSN 0331-9296: 48-53.
Otobo, F. O. (1976). Evaluation of beach seine as an effective gear for harvesting
tilapia in Kainji Lake. Archive Hydrobiology. 78: 375-382.
Oyebande, L. E., Sagua, V. O. and Ekpenyong, L. (1980). The effect of Kainji Dam on
the hydrological regime water balance and water quality of the River Niger.
In: Proceedings of the Helsinki Symposium. June, 1980. IAHS-AISH.
Publication No. 130: 221-228.
Oyedipe, F. P. A. (1983). Adjustment to resettlement: A study of the resettled peoples
in the Kainji ' Lake Basin. University Press Limited, Ibadan.
ISBN 0 19 575811 0.167pp.
Petr, T. (1975). On some factors associated with the initial high fish catches in new
African man-made lakes. Archive Hydrobiology, 75: 32-49.
Reed, W. (1970). Fishery technology in the Kainji Lake area. In: Kainji Lake Studies,
Vol. 1, Ecology. S. A. Visser ed. Published by NISSER, Ibadan: 99-104.
Rettberg, S., Alamu, S. O. and Mdaihli. M. (1995). Fisherwomen of Kainji Lake.
National Institute for Fresh water Fisheries Research (NIFFR), Annual
Report. 1994. ISSN 0331-9296: 190-194.
Roder, W. (1993). Human adjustment to Kainji Reservoir in Nigeria. An assessment
of the economic and environmental consequences of a major man-made lake in Africa. University Press of America, Inc. Maryland.
ISBN 0 8191 333 X. 188pp.
Page: 82
Chapter 2
Sagua, V. O. (1978). Flood control of the River Niger at Kainji dam, Nigeria and its
use during drought conditions: the period 1970-1976. In: The Aftermath of
the 1972-74 Drought in Nigeria. Proceedings of a Conference held at Bagauda, Kano, April, 1977: 127-140.
Soils Incorporated (Pty) Ltd & Chalo Environmental and Sustainable Development Consultants. (2000). Kariba Dam Case Study, prepared as an input to the
World Commission on Dams, Cape Town, Executive Summary. 20pp.
Taiwo, S. A. (1984). Studies on the benthic fauna of Kainji Lake, Nigeria. In: Kainji
Lake Research Institute Annual Report 1983: 33-44.
Turner, G. F. (1994). Lake Kainji, Nigeria fisheries statistics and stock assessment. An internal report of the Kainji Lake Fisheries Promotion Project. GTZ, Eschbom, Germany. 40pp.
Turner, G. F. (1996). Lake Kainji, further progress in fisheries statistics and biology.
An internal report of the Kainji Lake Fisheries Promotion Project. GTZ, Eschborn, Germany. 79pp.
Turner, J. L. (1971). The fish population of the newly impounded Kainji Lake in Nigeria. Journal of the West. African Science Association. 16. (1): 49-58.
Vanderpuye, C. J. (1984). Fisheries and limnology of Volta Lake: 261-320, In: Status
of African Reservoir Fisheries. (eds. J. M. Kapetsky and T. Petr). CIFA Technical Paper. No. 10.
Visser, S. A. (1970). [ed. ] Kainji- a Man-Made Lakes, Kainji Lake Studies. Vol. 1, Ecology. Published by the Nigerian Institute of Social and Economic Research. I badan. 126pp.
WCD (World Commission on Dams). (2000). Dams and development: a new framework for decision making. Published by Earthscan Publications Ltd. ISBN 1 85383 798 9.

Chapter 2
Welcomme, R. L. (1972). The inland waters of Africa. CIFA Technical Paper. (1).
117pp.
White, E. (1965). The first scientific report of the Kainji biological research team.
Liverpool: Biological Research Team, Kainji. 44pp.
White, E. (1969). Man-made lakes in Tropical Africa and their biological potentialities. Biol. Conserv. 1, (3): 219-224.
Wilson, E. B. (1975). Resettlement communities in the Kainji Lake Basin. In: The
Ecology of Lake Kainji, the Transition from River to Lake.
(eds. A. M. A. Imevbore and 0. S. Adegoke). Ile-Ife, Nigeria, University of Ife
Press: 187-203.
Page: 84
Chapter 2
Appendix 1. Family taxons and fish species recorded for Lake Kainji, Nigeria.
Osteoglossidae
Heterotis niloticus (Cuvier, 1829)
Mormyridae Hyperopisus bebe bebe (Lacepede, 1803)
Mormyrus hasselquistii Valenciennes, 1847 Mormyrus rume Valenciennes, 1847 Mormyrus macrophthalmus Günther, 1866 Mormyrops anguilloides (Linnaeus, 1758) Campylomormyrus tamandua (Günther, 1864) Hippopotamyrus harringtoni (Boulenger, 1905) Hippopotamyrus pictus (Marcusen, 1864) Gnathonemus petersii (Günther, 1862) Marcusenius senegalensis gracilis (Pellegrin, 1922) Gnathonemus cyprinoids Auchenoglanis & Clarotes sp. ) simus Sauvage, 1879 Petrocephalus bane bane (Lacepede, 1803)
Petrocephalus
Hippopotamyrus psittacus Hippopotamyrus harringtoni
Gymnarchidae
Gymnarchus niloticus
Clupeidae
Sierrathrissa leonensis Pellonula afzeliusi
Tetraodontidae Tetraodon lineatus
(Boulenger, 1897) (Boulenger, 1905)
Cuvier, 1829
Thys van den Audenaerde, 1969 Boulenger, 1916
Linnaeus, 1758
Page: 85
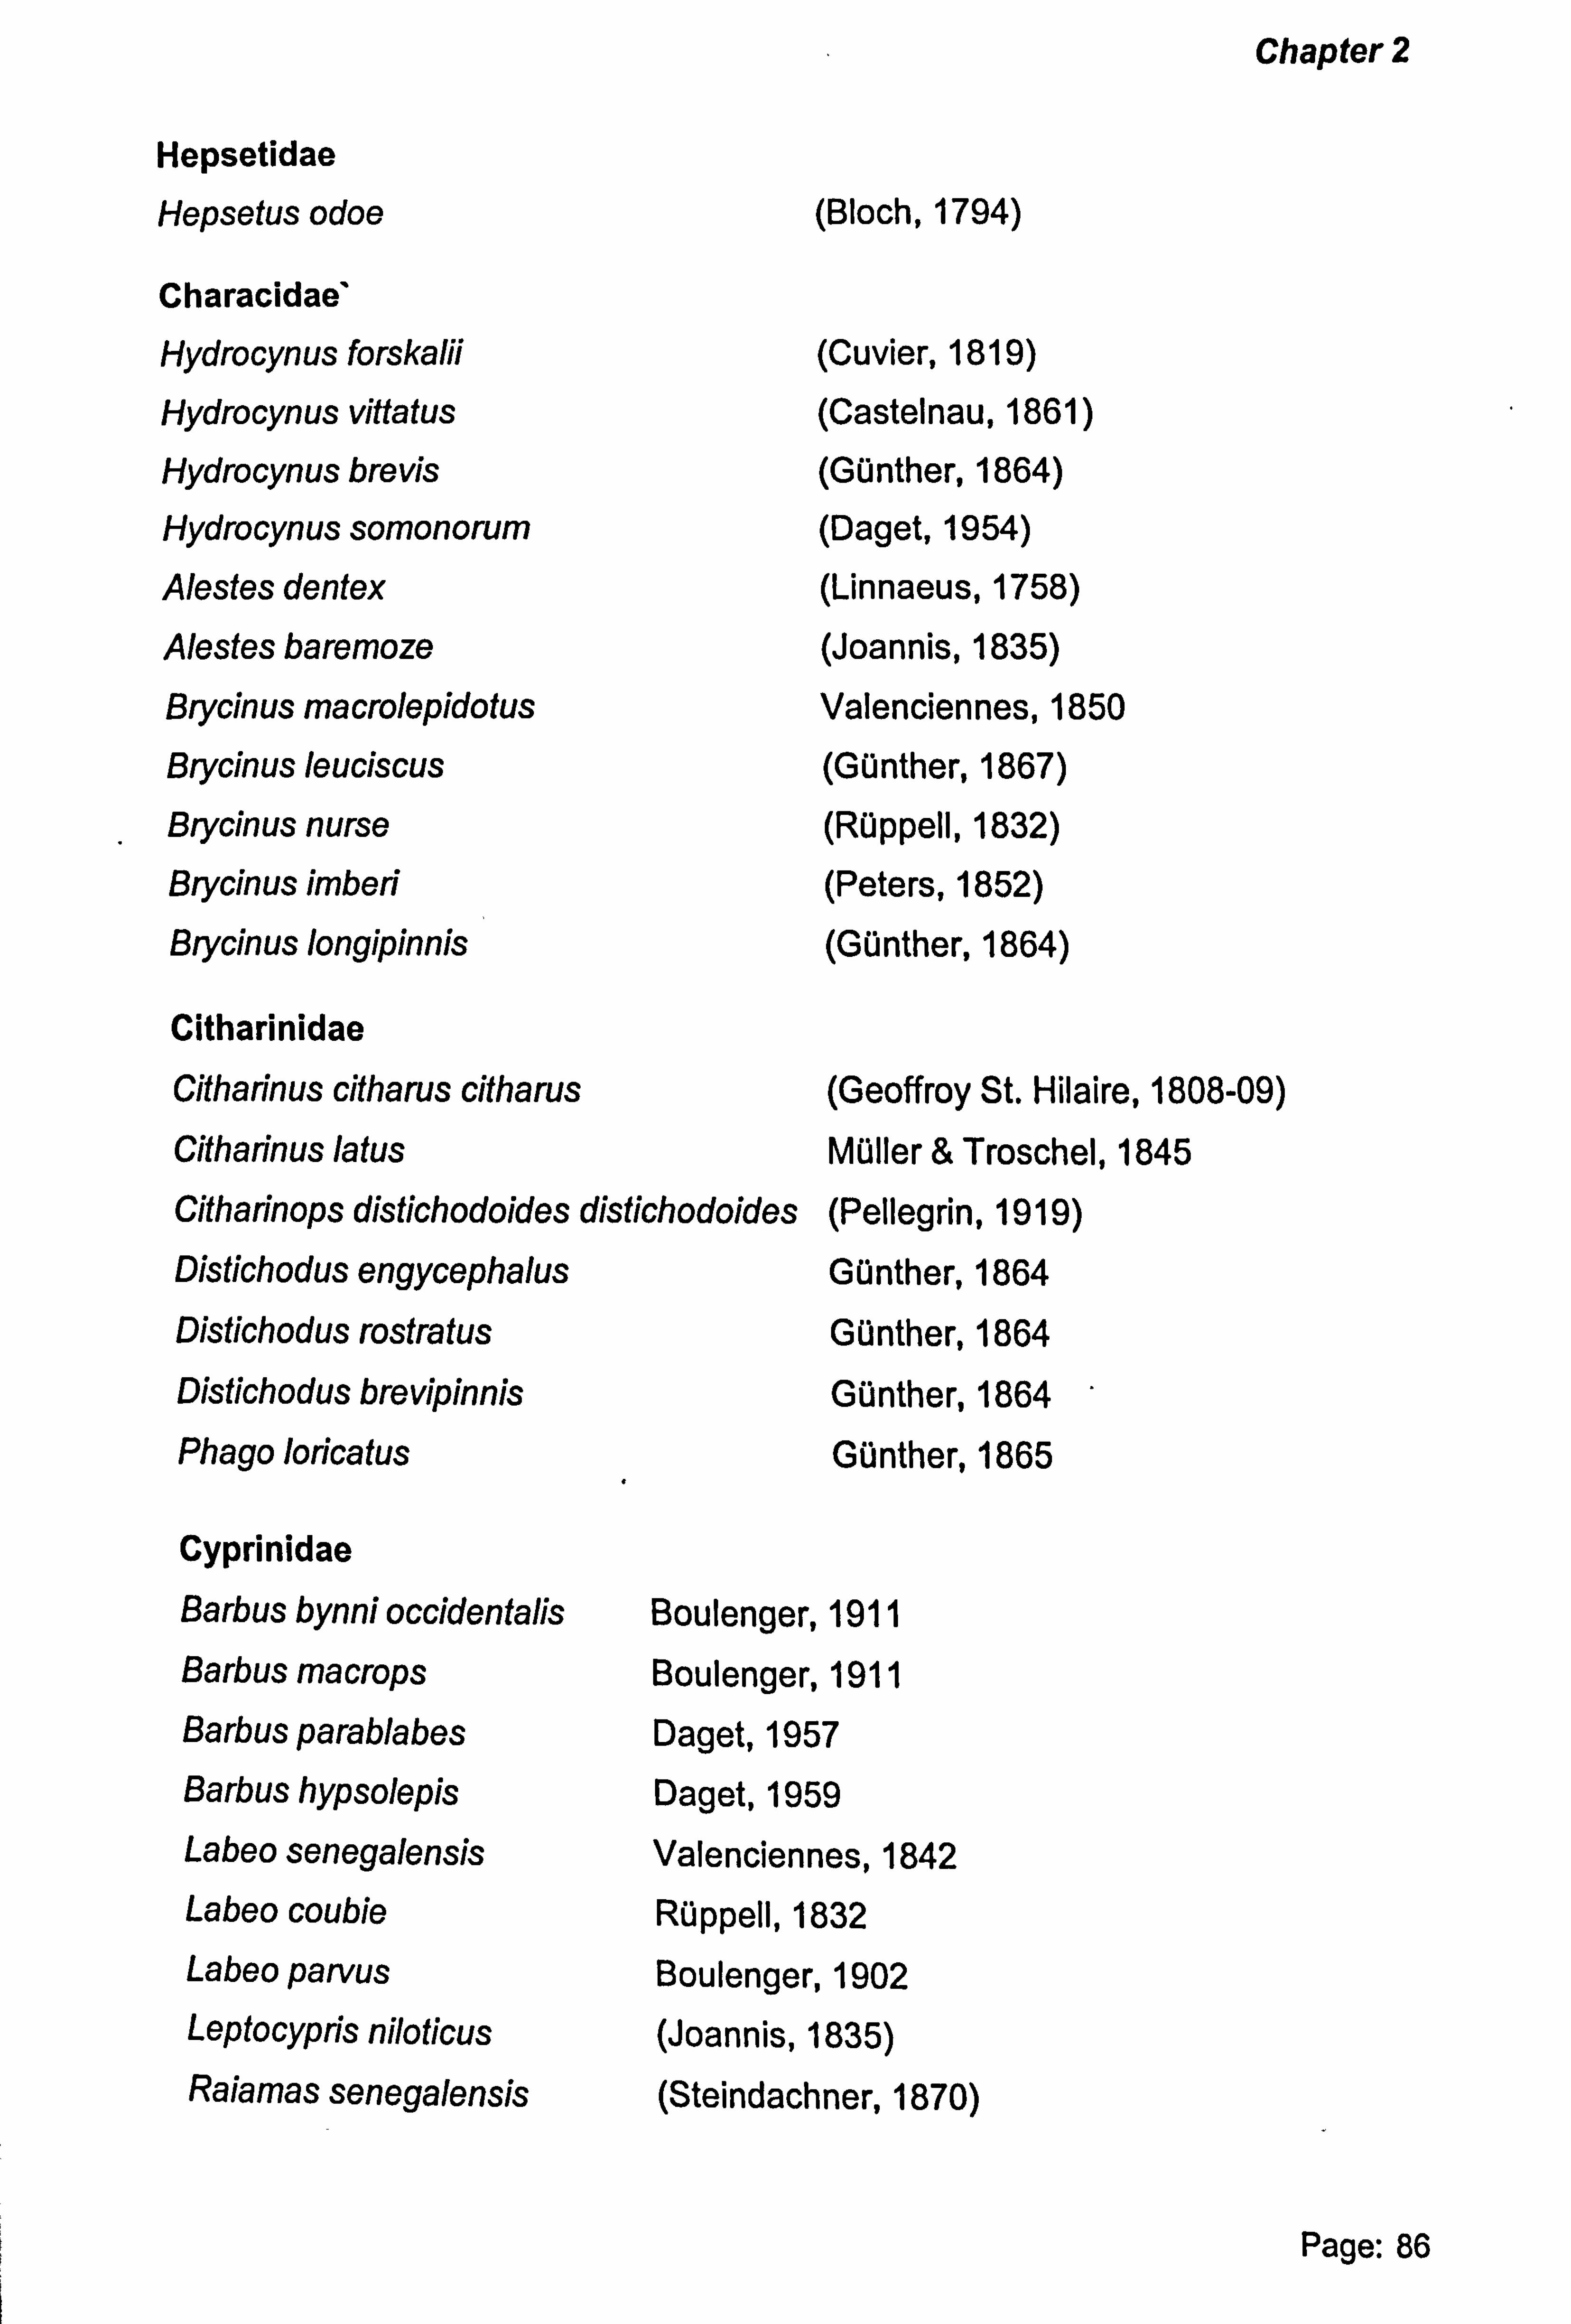
Chapter 2
Hepsetidae
Hepsetus odoe (Bloch, 1794)
Characidae'
Hydrocynus forskalii (Cuvier, 1819)
Hydrocynus vittatus (Castelnau, 1861) Hydrocynus brevis (Günther, 1864)
Hydrocynus somonorum (Daget, 1954)
Alestes dentex (Linnaeus, 1758)
Alestes baremoze (Joannis, 1835)
Brycinus macrolepidotus Valenciennes, 1850
Brycinus leuciscus (Günther, 1867)
erycinus nurse (Rüppell, 1832) Brycinus imbed (Peters, 1852) Brycinus longipinnis (Günther, 1864)
Citharinidae
Citharinus citharus citharus (Geoffroy St. Hilaire, 1808-09) Citharinus latus Müller & Troschel, 1845 Citharinops distichodoides distichodoides (Pellegrin, 1919) Distichodus engycephalus Günther, 1864 Distichodus rostratus Günther, 1864 Distichodus brevipinnis Günther, 1864 Phago loricatus Günther, 1865
Cyprinidae
Barbus bynni occidentalis Barbus macrops Barbus parablabes Barbus hypsolepis
Labeo senegalensis Labeo coubie Labeo parvus Leptocypris niloticus Raiamas senegalensis
Boulenger, 1911
Boulenger, 1911 Daget, 1957 Daget, 1959 Valenciennes, 1842 Rüppell, 1832 Boulenger, 1902 (Joannis, 1835) (Steindachner, 1870)
Page: 86

Chapter, 2
Bagridae
Bagrus docmak
Bagrus bajad
Chrysichthys auratus auratus Chrysichthys nigrodigitatus Chrysichthys furcatus
Clarotes laticeps
Auchenoglanis biscutatus
Auchenoglanis occidentalis
Clariidae
(Forsskäl, 1775)
(Forsskäl, 1775)
(Geoffroy St. Hilaire, 1808-1809)
(Lacepede, 1803)
Günther, 1864
(Rüppell, 1829)
(Geoffroy St. Hilaire, 1808-1809) (Valenciennes, 1840)
Clarias anguillaris (Linnaeus, 1758) Clarias gariepinus (Burchell, 1822) Heterobranchus bidorsalis Geoffroy Saint-Hilaire, 1809 Heterobranchus longifilis
Mochokidae
Valenciennes, 1840
Synodontis batensoda Hemisynodontis membranaceus Synodontis clarias Synodontis sorex Synodontis filamentosus
Synodontis nigrita Synodontis eupterus Synodontis resupinatus Synodontis ocellifer Synodontis schal) Synodontis gambiensis Synodontis courtetti Synodontis violaceus
Malapteruridae Malapterurus electricus
Rüppell, 1832 (Geoffroy St. Hilaire, 1808-1809) (Linnaeus, 1758) Günther, 1864
Boulenger, 1901
Valenciennes, 1840 Boulenger, 1901 Boulenger, 1904
Boulenger, 1900 (Bloch & Schneider, 1801) Günther, 1864 Pellegrin, 1906 Pellegrin, 1919
(Gamelin, 1789)
Page: 87
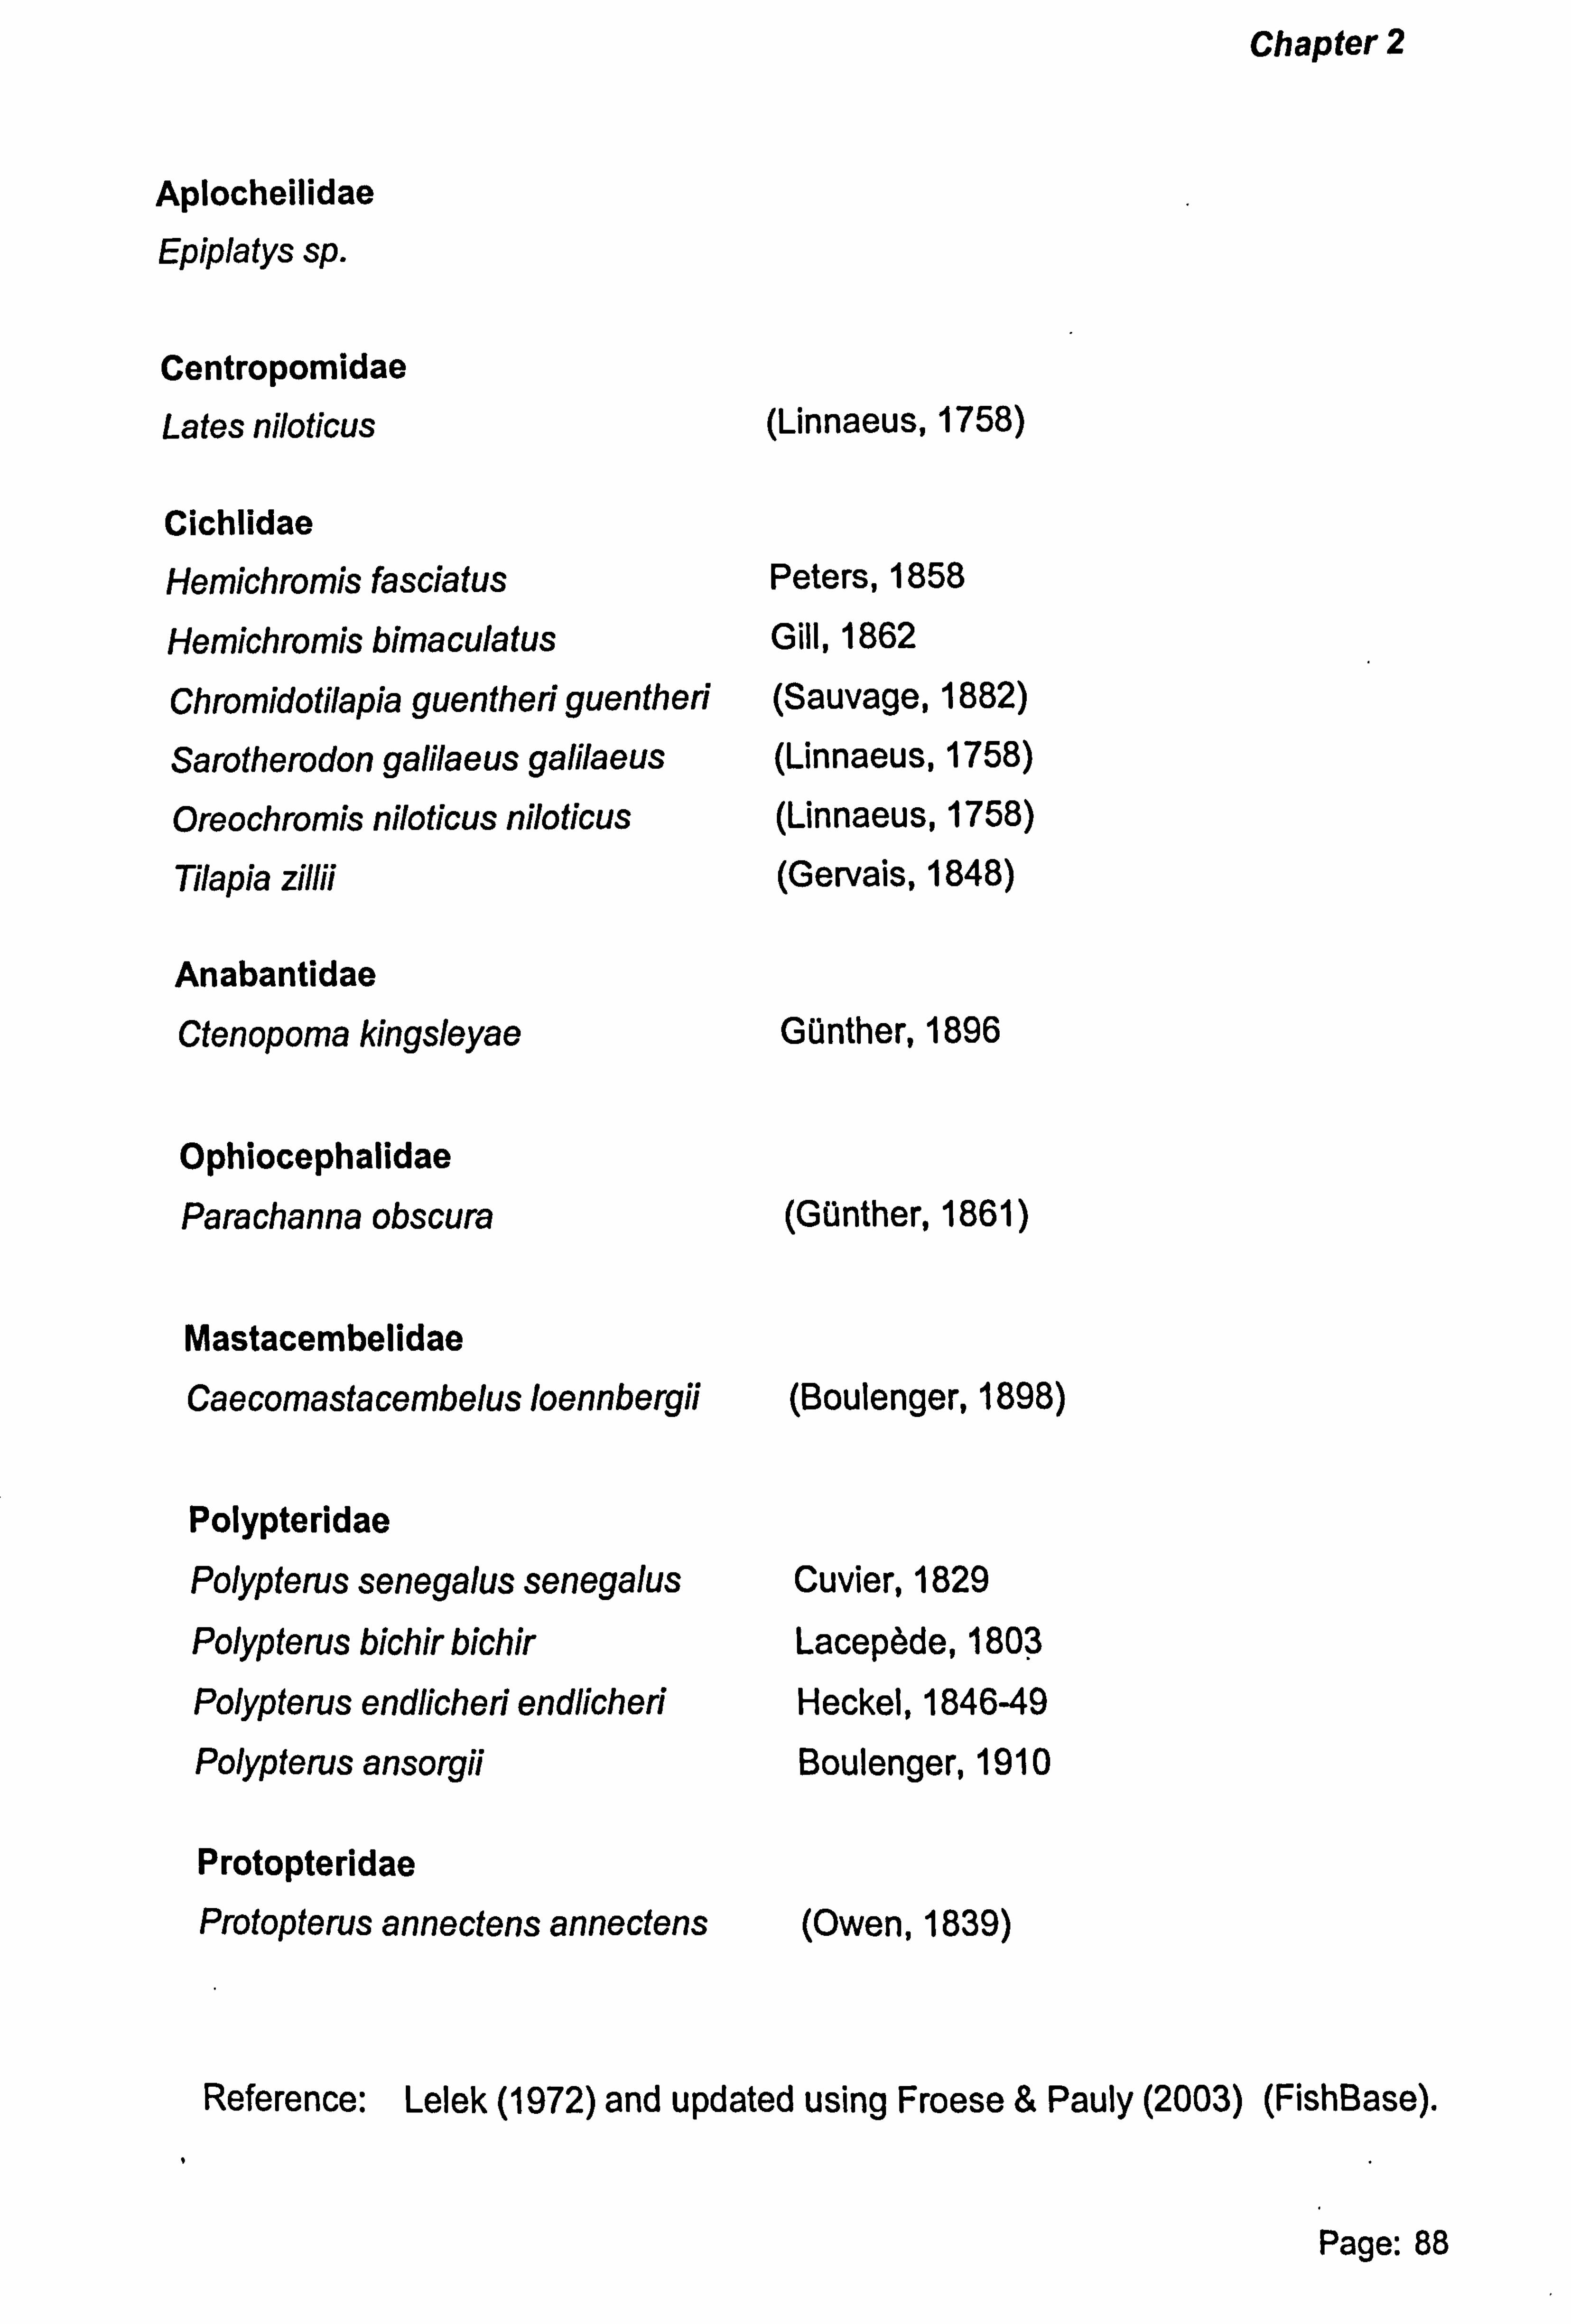
Chapter 2
Aplocheilidae
Epiplatys sp.
Centropomidae
Lates niloticus (Linnaeus, 1758)
Cichlidae
Hemichromis fasciatus Peters, 1858
Hemichromis bimaculatus Gill, 1862
Chromidotilapia guentheri guentheri (Sauvage, 1882)
Sarotherodon galilaeus galilaeus (Linnaeus, 1758)
Oreochromis niloticus niloticus (Linnaeus, 1758)
Tilapia zillii (Gervais, 1848)
Anabantidae Ctenopoma kingsleyae Günther, 1896
Ophiocephalidae
Parachanna obscura (Günther, 1861)
Mastacembelidae
Caecomastacembelus loennbergii (Boulenger, 1898)
Polypteridae
Polypterus senegalus senegalus Cuvier, 1829
Polypterus bichir bichir Lacepede, 1803
Polypterus endlicher! endlicher! Heckel, 1846-49
Polypterus ansorgii Boulenger, 1910
Protopteridae
Protopterus annectens annectens (Owen, 1839)
Reference: Lelek (1972) and updated using Froese & Pauly (2003) (FishBase).
Page: 88

Chapter 2
U L d
E V Q~) O~)
V O O 0 0
E I O
+i+ not 0
VO CC
tq E "o ao
C O
CV OO O
E -Q ON O
00 Q ý
C GLO, ý
0
C. 0 CL
ca N
0 w ý
Co N
(ü N Q.
0 n. 0
n 0 C
LL N N
ü d
.C
` U V
Z Z LL CL
C'C '«+ Cu ý to
(D ' (4
pt J I- aci
c "vý ca o 4- 0 v O ro
y fA C O
y co M y
ýn ä NC
k Cu CC o
c o
CL ý E c
In. - 0
N co ti rn C) vr
O Ö
00
> 40)
aM m >>. Qi- aý 0E
CO o 2v ivii Ö
vs
s a OyN
(0 CO
23 UM IO
0u ; t9 ý ,
4? CO .C
a. ac
co
v °- O w äm
o
aý cO a 0)
v
fL U U (j
ý. .0 CD - o
ti
Q) r r
C) v
r v ý ý A C\1
ai cý .o ti O 0 0 0)
(D (D
Q E E ä
a
CL N
.o _
U .C
V OO C_
:1 -0 0 u; Co m "` ö c vý ö, 0
ö > ä
Z c
a) (2. n. 0 C c9
EE °'
a 0 N
00 Nc
(L) > U)
pcc
U U ,
V .
C. ) C» , cm
CO C CO
Ö 0 0 0 ro
a) N C a) a) ) G
m m m m C)
O ` L y
.y th O
C) -
N yU
O h
O Ö z1--. ý
ti C O LU C-- ,U
N ý C ö
J J ºO cE " U
vN Ö C) C L7 ` L
0 C
N ti C)
co Z
C. )_
V) 4)
.o U)
ö. c to. a
aý > pc
Tv
a) E CD 0
O)
Co Co rn
c
0 c
I co 0
a. C N .
CN
-gyp jý
Q
y Q) Co
Q oÖ N
0
CL 0 CL a) U) LL
v co a) CL
Üj
y t2
Vvc
co E 0
c U
Page: 89
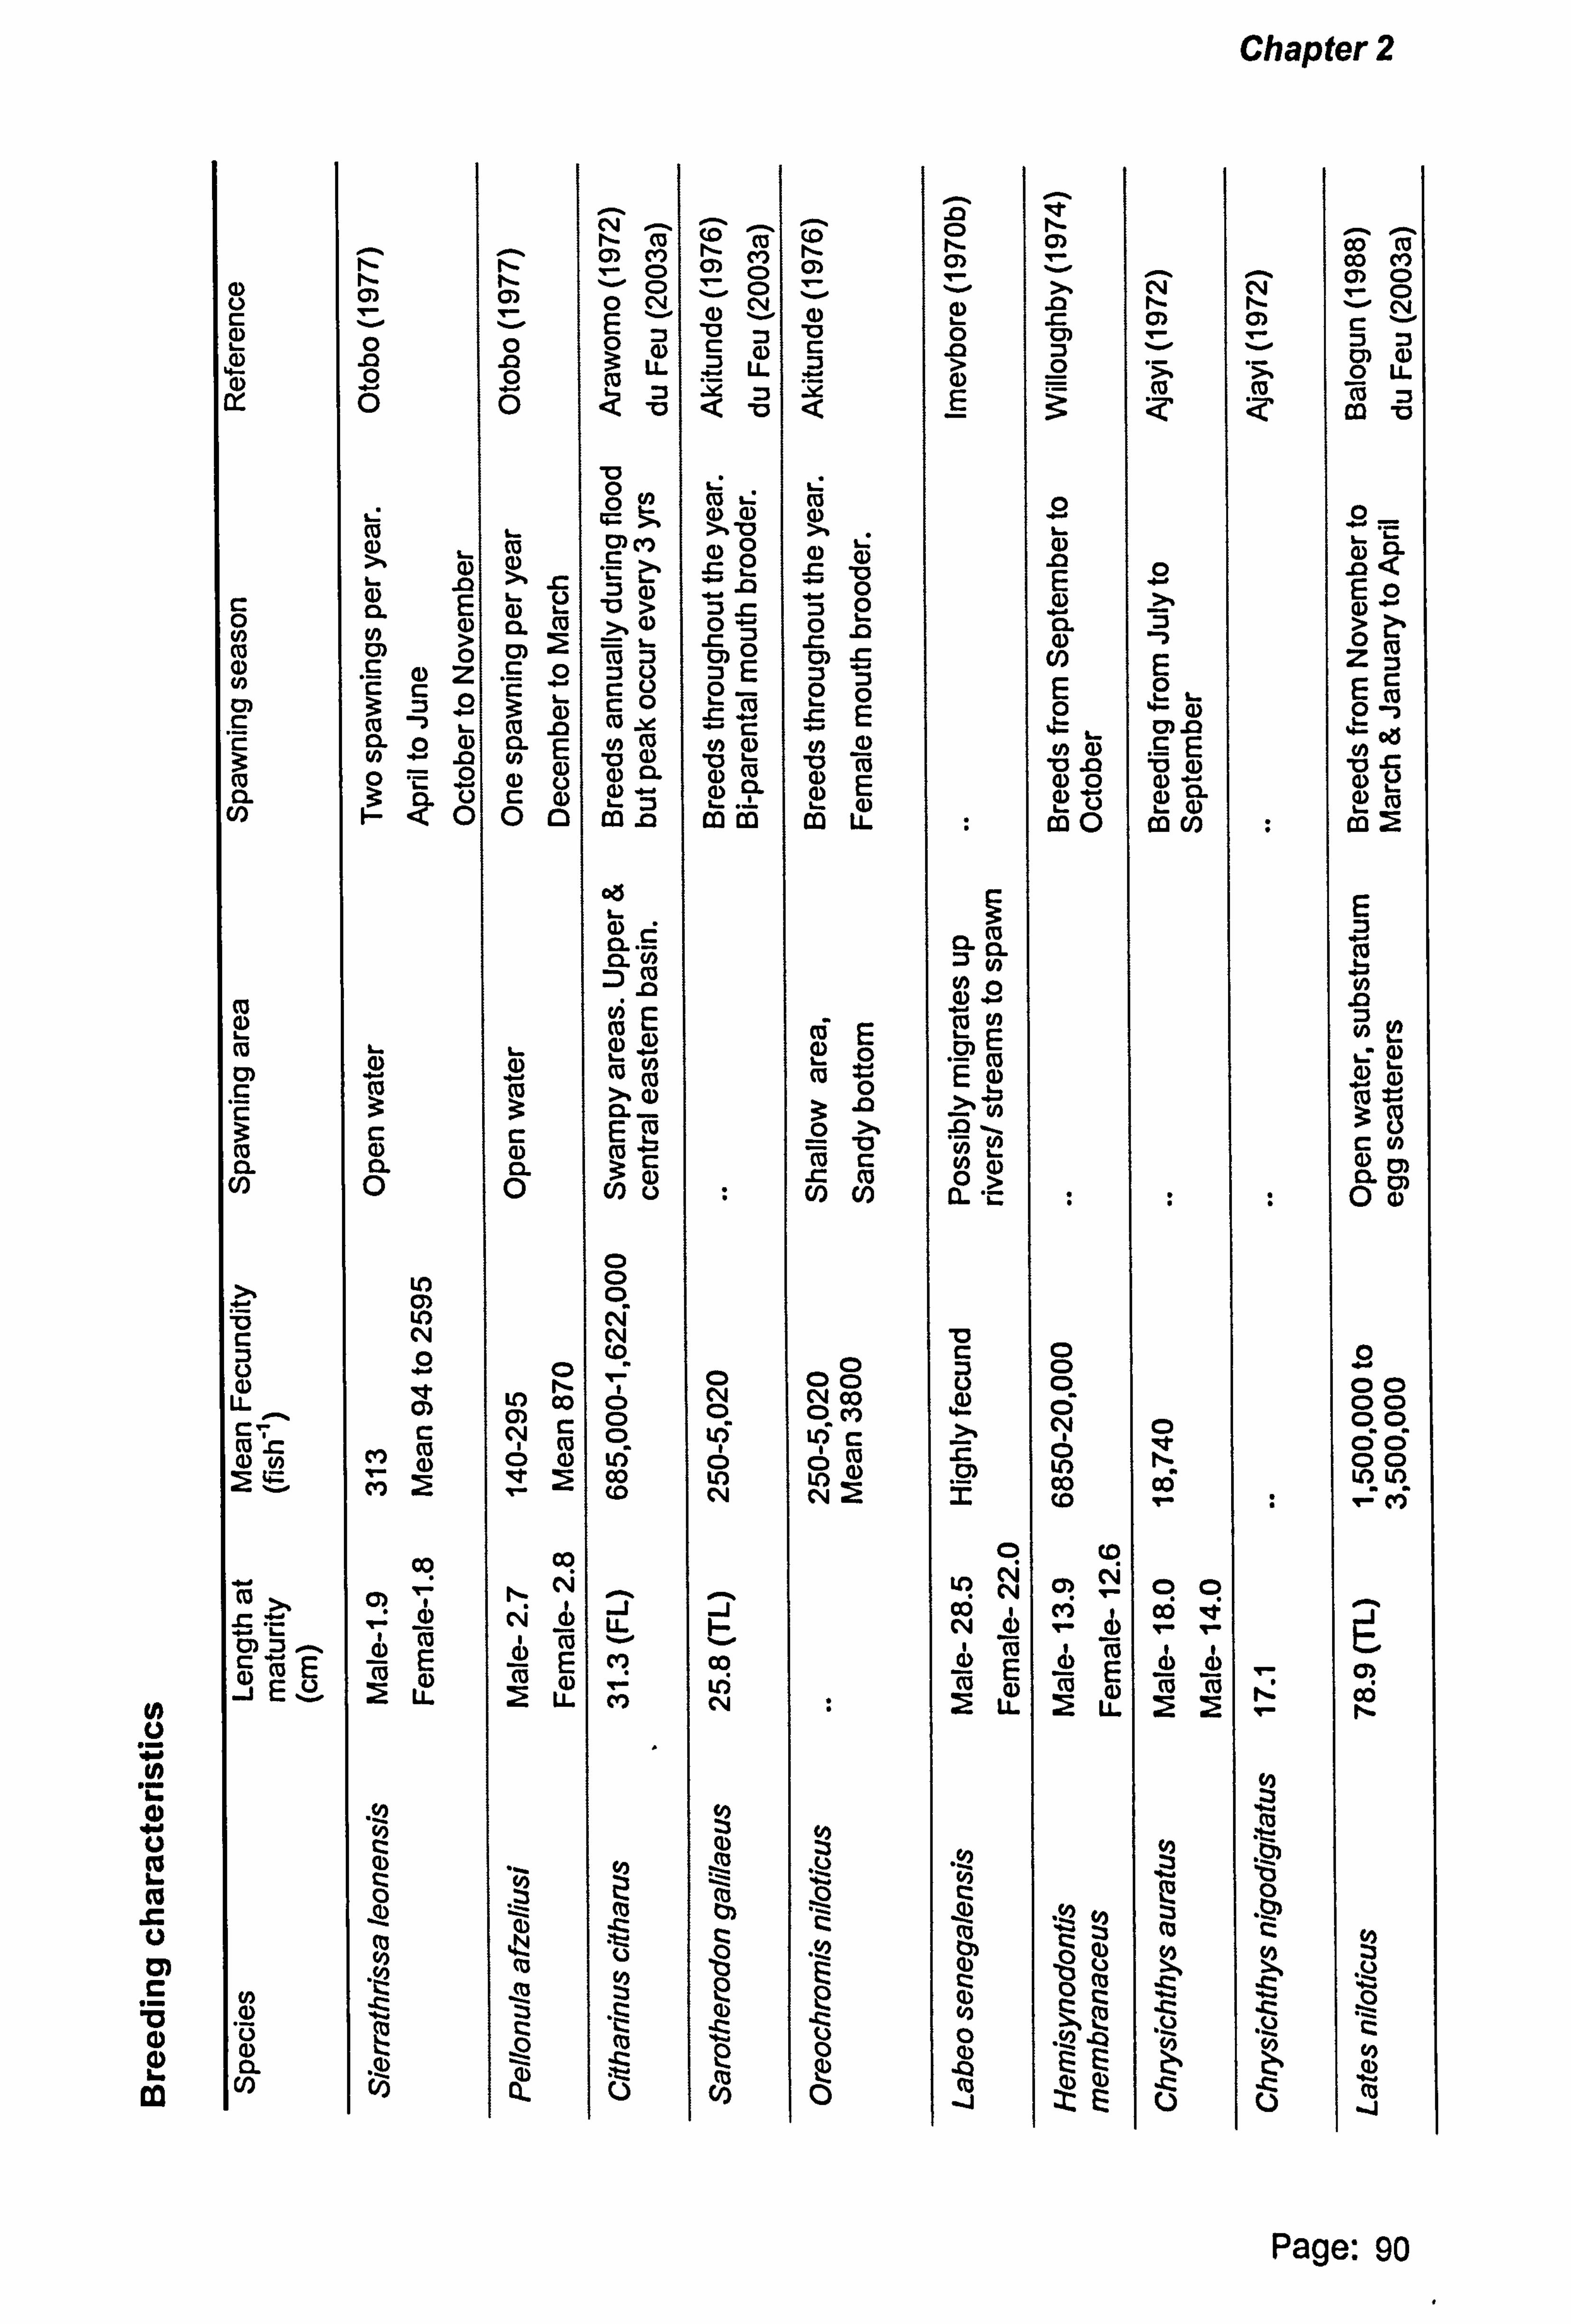
Chapter 2
N C. )
N .` C) 9..
C. ) ß L
s oý c co C) aý L
m
U
4)
N
w
C 0
C)
C) C C
CO
cv
co rn c
co a
ß c U LL. c; (Z m
co -c
cooE J Eý
U) T a) a
ti I . - C)
0 .Q 0 O
Cu L
L .0
a. Cl) 0) p
z 3ýo Cu L 0.0 CI) No o "` o H<Ö
I- a) co
C CD a 0
rn N 0
. a' w C
MO
M
"O
LL
a) O
lD
c`a
ti ti rn
0 m 0
cO
äý a CO rn ý c0 Co äl 0.
Oo
L- CD cu
Cu C. 0
O LO O
NC N O 4)
Co
Iý N
N G)
N E L0 i
cu ro S3 0
N ti C O) M
O O
ON
N LL' e
00
CM M
'd >
cO Co Y oM
(D Co CL
IM m
0ö LE
m 0)
>%0 o. - E2 (»r c
O O O lV N Co
O O to Co Co
J U- M
M
co 2 M U
cri
U
cu O
vN
O)
CO M LL
Q 'a
NN
OO . sO
.rý L 0
IL
O N O to
In N
J
O U) N
4)
ri)
a^)
E0-
(2
to I- C)
V C
N
a) a) O O
L ,p
OO
E
E m LL
3° o >. io c .c cu U)
OÖ0 Ö Co
c O N
w
E 0
O
0
0 ti rn 1 I- L- 0
E
a N N mE rnCo ýE a
Ný ä.
M U
0)
2
O
to N
N G) I C3
E LL
. 11) C ca a Q) C 4) 0 m m J
ti C) T-
s rn 0
0 .r I- a) E a)
E 0
(n a) v .a 00 m`0
0 0 0 ö Ö L() co c0
', tD
M
Co E ca
"y to C OV bO
C
ZEE
N ti C)
N
O
E °ý
rný E va) a)"- I-aa) CO Cl)
0 ti C
00 aö v
ä) (D
ro
N ti C)
N
Co m OO M Q) O
O `-' N
OO O LL
RS Z CO 'a
0
O. m< EO
>
Zm
Co 0t
ý Ip
E I
Ny
G) N=
C Cn
0 00 00 00 C; C; 00
M
ti
I) º
º
y
J
Page: 90
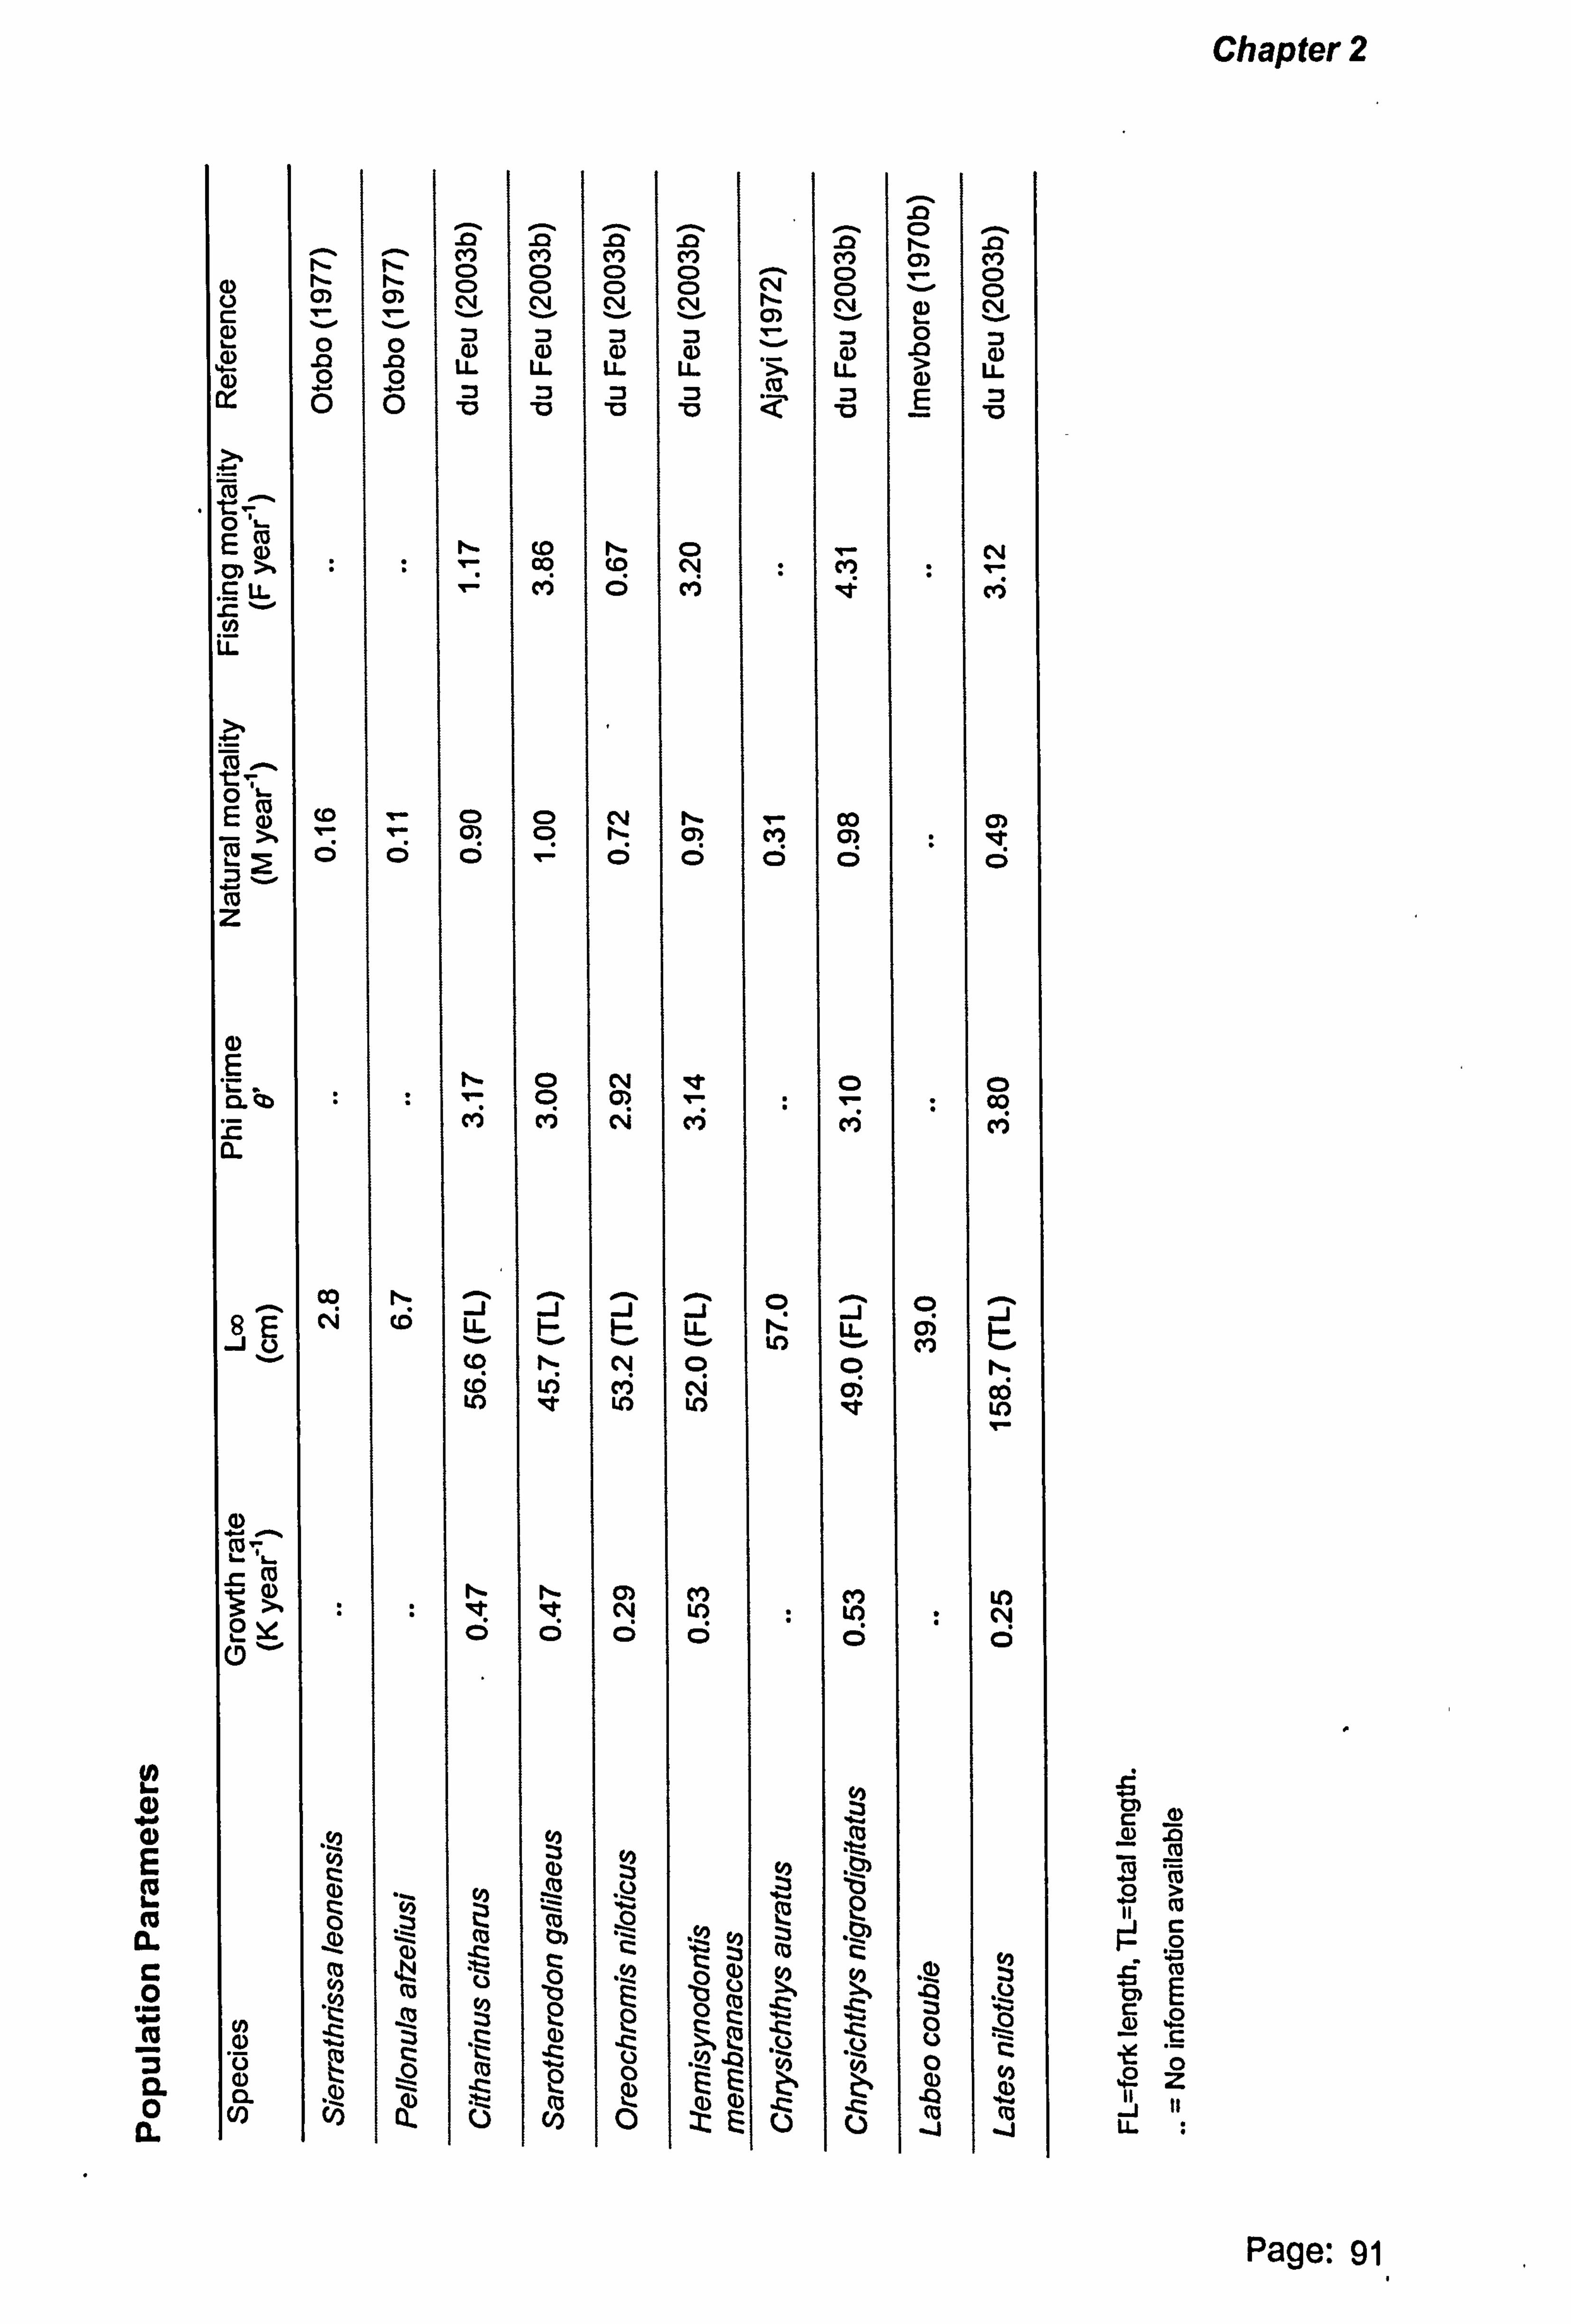
Chapter 2
.I
d .. +
d E
co a 0
75 CL 0 a
-0 -0 -0 ^^MMMMM ÖÖÖÖNO. Ö
a) C) C14 04 N- OO C
r- e- '- N.. Ni d) - .
N.. 200OOOOvO0
LL LL LL LL U- > LL =3 :3m 00ß ß-ßQ 'a
Eß
(1) CN
I--
O >% V- 00 CD N Cl r C LL - CM O CV) ce)
.r 1-1
M
A
OL
CO Co (D N N- V- co 0) O 1- (7) Cl) (3) V 0OÖ . -= OÖOÖO
Z
a) E
N- 0N It 00 ý. m 17 OO e- e- 00 C) MNMM Cl)
co ~JJJJ^ EN ýO v I.
1- v
Itr U-
) CV) JV
CO N- NOON t6 L6 Nr
vO OV CO
G) ^ i.
Z CU N 2OOOÖOp
co
y a)
a) .yy t2 Ü
a 1112 lb co OÖ NC+: co CO
c0 N ,yp
Qý
hypEp gy
y -co co ]' j.
v) ý_ MO'BCC
-C .COO CT3 ÜOC ,O
+ý-+ V "y `Q y "y 0OC
"I QEE co
04Ü v5 Ö=ÜÜ co J U)
rn c a) o .o
2 o
T cß > c 0 :a
: Ef
rn aci
Co E
40 ö c
Z !ý u.
Page: 91
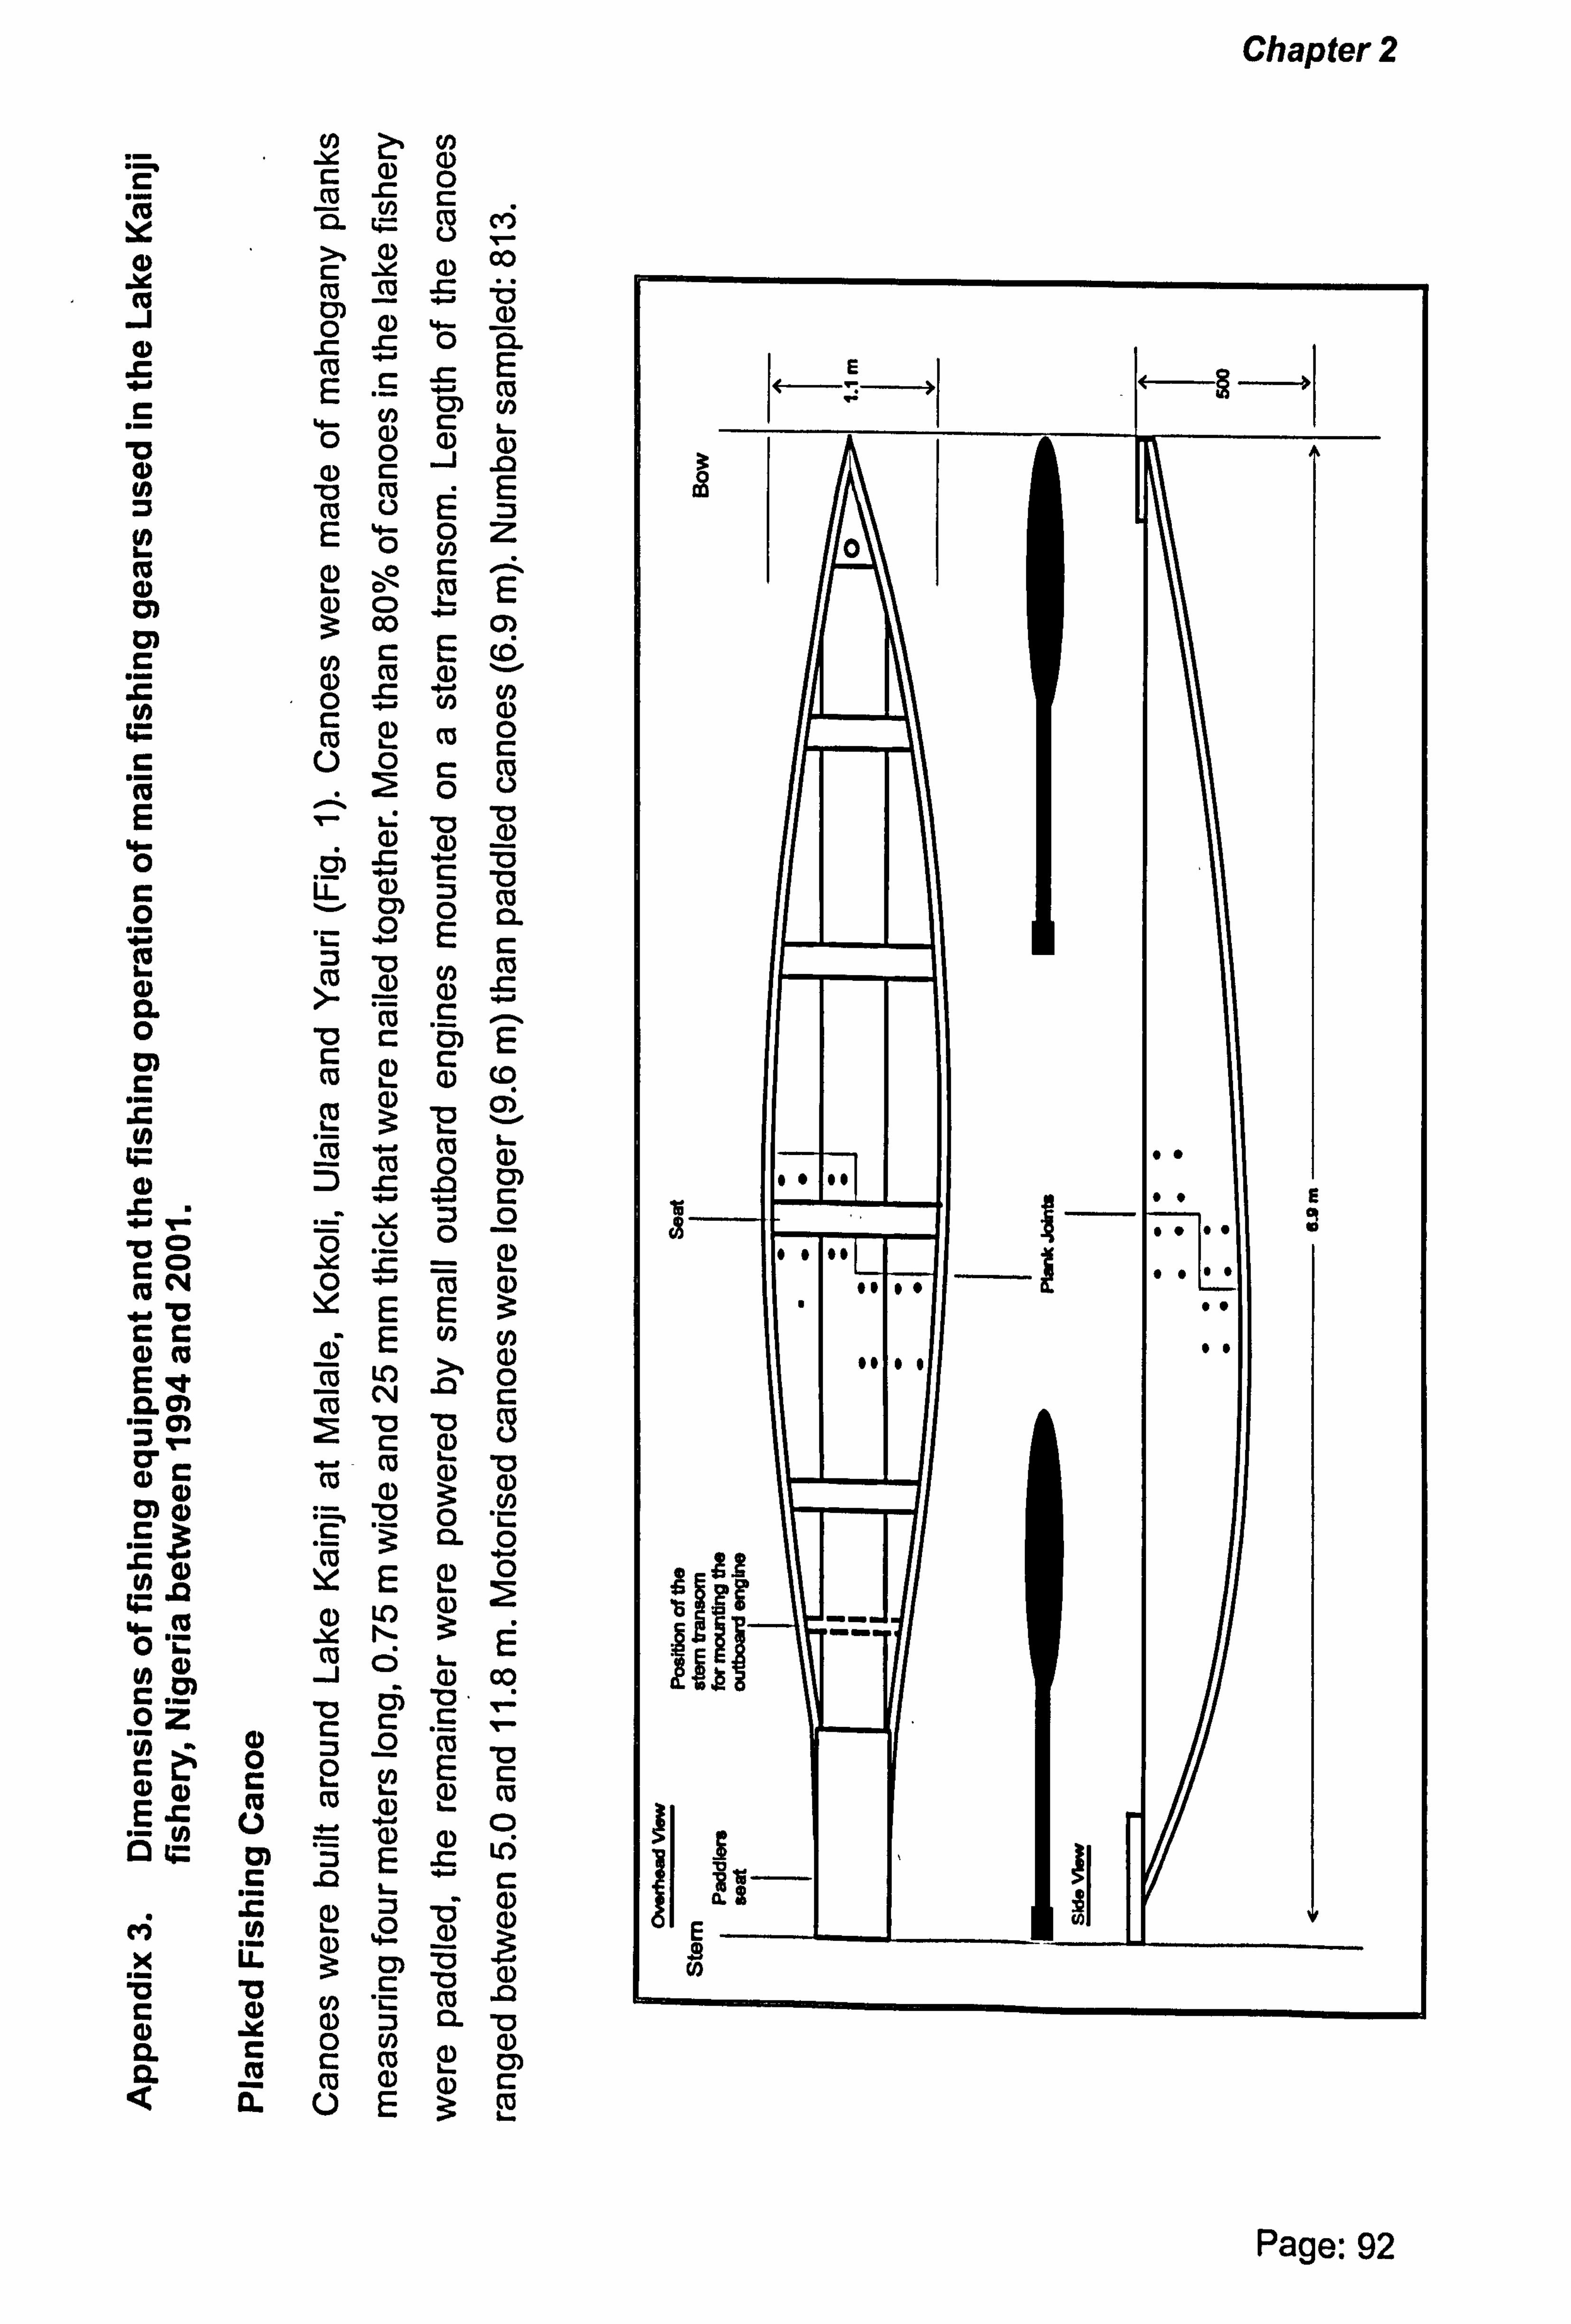
Y a)
O a)
'C 0
cli a aý 00
J cm O c 0 o Cl
E 6-0 E Co
C
O Cl) 0
C
13 J a
Co () E E L E ö o Z
Co E m (D CD
c c ca
E ?
cd N o O
a t4
Ü o c c 0
(D o r
0 1
0 Co ' L. ° E c
} CL
C C C E
.C O .0
0 (D Z c
r -p O
= .O V I 0
CO m c4
Y O N
O N
ýv Y E E E 0
EC N ab C
C) g ,° `ý N- Cr c
o aý o d O
Of cj 'c "3 a o
E 22 q0
OZ Y f` 3
Ul O N CO
02 Nw
c W = 0 CO
E Y / y (, ý
m __ "ý
om
E O
,c
O
ýn c .0 `
y- c
0 40-
.° (D
: cm «c3 a) a m c i CL
m
0 0 x r_ ö c
v i c13 2 (D m CL
Q Ö- Co Cl) 3 m
Chapter 2
Page: 92

Chapter 2
Beach Seine
Length of net fished ranged between 30 and 200 m and net depth between 2.0
and 9.7 m. All nets had a mesh size of 12 mm and a twine size of 36 ply. Number
of nets sampled: 102.
Gear Design
Bridle ropes Net length 110 m made of old, twisted 80 rn long s netting material of pow} e floatation
tled end to and
1 1, 0.5 hanging 12 mm stretched ratio meshed netting
material
New net sections are added to the centre of the net as money becomes available, thus Inaeasing Its length
,A
Foot rope made of old twisted netting material
Method of Fishing 2. Net Is paid out In a semi circle
1. One end of the net Is held on the beach
Beach
'jam ýJýC
Assistants are often children
3. The end of the net 4. Both ends of Is returned to the beach the net are hauled towards the beach
Pulled In ,
gý net
AA AA
AAAý A
Fishing entrepreneur A Fishing assistant
Pictures of clocks indicate the usual setting and checking times of the gear (gill
nets, drift nets, longlines and traps) or the time of the fishing operation (beach
seines and cast nets). Pictures of entrepreneurs and assistants represent the
number of fisherfolk who usually operate the gear.
Page: 93
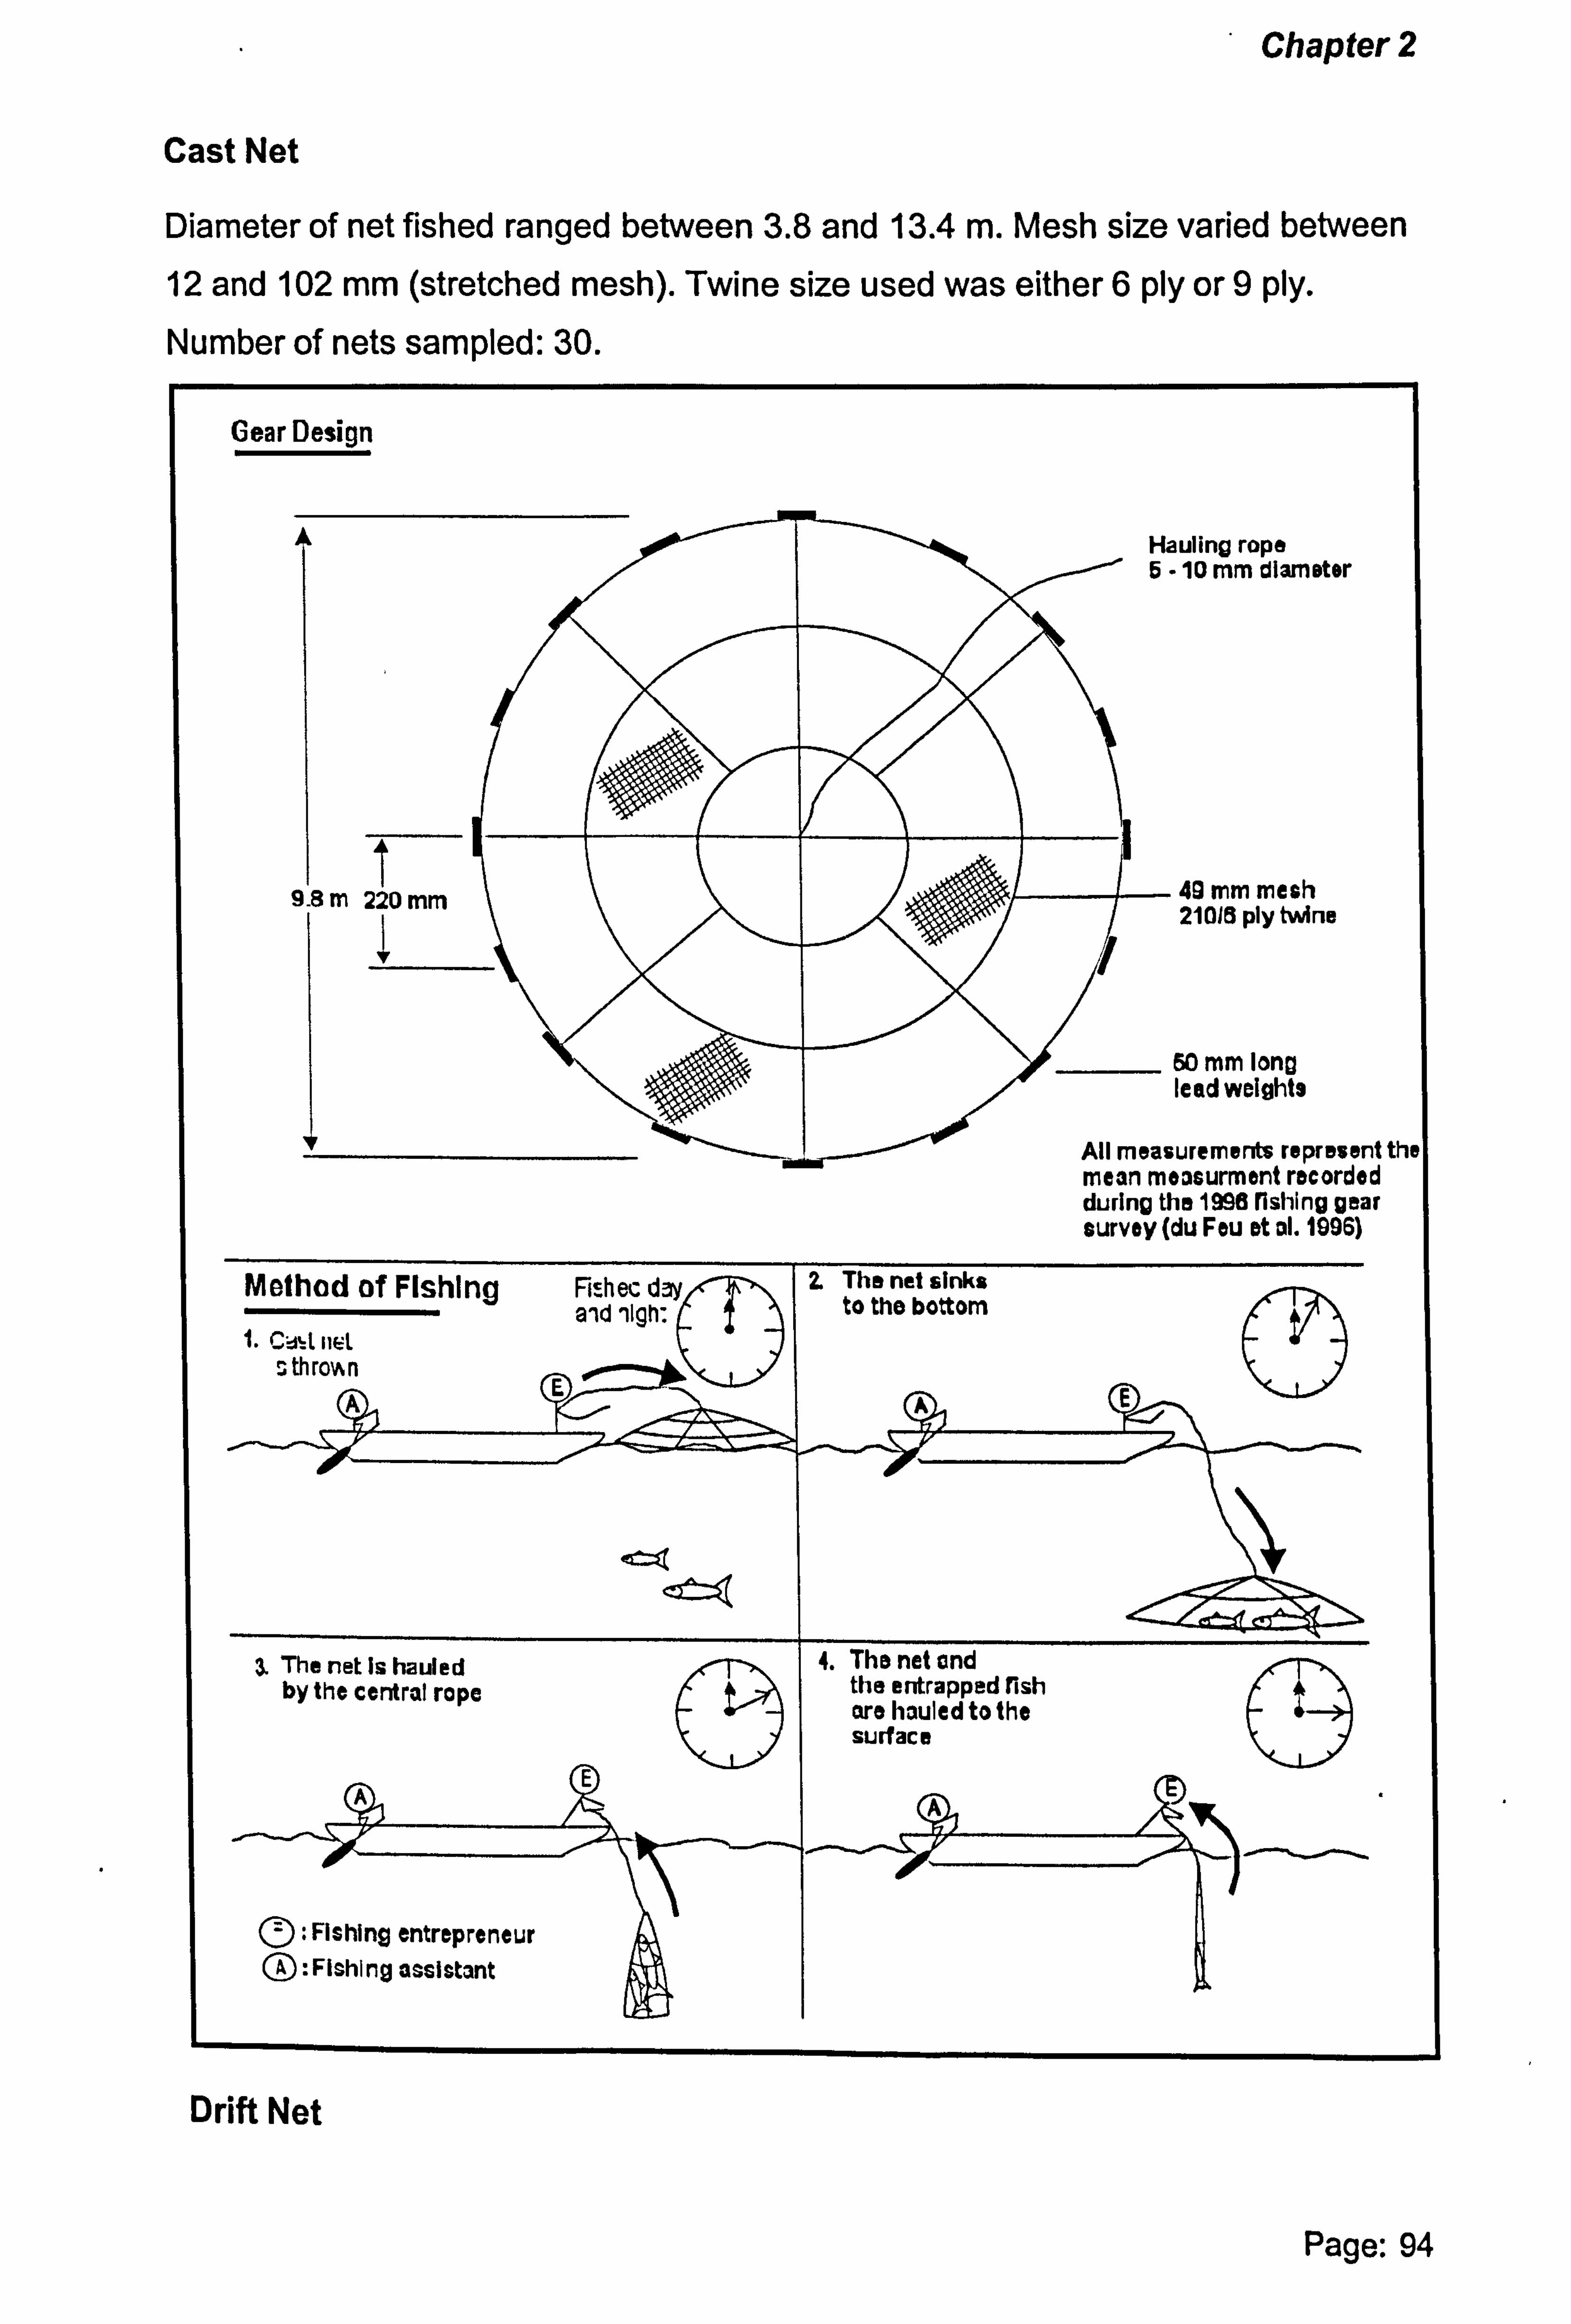
Chapter 2
Cast Net
Diameter of net fished ranged between 3.8 and 13.4 m. Mesh size varied between
12 and 102 mm (stretched mesh). Twine size used was either 6 ply or 9 ply. Number of nets sampled: 30.
Gear Design
11 98m 220 mm
11
auling rope " 10 mm diameter
48 mm mesh 21018 ply twine
60 mm long lead weights
All measurements represent mean measurment recorded during the 1996 fishing gear survey (du Feu et al. 1096)
Method of Flshing Fi hec dir 2 The net sinks aid uIgh: to the bottom
1. CýýL nel
rpý
s th roA n Iýj
ýi The net Is hauled by the central rope
(! ): Fishing entrepreneur (: Fishing assistant
4. The net and the entrapped fish are hauled to the surface
Drift Net
Page: 94
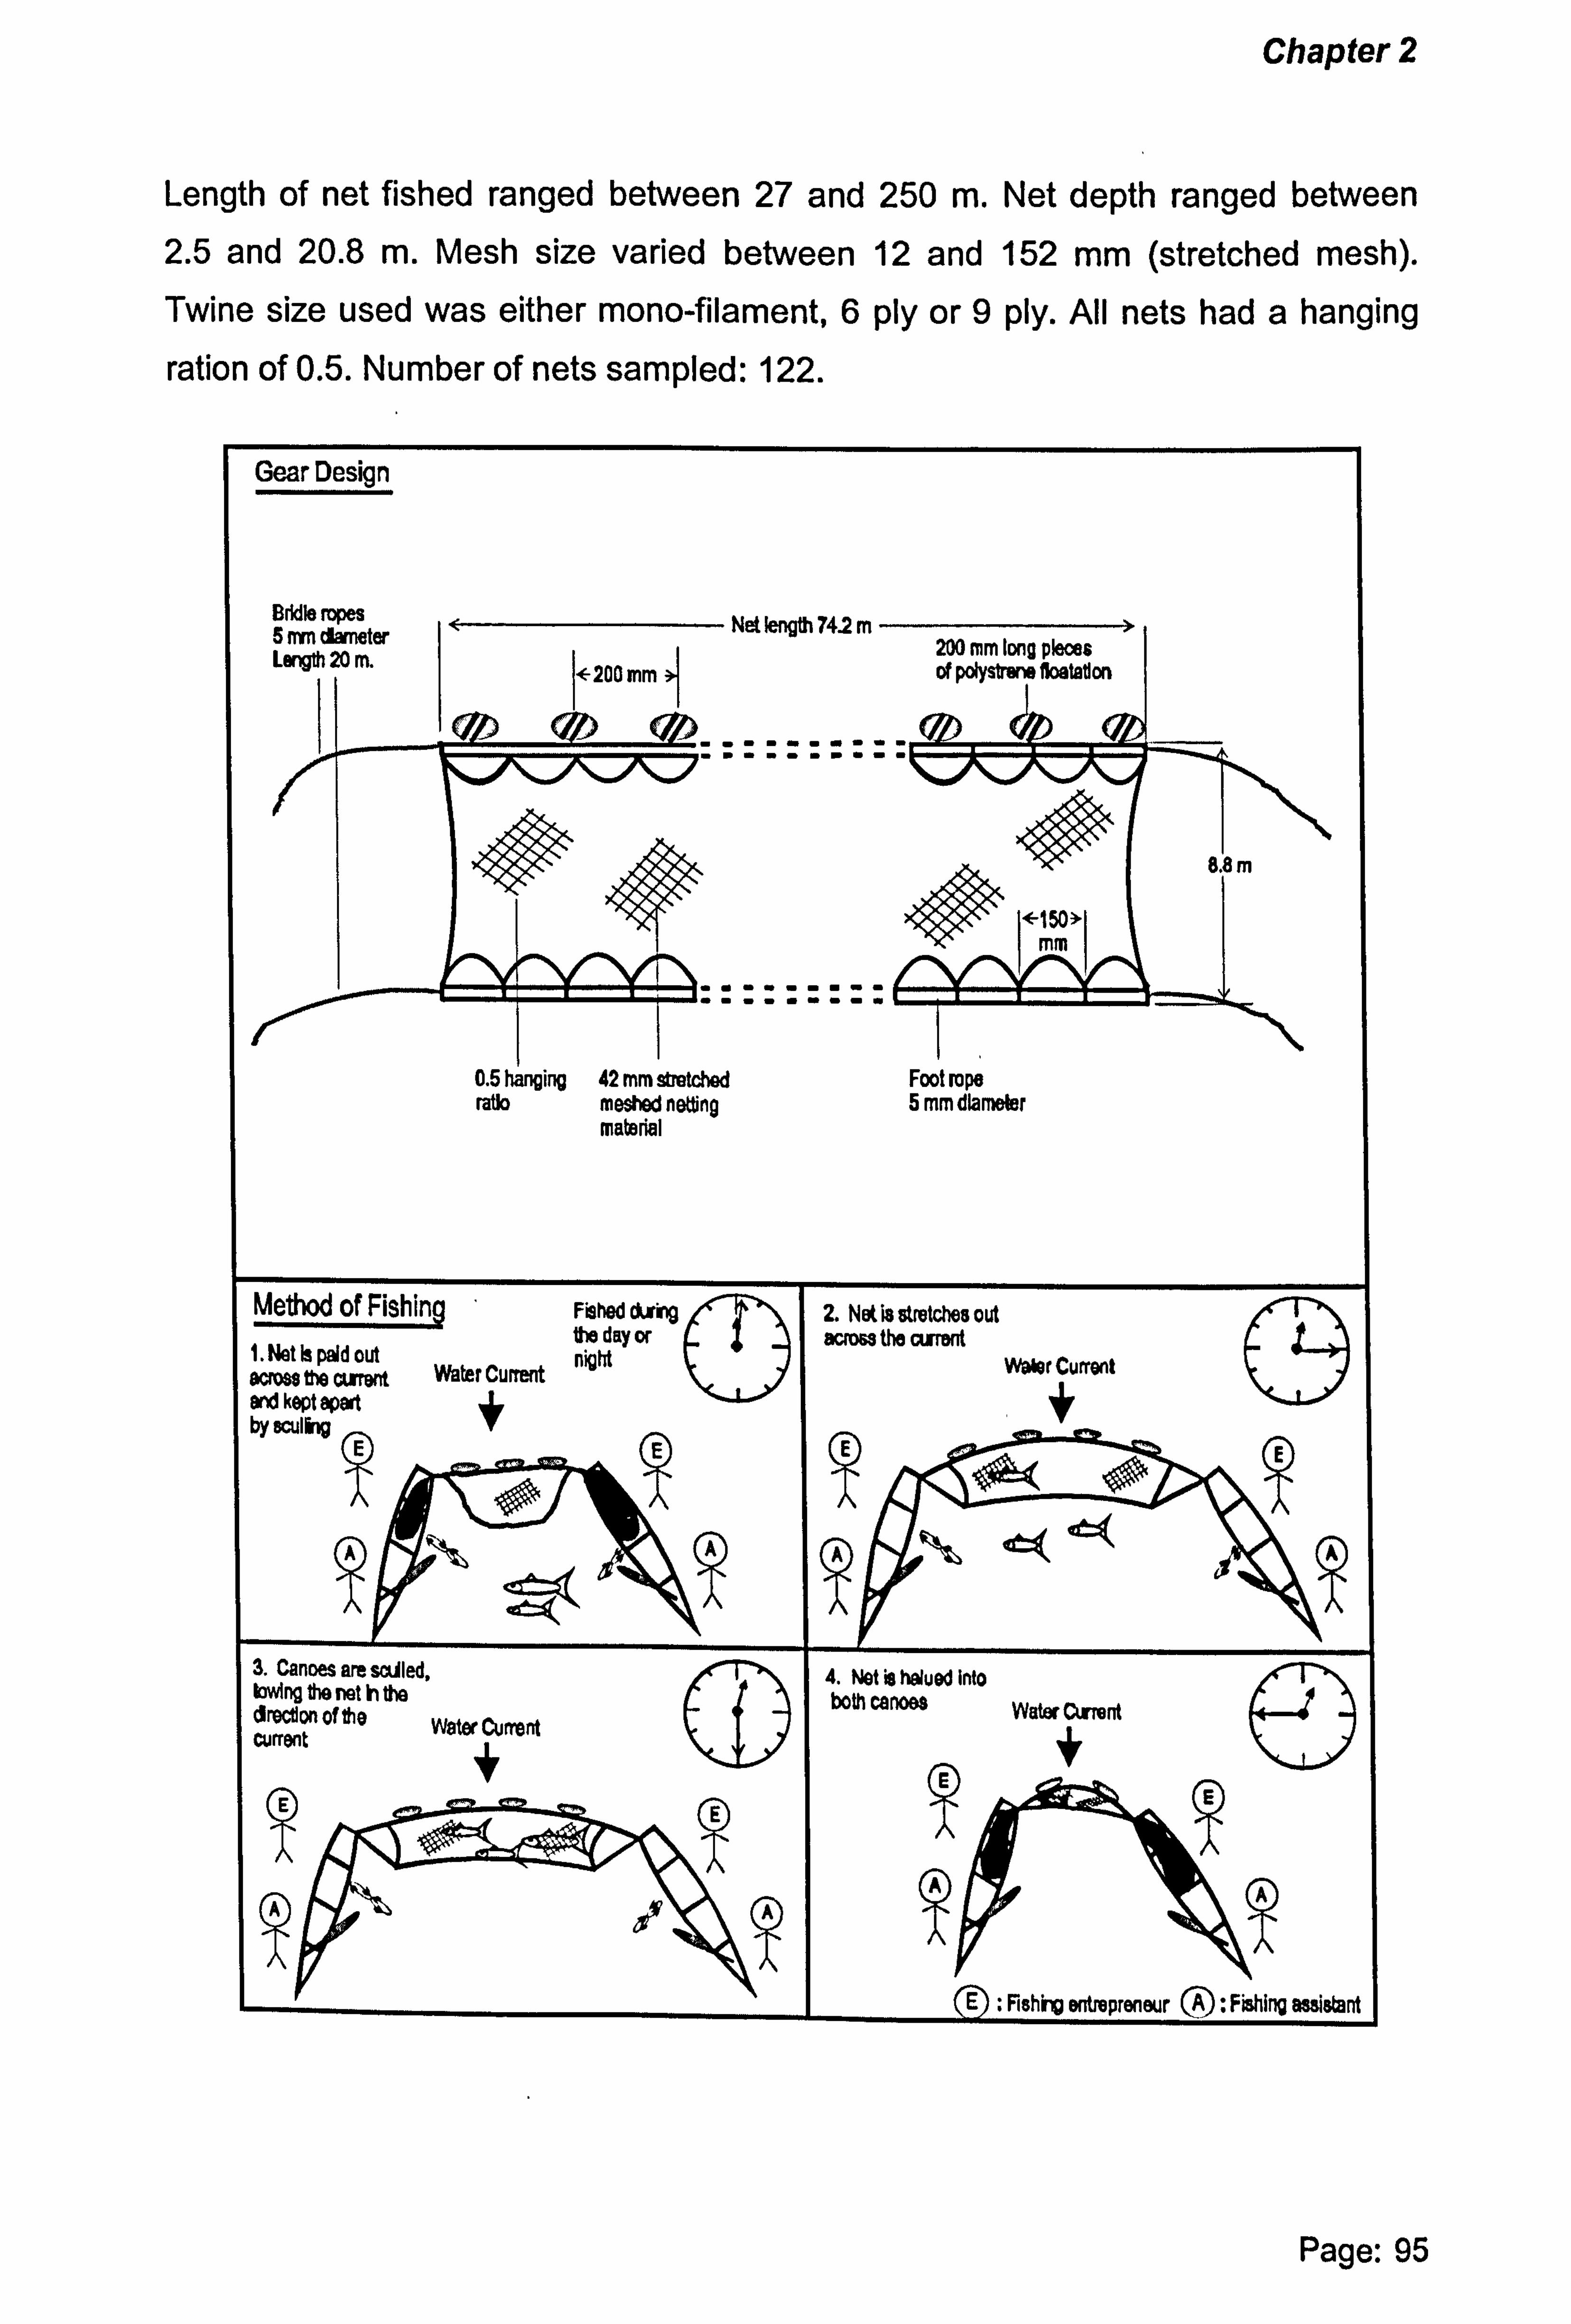
Chapter 2
Length of net fished ranged between 27 and 250 m. Net depth ranged between
2.5 and 20.8 m. Mesh size varied between 12 and 152 mm (stretched mesh). Twine size used was either mono-filament, 6 ply or 9 ply. All nets had a hanging
ration of 0.5. Number of nets sampled: 122.
Gear Design
Bddie ropes 5 mm diameter length 20 m. F200 mm
0.5 hanging 42 mm stretched ratio meshed netting
material
-X- <0 IEmmýl
Foot rope 5 mm diameter
m
Method of Fishing FiSned ckrlrg 2. Nat is atretcnes out the day or across the arrant 1. Net is paid out night water Current tv wffwt Water Current
and kept apart +i by eculing
AýAA
3. Canoes are sailed, besing the net In the drectlon of the Water Current current
4. Plot is halved into both canoes Water Current
Net length 742 m 200 mm long pieces of polystrene 1lostatlon
A
(D
IJ T
EDf Fishing entrepreneur (A) : Fishing assistant
Page: 95
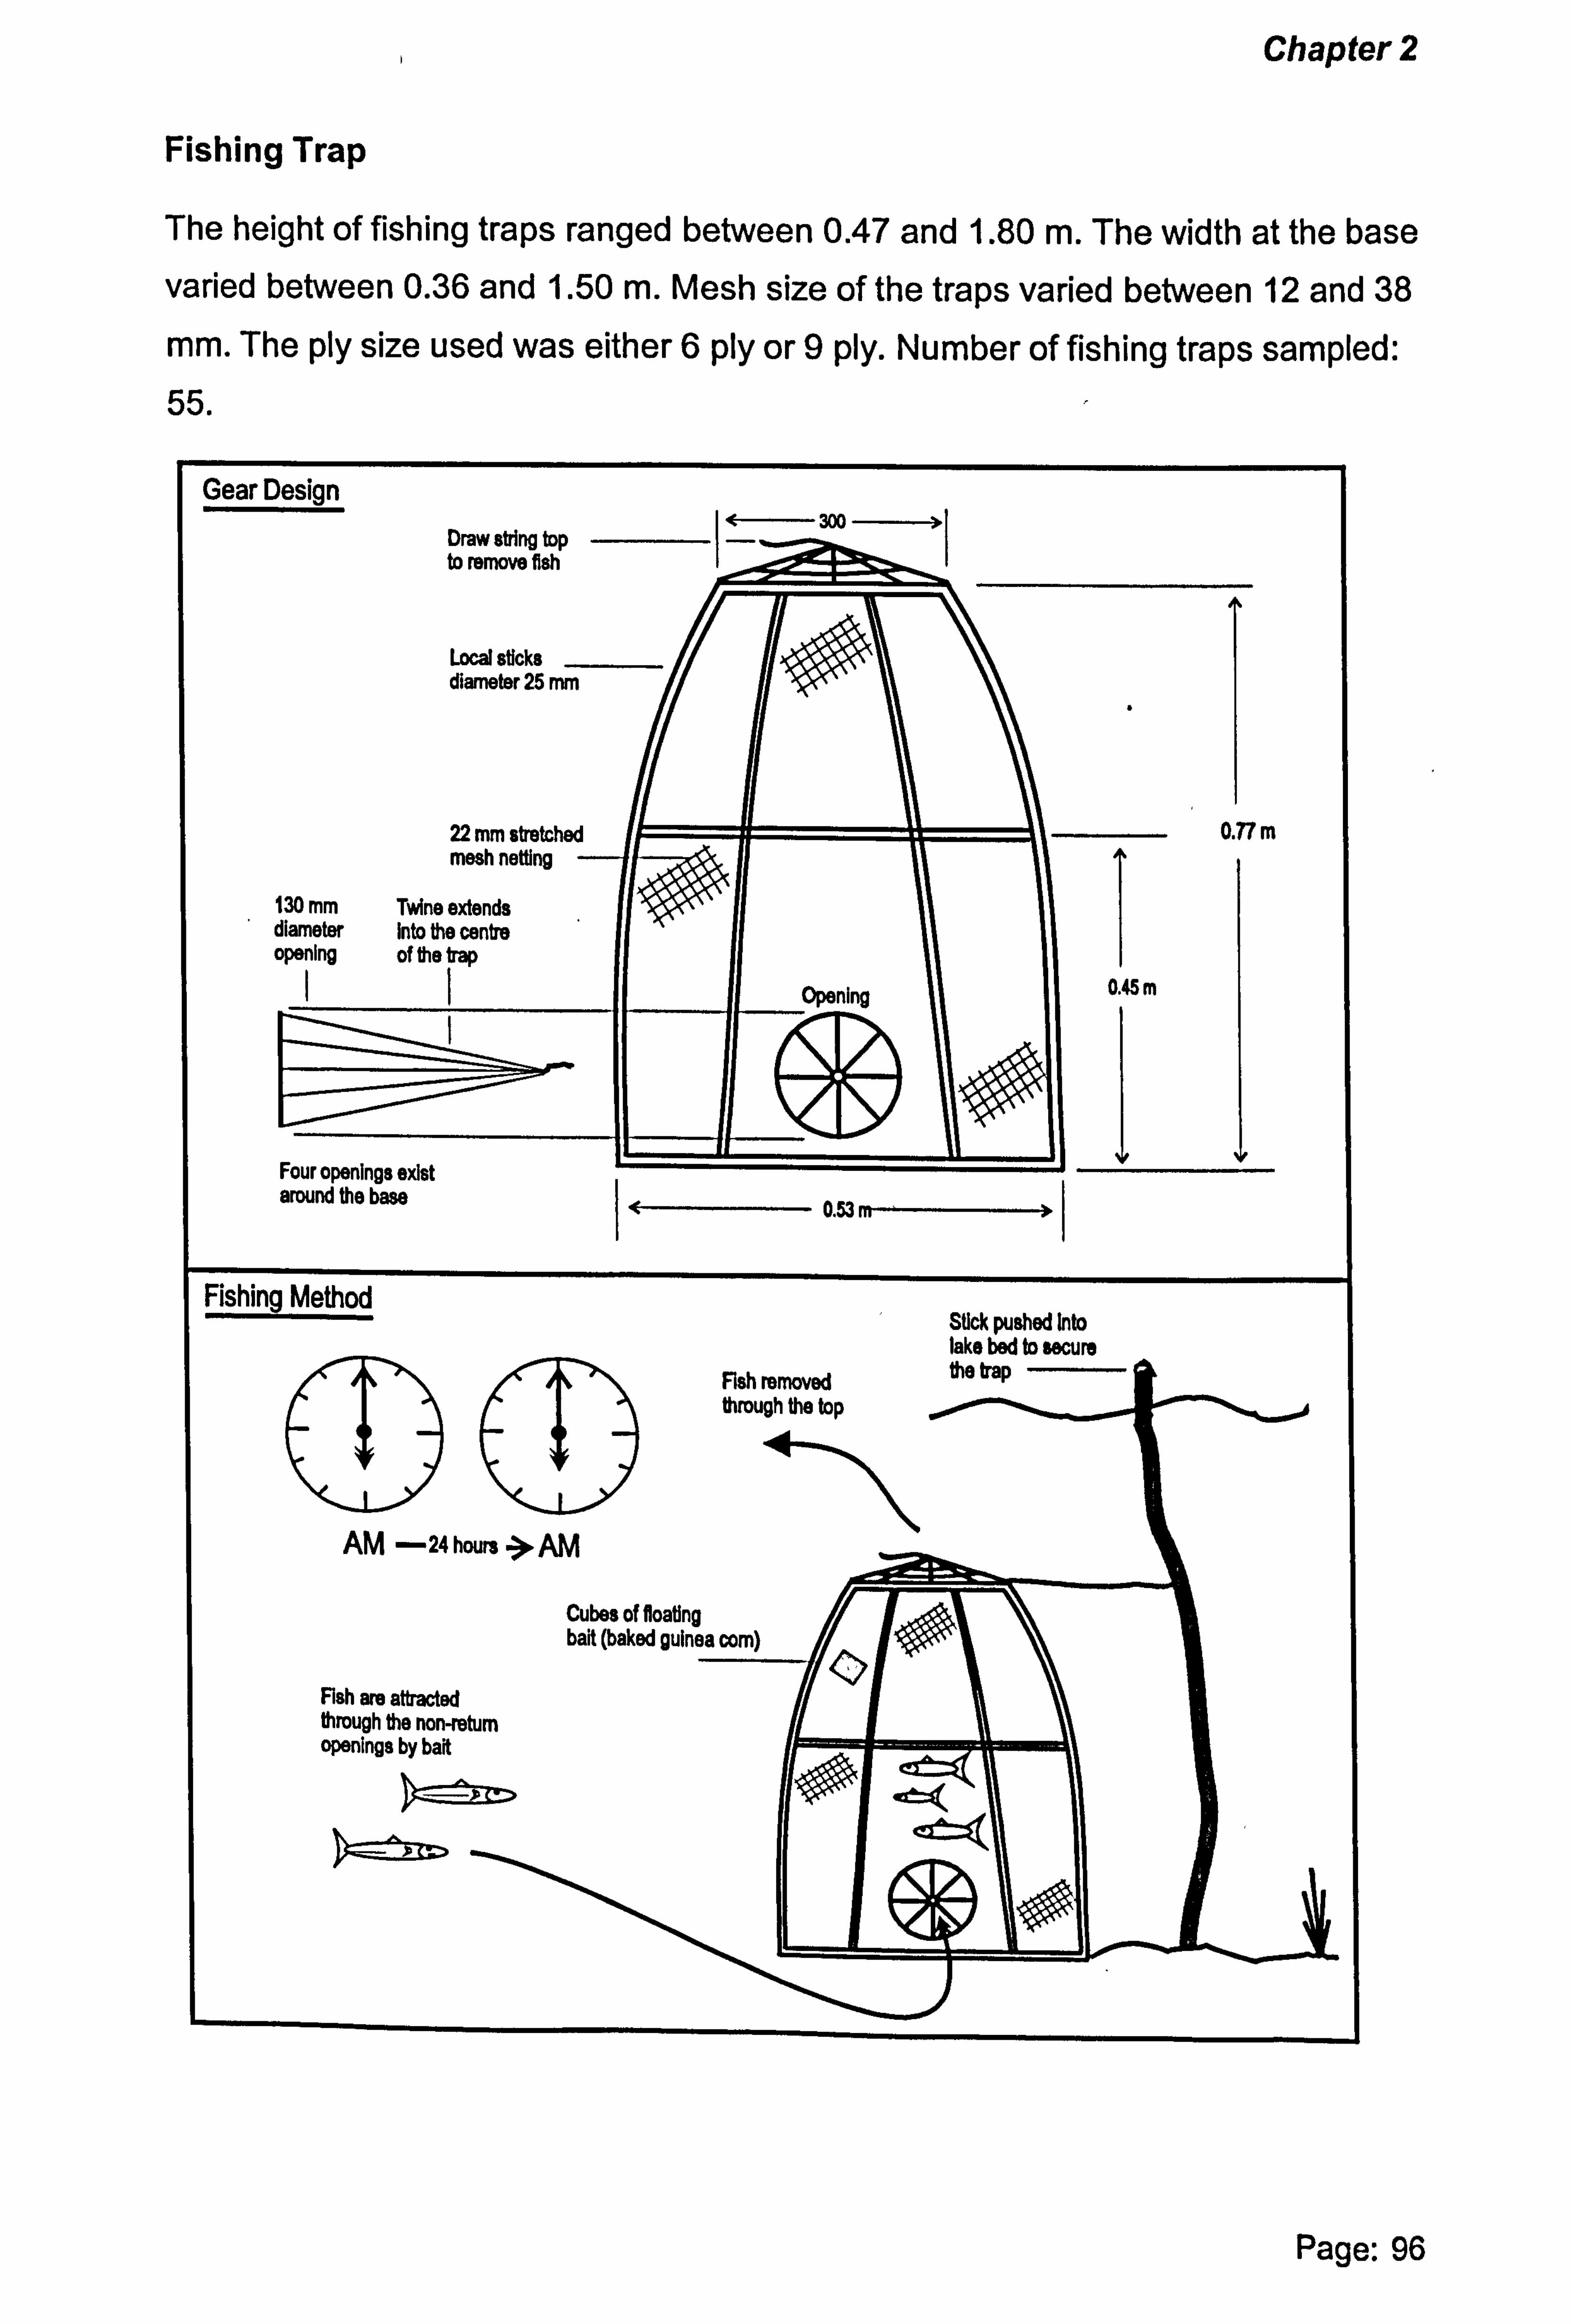
Chapter 2
Fishing Trap
The height of fishing traps ranged between 0.47 and 1.80 m. The width at the base
varied between 0.36 and 1.50 m. Mesh size of the traps varied between 12 and 38
mm. The ply size used was either 6 ply or 9 ply. Number of fishing traps sampled: 55.
Gear Design
300 Draw string top to remove fish
LocalsUcks - diameter 25 mm
22 mm stretched mesh netting -
130 mm Twine extends diameter Into the centre opening of the trap
ýýO- Four openings exist around the base
Fishing Method
Opening ? QýI\
KZY
0.77 m
0.45 m
0.53
AM -24 hours ->AM
Stick pushed Into lake bed to secure
Fish removed the trap through the top
Cubes of floating bait (baked guinea com)
Fish are attracted through the non-return openings by bait
1
Page: 96
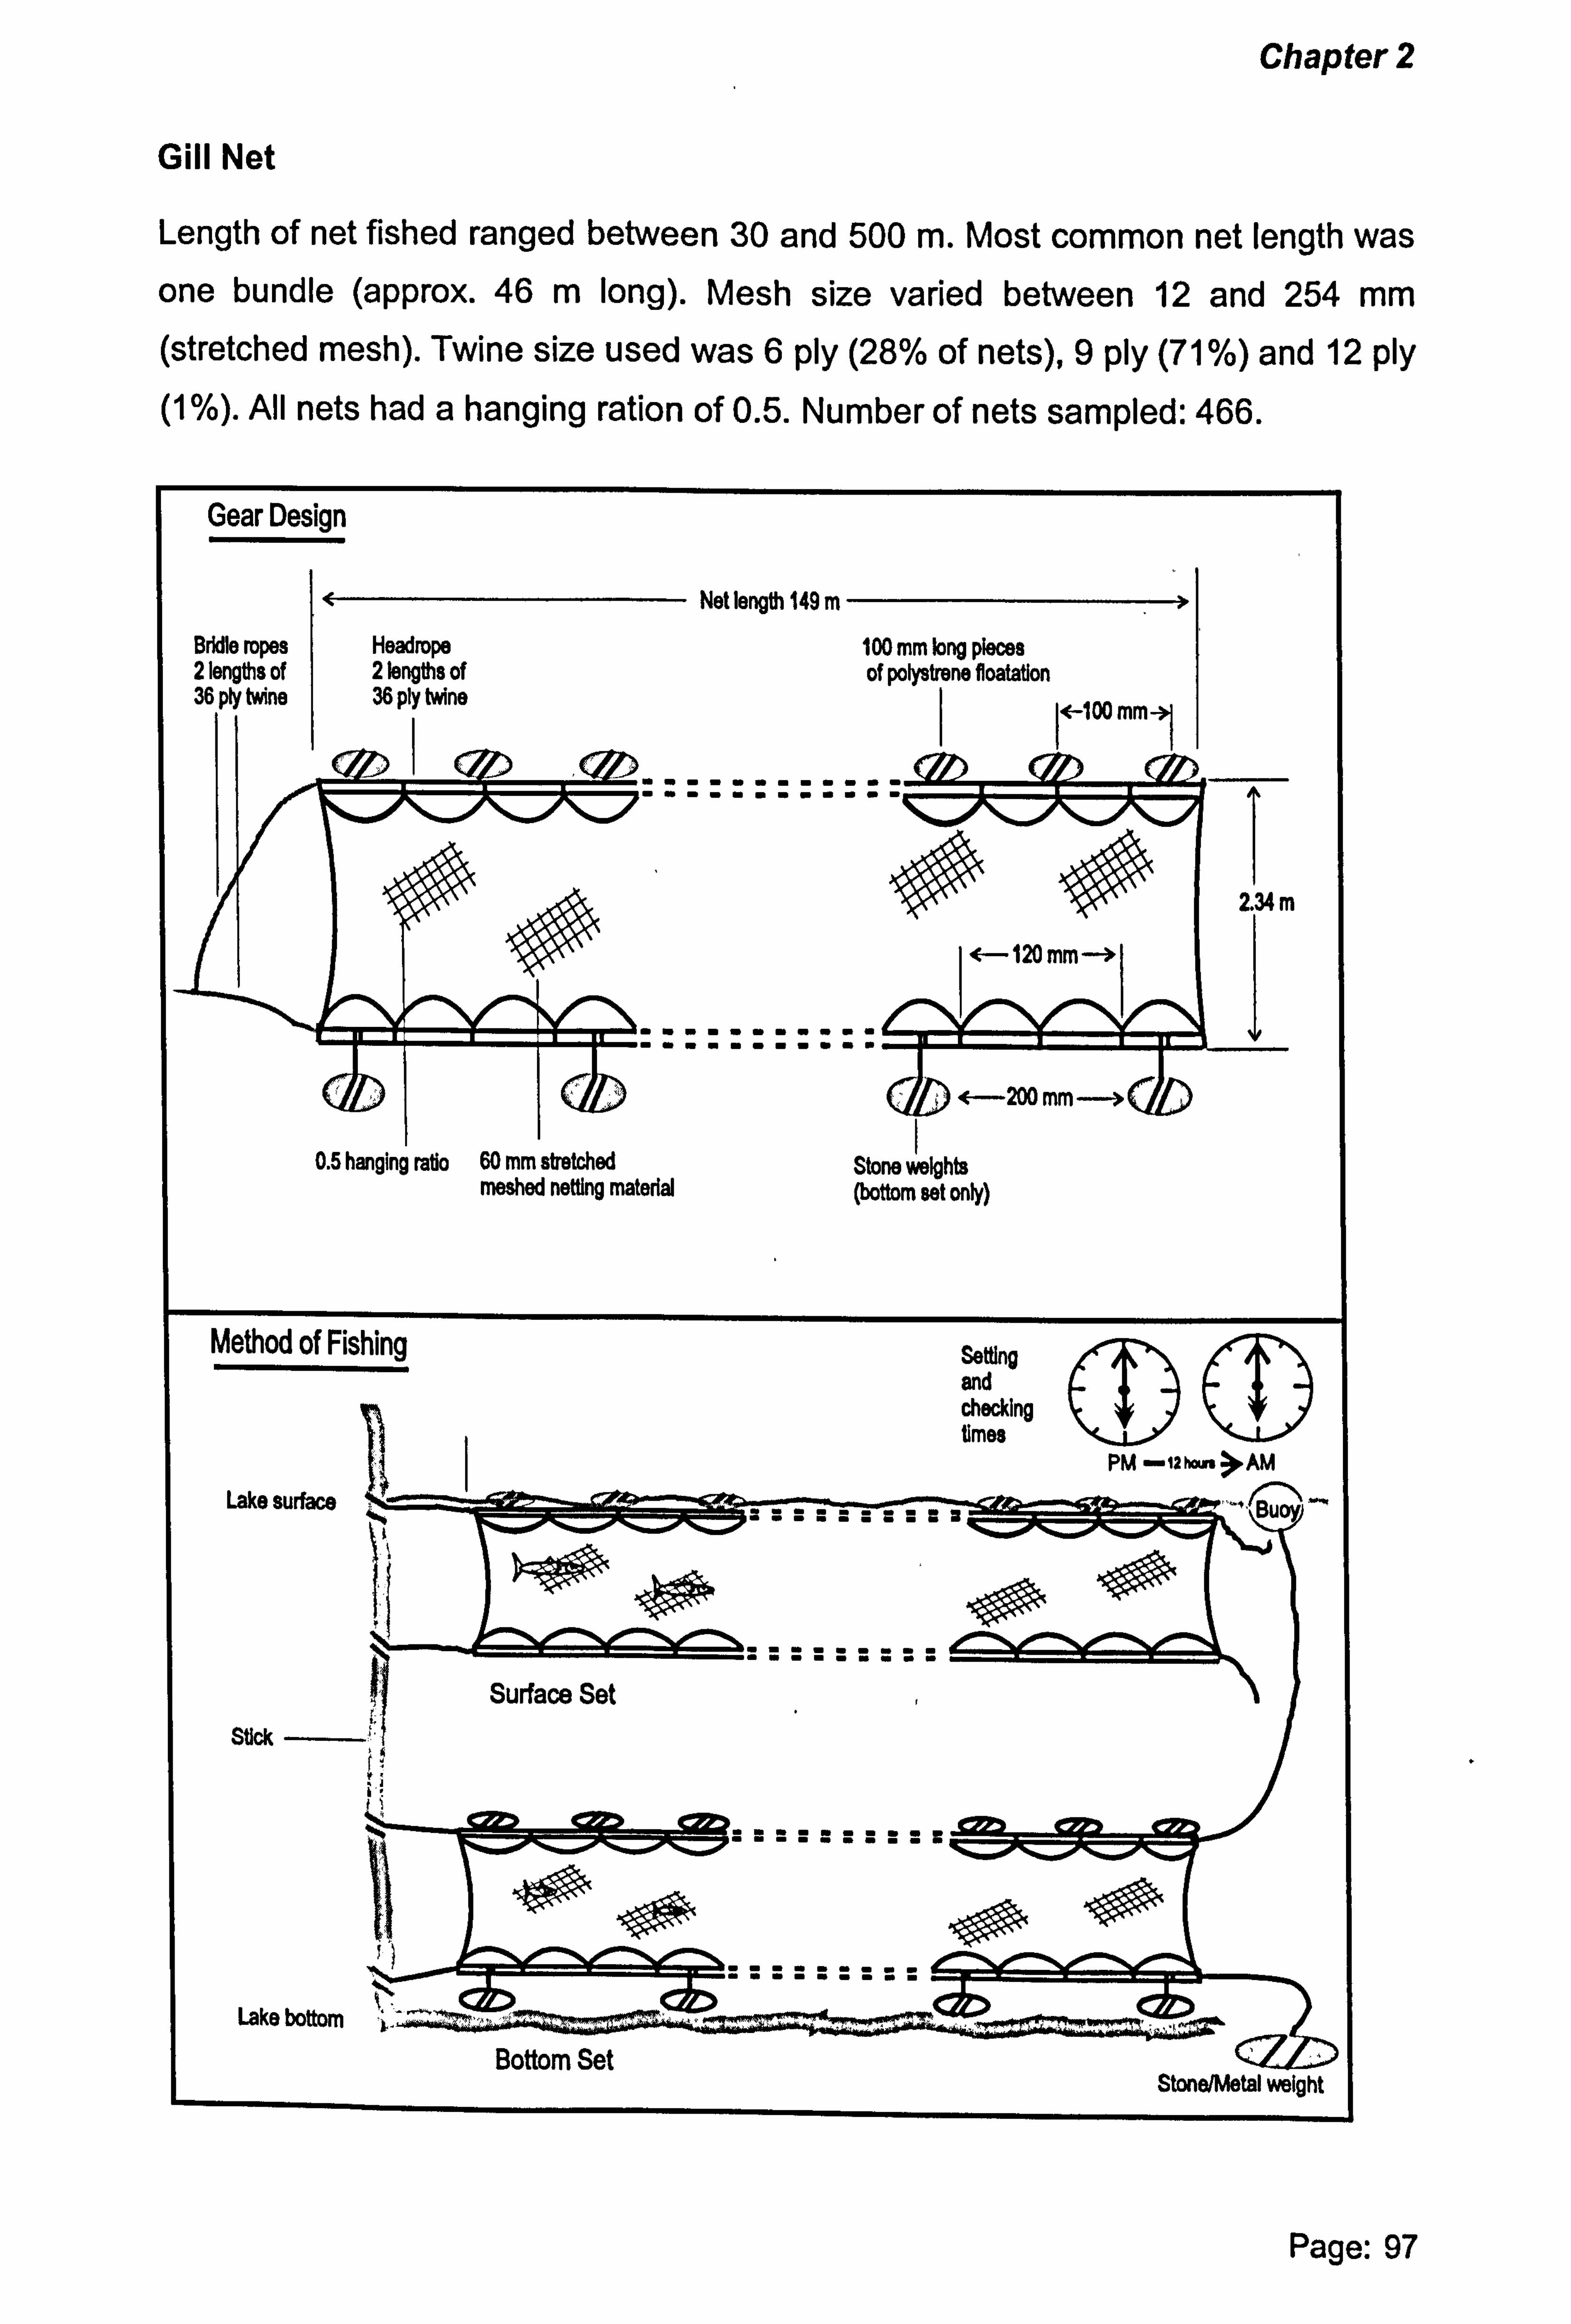
Chapter 2
Gill Net
Length of net fished ranged between 30 and 500 m. Most common net length was
one bundle (approx. 46 m long). Mesh size varied between 12 and 254 mm (stretched mesh). Twine size used was 6 ply (28% of nets), 9 ply (71 %) and 12 ply (1 %). All nets had a hanging ration of 0.5. Number of nets sampled: 466.
Gear Design
Bridle ropes Headrope 2 lengths of 2 lengths of 36 ply twine 36 ply twine
Net length 149 m
100 mm long pieces of polystrene floatation
I<-100 mmI
2.34m
Method of Fishing
Lake surface
SOck
Lake bottom
Bottom Set
Setting and checking times
PM -+shoum>AM
StonelMetal weight
Page: 97
Stone weights (bottom set only)
0.5 hanging ratio 60 mm stretched meshed netting material
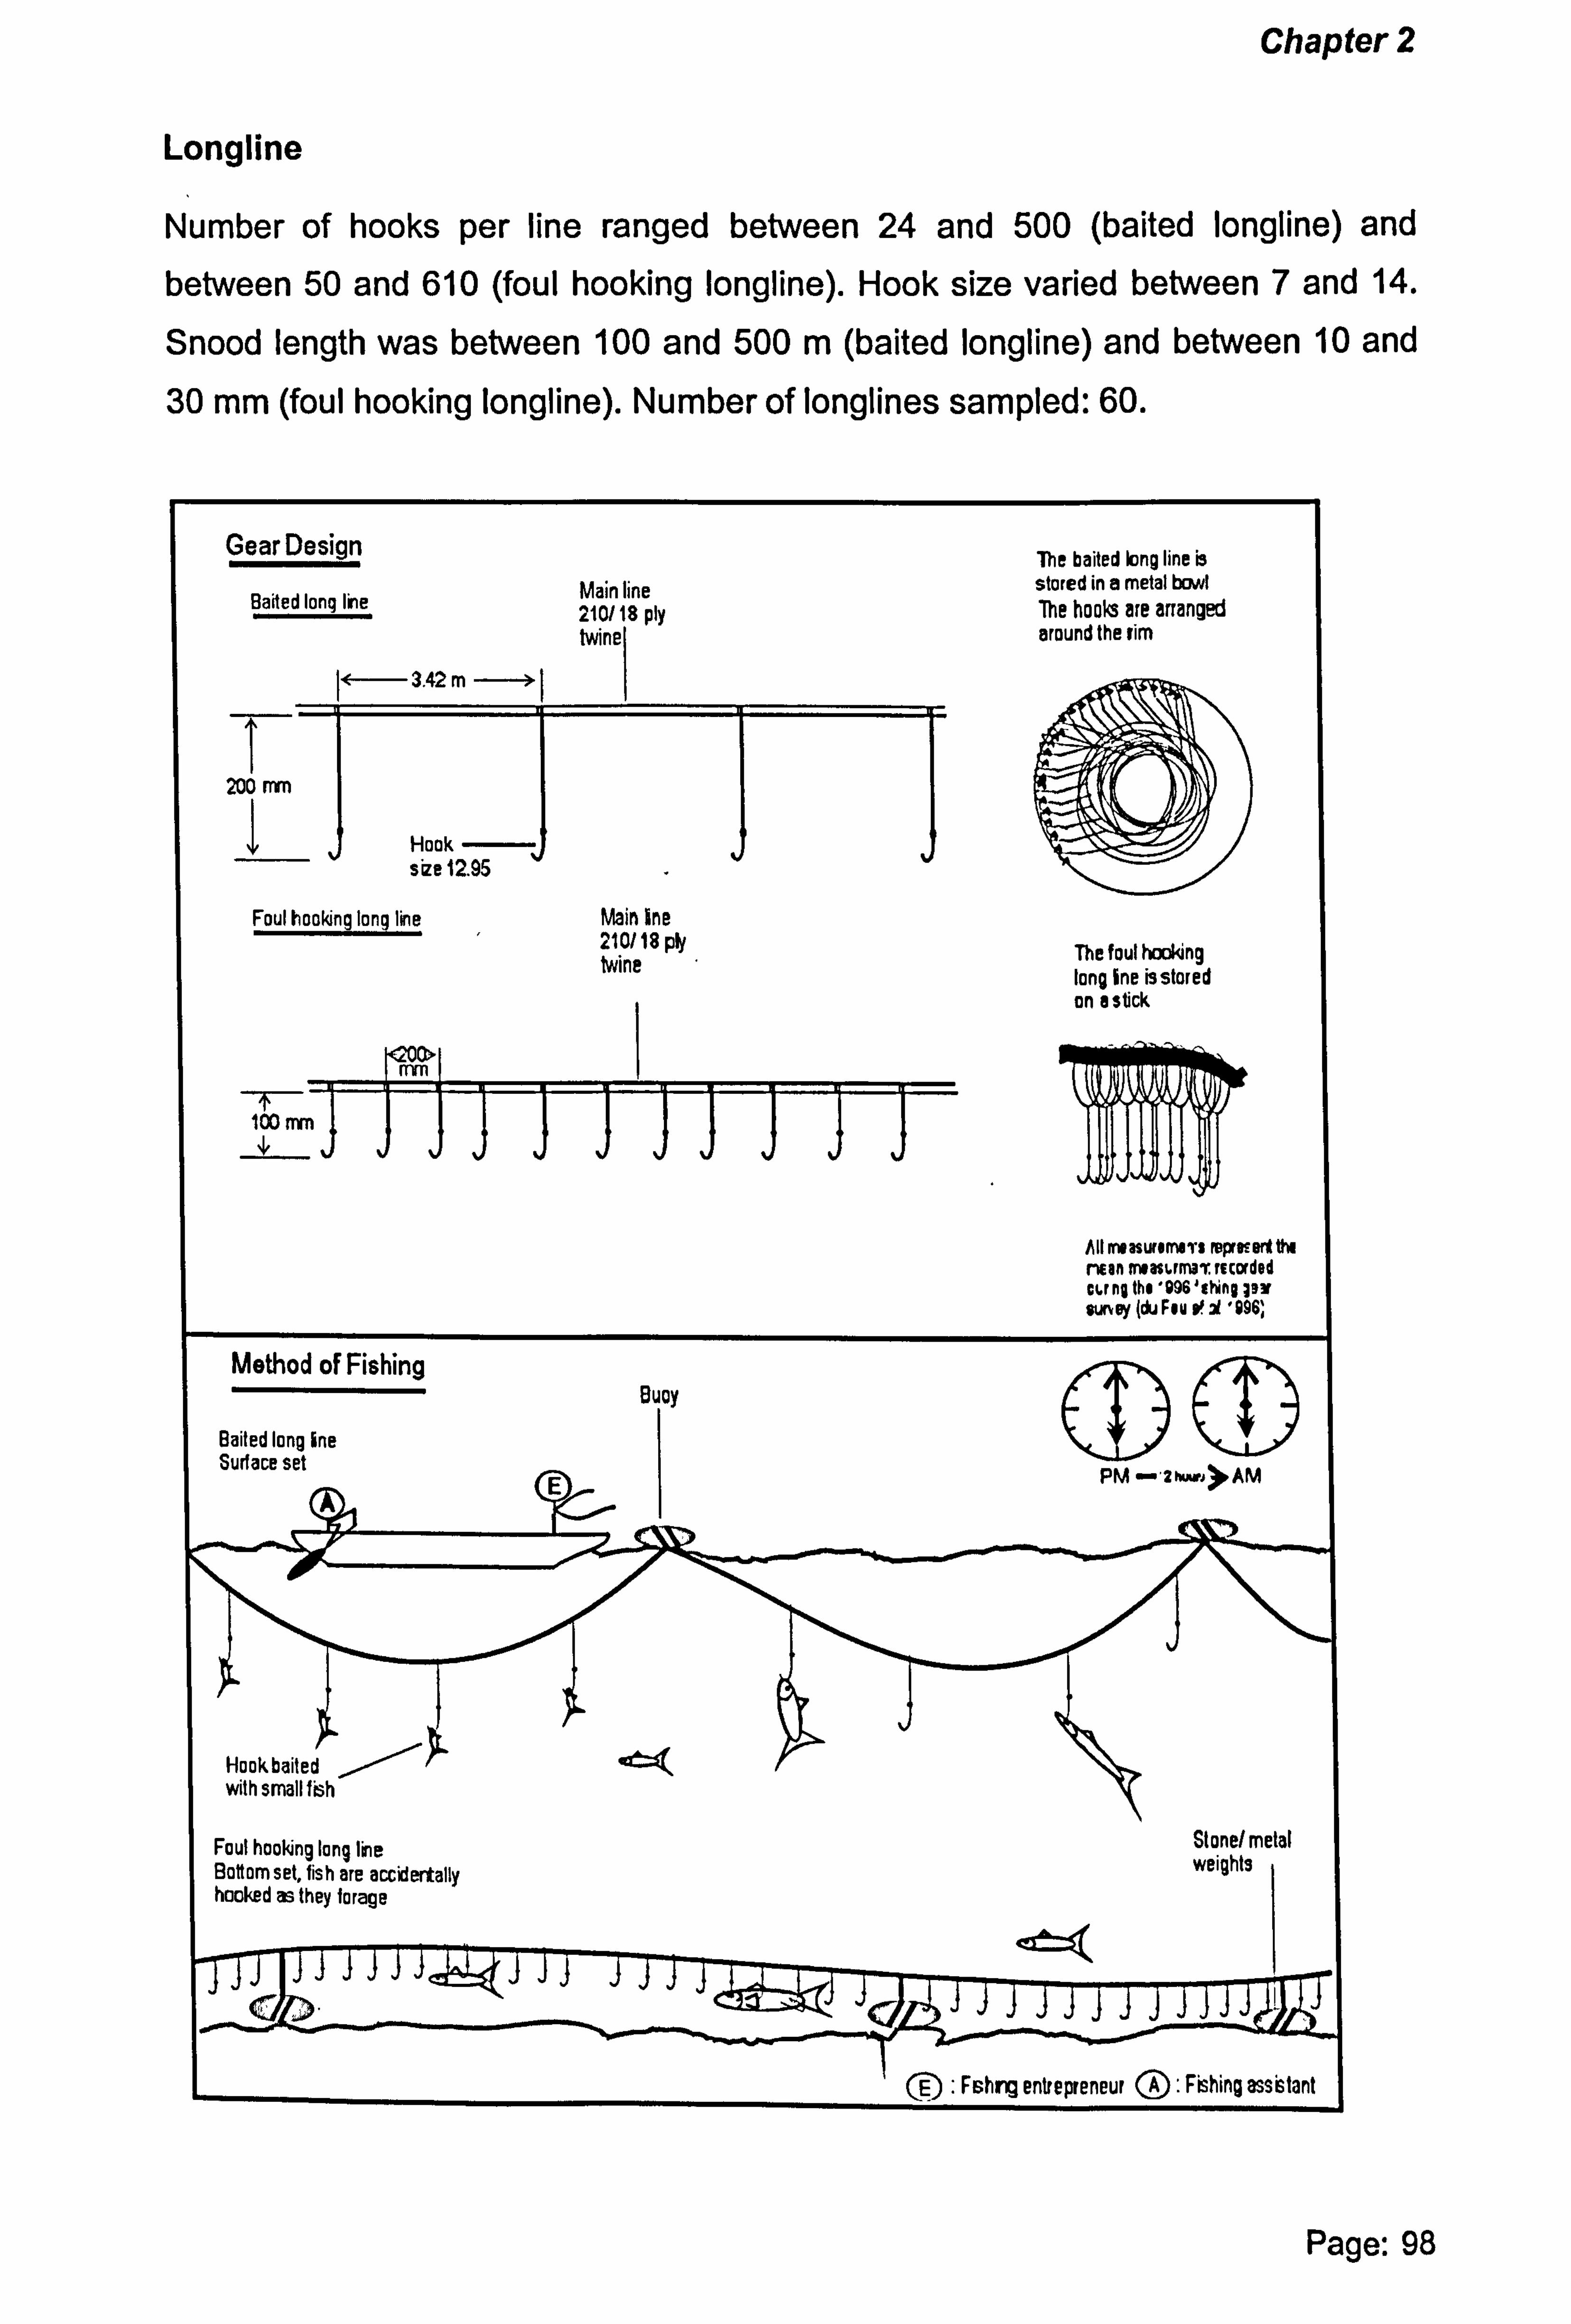
Chapter 2
Longline
Number of hooks per line ranged between 24 and 500 (baited longline) and between 50 and 610 (foul hooking longline). Hook size varied between 7 and 14.
Snood length was between 100 and 500 m (baited longline) and between 10 and
30 mm (foul hooking longline). Number of longlines sampled: 60.
Gear Design
Baited long line
T 20o mm
1
Main line 2101 18 ply
sizeizu! )
Foul hooking long line Main 6ne 210118 ply twine
i 200> mm
1
loomm y
The baited long line is stored in a metal bowl The hooks are arranged around the tim
The foul hooking long ine is stored on e stick
All Nwasuwemere r preeert 1M run nwasuma r. if corded Cu no the '996, Ihng 193r 4uney (du Feu rx' 9961,
Method of Fishing Buoy leý
Baited long line Qu 11ý"D
Surface set n PM - znw, >AM
Hookbaited with small fish
Foul hooking long line Stone/metal Bottom set, fish are accidertally weights hooked they forage
Fshng entrepreneur (: Rhing asshtant
Page: 98
Chapter 3
Chapter 3
Changes in the fish fauna of a reservoir fishery (Lake Kainji,
Nigeria) determined using commercial catch data and
sampling using differing mesh-sized gill nets.
ABSTRACT
The impounding of rivers to form still water reservoirs causes long-term change. This is
particularly the case for the aquatic ecosystem and the assemblage of fish species. To be
successful, fisherfolk need to accommodate such changes. Fishery managers must also
understand the expected changes and dynamics involved so as to manage the new
reservoir fishery successfully. Lake Kainji, Nigeria was formed by the impounding of the
large and fast flowing River Niger. In this chapter, I assess how the composition of the
main commercial fish species has changed from impoundment to some 30 years on. Information on species abundance and mean fish size were gathered using almost 50,000 individual fish records, sampled by experimental fishing with fleets of multi-meshed
gill nets, as well as data from commercial catches. It is shown that a high recruitment of a
single cohort of the large herbivorous Characoid (Citharinus citharus) occurred after the
initial flooding of the lake. The species accounted for 30% of the total weight of fish
sampled one year after impoundment. Populations of this species quickly declined, with Characins and Cichlids increasing in abundance. A rapid decline in the mean fish size of
all species occurred after impoundment. The gradual build up of predators in the reservoir caused the mean trophic level of all fish sampled to initially rise, after which, it declined.
Key words: fish fauna; gill net sampling; Lake Kainji; reservoir fishery; species abundance; trophic level.
Page: 99
Chapter 3
INTRODUCTION
Man-made impoundments or reservoirs have been constructed for almost
5 millennia (Petrere, 1996). The majority of tropical reservoirs have, however,
been commissioned since the 1950s in response to the growing need both for
hydroelectricity and water for irrigation. In the tropics, there is a growing demand
for electricity and, more critically, for water from an ever increasing human
population (UNEP, 2002).
In 1998, there were around 63,000 large reservoirs in the world with a water
surface area of some 400,000 km2 (ICOLD, 1998). The contribution of fish protein
and employment made by fisheries within these reservoirs is considered as being
increasingly important (UNEP, 2002), especially since many dams are located in
rural areas.
The change from riverine to lacustrine (reservoir) environments causes dramatic
changes to the aquatic environment and the fishery. These include changes to the
fertility and transparency of the water and the temperature profiles of water
columns. This affects the productivity of the aquatic system, which in turn alters the yield from the fishery. The leaching of nutrients from flooded soils and
sediments, the decomposition of submerged vegetation and the establishment of the aquatic macrophyte fauna further influence levels of water productivity.
The fish yield within newly flooded reservoirs is influenced by the assemblage of fish species and how successful they are in adapting to accommodate such changes. A further factor determining fish yield is the extent that fisherfolk are able to exploit the changing abundance of species and how effectively the species can be managed. This therefore suggests that the changing dynamics of newly created reservoirs, particularly changing fish fauna, must be understood.
Page: 100

Chapter 3
Researchers have often used fleets of graded multi-meshed gill nets (gill net trials)
to assess the abundance of fish species in reservoir fisheries. Examples are Lakes
Volta in Ghana (Denyoh, 1964; Petr, 1967; Petr, 1969), Kariba in
Zambia/Zimbabwe (Balon, 1974; Kenmuir, 1984; Karenge & Kolding, 1995),
Nyumba ya Mungu Reservoir in Tanzania (Bailey et al., 1978), Manantali and Selingue in Mali (Anne et al., 1994), Itezhi-tezhi in Zambia (Cowx &
Kapasa, 1995), Chenderoh Reservoir in Malaysia (Ali & Lee, 1995) and reservoirs in Sri Lanka (Pet of al., 1999).
Lake Kainji in Nigeria was impounded in 1968 and has a surface area of 1280 km2 (Imevbore, 1970). A large number of gill net trial fishing records exist for the
reservoir. The records extend over the 30-year period following initial flooding. The lake is typical of many of the larger sized reservoirs that were built in the 1960s
and thus provides an example by which the changes resulting from the transition from riverine to lake can be examined.
Gill net trial fishing in the Lake Kainji area was first undertaken in the
pre-impounded river by Banks et al. (1965). In 1966, Motwani & Kanwai (1970)
made replicate trials in a small lake (surface area 18 km2) that had formed before the reservoir was completely filled.
After the filling of the reservoir gill net trials continued between June 1969 and May 1971 as part of a UNDP/FAO Kainji Lake Research Project (Lelek, 1972). Sampling using cast nets, longlines and light fishing was included at this time. Gill net trial fishing was also undertaken at the same time (between October 1970
and September 1972) as part of the research activities undertaken by the Ile-Ife (Nigeria)-Southampton (UK) Universities 'Lake Kainji Research Teams (see Lewis, 1974a). The results were reported by Turner (1971); Ita (1975) and Blake (1977).
After the handover of the UNDP/FAO project and the end of collaboration by the universities the trials were continued by the Kainji Lake Research Institute (KLRI). Results were analysed by Ita (1978) and Balogun (1983 & 1986).
Page: 101
Chapter 3
In 1987, the research area covered by the KLRI increased from Lake Kainji to include nationwide responsibilities. This caused the regular sampling of fish
populations using gill net trials on Lake Kainji to stop. In 1993, the Nigerian- German Kainji Lake Fisheries Promotion Project (KLFPP) commenced on Lake Kainji. Up to date fisheries data were required to develop a management plan for
the lake fishery. Surveys undertaken by the KLFPP included annual gear counts between 1993 and 2001 and monthly catch and effort sampling from 1995 to 2001 (du Feu, 2003). Gill net trial sampling formed part of the research and was undertaken in 1996 for three months (Ita, 1998).
In this chapter, I use the records from all the gill net trial sampling on Lake Kainji (between 1969 and 1996) and the sampling of commercial catch and effort data to determine the changes in the abundance of species, the mean fish size and trophic levels of the main commercial species from lake impoundment to some 30 years on. It is hoped that this knowledge may help the future planning and management of reservoir fisheries.
MATERIALS AND METHODS
Graded fleets of bottom, surface and shore set nets were used in all stations for all the differing sampling periods (Table I). For all the sampling periods, the gill net fleets were set at 6 pm and checked at 7 am. Catches were separated by mesh size and species. The individual standard, fork and total lengths (mm), weight (g) and sex of fish were then recorded.
Page: 102

Chapter 3
Table I. Meshes sizes used, net size (m) and fleet size (m2) and number of sampling stations for the sampling of fish populations using gill net trial fishing, Lake Kainji, Nigeria.
Period Meshes Net Net Number of Reference sizes used size area sampling
(mm) (m) of fleet stations (m)
1969-1971 51,64,76, 30x3 630 23 Lelek (1972) 89,102, Lewis (1974a) 127
1971-1975 25,34,51,30x3 64,76,89, 102,127
810 23 as above
1975- as above 1987 30x3
810 10 Ita (1978) Balogun (1983) Balogun, 1986)
1996 as above 50x3 1350 5 Ita (1998)
To compare all sampling periods equally, catches from the smaller 25 and 34mm
meshed nets included after 1971 have been excluded from calculations of catch
per unit effort (CpUE), mean sizes and trophic levels of fish caught. Allowance was
made during the analysis for the differing surface areas of the fleets used during
the various sampling periods. Net twine size and hanging ratios remained
standard throughout.
A number of gill net trial recording forms completed prior to 1978 were found in
storage (Table II), entered into a database and re-analysed. The results are used for
the analysis in this chapter.
Previous analysis of the gill net trial data by Ita (1978) & Balogun (1986) assessed the abundance of species by the total number of fish sampled. Such an approach
may cause "small-sized species to be over-represented compared to larger ones. I have therefore assessed fish abundance by using the total weight of species caught (CpUE or kg fish caught, 100m2 net's night fishing').
Page: 103
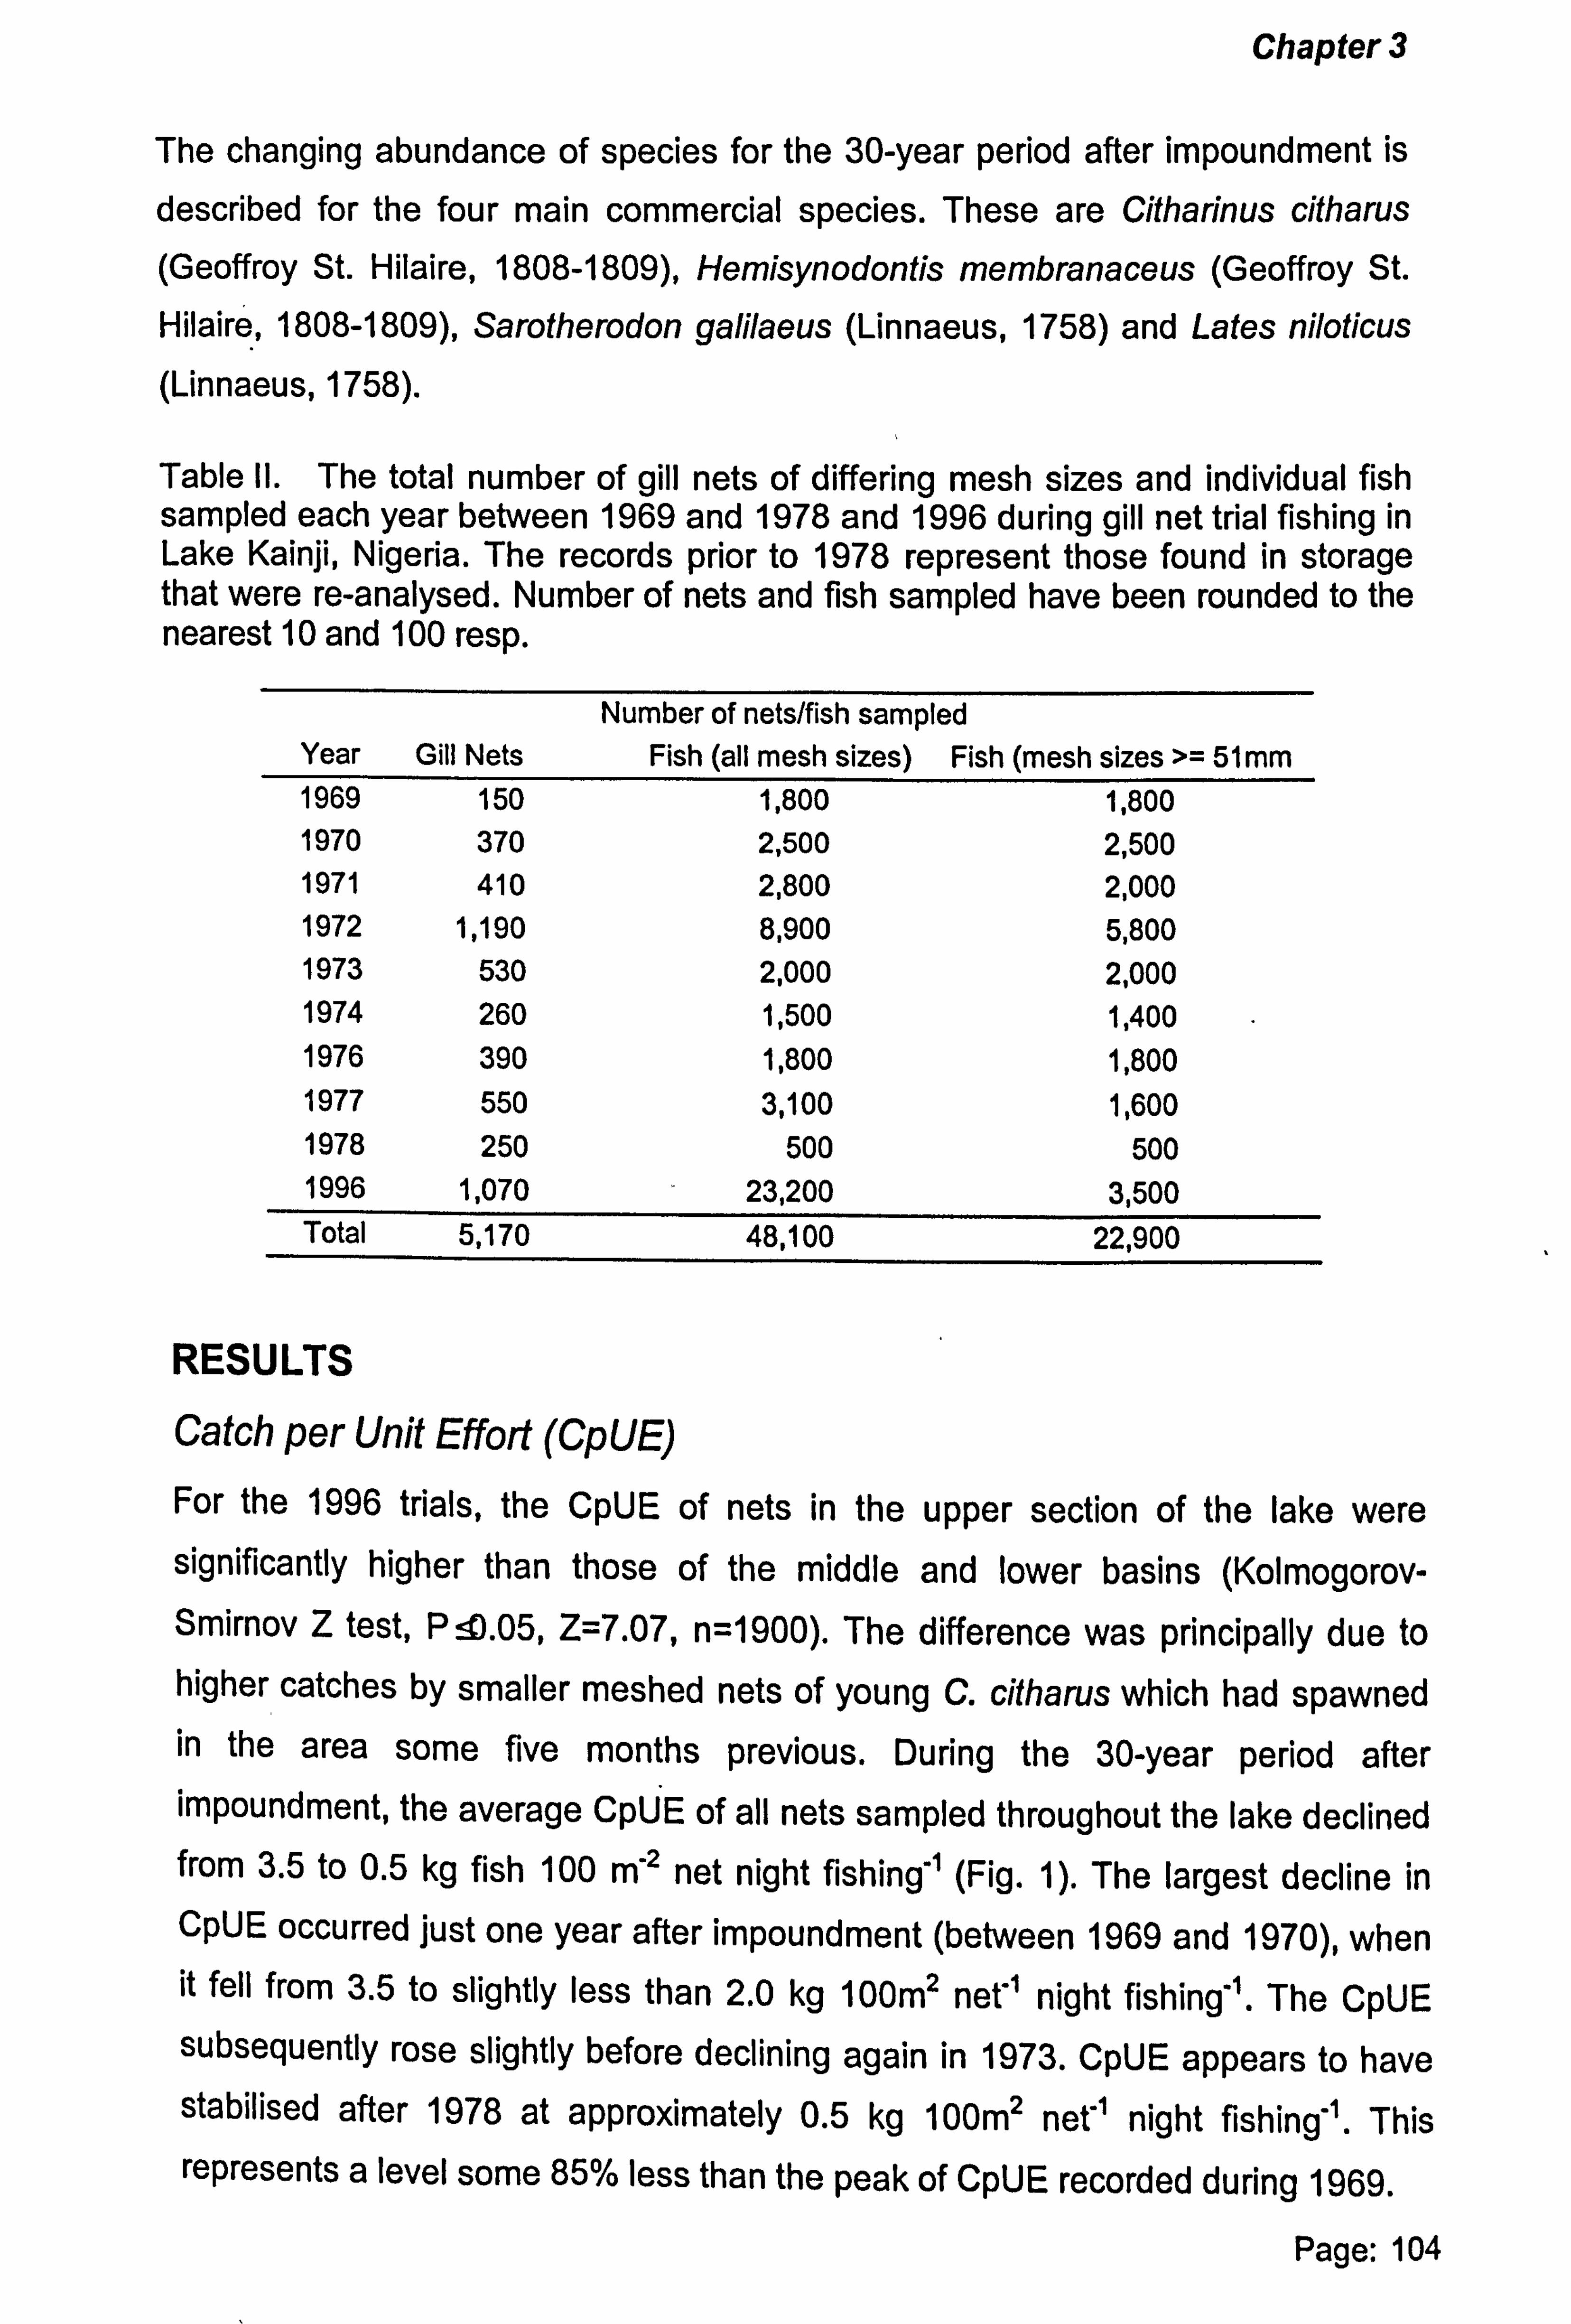
Chapter 3
The changing abundance of species for the 30-year period after impoundment is
described for the four main commercial species. These are Citharinus citharus (Geoffroy St. Hilaire, 1808-1809), Hemisynodontis membranaceus (Geoffroy St.
Hilaire, 1808-1809), Sarotherodon galilaeus (Linnaeus, 1758) and Lates niloticus (Linnaeus, 1758).
Table II. The total number of gill nets of differing mesh sizes and individual fish sampled each year between 1969 and 1978 and 1996 during gill net trial fishing in Lake Kainji, Nigeria. The records prior to 1978 represent those found in storage that were re-analysed. Number of nets and fish sampled have been rounded to the nearest 10 and 100 resp.
Number of nets/fish sampled Year Gill Nets Fish (all mesh sizes) Fish (mesh sizes >= 51 mm 1969 150 1,800 1,800 1970 370 2,500 2,500 1971 410 2,800 2,000 1972 1,190 8,900 5,800 1973 530 2,000 2,000 1974 260 1,500 1,400 1976 390 1,800 1,800 1977 550 3,100 1,600 1978 250 500 500 1996 1,070 23,200 3,500 Total 5,170 48,100 22,900
RESULTS
Catch per Unit Effort (CpUE) For the 1996 trials, the CpUE of nets in the upper section of the lake were significantly higher than those of the middle and lower basins (Kolmogorov- Smirnov Z test, Px. 05, Z=7.07, n=1900). The difference was principally due to higher catches by smaller meshed nets of young C. citharus which had spawned in the area some five months previous. During the 30-year period after impoundment, the average CpUE of all nets sampled throughout the lake declined from 3.5 to 0.5 kg fish 100 M-2 net night fishing"' (Fig. 1). The largest decline in CpUE occurred just one year after impoundment (between 1969 and 1970), when it fell from 3.5 to slightly less than 2.0 kg 100m2 net" night fishing". The CpUE subsequently rose slightly before declining again in 1973. CpUE appears to have stabilised after 1978 at approximately 0.5 kg 100m2 net -1 night fishing". This represents a level some 85% less than the peak of CpUE recorded during 1969.
Page: 104
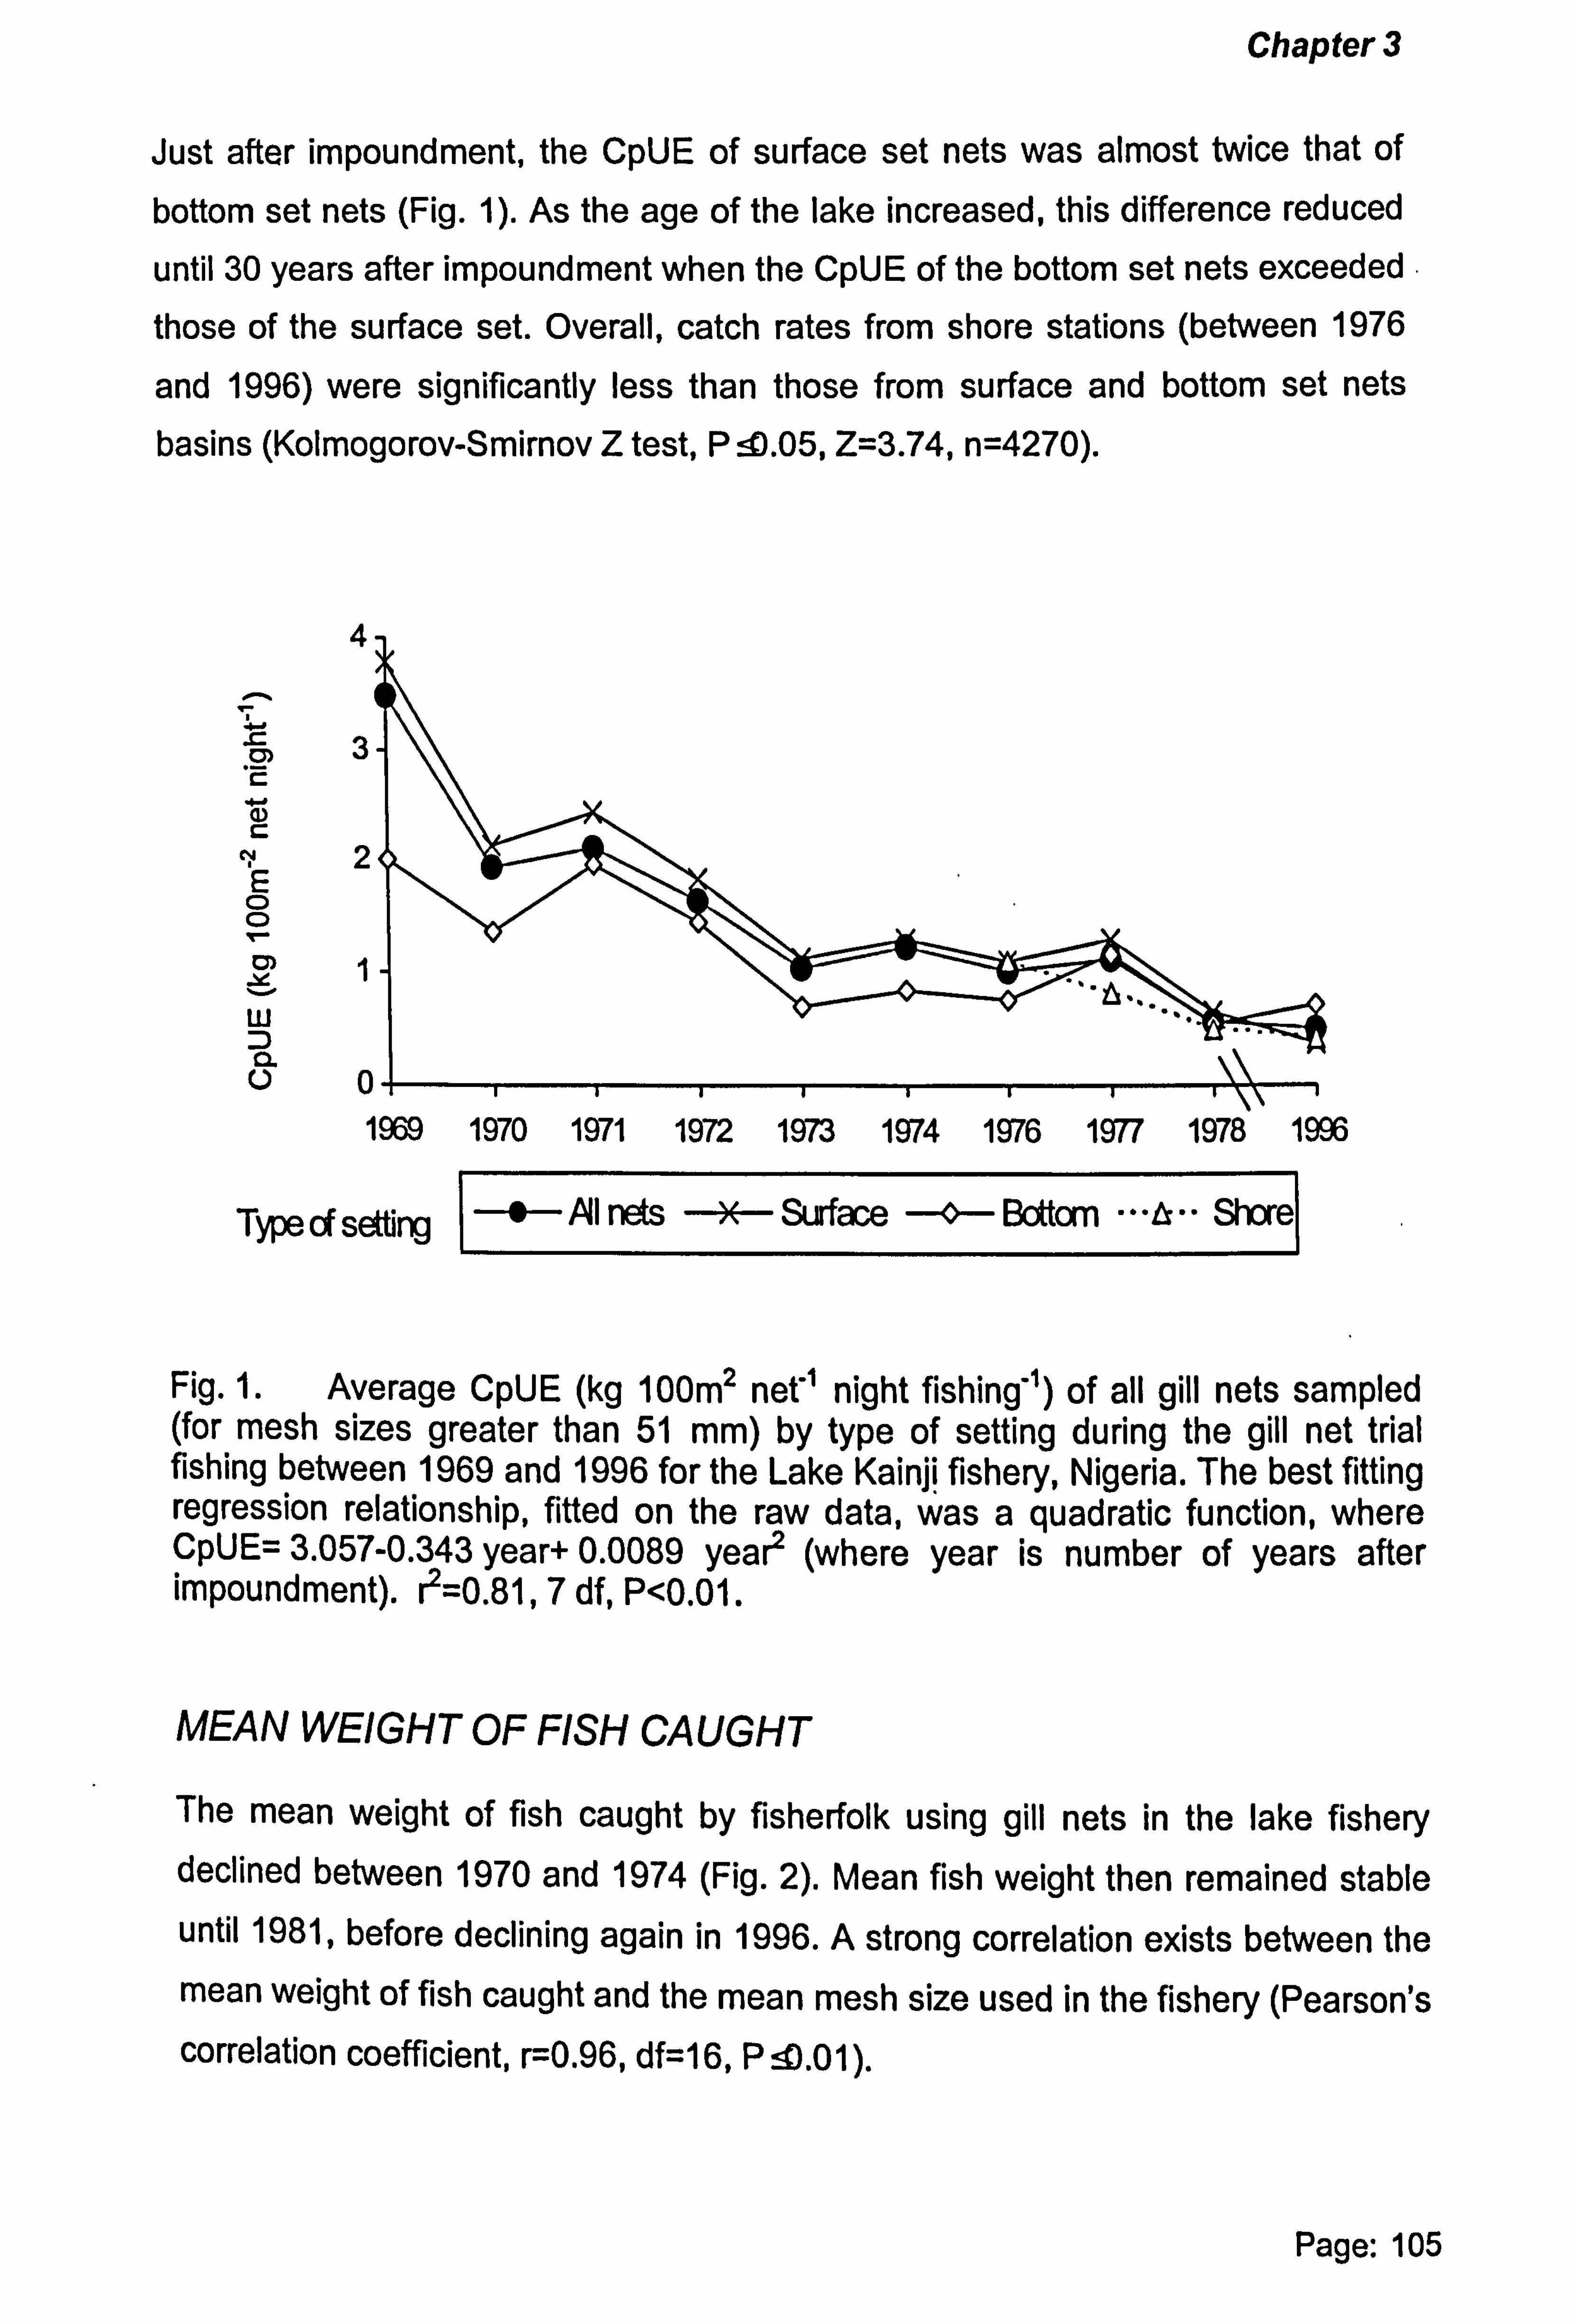
Chapter 3
Just after impoundment, the CpUE of surface set nets was almost twice that of
bottom set nets (Fig. 1). As the age of the lake increased, this difference reduced
until 30 years after impoundment when the CpUE of the bottom set nets exceeded those of the surface set. Overall, catch rates from shore stations (between 1976
and 1996) were significantly less than those from surface and bottom set nets basins (Kolmogorov-Smirnov Z test, P ! D. 05, Z=3.74, n=4270).
4
-C 3 rn
aD C CV 2
E 0 0
Y
w D
a U0
Type aF setting 0 Al nets x Surface -o- Bottom ... A.. Shore
Fig. 1. Average CpUE (kg 100m2 net" night fishing") of all gill nets sampled (for mesh sizes greater than 51 mm) by type of setting during the gill net trial fishing between 1969 and 1996 for the Lake Kainji fishery, Nigeria. The best fitting regression relationship, fitted on the raw data, was a quadratic function, where CpUE= 3.057-0.343 year+ 0.0089 year2 (where year is number of years after impoundment). r2=0.81,7 df, P<0.01.
MEAN WEIGHT OF FISH CAUGHT
The mean weight of fish caught by fisherfolk using gill nets in the lake fishery declined between 1970 and 1974 (Fig. 2). Mean fish weight then remained stable until 1981, before declining again in 1996. A strong correlation exists between the mean weight of fish caught and the mean mesh size used in the fishery (Pearson's correlation coefficient, r=0.96, df=16, PAW).
Page: 105
1969 1970 1971 1972 1973 1974 1976 1977 1978 1996
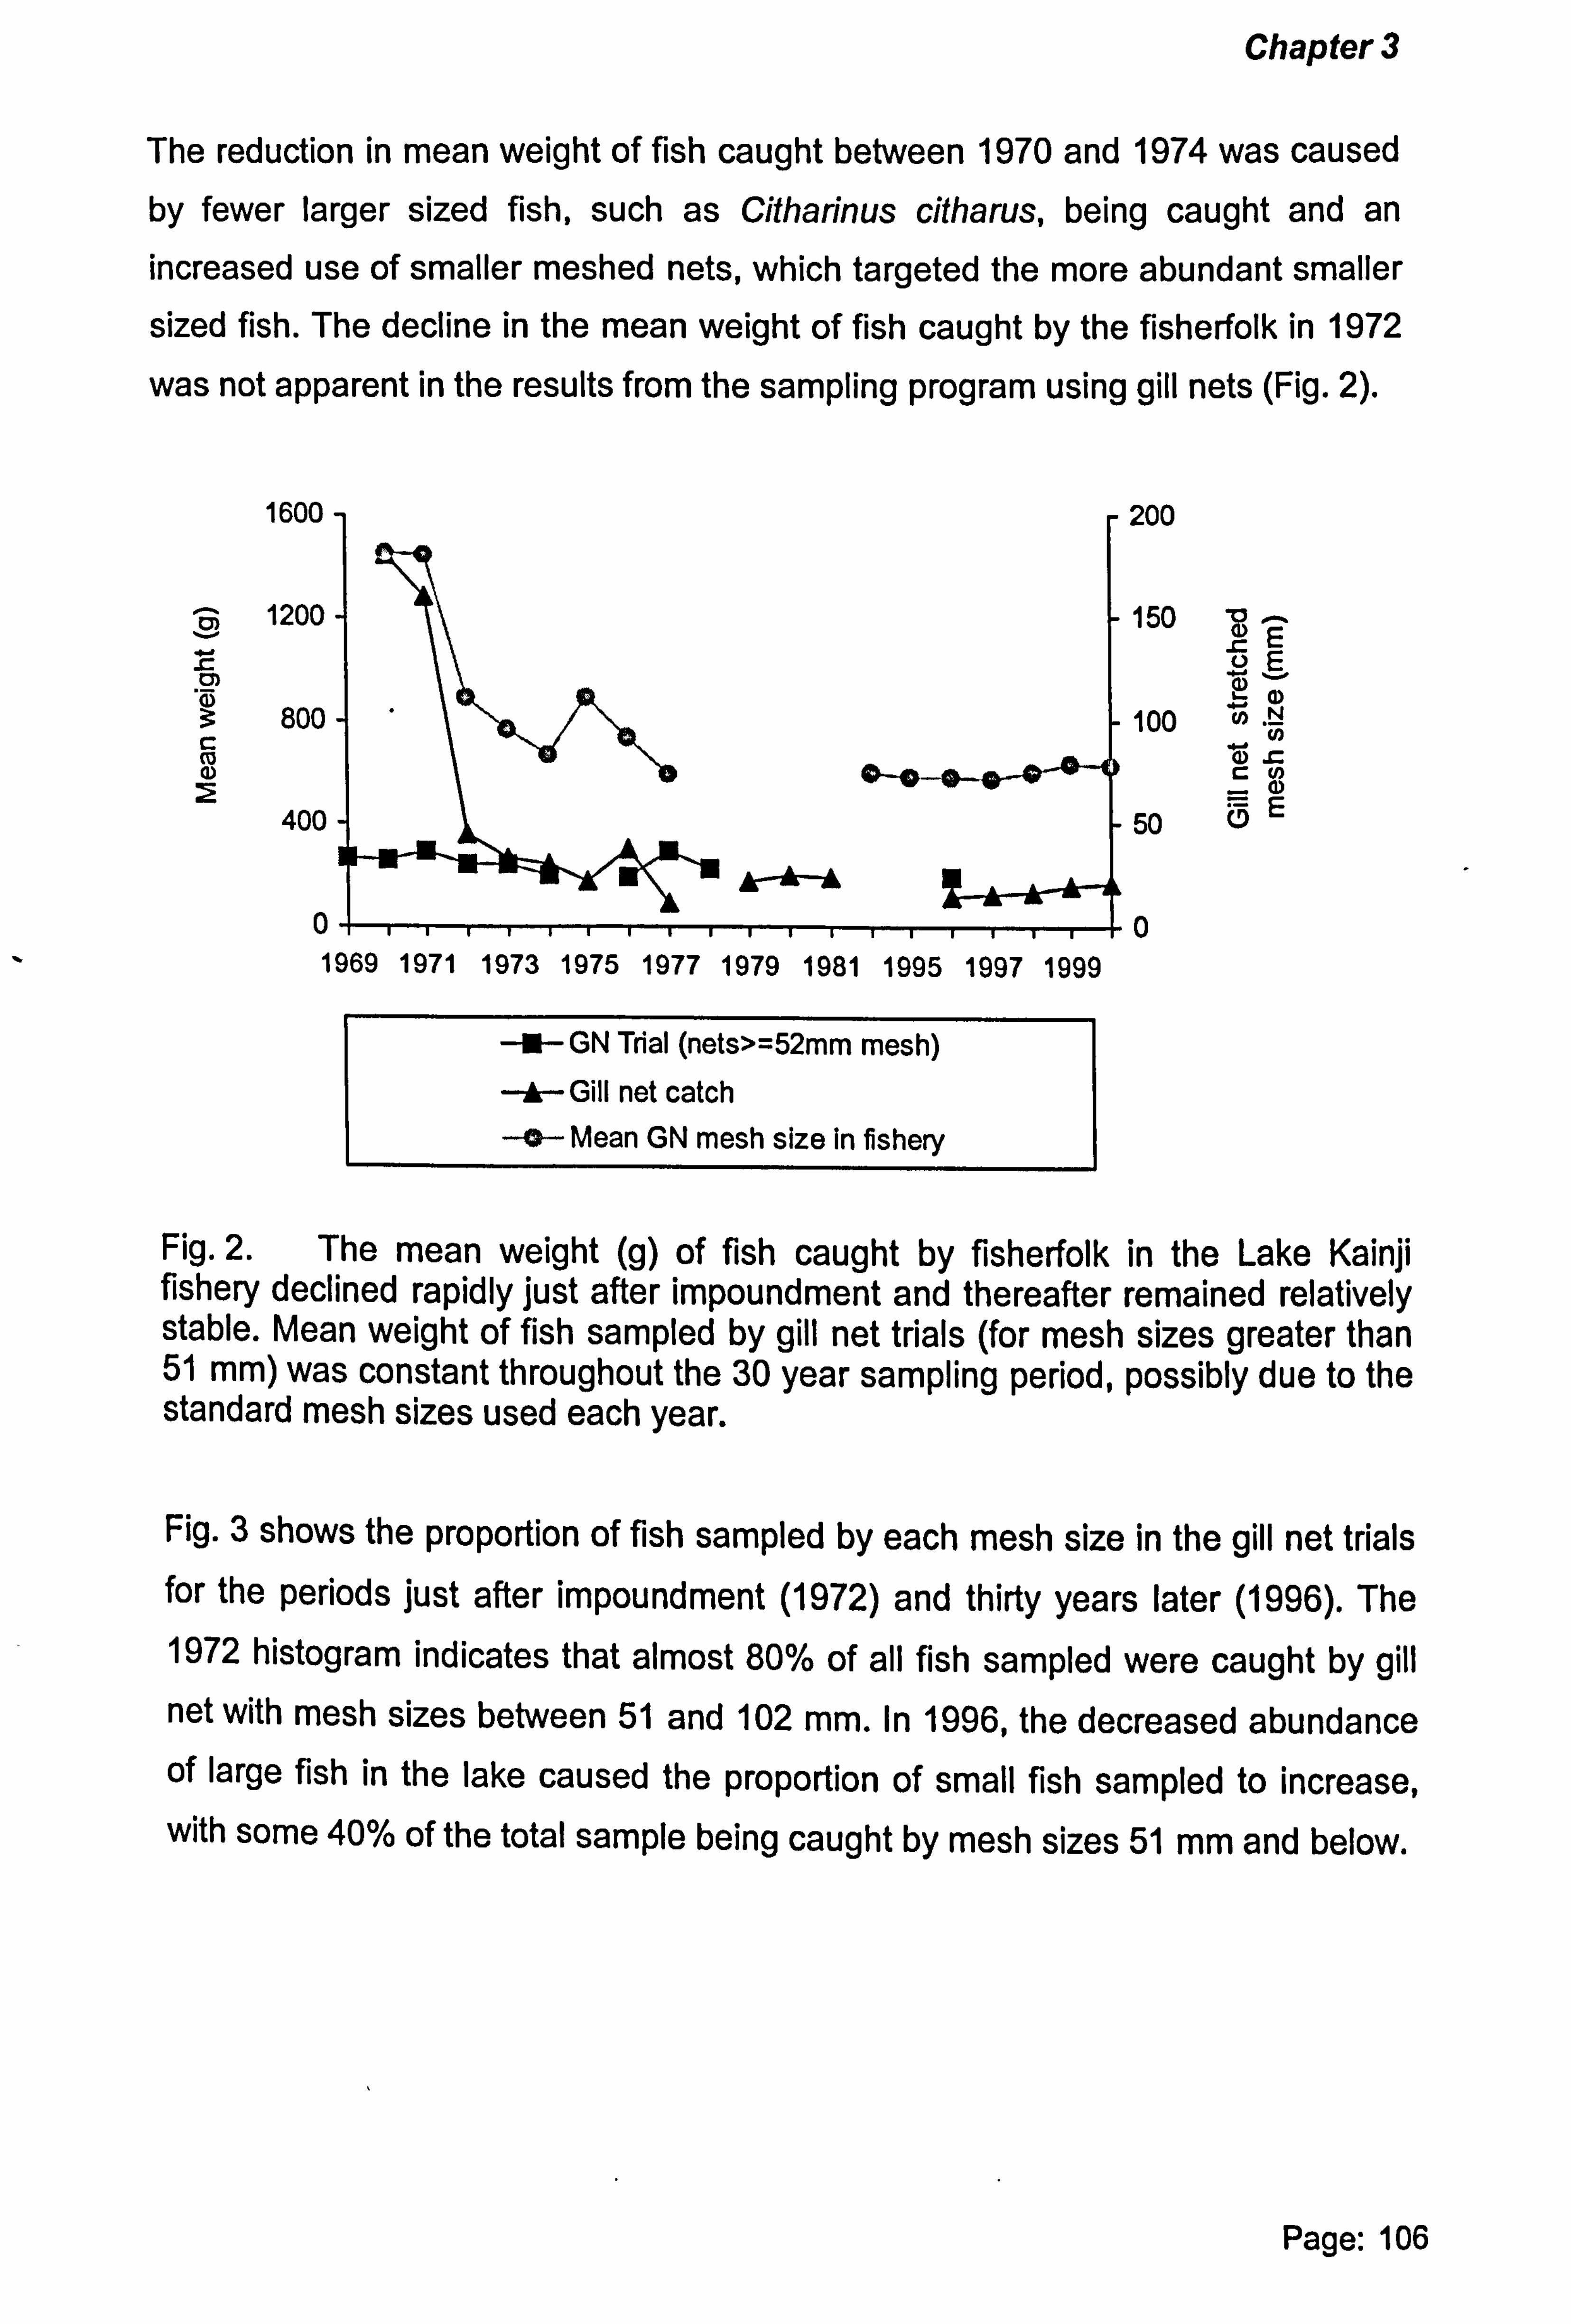
Chapter 3
The reduction in mean weight of fish caught between 1970 and 1974 was caused by fewer larger sized fish, such as Citharinus citharus, being caught and an increased use of smaller meshed nets, which targeted the more abundant smaller
sized fish. The decline in the mean weight of fish caught by the fisherfolk in 1972
was not apparent in the results from the sampling program using gill nets (Fig. 2).
1600
1200
rn 3 800 C co (1) 2
400
0
--a- GN Trial (nets>=52mm mesh) A Gill net catch
-+s- Mean GN mesh size in fishery
200
150 E
100 NN
C V)
50 E
0
Fig. 2. The mean weight (g) of fish caught by fisherfolk in the Lake Kainji fishery declined rapidly just after impoundment and thereafter remained relatively stable. Mean weight of fish sampled by gill net trials (for mesh sizes greater than 51 mm) was constant throughout the 30 year sampling period, possibly due to the standard mesh sizes used each year.
Fig. 3 shows the proportion of fish sampled by each mesh size in the gill net trials for the periods just after impoundment (1972) and thirty years later (1996). The 1972 histogram indicates that almost 80% of all fish sampled were caught by gill net with mesh sizes between 51 and 102 mm. In 1996, the decreased abundance of large fish in the lake caused the proportion of small fish sampled to increase, with some 40% of the total sample being caught by mesh sizes 51 mm and below.
Page: 106
1969 1971 1973 1975 1977 1979 1981 1995 1997 1999
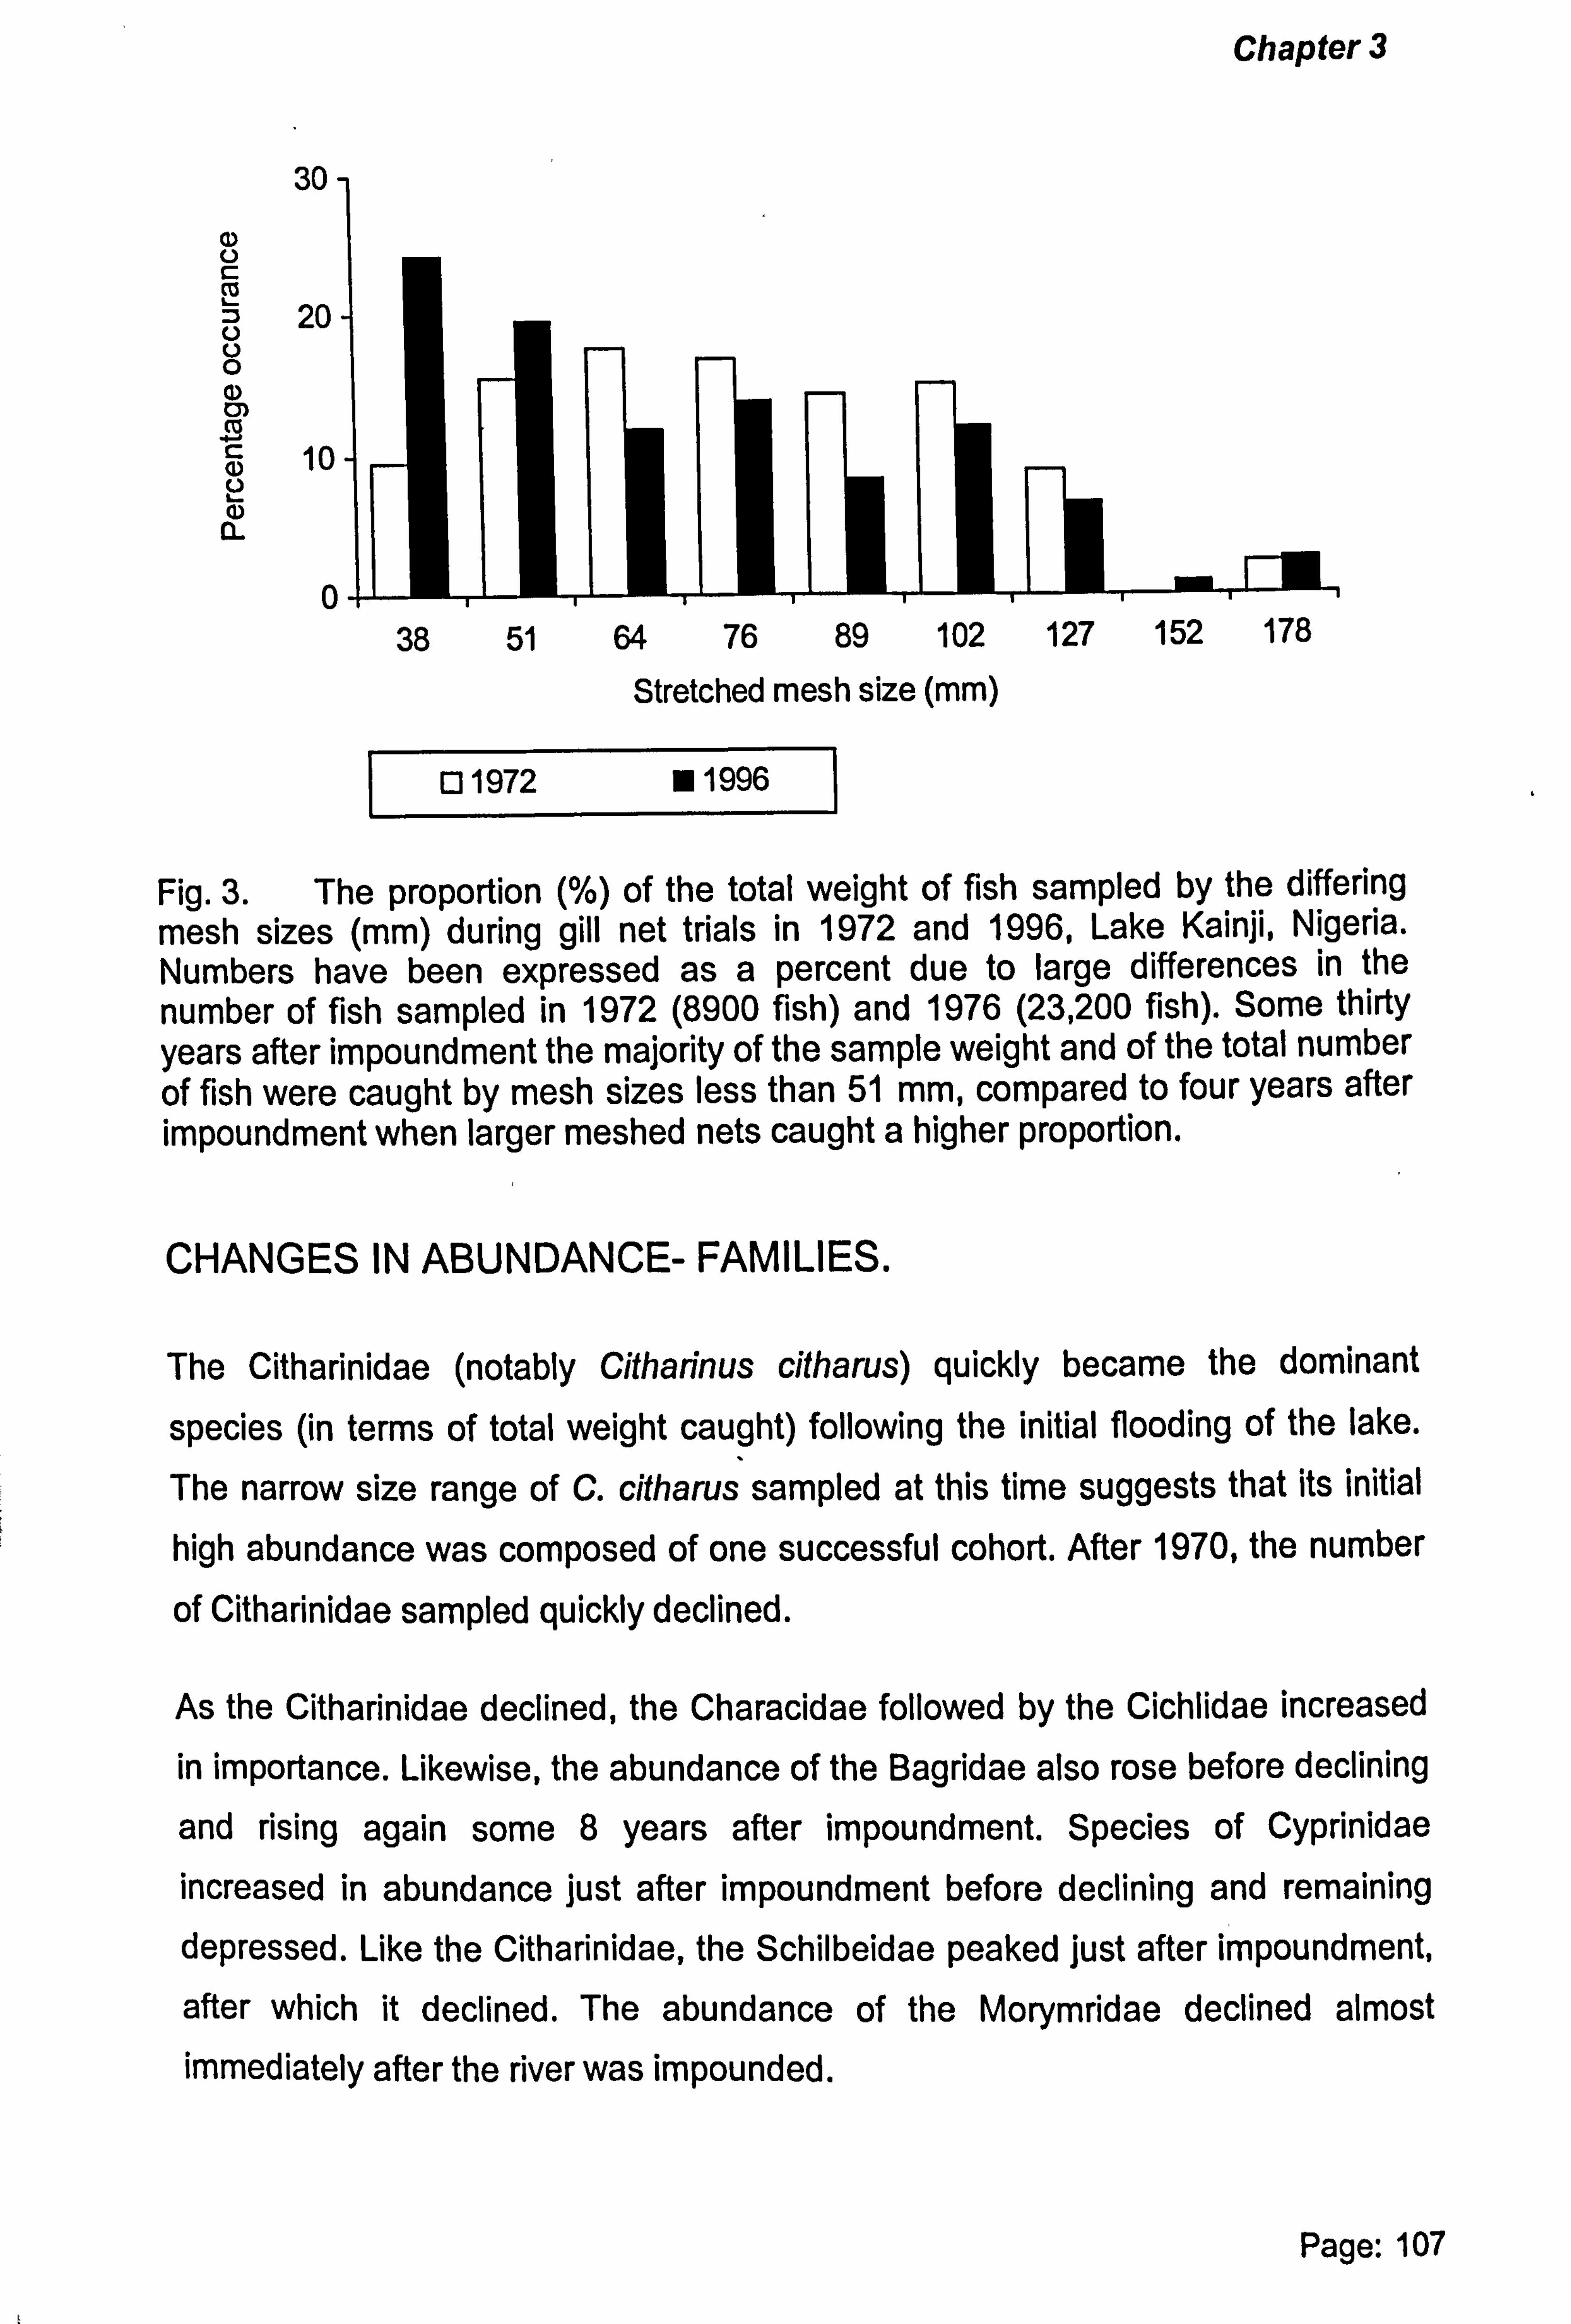
Chapter 3
30
U
20 O N
cß 4) 10 U U
CL
0
Stretched mesh size (mm)
Q 1972 1996
Fig. 3. The proportion (%) of the total weight of fish sampled by the differing mesh sizes (mm) during gill net trials in 1972 and 1996, Lake Kainji, Nigeria. Numbers have been expressed as a percent due to large differences in the number of fish sampled in 1972 (8900 fish) and 1976 (23,200 fish). Some thirty years after impoundment the majority of the sample weight and of the total number of fish were caught by mesh sizes less than 51 mm, compared to four years after impoundment when larger meshed nets caught a higher proportion.
CHANGES IN ABUNDANCE- FAMILIES.
The Citharinidae (notably Citharinus citharus) quickly became the dominant
species (in terms of total weight caught) following the initial flooding of the lake.
The narrow size range of C. citharus sampled at this time suggests that its initial
high abundance was composed of one successful cohort. After 1970, the number
of Citharinidae sampled quickly declined.
As the Citharinidae declined, the Characidae followed by the Cichlidae increased
in importance. Likewise, the abundance of the Bagridae also rose before declining
and rising again some 8 years after impoundment. Species of Cyprinidae
increased in abundance just after impoundment before declining and remaining depressed. Like the Citharinidae, the Schilbeidae peaked just after impoundment,
after which it declined. The abundance of the Morymridae declined almost immediately after the river was impounded.
Page: 107
38 51 64 76 89 102 127 152 178
Chapter 3
The abundance of the Claridae and Clupeidae could not be assessed as they
were difficult to sample using the type of the net construction and setting used during the gill net trials.
CHANGES IN ABUNDANCE- SPECIES.
The changing abundance and mean weight of fish from impoundment to some
30 years later is analysed for each of the main commercial species:
Citharinus citharus
Citharinus citharus increased in abundance immediately after impoundment due to
a high recruitment that coincided with the initial rapid flooding of the lake basin.
Flooded vegetation would have provided both abundant food source and shelter for the fingerlings at this time. Natural mortality was possibly further reduced by
the low abundance of predatory species indicated by the gill net trial data. These
conditions favoured high growth and survival rates of C. citharus.
The CpUE of C. citharus peaked one year after impoundment to more than 1.0 kg 100m2 net 1 night fishing'' (Fig. 4). At this time, C. citharus accounted for
around 30% of the total weight of fish sampled by the gill net trials. The contribution of C. citharus then declined to 8% of the total sample weight just
four years after impoundment.
The reduction in the abundance of C. citharus was possibly due to the heavy fishing pressure by the fisherfolk who mainly targeted the species using large
meshed gill nets. Interestingly, the CpUE of the commercial fishery only peaked in 1971 (two years later than the peak indicated by the gill net trial data) (Fig. 5). The delay 'was possibly caused by the time taken for the fishing effort to become
established on the newly formed lake. However, similar to the gill net trials, C. citharus was the main species caught after impoundment by the commercial fishery when the species comprised of 90% of the total lake yield in 1969.
Page: 108

Chapter 3
Following the peak CpUE in 1969, the average catch of C. citharus made by gill
net trials reduced by approximately 40% each year until 1974. The slight rise in
CpUE observed during 1977 might have been caused by the establishment of
macrophytic vegetation on the lake margins or to the high flood in 1976, which
prompted a large spawning of the lake species.
Similar to the levels of CpUE, the mean weight of C. citharus sampled by the gill
net trials declined rapidly just after impoundment (Fig. 4). Individual fish weight fell
from 1715 g in 1971 to 344 g in 1972. The fact that C. citharus was an important
target species is highlighted by the overall mesh size distribution which declined at the same rate as the mean weight of C. citharus during this time.
1.5
aý 1.0 04 E
rn 0.5 w CL U
0.0 1969 1970 1971 1972 1973 1974 1976 1977 V996
Sample size: 1357 -,! -CpUE -X-Mean size (g)
2000
rn
rn 1000
0
Fig. 4. The CpUE (kg 100m2 net'' night fishing') of Citharinus citharus peaked in 1971 just after lake impoundment, mean weight (g) has declined since 1969. A further peak was noted in 1977, possibly due to high flood at this time. Fish sampled during gill net trial fishing between 1969 and 1996, Lake Kainji, Nigeria. Sample size 1357 nets.
Page: 109

Chapter 3
c 80 0
60 c
40 cm m
20
CL 0
Sample size: 1357 x- GN trial sample "" "o ." Commercial fishery
Fig. 5. The percentage contribution of Citharinus citharus in the gill net trial catch and the commercial fishery between 1969 and 1996, Lake Kainji, Nigeria. C. citharus had a high composition in commercial catches just after impoundment due to fisherfolk targeting the species, as catching methods and targeted species diversified so the occurrence of C. citharus declined. Sample size: 1357 nets.
Cichlidae
Three main species of Cichlidae exist in Lake Kainji. Of these, the highest yielding in 1998 was Sarotherodon galilaeus. This species contributed 54% of the total
weight of Cichlidae caught by the small-scale commercial fishery at this time.
The Cichlidae only dominated the catch sampled by the gill net trials for a brief
period, some 6 years after impoundment, before declining (Fig. 6). S. galilaeus
only became established some five years after impoundment when the species
contributed some 0.26 kg 1 00m2 net" night fishing'' in 1974 and accounted for
3% of the totals weight of fish sampled by the gill net trial. In 1977, the proportion of S. galilaeus increased to 15% by weight of the total sample. The CpUE of S. galilaeus has since declined to 0.003 kg 1 00m2 net71 night fishing'' in 1996.
The exclusion of shore fleets prior to 1972 and the fact that the species is not readily captured by gill net affects the accuracy of the results.
Page: 110
1969 1970 1971 1972 1973 1974 1975 1976 1977 1996

Chapter 3
0.5 N^
E
CD c: C rN
Y 4- 0.3 w °' a U Cc
0.0
--A- Cpl -x- Nban fish weight (g)
5m
rn L rn
L N
4- C co a)
0
Fig. 6. The CpUE (kg 100m2 net" night fishing") of Sarotherodon galilaeus increased six years after impoundment and then declined. The mean fish weight (g) of S. galilaeus reduced five years after lake flooding, this corresponds to the increased use of smaller meshed gill nets by the fisherfolk. Samples taken from experimental fishing with multi- meshed gill nets, Lake Kainji, Nigeria. Sample size: 700 nets.
Mochokidae The Mochokidae is one of the most diverse families in Lake Kainji, comprising of
approximately 13 species. The most successful of these is Hemisynodontis
membranaceus that feeds on the zooplankton and has thrived following the
creation of open water conditions within the lake. The species of Mochokidae that declined following lake creation were the insectivores and detrivores such as Synodontis courtetti Pellegrin, 1906, Synodontis eupterus Boulenger, 1901, Synodontis filamentosus Boulenger, 1901, Synodontis gambiensis Günther, 1864, Synodontis vermiculatus Daget, 1954 and Synodontis violaceus Pellegrin, 1919.
Like C. citharus, the abundance of Synodontis sp. peaked in 1969. At this time the Mochokidae family contributed 10% of the total weight of fish sampled by the gill net trial catch. The mean weight of Synodontis sp sampled peaked in 1971 after which it rapidly declined (Fig. 7).
Page: 111
2
1969 1970 1971 1972 1973 1974 1976 1977 1996

Chapter 3
0.5 CI)
r aý N
E 0.3 0 rn
W D CL
0.0 1969 1970 1971 1972 1973 1974 1976 1977 1996
x-CpUE "- "o -- Mean fish weight (g)
2000
.. rn
LM 1000 *0 C
G)
0
Fig. 7. The CpUE (kg 100m2 net's night fishing') of Synodontis sp. declined four years after lake flooding. The mean weight (g) of Synodontis sp. peaked in 1971 before declining. Samples taken from experimental fishing with multi-meshed gill nets, Lake Kainji, Nigeria. Sample size: 70 nets.
Centropomidae
Lates niloticus is the largest predator and the only species within the family
Centropomidae existing in Lake Kainji. The abundance of L. niloticus peaked just
after impoundment in 1969 at 0.42 kg 1 00m2 net 1 night fishing's when the species
contributed 13% of the total weight of fish sampled by the gill net trial (Fig. 8).
By 1996 the CpUE of L. niloticus had reduced to a level some 14 times lower than that achieved in 1969. The mean weight of the species sampled by the gill net trials rose from an estimated 220 g in 1969 to 420 g in 1970. In 1996 the mean size of L. niloticus sampled was three times lower at 132 g.
Page: 112
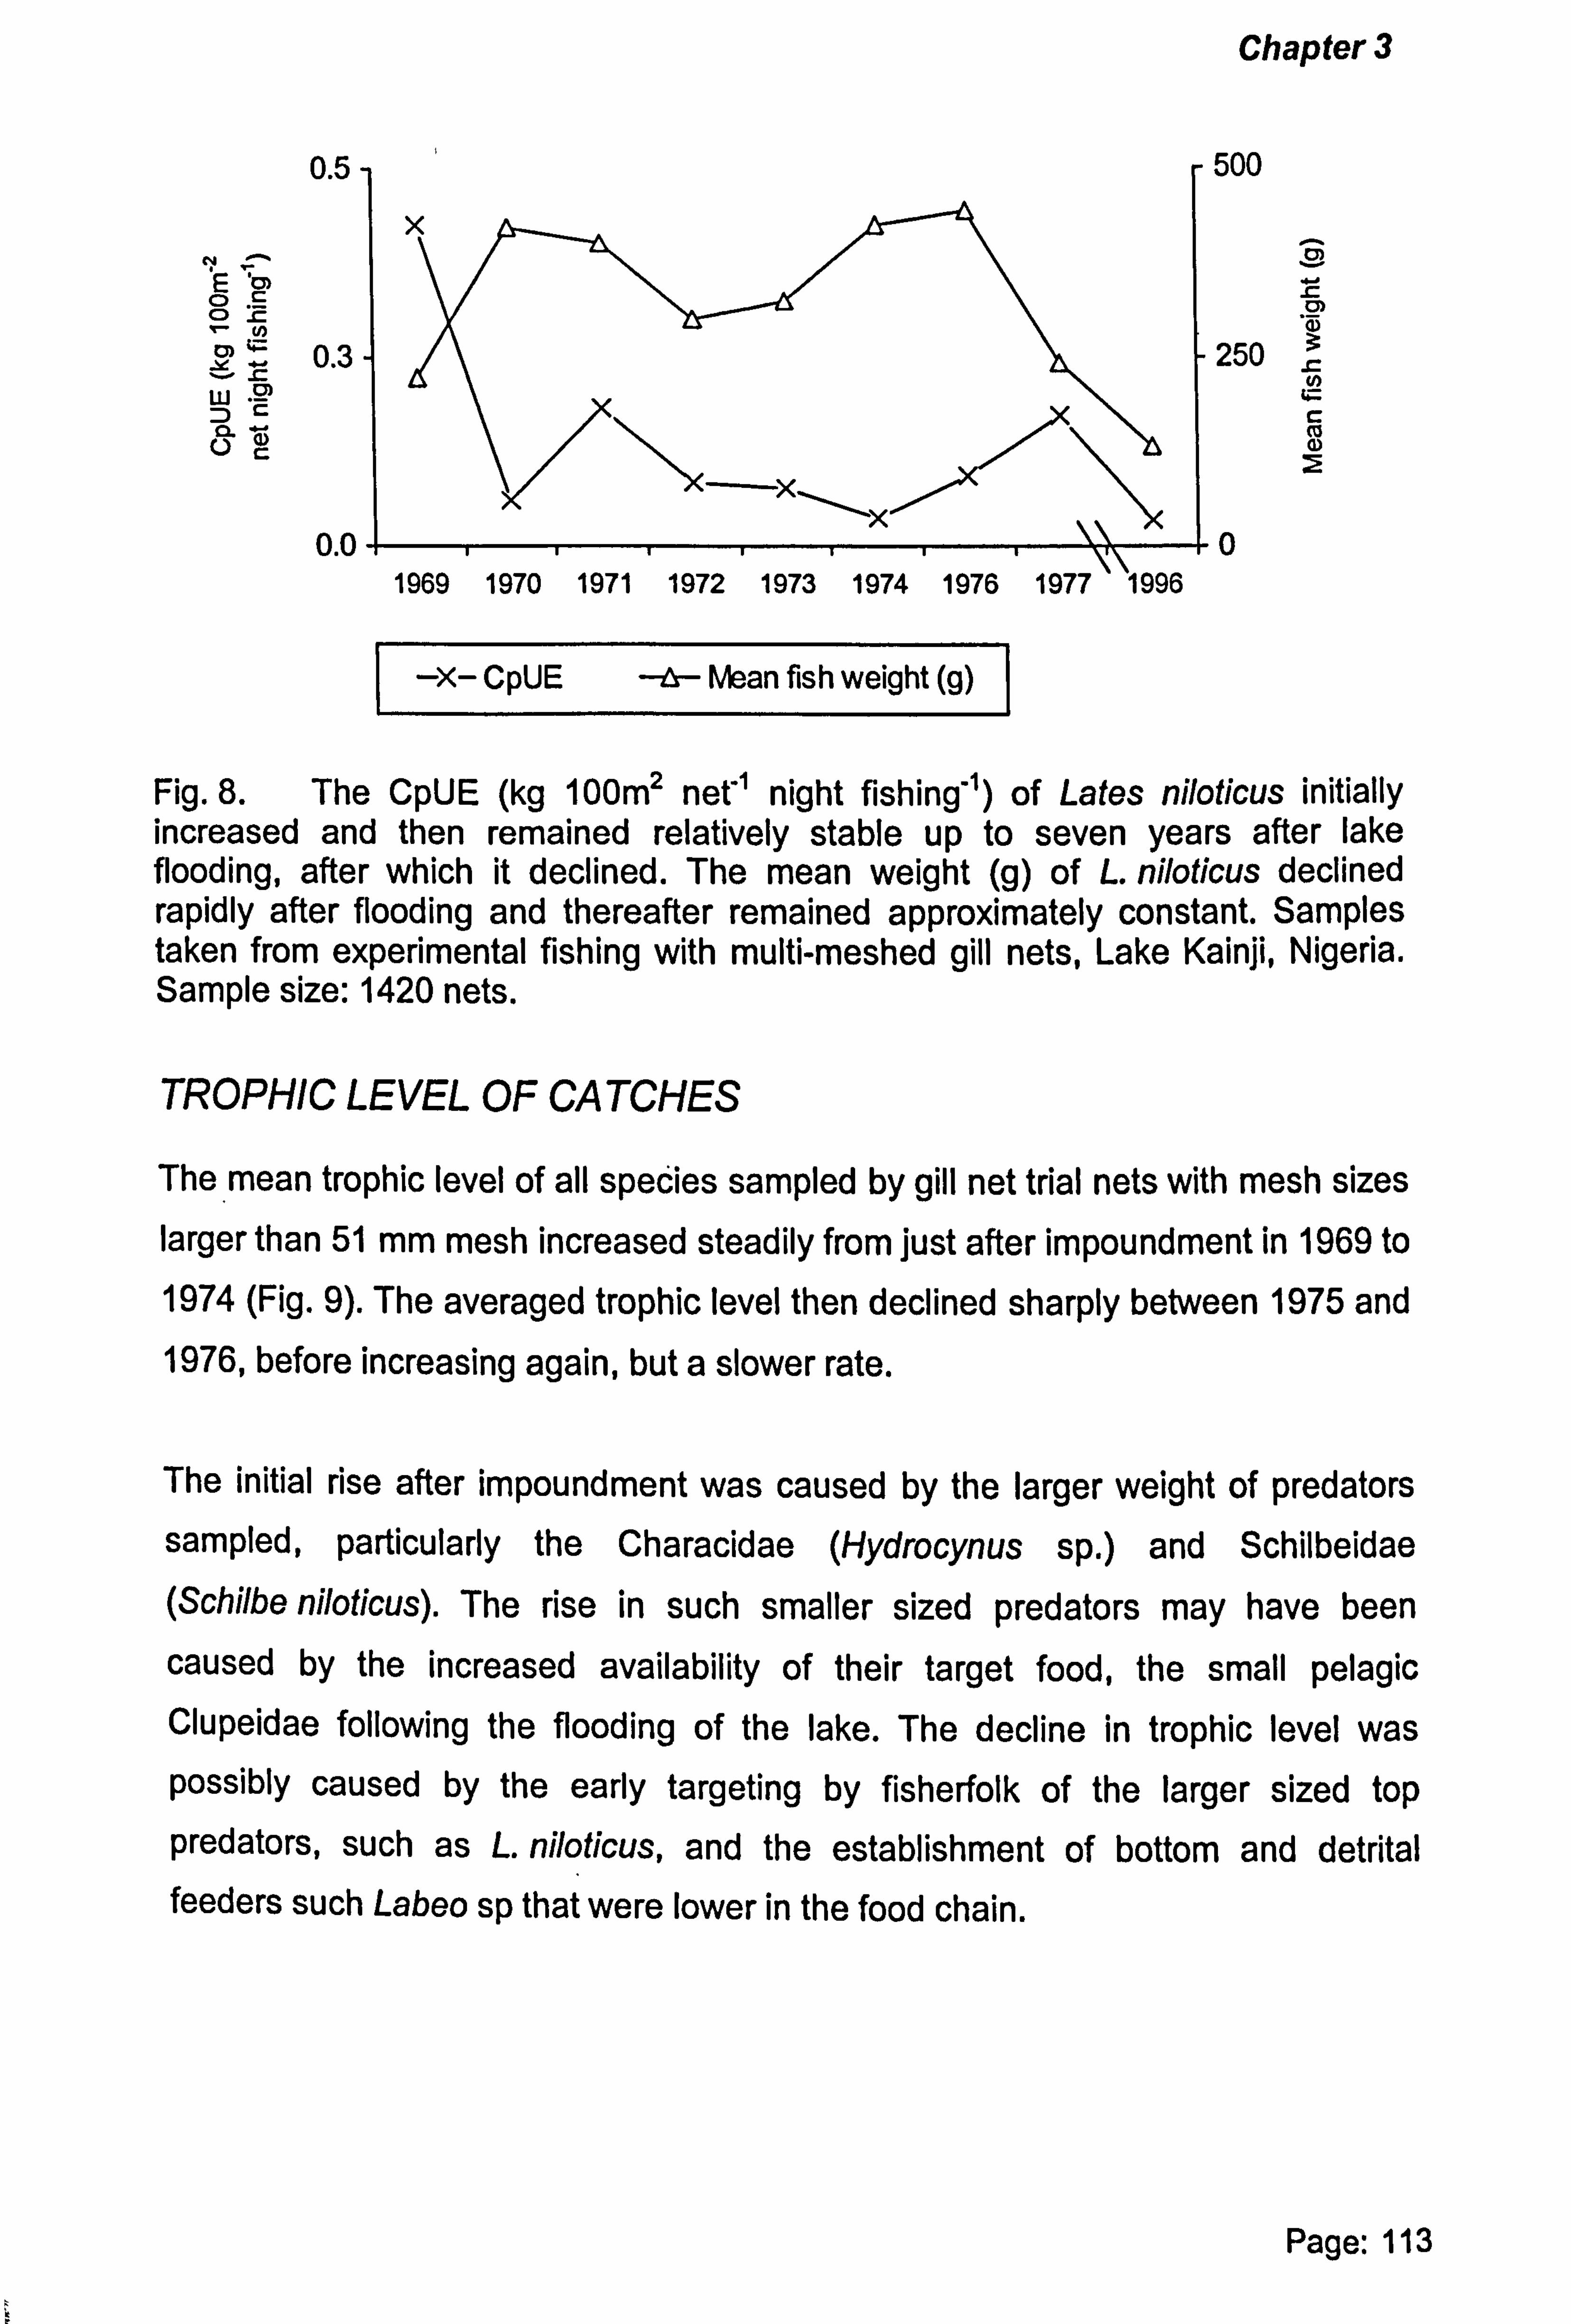
Chapter 3
0.5
N
Oc OL
y
0.3 W °' 0.
0.0 1969 1970 1971 1972 1973 1974 1976 1977 '1996
x- CpUE -a- Mean fish weight (g)
500
cm
s rn
250
0
Fig. 8. The CpUE (kg 100m2 net's night fishing-) of Lates niloticus initially increased and then remained relatively stable up to seven years after lake flooding, after which it declined. The mean weight (g) of L. niloticus declined rapidly after flooding and thereafter remained approximately constant. Samples taken from experimental fishing with multi-meshed gill nets, Lake Kainji, Nigeria. Sample size: 1420 nets.
TROPHIC LEVEL OF CATCHES
The mean trophic level of all species sampled by gill net trial nets with mesh sizes larger than 51 mm mesh increased steadily from just after impoundment in 1969 to 1974 (Fig. 9). The averaged trophic level then declined sharply between 1975 and 1976, before increasing again, but a slower rate.
The initial rise after impoundment was caused by the larger weight of predators sampled, particularly the Characidae (Hydrocynus sp. ) and Schilbeidae (Schilbe niloticus). The rise in such smaller sized predators may have been
caused by the increased availability of their target food, the small pelagic Clupeidae following the flooding of the lake. The decline in trophic level was possibly caused by the early targeting by fisherfolk of the larger sized top predators, such as L. niloticus, and the establishment of bottom and detrital feeders such Labeo sp that were lower in the food chain.
Page: 113

Chapter 3
It is likely that as fisherfolk switched to smaller meshed fishing gears. They no
longer targeted the larger sized predator species and this may have caused their
initial rise in abundance. The rise in trophic level is less dramatic if the declining
biomass of C. citharus with a low trophic level is ignored (Fig. 9).
Lelek (1972) also noticed a rise in the trophic levels of species and records this for
other lakes.
4
G) > aý J v3 L 0. 2 F-
2
x- All species ---- Citharinidae removed
Fig. 9. The mean trophic level (TL) of the fish sampled in Lake Kainji, Nigeria showed a gradual increase of trophic level to 1974 possibly due to the replacement of the herbivourous Citharidae with species higher in the food chain. Overall trophic level was calculated by assigning values for the trophic level of individual species (taken from Froese & Pauly, 2003) which were then raised to the total sample of fish caught using data from experimental sampling with multi- meshed gill nets. Vertical axis does not start at zero.
Page: 114
1969 1970 1971 1972 1973 1974 1976 1977 1978 1996
Chapter 3
DISCUSSION Sampling using fleets of multi-meshed gill net trials enabled the collection of a time
series of fisheries data that included individual fish length and weight
measurements. A shortcoming of the method, however, was some fish species
and fish sizes are more susceptible to capture by gill nets than others. Species
that were difficult to sample included those from the Clariidae and Clupeidae.
The sampling bias suggests that there is a need to undertake complementary
sampling using other methods alongside the collection of fisheries data using gill
nets.
The comparison of abundance between species, using only gill net trial sampling, is therefore problematic. On the other hand, comparison of long-term catch rates (CpUE) of those species susceptible to sampling can indicate the species
changing abundance over time. The extent by which individual species are
successful in adapting from a riverine to the still water lake environment can then
be assessed.
Lake Kainji has a long time series of gill net trial records. This is particularly the
case for the period just after flooding from 1968 to 1982 (see Turner, 1971;
Lelek, 1972; Lewis, 1974a; Ita, 1975; Blake, 1977). For the analysis, I have used the raw data from the time-series of gill net sampling to determine the changing
abundance of the main fish species during the transition from riverine to lacustrine
environment.
The overall CpUE of all the meshed nets used in the gill net trial sampling peaked in 1970, one year after the initial flooding of the lake. At this time, the main fishing
gear used was large meshed gill nets to target the Characoid, C. citharus (Lelek, 1972). The high catch rates caused fisherfolk from outside the lake area to
commence fishing on the lake (du Feu, 2003).
Page: 115
Chapter 3
Following the brief and sudden rise in CpUE the overall catches sampled by the
gill net trials quickly declined. The largest fall occurred between 1969 and 1970
and was caused mainly by a decrease in the abundance of large C. citharus., The
decline of this species may have been caused by fisherfolk concentrating their
fishing effort on large sized and valuable C. citharus, before targeting smaller
sized and perhaps less valuable species.
To counteract the decline in larger sized fish the fisherfolk diversified their fishing
methods away from a gill net based fishery. Gears such as drift nets, beach
seines, cast nets, longlines and fishing traps became important (du Feu, 2003).
A larger range of mesh sizes were also used, particularly those of smaller size. This caused a further slight decline in CpUE, as well as, a reduction in the mean
weight of fish caught. The largest decline in mean fish size was recorded for
C. citharus (a reduction from around 1700 g in 1971 to 340 g in 1972).
An initial rise and then decline in CpUE was also noted in Lake Lagdo, Cameroon
(van der Knapp, 1994). The peak of CpUE for Lake Lagdo (20 kg" net71 night fishing') was far higher than Lake Kainji (3.5 kg's net-' night fishing') and may have been caused by the more abundant cichlids in Lake Lagdo at this time.
Lewis (1974a) suggested that the change from riverine to lacustrine environment
would affect those species most reliant on the conditions and food source provided by rivers and favour species less selective in their choice of environment such as
swamp dwellers.
Such a species is C. citharus, a herbivorous/ detritus feeder, that has thrived both in the river and lake environments. Banks et a/. (1965) reported that C. citharus accounted for the highest number of fish caught in the River Niger prior to creation of the lake, particularly in the upper basin characterised by floodplains colonised with aquatic vegetation. Bakare (1970). stated that the species was particularly abundant during the riverine floods when the species formed 75% by weight of fisherfolk's catches.
Page: 116
Chapter 3
Banks et al. (1965) suggested that the spawning of C. citharus was triggered by
the distinct periods of floods in the River Niger. Turner (1971) and Petr (1975)
proposed that the rise in CpUE noted during 1969 was due to an increased level of
spawning of C. citharus in 1968 caused by the sudden flood and rise in water
level. The subsequent survival rate of the fingerlings was also perhaps high due to
the newly created flooded areas that offered an abundant food source and safe
refuge from fishing and predation pressures.
A similar situation was noted in Lake Kariba, where another Characoid,
Distichodus sp., became a dominant commercial species after impoundment
(Karenge & Kolding, 1995). Similar to C. citharus, residual plant material and blooms in algae from the initial lake flooding probably caused the increase in
biomass. Ali (1984) further noted that C. citharus was abundant after the
impoundment of Lake Nubia. However, elsewhere C. citharus appears to be less
prominent: In Lakes Volta and Lagdo there was no large increase in abundance
after impoundment as had occurred in Lake Kainji (Lewis, 1974a;
van der Knapp, 1994). This may have been due to the slower rate of filling that
failed to trigger heightened spawning activity.
Ita (1978) noted that large floods do not occur every year and suggested that
successful spawning only takes place approximately every three years following
times of large floods.
It appears therefore that the high abundance of C. citharus after lake formation
was due to a high spawning following lake flooding. It is most likely therefore that the absence of a similar high spawning during subsequent years and the high fishing pressure on the larger fish caused the abundance of the species to quickly decline.
Unlike C. citharus, that initially had a high abundance and then declined, the Cichlids appear to have had an initial low abundance, but have since increased as the lake has stabilised. The increase appears to have been gradual. This is supported by previous authors who have been unable to identify a sudden rise in Cichlid biomass (Blake, 1977; Ita, 1978).
Page: 117
Chapter 3
It appears that the changing abundance of cichlids within other lakes, such as
Itezhi-tezhi (Cowx & Kapasa, 1995) and Lake Volta (Bazigos, 1970; Petr, 1974),
have followed the same pattern and also increased as the lake has become
stabilised. It is possible that this gradual increase was aided by the gradual
establishment of the littoral zone that contained an abundance of algal and plant
material food source.
The Cichlidae were the dominant fish family recorded in Lagdo Reservoir,
Cameroon (Postma & van der Knapp, 1999); a lake that has a similar species mix
as Lake Kainji. Cichlidae were also the dominant family in Nyumba ya Mungu
Reservoir in Tanzania (Bailey et al., 1978) and the natural lakes of Lake Kamburu,
Kenya (Dadzie, 1980) and West Benin (Adite & van Thielen, 1995). The family
have also become important in reservoirs in Asia and South America where they
have been introduced (De Silva, 1988; Petrere, 1996).
Banks et al. (1965) predicted that the Cichlidae would, likewise, eventually become the dominant species in Lake Kainji. It would appear that this has failed to
be the case for Lake Kainji. The reason why cichlids in Lake Kainji may not have
been as successful as elsewhere may be due to the large annual drawdown of
water that disturbs the fish as they spawn on the substrate. S. galilaeus, a mouth brooder, is less dependant on a suitable substrate (Lelek, 1975) and this is
perhaps why it has become the dominant cichlid in the lake. Petr (1969) also found S. galilaeus to be the most important cichlid species in Lake Volta; a lake with three to four meter drawdown.
Turner (1971) suggested that the high turbidity in Lake Kainji, which occurs during the white flood, is also not favourable for cichlids. Lewis (1974b) further noted that S. galilaeus is the main prey species of Hydrocynus brevis (G(Jnther, 1864) and the increase in the biomass of this predator may have been a contributory reason why the cichlid population did not increase early during the lake development.
Page: 118
Chapter 3
It is, however, also possible that Cichlids were more abundant than suggested by
the catch of gill net trials. It was suggested by Willoughby (1974) that their slow
swimming and wary nature made the capture by the nets difficult. The theory is
supported by Otobo (1976) who recorded high catches of cichlids when sampling
with beach seines and by Ita (1981) who sampled with rotenone between 1975
and 1976 and found that the Cichlidae dominated the catch and was twice the
percentage by weight of the gill net trial. Otobo suggested that the lack of samples
prior to 1976 might have been due to the exclusion of the gill net trials within the
lake's littoral zone. Blake (1977) and Ita (1978) also suggested that the omission
may have resulted in the under sampling of the shore dwelling Cichlidae.
It appears that creation of the lake favoured the planktivorous Synodontis that feeds mainly on zooplankton from the family Cyclopidae (Clarke, 1977) and which
was possibly able to breed in inflowing streams/rivers (Willoughby, 1974).
Those species of Mochokidae that declined were the insectivores and detrital
feeders inhabiting the shallow or inshore waters. Van der Knapp (1974) reported
similar declines in Mochokidae for Lake Kossou.
Lelek (1975) noted that before impoundment the predators Hydrocynus sp. and L. niloticus accounted for up to 17% by weight of all fish sampled. Ita (1978) and Balogun, (1986) suggested that the abundance of L. niloticus followed the same trends as C. citharus; peaking in 1969 after which it declined. Lelek & EI-Zarka (1973) noted that two years after impoundment abundance increased to 31% by
weight and L. niloticus became the third most abundant important species. It is
possible that the juveniles were able to feed extensively on the abundant fry after impoundment.
Species which have declined in abundance as soon as the lake filled include the Mormyridae which also declined in Lake Volta (White, 1969) and Lake Kamburu (Dadzie, 1980).
Page: 119
Chapter 3
The continuing decline of CpUE and trophic level of the main species in the fishery
is of concern for the future well-being of the Lake Kainji fisherfolk and reliant
communities. One favourable aspect is that many of the Lake Kainji species, such
as C. citharus and L. niloticus have a high fecundity (Imevbore, 1970; Balogun
1988) and the current absence of large meshed gears to target them
(du Feu, 2003) may mean that they are able to breed and supply the small-sized fingerlings that are necessary to support the small meshed fishery.
REFERENCES Adite, A. and van Thielen, R. (1995). Ecology and fish catch in natural lakes of Benin,
West Africa. Environmental Biology of Fishes. 43: 381-391.
All, M. T. (1984). Fish and fisheries of Lake Nubia, Sudan. Hyrobiologia, 110: 305-314.
Ali, A. B. and Lee. K. Y. (1995). Chenderoh Reservoir, Malaysia: a characteristic of a
small scale, multigear and multispecies commercial fishery in the tropics. Fisheries Research. 23: 267-281.
Anne, I., Lelek, A. and Tobias, W. (1994). Post-impoundment changes in water quality and fish stocks in two large West African reservoirs (Manantali and Selingu6, Mali). International Revue Gesamten Hydrobiology, 79, (1): 61-75.
Bailey. R. L., Churchfield, S., Petr, T. and Pimm, R. (1978). The ecology of the fishes in Nyumba ya Mungu reservoir, Tanzania. Biological Journal of the Linnean Society, 10: 109-137.
Bakare, 0. (1970). Bottom deposits as food of inland fresh water fish. In: Kainji Lake Studies, Vol. 1, Ecology. S. A. Visser ed. Published by NISSER, Ibadan: 65-85.
Balogun, J. K. (1983). Feasibility survey of commercial gill netting in Kainji Lake. Kainji Lake Research Institute Annual Report 1982: 85-90.
Page: 120
Chapter 3
Balogun, J. K. (1986). Gill net monitoring studies with emphasis on fish distribution in
Kainji Lake, Nigeria. Kainji Lake Research Institute Annual Report. 1985:
35-39.
Balogun, J. K. (1988). The bio-ecology of the Nile Perch Lates niloticus (Linne) in
Lake Kainji, Nigeria. PhD. Thesis. 284pp.
Balon, J. K. (1974). Fish production of a tropical ecosystem. Monogr. Biol.,
24: 249-573.
Banks, J. W., Holden, M. J. and McConnell, R. H. (1965). Fishery report. In: The First Report of the Kainji Biological Research Team. E. White ed. Liverpool: 21-42.
Bazigos, G. P. (1970). Yield indices 'in inland fisheries with special reference to Volta Lake. FAO Volta Lake Research and Development Project, Statistical Studies. FAO/SF/GHA/10/St. S. /3. FAO, Rome. 25pp.
Blake, B. F. (1977). Lake Kainji, Nigeria. A summary of the changes within the fish
population since impoundment of the Niger in 1968. Hydrobiologia. 53. (2): 131-137.
Clarke, N. V. (1977). Studies on the zooplankton of Lake Kainji, Nigeria. University of Reading. PhD. Thesis. 218pp.
Cowx, I. G. and Kapasa, C. K. (1995). Species changes in reservoir fisheries following impoundment: the case of Lake Itezhi-tezhi, Zambia. In: The Impact of Species Changes in African Lakes. (eds. T. J. Pitcher and J. B. Hart). Chapman and Hall, London. ISBN 0 412 55050 4: 321-332.
Dadzie, S. (1980). Recent changes in the fishery of a new tropical man-made lake, Lake Kamburu (Kenya). Journal of Fish Biology, 16: 361-367.
Page: 121

Chapter 3
Denyoh, F. M. K. (1964). Changes in fish population and gear selectivity in the Volta
Lake. In: Man-Made Lakes: The Accra Symposium. L. E. Obeng ed.:
206-210.
De Silva, S. S. (1988). Reservoirs of Sri Lanka and their fisheries. FAO Fisheries
Technical Paper. No. 298.128pp.
du Feu, T. A. (1993). Frame survey, Kainji Lake Nigeria. An internal report of the
Kainji Lake Fisheries Promotion Project. GTZ Eschbom, Germany. 27pp.
du Feu, T. A. (2003). The changing fishery of Lake Kainji, Nigeria from impoundment
to some 30 years after. PhD. Thesis submitted to the University of Hull, UK.
Chapter 6: 180-228.
du Feu, T. A. and Abiodun. J. A. (1999). Fisheries Statistics of Kainji Lake, Northern
Nigeria. Nov. 1994- Dec. 1998. Kainji Lake Fisheries Promotion Project
Technical Report Series. No. 13. ISBN 978 037 012 9. GTZ, Eschbom,
Germany. 128pp.
Froese, R. and Pauly, D. [eds]. (2003). FishBase. World Wide Web electronic
publication. www. fishbase. org. August 2003.
ICOLD. (1998). World register of dams 1998. ICOLD-CIGB, 151 Bd Haussmann,
Paris 75008, France.
lmevbore, A. M. A. (1970). Some preliminary observations on the sex-ratios and fecundity of the fish in the River Niger. In: Kainji Lake Studies, Vol. 1,
Ecology. S. A. Visser ed. Published by NISSER, Ibadan: 87-103.
Ita, E. O. (1975). A short historical review of experimental gill-net sampling
programme and data processing methods in Kainji Lake between 1969 and 1975. Unpublished report to the Kainji Lake Research Institute.
Page: 122
Chapter 3
Ita. E. O. (1978). Analysis of fish distribution in Kainji Lake, Nigeria. Hydrobiologia, 58,
(3): 233-244.
Ita. E. O. (1981). Standing crop of fish in the inshore waters of Lake Kainji.
Unpublished report to the Kainji Lake Research Institute.
Ita. E. O. (1998). The current status of fish stock and fisheries in Kainji Lake, 1996.
An internal report of the Kainji Lake Fisheries Promotion Project. GTZ
Eschbom, Germany. 45pp.
Karenge, L. and Kolding, J. (1995). Inshore fish population and species changes in
Lake Kariba, Zimbabwe. In: The Impact of Species Changes in African
Lakes. (eds. T. J. Pitcher and J. B. Hart). Chapman and Hall, London.
ISBN 0 412 55050 4: 245-275.
Kenmuir, D. H. S. (1984). Fish population changes in the Sanyati Basin, Lake Kariba,
Zimbabwe. South African Journal of Zoology., 19: 194-209.
Lelek, A. (1972). Fish populations of Kainji Lake: trends in their development and utilisation. FI: SF/NIR 24 Technical Report. 2.121 pp.
Lelek, A. (1975). Possible trends in the development of the fish fauna in Lake Kainji. In: The Ecology of Lake Kainji, the Transition from River to Lake. (eds. A. M. A. Imevbore and 0. S. Adegoke). Ile-Ife, Nigeria, University of Ife Press: 157-162.
Lelek, A. and EI-Zarka, S. (1973). Ecological comparison of fish fauna of the Niger River before and after the formation of Kainji Lake. Geophys. Monogr., 17: 655-660.
Lewis, D. S. C. (1974a). The effect of the formation of Lake Kainji (Nigeria) upon the indigenous fish population. Kainji Research Project, University of Ife, Nigeria. Hydrobiologia, 45,2-3: 281-301.
Page: 123
Chapter 3
Lewis, D. S. C. (1974b). The food and feeding habits of Hydrocynus forskahlii Cuvier
and H. brevis Günther in Lake Kainji, Nigeria. Journal of Fish Biology, 6:
349-363.
Motwani, M. P. & Kanwai, Y. (1970). Fishes and fisheries of the coffer dammed right
channel of the River Niger at Kainji. In: Kainji Lake Studies, Vol. 1, Ecology. S. A. Visser ed. Published by NISSER, Ibadan: 27-48.
Otobo, F. O. (1976). Evaluation of beach seine as an effective gear for harvesting
tilapia in Kainji Lake. Archive Hydrobiology. 78: 375-382.
Pet, J. S., Van Densen, W. L. T. and Vijverberg, J. (1999). Management options for the
exploitation of introduced tilapia and small indigenous cyprinids in Sri Lankan
reservoirs. In: Fish and Fisheries of Lakes and Reservoirs in Southeast Asia
and Africa. (eds. W. L. T. van Densen and M. J. Morris). Westbury Publishing,
Otley, UK. ISBN 1 84103 004 X: 159-185.
Petr, T. (1967). Fish population changes in Volta Lake in Ghana during its first
sixteen months. Hyrobiologia. 30: 193-220.
Petr, T. (1969). Fish population changes in the Volta Lake over the period January 1965-September 1966. In: Man-Made Lakes: The Accra Symposium. L. E. Obeng ed.: 220-234.
Petr. T. (1974). Distribution, abundance of food of commercial fish in the Black Volta and Volta man-made lake in Ghana during the filling period (1964-68). 11. Characidae. Hyrobiologia, 45: 303-337.
Petr, T. (1975). On some factors associated with the initial high fish catches in new African man-made lakes. Arch. Hyrobiologia. 75: 32-49.
Petrere, M. (1996). Fisheries in large tropical reservoirs in South America. Lakes and Reservoirs, Research and Management. 2: 111-133.
Page: 124

Chapter 3
Postma, D. J. and van der Knapp, M. (1999). Developments in the fishery of Lagdo Reservoir, Cameroon. In: Fish and Fisheries of Lakes and Reservoirs in
Southeast Asia and Africa. (eds. W. L. T. van Densen and M. J. Morris).
Westbury Publishing, Otley, UK. ISBN 1 84103 004 X: 311-325.
Turner, J. L. (1971). The fish population of the newly impounded Kainji Lake in
Nigeria. Journal of West African Science Association. 16. (1): 49-58.
UNEP. (2002). Global Environment Outlook 3, UNEP, Earthscan Publications Ltd,
London, ISBN: 1853 8384 54.416pp.
van der Knapp, M. (1994). Status of fish stocks and fisheries of thirteen medium sized African reservoirs. C1FA Technical Paper. No. 26. Rome, FAO. 107pp.
White, E. D. (1969). The place of biological research in the development of the
resources of man-made lakes. In: Man-Made Lakes: The Accra Symposium.
L. E. Obeng ed. A Publication of the Council for Scientific & Industrial Research for the Ghana Academy for Sciences: 37-49.
Willoughby, N. G. (1974). The ecology of the genus Synodontis (Pisces: Siluridae) in
Kainji Lake. PhD. Thesis. University of Southampton, UK. 288pp.
Page: 125
Chapter 4
Chapter 4
A previous version of this chapter has been accepted for publication in:
du Feu, T. (2003). Estimation of population parameters for the six commercial species in Lake Kainji, Nigeria using length frequency data sampled from artisanal fish catches. In: D. Pauly, T. Diouf, B. Samb, M. J. Vakily and M. L. D. Palomares (Editors) Fish Biodiversity: Local Studies as Basis for Global Inferences. ACP- EU Fisheries Research Report. ACP-EU Fisheries Research Initiative. Brussels.
Estimation of population parameters for the six
commercial species in Lake Kainji, Nigeria using length
frequency data sampled from artisanal fish catches.
ABSTRACT
Estimates of growth parameters are widely used for detailed assessment and modelling of fish species and fisheries. The length-weight relationship, age at length zero (to), growth coefficient (K), asymptotic fish length (L. ) and rates of natural (M) and total mortality (Z)
were estimated for the six main commercial species from the artisanal fishery of Lake Kainji, Nigeria. Length-weight relationships were calculated from individual fish length and weight records collected from sampling using fleets of multi-meshed gill nets. Large
numbers of fish lengths for length frequency analysis were obtained by sampling direct from the catch of fisherfolk. Large-sized fish were under-represented in the sample since fisherfolk mainly fished with gears that targeted small fish. The number of fish sampled was scaled up to the total yield of each species and gear type. Data were analysed using Fisat software®. For four of the commercial species the estimate of K was around 0.5 y', whilst Lao was approximately 50 cm. Lates niloticus had the lowest low value of K (0.25 yr) and the largest Loo (159 cm). Oreochromis niloticus had a K=0.25 Y" and L�=53 cm. Natural mortality was the lowest for L. niloticus (M=0.49 y 1), whilst fishing mortality was highest for Chrysichthys nigrodigitatus (F=4.3 y'1). Length-weight, growth parameter and mortality estimates generally agreed with previously published figures from Lake Kainji and elsewhere. The majority of fish caught of the main commercial species in the Lake Kainji fishery were from the 0+ cohort, at a size far below the optimal length at capture. This suggests growth overfishing of the six sampled species. The situation was most apparent for Citharinus citharus.
Key words: growth rates; Lake Kainji; length-weight relationship; mortality rates; population parameters; reservoir fishery.
Page: 126
Chapter 4
INTRODUCTION
The World Bank (1992) stated that most fish stocks are fully or over-exploited. This led them to recommend that fisheries research should be directed towards
increasing understanding to enable accurate management decisions. The
recommendation is particularly valid for many tropical reservoir fisheries.
An important aspect of such ̀ management orientated' research is the estimation of the maximum size and age of fish, length-weight relationships and population
parameters of the commercial fish species. These are essential, not only to gain
an understanding of the fish species, but also for use in analytical fisheries
models; particularly yield per recruit, dynamic pool models, and more recently, for
trophic modeling of ecosystems (Ecopath with Ecosim; see Pauly et al., 1993).
The accuracy of the estimates of population parameters can therefore affect the
validity of management decisions.
Within temperate fisheries, otoliths, scales and vertebrae display seasonal markings for both the summer and winter. These form daily/annual rings which can be used to indicate the age of the fish (Bagenal, 1974). The lack of defined
seasons in tropical fisheries means that often only daily growth rings can be identified and high powered microscopes are required to count these (Pauly, 1987). It is therefore often difficult and time consuming to age fish species from tropical fisheries using hard parts (Gulland & Rosenberg, 1992).
In the present study, the ageing by hard parts was further hampered by the lack of expertise of staff and the fact that fisherfolk were unwilling to allow the cutting and removal of hard parts from their fish. These are likely to be common problems within tropical fisheries of developing countries.
Page: 127
Chapter 4
A method more suited to tropical fish species has been the conversion of age-
based models into length-based models (Sparre et al., 1989). This involves the
collection of fish lengths from separate fish species. The resulting 'length-
frequency data' have the advantage that they are relatively quick and inexpensive
to collect and that they can also be used to give an overview of fishing patterns
(du Feu, 2003a). Analysis of length frequency data has also been made easier
through the FiSAT software' (Gayanilo & Pauly, 1997).
Despite the voluminous research that has been undertaken since the creation of Lake Kainji, little recent work has been directed at estimating the growth
parameters of its fish species. Length at age data for Oreochromis niloticus in pre- impounded river fishery was presented by Banks et al. (1965) and for the early lake fishery by Lelek (1972). Mean length at age estimates in the lake fishery were been made by ageing hard parts for Bagridae (using spines & vertebrae; Ajayi, 1972), Mochokidae (vertebrae; Willoughby, 1974) and Lates niloticus (scales; Balogun, 1988).
This chapter presents more recent estimates of population parameters for the six
main commercial species using length frequency data. The parameters estimated for each species include the asymptotic fish length (L. ), growth coefficient (K), age
at length zero (to) and the instantaneous rates of natural (M) and fishing (F)
mortalities. It is hoped that these estimates will add to those available for tropical
fisheries and so assist managers working elsewhere.
2 "Fish Stock Assessment Tools" initiated by Daniel Pauly from the ELEFAN software at ICLARM and developed further by F. Gayanilo through a collaborative effort with FAO.
Page: 128
Chapter 4
MATERIALS AND METHODS
Measurements for length frequency analysis were collected for the six main
commercial species of Lake Kainji (Table I). The species were identified from the
yield estimates derived by the 1995 to 1997 catch assessment survey (du Feu, 2003b). L. niloticus was included due to its high market price and large
contribution to the total catch value of the fishery.
Table I. The six main commercial fish species sampled for length frequency from September 1997 to December 1998 in the Lake Kainji fishery, Nigeria.
Species Author Citharinus citharus citharus (Geoffroy St. Hilaire, 1808-1809)
Sarotherodon galilaeus galilaeus (Linnaeus, 1758)
Oreochromis niloticus niloticus (Linnaeus, 1758)
Hemisynodontis membranaceus (Geoffroy St. Hilaire, 1808-1809)
Chrysichthys nigrodigitatus (Lacepede, 1803)
Lates niloticus (Linnaeus, 1758)
Two stage cluster sampling and pooling of data was used (Lohr, 1999). Sampling
stations were Anfani and the Dam site (in the lower basin), Warra and Foge Island
(central basin) and Jijima, Zamare and Rofia (upper basin; see Fig. 1).
Individual fish lengths were sampled from fisherfolk's catch landed at the seven sampling sites during the middle 10 days of every month from September 1997 to December 1998. September represented the time of spawning and the beginning
of the first-year cohort for many of the sampled species (Omorinkoba & du Feu, 1994). Individual fish lengths were recorded from each fishing gear type
and separated into 1.0 cm length classes (Table II).
The total number of fish caught during each month for each species, gear type and length class was estimated. This was done by raising the number of fish sampled during the length frequency sampling to the total yield from each gear type using the monthly yield estimates from the catch assessment survey. The length-weight
relationships were used to convert fish lengths into weights.
Page: 129
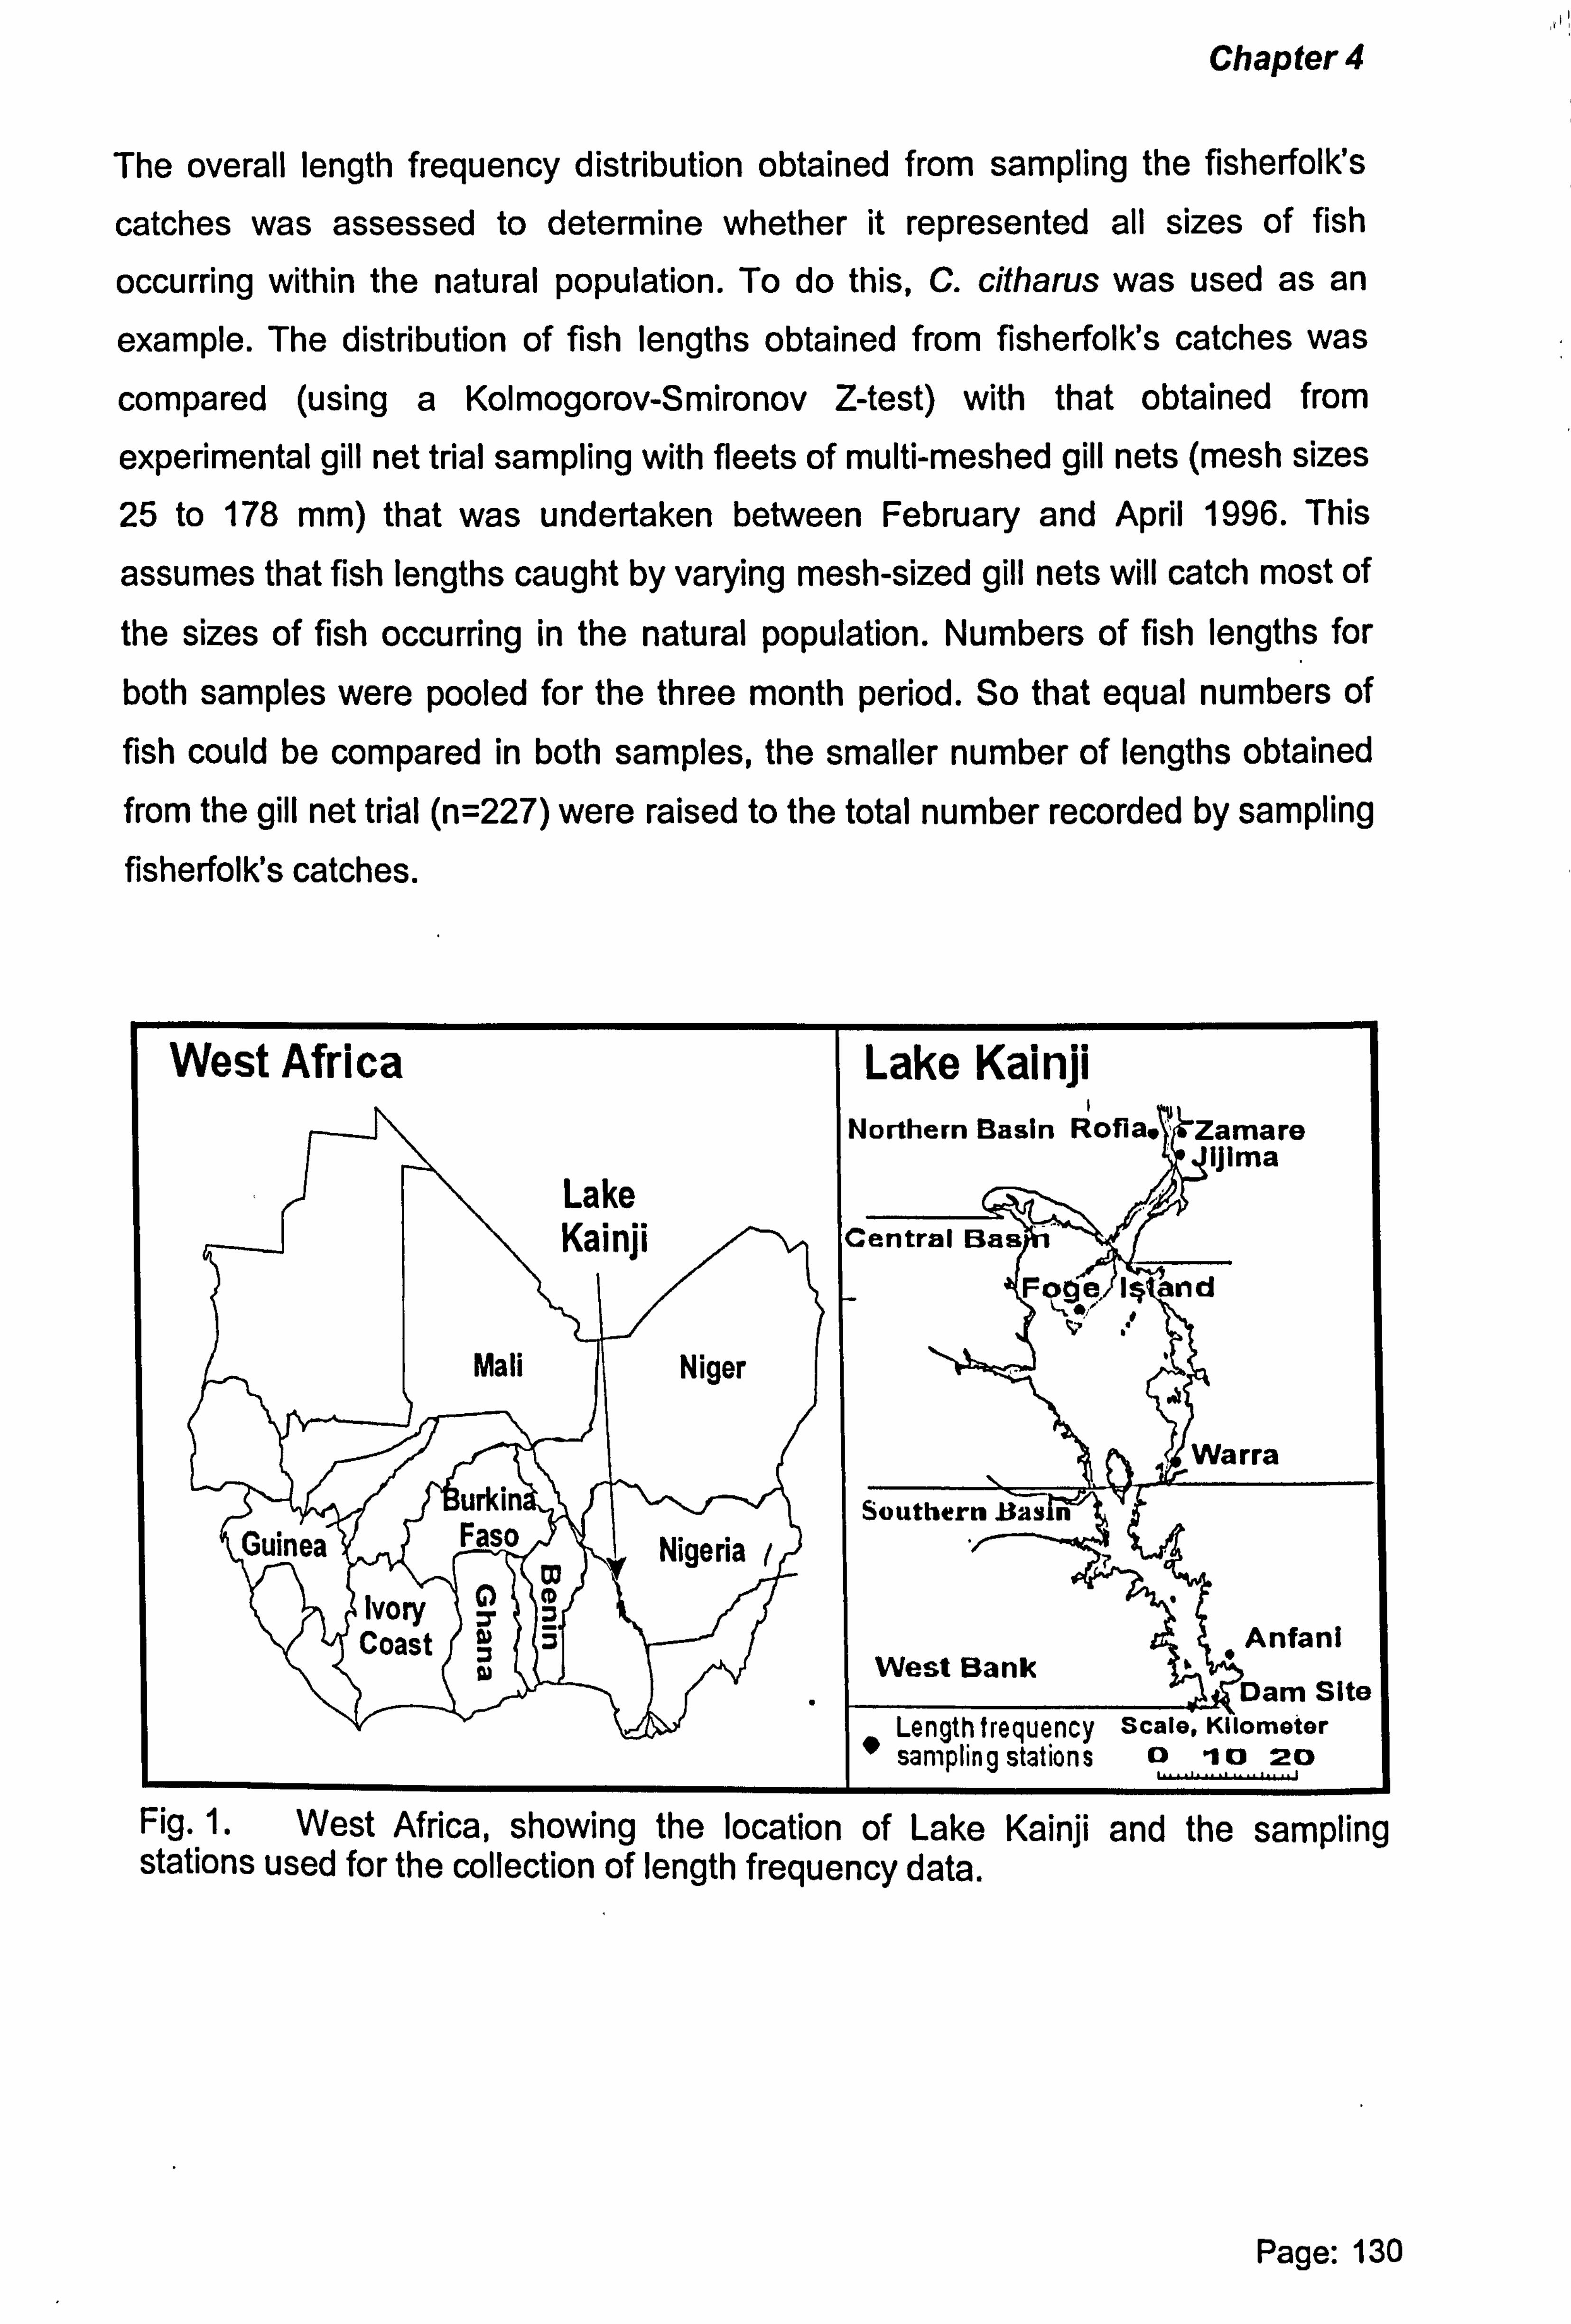
Chapter 4
The overall length frequency distribution obtained from sampling the fisherfolk's
catches was assessed to determine whether it represented all sizes of fish
occurring within the natural population. To do this, C. citharus was used as an
example. The distribution of fish lengths obtained from fisherfolk's catches was
compared (using a Kolmogorov-Smironov Z-test) with that obtained from
experimental gill net trial sampling with fleets of multi-meshed gill nets (mesh sizes 25 to 178 mm) that was undertaken between February and April 1996. This
assumes that fish lengths caught by varying mesh-sized gill nets will catch most of
the sizes of fish occurring in the natural population. Numbers of fish lengths for
both samples were pooled for the three month period. So that equal numbers of fish could be compared in both samples, the smaller number of lengths obtained from the gill net trial (n=227) were raised to the total number recorded by sampling fisherfolk's catches.
West Africa Lake Kainji Northern Basin Ro fia. ', Zamare
ijima Lake Kainji Central Bas
i$ and
Mali Niger
Warra Urkin Southern as n
Guinea Faso Nigeria / Ivory s Coast Anfani
West Bank Dam Site
Length frequency stale, Kilometer " sampling stations 0h0 20
.................... . Fig. 1. West Africa, showing the location of Lake Kainji and the sampling stations used for the collection of length frequency data.
Page: 130
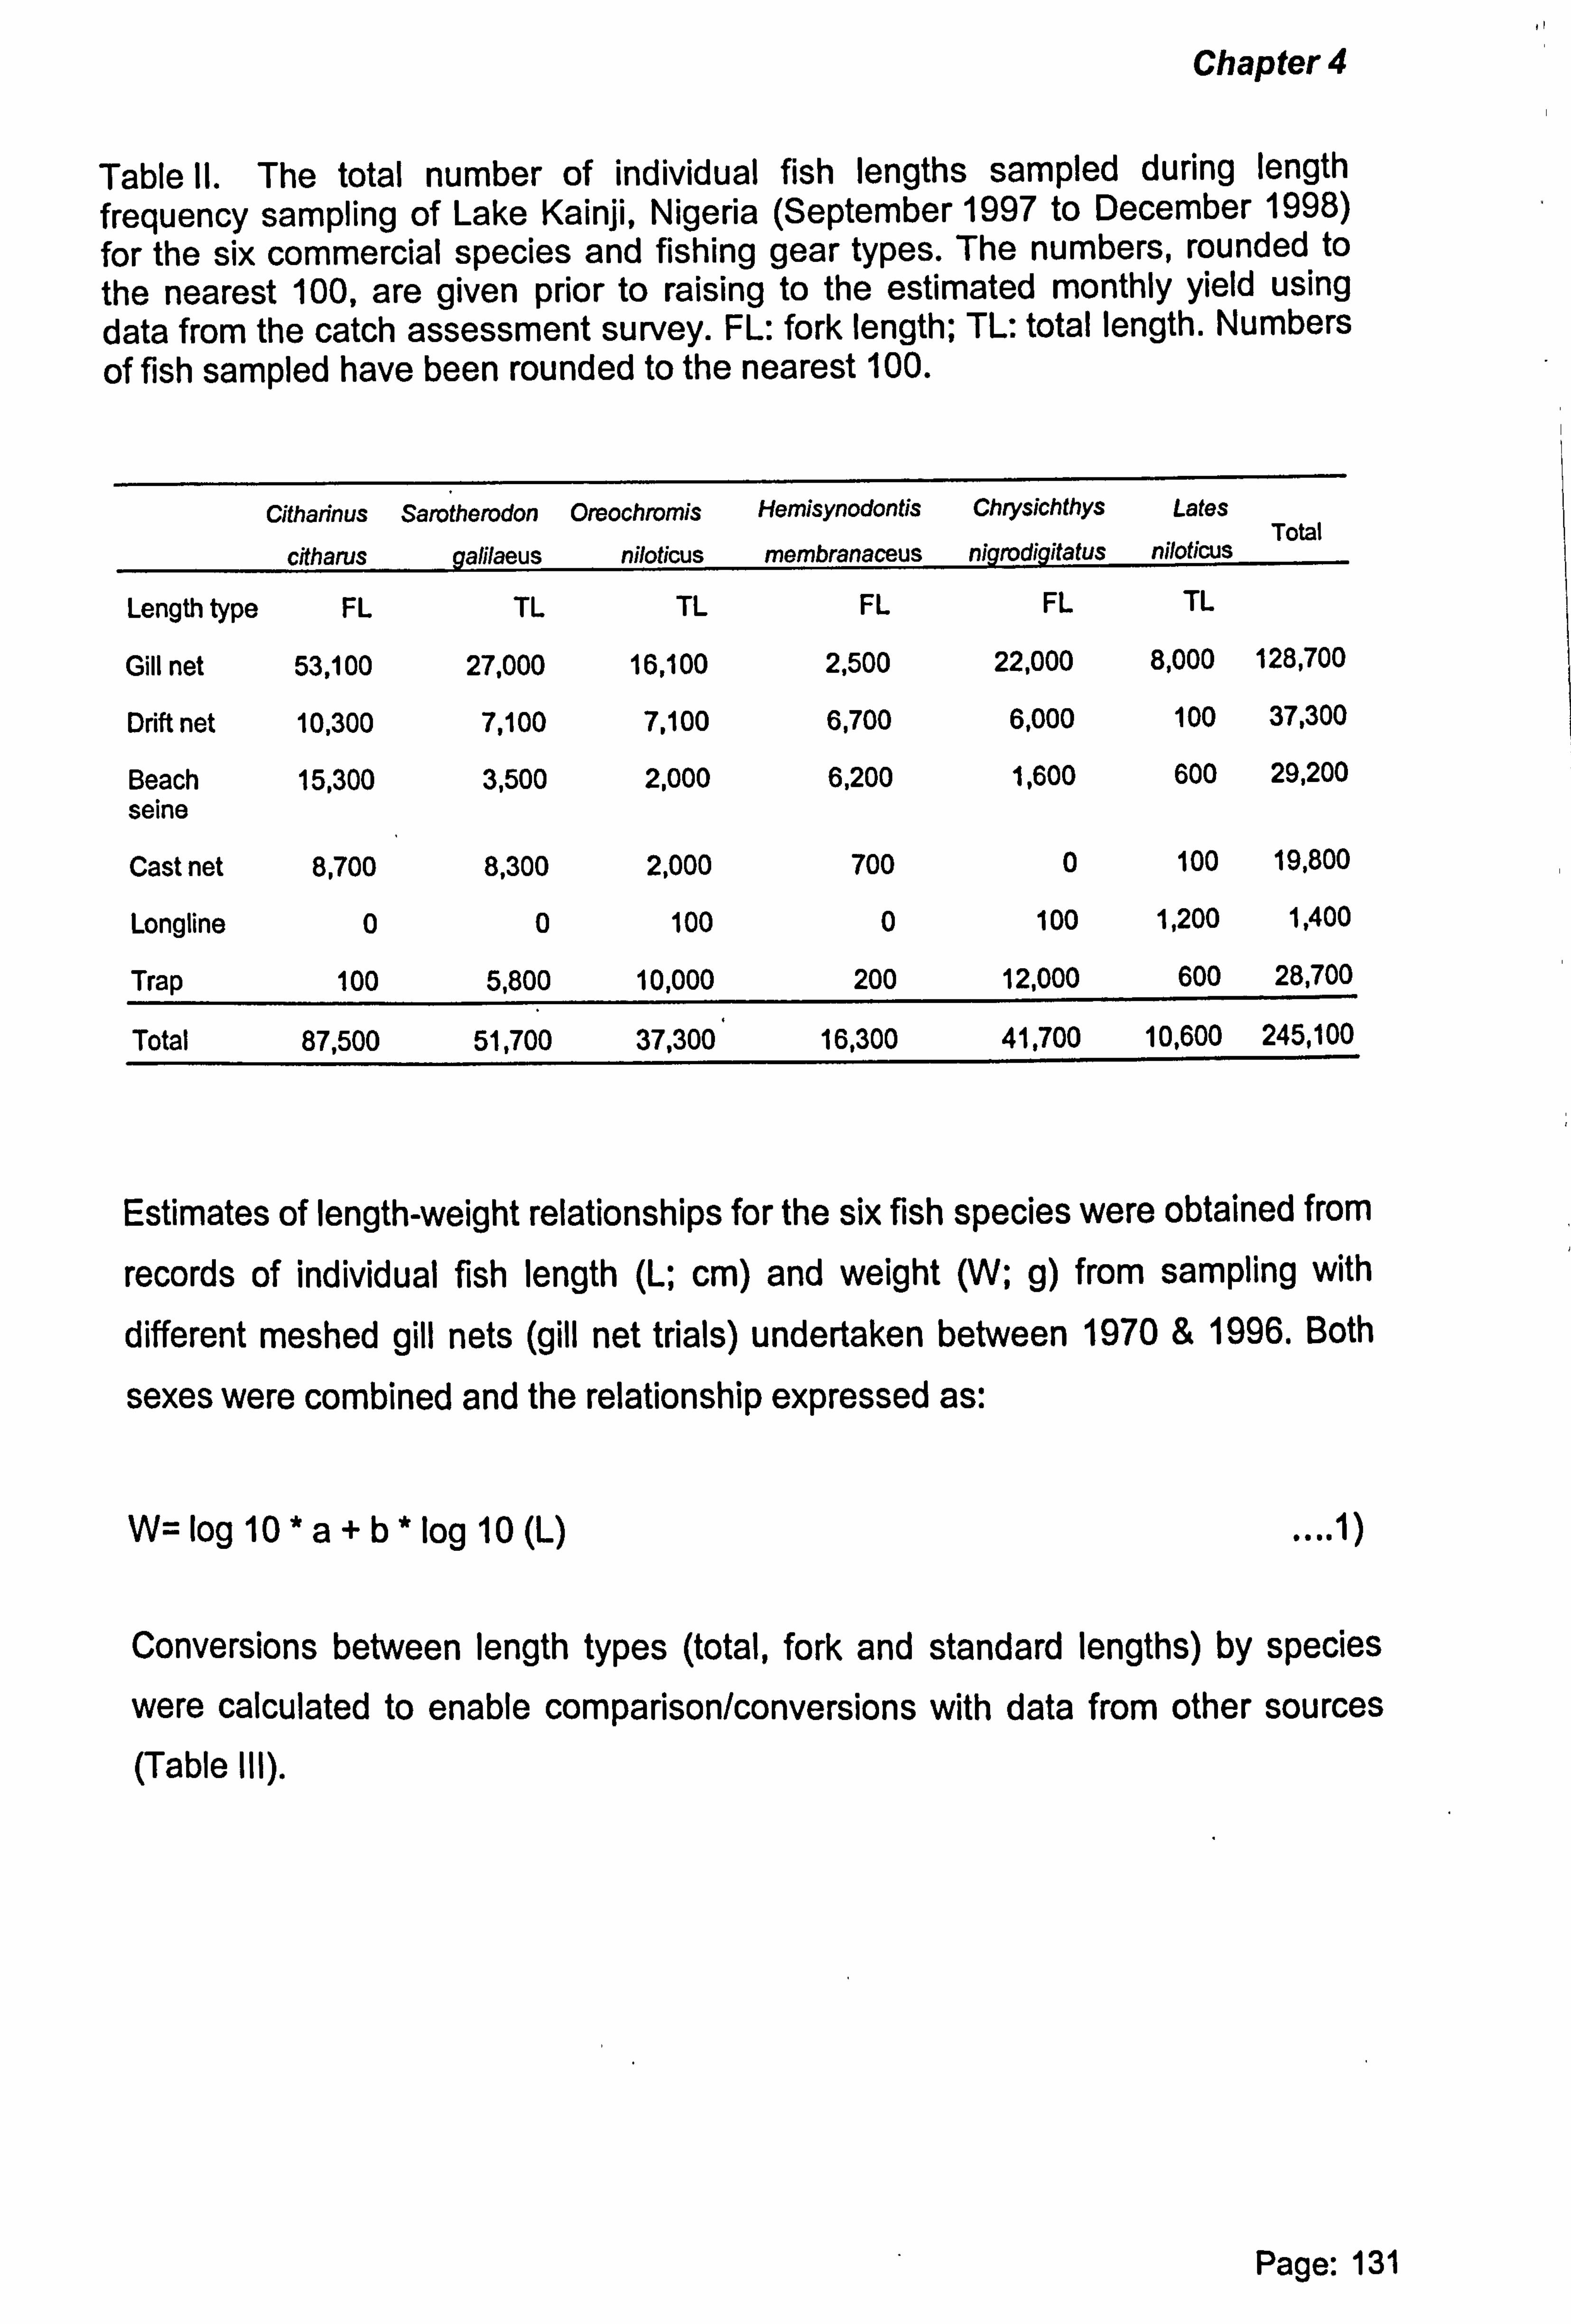
Chapter 4
Table II. The total number of individual fish lengths sampled during length frequency sampling of Lake Kainji, Nigeria (September 1997 to December 1998) for the six commercial species and fishing gear types. The numbers, rounded to the nearest 100, are given prior to raising to the estimated monthly yield using data from the catch assessment survey. FL: fork length; TL: total length. Numbers
of fish sampled have been rounded to the nearest 100.
Citharinus
citharus
Sarotherodon
galilaeus
Oreochromis
niloticus
Hemisynodontis
membranaceus
Chrysichthys
nigrodigitatus
Lates
niloticus Total
Length type FL TL TL FL FL TL
Gill net 53,100 27,000 16,100 2,500 22,000 8,000 128,700
Drift net 10,300 7,100 7,100 6,700 6,000 100 37,300
Beach 15,300 3,500 2,000 6,200 1,600 600 29,200 seine
Cast net 8,700 8,300 2,000 700 0 100 19,800
Longline 0 0 100 0 100 1,200 1,400
Trap 100 5,800 10,000 200 12,000 600 28,700
Total 87,500 51,700 37,300 16,300 41,700 10,600 245,100
Estimates of length-weight relationships for the six fish species were obtained from
records of individual fish length (L; cm) and weight (W; g) from sampling with different meshed gill nets (gill net trials) undertaken between 1970 & 1996. Both
sexes were combined and the relationship expressed as:
W=Iog10*a+b*log10(L) .... 1)
Conversions between length types (total, fork and standard lengths) by species
were calculated to enable comparison/conversions with data from other sources (Table III).
Page: 131
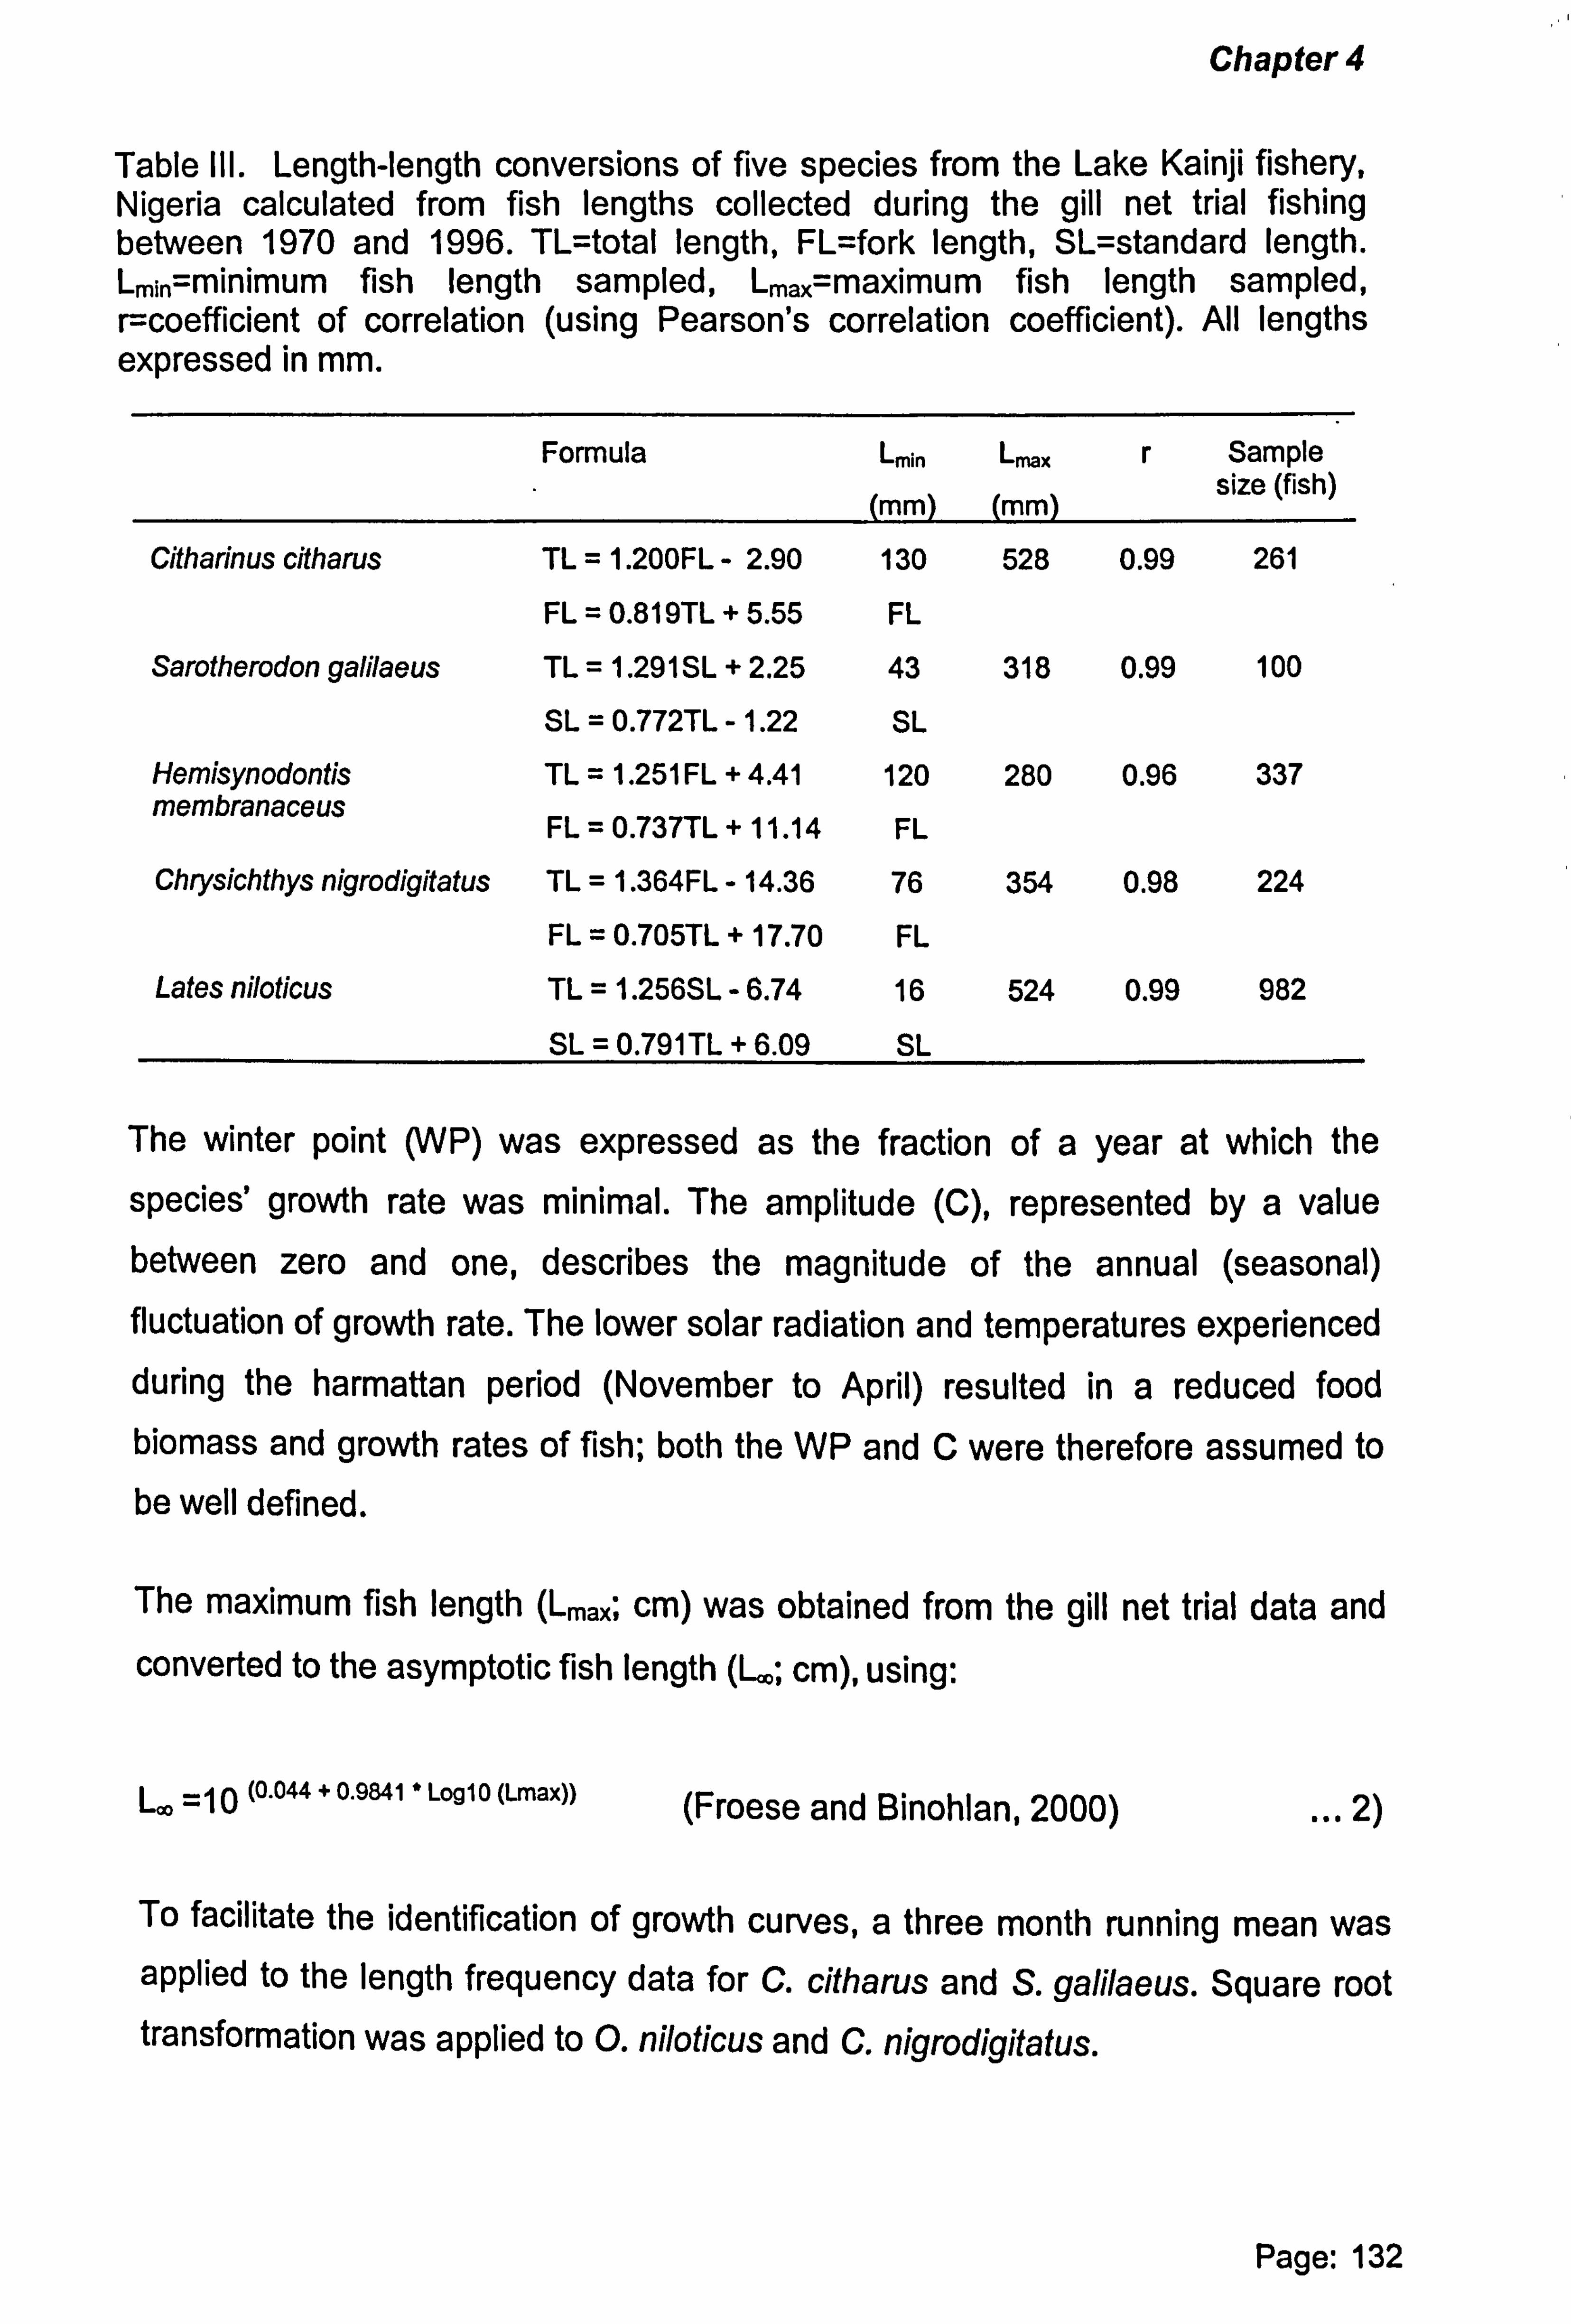
Chapter 4
Table III. Length-length conversions of five species from the Lake Kainji fishery, Nigeria calculated from fish lengths collected during the gill net trial fishing between 1970 and 1996. TL=total length, FL=fork length, SL=standard length. Lmj�=minimum fish length sampled, Lmax=maximum fish length sampled, r=coefficient of correlation (using Pearson's correlation coefficient). All lengths expressed in mm.
Formula Lmj�
(mm)
L,,,,,
(mm)
r Sample size (fish)
Citharinus citharus TL =1.200FL - 2.90 130 528 0.99 261
FL = 0.819TL + 5.55 FL
Sarotherodon galilaeus TL =1.291 SL + 2.25 43 318 0.99 100
SL = 0.772TL - 1.22 SL
Hemisynodontis TL = 1.251 FL + 4.41 120 280 0.96 337 membranaceus FL = 0.737TL + 11.14 FL
Chrysichthys nigrodigitatus TL =1.364FL - 14.36 76 354 0.98 224
FL = 0.705TL + 17.70 FL Lates niloticus TL =1.256SL - 6.74 16 524 0.99 982
SL = 0.791 TL + 6.09 SL
The winter point (WP) was expressed as the fraction of a year at which the
species' growth rate was minimal. The amplitude (C), represented by a value between zero and one, describes the magnitude of the annual (seasonal) fluctuation of growth rate. The lower solar radiation and temperatures experienced during the harmattan period (November to April) resulted in a reduced food biomass and growth rates of fish; both the WP and C were therefore assumed to be well defined.
The maximum fish length (1-max; cm) was obtained from the gill net trial data and converted to the asymptotic fish length (L.; cm), using:
Loo =10 (0.044 + 0.9841 * Log 10 (Lmax)) (Froese and Binohlan, 2000) ... 2)
To facilitate the identification of growth curves, a three month running mean was applied to the length frequency data for C. citharus and S. galilaeus. Square root transformation was applied to 0. niloticus and C. nigrodigitatus.
Page: 132
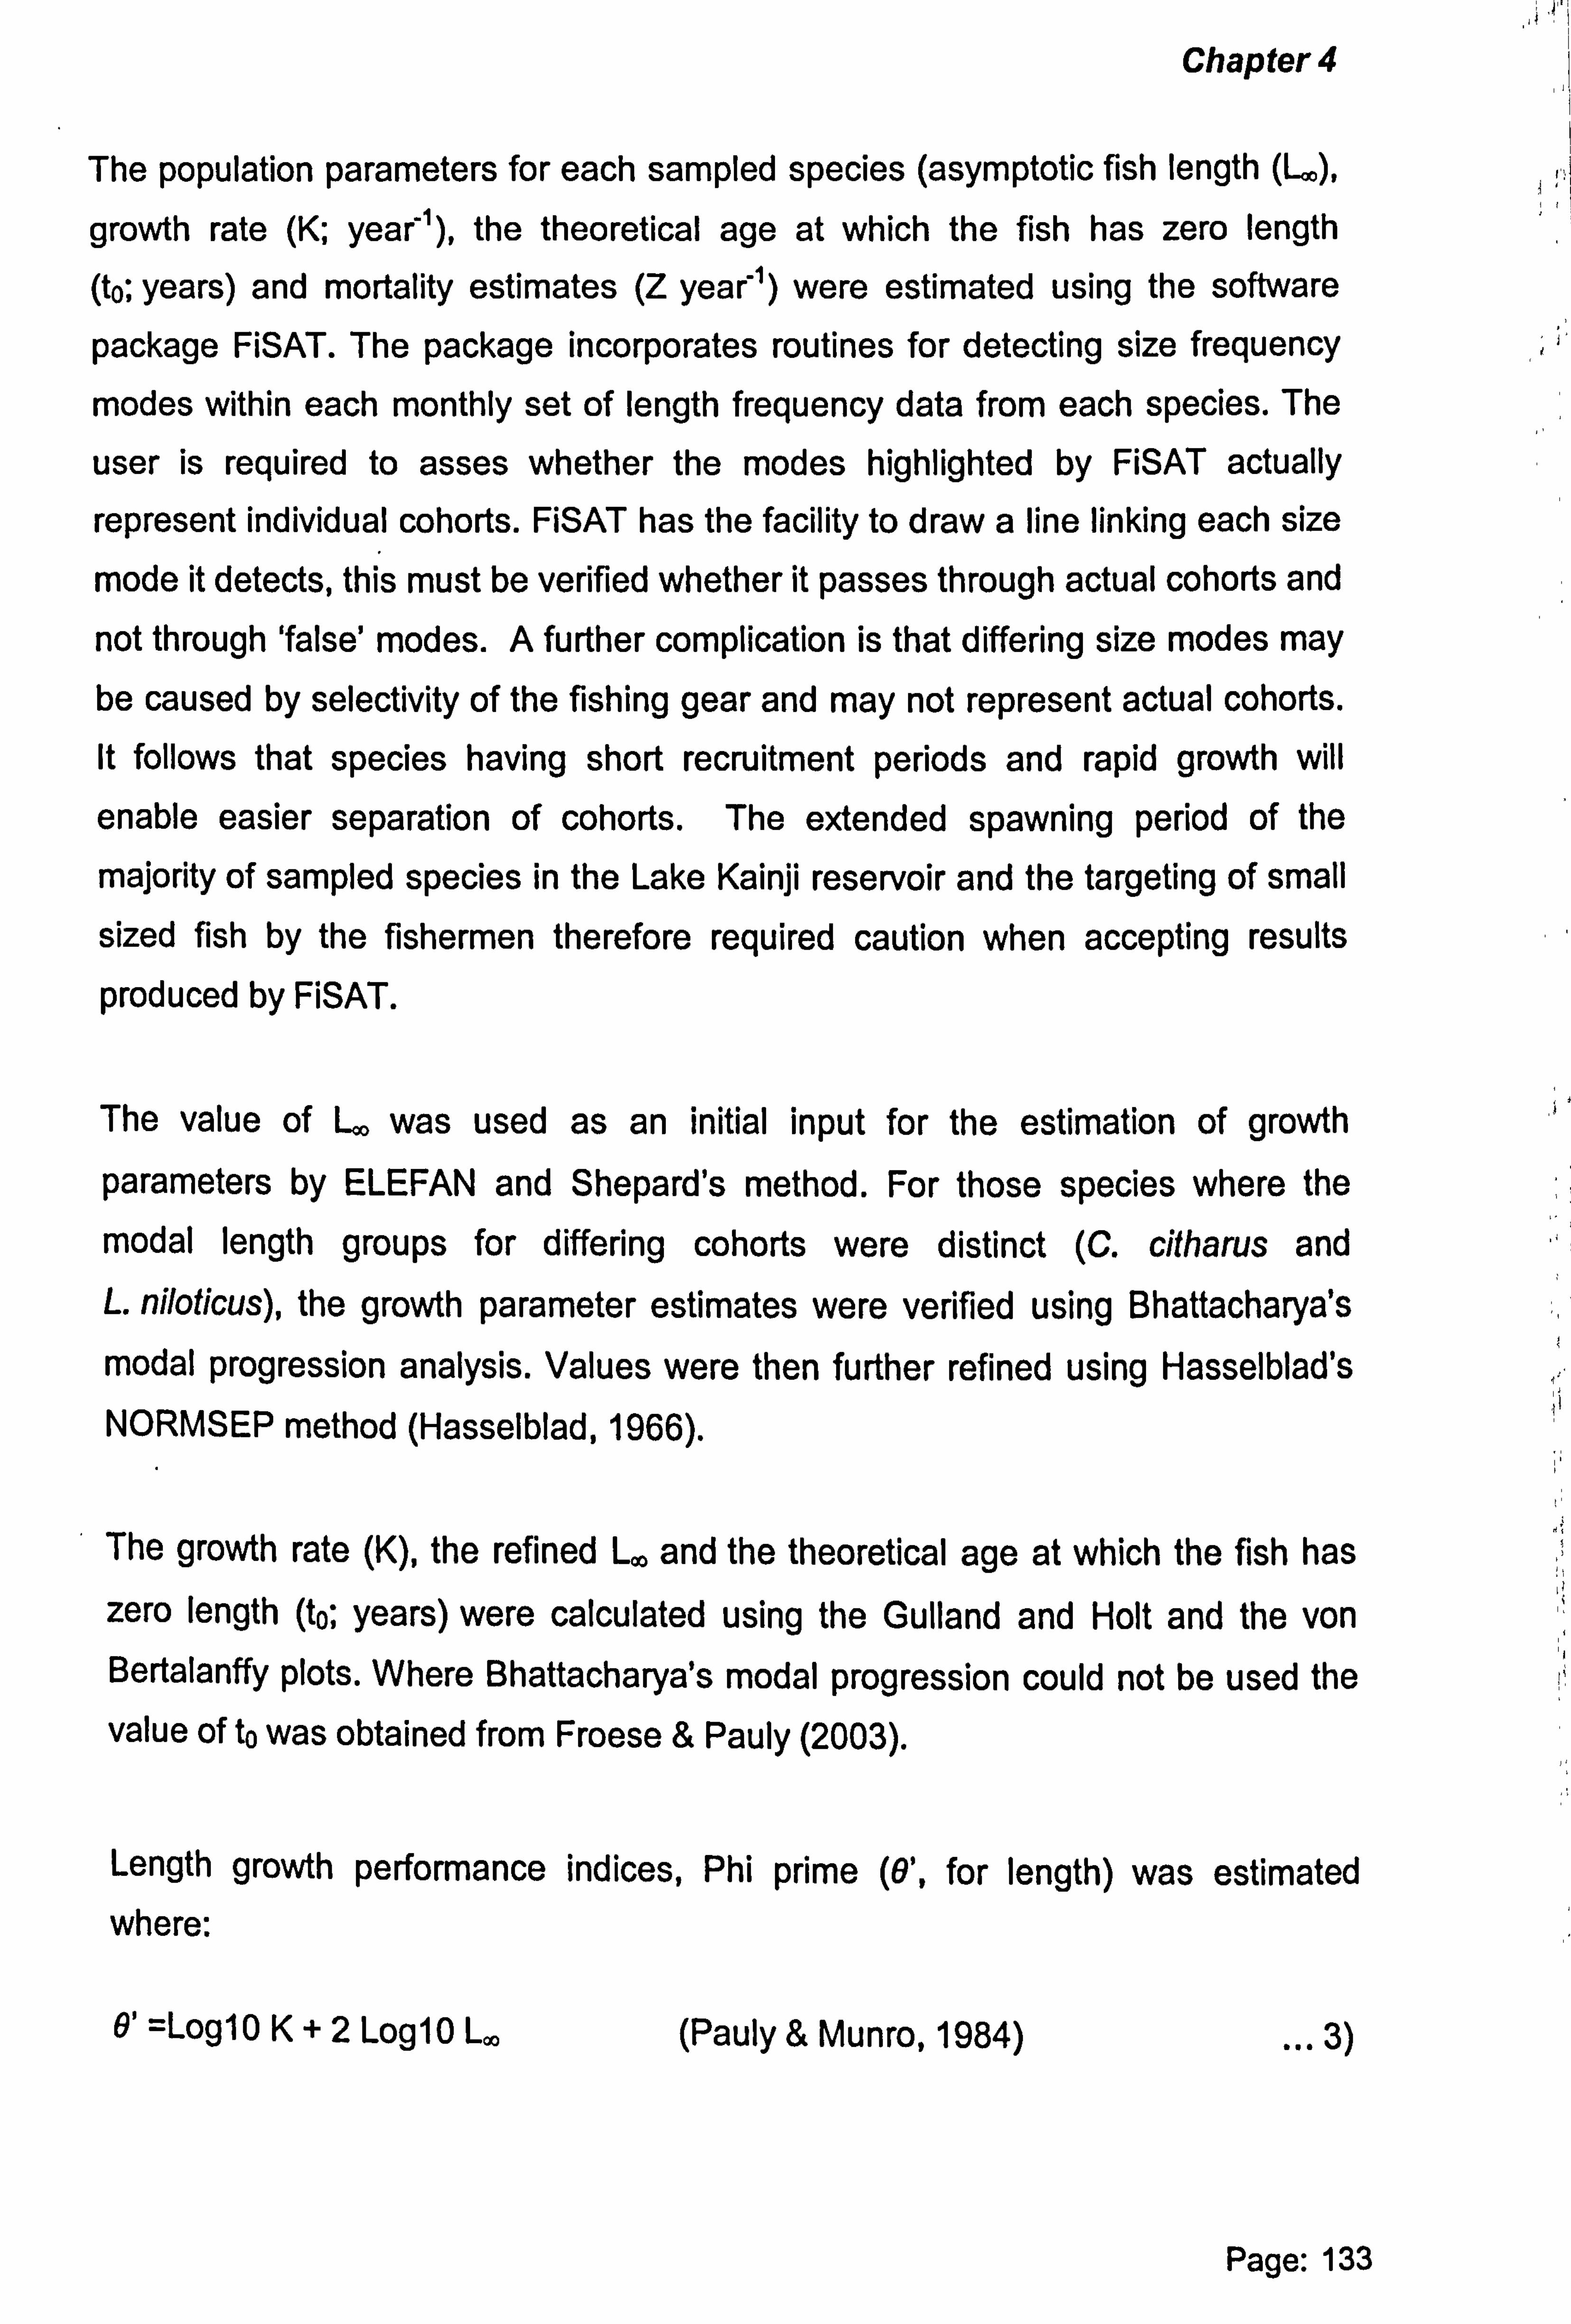
Chapter 4
The population parameters for each sampled species (asymptotic fish length (L. ),
growth rate (K; year'), the theoretical age at which the fish has zero length
(to; years) and mortality estimates (Z year) were estimated using the software
package FiSAT. The package incorporates routines for detecting size frequency
modes within each monthly set of length frequency data from each species. The
user is required to asses whether the modes highlighted by FiSAT actually
represent individual cohorts. FiSAT has the facility to draw a line linking each size
mode it detects, this must be verified whether it passes through actual cohorts and
not through 'false' modes. A further complication is that differing size modes may be caused by selectivity of the fishing gear and may not represent actual cohorts. It follows that species having short recruitment periods and rapid growth will
enable easier separation of cohorts. The extended spawning period of the
majority of sampled species in the Lake Kainji reservoir and the targeting of small
sized fish by the fishermen therefore required caution when accepting results
produced by FiSAT.
The value of L. was used as an initial input for the estimation of growth
parameters by ELEFAN and Shepard's method. For those species where the
modal length groups for differing cohorts were distinct (C. citharus and L. niloticus), the growth parameter estimates were verified using Bhattacharya's
modal progression analysis. Values were then further refined using Hasselblad's NORMSEP method (Hasselblad, 1966).
The growth rate (K), the refined L. and the theoretical age at which the fish has zero length (to; years) were calculated using the Gulland and Holt and the von Bertalanffy plots. Where Bhattacharya's modal progression could not be used the value of to was obtained from Froese & Pauly (2003).
Length growth performance indices, Phi prime (0', for length) was estimated where:
9' =Log10 K+2 Log10 L. (Pauly & Munro, 1984) ... 3)
Page: 133
11 a IF Chapter 4
For each species the mean value of 9' and L. from the ELEFAN and Shepard's
method, Gulland and Holt and von Bertalanffy plots were used to calculate the
mean value of K.
Natural mortality (M; year'), the mortality caused by all other factors apart from
fishing mortality (F; year'), was estimated using:
Log10 (M) = -0.065 - 0.287 log 10 (L. ) + 0.604 log 10 (K) + 0.513 log 10 (T)
(Pauly, 1980) ... 4)
where: L. is total length (cm) and T= mean water temperature of 27.85 °C (Mbagwu & Adeniji, 1994).
Total mortality (Z=M+F; year) was estimated using Jone's length-converted catch
curve method.
Ln (C1/Lt; ) =a+b. t'
where: it; = (1 /K). Ln [ L. -L j+, ] and b. t' =1 /K Ln [1-(Li/ L, ) ... 5)
Ci = terminal catch, At; = time difference for fish to grow, Li = mid point of the length
class.
The exploitation rate (E; year'), the fraction of all deaths (total mortality, Z; year)
E= E ...
6) Z
RESULTS ASSESSMENT OF METHODOLOGY
The comparison of the distribution of the length frequencies sampled (from fisherfolk's catches) with those obtained from the gill net trial data for C. citharus is
shown in Fig. 2. The data are for combined the three months during which gill net trial samples were collected. The sample number for the gill net trial data was small (n=227) and had to be scaled up to the higher number of length frequency data. Results are therefore tentative.
Page: 134
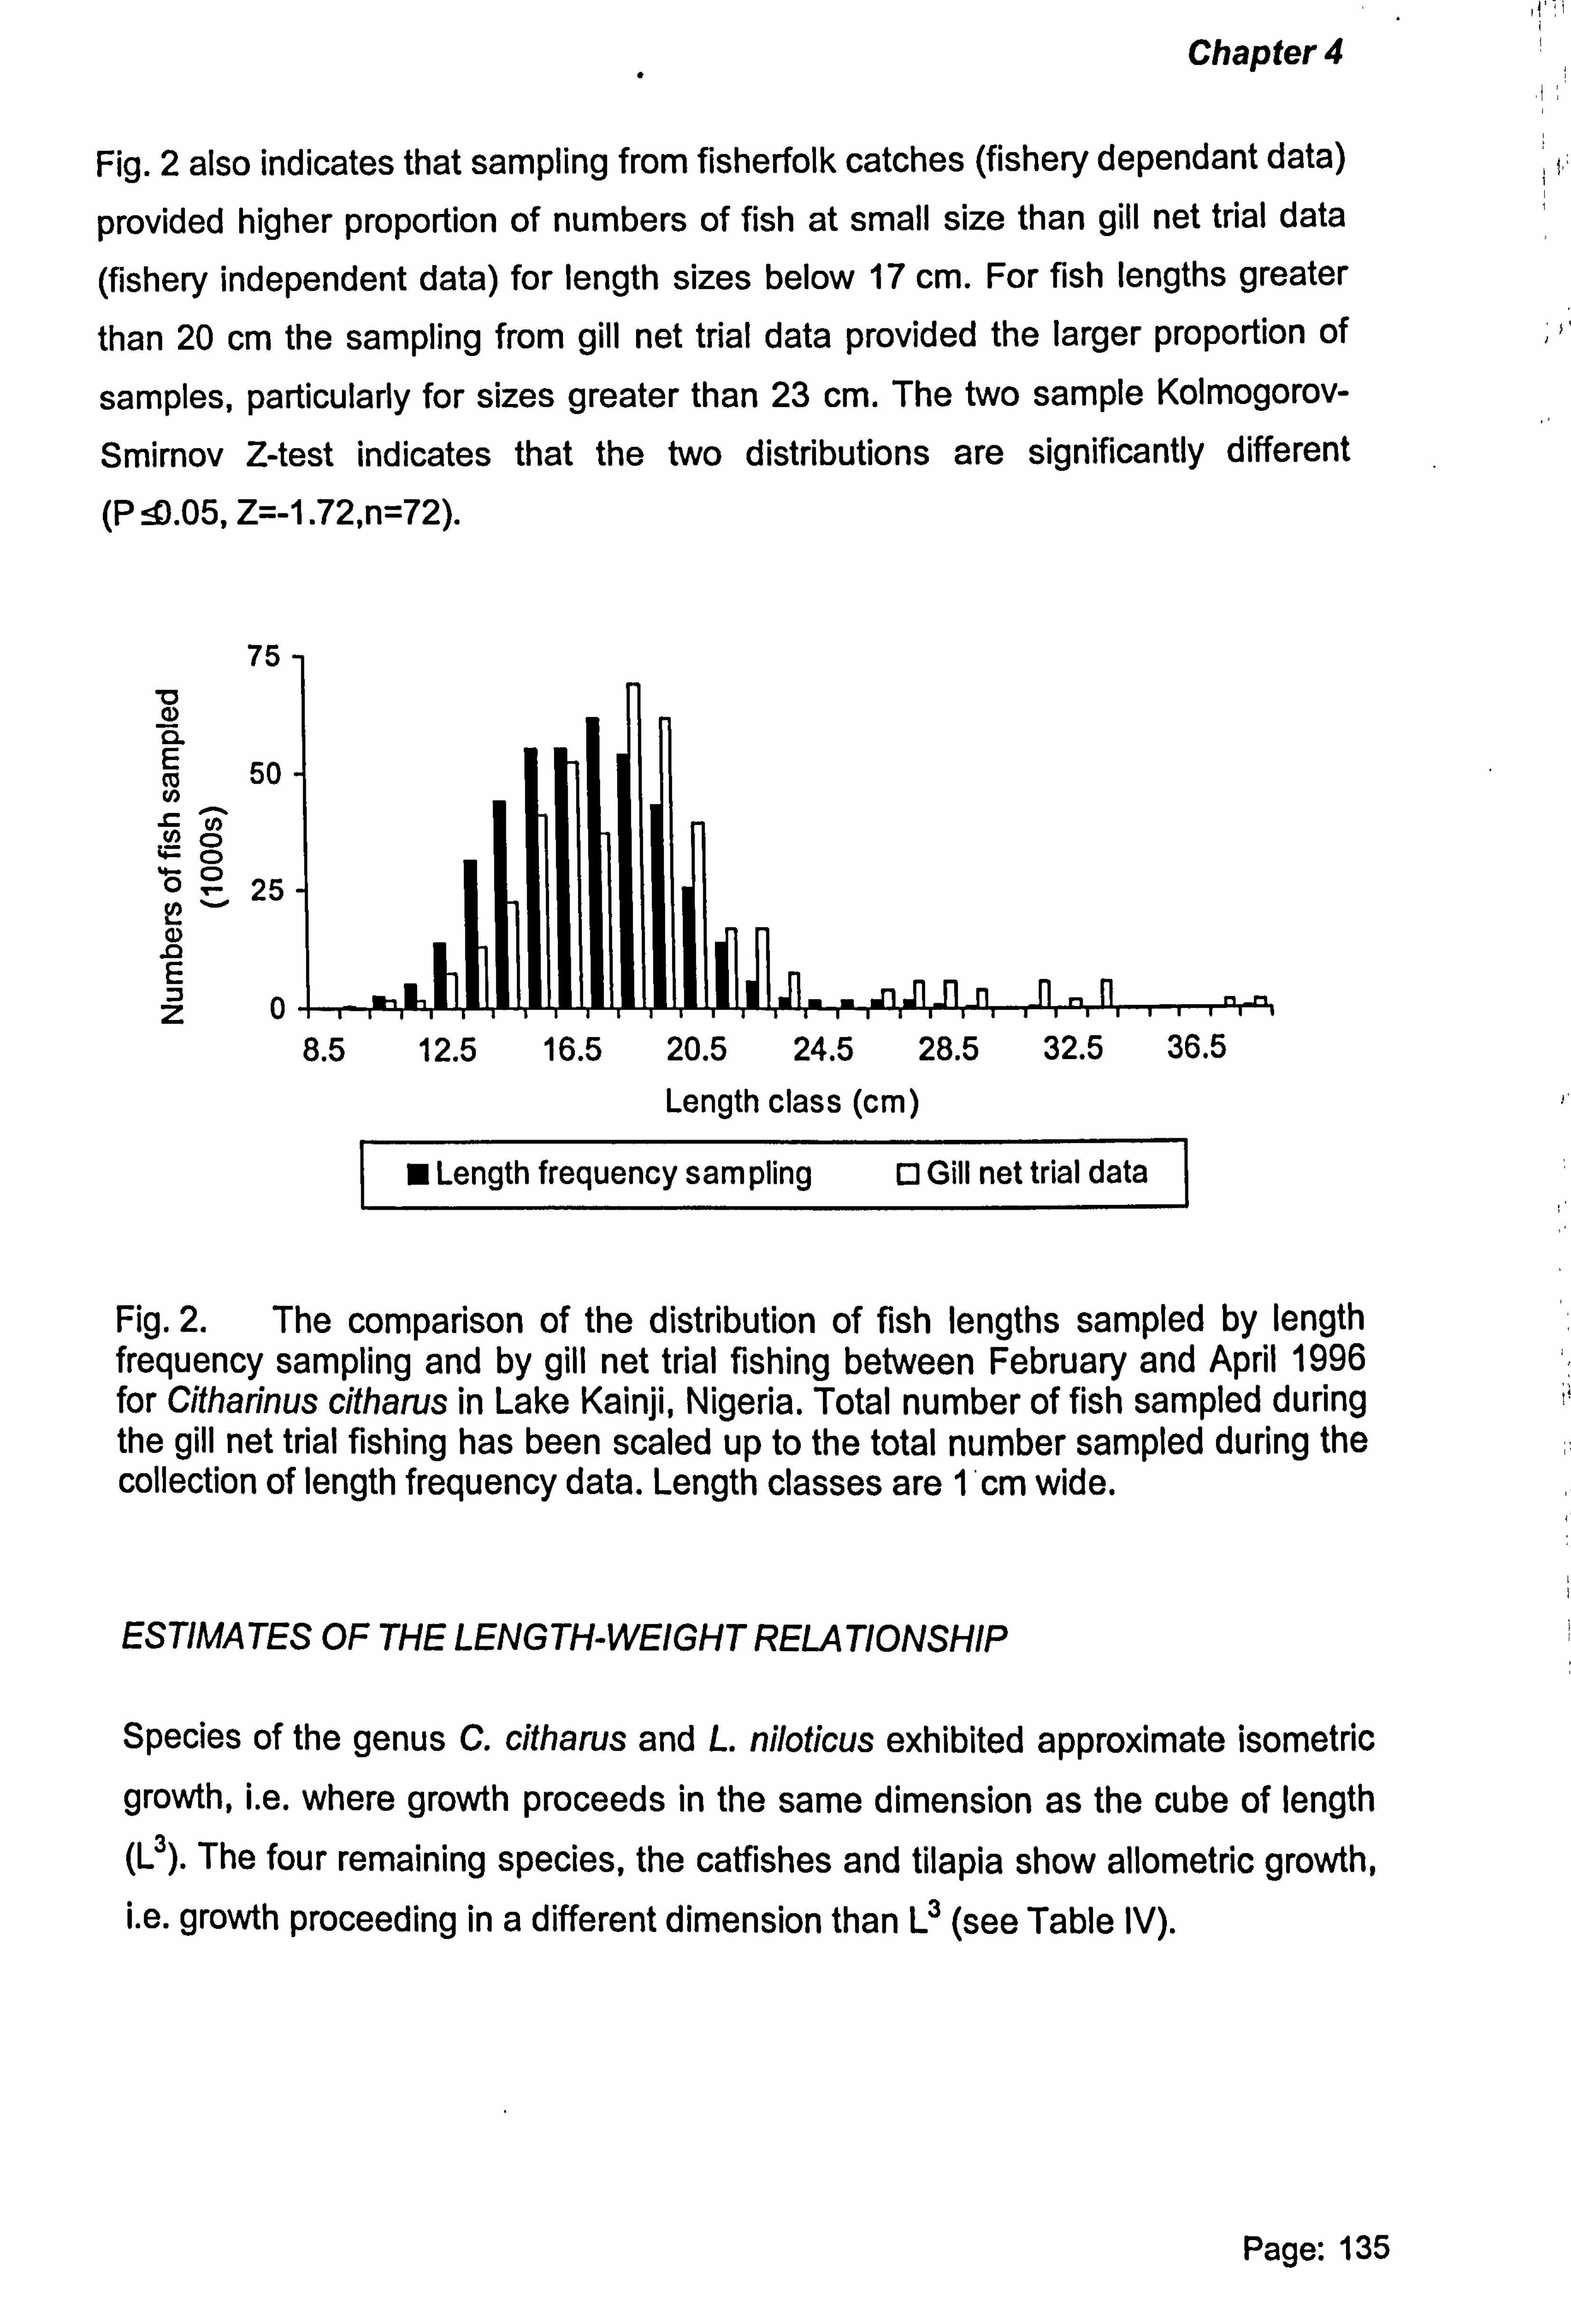
Chapter 4
Fig. 2 also indicates that sampling from fisherfolk catches (fishery dependant data)
provided higher proportion of numbers of fish at small size than gill net trial data
(fishery independent data) for length sizes below 17 cm. For fish lengths greater
than 20 cm the sampling from gill net trial data provided the larger proportion of
samples, particularly for sizes greater than 23 cm. The two sample Kolmogorov-
Smirnov Z-test indicates that the two distributions are significantly different
(P J. 05, Z=-1.72, n=72).
75 'o CD a. co 50 co s0 No z= o ö°
v 25
a) E
0 Z
Length class (cm)
Length frequency sampling Q Gill net trial data
Fig. 2. The comparison of the distribution of fish lengths sampled by length frequency sampling and by gill net trial fishing between February and April 1996 for Citharinus citharus in Lake Kainji, Nigeria. Total number of fish sampled during the gill net trial fishing has been scaled up to the total number sampled during the collection of length frequency data. Length classes are 1 'cm wide.
ESTIMATES OF THE LENGTH-WEIGHT RELATIONSHIP
Species of the genus C. citharus and L. niloticus exhibited approximate isometric
growth, i. e. where growth proceeds in the same dimension as the cube of length (L3). The four remaining species, the catfishes and tilapia show allometric growth, i. e. growth proceeding in a different dimension than L3 (see Table IV).
Page: 135
8.5 12.5 16.5 20.5 24.5 28.5 32.5 36.5
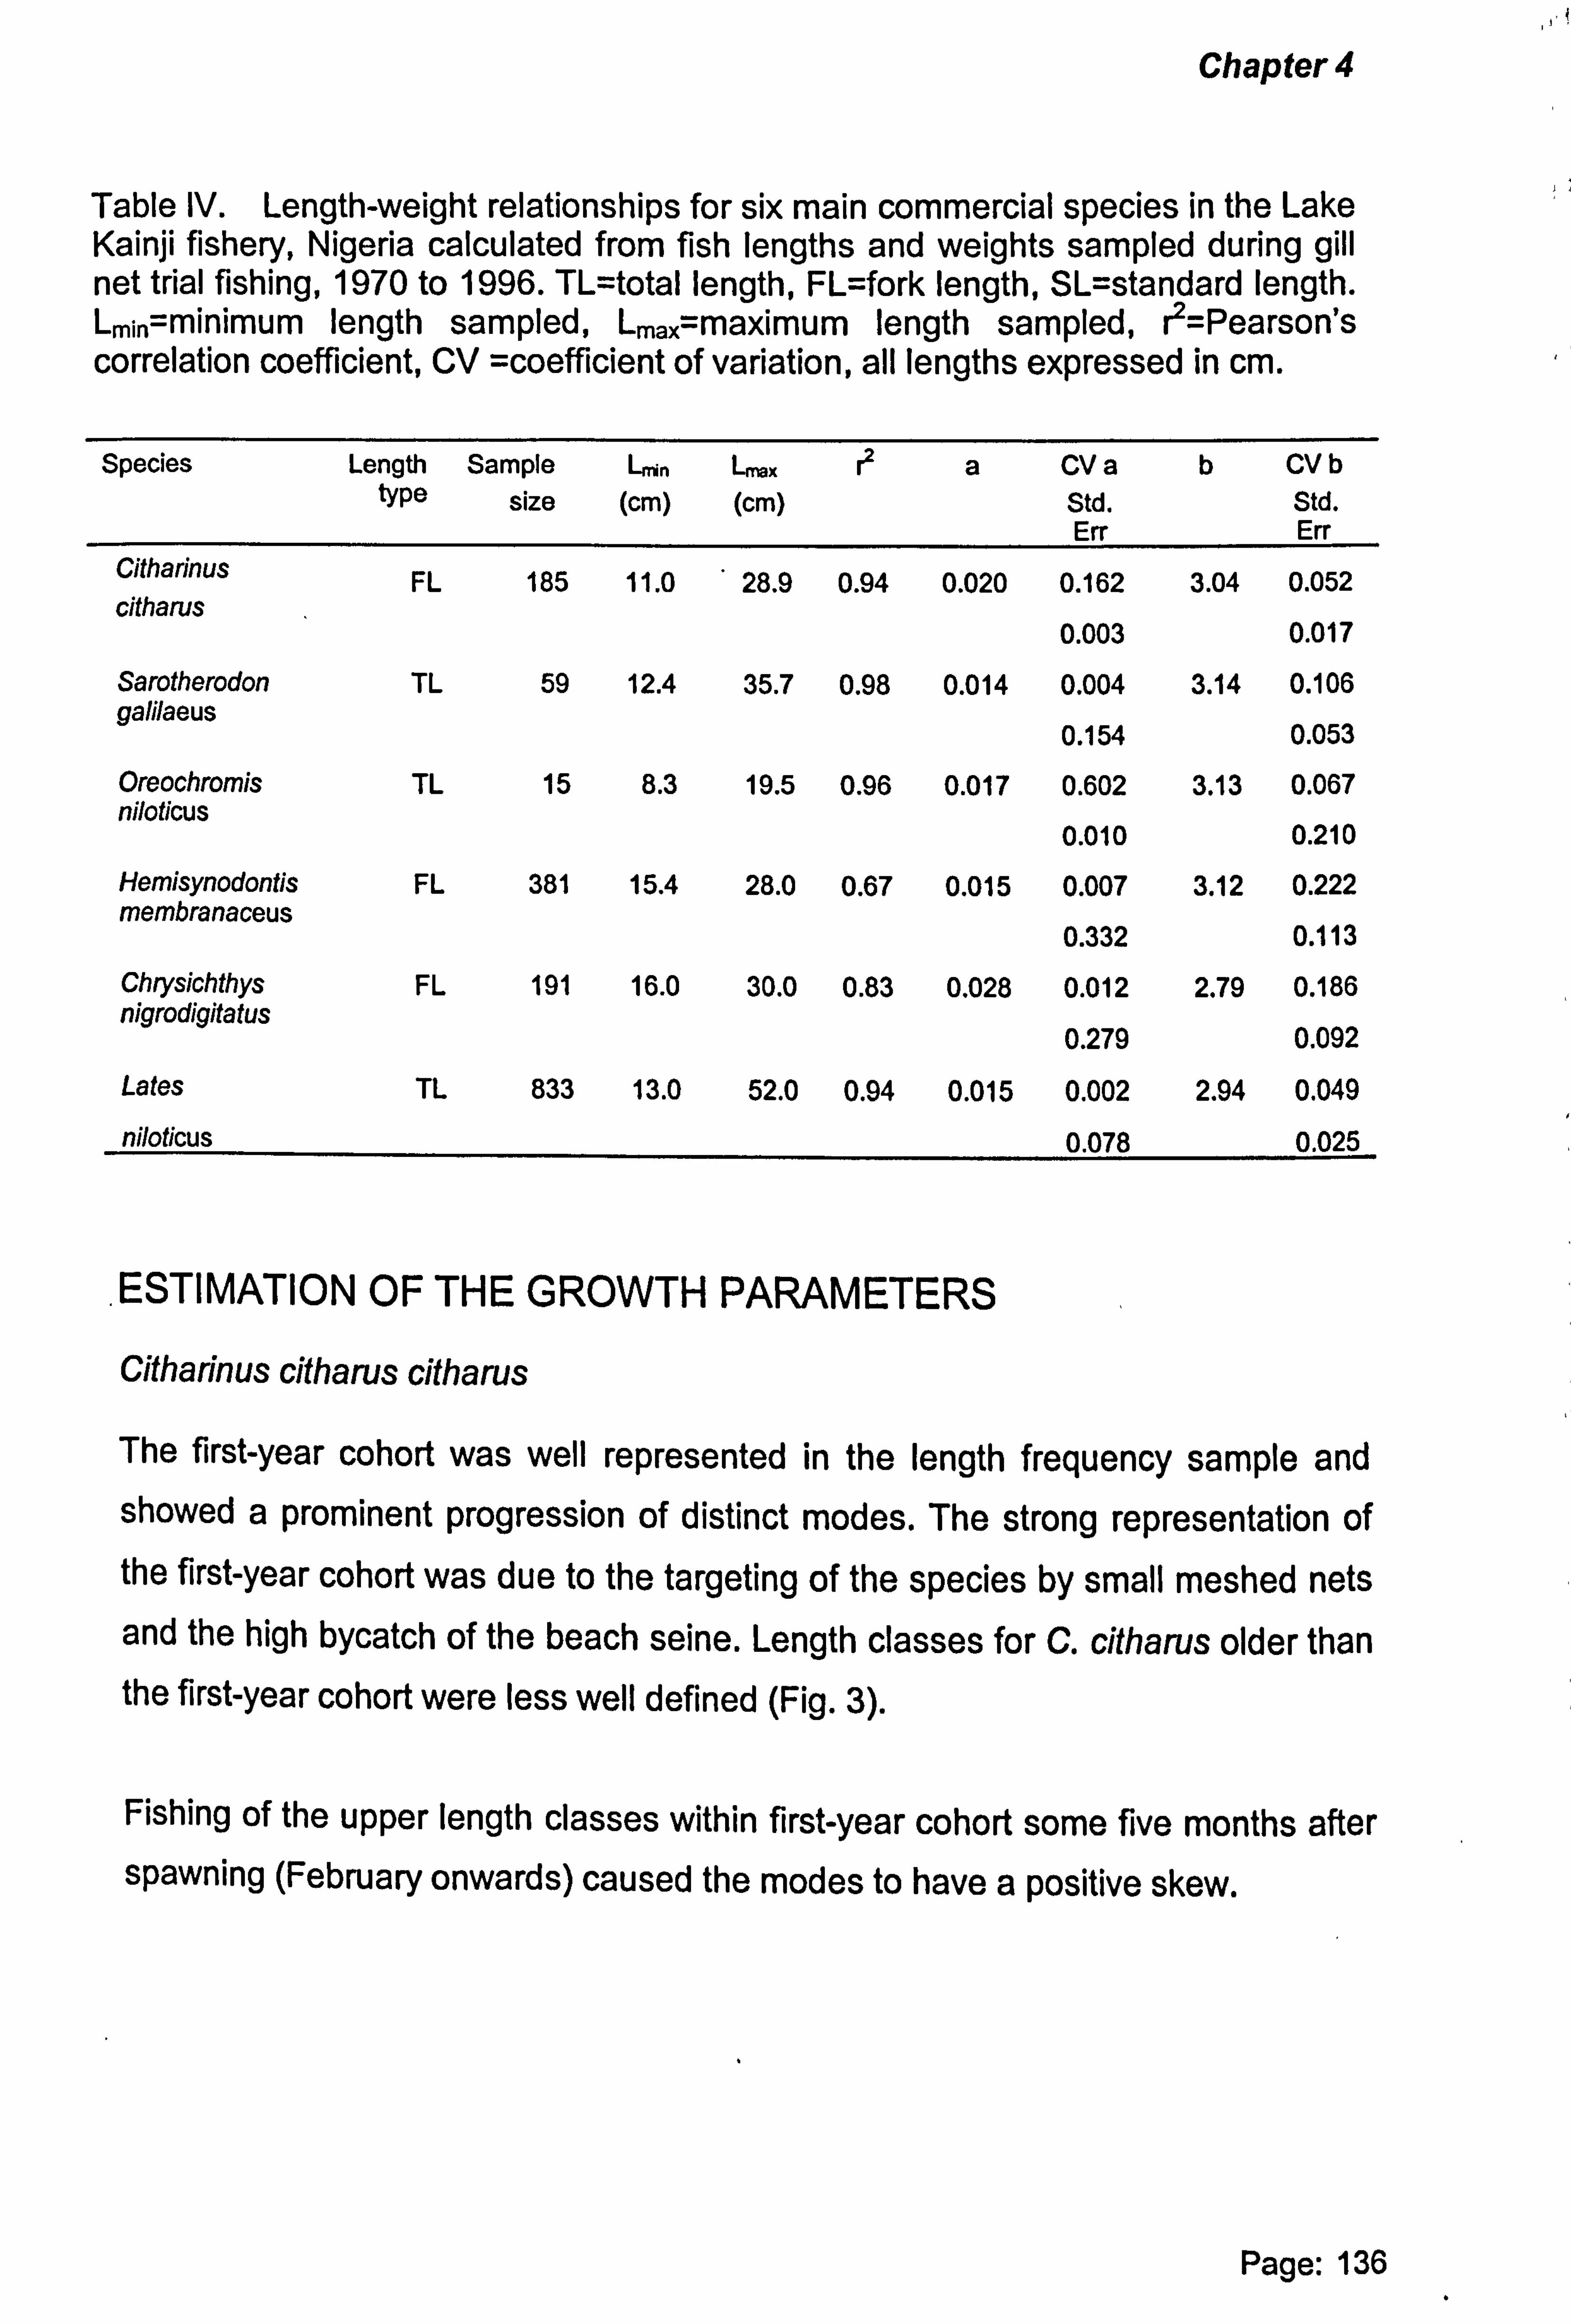
Chapter 4
Table IV. Length-weight relationships for six main commercial species in the Lake Kainji fishery, Nigeria calculated from fish lengths and weights sampled during gill net trial fishing, 1970 to 1996. TL=total length, FL=fork length, SL=standard length. Lmin=minimum length sampled, Lmax=maximum length sampled, r2=Pearson's correlation coefficient, CV =coefficient of variation, all lengths expressed in cm.
Species Length type
Sample size
L,,,;,, (cm)
LMx (cm)
r2 a CV a Std. Err
b CV b Std. Err
Citharinus FL 185 11.0 28.9 0.94 0.020 0.162 3.04 0.052 citharus
0.003 0.017
Sarotherodon TL 59 12.4 35.7 0.98 0.014 0.004 3.14 0.106 galilaeus
0.154 0.053
Oreochromis TL 15 8.3 19.5 0.96 0.017 0.602 3.13 0.067 niloticus
0.010 0.210
Hemisynodontis FL 381 15.4 28.0 0.67 0.015 0.007 3.12 0.222 membranaceus
0.332 0.113
Chrysichthys FL 191 16.0 30.0 0.83 0.028 0.012 2.79 0.186 nigrodigitatus
0.279 0.092
Lates TL 833 13.0 52.0 0.94 0.015 0.002 2.94 0.049
niloticus 0.078 0.025
ESTIMATION OF THE GROWTH PARAMETERS
Citharinus citharus citharus
The first-year cohort was well represented in the length frequency sample and showed a prominent progression of distinct modes. The strong representation of the first-year cohort was due to the targeting of the species by small meshed nets and the high bycatch of the beach seine. Length classes for C. citharus older than the first-year cohort were less well defined (Fig. 3).
Fishing of the upper length classes within first-year cohort some five months after spawning (February onwards) caused the modes to have a positive skew.
Page: 136
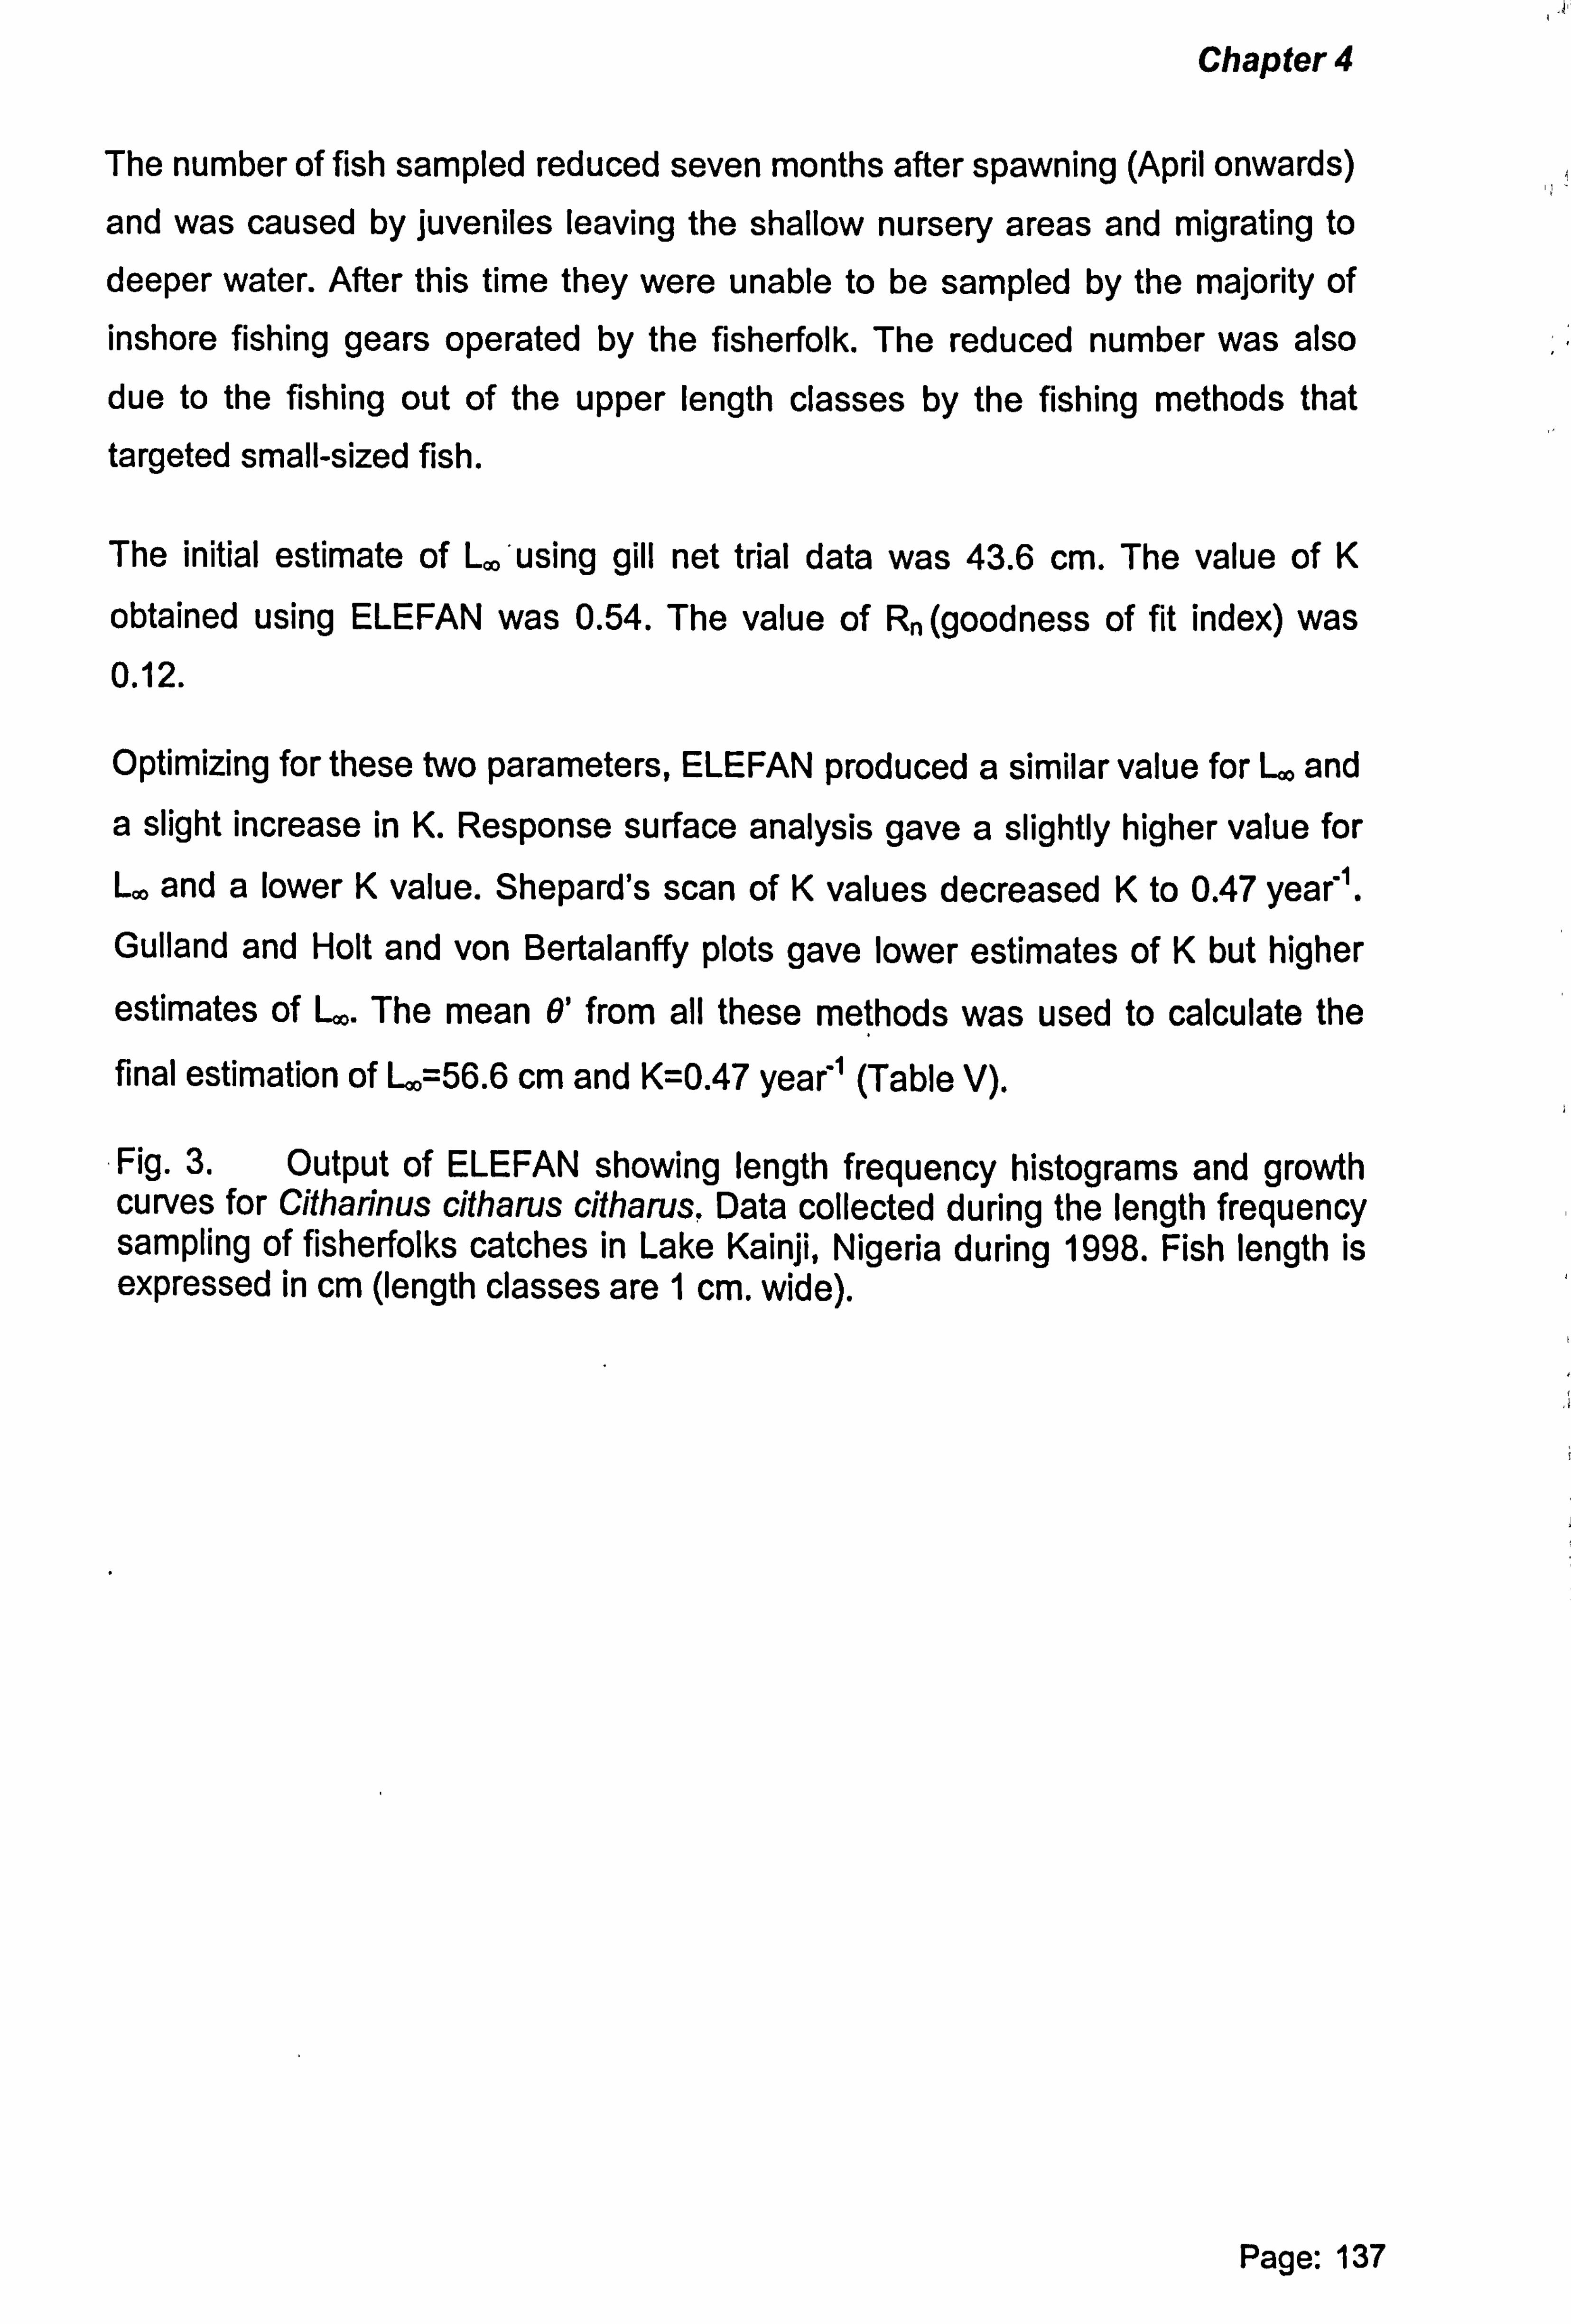
Chapter 4
The number of fish sampled reduced seven months after spawning (April onwards)
and was caused by juveniles leaving the shallow nursery areas and migrating to
deeper water. After this time they were unable to be sampled by the majority of inshore fishing gears operated by the fisherfolk. The reduced number was also due to the fishing out of the upper length classes by the fishing methods that
targeted small-sized fish.
The initial estimate of L. ' using gill net trial data was 43.6 cm. The value of K
obtained using ELEFAN was 0.54. The value of R� (goodness of fit index) was 0.12.
Optimizing for these two parameters, ELEFAN produced a similar value for L, and a slight increase in K. Response surface analysis gave a slightly higher value for
L. and a lower K value. Shepard's scan of K values decreased K to 0.47 year 1.
Gulland and Holt and von Bertalanffy plots gave lower estimates of K but higher
estimates of L.. The mean 9' from all these methods was used to calculate the
final estimation of L. =56.6 cm and K=0.47 year' (Table V).
Fig. 3. Output of ELEFAN showing length frequency histograms and growth curves for Citharinus citharus citharus. Data collected during the length frequency sampling of fisherfoiks catches in Lake Kainji, Nigeria during 1998. Fish length is expressed in cm (length classes are 1 cm. wide).
Page: 137

Chapter 4
Sarotherodon galilaeus galilaeus
The number of small-sized fish in the length frequency sample of S. galilaeus increased from August 1998. This was assumed to represent the time of the main
spawning and was used as the starting point for plotting growth curves.
The value of L., obtained from the gill net trial data, was refined using ELEFAN
response surface analysis. Resulting values were L,,, =43.0 cm, K=0.41 year' (Fig. 4)
The scan of K values gave a higher estimate of K despite differing values of L,
used. The ELEFAN optimising routine gave an estimate of L,. =45.7 cm and K=0.47
year'.
Plotting the results from Shepard's scan of K values back onto the length frequency curve did not produce a better fit than the results from ELEFAN. The
results from ELEFAN response surface analysis were therefore used as the final
estimates.
Fig. 4. Output of ELEFAN showing length frequency histograms and growth curves for Sarotherodon galilaeus galilaeus. Data collected during the length frequency sampling of fisherfolks catches in Lake Kainji, Nigeria during 1998. Fish length is expressed in cm (length classes are 1 cm. wide).
Page: 138

Chapter 4
Oreochromis niloticus niloticus
Using estimates of L,,, obtained from the gill net trial data as initial inputs for
ELEFAN (Fig. 5) produced high values of L. and K for 0. niloticus.
ELEFAN's scan of K values agreed with these estimates but displayed a second
optima for Rn with a lower K value. Shepard's scan of K values also gave a lower
estimate for K, which was more realistic to cited values for the species. Final
estimates were L. =53.2 cm K=0.29 year' .
Fig. 5. Output of ELEFAN showing length frequency histograms and growth curves for Orechromis niloticus niloticus. Data collected during the length frequency sampling of fisherfolks catches in Lake Kainji, Nigeria during 1998. Fish length is expressed in cm (length classes are 1 cm. wide).
Hemisynodontis membranaceus
The length frequency distribution gave a clear depiction of the first, second and third year cohorts (Fig. 6). September was used as the starting point for the growth curve. Like many of the lake species the month corresponds to the peak spawning of the species due to the occurrence of the main flood at this time.
Page: 139
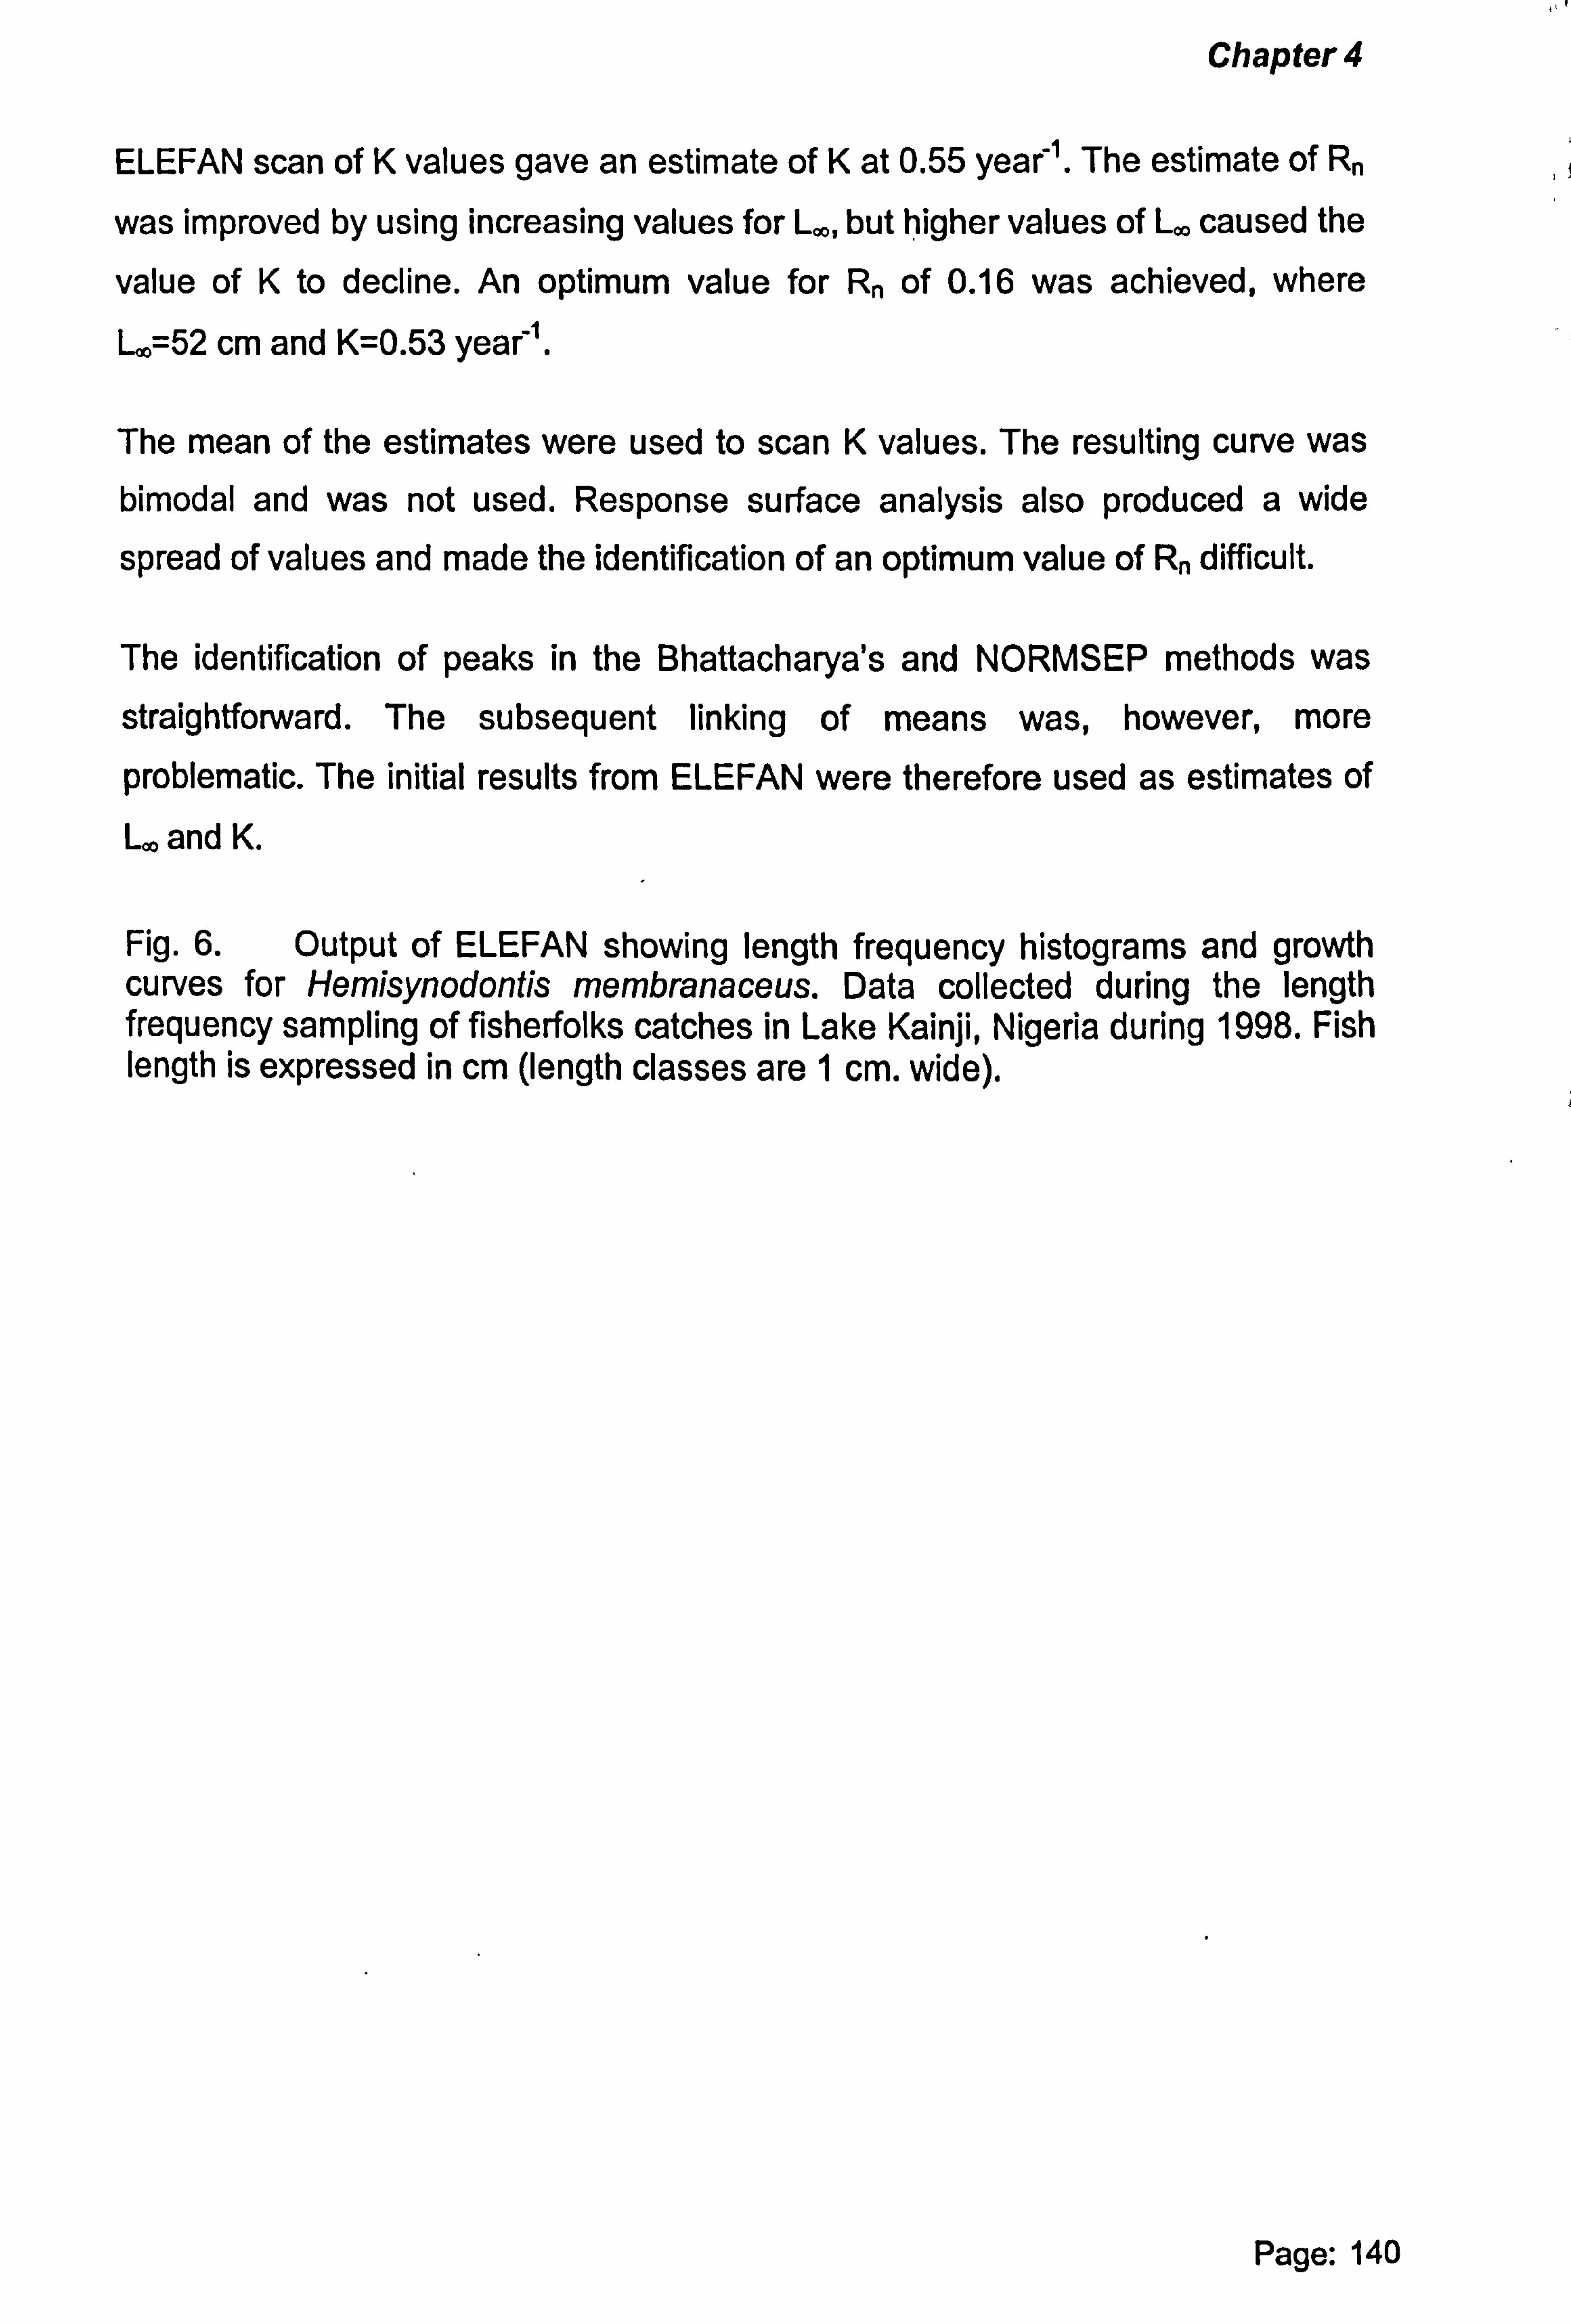
Chapter 4
ELEFAN scan of K values gave an estimate of K at 0.55 year'. The estimate of Rn
was improved by using increasing values for L., but higher values of L. caused the
value of K to decline. An optimum value for R� of 0.16 was achieved, where
L. =52 cm and K=0.53 year'.
The mean of the estimates were used to scan K values. The resulting curve was bimodal and was not used. Response surface analysis also produced a wide
spread of values and made the identification of an optimum value of Rn difficult.
The identification of peaks in the Bhattacharya's and NORMSEP methods was
straightforward. The subsequent linking of means was, however, more
problematic. The initial results from ELEFAN were therefore used as estimates of L. and K.
Fig. 6. Output of ELEFAN showing length frequency histograms and growth curves for Hemisynodontis membranaceus. Data collected during the length frequency sampling of fisherfolks catches in Lake Kainji, Nigeria during 1998. Fish length is expressed in cm (length classes are 1 cm. wide).
Page: 140
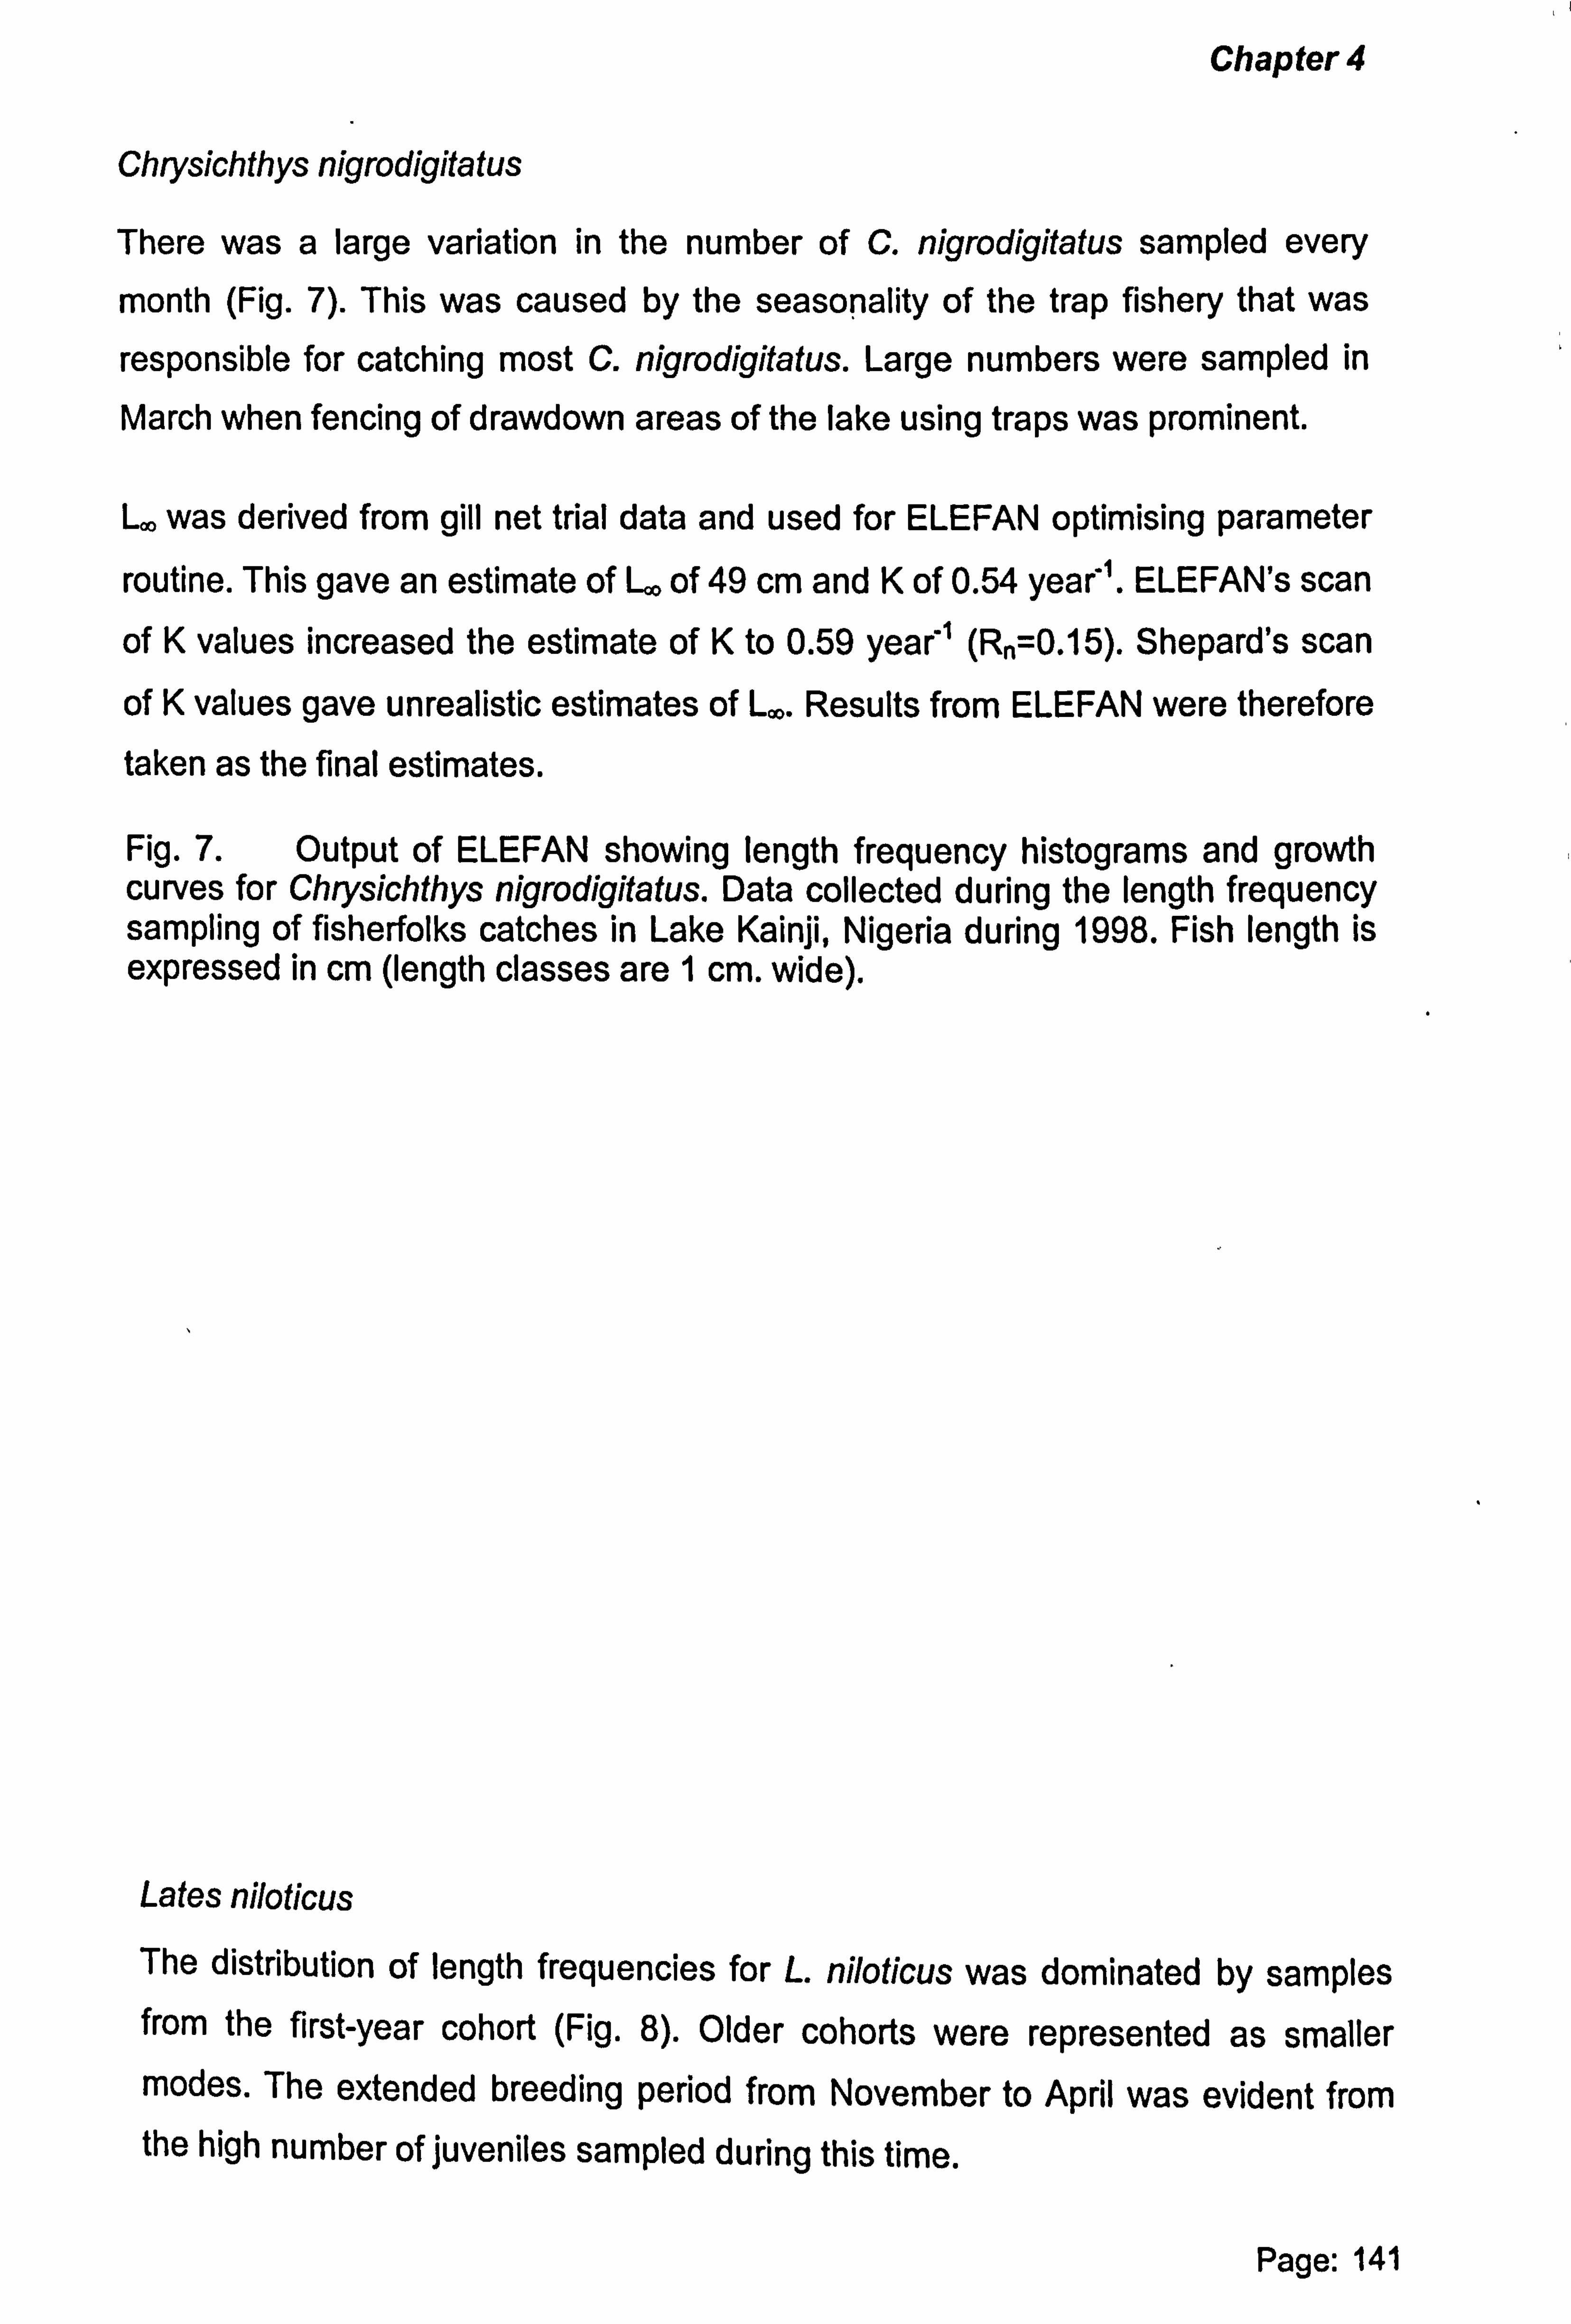
Chapter 4
Chrysichthys nigrodigitatus
There was a large variation in the number of C. nigrodigitatus sampled every
month (Fig. 7). This was caused by the seasonality of the trap fishery that was
responsible for catching most C. nigrodigitatus. Large numbers were sampled in
March when fencing of drawdown areas of the lake using traps was prominent.
L. was derived from gill net trial data and used for ELEFAN optimising parameter
routine. This gave an estimate of L. of 49 cm and K of 0.54 year'. ELEFAN's scan
of K values increased the estimate of K to 0.59 year' (R�=0.15). Shepard's scan
of K values gave unrealistic estimates of L. Results from ELEFAN were therefore
taken as the final estimates.
Fig. 7. Output of ELEFAN showing length frequency histograms and growth curves for Chrysichthys nigrodigitatus. Data collected during the length frequency sampling of fisherfolks catches in Lake Kainji, Nigeria during 1998. Fish length is expressed in cm (length classes are 1 cm. wide).
Lates niloticus The distribution of length frequencies for L. niloticus was dominated by samples from the first-year cohort (Fig. 8). Older cohorts were represented as smaller modes. The extended breeding period from November to April was evident from the high number of juveniles sampled during this time.
Page: 141

Chapter 4
ELEFAN's response surface analysis gave estimates of L. =155 cm and K=0.27 year'. ELEFAN's scan of K values produced similar estimates. The values
obtained from Shepard's scan of K values missed several observed peaks when
plotted and were not used.
Gulland and Holt and von Bertalanffy methods gave estimates that were similar to
those from ELEFAN. The K value, calculated from the mean 9', was taken as being representative of the population.
Fig. 8. Output of ELEFAN showing length frequency histograms and growth curves for Lates niloticus. Data collected during the length frequency sampling of fisherfolks catches in Lake Kainji, Nigeria during 1998. Fish length is expressed in cm (length classes are 1 cm. wide).
Page: 142

III
Chapter 4
Table V. Estimates of winter points (WP), amplitudes (C) and growth parameters (L. ,K and 0') of six main commercial species of the Lake Kainji fishery, Nigeria
using data collected during the sampling of length frequencies between September 1997 to December 1998. Lam=asymptotic fish length, K=growth rate, 6'=length-based index of growth performance. Mean annual water temperature=27.85°C.
Species WP C L. K 0' Method used (cm)
Citharinus 0.75 0.2 56.6 0.47 3.17 Mean 0' of ELEFAN, Shepards, Gulland and Holt, von Bertalanffy
cifharus plots
Sarotherodon 0.66 0.2 45.7 0.47 galilaeus
Oreochromis 0.66 0.2 53.2 0.29 niloticus
Hemisynodontis 0.25 0.2 52.0 0.53 membranaceus
Chrysichthys 0.25 0.2 49.0 0.53 nigrodigitatus
3.00 ELEFAN
2.92 Mean 9' of ELEFAN and Shepards
3.14 ELEFAN
3.10 ELEFAN
Lates niloticus 0.17 0.2 158.7 0.25 3.80 Mean 0' of ELEFAN, Gulland and Holt and von Bertalanffy
MORTALITY RATES
Values for total mortality (Z, see Table VI) varied between 1.39 year' (0. niloticus)
and 5.29 year' (C. nigrodigitatus) (Table VI).
In all cases, with the exception of 0. niloticus, the largest proportion of mortality
was caused by fishing mortality (F). For L. niloticus, C. nigrodigitatus and S. galilaeus, F accounted for about 80% of total mortality.
Estimates of fishing mortality varied more than natural mortality, from 0. niloticus (0.62 year) to C. nigrodigitatus (4.31 year'). Four of the six sample species had
values of F>3.0 year'.
Natural mortality (M) for most of the sampled species was high, commonly the
case with most tropical species. The value of M is a mean for all the cohorts of a
species and is therefore usually expected to be highest during the juvenile stages when the number of predators is large. This was the case for L. niloticus whose
adults have few predators and has a low overall value of M.
Page: 143
Chapter 4
The exploitation rate (E) was lowest for C. citharus and 0. niloticus and was high
for the remaining four species.
Table VI. Total (Z; year-'), natural (M; year) and fishing (F; year) mortality, rate of exploitation (E; year') and length at to (cm) estimated for six major species of Lake Kainji fishery, Nigeria using data collected during the sampling of length frequencies between September 1997 to December 1998 and a mean annual water temperature=27.85°C.
Species zr Cl Cl M M/K FE to
(yea(') (Z) (Z) (Z) (yea(') (yea(') (yea(') lower upper
Citharinus citharus 2.07 -0.946 1.81 2.33 0.90 1.91 1.17 0.56 -0.04
Sarotherodon galilaeus 4.86 -0.993 4.53 5.19 1.00 2.14 3.86 0.79 -0.30
Oreochromis niloticus 1.39 -0.885 1.15 1.64 0.72 2.48 0.67 0.48 -0.50
Hemisynodontis . 4.17 -0.947 3.32 5.01 0.97 1.87 3.20 0.76 -0.30 membranaceus
Chrysichthys nigrodigitatus 5.29 -0.990 4.96 5.62 0.98 1.85 4.31 0.81 -0.30
Laces niloticus 3.61 -0.861 2.75 4.47 0.49 1.96 3.12 0.86 0.24
DISCUSSION
The objective when sampling length frequencies of fish populations is to ensure
that the sampled frequency distribution of fish lengths mirrors that of the actual
population (Hoenig et al., 1987). To achieve this, methods of sampling of catch
and effort and length frequencies need to be carefully designed (Gulland &
Rosenberg, 1992). Gulland (1987) suggested that one way to help ensure that the
sample represents the natural population is to collect as many length frequency
samples as possible.
Sampling direct from landed fish catches helped ensure that a large number of fish
was measured (n - 250,000) at minimal expense for the six commercial species in
Lake Kainji. The lowest number was collected for L. niloticus. Pauly (1987)
recommended that larger sized fish, such as L. niloticus, require more samples due to the increased number of length classes needed. However, the average of 700 L. niloticus sampled every month is still considered adequate by Hoenig et al. (1987). Numbers of fish measured of the remaining five species were in excess of 1500 fish per month.
,i
ý'
Page: 144

Chapter 4
A further advantage of sampling from fish catches was that samples could be
raised to the total catch of each gear type. This helped ensure that fish from easily
sampled gears did not dominate the final sample. Separation, by gear type also
enabled later assessment of fishing patterns by gear (du Feu, 2003a).
A problem noted when sampling direct from catches was the possible bias caused by measuring fish from only those fisherfolk who were willing to cooperate. This
was also noted around Lake Victoria by Garrod (1963). In the case of Lake Kainji
the bias is likely to be small since the main reason that caused the fisherfolk not to
cooperate was the length of time taken to sample large catches. Large catches
were characterised by small fish, which were already well represented in the final
sample.
The large diversity of fishing methods (and mesh sizes) used in the Lake Kainji
fishery meant that a cross-section of fish sizes were caught and sampled. The
distribution of fish sizes sampled was compared with that obtained from sampling
using experimental fishing with graded fleets of gill nets. The comparison is limited
due to the small sample numbers obtained from the gill nets and the short three
month sampling period. The method did, however, provide an approximate cross
check of representation of the sample. Although both samples consisted of small
sized fish, there was some indication that the larger sized fish in the population were not adequately sampled using lengths recorded from fisherfolk's catches. This was due to the fisherfolk mainly using gears that targeted small-sized fish
within shallow waters and not fishing in deeper waters where the larger fished lived.
Final growth curves of all the species sampled were therefore mainly based on small-sized fish. Small-sized fish often have higher growth rates than larger sized fish. There is a likelihood therefore that the growth rate (K) may have been slightly overestimated for individual species. The dominance of young year class fish also meant that it was difficult to accurately calculate the value for L., which needs several year classes for projection. It was therefore necessary to verify values of La, from the length frequency sampling with the maximum fish sizes sampled during the historic gill net trial fishing.
Page: 145
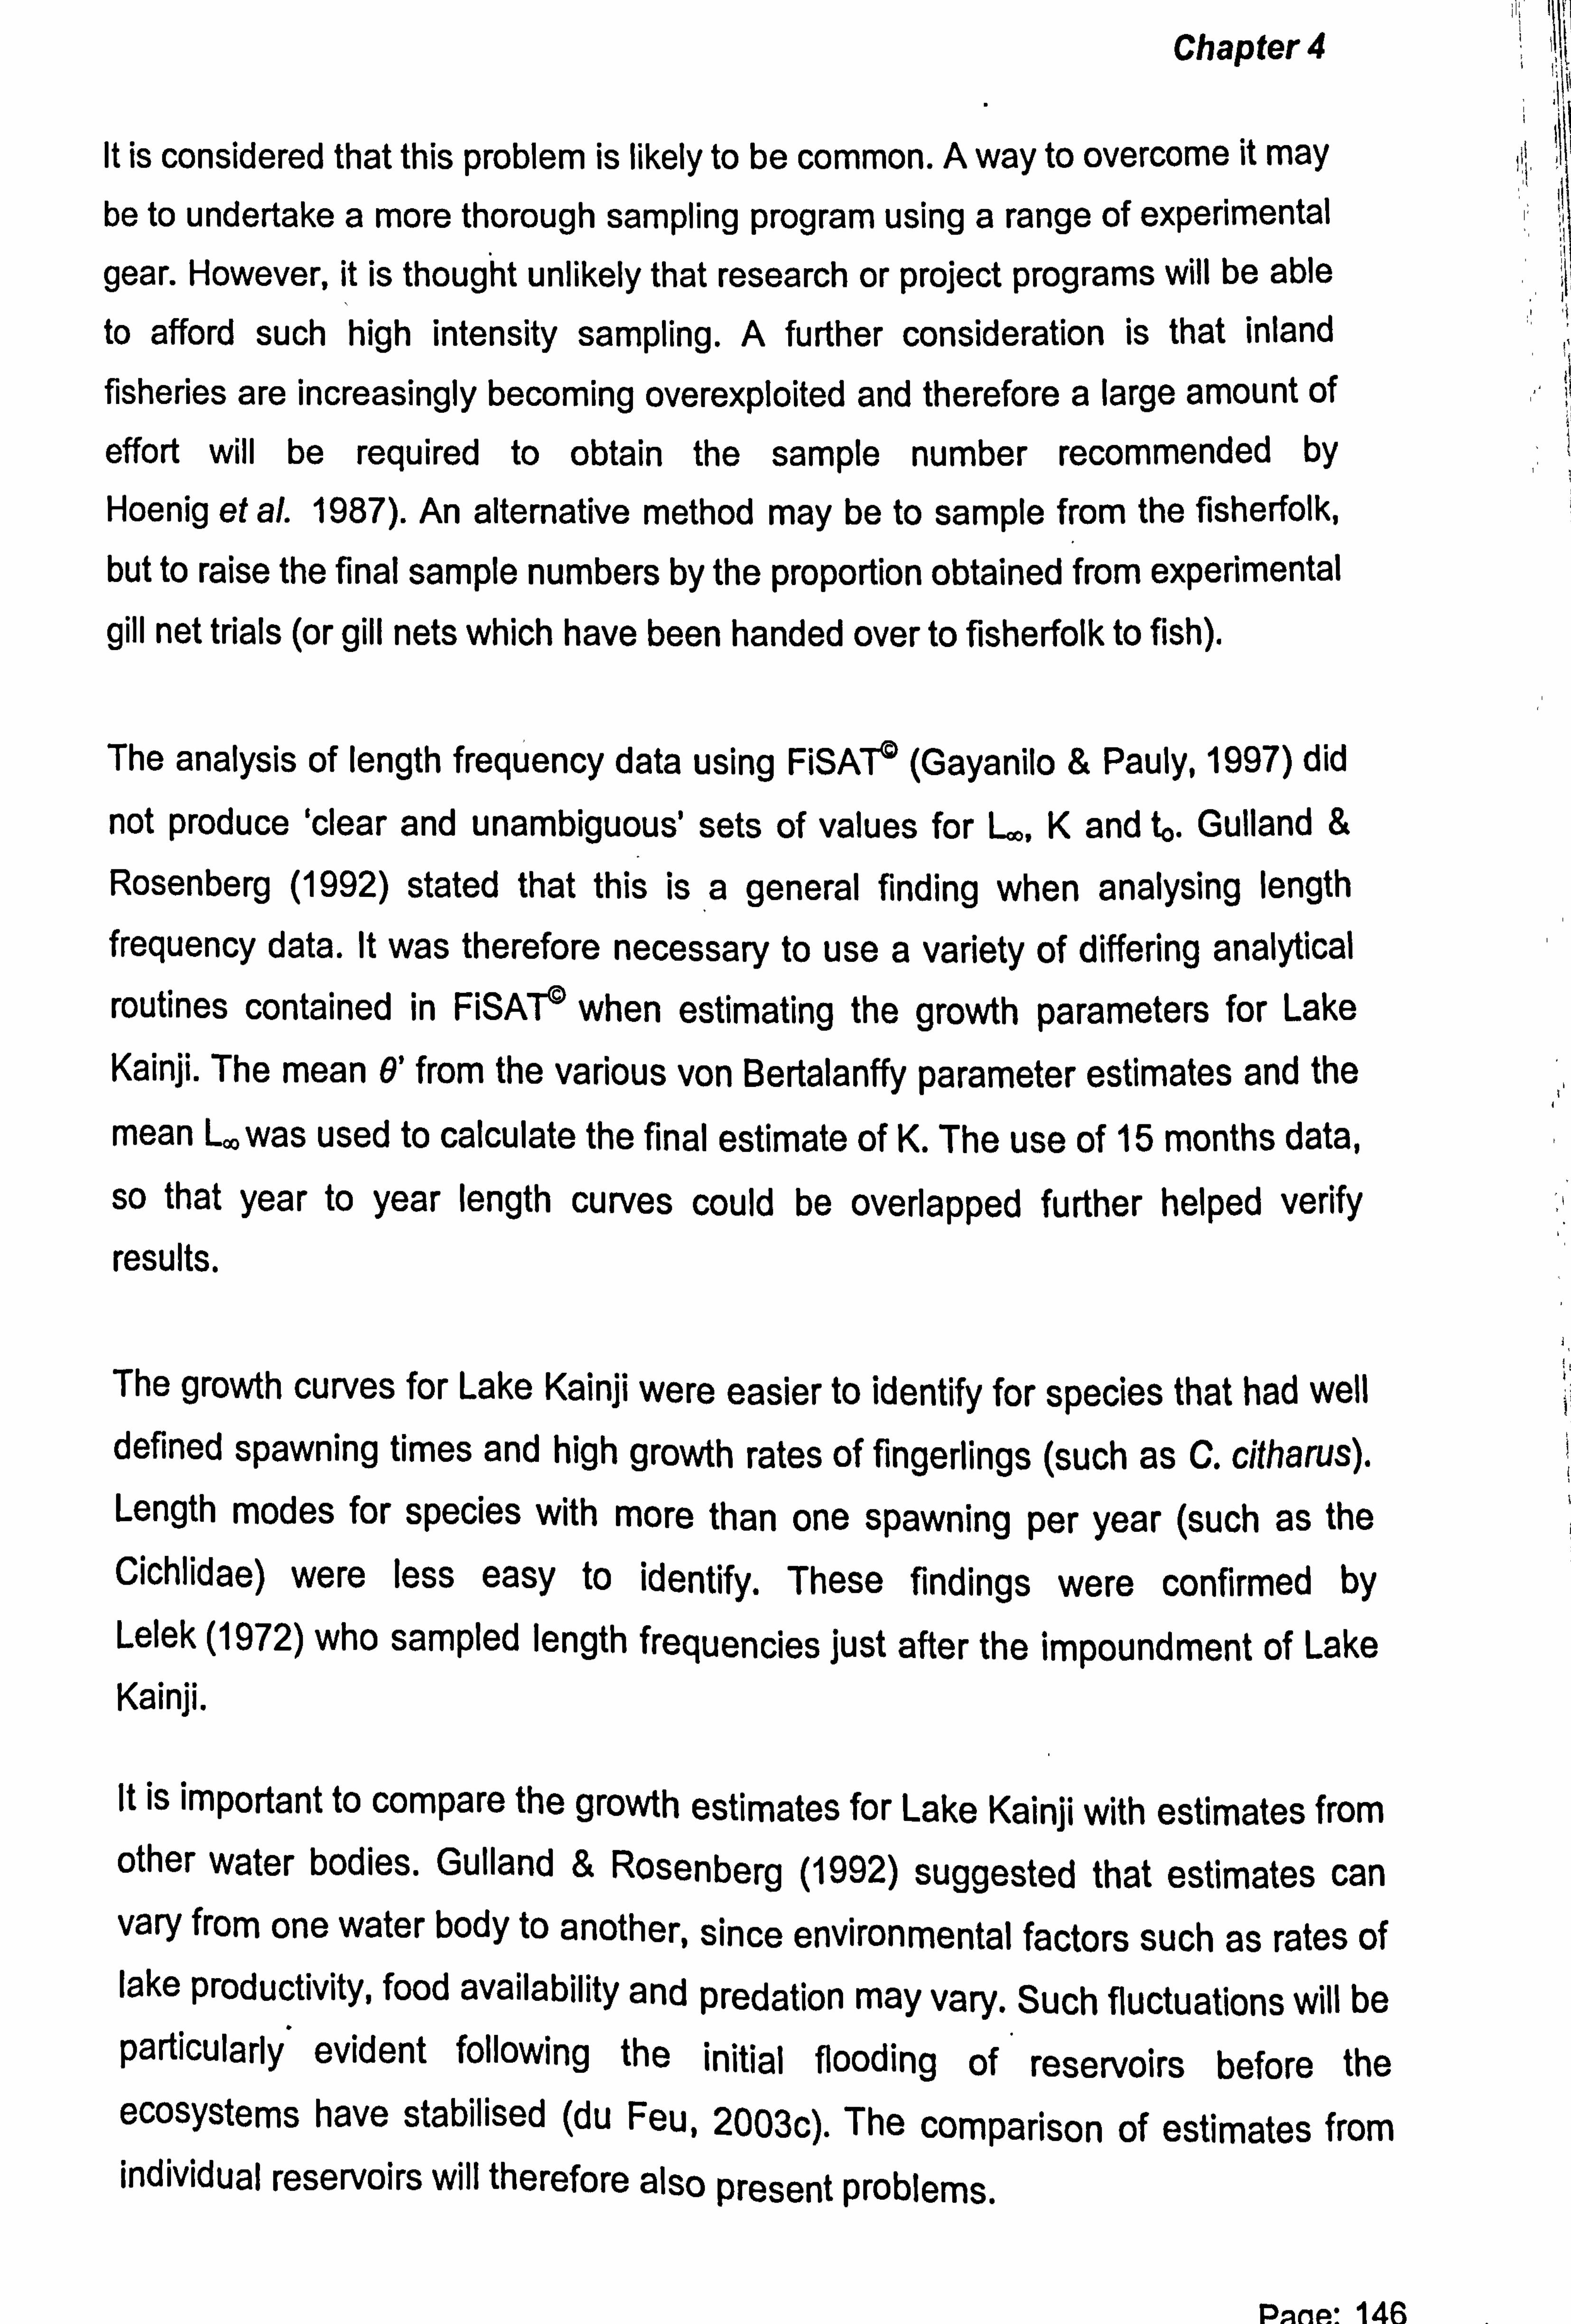
Chapter 4
It is considered that this problem is likely to be common. A way to overcome it may be to undertake a more thorough sampling program using a range of experimental
gear. However, it is thought unlikely that research or project programs will be able
to afford such high intensity sampling. A further consideration is that inland
fisheries are increasingly becoming overexploited and therefore a large amount of
effort will be required to obtain the sample number recommended by
Hoenig et a/. 1987). An alternative method may be to sample from the fisherfolk, but to raise the final sample numbers by the proportion obtained from experimental
gill net trials (or gill nets which have been handed over to fisherfolk to fish).
The analysis of length frequency data using FiSAT© (Gayanilo & Pauly, 1997) did
not produce 'clear and unambiguous' sets of values for L., K and to. Gulland &
Rosenberg (1992) stated that this is a general finding when analysing length frequency data. It was therefore necessary to use a variety of differing analytical routines contained in FiSAT© when estimating the growth parameters for Lake
Kainji. The mean 9' from the various von Bertalanffy parameter estimates and the
mean L. was used to calculate the final estimate of K. The use of 15 months data,
so that year to year length curves could be overlapped further helped verify results.
The growth curves for Lake Kainji were easier to identify for species that had well defined spawning times and high growth rates of fingerlings (such as C. citharus). Length modes for species with more than one spawning per year (such as the Cichlidae) were less easy to identify. These findings were confirmed by Lelek (1972) who sampled length frequencies just after the impoundment of Lake Kainji.
It is important to compare the growth estimates for Lake Kainji with estimates from other water bodies. Gulland & Rosenberg (1992) suggested that estimates can vary from one water body to another, since environmental factors such as rates of lake productivity, food availability and predation may vary. Such fluctuations will be particularly evident following the initial flooding of reservoirs before the ecosystems have stabilised (du Feu, 2003c). The comparison of estimates from individual reservoirs will therefore also present problems.
Panes' 14fi
Chapter 4
The length-weight relationships derived for three species in Lake Kainji were found
to agree with previous estimates from the reservoir. These were L. niloticus (Balogun, 1988), H. membranaceus (Willoughby, 1974) and C. nigrodigitatus (Ajayi, 1972).
The mean size of the first-year cohort of C. citharus was 20.5 cm in the
pre-impounded river fishery and was 25.0 cm in the early Lake Kainji fishery
(Imevbore & Okpo, 1975). In the present study the mean size was around 15.0 cm. The reduction might possibly have been caused by food not being as
abundant as it was during the initial lake flooding. It may also have been due to the
decreasing size of gear (such as mesh size) that targeted the upper length classes
of these cohorts. This was evident from the lower number of fish sampled within these classes (Appendix 1).
FishBase (Froese & Pauly, 2003) was used to compare the growth parameters and mortality estimates with records from other water bodies (Tables VII and VIII).
The computed growth rate (K) of C. citharus for Lake Kainji was slightly less than
values reported for Lake Chad in West Africa while estimates of L. were similar (Table VII). Estimates of natural mortality for Lake Chad were similar, however, fishing mortality of the species in the Lake Kainji fishery was slightly lower (Table VIII).
S. galilaeus appears to grow slightly larger in Lake Kainji, whilst the growth rate is
within the wide range of values reported elsewhere in Africa. Estimates of total
mortality were more than double the other values cited for reservoirs in West Africa.
Estimates of L., and K for 0. niloticus in Lake Kainji agreed with estimates from Lakes Victoria and Nasser and a small reservoir in Nigeria. Comparison of mortality estimates was not possible due to the small number of published estimates, however, it appears to be low for Lake Kainji.
Page: 147
Chapter 4
The value of L. for H. membranaceus agreed with the earlier estimate of the
species for Lake Kainji, but was higher than that cited for Lake Volta. Values for K,
fishing and total mortality (Z), however, were in agreement.
The estimate of L.,, for C. nigrodigitatus agreed with a previous estimate for Lake
Kainji by Ajayi (1972) and with estimates from Lake Volta. Growth rates of C. nigrodigitatus for Lake Kainji were slightly lower than those estimated for the
species from Lake Volta.
Values of L. and K for L. niloticus in Lake Kainji were in agreement with earlier
estimates from the reservoir using ageing by scales, back-calculated scales and length-frequency methods by Balogun (1988). Fishing and total mortality was higher than reported in Lake Victoria.
Length frequency studies of L. niloticus have mainly been performed in East Africa (Froese & Pauly, 2003). L. niloticus in Nigeria do not appear to grow as large as the species in East Africa. The calculated L, and the estimate by King (1997) for
the River Niger were lower than values cited for Lake Victoria by Asila & Ogari (1998). The calculated growth rates for Lake Kainji, however, appeared higher than that recorded for Lake Victoria.
Page: 148
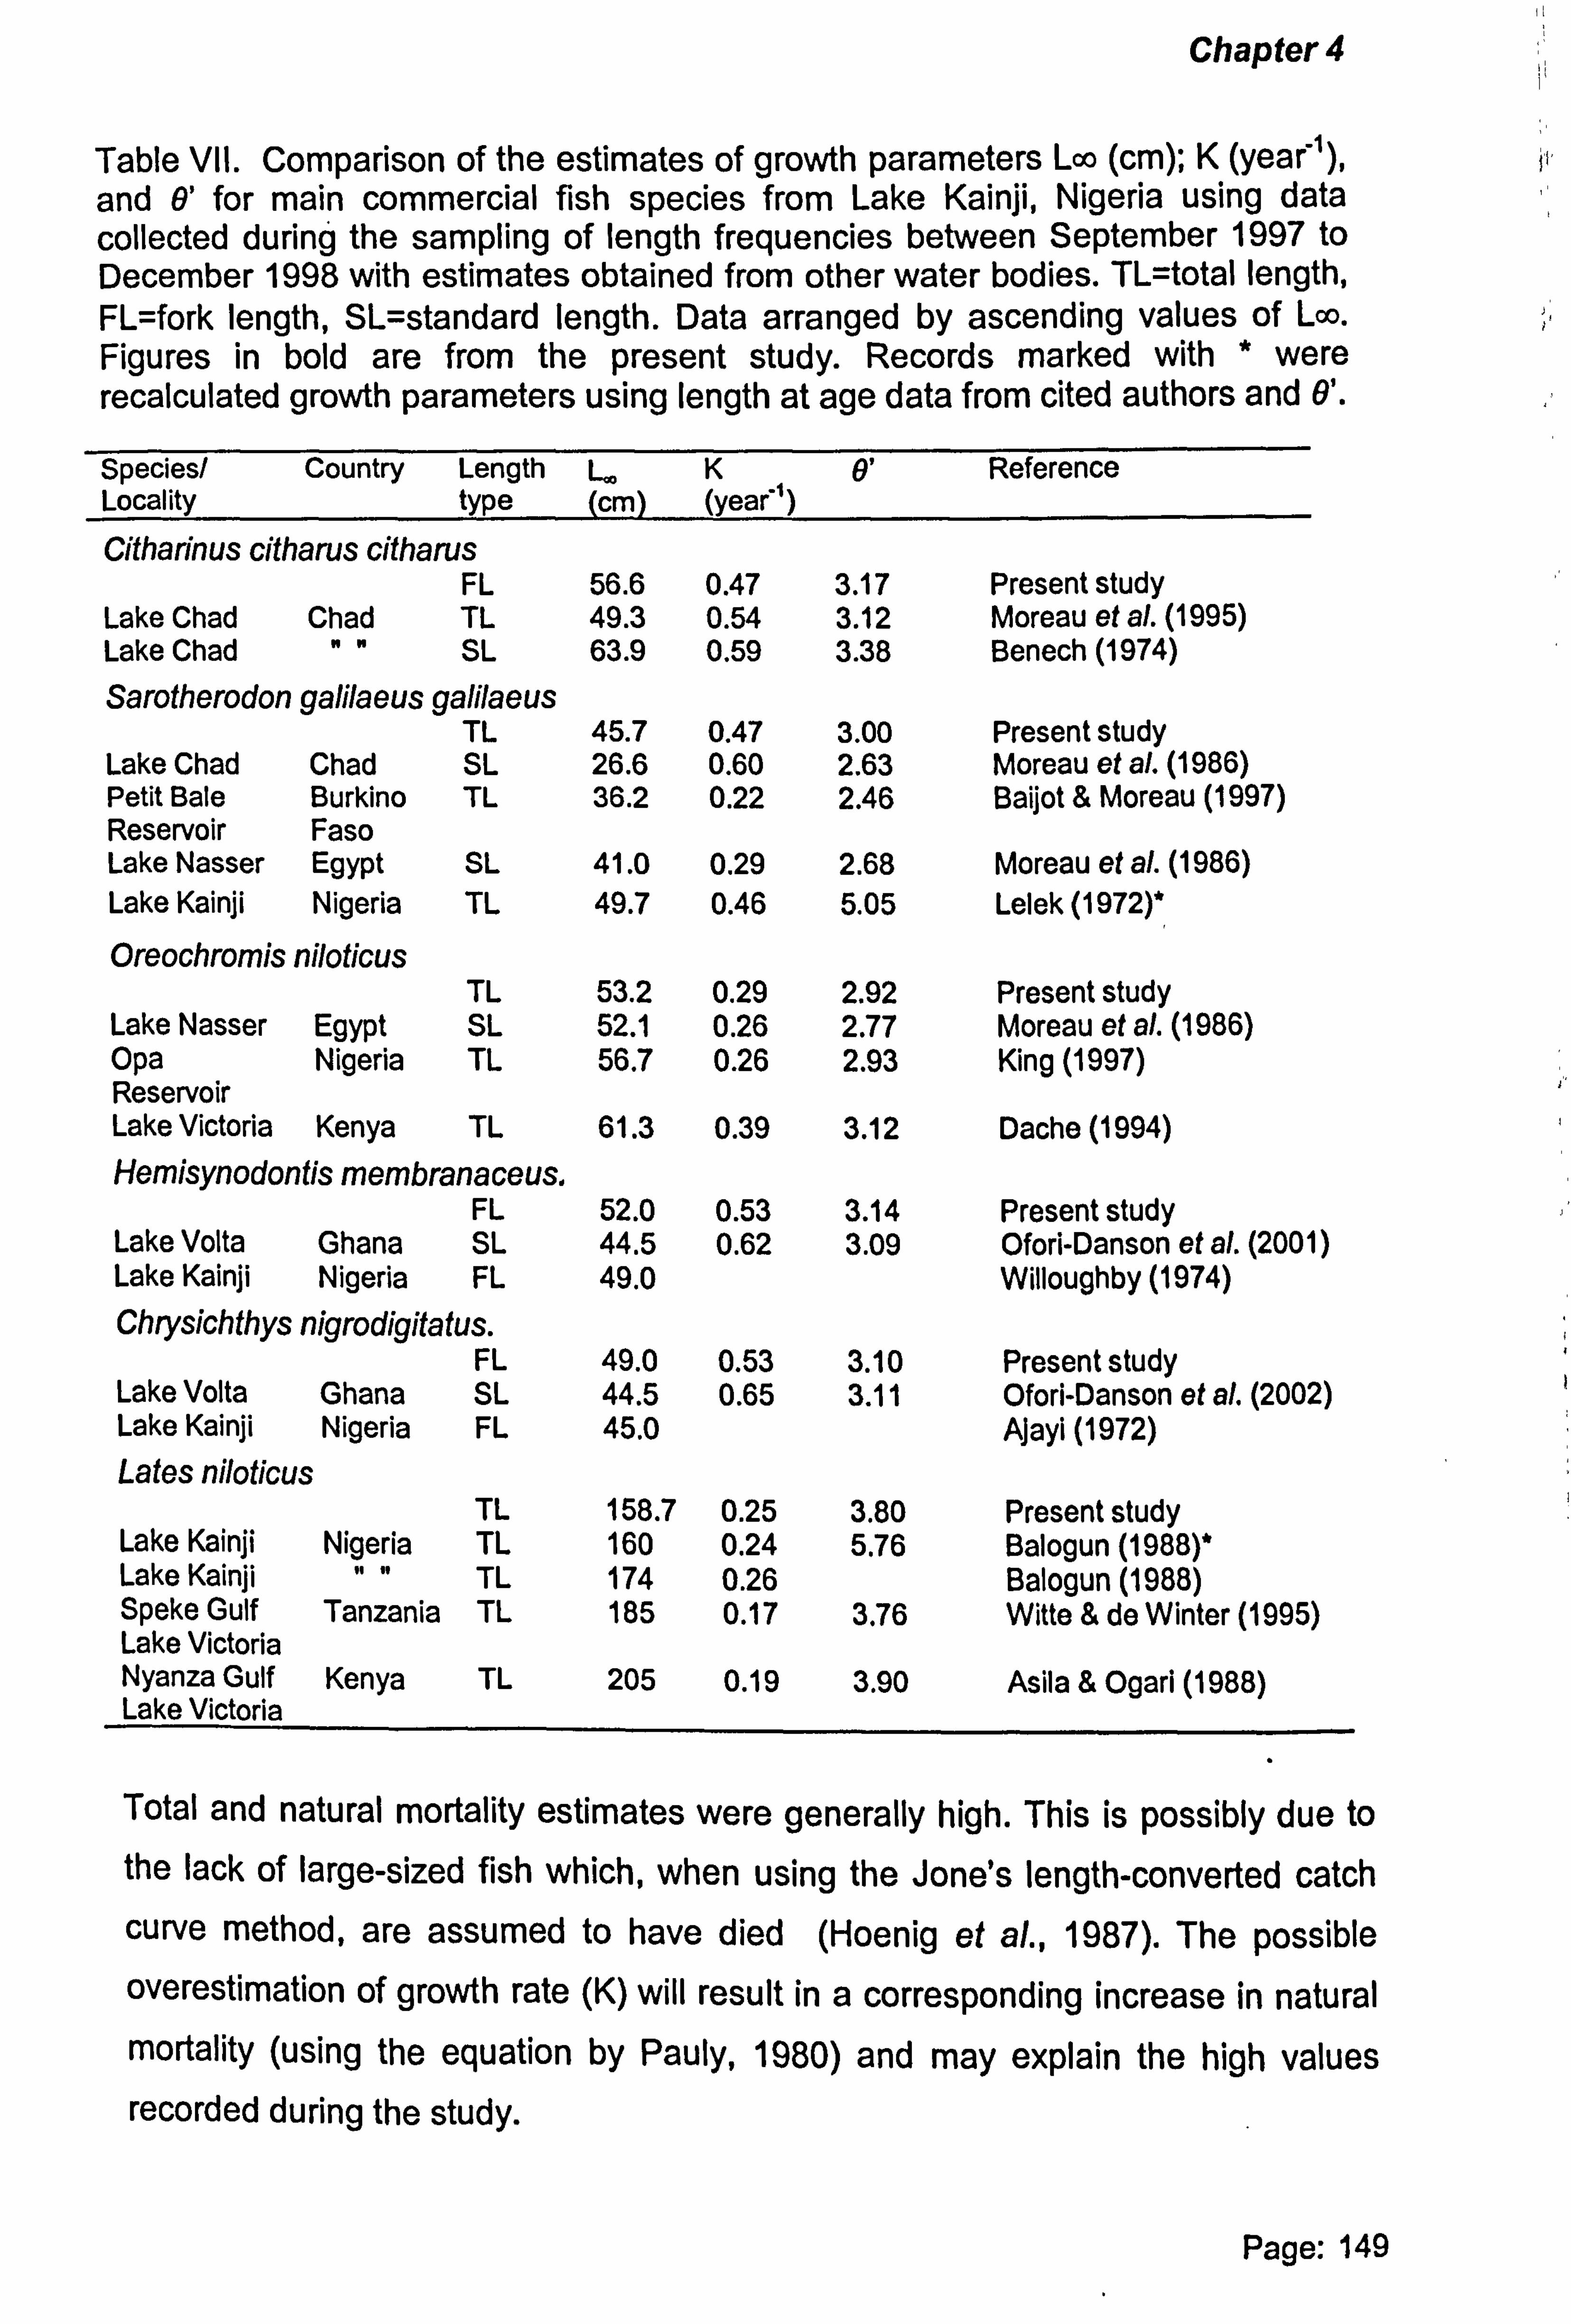
Chapter 4
Table VII. Comparison of the estimates of growth parameters Lco (cm); K (year'), and 0' for main commercial fish species from Lake Kainji, Nigeria using data collected during the sampling of length frequencies between September 1997 to December 1998 with estimates obtained from other water bodies. TL=total length, FL=fork length, SL=standard length. Data arranged by ascending values of Lao. Figures in bold are from the present study. Records marked with * were recalculated growth parameters using length at age data from cited authors and 0'.
Species/ Country Length L� K 0' Reference Locality type (cm) (year')
Citharinus citharus citharus FL 56.6 0.47 3.17 Present study
Lake Chad Chad TL 49.3 0.54 3.12 Moreau et al. (1995) Lake Chad "" SL 63.9 0.59 3.38 Benech (1974)
Sarotherodon galilaeus galilaeus TL 45.7 0.47 3.00 Present study
Lake Chad Chad SL 26.6 0.60 2.63 Moreau et a/. (1986) Petit Bale Burkino TL 36.2 0.22 2.46 Baijot & Moreau (1997) Reservoir Faso Lake Nasser Egypt SL 41.0 0.29 2.68 Moreau et al. (1986) Lake Kainji Nigeria TL 49.7 0.46 5.05 Lelek (1972)*
Oreochromis niloticus TL 53.2 0.29 2.92 Present study
Lake Nasser Egypt SL 52.1 0.26 2.77 Moreau et al. (1986) Opa Nigeria TL 56.7 0.26 2.93 King (1997) Reservoir Lake Victoria Kenya TL 61.3 0.39 3.12 Dache (1994) Hemisynodontis membranaceus.
FL 52.0 0.53 3.14 Present study Lake Volta Ghana SL 44.5 0.62 3.09 Ofori-Danson et al. (2001) Lake Kainji Nigeria FL 49.0 Willoughby (1974) Chrysichthys nigrodigitatus.
FL 49.0 0.53 3.10 Present study Lake Volta Ghana SL 44.5 0.65 3.11 Ofori-Danson et al. (2002) Lake Kainji Nigeria FL 45.0 Ajayi (1972)
Lates niloticus TL 158.7 0.25 3.80 Present study
Lake Kainji Nigeria TL 160 0.24 5.76 Balogun (1988)* Lake Kainji of to TL 174 0.26 Balogun (1988) Speke Gulf Tanzania TL 185 0.17 3,76 Witte & de Winter (1995) Lake Victoria Nyanza Gulf Kenya TL 205 0.19 3.90 Asila & Ogari (1988) Lake Victoria
Total and natural mortality estimates were generally high. This is possibly due to the lack of large-sized fish which, when using the Jone's length-converted catch curve method, are assumed to have died (Hoenig et al., 1987). The possible overestimation of growth rate (K) will result in a corresponding increase in natural mortality (using the equation by Pauly, 1980) and may explain the high values recorded during the study.
a`
Page: 149
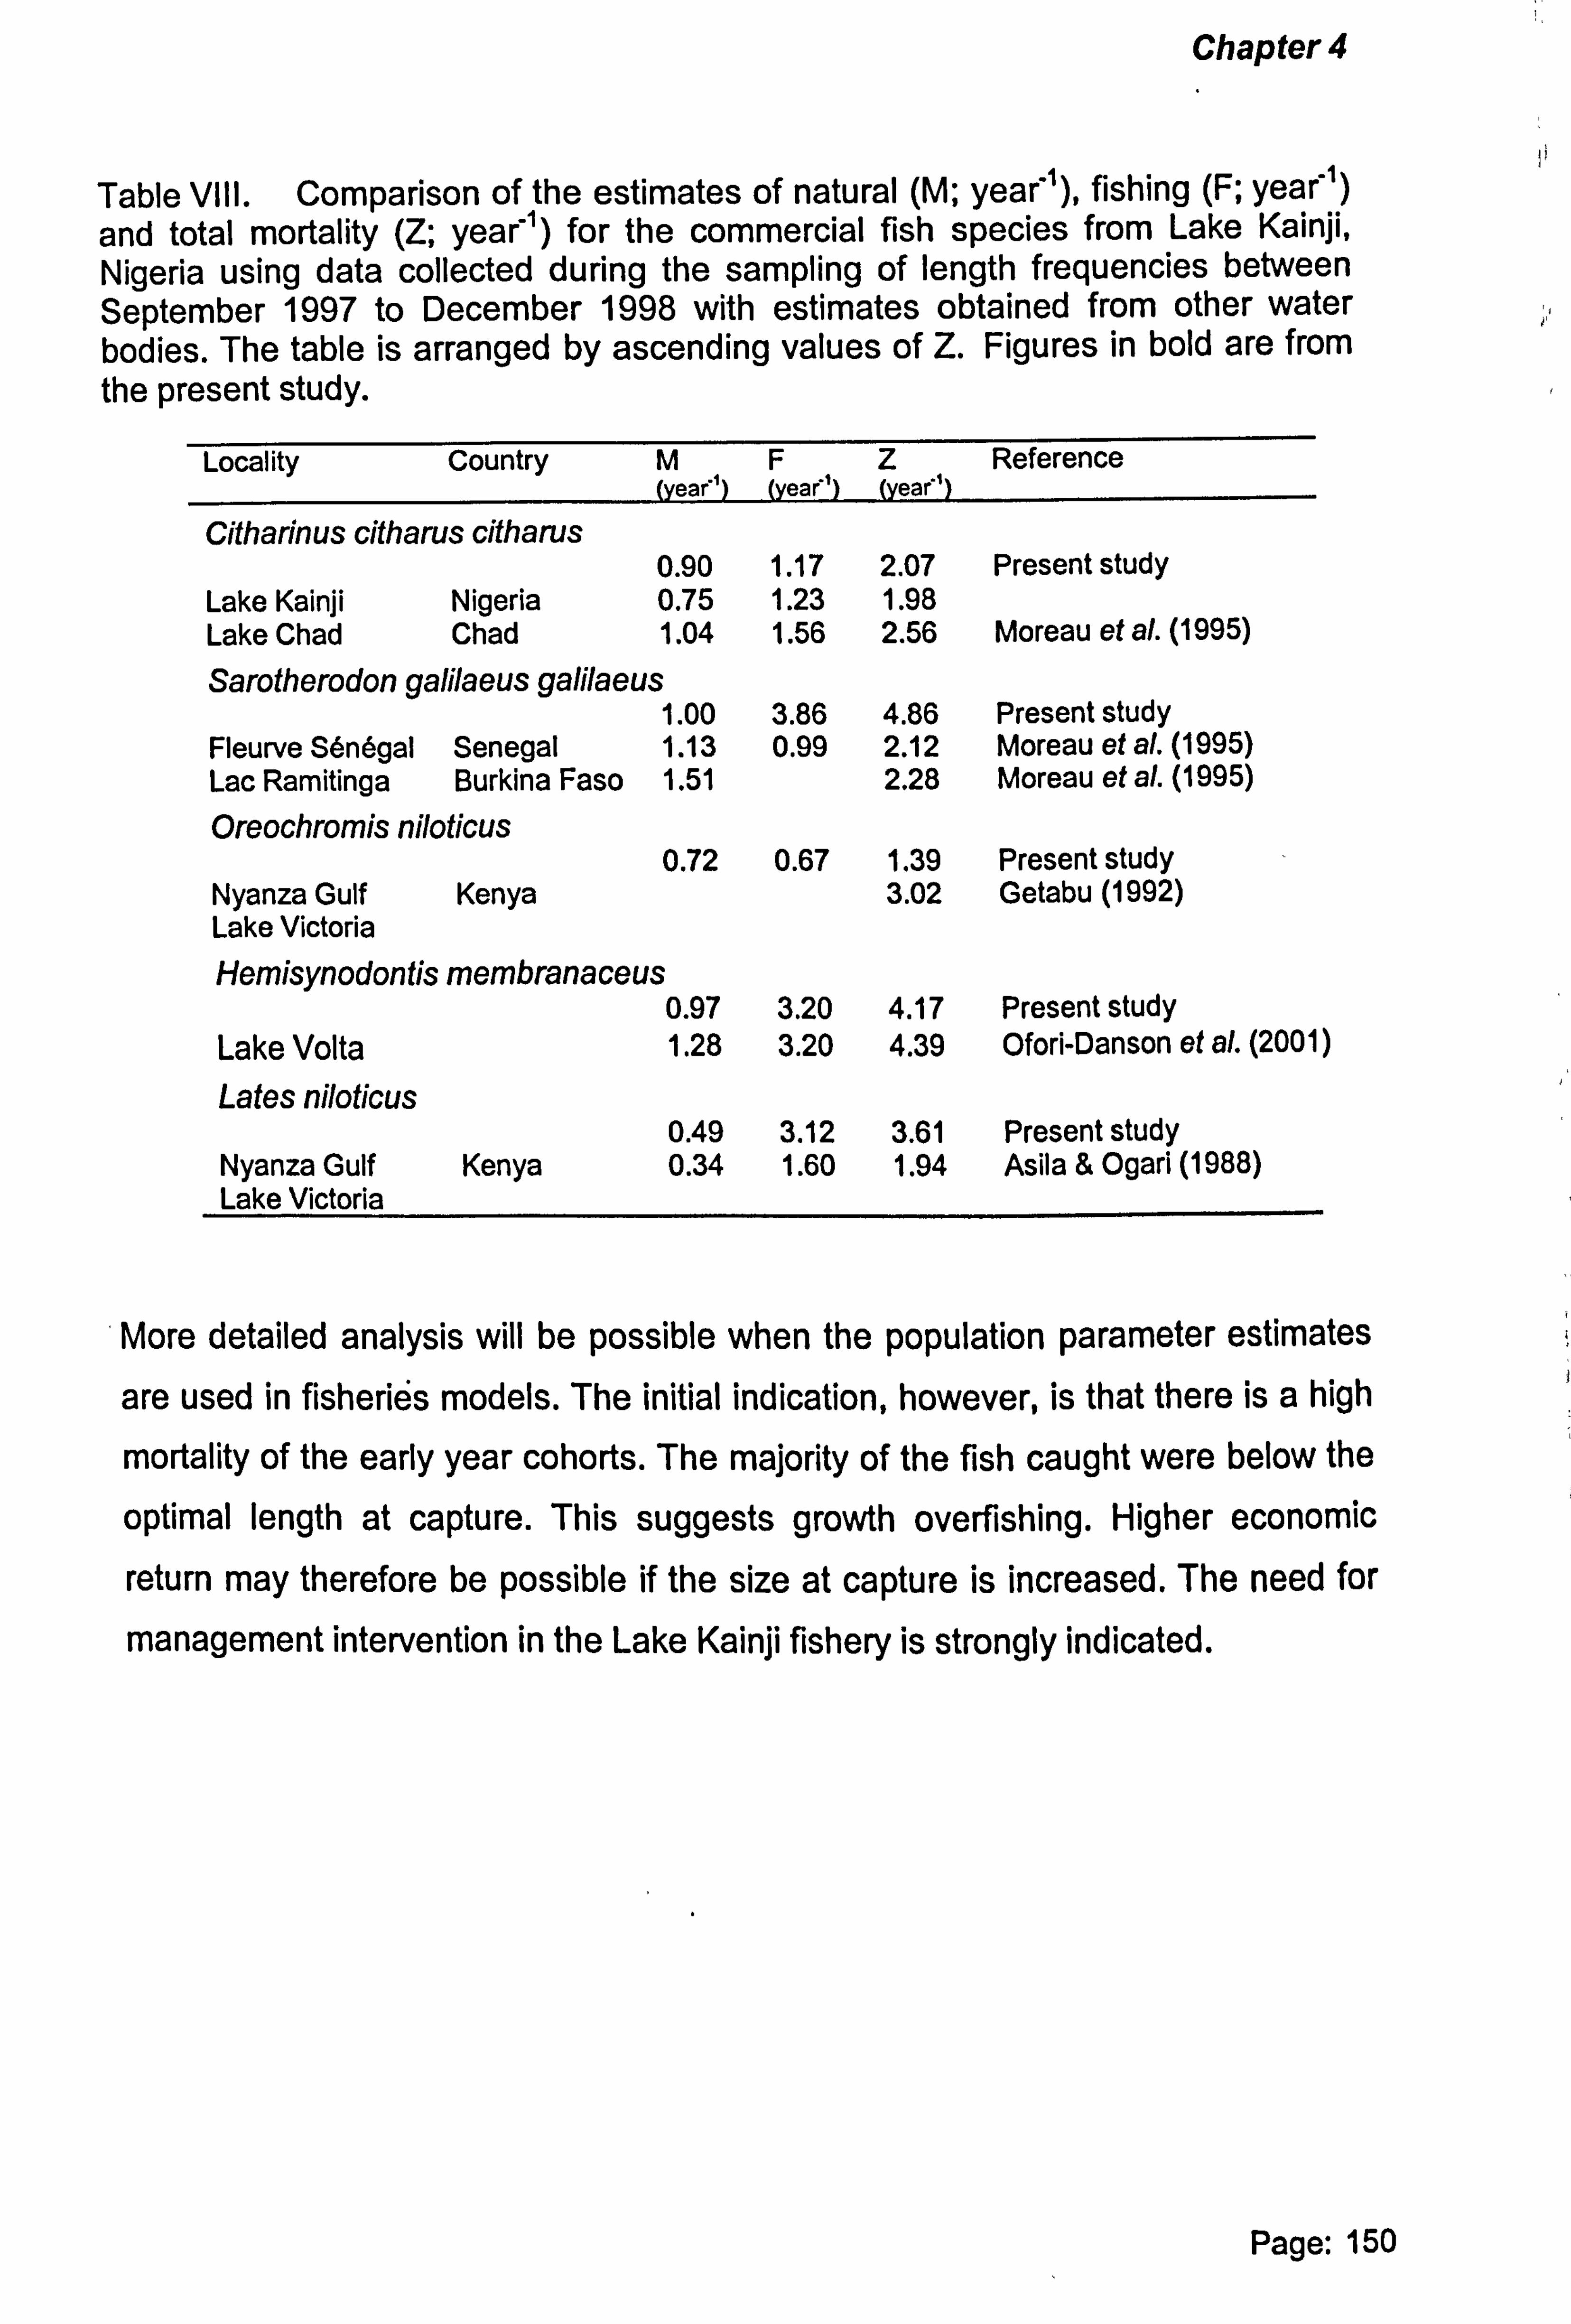
Chapter 4
Table VIII. Comparison of the estimates of natural (M; year'), fishing (F; year) and total mortality (Z; year) for the commercial fish species from Lake Kainji, Nigeria using data collected during the sampling of length frequencies between September 1997 to December 1998 with estimates obtained from other water bodies. The table is arranged by ascending values of Z. Figures in bold are from the present study.
Locality Country MFZ Reference (year) (year') (year')
Citharinus citharus citharus
Lake Kainji Nigeria Lake Chad Chad
0.90 1.17 2.07 0.75 1.23 1.98 1.04 1.56 2.56
Present study
Moreau et al. (1995)
Sarotherodon galilaeus galilaeus 1.00 3.86 4.86 Present study
Fleurve Senegal Senegal 1.13 0.99 2.12 Moreau et al. (1995) Lac Ramitinga Burkina Faso 1.51 2.28 Moreau et al. (1995)
Oreochromis niloticus 0.72 0.67 1.39 Present study
Nyanza Gulf Kenya 3.02 Getabu (1992) Lake Victoria
Hemisynodontis membranaceus 0.97 3.20 4.17 Present study
Lake Volta 1.28 3.20 4.39 Ofori-Danson et al. (2001)
Lates niloticus 0.49 3.12 3.61 Present study
Nyanza Gulf Kenya 0.34 1.60 1.94 Asila & Ogari (1988) Lake Victoria
More detailed analysis will be possible when the population parameter estimates
are used in fisheries models. The initial indication, however, is that there is a high
mortality of the early year cohorts. The majority of the fish caught were below the
optimal length at capture. This suggests growth overfishing. Higher economic
return may therefore be possible if the size at capture is increased. The need for
management intervention in the Lake Kainji fishery is strongly indicated.
Page: 150
Chapter 4
REFERENCES Ajayi, 0. (1972). Biological studies on the family Bagridae (Pisces: Siluridae) in Kainji
Lake, Nigeria. M. Phi! Thesis. University of Ife. 151 pp.
Asila, A. A. and Ogari, J. (1988). Growth parameters and mortality rates of Nile perch (Lates niloticus) estimated from length-frequency data in the Nyanza Gulf (Lake Victoria). FAO Fisheries Report. 389: 272-287.
Bagenal, T. B. [ed. ]. (1974). Ageing of fish. Proceedings of an international
symposium on the ageing of fish held at the Univ. of Reading, England. 19-20 July, 1973. Surrey, England. Unwin Bros. Ltd. 234pp.
Baijot, E. and Moreau, J. (1997). Biology and demographic status of the main fish
species in the reservoirs of Burkina Faso. In: Hydrobiological Aspects of Fisheries in Small Reservoirs in the Sahel region. (eds. E. Baijot, J. Moreau
and S. Bouda). Technical Center for Agricultural and Rural Cooperation ACP-EU, Wageningen, Netherlands: 79-110.
Balogun, J. K. (1988). The bio-ecology of the Nile Perch Lates niloticus (Linne) in Lake Kainji, Nigeria. PhD. Thesis. 284pp.
Banks, J. W., Holden, M. J. and McConnell, R. H. (1965). Fishery report. In: The First Report of the Kainji Biological Research Team. Liverpool. E. White (ed. ): 21-42.
Benech, V. (1974). Donnees sur la croissance de Citharinus citharus (Poisson Characiformes) dans le bassin tchadien. Cah. ORSTOM, ser. Hydrobiologia. 8. (1): 23-33.
Dache, S. A. O. (1994). Observations on the fisheries, growth and mortality rate of Oreochromis niloticus (Tilapia) in the Nyanza Gulf of Lake Victoria. In: Recent trends in research on Lake Victoria fisheries. (eds. E. E. Okemwa, E. O. Wakwabi and A. Getabu). Proc. 2nd EEC Regl. Sem. Recent Trends in Res. on Lake Victoria Fish., KMFRI, 25-27 Sept. 1991, Kisumu, Kenya: 59-65.
Page: 151
Chapter 4
du Feu, T. A. (2003a). Gaining a quick overview of Lake Kainji fishery, Nigeria: the
use of length frequency data. PhD. Thesis submitted to the University of
Hull, UK. Chapter 5: 156-179.
du Feu, T. A. (2003b). The changing fishery of Lake Kainji, Nigeria from
impoundment to some 30 years after. PhD. Thesis submitted to the
University of Hull, UK. Chapter 6: 180-228.
du Feu, T. A. (2003c). Review of tropical reservoir fisheries. PhD. Thesis submitted
to the University of Hull, UK. Chapter 1: 1-40.
Froese, R. & Binohlan, C. (2000). Empirical relationships to estimate asymptotic
length, length at first maturity and length at maximum yield per recruit in
fishes, with a simple method to evaluate length frequency data. Journal of
Fish Biology. 56. (4): 758-773.
Froese, R. and Pauly, D. [eds]. (2003). FishBase. World Wide Web electronic
publication. www. fishbase. org. August 2003.
Garrod, D. J. (1963). An estimation of the mortality rates in a population of Tilapia
esculenta Graham (Pisces,, Cichlidae) in Lake Victoria, East Africa. Journal
Fisheries Research Board of Canada. 20. (1): 195-227.
Gayanilo, F. C. and Pauly D. (1997). FAO-ICLARM stock assessment tools. (FiSAT).
Reference manual. FAO Computerised Information Series (Fisheries). No. 8.
Rome, FAQ. 262pp.
Getabu, A. (1992). Growth parameters and total mortality in Oreochromis niloticus (Linnaeus) from Nyanza Gulf, Lake Victoria. Hydrobiologia. 232. (1): 91-97.
Gulland, J. A. (1987). Length-based methods in fisheries research: from theory to
application. In: Length Based Methods in Fisheries Research. (eds. D. Pauly
and R. G. Morgan). ICLARM Conference Proceedings. 13: 335-342.
Page: 152
Chapter 4
Gulland, J. A. and Rosenberg, A. A. (1992). A review of length-based approaches to
assessing fish stocks. FAO Fisheries Technical Paper. No. 323. Rome,
FAO. 100pp.
Hassleband, V. (1966). Estimation of parameters for a mixture of normal
distributions. Technometrics. 8: 431-444.
Hoenig. J. M., Csirke, J., Sanders, M. J., Abella, A., Andreoli, M. G., Levi, D.,
Ragonese, S., Al-Shoushani, M and M. M. EI-Musa. (1987). Data acquisition
for length-based stock assessment. In: Length Based Methods in Fisheries
Research. (eds. D. Pauly and R. G. Morgan). ICLARM Conf. Proc. 13:
343-352.
Imevbore, A. M. A and Okpo, W. S. (1975). Aspects of the biology of the Kainji Lake
Fishers. In: The Ecology of Lake Kainji, the Transition from River to Lake.
(eds. A. M. A. Imevbore and 0. S. Adegoke). Ile-Ife, Nigeria, University of Ife
Press: 163-178.
King, R. P. (1997). Growth performance of Nigerian fish stocks. Naga, ICLARM
Quarterly. 20 (2): 31-35.
Lelek, A. (1972). Fish populations of Kainji Lake: trends in their development and
utilisation. F1: SFINIR 24 Technical Report. 2.121 pp.
Lohr. S. L. (1999). Sampling design and analysis. Brooks/Cole Publishing Company,
Pacific Grove, California 93950, USA. ISBN 0 534 35361 4.494pp.
Mbagwu, I. G. and Adeniji, A. (1994). A Review of the studies on the limnology of Kainji Lake. An internal report of the Kainji Lake Fisheries Promotion Project.
GTZ, Eschborn, Germany. 31 pp.
Moreau, J., Palomares, M. L. D., Torres, F. S. B. and Pauly, D. (1995). Atlas
demographique des populations de poissons d'eau douce d'Afrique. ICLARM Technical Report. 45.140pp.
Page: 153
Chapter 4
Moreau, J., Bambino, C. and Pauly, D. (1986). Indices of overall growth performance
of 100 tilapia (Cichlidae) populations. In: The First Asian Fisheries Forum.
(eds. J. L. Maclean, L. B. Dizon and L. V. Hosillos). Asians Fisheries Society,
Manila, Philippines: 201-206.
Ofori-Danson, P. K., Vanderpuye, C. J. and de Graaf, C. J. (2001). Growth and
mortality of the catfish Hemisynodontis membranaceus (Geoffroy St. Hilaire),
in the northern arm of Lake Volta, Ghana. Fisheries Management and
Ecology, 8: 37-45.
Ofori-Danson, P. K., de Graaf, G. J. and Vanderpuye, C. J. (2002). Population
parameter estimates for Chrysichthys auratus and C. nigrodigitatus (Pisces:
Claroteidae) in Lake Volta, Ghana. Fisheries Research. 54. (2): 267-277.
Omorinkoba, W. S. O. and du Feu, T. A. (1994). The identification of breeding grounds
of the commercially important fish species in Lake Kainji. National Institute
for Fresh water Fisheries Research (NIFFR), Annual Report. 1994. ISSN
03319296: 48-53.
Pauly, D. (1980). On the interrelationships between natural mortality, growth
parameters and mean environmental temperature in 175 fish stocks. Journal
du Conseil international pour ! 'Exploration de la Mer. 39. (3): 175-192.
Pauly, D. (1987). Studying single-species dynamics in a tropical multispecies
context. In: Theory and management of tropical fisheries. (eds. D. Pauly and G. I. Murphy). ICLARM Conference Proceedings 9: 33-65.
Pauly, D. & J. L. Munro. (1984). Once more on the comparison of growth in fish and invertebrates. ICLARM Fishbyte, 2, (1). 21 pp.
Pauly, D., Soriano-Bartz, M. L. and Palomares, M. L. D. (1993). Improved construction, parametrization and interpretation of steady-state ecosystem models. In: Trophic Models of Aquatic Ecosystems. (eds. V. Christensen and D. Pauly). ICLARM Conference Proceedings. 26: 1-13.
Page: 154
Chapter 4
Sparre, P., Ursin, E. and Venema, S. C. (1989). Introduction to tropical fish stock
assessment. Part 1. Manual. FAO Fisheries Technical Paper. No. 306.1.
337pp.
Willoughby, N. G. (1974). The ecology of the genus Synodontis (Pisces: Siluridei) in
Lake Kainji, Nigeria. PhD. Thesis, Southampton University. 288pp.
Witte, F. and de Winter, W. (1995). Appendix II. Biology of the major fish species of Lake Victoria. In: Fish Stocks and Fisheries of Lake Victoria. A Handbook for
Field Observations. (eds. F. Witte and W. L. T. Van Densen). Samara Publishing Limited, Dyfed, Great Britain: 301-320.
World Bank. (1992). A study of international fisheries research. Policy and Research Series no. 19.
Page: 155

Chapter 5
Chapter 5
A previous version of this chapter has been accepted for publication in:
du Feu, T. 2003. Gaining a quick overview of Lake Kainji fishery, Nigeria: the use of length frequency data, In: D. Pauly, T. Diouf, B. Samb, M. J. Vakily and M. L. D. Palomares (Editors) Fish Biodiversity: Local Studies as Basis for Global Inferences. ACP-EU Fisheries Research Report. ACP-EU Fisheries Research Initiative. Brussels.
Gaining a quick overview of the Lake Kainji fishery,
Nigeria: the use of length frequency data.
ABSTRACT
The assessment of tropical fisheries using surplus yield or dynamic pool models usually
requires complex and long-term data. Length distribution histograms of fish maybe used
as an alternative method as it offers a quick and easily understood portrayal of the
distribution of fish size caught. The length distributions can be compared with lengths of
optimal capture, maturity and asymptotic fish length. This comparative method was used to investigate the length frequency data of the three main commercial fish species of the
man-made reservoir, Lake Kainji, Nigeria, collected some 30 years after its creation. Length frequency histograms are presented for total catch for a 12-month sampling period
and for the catch by month and gear type. Results indicate that the catch of all three fish
species mainly consisted of the first-year cohort. Almost all fish were caught below their
optimal size at capture and length at maturity. The beach seine fishery was responsible for the highest mortality of juvenile fish, particularly of the Characoid, Citharinus citharus. Small meshed cast nets also caught many undersized fish, as did the widely used 25 mm mesh nylon twined gill nets. The situation is considered to be potentially damaging to a sustainable fishery. Given the high growth rates of juveniles, it is proposed that the fishery
would provide a higher economic return if the mean size at capture was raised.
Key words: Lake Kainji; length frequency sampling; overfishing; reservoir fishery; size at capture; yield per recruit analysis.
Page: 156
Chapter 5
INTRODUCTION
National authorities and administrators of development projects can underestimate the time needed to undertake proper fisheries assessment. It is often assumed that fisheries managers can quickly identify fishery management problems and their required solutions. However, this is frequently not the case. Managers rarely have sufficient time or quality data on which to base their decisions (Cowx, 1991;
Verheust, 1998). Time must therefore be devoted to data collection activities.
The data sought usually include regular counts of the total number of existing gears, as well as, routine measurements of catch and effort. In tropical reservoir fisheries such data are often expensive to collect from highly diversified fisheries
and inaccessible villages (Entz, 1984; De Silva, 1988). A further problem is that a long-time series of data is needed to determine trends. Government institutions
are often unable to afford or justify expensive and long-term data collection.
The reservoir fishery of Lake Kainji, Nigeria is a typical example. A joint
co-operation project, the 'Nigerian-German Kainji Lake Fisheries Promotion Project', commenced in 1993. The project objective was to design and implement
a management plan for the reservoir fishery. The problem was that limited fisheries data had been collected for fifteen years. Monitoring of the fishery was therefore started as early as possible. Training of data recorders and enlightenment of fisherfolk meant that obtaining reliable data took time. Time was also needed to assemble the time series of data required by fisheries models.
A further problem, which is unique to reservoir fisheries, is that the aquatic environment and the fishery change as the reservoir gets older and stabilises. It is therefore often difficult to identify reliable trends in the fishery. Sparre & Venema (1992) noted that such changes cause problems when using fisheries assessment tools, such as surplus yield or dynamic yield models, which require that the fishery is stable. Fisheries managers can therefore often be confronted with the dilemma of having to design or implement management plans without fully understanding the fishery. There is thus a need to identify other assessment methods by which a quicker and perhaps less costly understanding of the fishery can be gained.
Page: 157

Chapter 5
Using fish lengths to depict the total catch is one such method. This represents an
alternative use of length frequency data which are usually collected in order to
estimate population parameters of fish species. This contribution presents a
method using quick and easily understandable pictorial representation of the
composition of fish catch using fish length measurements as a first indicator of
overfishing. In the same manner, length frequency measurements by gear type
are used to indicate the number and size of fish caught, as well as, the fishing
methods responsible and the months when catches of undersized fish occurred.
These are compared with the size at maturity, optimal lengths of capture and
asymptotic fish lengths. Yield per recruit analysis is used to show the relationship between optimal and actual levels of fishing effort. This methodology was
explained during a training course on strengthening of fisheries and biodiversity
management in Africa, Caribbean and Pacific (ACP) countries held in Kenya in
23 August to 3 September 1999 and organised by ICLARM as part of the ACP-EU
Fisheries Research Initiatives (see Froese and Binohlan, 2000).
This method, which uses easily understandable graphs depicting the patterns of fishing, was useful for the Lake Kainji fishery. It gave an early indicator of fishing
patterns prior to the results of the catch assessment survey becoming available. It
is hoped that this contribution will be useful to managers of other water bodies
where quick overviews of the fishery are required.
MATERIALS AND METHODS The total weight and numbers of fish caught, and mean size at capture by species, as well as the gear measurements for the Lake Kainji fishery between 1995 and 2000 were obtained from monthly sampling of catch and effort (catch assessment survey) (du Feu, 2003a). Fishing activity (proportion of gears owned that went fishing) and fish catch (average Kg of fish caught per 24 hours per gear) was sampled for two days every month in fifteen villages.
Page: 158
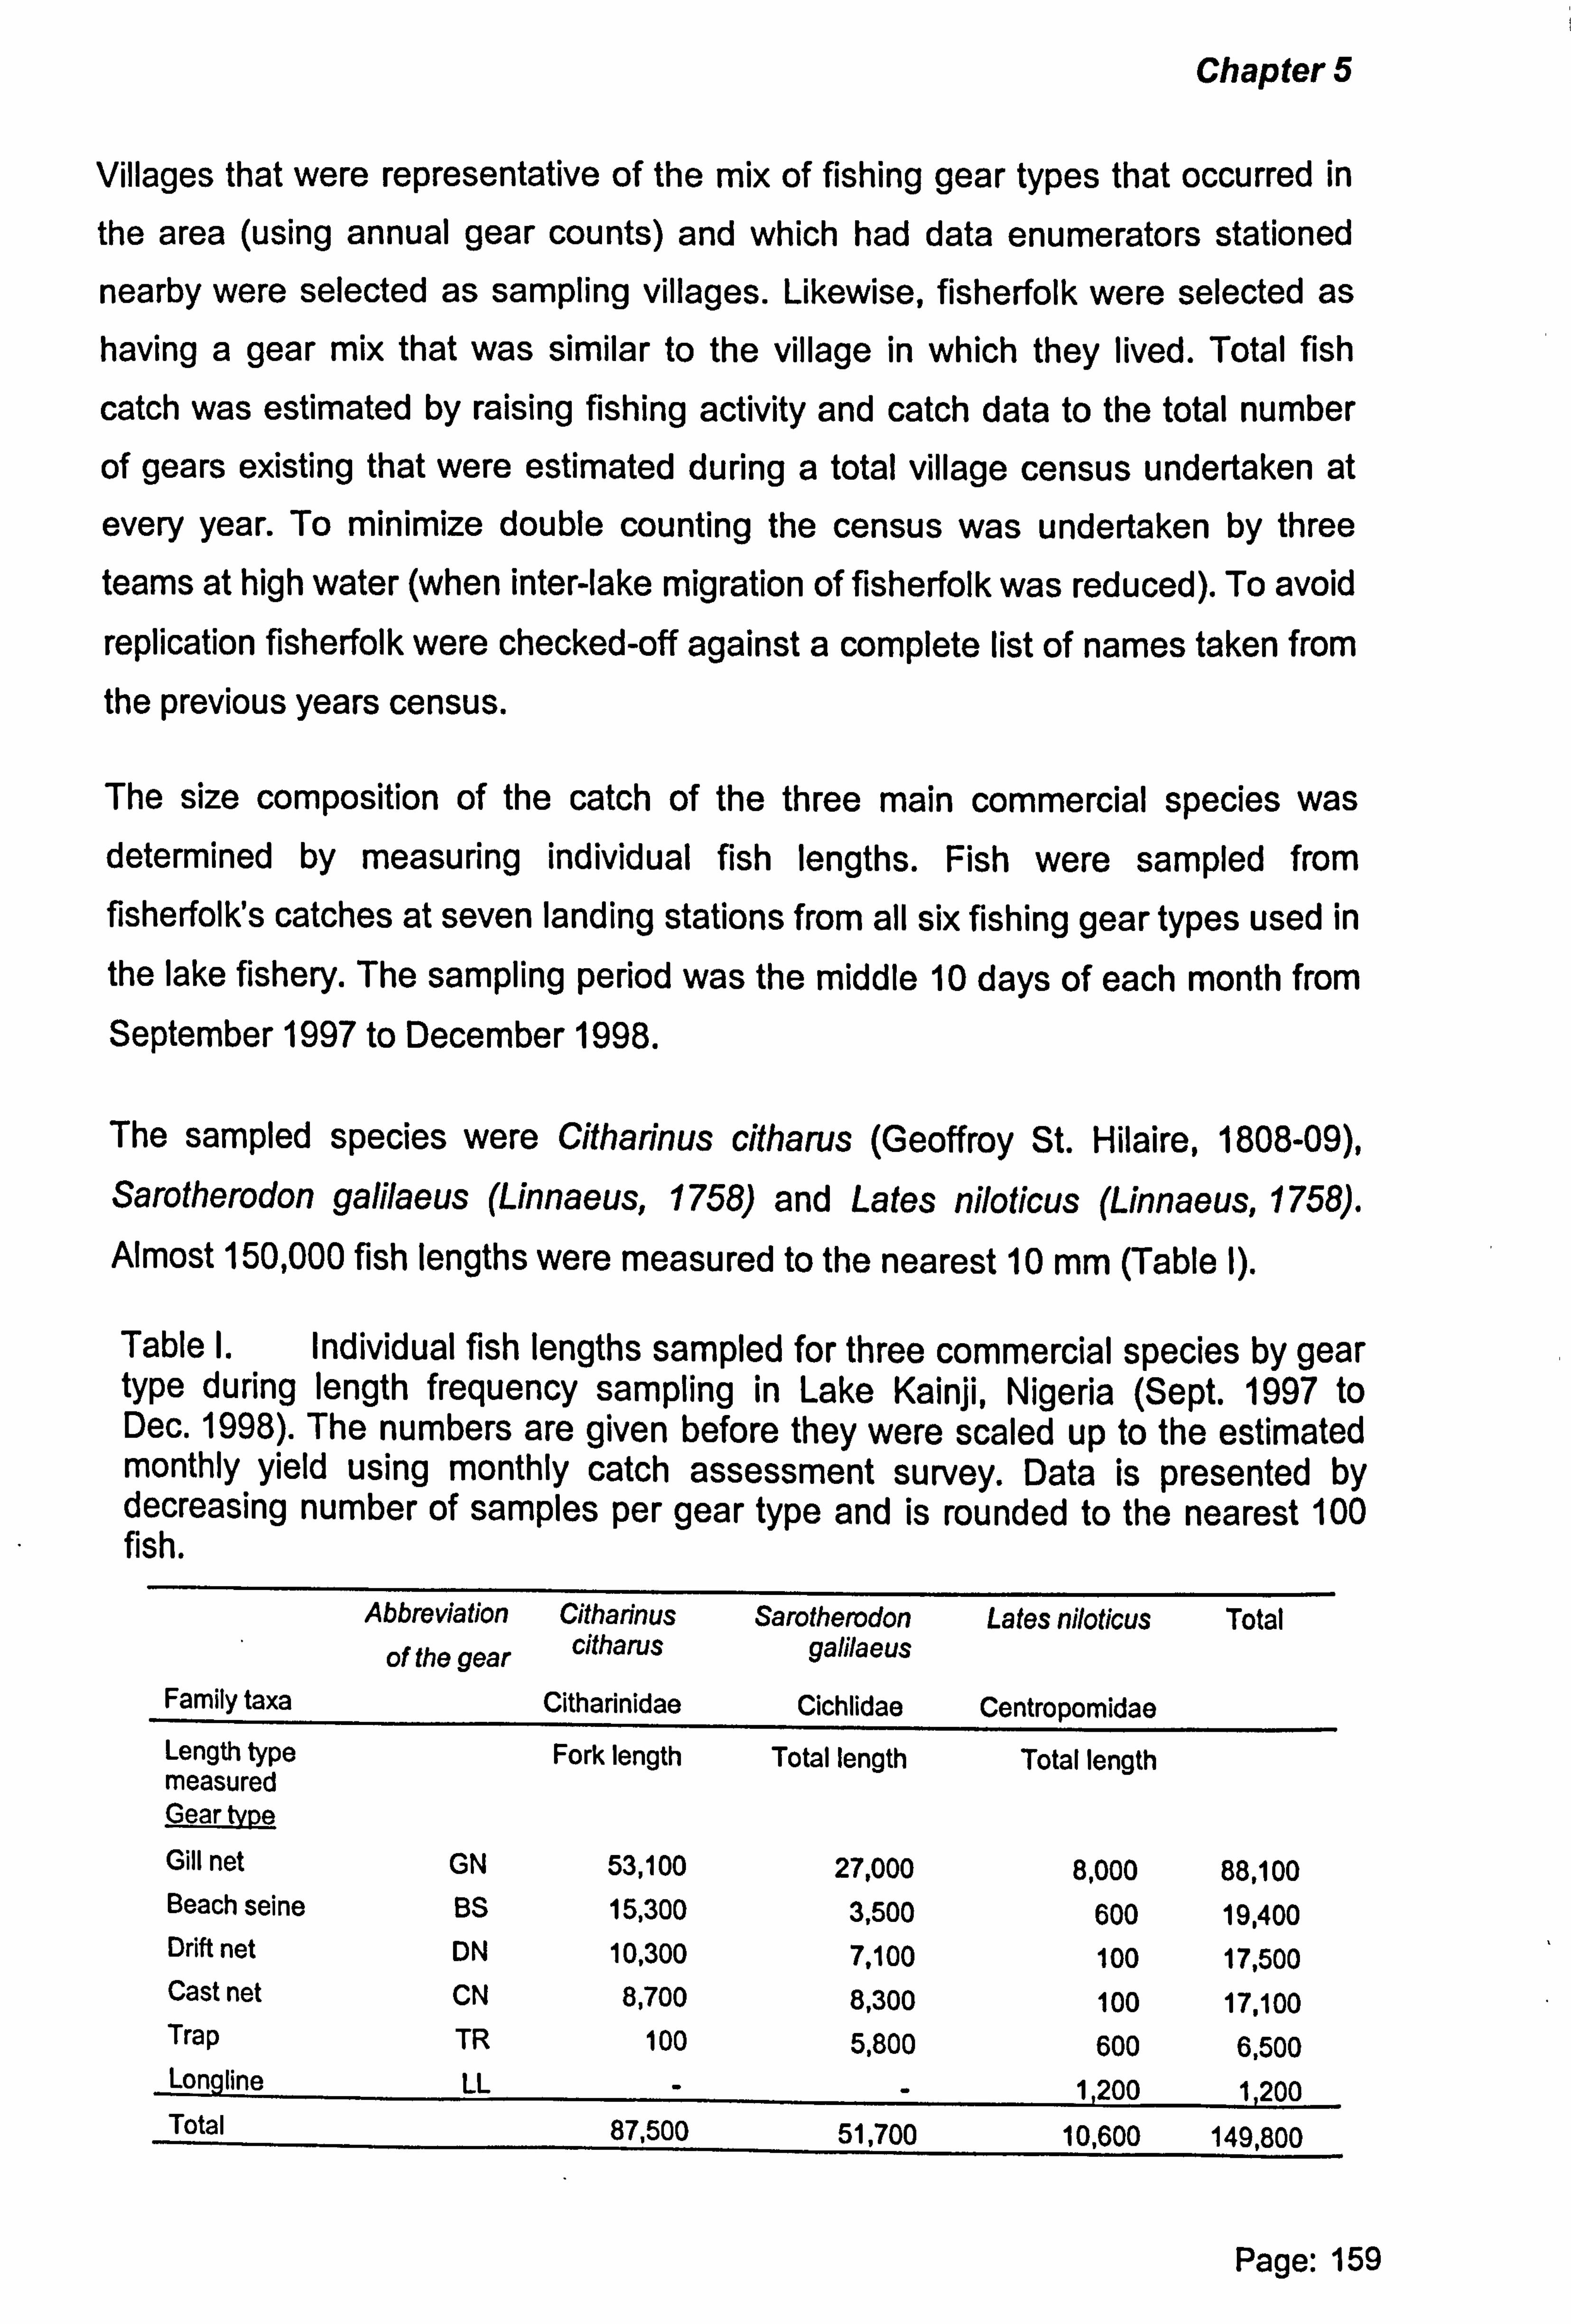
Chapter 5
Villages that were representative of the mix of fishing gear types that occurred in
the area (using annual gear counts) and which had data enumerators stationed
nearby were selected as sampling villages. Likewise, fisherfolk were selected as having a gear mix that was similar to the village in which they lived. Total fish
catch was estimated by raising fishing activity and catch data to the total number
of gears existing that were estimated during a total village census undertaken at
every year. To minimize double counting the census was undertaken by three
teams at high water (when inter-lake migration of fisherfolk was reduced). To avoid
replication fisherfolk were checked-off against a complete list of names taken from
the previous years census.
The size composition of the catch of the three main commercial species was determined by measuring individual fish lengths. Fish were sampled from fisherfolk's catches at seven landing stations from all six fishing gear types used in the lake fishery. The sampling period was the middle 10 days of each month from September 1997 to December 1998.
The sampled species were Citharinus citharus (Geoffroy St. Hilaire, 1808-09), Sarotherodon galilaeus (Linnaeus, 1758) and Lates niloticus (Linnaeus, 1758). Almost 150,000 fish lengths were measured to the nearest 10 mm (Table I).
Table I. Individual fish lengths sampled for three commercial species by gear type during length frequency sampling in Lake Kainji, Nigeria (Sept. 1997 to Dec. 1998). The numbers are given before they were scaled up to the estimated monthly yield using monthly catch assessment survey. Data is presented by decreasing number of samples per gear type and is rounded to the nearest 100 fish.
Abbreviation Citharinus Sarotherodon Lates niloticus Total
of the gear citharus galilaeus
Family taxa Citharinidae Cichlidae Centropomidae Length type Fork length Total length Total length measured Gear e Gill net GN 53,100 27,000 8,000 88,100 Beach seine BS 1 53no A rnn Ann 10 Ann Drift net DN 10,300 7,100 100 17,500 Cast net CN 8,700 8,300 100 17,100 Trap TR 100 5,800 600 6,500 Longline LL - 1,200 1,200 Total 87,500 51,700 10,600 149,800
Page: 159
Chapter 5
Length-weight relationships were derived from individual length and weight
measurements sampled by fleets of multi-meshed gill nets between 1970 and
1996 (gill net trial sampling) (see du Feu, 2003b).
The total number of fish caught by the fishery was calculated by raising the weight (from the length-weight relationship) of the sample to the total monthly catch of the
species per gear type. The total weight of fish was then converted back to lengths
to give the total number of fish in each length class caught every month by each
gear type. The frequency distributions by length groups are presented as
histograms. The length at maturity (Lm), optimum length at capture (Laps) and
asymptotic length (L. ) were superimposed onto the plots to give a pictorial view of
the level of overfishing for each species. The maximum length (1-max) at capture
was obtained from the gill net trial sampling and converted to L..
L. =10^(0.044+0.9841 *Log10 (Lmax) (Froese and Binohlan, 2000) ... 1)
This Loo estimate was used as an initial input for the estimation of growth
parameters by ELEFAN and Shepard's method (see du Feu, 2003b). Values of the length at maturity (Lm) were derived from Pauly's revised equation.
L, r =10^(0.898 * Iog1 O(L. ) - 0.0781) (Froese and Binohlan, 2000) ... 2)
The yield per recruit model of Beverton and Holt (1957) was used to identify Lopt
and assess the effect of increasing the size at capture on yield. Values of Lm and Lops were approximately confirmed by comparing them with values cited in FishBase (Froese & Pauly, 2003) for the species in other areas. The comparison is however limited by the lack of methodology explaining how the estimates contained in FishBase were obtained.
Page: 160
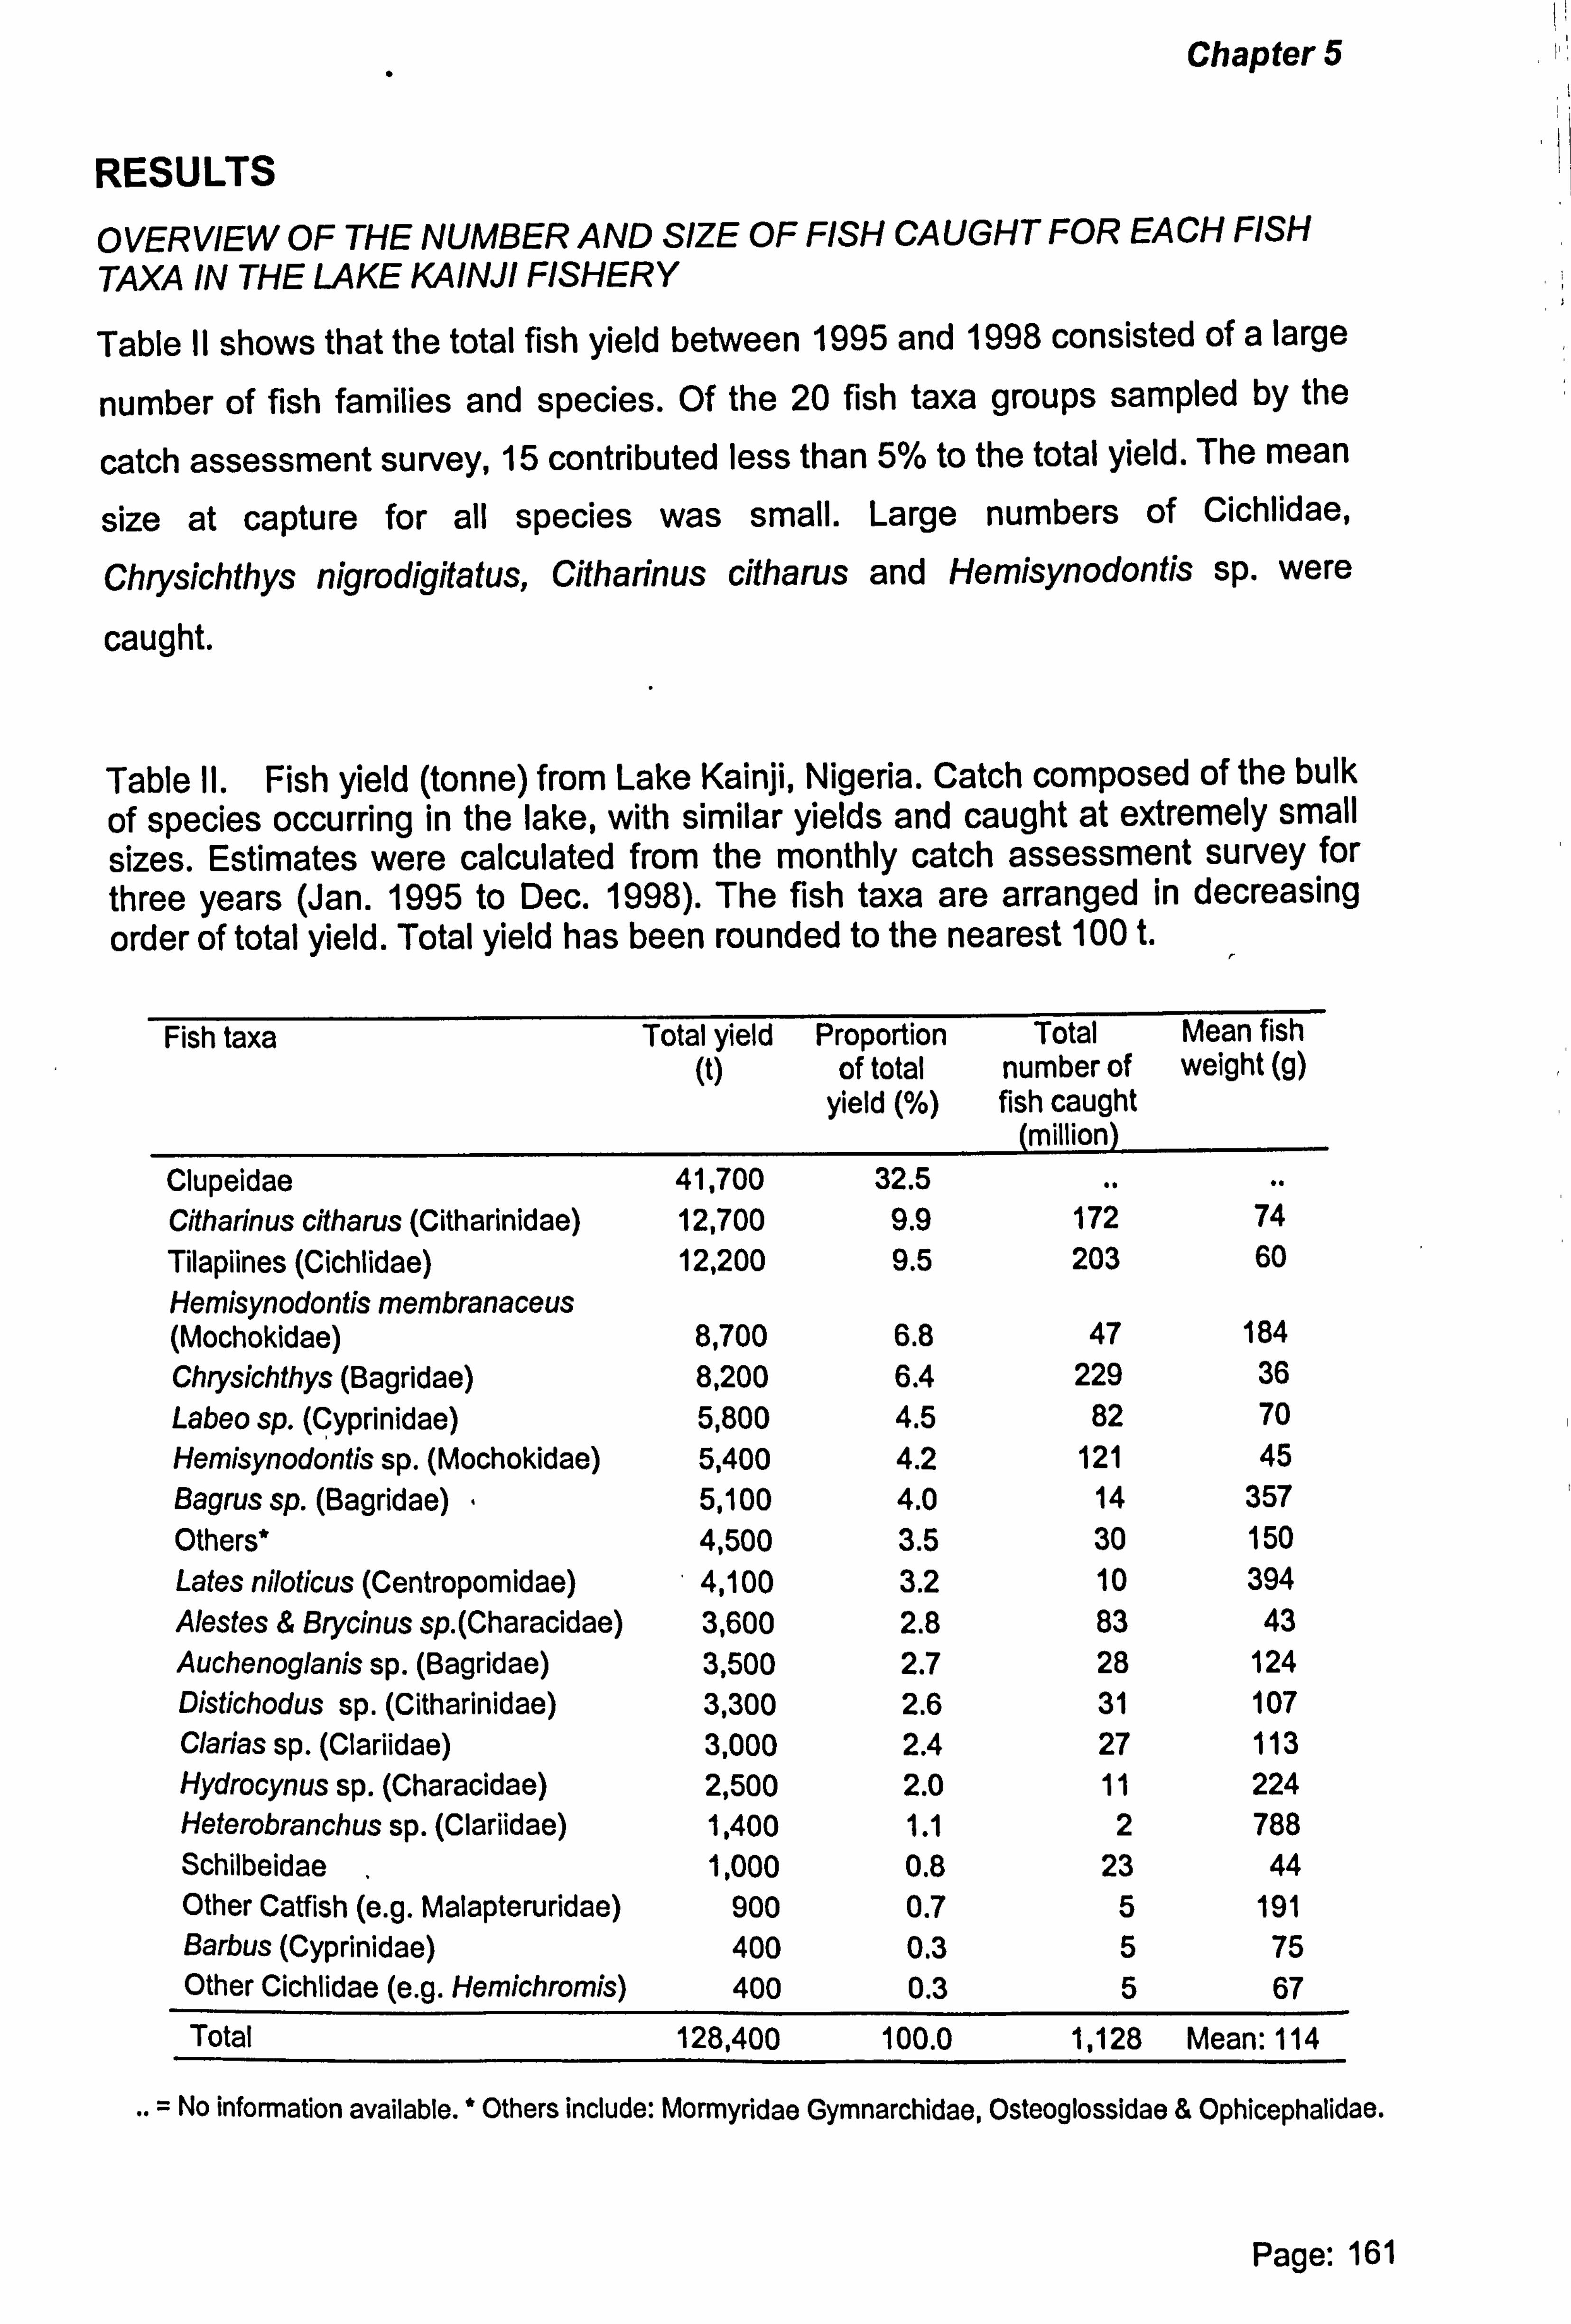
Chapter 5
RESULTS
OVERVIEW OF THE NUMBER AND SIZE OF FISH CAUGHT FOR EACH FISH TAXA IN THE LAKE KAINJI FISHERY
Table II shows that the total fish yield between 1995 and 1998 consisted of a large
number of fish families and species. Of the 20 fish taxa groups sampled by the
catch assessment survey, 15 contributed less than 5% to the total yield. The mean
size at capture for all species was small. Large numbers of Cichlidae,
Chrysichthys nigrodigitatus, Citharinus citharus and Hemisynodontis sp. were
caught.
Table II. Fish yield (tonne) from Lake Kainji, Nigeria. Catch composed of the bulk of species occurring in the lake, with similar yields and caught at extremely small sizes. Estimates were calculated from the monthly catch assessment survey for three years (Jan. 1995 to Dec. 1998). The fish taxa are arranged in decreasing order of total yield. Total yield has been rounded to the nearest 100 t.
Fish taxa Total yield (t)
Proportion of total
yield (%)
Total number of fish caught
(million)
Mean fish weight (g)
Clupeidae 41,700 32.5 .. "" Citharinus citharus (Citharinidae) 12,700 9.9 172 74 Tilapiines (Cichlidae) 12,200 9.5 203 60 Hemisynodontis membranaceus (Mochokidae) 8,700 6.8 47 184 Chrysichthys (Bagridae) 8,200 6.4 229 36 Labeo sp. (Cyprinidae) 5,800 4.5 82 70 Hemisynodontis sp. (Mochokidae) 5,400 4.2 121 45 Bagrus sp. (Bagridae) 5,100 4.0 14 357 Others* 4,500 3.5 30 150 Lates niloticus (Centropomidae) 4,100 3.2 10 394 Alestes & Brycinus sp. (Characidae) 3,600 2.8 83 43 Auchenoglanis sp. (Bagridae) 3,500 2.7 28 124 Distichodus sp. (Citharinidae) 3,300 2.6 31 107 Clarias sp. (Clariidae) 3,000 2.4 27 113 Hydrocynus sp. (Characidae) 2,500 2.0 11 224 Heterobranchus sp. (Clariidae) 1,400 1.1 2 788 Schilbeidae
, 1,000 0.8 23 44
Other Catfish (e. g. Malapteruridae) 900 0.7 5 191 Barbus (Cyprinidae) 400 0.3 5 75 Other Cichlidae (e. g. Hemichromis) 400 0.3 5 67
Total 128,400 100.0 1,128 Mean: 114
.. = No information available. * Others include: Mormyridae Gymnarchidae, Osteoglossidae & Ophicephalidae.
Page: 161
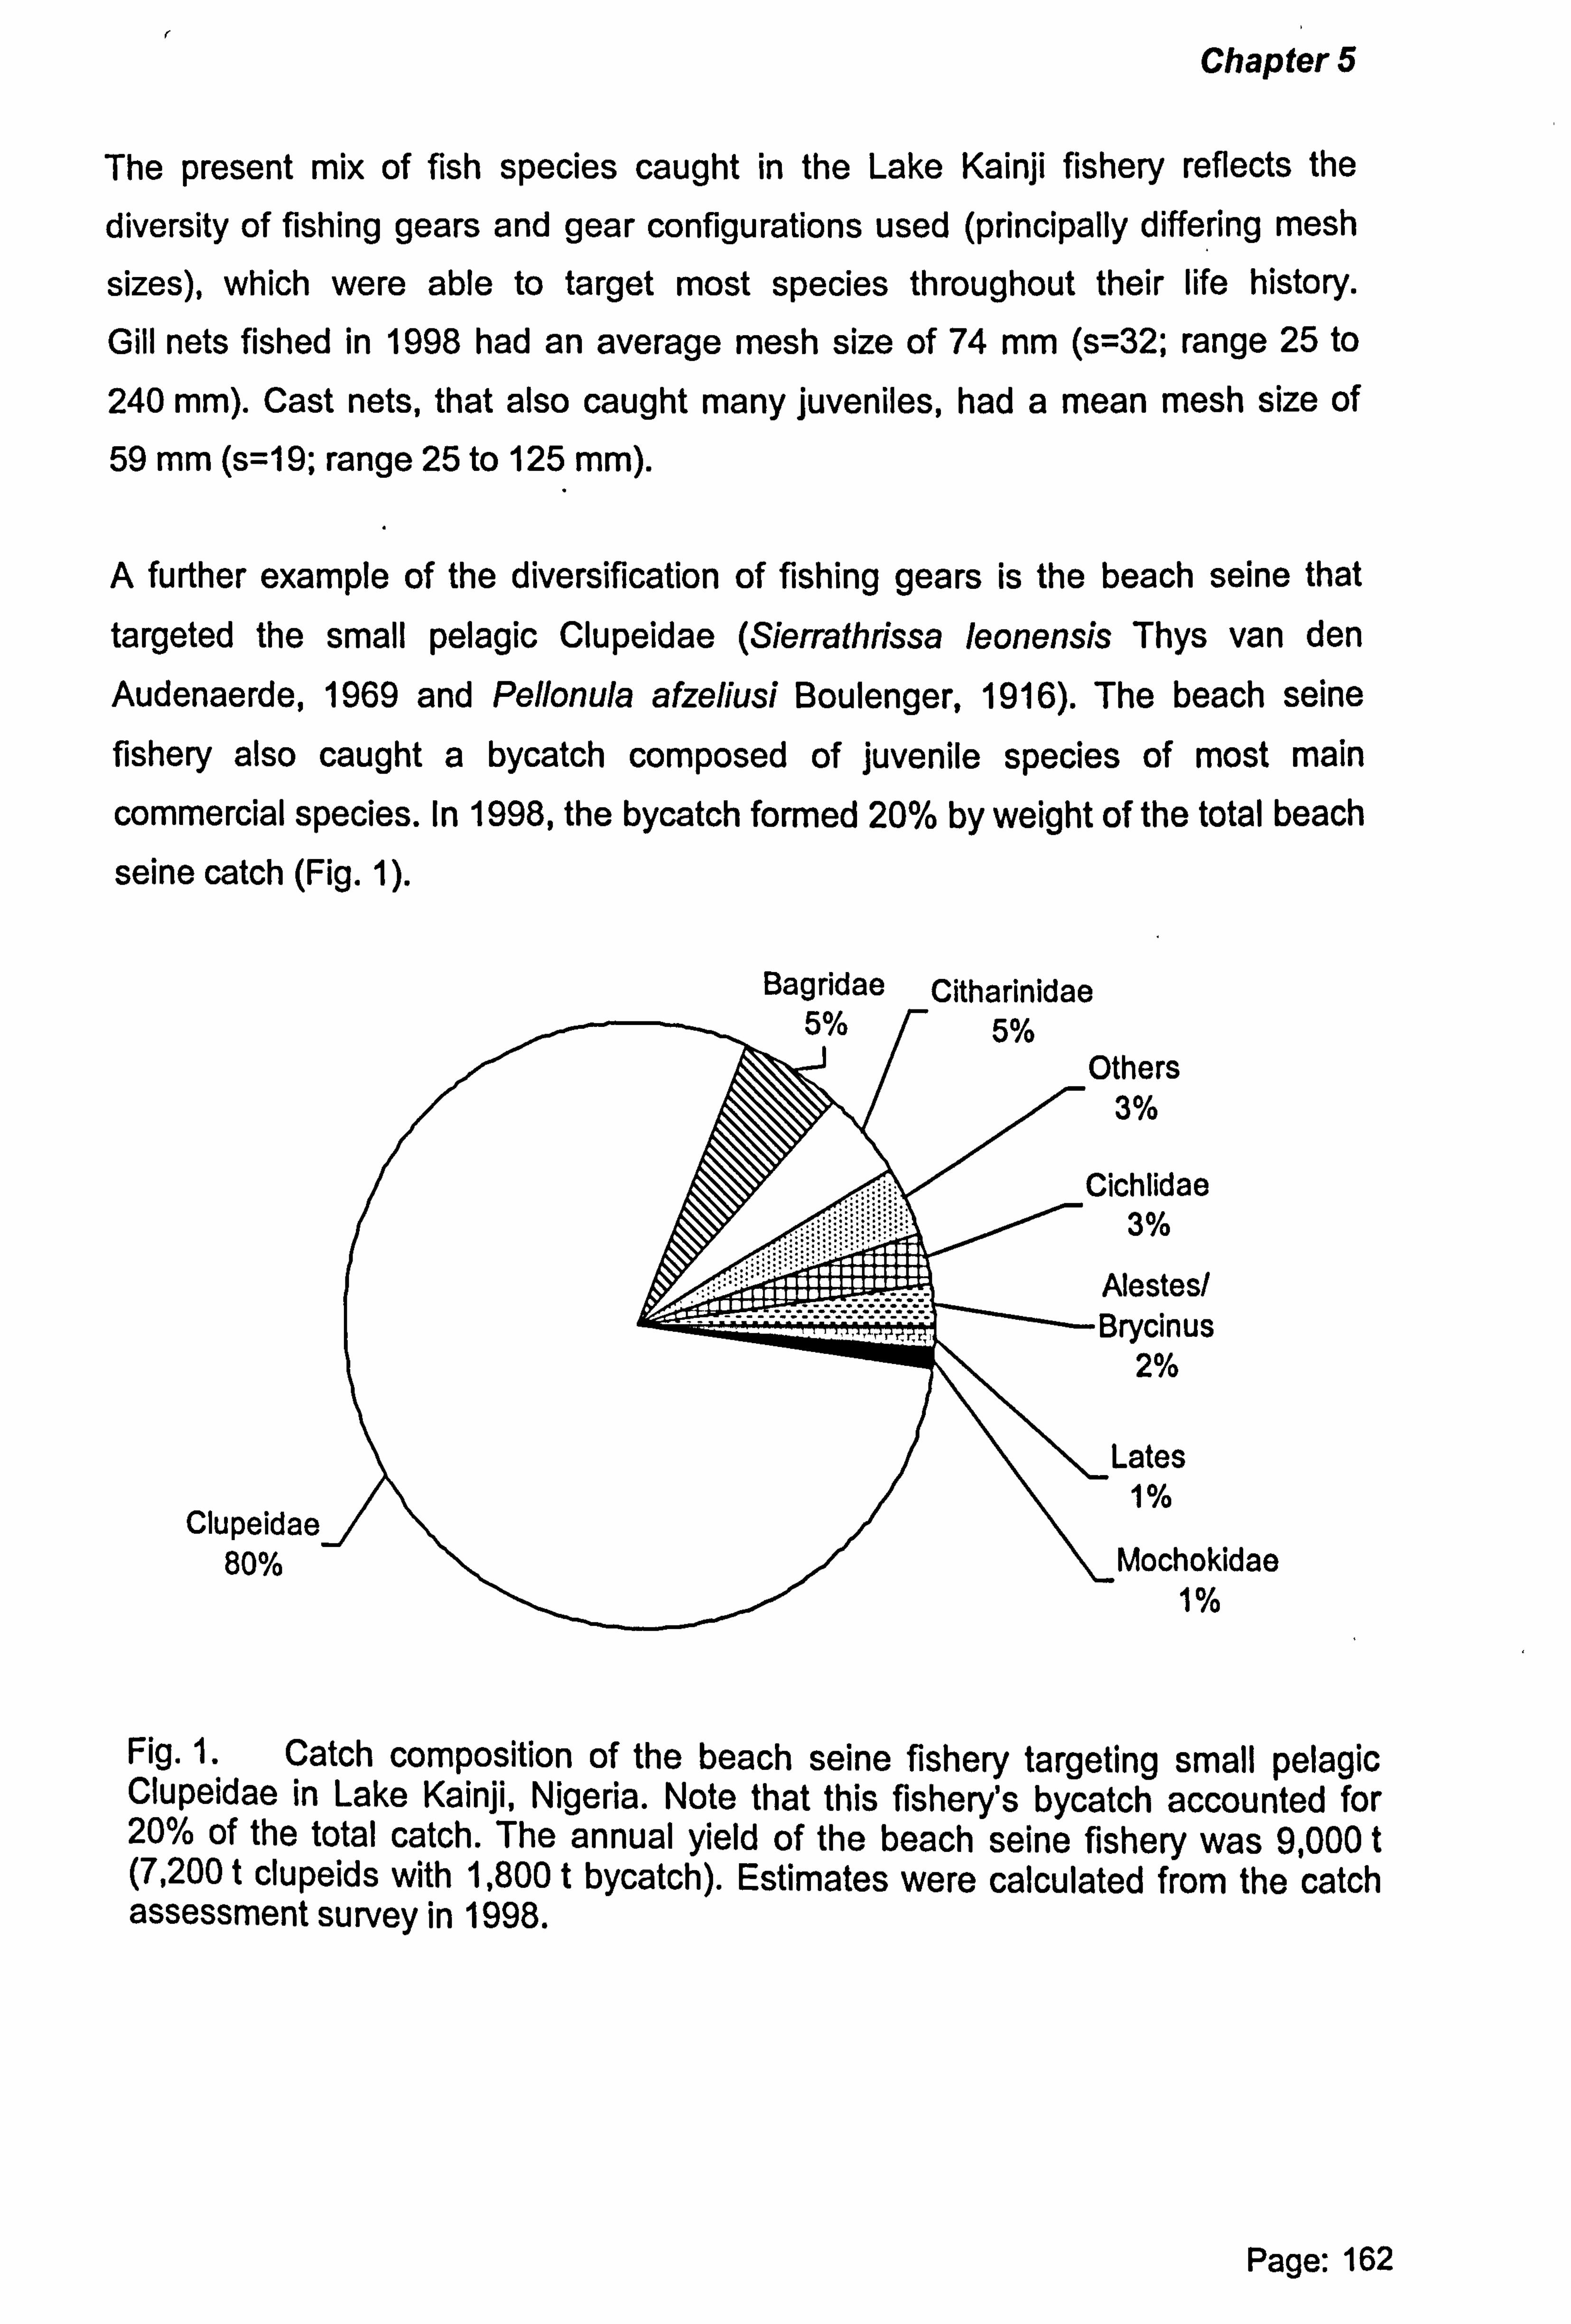
r
Chapter 5
The present mix of fish species caught in the Lake Kainji fishery reflects the
diversity of fishing gears and gear configurations used (principally differing mesh
sizes), which were able to target most species throughout their life history.
Gill nets fished in 1998 had an average mesh size of 74 mm (s=32; range 25 to
240 mm). Cast nets, that also caught many juveniles, had a mean mesh size of
59 mm (s=19; range 25 to 125 mm).
A further example of the diversification of fishing gears is the beach seine that
targeted the small pelagic Clupeidae (Sierrathrissa leonensis Thys van den
Audenaerde, 1969 and Pellonula afzeliusi Boulenger, 1916). The beach seine fishery also caught a bycatch composed of juvenile species of most main
commercial species. In 1998, the bycatch formed 20% by weight of the total beach
seine catch (Fig. 1).
thers 3%
Clupeidae 80%
chlidae 3%
Testes/
, rycinus 2%
Lates 1%
Mochokidae 1%
Fig. 1. Catch composition of the beach seine fishery targeting small pelagic Clupeidae in Lake Kainji, Nigeria. Note that this fishery's bycatch accounted for 20% of the total catch. The annual yield of the beach seine fishery was 9,000 t (7,200 t clupeids with 1,800 t bycatch). Estimates were calculated from the catch assessment survey in 1998.
Page: 162
Bagridae Citharinidae
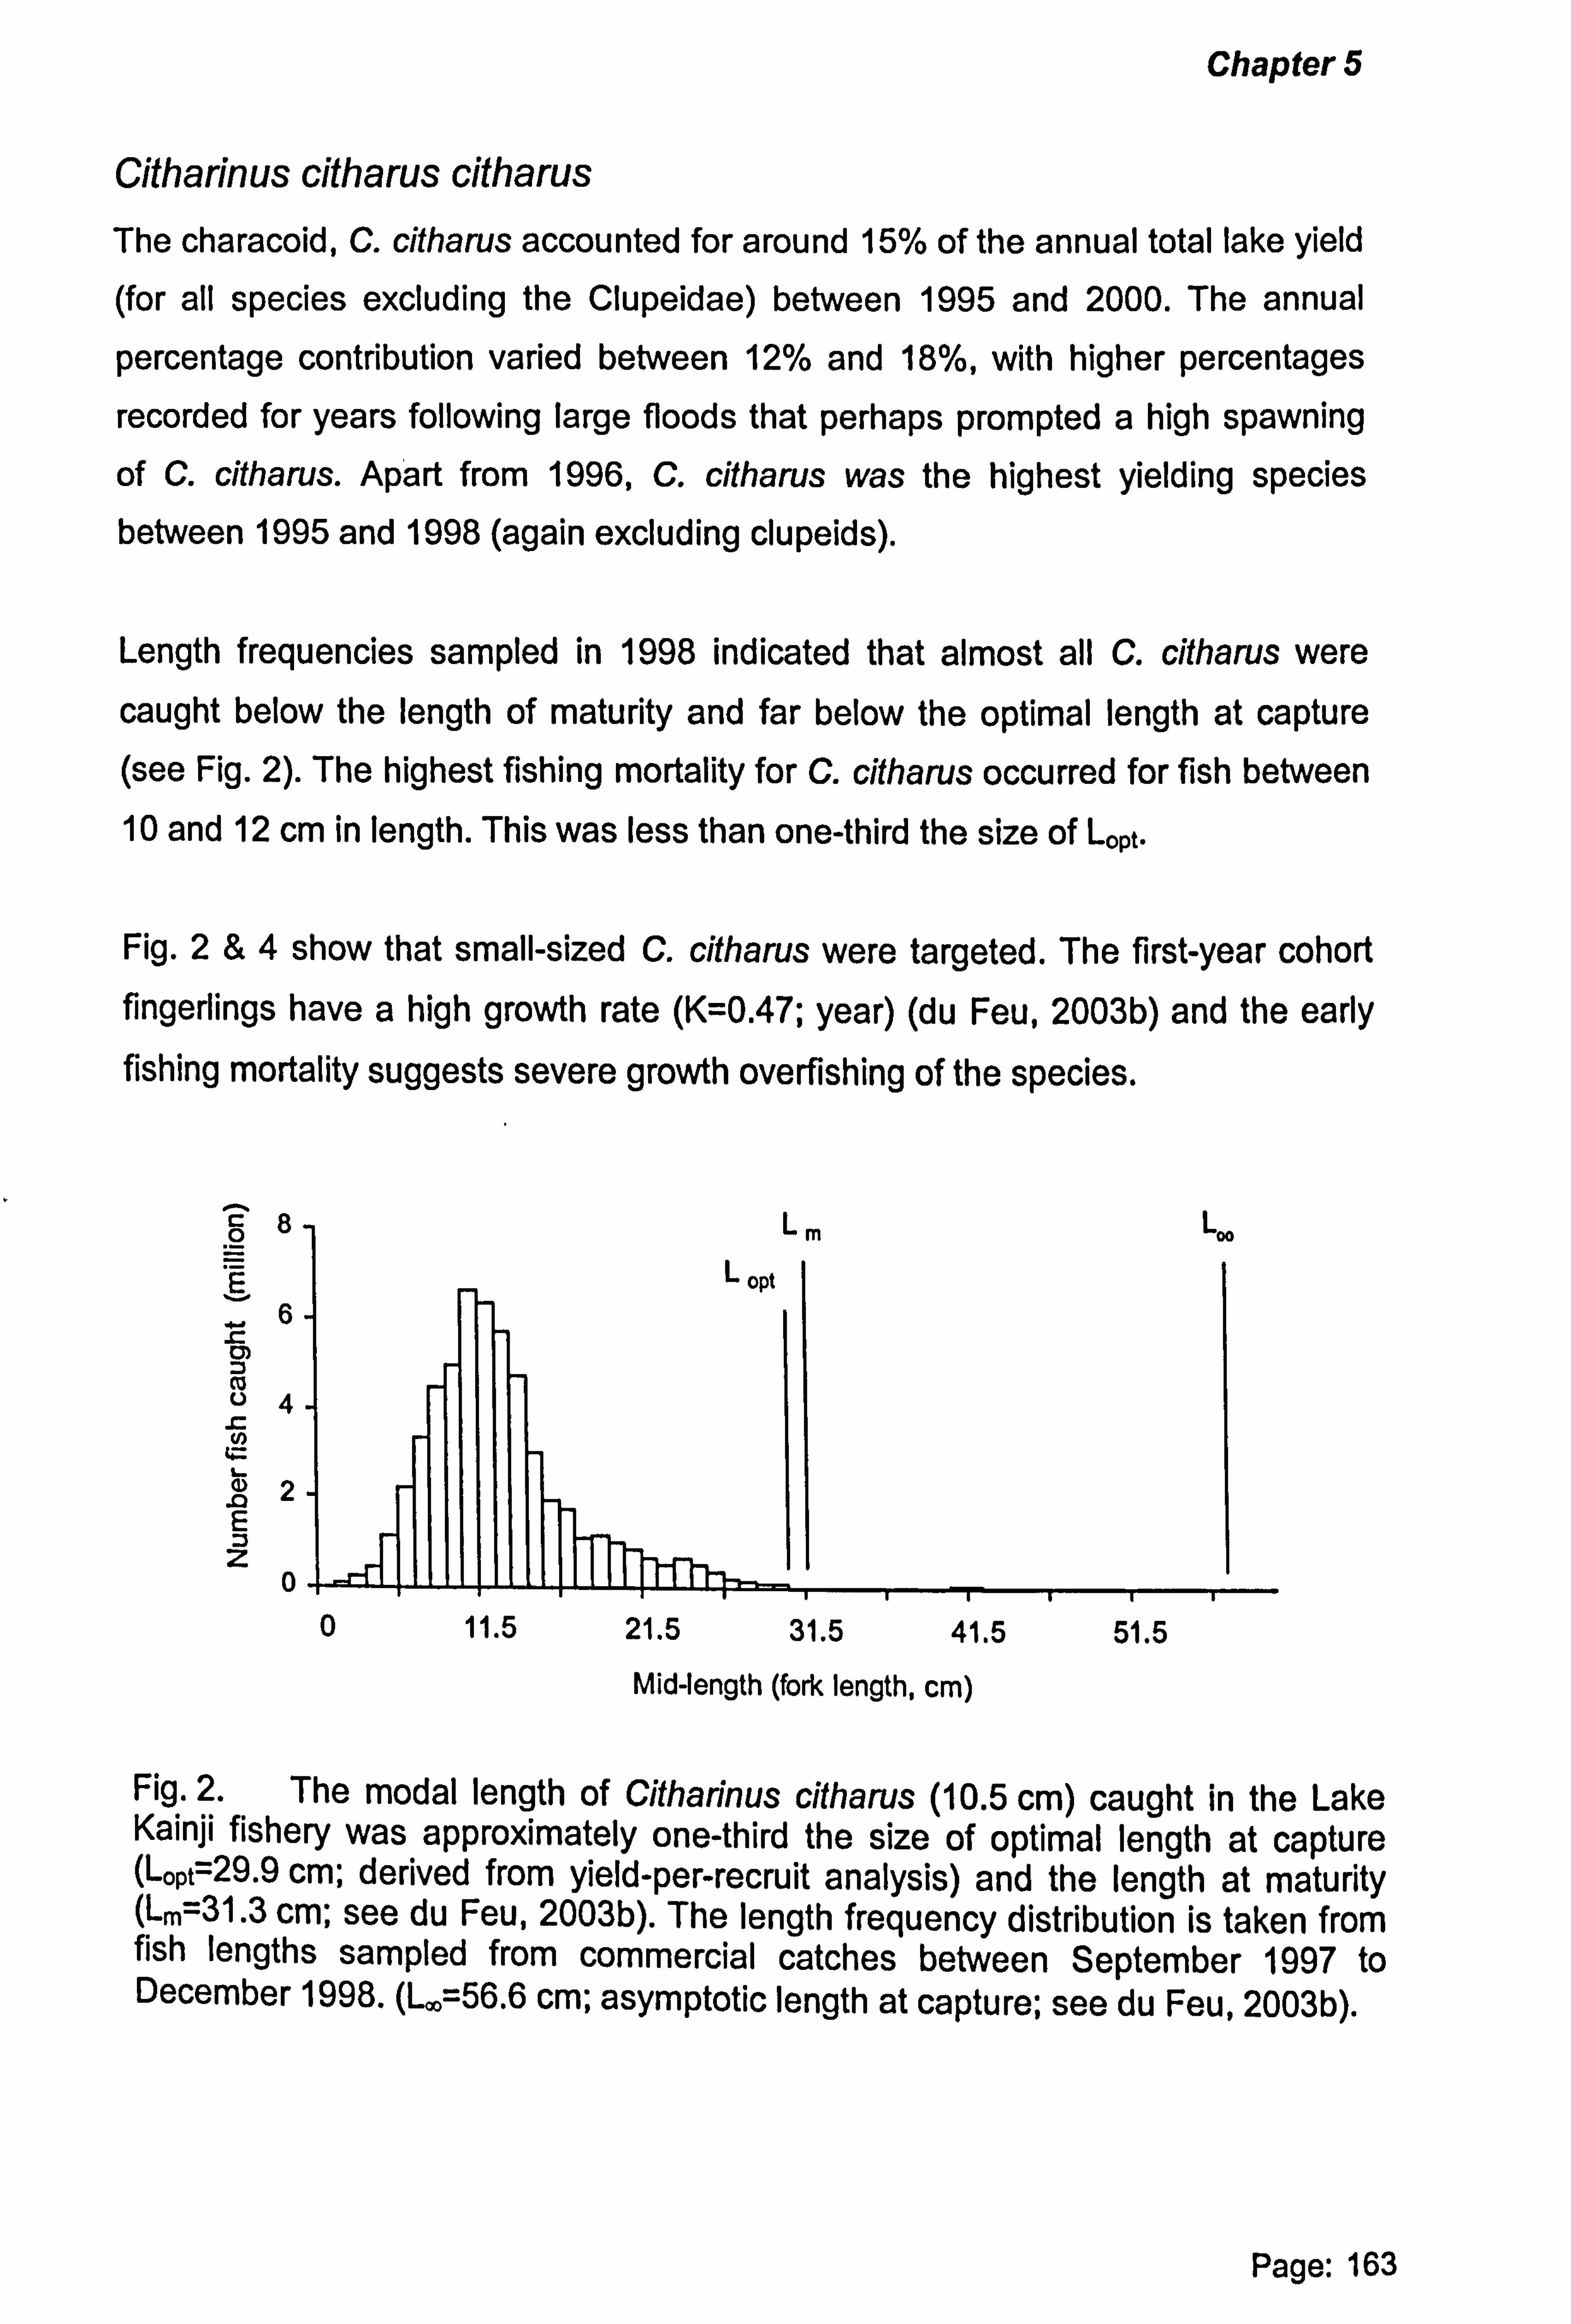
Chapter 5
Citharinus citharus citharus The characoid, C. citharus accounted for around 15% of the annual total lake yield (for all species excluding the Clupeidae) between 1995 and 2000. The annual
percentage contribution varied between 12% and 18%, with higher percentages
recorded for years following large floods that perhaps prompted a high spawning
of C. citharus. Apart from 1996, C. citharus was the highest yielding species between 1995 and 1998 (again excluding clupeids).
Length frequencies sampled in 1998 indicated that almost all C. citharus were caught below the length of maturity and far below the optimal length at capture (see Fig. 2). The highest fishing mortality for C. citharus occurred for fish between 10 and 12 cm in length. This was less than one-third the size of Lops.
Fig. 2&4 show that small-sized C. citharus were targeted. The first-year cohort fingerlings have a high growth rate (K=0.47; year) (du Feu, 2003b) and the early fishing mortality suggests severe growth overfishing of the species.
g
cm m 04
N2 E
z 0
I
Mid-length (fork length, cm)
Fig. 2. The modal length of Citharinus citharus (10.5 cm) caught in the Lake Kainji fishery was approximately one-third the size of optimal length at capture (Logt=29.9 cm; derived from yield-per-recruit analysis) and the length at maturity (Lm=31.3 cm; see du Feu, 2003b). The length frequency distribution is taken from fish lengths sampled from commercial catches between September 1997 to December 1998. (L. =56.6 cm; asymptotic length at capture; see du Feu, 2003b).
Page: 163
0 11.5 21.5 31.5 41.5 51.5
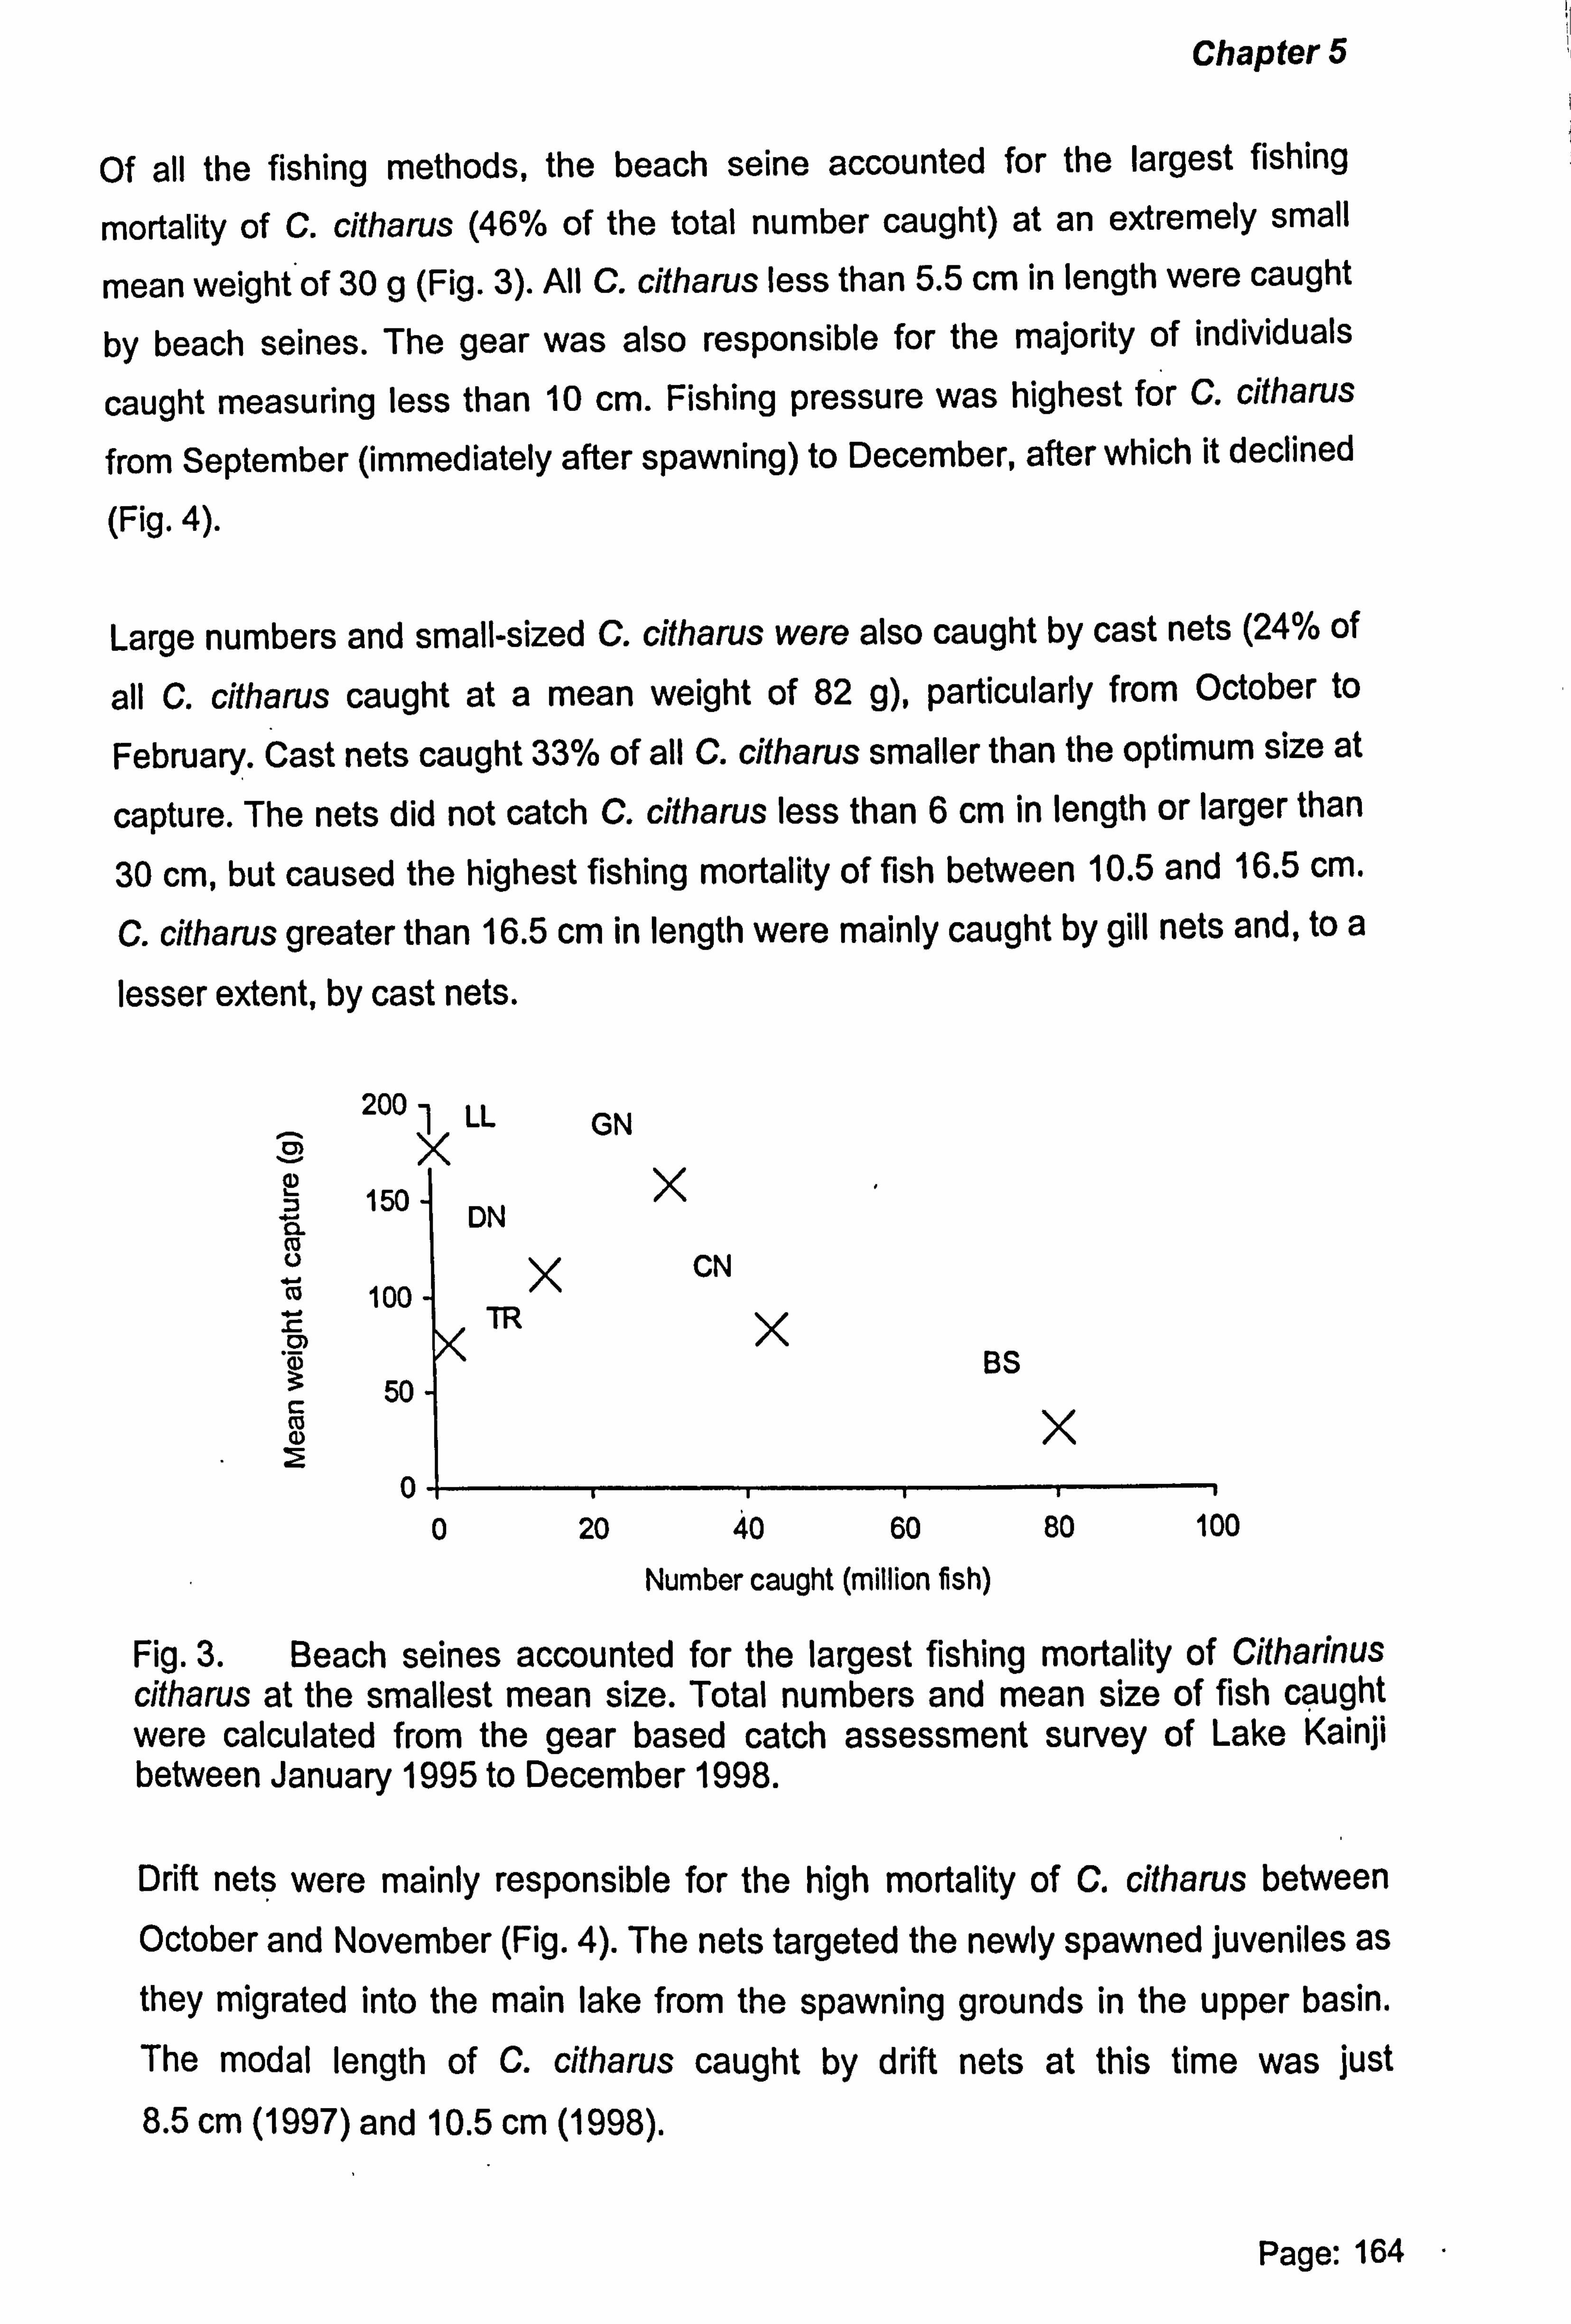
Chapter 5
Of all the fishing methods, the beach seine accounted for the largest fishing
mortality of C. citharus (46% of the total number caught) at an extremely small
mean weight of 30 g (Fig. 3). All C. citharus less than 5.5 cm in length were caught
by beach seines. The gear was also responsible for the majority of individuals
caught measuring less than 10 cm. Fishing pressure was highest for C. citharus
from September (immediately after spawning) to December, after which it declined
(Fig. 4).
Large numbers and small-sized C. citharus were also caught by cast nets (24% of
all C. citharus caught at a mean weight of 82 g), particularly from October to
February. Cast nets caught 33% of all C. citharus smaller than the optimum size at
capture. The nets did not catch C. citharus less than 6 cm in length or larger than
30 cm, but caused the highest fishing mortality of fish between 10.5 and 16.5 cm.
C. citharus greater than 16.5 cm in length were mainly caught by gill nets and, to a
lesser extent, by cast nets.
rn 2
CL Co U
Co
0)
m
200 X LL GN
150
100
50
0
Number caught (million fish)
Fig. 3. Beach seines accounted for the largest fishing mortality of Citharinus citharus at the smallest mean size. Total numbers and mean size of fish caught were calculated from the gear based catch assessment survey of Lake Kainji between January 1995 to December 1998.
Drift nets were mainly responsible for the high mortality of C. citharus between
October and November (Fig. 4). The nets targeted the newly spawned juveniles as they migrated into the main lake from the spawning grounds in the upper basin. The modal length of C. citharus caught by drift nets at this time was just
8.5 cm (1997) and 10.5 cm (1998).
Page: 164
0 20 40 60 80 100
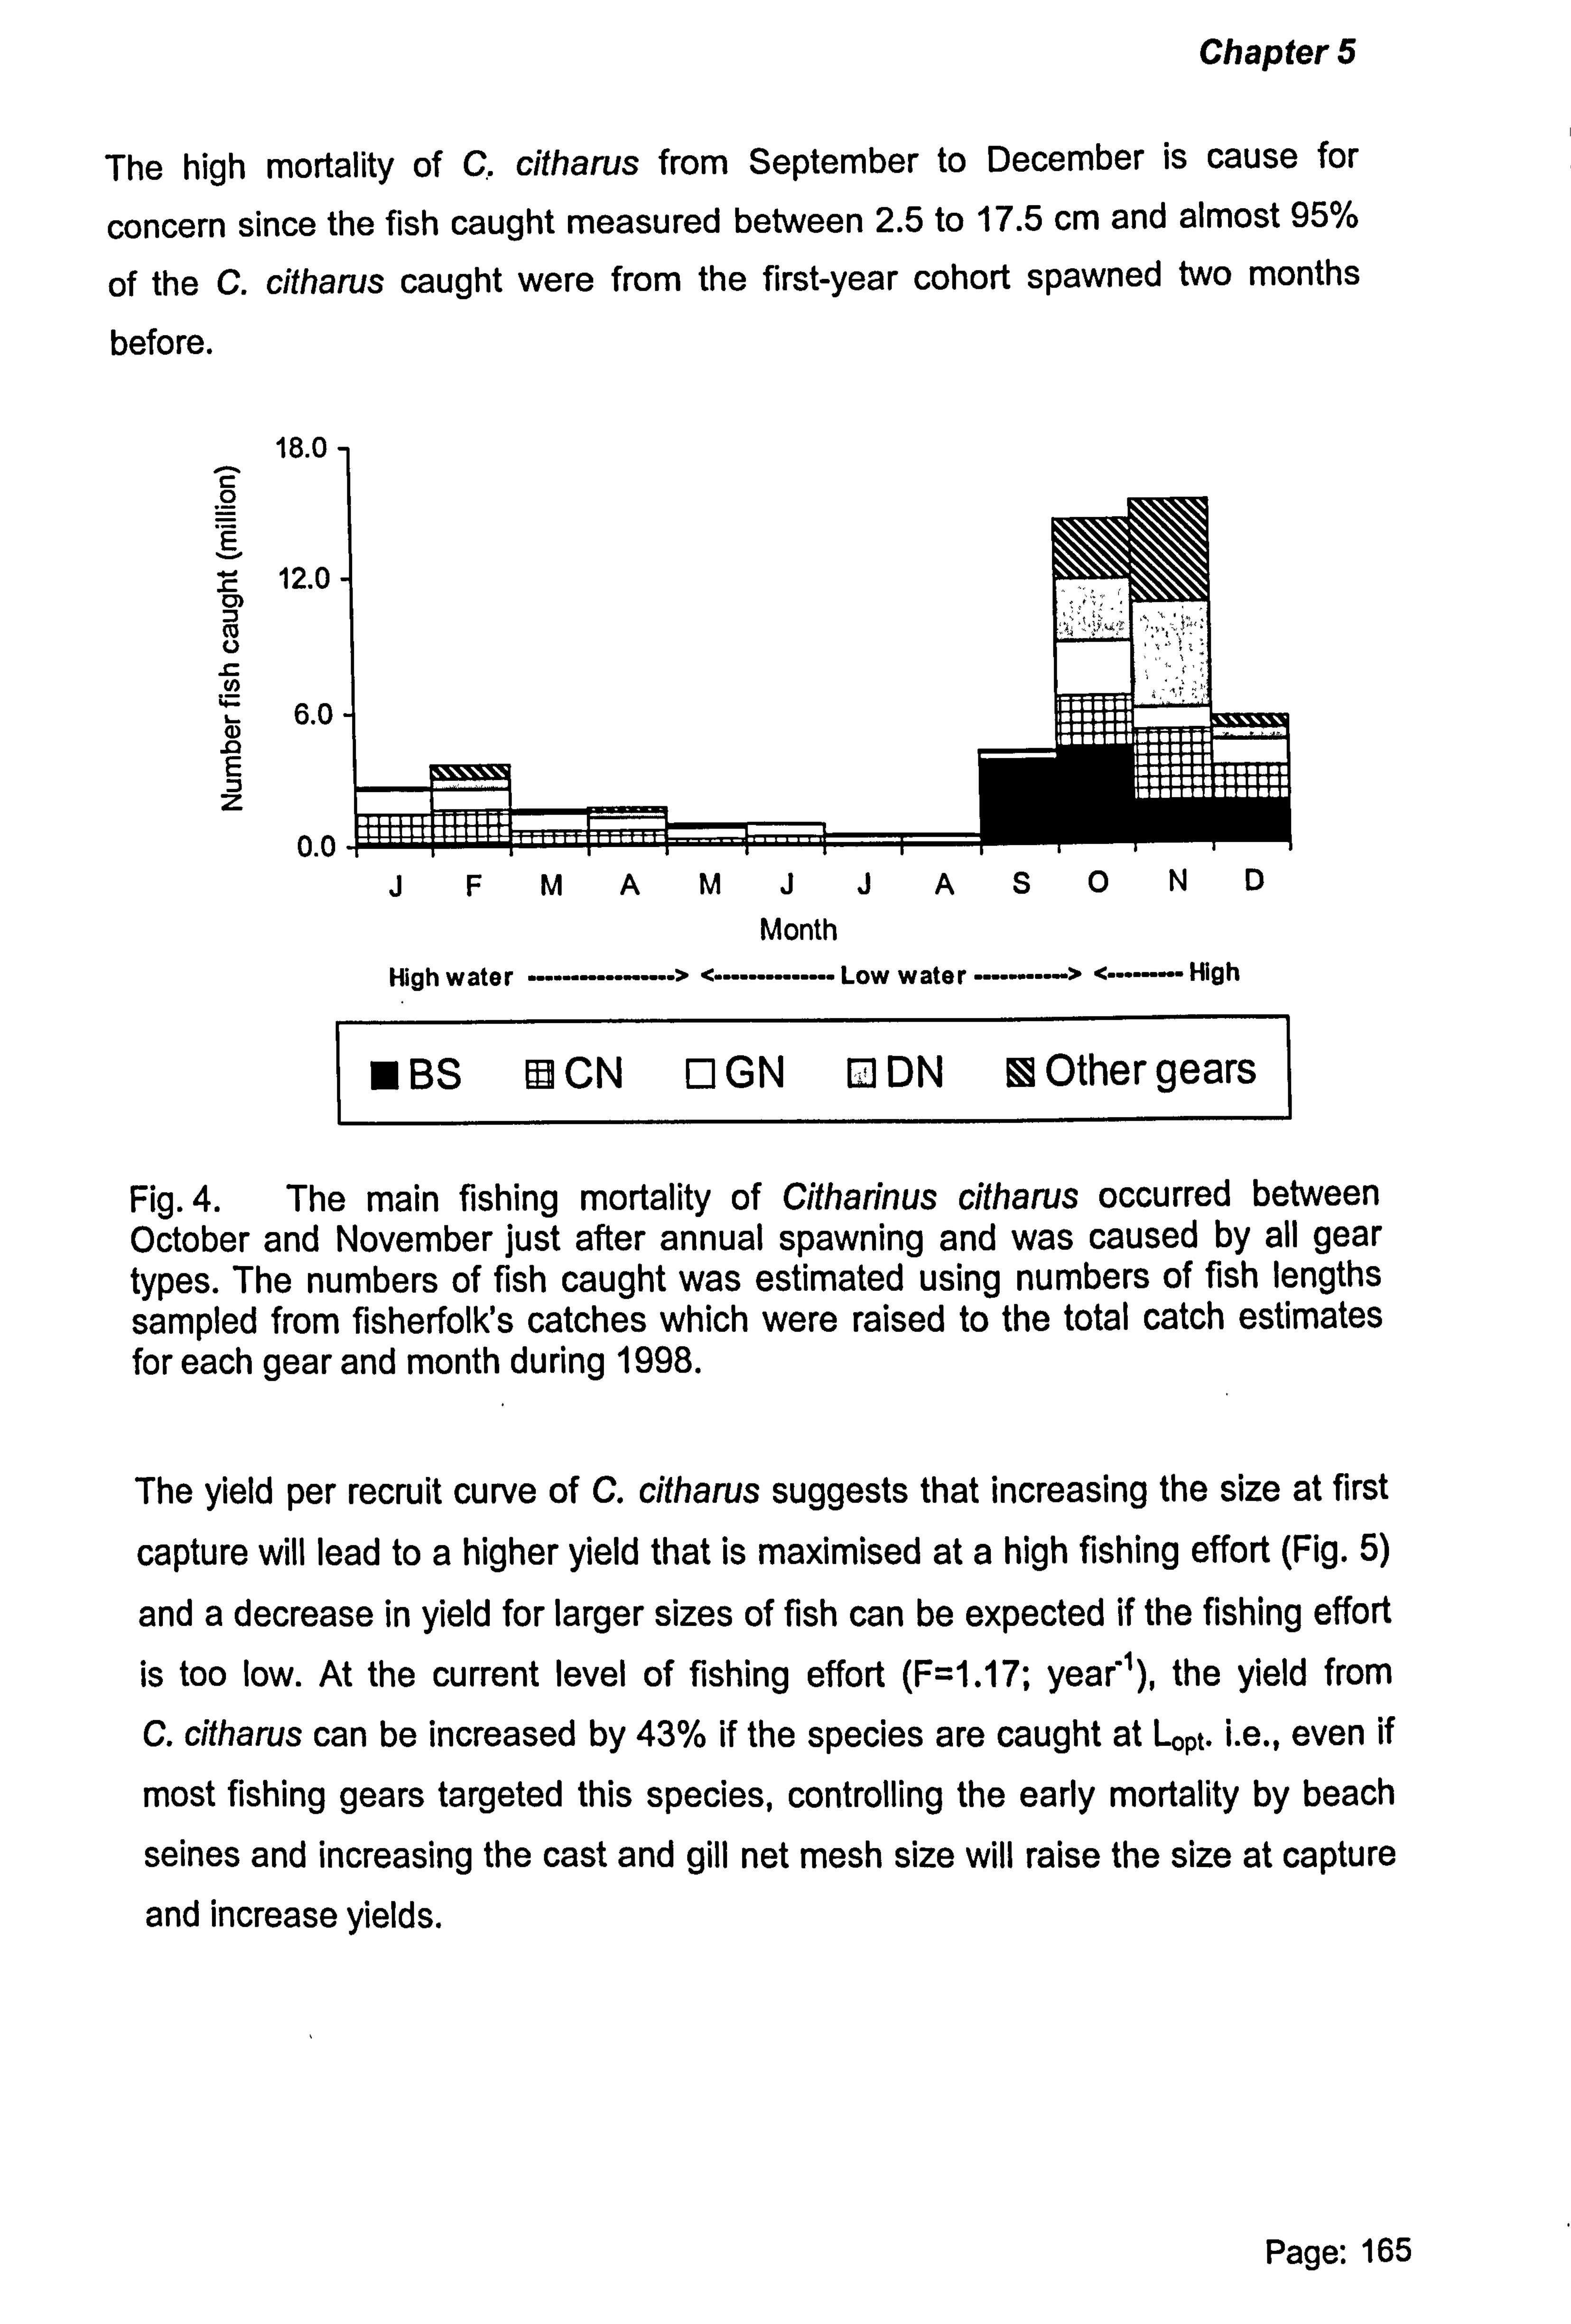
Chapter 5
The high mortality of C. citharus from September to December is cause for
concern since the fish caught measured between 2.5 to 17.5 cm and almost 95%
of the C. citharus caught were from the first-year cohort spawned two months
before.
18.0
0 E r 12.0 CF) co U
L N
6.0 a) E z
0.0
High water -----------------> <-------------- Low water -----------> <------»- High
BS EEO CN QGN QDN ®Other gears
Fig. 4. The main fishing mortality of Citharinus citharus occurred between October and November just after annual spawning and was caused by all gear types. The numbers of fish caught was estimated using numbers of fish lengths sampled from fisherfolk's catches which were raised to the total catch estimates for each gear and month during 1998.
The yield per recruit curve of C. citharus suggests that increasing the size at first
capture will lead to a higher yield that is maximised at a high fishing effort (Fig. 5)
and a decrease in yield for larger sizes of fish can be expected if the fishing effort is too low. At the current level of fishing effort (F=1.17; year'), the yield from
C. citharus can be increased by 43% if the species are caught at Lops. i. e., even if
most fishing gears targeted this species, controlling the early mortality by beach
seines and increasing the cast and gill net mesh size will raise the size at capture
and increase yields.
Page: 165
JFMAMJJAS0ND Month

Chapter 5
0.04
2 0.03
(D 0.02
cr-
0.01
F=0.5
F=1.17
F=1.5
-"-"-" F=2.0
WHERE: F=1.17 year-1 M=O. 9 year-1 LOO=56.6 cm K=0.47 year-1
Length at capture (fork length; cm)
Fig. 5. The mean length at capture of Citharinus citharus in 1998 (L6=12.0 cm) was 40 % the size of the optimal length at capture (Lops=29.9 cm) (calculated using Beverton and Holt yield per recruit curve analysis). Higher fishing effort at the present size at capture will cause the relative yield per recruit to reduce. Mortality and population parameters are from du Feu (2003b), L,. calculated from length- frequency data collected during 1998.
Sarotherodon galilaeus galilaeus
Tilapia sampled by the catch assessment survey (Sarotherodon galilaeus, Oreochromis niloticus and Tilapia zillu) had the second largest component of the
catch after C. citharus (Table II). Between 1995 and 2000, the average annual
percentage contribution of Cichlidae to the total yield (excluding the Clupeidae)
was 14 %, with a maximum contribution to the catch at 16 % in 1996. Among the
tilapiines, S. galilaeus is the most represented. Although the number of Cichlidae
caught between 1995 and 1998 was slightly higher than C. citharus, the mean size
of the catch was smaller, making the . total weight of fish caught comparable (see Table II). Excluding the Clupeidae, the two groups combined contributed just less than one-third of the total lake yield between 1995 and 1998.
The length frequency distribution for S. galilaeus is similar to C. citharus and indicates comparable sizes of fish caught (Fig. 6). Almost all fish were caught below the optimal length at capture, with some 85% of fish caught below the length at maturity. The modal size of 11.5 to 13.5 cm was less than half the
optimal length at capture.
Page: 166
10 15 20 25 30 35

Chapter 5
Lm Lý
c 0
2.0
t rn
U
N 1.0 I- a) E Z 0.0
Mid-length (total length, cm)
Fig 6. The modal length of Sarotherodon galilaeus caught (13.5 cm) in the Lake Kainji fishery was approximately half the size of optimal length at capture (Lops=25.0 cm; derived from yield per recruit analysis) and the length at maturity (Lm=25.8 cm; see du Feu, 2003b). The length frequency distribution is taken from fish lengths sampled from commercial catches between September 1997 and December 1998 (L. =45.7 cm; asymptotic length at capture; see du Feu, 2003b).
Traps followed by cast nets caught the most fish (Fig. 7). Beach seines and cast
nets caught the majority of small-sized tilapia and gill nets targeted the larger fish.
Traps targeted the species during high water and receding lake level when the fish
were breeding within the submerged vegetation (Fig. 8). Conversely, cast nets targeted S. galilaeus during low water when fishing in shallow waters was not
obstructed by aquatic vegetation.
100 GN DN X
rn TR x BS X
50 XX CN
0 0 20 40 60
Number fish caught (million) 80
Fig 7. The largest number of Sarotherodon galilaeus were caught by fishing traps followed by cast nets and smaller fish were caught by beach seines and cast nets. Total numbers and mean size of fish caught were calculated from the gear based catch assessment survey of Lake Kainji between January 1995 to December 1998.
Page: 167
0 6.5 11.5 16.5 21.5 26.5 31.5 36.5 41.5 46.5

Chapter 5
3.0 ^c 0 E
L 2.0 rn m
1.0
Z 0.0
High water >< -Low water >< High water
BS 91 CN Q GN Q TR ® Other gears
Fig. 8. The fishing mortality of Sarotherodon galilaeus was spread throughout the year with fishing traps generally catching the most fish. The number of fish
caught was estimated using numbers of fish lengths sampled from fisherfolk's catches which were raised to the total catch estimates for each gear and month during 1998.
The fishing effort for S. galilaeus in 1998 was at the maximum level required for
optimal yield per recruit (Fig. 9). Increasing the size of capture is, therefore, the
only alternative to increasing yield. One can expect a sharp increase in yield if this
is achieved.
,. 0.03 2 U
ID 0. 'o A 0.02
0.01
F=0.5
- F=1.0
....... F=2.0 F=3.8
--- F=5.0
WHERE: F= 3.86 year-1 M=1.0 year-1 L, =45.7 cm K=0.47 year-1
Length at capture (total length; cm)
I
Fig. 9. The mean length at capture of Sarotherodon galilaeus in 1998 (L, =12.8 cm) was half the size of the optimal length at capture (Logt=25.0 cm) calculated using Beverton and Holt yield per recruit curve analysis. Increasing the size at capture will result in a marked increase in the relative yield per recruit. Mortality and population parameters are from du Feu (2003b), Lc calculated from length frequency data collected during 1998.
Page: 168
JFMAMJJAS0ND Month
10 13 16 19 22 25 . 28 31 34 37
Chapter 5
Lates niloticus
Between 1995 and 2000, the annual average proportion of L. niloticus in the catch
of the artisanal fishery was around 5%. The maximum annual contribution was 10 kg ha-1 yr' in 1998. Although the total weight of L. niloticus caught was less
than for C. citharus and S. galilaeus, L. niloticus had a higher 'beach sale' value.
All the L. niloticus sampled were caught far below their size at maturity and optimal length at capture (Fig. 10). The most common length caught was 14 to 15 cm, less
than one-fifth the size at maturity and 15% of the optimal size at capture. The
mean weight of L. niloticus sampled was just 394 g.
Beach seines and gill nets accounted for the largest mortality of small-sized L. niloticus. Longlines caught fewer fish but at larger size (Fig. 11). The number of L. niloticus caught by the gill net fishery decreased between August and December as the first-year cohort was fished out (Fig. 12). The pattern of fishing is
similar to C. citharus in that newly spawned fingerlings are targeted from February
onwards by the 25 mm meshed gill net fishery.
L. niloticus were also caught as bycatch (at a length between 8 and 23 cm) by the beach seines during the low water period. Numbers of fish caught peaked in October due to larger catches by longlines, possibly representing the time of spawning.
The high mortality of undersized L. niloticus is cause for concern. This possibly reduces the catch by the longline fishery, which targeted the species at larger size.
Page: 169
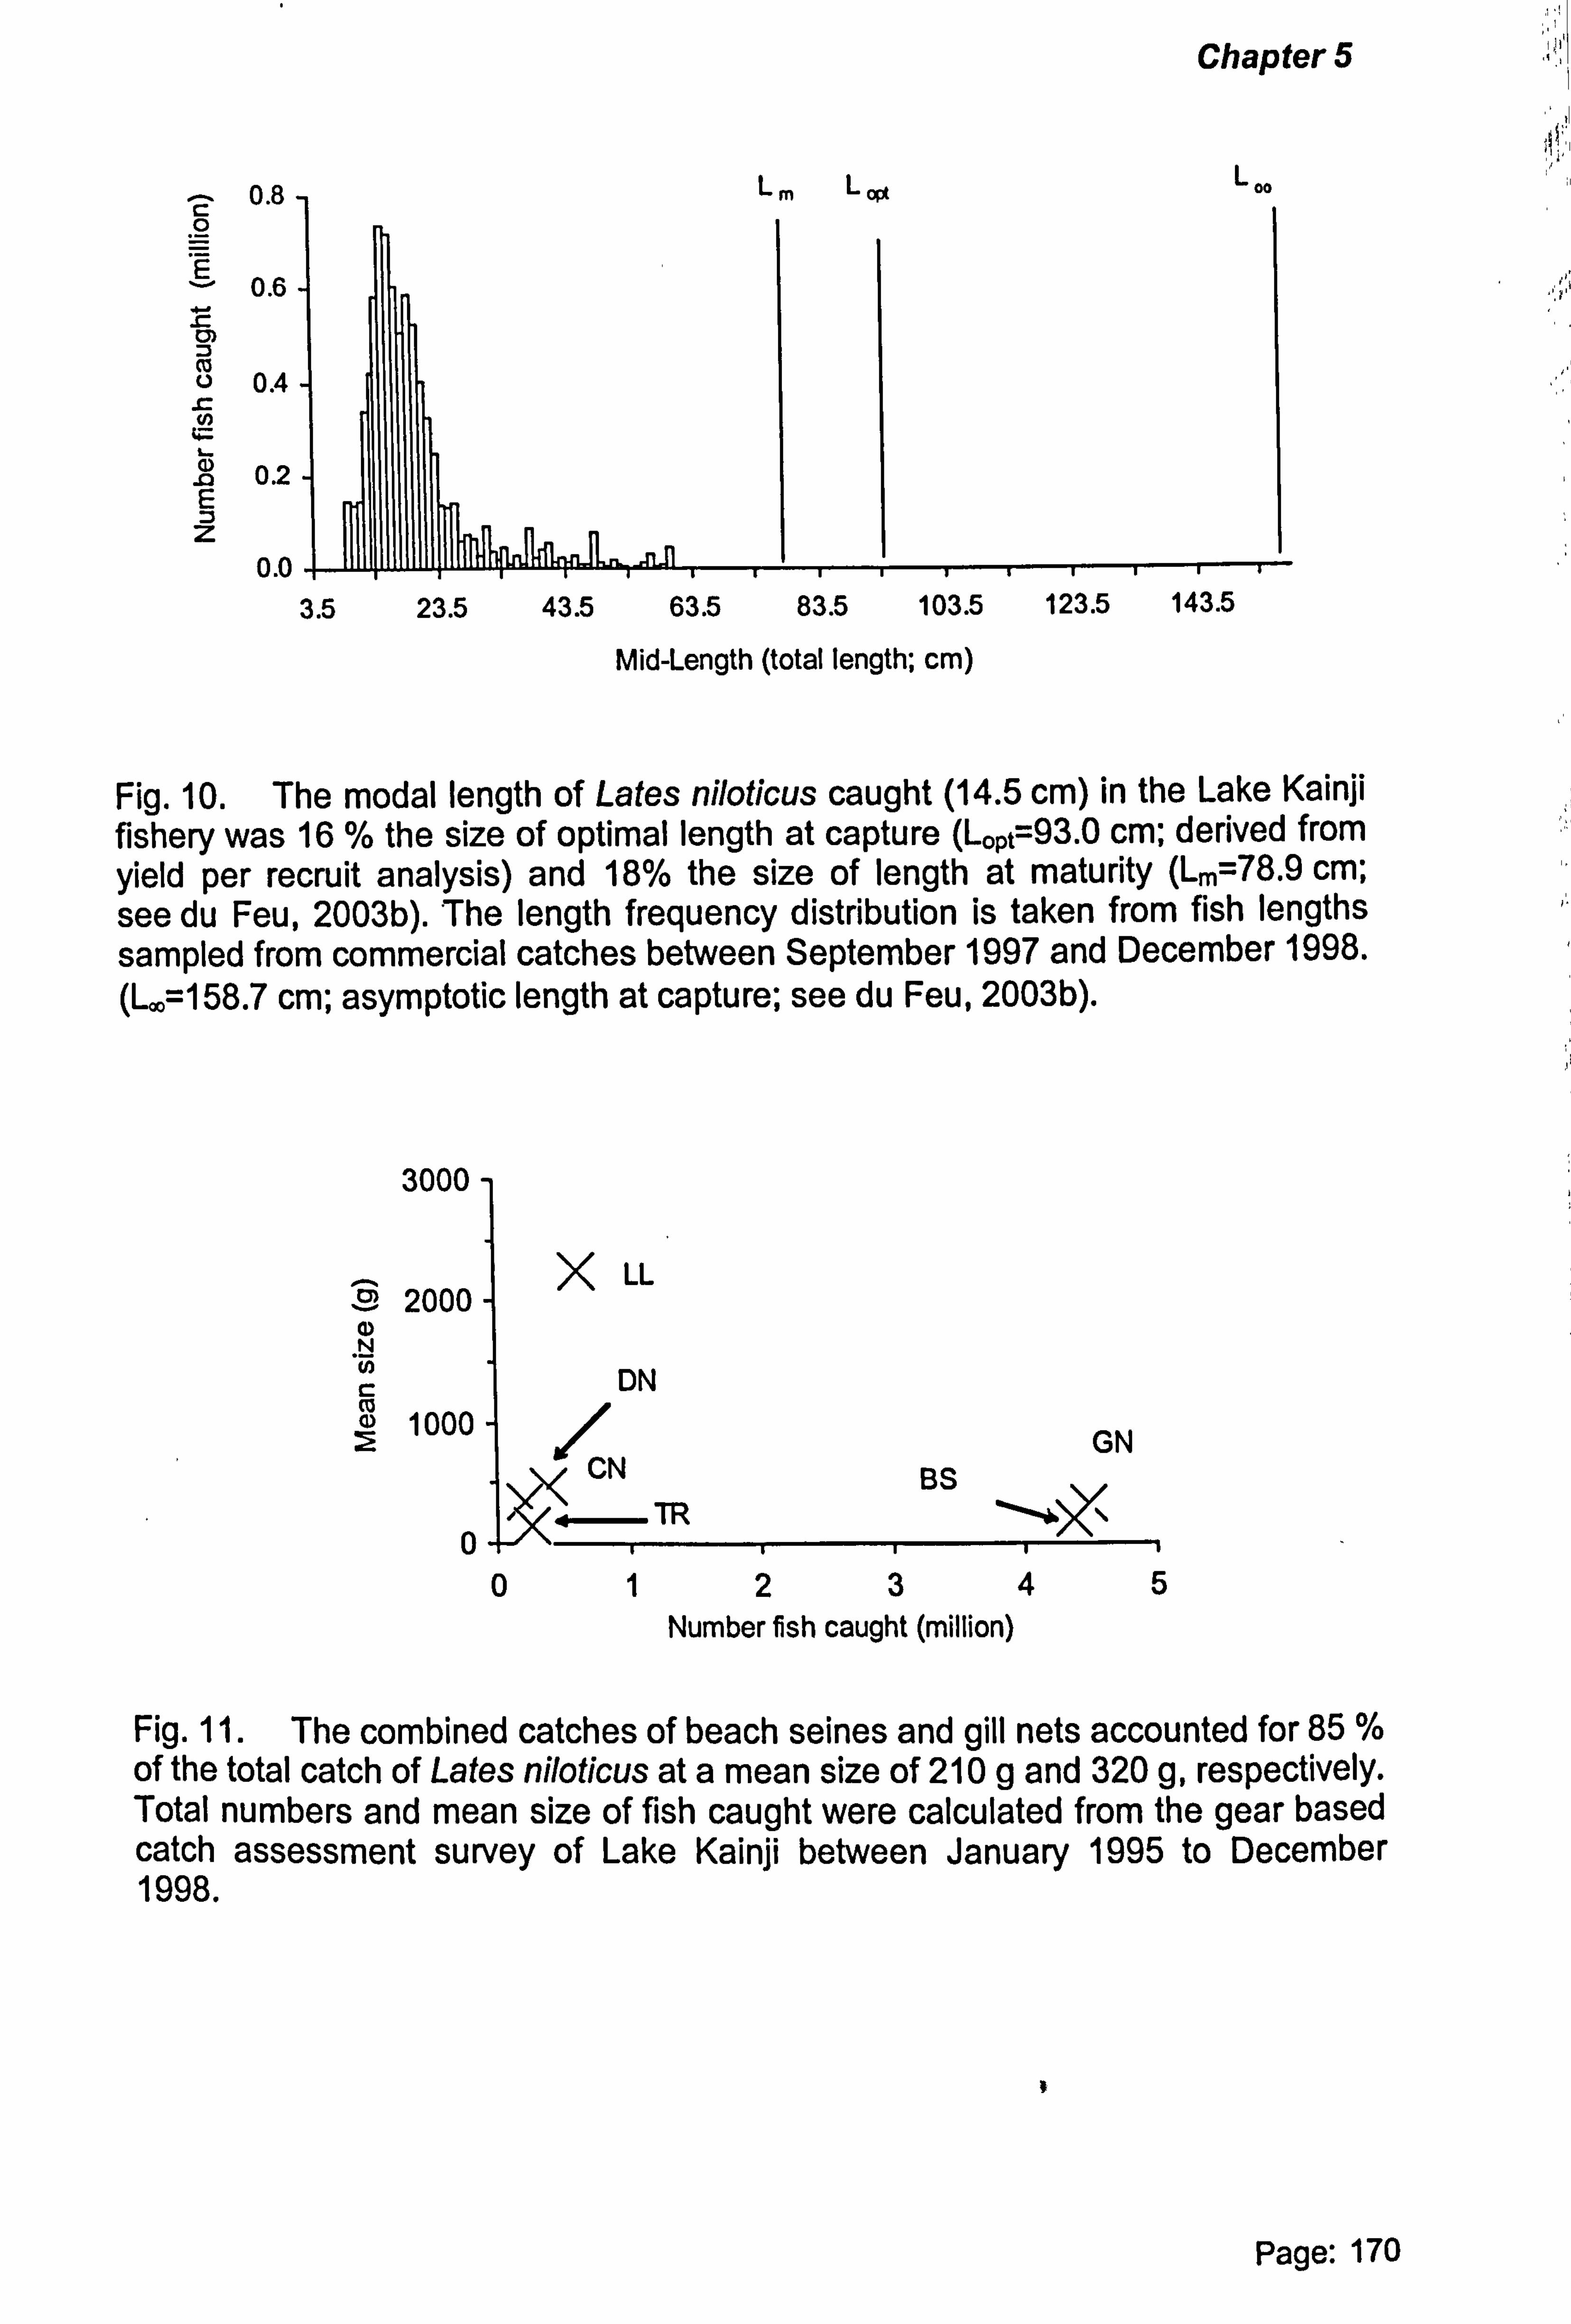
Chapter 5
0.8 O
0.6
0.4
0.2 oC
0.0 -I- 3.5
L_ Lý Loo
Fig. 10. The modal length of Lates niloticus caught (14.5 cm) in the Lake Kainji fishery was 16 % the size of optimal length at capture (Lops=93.0 cm; derived from yield per recruit analysis) and 18% the size of length at maturity (Lm=78.9 cm; see du Feu, 2003b). The length frequency distribution is taken from fish lengths sampled from commercial catches between September 1997 and December 1998. (Loo=158.7 cm; asymptotic length at capture; see du Feu, 2003b).
3000
2000 X LL
a)
DN 1000 GN
CN BS TR ºý
0 012345
Number fish caught (million)
Fig. 11. The combined catches of beach seines and gill nets accounted for 85 % of the total catch of Lates niloticus at a mean size of 210 g and 320 g, respectively. Total numbers and mean size of fish caught were calculated from the gear based catch assessment survey of Lake Kainji between January 1995 to December 1998.
i
Page: 170
23.5 43.5 63.5 83.5 103.5 123.5 143.5
Mid-Length (total length; cm)

,; i li
Chapter 5
1.5 C O
E
1.0 cm Co U
0.5 a E z
0.0
High water -------------------> <------------Low water ---------------> <-----------High water
BS QGN ®LL ,
QOthergears
Fig. 12. The fishing mortality of Lates niloticus was spread throughout the year with gill nets being mainly responsible. Beach seines mainly caught L. niloticus as bycatch during the low water period. The number of fish caught was estimated using numbers of fish lengths sampled from fisherfolk's catches which were raised to the total catch estimates for each gear and month during 1998.
The size of L. niloticus caught was far below the Lopt. Large increases in yield will
result as the size at capture approaches this value (Fig. 13). Higher levels of fishing effort at the present length at capture would cause a fall in yield. Increasing
the size at capture will result in a higher increase in yield than decreasing fishing
effort.
0.04
2 0.03
CL
0.02
0.01 C)
0
....... F=2.0
F=3.1
F=4.0 WHERE: F= 3.1 year' M=0.49 year, Loo=158.7 cm K=0.25 year'
Length at capture (total length; cm)
Fig. 13. The mean length at capture of L. niloticus in 1998 (Lc=14 cm) was 15 % the optimal length at capture (Logt=93.0 cm) calculated using Beverton and Holt yield per recruit analysis. Increasing the size at capture will result in a marked increase in the relative yield per recruit. Altering the levels of fishing effort will have only marginal effect. Mortality and population parameters are from du Feu (2003b). Lc calculated from length frequency data collected during 1998.
Page: 171
JFMAMJJAS0ND Month
15 40 65 90

Chapter 5
DISCUSSION
Since its creation in 1968, the Lake Kainji fishery has largely been unmanaged
and has remained open access. Fisherfolk have thus been able to fish with any
gear type, mesh size or fishing method they wished.
In the case of Lake Kainji, a diversification into gears which targeted small-sized
species has occurred. This mainly occurred after the decline of high catches and large fish size that were experienced during the increased productivity following
initial lake impoundment. It is possible, therefore, that fisherfolk started using other
gears to counteract falls in daily catch (du Feu, 2003a). The gears included a higher number of small meshed gill, cast and drift nets and fishing traps that were
used to target a larger variety of species and size ranges of fish (du Feu, 2003a).
The beach seine, that became popular in the late 1980s and has a mesh size of just 2 mm to catch the small pelagic clupeids, was one such example (du Feu, 2003d).
As well as reduced catches of large fish, fisherfolk stated that they also diversified
gears in order to ensure that fish is available every day to feed their families. Although larger meshed gears have a higher average daily catch than those with smaller meshes, the catch is sporadic, and thus the daily supply of fish is not guaranteed. Eyo & Mdaihli (1997) added that small-sized fish are also easier to
process by smoking than those of larger size. The effect on fish catches of the diversification of the fishery was evident from the large number of species and small size of fish that has been highlighted through the analysis of total yield data.
Results of the analysis of length frequency measurements for the fishery indicated that the catches of the three commercial species mainly consisted of undersized fish. These were generally from the first-year cohort, which were caught a few months after spawning.
Page: 172

Chapter 5
FishBase (Froese & Pauly, 2003) was used to compare the length at maturity (Lm),
optimal length at capture (Lops) and asymptotic fish length (L. ) with measurements from other water bodies (Table III). All measurements for C. citharus were in
approximate agreement, apart from L. which was larger for Lake Kainji. For S.
galilaeus, lengths at Loft and L. for the species in Lake Chad were smaller than
those recorded for Lake Kainji, however, Lm for Lake Kainji was larger than
recoded in other water bodies. Lengths for L. niloticus showed the reverse pattern
with Lopt and L., recorded in Lake Kainji being smaller and Lm being larger than
those from other areas.
Table III. Comparison with estimates from other water bodies of the estimates of the length at maturity (Lr,,: cm) the optimal length at capture (L(, ps; cm) and the asymptotic fish length (L. or Lief; cm) of the commercial fish species from Lake Kainji, Nigeria using data collected during the sampling of length frequencies between September 1997 and December 1998 with estimates obtained from other water bodies. TL=total length, SL=standard length; data arranged by ascending values of L.
Locality Country Length Lm (cm) Loft (cm) Lo, Reference type (cm)
Citharinus citharus citharus FL
Lake Kainji Nigeria SL Lake Kainji Nigeria TL Lake Chad Chad TL Sarotherodon galilaeus galilaeus
TL Fleuvre Chad TL Small Burkino Faso TL reservoirs Lake Volta Ghana Lake Tiberias Israel Lates niloticus
31.3 35.2
25.8
13.8
TL 19.8 TL 22.4
29.9 56.6 Present study Arowomo (1972)
28.9 49.0 Moreau et al. (1995) 30.5 49.3 Moreau et al. (1995)
25.0 45.7 Present study 17.8 30.1 Moreau et al. (1995)
Baijot & Moreau (1997)
Johnson(1974) Trewavas (1983)
TL 78.9 93.0 158.7 Present study Nyanza Gulf Lake Victoria TL 133.8 205.0 Asila & Ogari (1988) Nyanza Gulf Lake Victoria TL 74.0 Witte & de Winter (1995) Lake Chad Chad SL 52.0 Levdque (1997)
Page: 173

Chapter 5
For the three sampled species, almost all the fish were caught at less than half the
size at maturity and far below the optimal size at capture. Yield per recruit analysis indicated that the mean size of the fish presently caught needs to increase from
between 44% to 596% to attain the length required to maximise yields. In a
separate analysis, du Feu & Abiodun (1998) have shown that the overall present level of fishing effort is 40% beyond that needed for maximum sustained
exploitation (MSY) of the resource.
Short-term yield estimates indicated that catches have already started to decline.
Between 1996 and 1998 lake yield fell from 300 to 227 kg ha" yr (du Feu, 2003a). Total fish yield is likely to decline further if increases in fishing
effort occur in future. Effort appears likely to increase given the increasing
numbers of fisherfolk, both from a rising population and from a greater proportion
of women opting to fish together with a continued rise in the use of fishing
methods such as the beach seine, monofilament gill nets and. fishing traps (du Feu, 2003a).
Similar diversifications of fisheries and targeting of small-sized species as
occurred in Lake Kainji are likely to have occurred elsewhere. One example is
reservoirs in Sri Lanka (Sugunan, 1997). High fishing pressure and the use of
undersized gill nets has caused the mean size of 0. mossambicus, the major
species, to fall to below 200 mm in one reservoir. Amarasinghe (1987) noted that
this is typical of many reservoirs and has led to overexploitation and declining
rates of CpUE in the region.
Comparable fishing pressure and targeting of small-sized fish as in Lake Kainji,
may have caused other fisheries to collapse long ago. The reason that the Lake Kainji fishery is still relatively high yielding can possibly be explained by the biology and behaviour of the fish species. The high number of fish caught during the sampling period indicates that numerous fingerlings are required to sustain the fishery. The notion is supported by the successful species such as C. citharus and L. niloticus having relatively high fecundities (Imevbore, 1970; Omorinkoba & du Feu, 1994).
Page: 174

Chapter 5
A further aspect influencing recruitment was noted by Balogun (1986) and
Lelek (1972) who noted that the large mature fish (particularly of C. citharus and
L. niloticus) inhabit the deeper portions of the lake. The absence of large meshed
nets and the rougher water conditions that prohibit regular fishing in the central
lake area may decrease the probability of capture of mature fishes of these
species (du Feu & Abiodun 1999). Areas of submerged trees in the lake are largely unfishable. These may also form refuges for young fish and lead to
escapement from the fishing gears thus giving some chance for fish to reach
maturity.
A further aspect influencing the success of species is their ability to use the
flooded macrophyte vegetation in the extensive drawdown or floodplain areas for
protected nursery grounds leading to lower natural mortality. High fishing pressure
poses more concern to species such as cichlids, i. e., because they are targeted at
smaller size ranges by fishing trap and cast net fisheries. Cichlidae have a lower
fecundity, but a more regular pattern of breeding and need a relatively higher
proportion of breeding adults than other highly fecund species to maintain the
population size (Imevbore 1970; du Feu & Abiodun 1998). The potential of a
sudden cichlid stock collapse is therefore greater than for the higher fecund
species such as C. citharus and L. niloticus.
Results show that the four main commercial species of Lake Kainji are mainly targeted as first-year cohort fish. The yield per recruit analysis suggests that higher yields may be possible if the size at capture is raised. Beach seines, small meshed gill nets and traps are the main fishing gear types capturing small sized fish. It would therefore appear prudent to limit either the number of gears fishing or time or area in which they are fished.
Page: 175

Chapter 5
The problem is that the majority of fisherfolk (especially fisherwomen) prefer to use
such gears as they catch fish on a regular basis. A daily supply of fish is needed to
feed their families and limiting the use of such gears may therefore -affect the
nutrition of lakeside residents. The beach seine is a highly profitable fishing
method and limiting its use is certain to be met with resilience by the relatively few
fisherfolk who use the gear. A large number of fishing villages exist along the
entire shoreline, fisherfolk mainly use paddles and cannot travel far, therefore
establishing closed areas will also be problematic. Finally, the long shoreline, the
many hiding places and use of low-paid enforcement staff who are vulnerable to
bribery makes it very difficult to effectively police closed seasons.
REFERENCES
Amarasinghe, U. S. (1987). Growth overfishing: a potential danger in the Sri Lankan reservoir fishery. In: Reservoir Fishery Management and Development in Asia. Proceedings of a Workshop held in Kathmandu,
Nepal, 23-28 Nov. 1987. Ottawa, Canada. The International Development Research Centre (Canada), ISBN: 0 88936 515 6: 105-112.
Arawomo, G. O. (1972). The ecology of the fish genera Citharinus and Distichodus in Lake Kainji Nigeria. M. Phil Thesis, University of Ife, Nigeria. 129pp.
Asila, A. A. and Ogari. J. (1988). Growth parameters and mortality rates of Nile
Perch (Lates niloticus) estimated from length-frequency data in the Nyanza Gulf (Lake Victoria). FAO Fish. Rep. 389: 272-287.
Baijot, E. and Moreau, J. (1997). Biology and demographic status of the main fish
species in the reservoirs of Burkina Faso. In: Hydrobiological Aspects of Fisheries in Small Reservoirs in the Sahel region. (eds. E. Baijot, J. Moreau
and S. Bouda). Technical Center for Agricultural and Rural Cooperation ACP-EU, Wageningen, Netherlands: 79-110.
Page: 176
Chapter 5
Balogun, J. K. (1986). Fish distribution in Kainji Lake, Nigeria, Journal of Fish
Biology, 29: 489-498.
Beverton, R. J. H. and Holt, S. J. (1957). On the dynamics of exploited fish
populations. Fish. Invest. Ser. 11.19.533pp.
Cowx, I. G. (1991). Catch effort sampling strategies: conclusions and
recommendations for management. In: Catch Effort Sampling Strategies;
their Application in Fresh water Fisheries Management. I. G. Cowx ed.
Fishing News Books. ISBN 0 85238 177 8: 404-413.
De Silva, S. S. (1988). Reservoirs of Sri Lanka and their fisheries. FAO Fisheries
Technical Paper. No. 298.128pp.
du Feu, T. A. (2003a). The changing fishery of Lake Kainji, Nigeria from
impoundment to some 30 years after. PhD. Thesis submitted to the
University of Hull, UK. Chapter 6: 180-228.
du Feu, T. A. (2003b). Estimation of population parameters for the six commercial
species in Lake Kainji, Nigeria using length frequency data sampled from
artisanal fish catches. PhD. Thesis submitted to the University of Hull, UK.
Chapter 4: 126-155.
du Feu, T. A. (2003c). Changes in the fish fauna of a reservoir fishery (Lake Kainji,
Nigeria) determined using commercial catch data and sampling using differing meshed gill nets. Ph. d. Thesis submitted to the University of Hull,
UK. Chapter 3: 99-125.
du Feu, T. A. (2003d). Physical, sociological and fishery aspects of Lake Kainji, Nigeria. PhD. Thesis submitted to the University of Hull, UK. Chapter 2: 41- 98.
du Feu, T. A. and Abayomi, O. S. (1997). Frame survey of Kainji Lake, Northern Nigeria 1996. Kainji Lake Fisheries Promotion Project Technical Report Series. No. 7. GTZ, Eschbom, Germany. ISBN 978 037 006 4.37pp.
Page: 177
Chapter 5
du Feu, T. A. and Abiodun, J. A. (1998). Predictions of fish yields and the status of the
Kainji Lake fishery. Kainji Lake Fisheries Promotion Project Technical Report
Series. No. 17. GTZ, Eschbom, Germany. ISBN 978 037 015 3.56pp.
du Feu, T. A. and Abiodun, J. A. (1999). Fisheries statistics of Kainji Lake, Northern
Nigeria. Nov. 1994- Dec. 1998. Kainji Lake Fisheries Promotion Project
Technical Report Series. No. 13. GTZ, Eschborn, Germany. ISBN 978 037
012 9.128pp.
Entz, B. A. G. (1984). A synthesis and evaluation of activities of FAO/UNDP projects
on five African man-made lakes: Kainji, Kariba, Kossou, Nasser-Nubia and Volta. FAO Fisheries Circular. No. 774.34pp.
Eyo. A. A. and Mdaihli, M. (1997). Post harvest losses in fisheries of Kainji Lake.
Kainji Lake Fisheries Promotion Project Technical Report Series. No. 5.
GTZ, Eschborn, Germany. ISBN 978 037 004 8.75pp.
Froese, R. and Binohlan, C. (2000). Empirical relationships to estimate, asymptotic length, length at first maturity and length at maximum yield per recruit in
fishes, with a simple method to evaluate length frequency data. Journal of Fish Biology. 56, (4): 758-773.
Froese, R. and Pauly, D. [eds]. (2003). FishBase. World Wide Web electronic publication. www. fishbase. org. August 2003.
Imevbore, A. M. A. (1970). Some preliminary observations on the ratio and fecundity of the fish in River Niger. In: Kainji Lake Studies, Vol. 1, Ecology. S. A. Visser ed. Ibadan press: 87-98.
Johnson, R. P. (1974). Synopsis of biological data on Sarotherdon galilaeus. FAO Fish. Synop. (90). 42pp.
Lelek, A. (1972). Fish populations of Kainji Lake: trends in their development and utilisation. Fi: SF/N1R 24 Technical Report. 2.121 pp.
Page: 178
Chapter 5
Leveque, C. L. (1997). Biodiversity dynamics and conservation: the fresh water fish
of tropical Africa. ORSTROM. Cambridge Univ. Press, UK. 438pp.
Moreau, J., Palomares, M. L. D., Torres, F. S. B. and Pauly, D. (1995). Atlas
demographique des populations de poissons d'eau douce d'Afrique.
ICLARM Technical Report. 45.140pp.
Omorinkoba, W. S. O. and du Feu, T. A. (1994). The identification of breeding
grounds of the commercially important fish species in Lake Kainji. National
Institute for Fresh water Fisheries Research (N1FFR), Annual Report. 1994.
ISSN 0331-9296: 48-53.
Sparre, P. & S. C. Venema. (1992). Introduction to tropical fish stock assessment. Part 1. Manual. FAO Fisheries Technical Paper. No. 306.1, Rev. 1. Rome,
FAO: 376pp.
Sugunan, V. V. (1997). Fisheries management of small water bodies in seven
countries in Africa, Asia and Latin America, FAO Fisheries Circular. No. 933
FIRI/C933.
Trewavas, E. (1983). Tilapiine fishes of the genera Sarotherodon, Oreochromis
and Danakilia. British Museum of Natural History, London, UK. 538pp.
Verheust, L. (1998). Obtaining basic information for the enhancement of small water body fisheries: a regional project viewpoint. In: Inland Fishery Enhancements. Papers presented at the FAO/DFID Expert Consultation on Inland Fishery Enhancements Dhaka, Bangladesh, 7-11 April 1997. T. Petr, ed. FAO Fisheries Technical Paper No. 374. Rome FAO: 183-203.
Witte, F. and de Winter. W. (1995). Appendix II. Biology of the major fish species of Lake Victoria. In: Fish Stocks and Fisheries of Lake Victoria. A Handbook for Field Observations. (eds. F. Witte and W. L. T. Van Densen). Samara Publishing Limited, Dyfed, Great Britain: 301-320.
Page: 179
Chapter 6
Chapter 6
The changing fishery of Lake Kainji, Nigeria from
impoundment to some 30 years after.
ABSTRACT
Lake Kainji was created in 1968. Intermittent frame and boat-based catch assessment
surveys were carried out until 1978. Frame surveys were reintroduced in 1993 and a new
gear-based catch assessment survey established in 1995. Thirty years after impoundment, total fish yield has risen to levels in excess of those experienced just after impoundment when increased productivity and high fish yields are normally noted. It is
suggested, that the rise was caused by the diversification of the fishery and enhanced local knowledge of the fisherfolk that enabled them to target almost all species and all
sizes of fish present. A beach seine fishery, targeting the endemic pelagic Clupeidae, was the major contributor to the yield in the 1990s. Other small-meshed gears were used
extensively. Yields declined between 1995 and 2000, perhaps due to growth overfishing. The mean number of gears owned by fisherfolk also declined, possibly as a result of
reduced income. The situation is cause for concern and management intervention seems essential.
Key words: catch and effort sampling; fish yield; frame survey; Lake Kainji; overfishing; reservoir fishery.
INTRODUCTION
The closure of the Kainji Dam in Northern Nigeria in 1968 resulted in 134 km of the River Niger being transformed into a shallow eutrophic man-made lake. At high
water, Lake Kainji has a shoreline length of 874 km and a surface area of 1270 km2 and is the fifth largest reservoir in Africa and the second largest in West Africa after Lake Volta (Imevbore, 1970; El- Zarka, 1973).
Page: 180
Chapter 6
The reservoir has three distinct basins; a deep lower area, a shallow central basin
(comprising of almost three-quarters of the lake area) and an upper riverine
section (Motwani, 1970; Karlman, 1982) (Fig. 1). Extensive floodplains exist in the
central and upper lake basins. These become exposed during an annual drawdown of some 10 m (Bidwell, 1976), when the water volume of the lake
reduces by almost two-thirds (60%) and the surface area by approximately one- third (30%) (Bidwell, 1976). The floodplains are important fish breeding and
nursery areas (Omorinkoba & du Feu, 1994).
The reservoir also has a high rate of water exchange. This equates to a turnover
of the total water volume of four times every year (Imevbore, 1975). The high flow-
through gives the lake the characteristics of a slow moving river (Karlman, 1982).
The water currents are particularly prominent in the upper basin. Upstream
migration and spawning takes place in this basin during the onset of the main flood
that usually occurs in September each year (Omorinkoba & du Feu, 1994).
Lake Kainji was built for the generation of hydroelectricity and for the control of downstream flooding. Of social importance, has been the development of a productive artisanal lake fishery.
The Kainji basin has been the focus of much fisheries and reservoir development
related research both before and just after impoundment. Ibeun (1995) has listed
more than 330 articles, which were produced prior to 1993
The initial research was undertaken both by a joint program between UK and Nigerian Universities (from 1965 to 1978) and a separate UNDP/FAO Kainji Lake Research Project (KLRP) that started in 1968. The KLRP was handed over to the Nigerian Authorities as the Kainji Lake Research Institute (KLRI) in 1974.
Page: 181
Chapter 6
The early research, performed by the KLRP and KLRI, included multidisciplinary
studies on the changing abundance of fish species, limnology, wildlife ecology, farming and husbandry practises and human disease. A comprehensive time-
series of fish sampling was also undertaken using fleets of multi-meshed gill nets (Turner, 1971; Ita, 1975 & Blake, 1977). Research covering the artisanal river and lake fisheries was more limited and included papers by Aiyedun &
Adegboye (1967), Banks et al. (1965), Jenness (1970), Reed (1970) &
Jenness (1973). A list of fishing villages built during the resettlement program was
recorded by Oyedipe (1983).
An inventory of all fishing villages and a count of all fisherfolk and canoes (frame
survey) around the reservoir was undertaken by the KLRP in 1970 (Bazigos, 1971)
and by the KLRI in 1975 and 1978 (Ekwemalor, 1975 & 1978). Estimates of fish
yield were made during catch assessment surveys in 1970/1971, for part of 1972 by Bazigos (1972 & 1974) and in 1976 by Ekwemalor (1977). After 1978,
monitoring of the fishery ceased for 15 years.
Fisheries monitoring re-commenced in 1993 during a technical co-operation project the `Nigerian-German (GTZ) Kainji Lake Fisheries Promotion Project' (KLFPP). The project objective was 'that a management plan is designed, tested
and implemented to ensure the sustained exploitation of the reservoir's natural resources'. This was to be undertaken by maximising the participation of the lakeside communities (KLFPP, 1996).
Current information on the status of the fishery was required to design the plan. To
update the previous data collected prior to 1978, annual frame surveys (du Feu, 1993; du Feu & Abayomi, 1997) and monthly gear-based catch assessment survey (Turner, 1994; du Feu & Abayomi, 1997) were started by the KLFPP in 1993 and 1995 respectively, under the supervision of the author.
The early data collected during the post-impoundment period is examined and combined with the more recent information. The resulting time series of data is perhaps one of the most comprehensive of any reservoir in Africa.
Page: 182
Chapter 6
In this chapter, I have used the information to endeavor to present a description of how an artisanal tropical reservoir fishery, such as Lake Kainji, has developed
from impoundment to some 30 years after.
MATERIALS AND METHODS
Frame surveys of Lake Kainji prior to 1978 included an inventory of all fishing
villages and a count of all fisherfolk and canoes. A count of the number of fishing
gears present was not undertaken since the catch assessment survey only
recorded the catch by canoe at that time.
During the same period, a catch assessment survey sampled fish catch and fishing effort. Total fish yield was estimated by multiplying the mean catch per canoe by the total fishing effort of the canoes. Fishing effort was calculated by
raising the total number of canoes, estimated from the preceding frame survey, to
the mean fishing activity of canoes. Fishing activity was estimated by the
proportion of the total number of canoes present in the village that went fishing that day.
Estimates of fish yield were only calculated for nine months between 1970/1971, for three months in 1972 and for six months in 1976. Yield for the intervening
periods (1969, part of 1971 and from 1973 to 1975) were estimated using past and future projections from the estimates made (Bazigos, 1972 & 1974; Ekwemalor 1977). For these calculations, the projections of the CpUE were taken from the
relationship existing between catch per canoe and the catch recorded during
experimental sampling programs using multi-meshed gill nets. Forecasts of fishing
effort were made from projections of canoe number (from the frame surveys undertaken in 1970,1975 & 1978) and an assumed constant rate of fishing activity. The total fish yield for the projected years was only calculated for the central lake basin and was then scaled up to the whole lake using the proportional differences in yield between the lake basins recorded from the full catch assessment surveys.
Page: 183
Chapter 6
Published estimates by Bazigos (1972) & Ita (1993) of the total fish yield for Lake
Kainji from 1969 to 1976 were therefore only based on 18 months of actual survey data. In light of this, the fish yield for this period was re-estimated and verified
using 2500 catch records from the catch assessment survey (for the years 1970 to
1978) and some 4000 catch records from nets fished during the experimental
sampling programs using multi-meshed gill nets (from1969 to 1978). Data sheets for these periods were found in storage at NIFFR, checked for accuracy by
comparing distributions and outliers with the current data set from supervised
collection and analysed by the author.
The rationale for using canoes as the sampling unit in the catch assessment
survey between 1970 and 1976 was that the fisherfolk mainly fished with a
constant number of gill nets. The total catch was therefore taken to be proportional to the number of canoes that went fishing.
The use of canoes as the sampling unit means that information on the number of differing gear types used for this early period is limited. The individual catch
records from the catch assessment survey found in storage were therefore
re-analysed. These provided estimates of the level of fishing effort and daily catch (CpUE) by gear type, the mean size of fish caught and mesh size distribution.
The catch assessment survey undertaken between 1995 and 2000 by the KLFPP
sampled catch and effort by gear type (gear-based), rather than by canoe (canoe- based). The number of individual fishing gears owned by each entrepreneur (the
owner of fishing equipment) was therefore recorded during an annual frame
survey. To avoid double counting, the frame survey was undertaken by three teams over a short time and at high water (in December) when the inter-lake
migration of the entrepreneurs was least. All entrepreneurs were coded and their
names and ownership of gears were checked against the previous years records. After every frame survey, five percent of the villages were selected at random and total gear numbers from the frame survey were checked by physical counts. In 2000, a full lake-wide count of fishing canoes was undertaken to check frame survey estimates. The count was within 5% of the frame survey estimate.
Page: 184
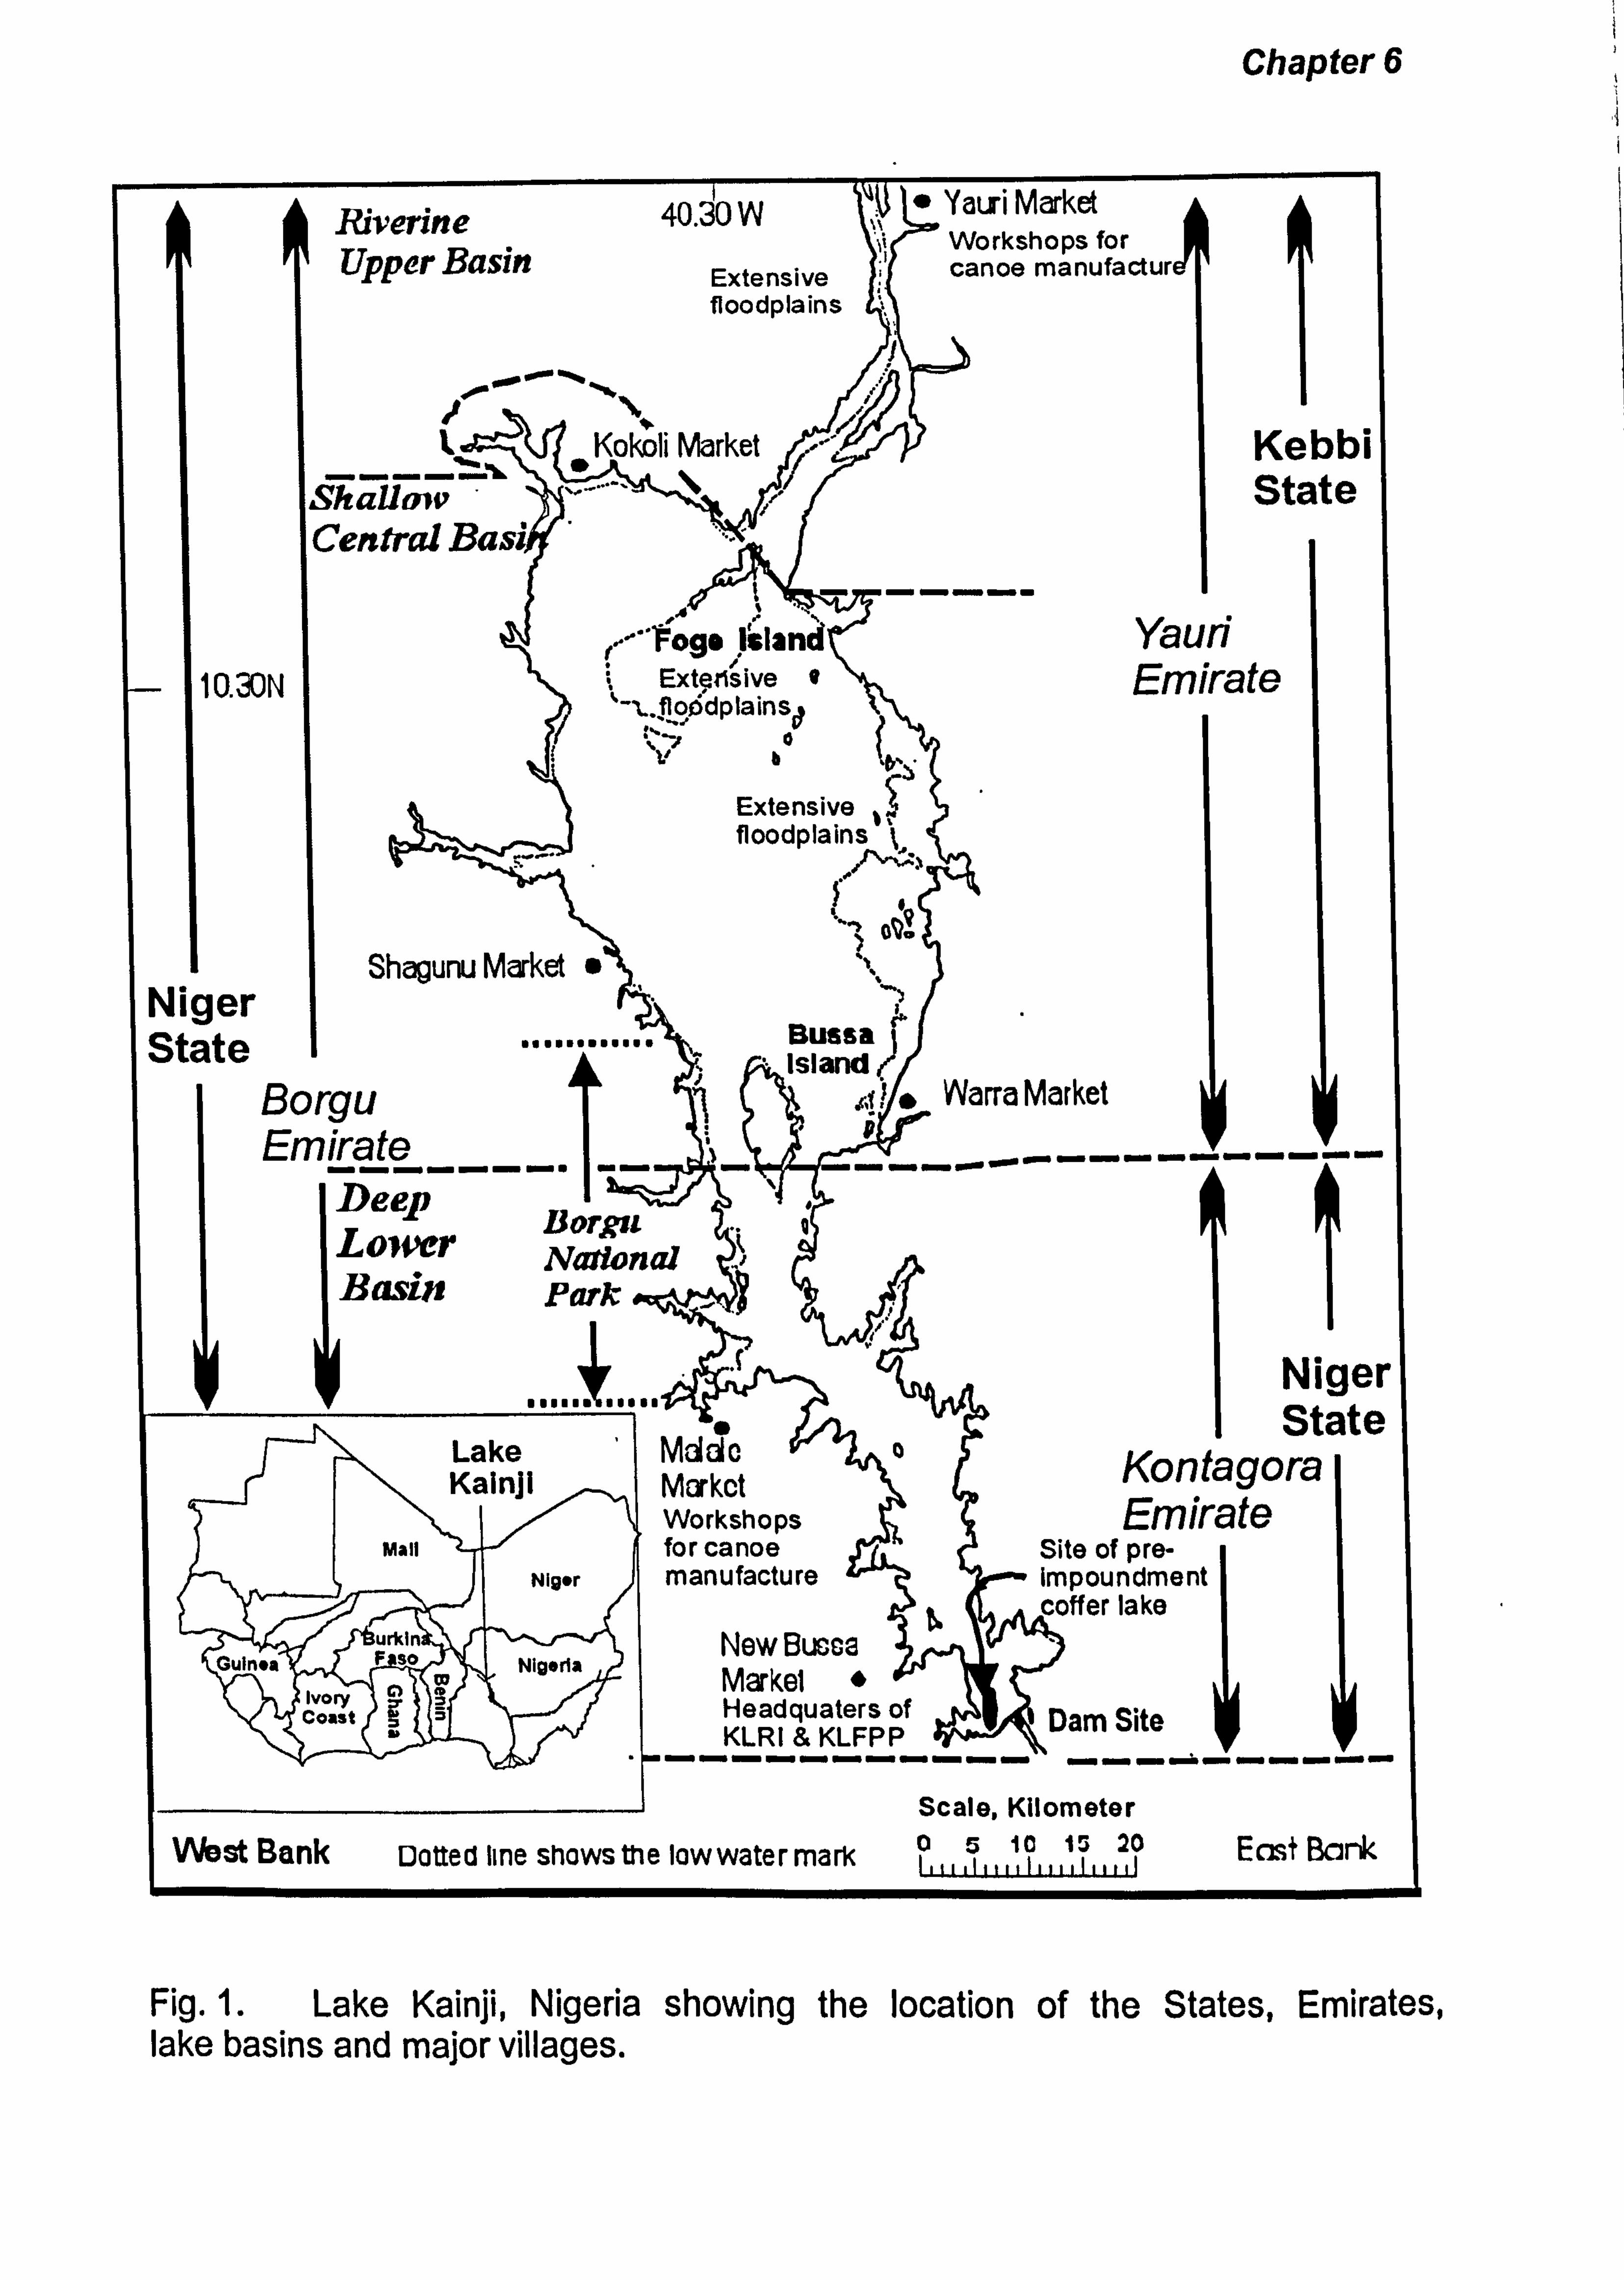
Chapter 6
Riverine Upper Basin
110.30N
Niger State
f Kokoli Market
Shallmv Central Basi.
40.30 W
Extensive floodplains
Kokoli Market
3asi
Aý ý1
, -, "'Pogo I=land Extensive 9
2 `-t. otidplainsd
Shagunu Market
Borgu Emirate
Deep Lower Jiorgu
National Basin Park .
" Yauri Market 'w Workshops
canoe man'.
Kebbi State
Yauri Emirate
Extensive floodplains \
Busaa Island
.4 0* Warra Market
------------r-
Lake M01010 V, -LA a Kainji Market
Workshops Man for canoe
Niger manufacture
Urkin New Bucce F so Nigeria Markel "
Ivory coast Headquaters of KLRI & KLFPP
-----------
Niger State
Kontagora Emirate
Site of pre- impoundment 9ffer lake
Dam Site
Scale, Kilometer
West Bank Dotted line shows the lowwatermaric 0a io i' 20 East Bank Iii[ 11i11111111I1IIII
Fig. 1. Lake Kainji, Nigeria showing the location of the States, Emirates, lake basins and major villages.

For the catch assessment survey, fish catch and fishing activity levels were
sampled initially for four days (between 1993 and 1995) and then for two days
(1995 to 2001) every month in 15 villages around the lake. The sampling villages
were representative of the gear mix and fishing patterns that occurred in that area (verified using annual frame survey data). Fishing activity was sampled from
twenty fisherfolk in each village, the total number of gears they owned was
representative of the gear mix occurring in that village. Entrepreneurs with small
and large gear ownership (perhaps having differing levels of fishing activity) were included. Data recorders were supervised for half of the recording days, village
officials verified that recorders were recording on other days. Rigorous data
checking and verification occurred at all stages. The total number of fishing gears for each gear type was used to calculate the fishing effort of that gear. The fishing
effort was multiplied by the mean CpUE of each gear type to give yield estimates. Separate yield estimates were obtained for each of the six gear types and for each
of the 20 sampled fish taxa groups caught by the lake fishery.
Estimation of the number of gears and the yield of beach seine fishery after 1998
was not possible due the ban of the gear by the Kainji Lake Fisheries Management and Conservation Unit in early 1999.
All mesh sizes cited in this chapter are from the catch assessment survey and represent nets fished. Mesh sizes refer to the stretched mesh size (in mm). Figures quoted for the number of gears per km2 lake area and the length of shoreline refer to the lake area at high water (1270 km2 and 874 km respectively). Appendix 1 gives the number of samples recorded during the individual frame and catch assessment surveys.
RESULTS
FISHING VILLAGES
The total number of fishing villages around Lake Kainji in 1970 (two years after impoundment) was 258 (Fig. 2). This represents a density of 1.4 villages per km shoreline. Between 1970 and 1975, the number declined by an average of 17 villages per year. In 2000 the number of villages was 314 (Appendix 4).
Page: 186
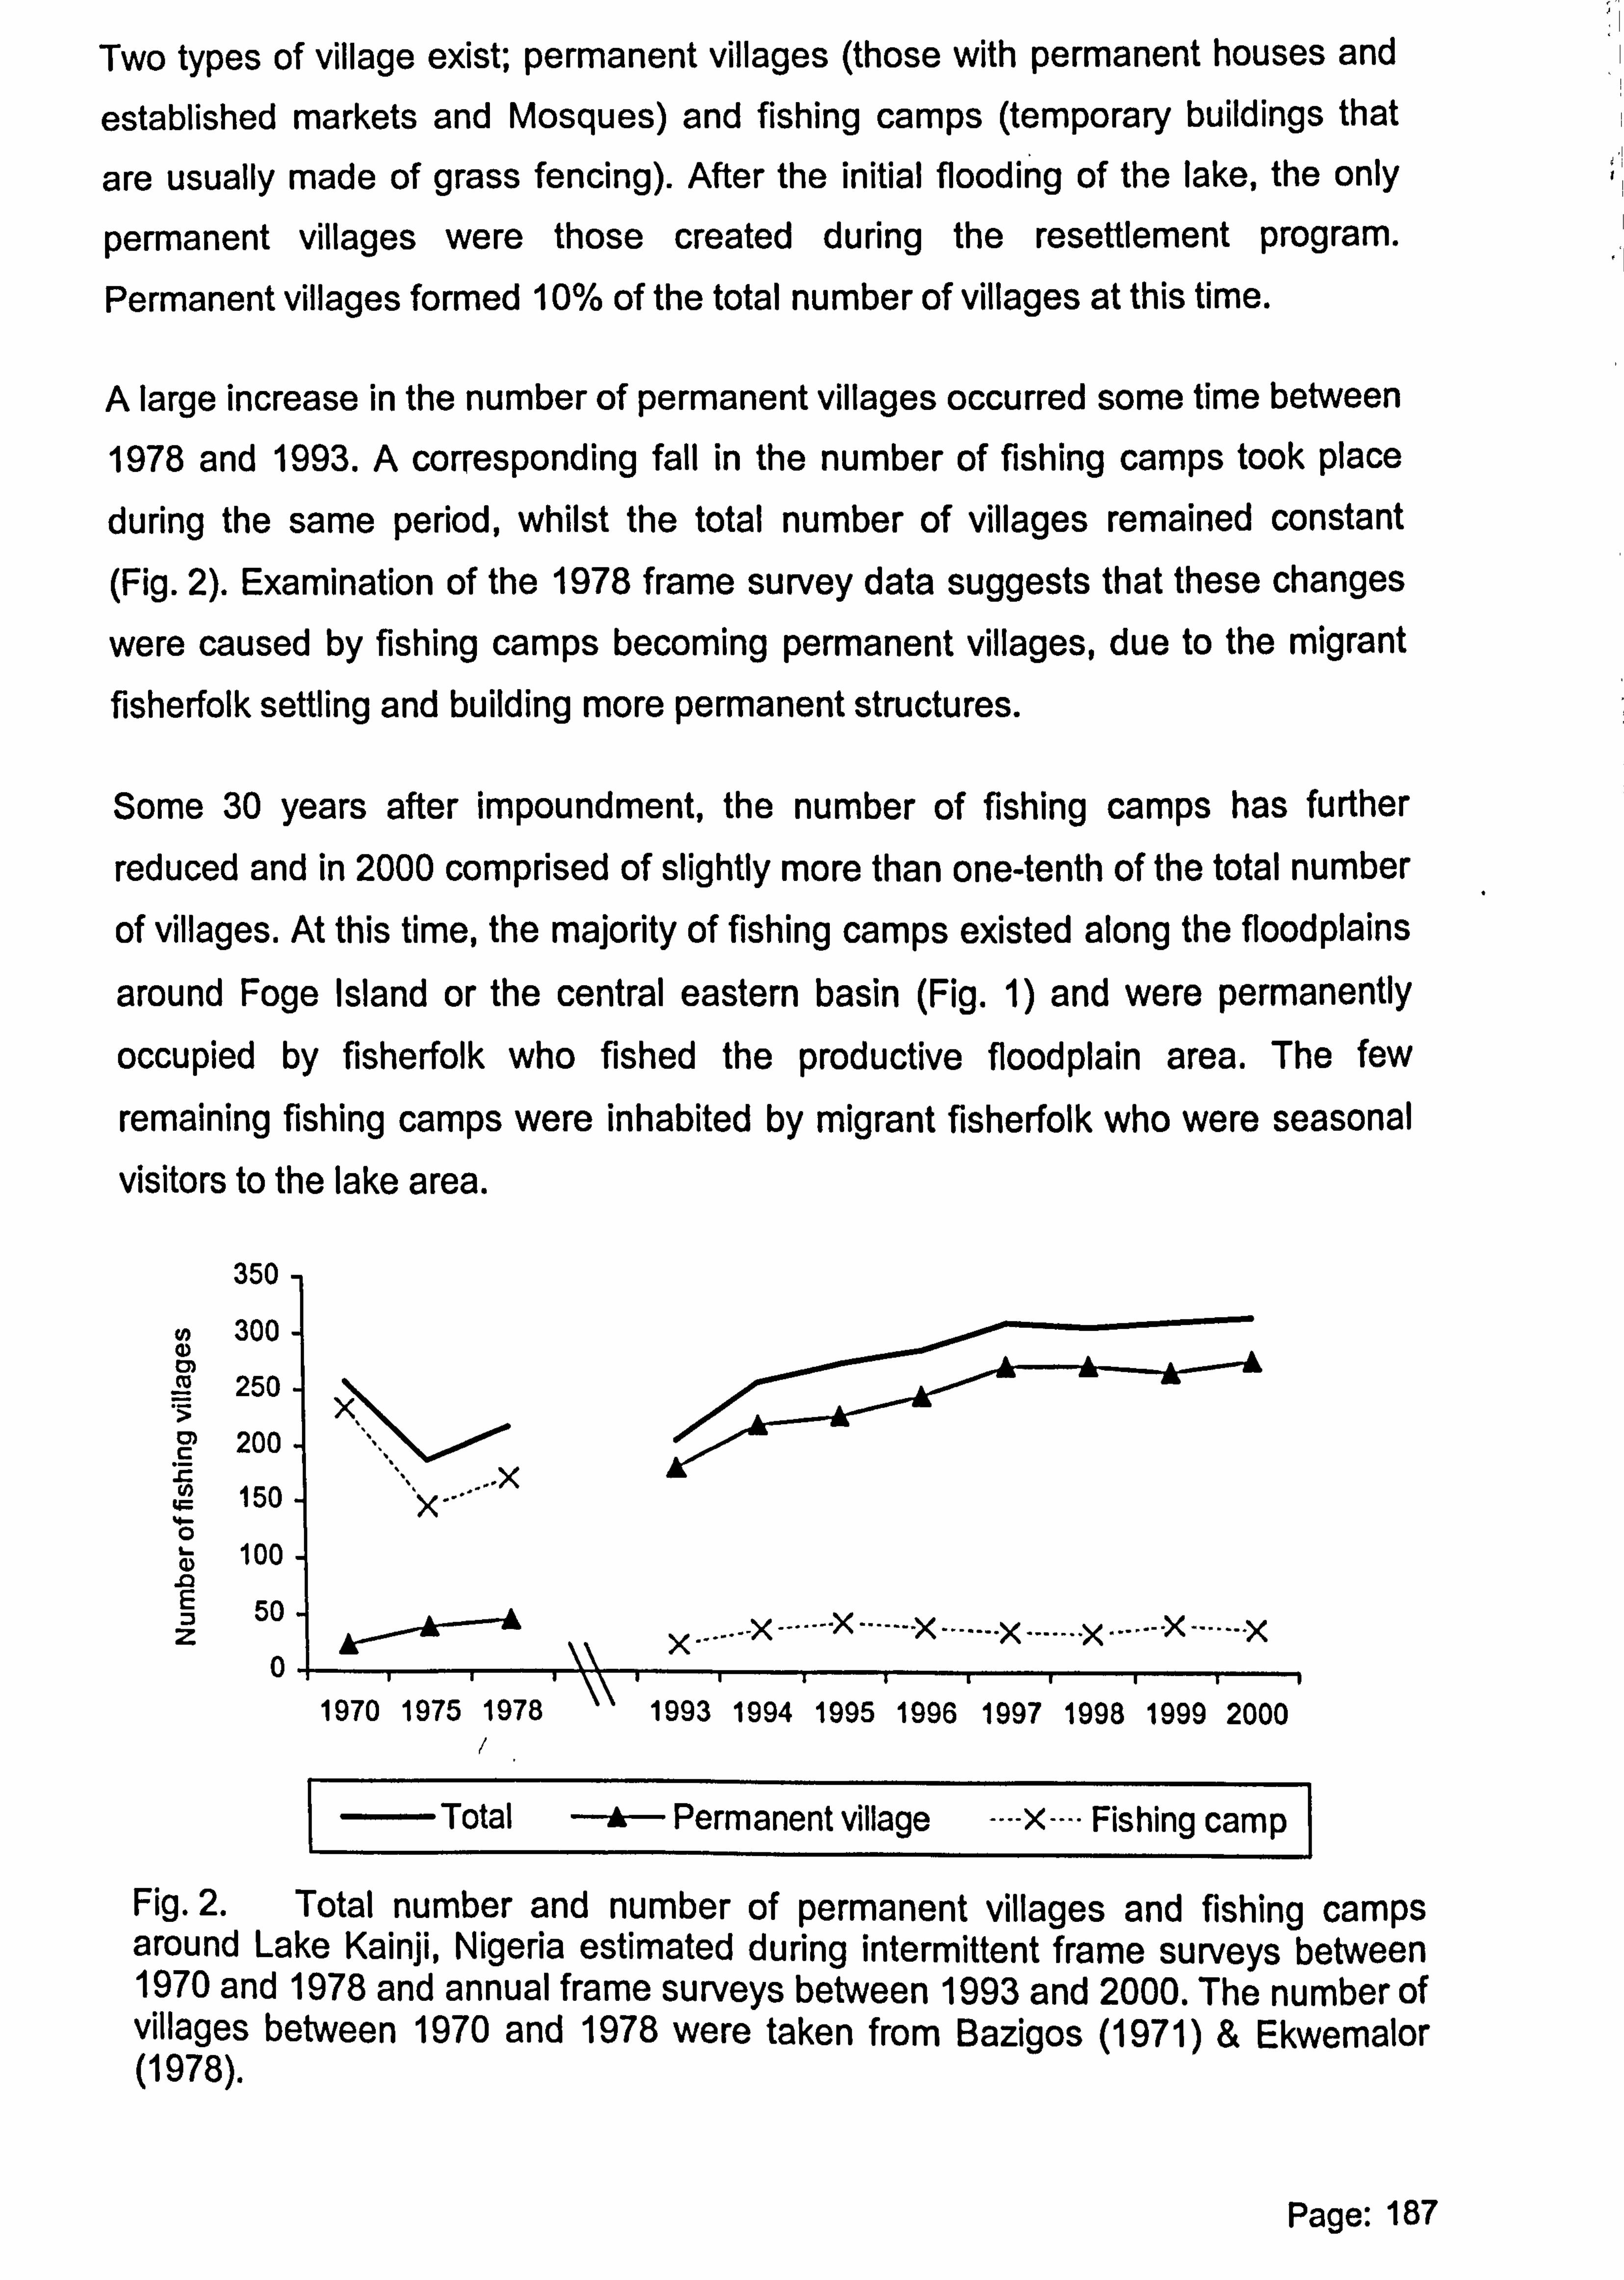
Two types of village exist; permanent villages (those with permanent houses and
established markets and Mosques) and fishing camps (temporary buildings that
are usually made of grass fencing). After the initial flooding of the lake, the only
permanent villages were those created during the resettlement program. Permanent villages formed 10% of the total number of villages at this time.
A large increase in the number of permanent villages occurred some time between
1978 and 1993. A corresponding fall in the number of fishing camps took place during the same period, whilst the total number of villages remained constant (Fig. 2). Examination of the 1978 frame survey data suggests that these changes
were caused by fishing camps becoming permanent villages, due to the migrant fisherfolk settling and building more permanent structures.
Some 30 years after impoundment, the number of fishing camps has further
reduced and in 2000 comprised of slightly more than one-tenth of the total number
of villages. At this time, the majority of fishing camps existed along the floodplains
around Foge Island or the central eastern basin (Fig. 1) and were permanently
occupied by fisherfolk who fished the productive floodplain area. The few
remaining fishing camps were inhabited by migrant fisherfolk who were seasonal
visitors to the lake area.
350
N 300 rn f0 250
X 200
X 150 w
100
50 ýý X -X
X >(.... __. X. .... X.. _.. _. X.... __X 0
1970 1975 1978 1993 1994'1995'1996' 994 1995 1996 1997 1998'1999'2000
Total A Permanent village ----x--.. Fishing camp
Fig. 2. Total number and number of permanent villages and fishing camps around Lake Kainji, Nigeria estimated during intermittent frame surveys between 1970 and 1978 and annual frame surveys between 1993 and 2000. The number of villages between 1970 and 1978 were taken from Bazigos (1971) & Ekwemalor (1978).
Page: 187
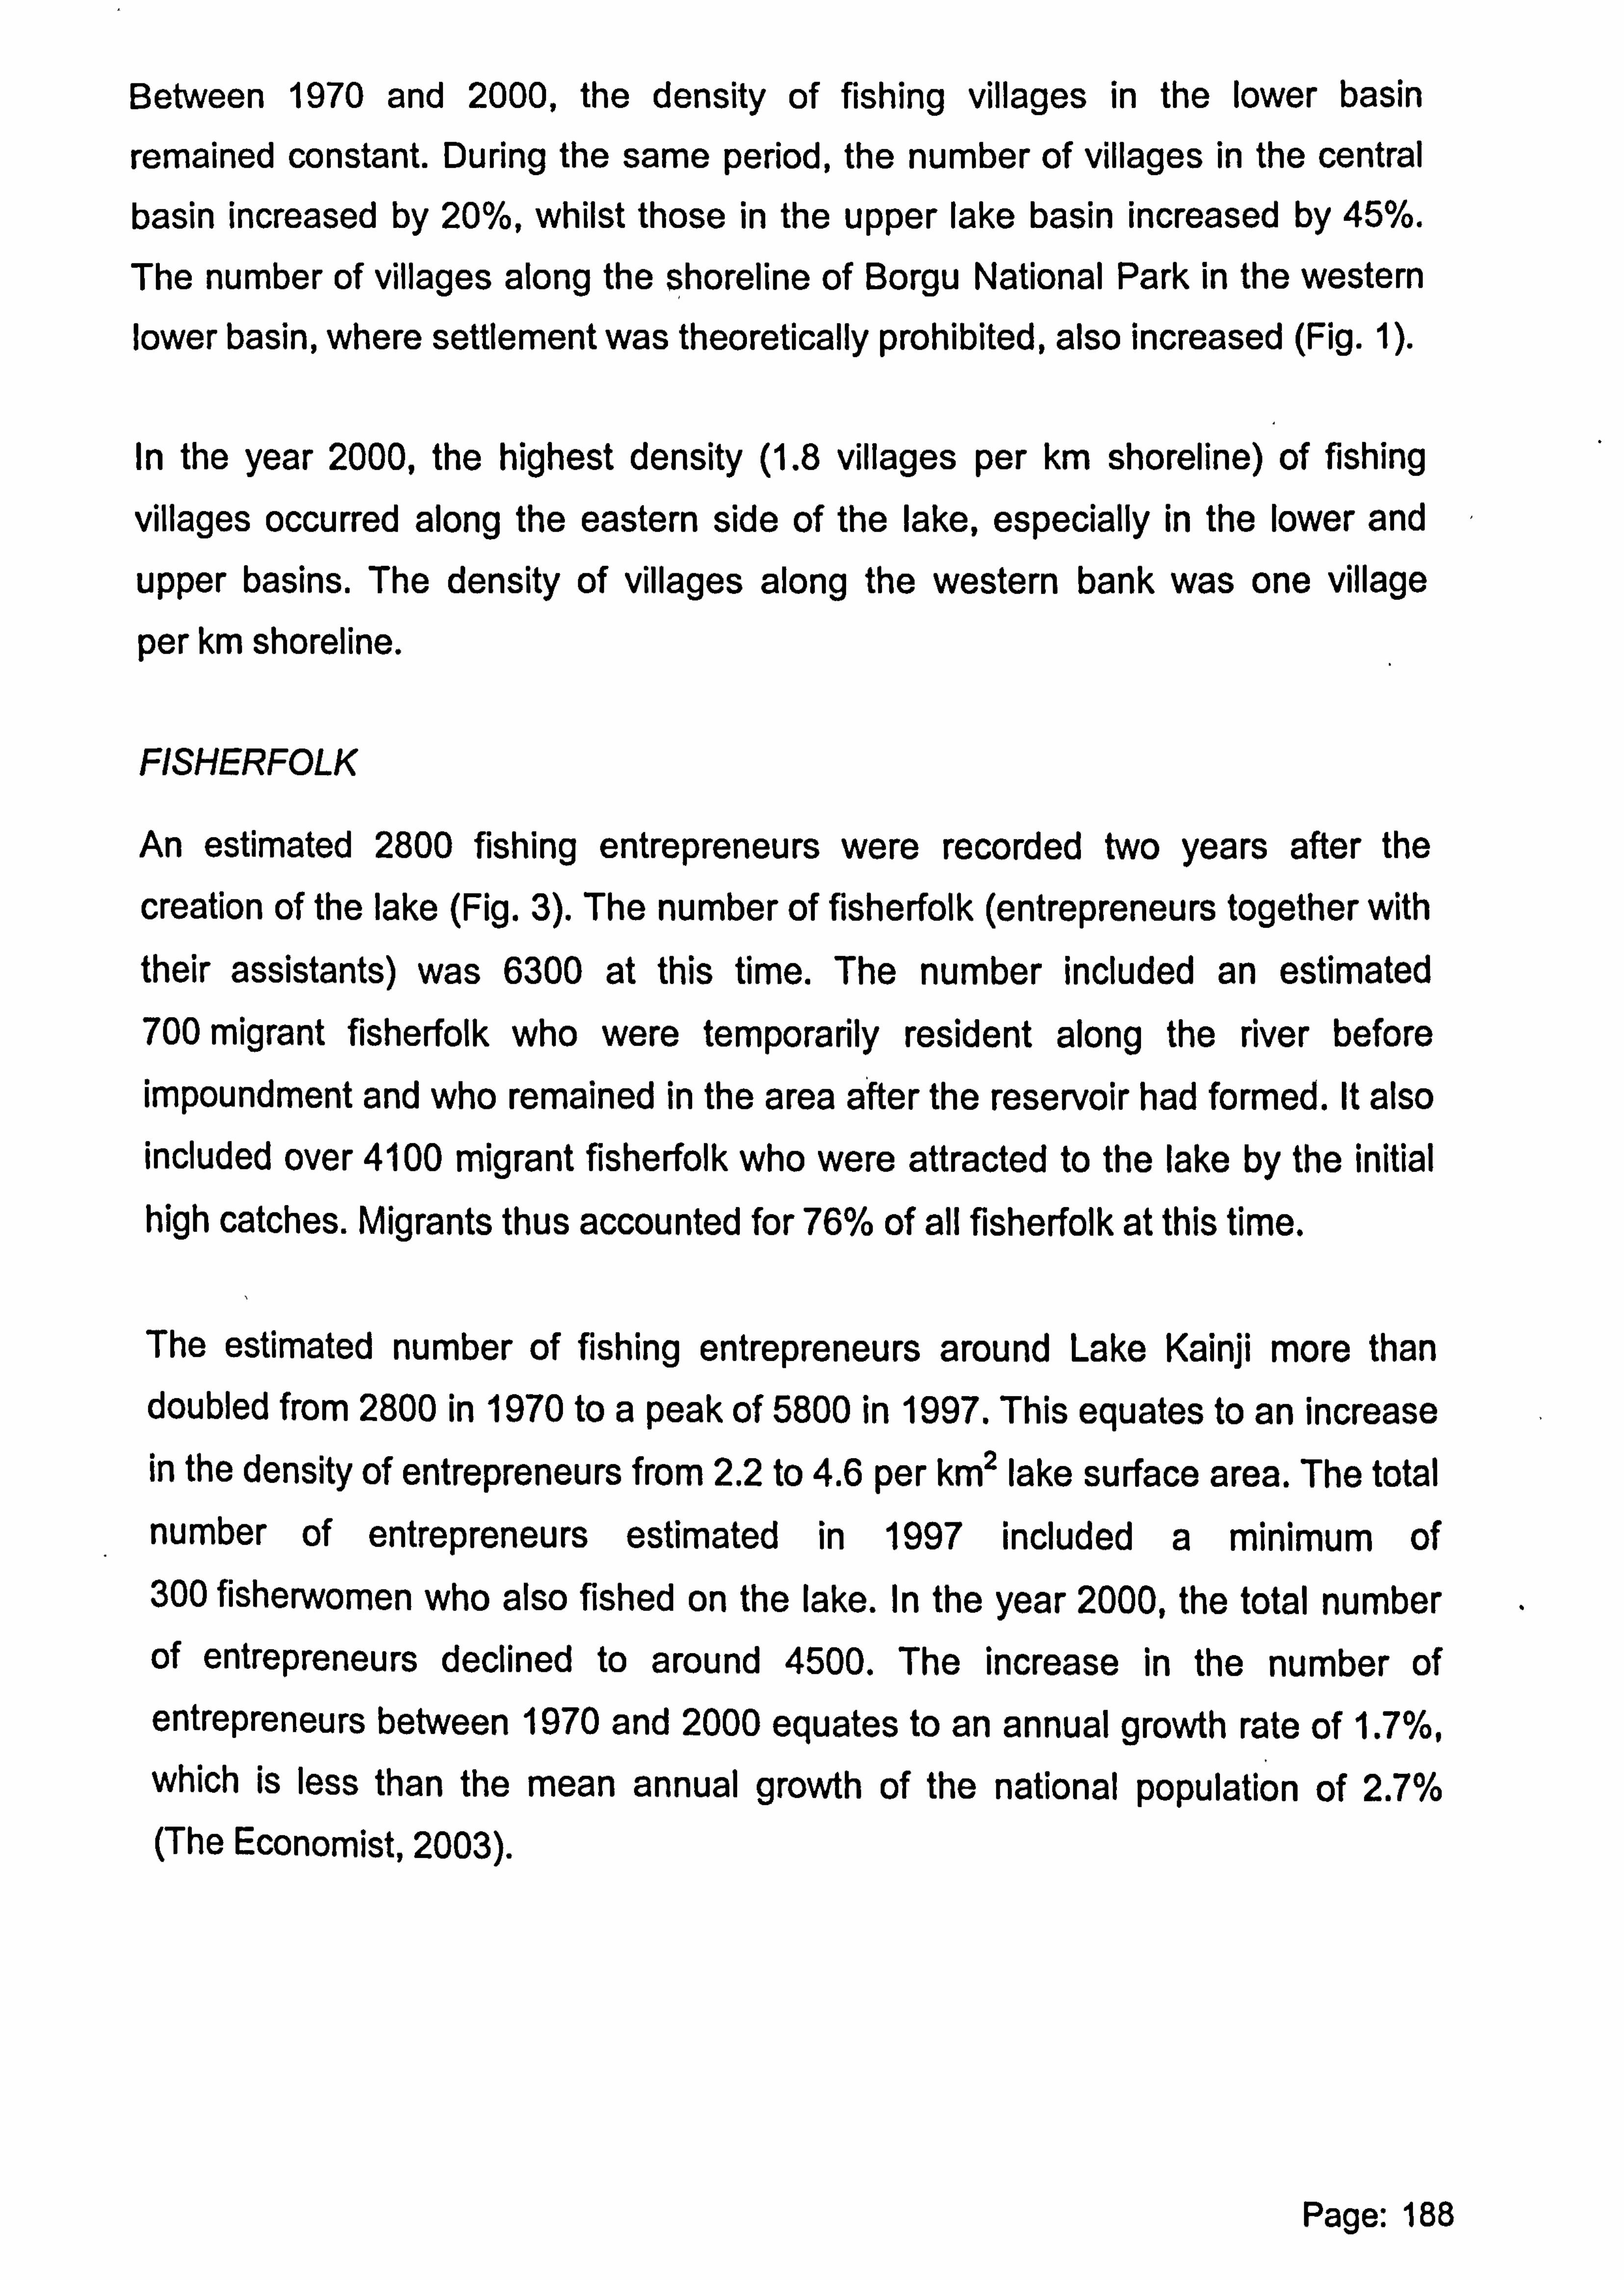
Between 1970 and 2000, the density of fishing villages in the lower basin
remained constant. During the same period, the number of villages in the central basin increased by 20%, whilst those in the upper lake basin increased by 45%.
The number of villages along the shoreline of Borgu National Park in the western lower basin, where settlement was theoretically prohibited, also increased (Fig. 1).
In the year 2000, the highest density (1.8 villages per km shoreline) of fishing
villages occurred along the eastern side of the lake, especially in the lower and
upper basins. The density of villages along the western bank was one village
per km shoreline.
FISHERFOLK
An estimated 2800 fishing entrepreneurs were recorded two years after the
creation of the lake (Fig. 3). The number of fisherfolk (entrepreneurs together with their assistants) was 6300 at this time. The number included an estimated 700 migrant fisherfolk who were temporarily resident along the river before impoundment and who remained in the area after the reservoir had formed. It also included over 4100 migrant fisherfolk who were attracted to the lake by the initial
high catches. Migrants thus accounted for 76% of all fisherfolk at this time.
The estimated number of fishing entrepreneurs around Lake Kainji more than doubled from 2800 in 1970 to a peak of 5800 in 1997. This equates to an increase in the density of entrepreneurs from 2.2 to 4.6 per km2 lake surface area. The total
number of entrepreneurs estimated in 1997 included a minimum of 300 fisherwomen who also fished on the lake. In the year 2000, the total number of entrepreneurs declined to around 4500. The increase in the number of entrepreneurs between 1970 and 2000 equates to an annual growth rate of 1.7%, which is less than the mean annual growth of the national population of 2.7% (The Economist, 2003).
Page: 188
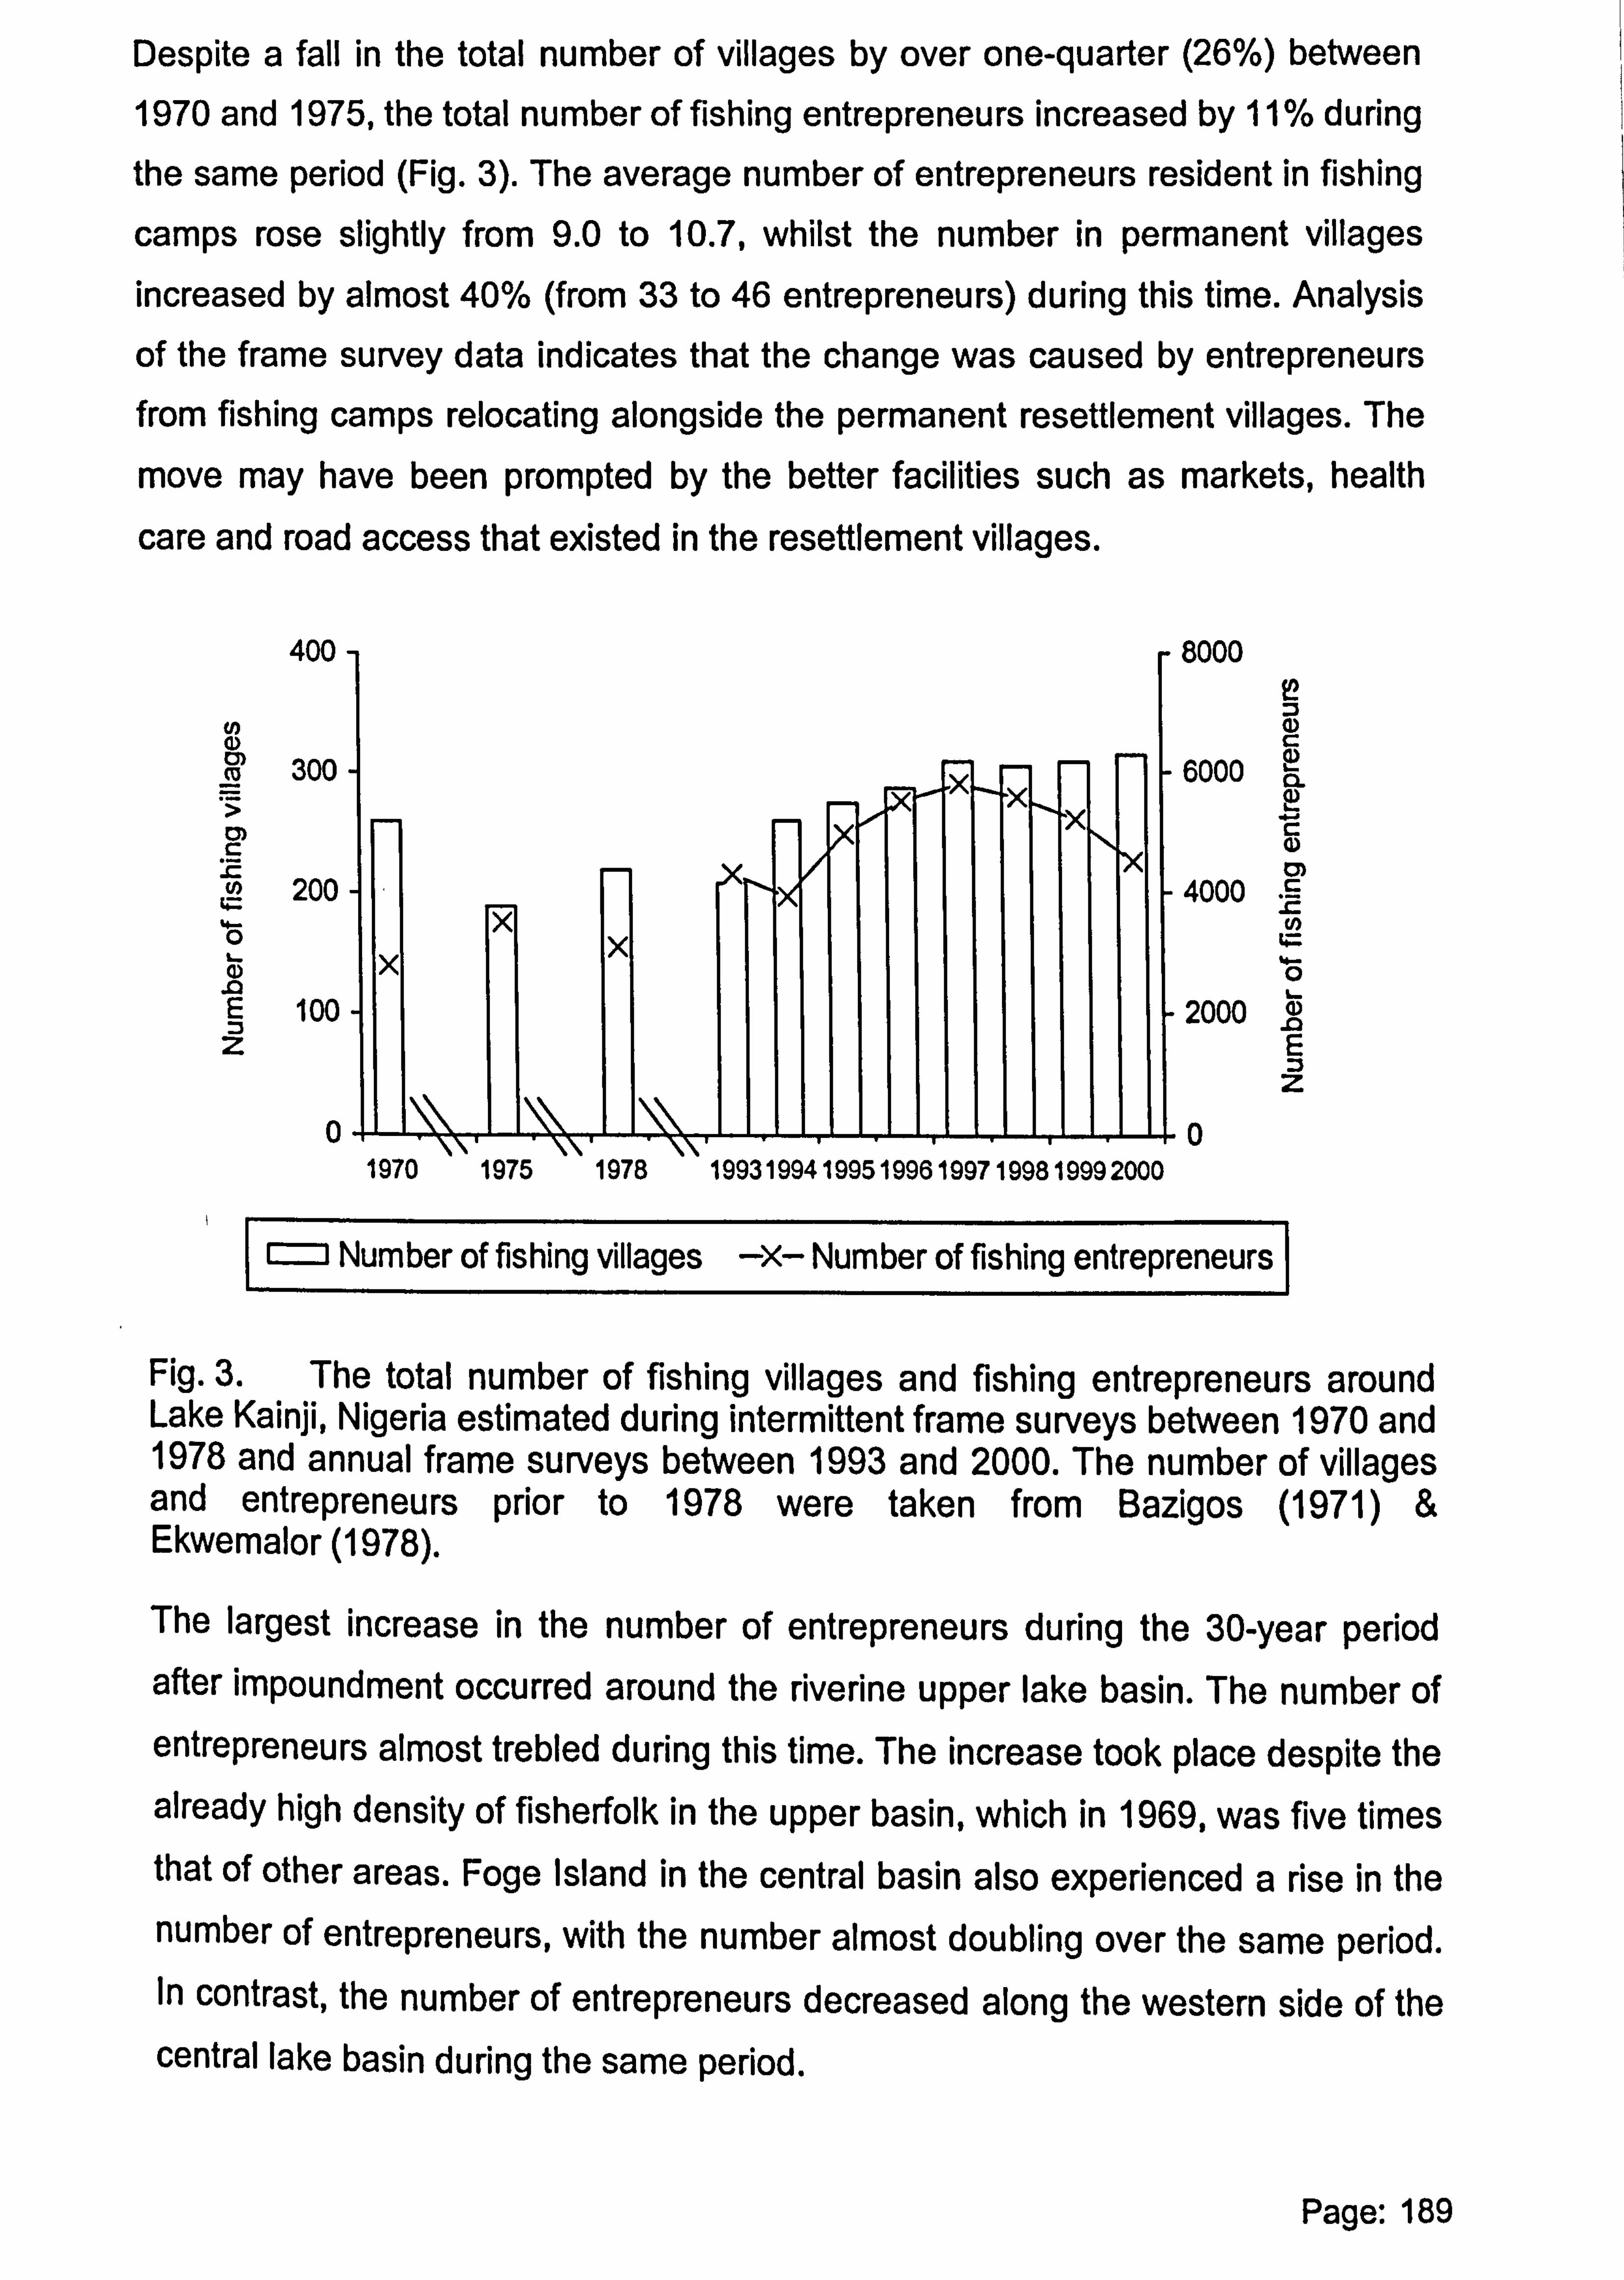
Despite a fall in the total number of villages by over one-quarter (26%) between
1970 and 1975, the total number of fishing entrepreneurs increased by 11 % during
the same period (Fig. 3). The average number of entrepreneurs resident in fishing
camps rose slightly from 9.0 to 10.7, whilst the number in permanent villages increased by almost 40% (from 33 to 46 entrepreneurs) during this time. Analysis
of the frame survey data indicates that the change was caused by entrepreneurs from fishing camps relocating alongside the permanent resettlement villages. The
move may have been prompted by the better facilities such as markets, health
care and road access that existed in the resettlement villages.
400
aý cc 300
rn c 200
E 100 Z
0
8000
6000
4000
2000
LA () c ID a all r- 4) rn
U, I- 0 2 a) E
Z
0
o Number of fishing villages -X- Number of fishing entrepreneurs
Fig. 3. The total number of fishing villages and fishing entrepreneurs around Lake Kainji, Nigeria estimated during intermittent frame surveys between 1970 and 1978 and annual frame surveys between 1993 and 2000. The number of villages and entrepreneurs prior to 1978 were taken from Bazigos (1971) & Ekwemalor (1978).
The largest increase in the number of entrepreneurs during the 30-year period after impoundment occurred around the riverine upper lake basin. The number of entrepreneurs almost trebled during this time. The increase took place despite the already high density of fisherfolk in the upper basin, which in 1969, was five times that of other areas. Foge Island in the central basin also experienced a rise in the number of entrepreneurs, with the number almost doubling over the same period. In contrast, the number of entrepreneurs decreased along the western side of the central lake basin during the same period.
Page: 189
1970 1975 1978 19931994 19951996 1997 1998 1999 2000

Chapter 6
FISHING CANOES AND ENGINES
The estimated number of fishing canoes remained constant during the 10 years
after impoundment (Fig. 4). Between 1978 and 1996, the number of canoes
approximately trebled to a density of 7.3 canoes per km2 lake area. The number
then declined, and in the year 2000, was 60% lower than during the peak in 1996.
In 2000, the highest density of canoes occurred along the southeast and northeast
sides of the lake. The number of canoes has almost doubled in both these areas
between 1970 and 2000.
Only about 2% of canoes had outboard engines just after impoundment (Fig. 4).
The percentage increased to 7% in 1975 and to 14% in 1993. By the year 2000,
the proportion of motorised canoes had fallen to 7%. A large fall occurred between
1997 and 1998, possibly caused by the ban on fishing with beach seines in early
1999. The majority of motorised canoes were used by the beach seine fishery.
cn m L. öc Co
VÜ6
M LN
Y4 ö!
N
.0 Y2 Zä
0
18
12
6
0
L . -. .ý
N
C m2 V NC
Ö
0) N C C)
o Density of fishing canoes -X- Percent of canoes with engines
Fig. 4. Number of fishing canoes per km2 lake surface area and the proportion (%) of canoes with engines in the Lake Kainji fishery estimated during intermittent frame surveys between 1970 and 1978 and annual frame surveys between 1993 and 2000. The number of canoes between 1970 and 1978 were taken from Bazigos (1971) & Ekwemalor (1978). Figures for the proportion of canoes with engines assume that all engines recorded as owned during the frame survey were used in the fishery.
Page: 190
IuIU I IJ 1.71 U 117171 1170-t 1 JQJ INJV IVVI ývvv ývvv ývvv

Chapter 6
FISHING GEARS
Over 95% of all the gears used for fishing during the two years after impoundment
were gill nets. The fisherfolk also owned cast nets, longlines and traps, but these
were less suited to catching the large herbivorous Characoid Citharinus citharus
(Geoffroy St. Hilaire, 1808-09) that were abundant and the main target species at
this time.
Several other fishing methods were introduced to the fishery after the creation of the lake. An example was the beach seine, which was similar to the hand seines
operated in river pools, but had smaller meshes to target the pelagic Clupeidae.
Another example was the 'Malian' fish trap, which was similar to the traditional
traps, but larger, and covered with nylon netting rather than raffia. In the year 2000, six main fishing gear types were used in the lake fishery. These were gill
nets, beach seines, drift nets, cast nets, longlines and fishing traps.
Between 1993 and 2000, the total number of gears estimated during the annual frame survey declined for all gear types3 (Fig. 5). The most dramatic rise and fall in
the number of gears occurred in the beach seine fishery. The number of seine
nets increased by over 30% between 1994 and 1995. This prompted management
measures, whereby the fisherfolk were discouraged from buying new or replacing
old seines, pending an envisaged ban of the gear. Numbers of seine nets
subsequently reduced and in 1999 fell substantially due to the ban of the gear at this time.
3 The number of fishing gears owned were not recorded during frame surveys prior to 1970. A breakdown of gear numbers before this time is therefore not possible.
Page: 191
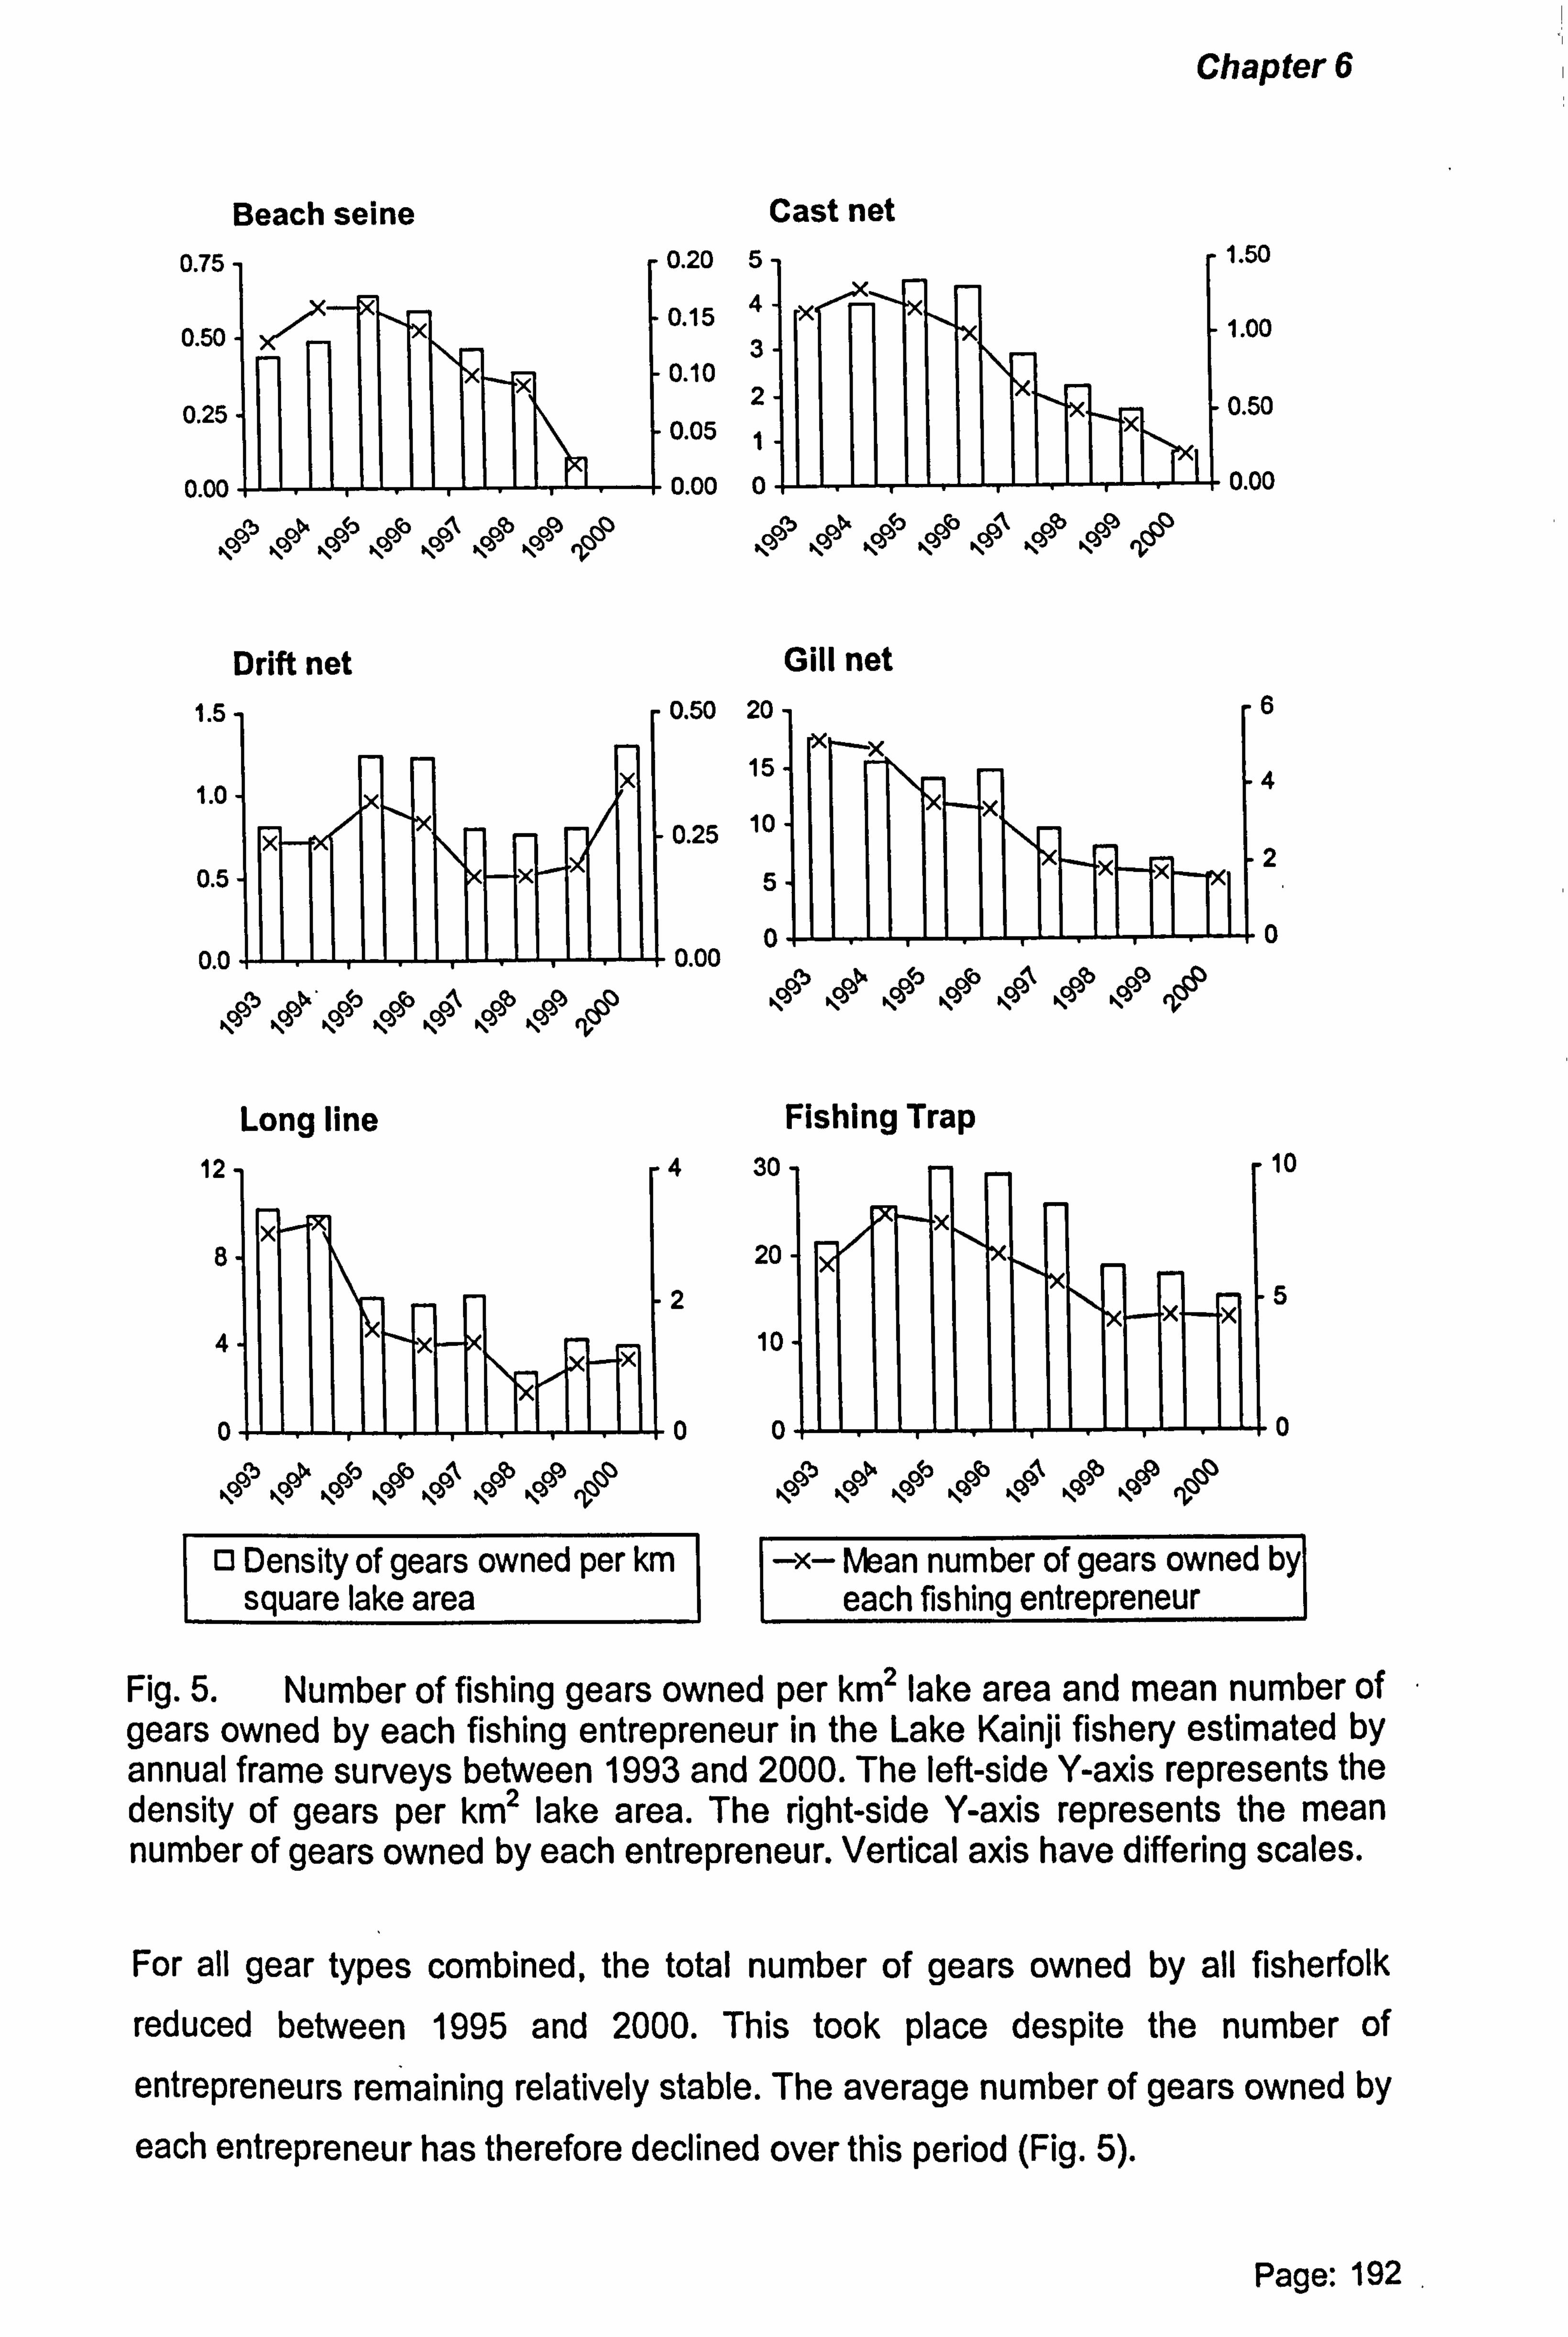
Chapter 6
Beach seine 0.75 ,
0.50
0.25
0.00 1'1.1 1111.1 111 , -I
Drift net 1.5 ,
1.0
0.5
0.0 a-Lý '-' ýý '''1111"
eloi NCP ýc§I Nooo Nog, Nooo º. ooo ýo ti
12
8
4
Cast net 0.20 5-
0.15 4-
3- 0.10
2 0.05 1X
0.00 0
IR ell
, C§l lcbcl 40 . 140, Ice 111P
Gill net 0.50 20-
15-
0.25 10
5xx
0 0.00
ý1 b% h ý6 ý1 �, c§'
0 ýý N°- e' i' -°ý ,ý , °, ti
4
2
oil II .. 1111.1111 1 11 .]i0
cbO q^, SP "", qmm º: b4, X0°'`0 p... q C3 p.,, º, °'qP p., ' fl
o Density of gears owned per km square lake area
Fishing Trap 30 -t r-l
20
10
10
5
lb 5ý% 9P ScAb (P CP SP
-x- Mean number of gears owned by each fishing entrepreneur
Fig. 5. Number of fishing gears owned per km2 lake area and mean number of gears owned by each fishing entrepreneur in the Lake Kainji fishery estimated by annual frame surveys between 1993 and 2000. The left-side Y-axis represents the density of gears per km2 lake area. The right-side Y-axis represents the mean number of gears owned by each entrepreneur. Vertical axis have differing scales.
For all gear types combined, the total number of gears owned by all fisherfolk
reduced between 1995 and 2000. This took place despite the number of
entrepreneurs remaining relatively stable. The average number of gears owned by
each entrepreneur has therefore declined over this period (Fig. 5).
1.50
1.00
0.50
0.00
6
4
2
0
Page: 192
Long line
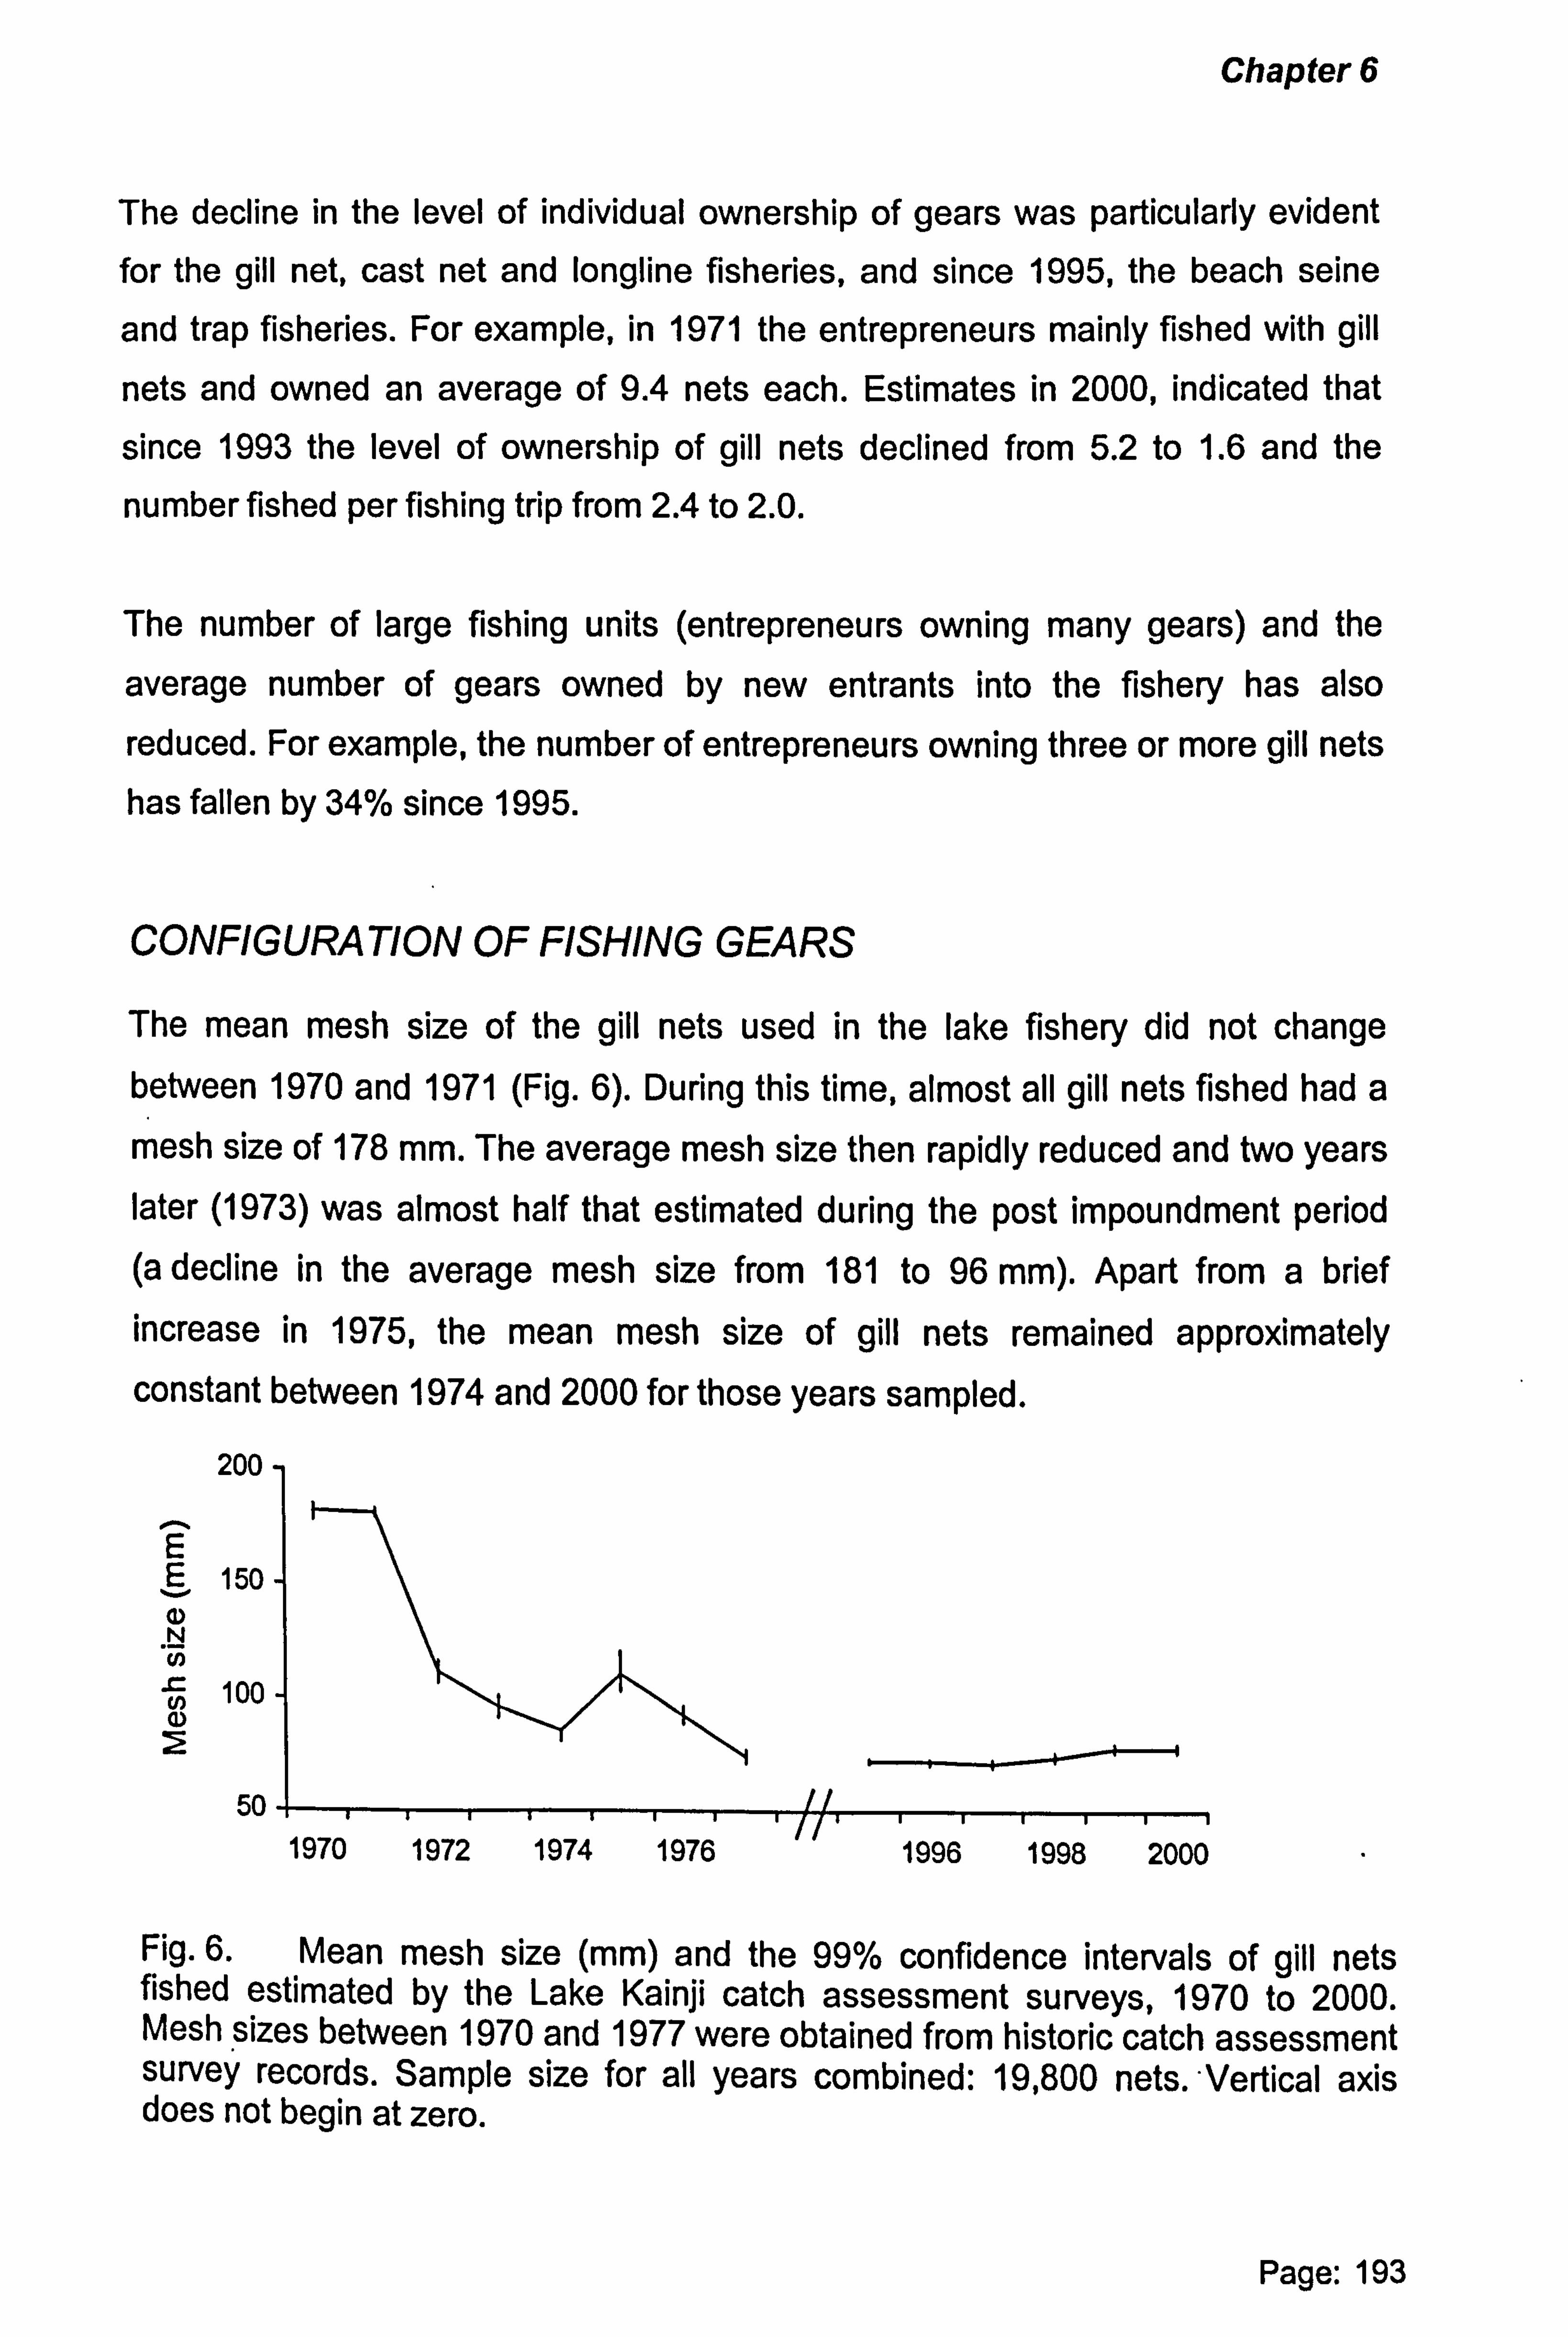
Chapter 6
The decline in the level of individual ownership of gears was particularly evident for the gill net, cast net and longline fisheries, and since 1995, the beach seine
and trap fisheries. For example, in 1971 the entrepreneurs mainly fished with gill
nets and owned an average of 9.4 nets each. Estimates in 2000, indicated that
since 1993 the level of ownership of gill nets declined from 5.2 to 1.6 and the
number fished per fishing trip from 2.4 to 2.0.
The number of large fishing units (entrepreneurs owning many gears) and the
average number of gears owned by new entrants into the fishery has also
reduced. For example, the number of entrepreneurs owning three or more gill nets has fallen by 34% since 1995.
CONFIGURATION OF FISHING GEARS
The mean mesh size of the gill nets used in the lake fishery did not change between 1970 and 1971 (Fig. 6). During this time, almost all gill nets fished had a mesh size of 178 mm. The average mesh size then rapidly reduced and two years later (1973) was almost half that estimated during the post impoundment period (a decline in the average mesh size from 181 to 96 mm). Apart from a brief increase in 1975, the mean mesh size of gill nets remained approximately constant between 1974 and 2000 for those years sampled.
200
1-1 E E 150 N N
N 100 a)
50
Fig. 6. Mean mesh size (mm) and the 99% confidence intervals of gill nets fished estimated by the Lake Kainji catch assessment surveys, 1970 to 2000. Mesh sizes between 1970 and 1977 were obtained from historic catch assessment survey records. Sample size for all years combined: 19,800 nets. -Vertical axis does not begin at zero.
Page: 193
iyiu 1972 1914 1976 1996 1998 2000
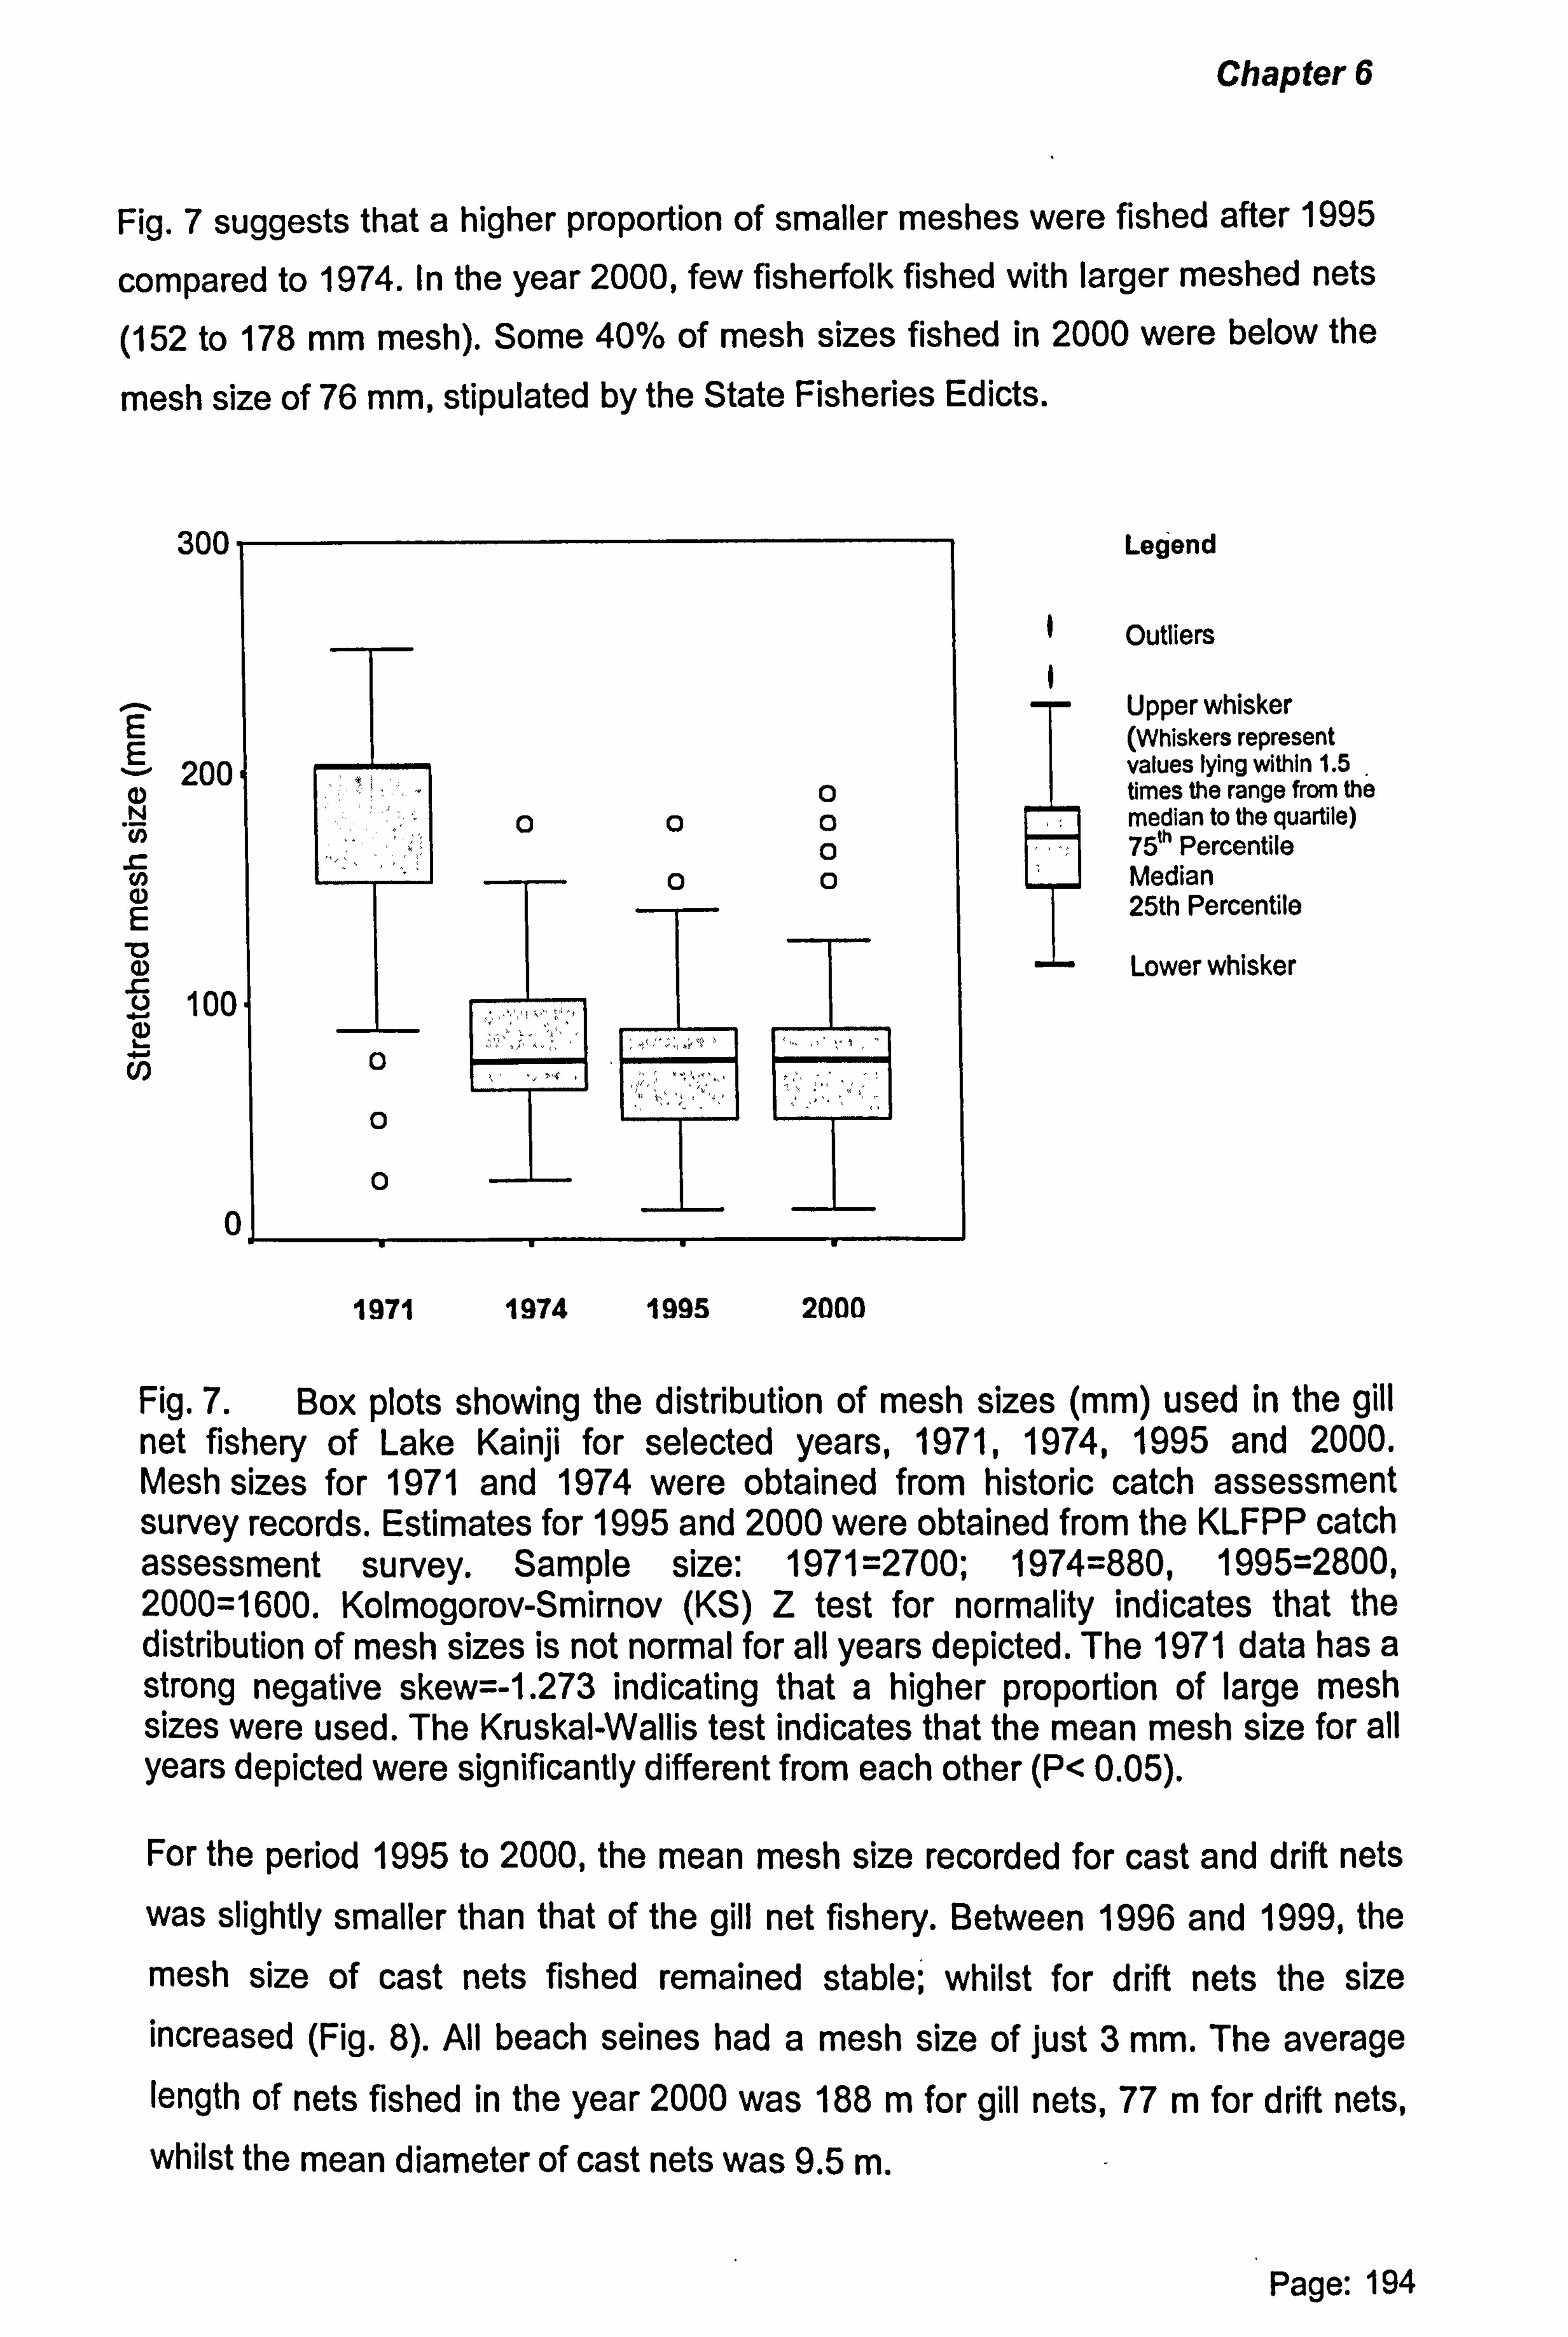
Chapter 6
Fig. 7 suggests that a higher proportion of smaller meshes were fished after 1995
compared to 1974. In the year 2000, few fisherfolk fished with larger meshed nets
(152 to 178 mm mesh). Some 40% of mesh sizes fished in 2000 were below the
mesh size of 76 mm, stipulated by the State Fisheries Edicts.
300
E E a) N N L N 4) E V a) L U N .r
200
100
0 00 0
0 0 0
0 F 0 _
_
0
1971 1974 1995 2000
Legend
Outliers
Upper whisker (Whiskers represent values lying within 1.5 times the range from the median to the quartile) 75th Percentile Median 25th Percentile
Lower whisker
Fig. 7. Box plots showing the distribution of mesh sizes (mm) used in the gill net fishery of Lake Kainji for selected years, 1971,1974,1995 and 2000. Mesh sizes for 1971 and 1974 were obtained from historic catch assessment survey records. Estimates for 1995 and 2000 were obtained from the KLFPP catch assessment survey. Sample size: 1971=2700; 1974=880,1995=2800, 2000=1600. Kolmogorov-Smirnov (KS) Z test for normality indicates that the distribution of mesh sizes is not normal for all years depicted. The 1971 data has a strong negative skew=-1.273 indicating that a higher proportion of large mesh sizes were used. The Kruskal-Wallis test indicates that the mean mesh size for all years depicted were significantly different from each other (P< 0.05).
For the period 1995 to 2000, the mean mesh size recorded for cast and drift nets was slightly smaller than that of the gill net fishery. Between 1996 and 1999, the
mesh size of cast nets fished remained stable; whilst for drift nets the size increased (Fig. 8). All beach seines had a mesh size of just 3 mm. The average length of nets fished in the year 2000 was 188 m for gill nets, 77 m for drift nets, whilst the mean diameter of cast nets was 9.5 m.
Page: 194
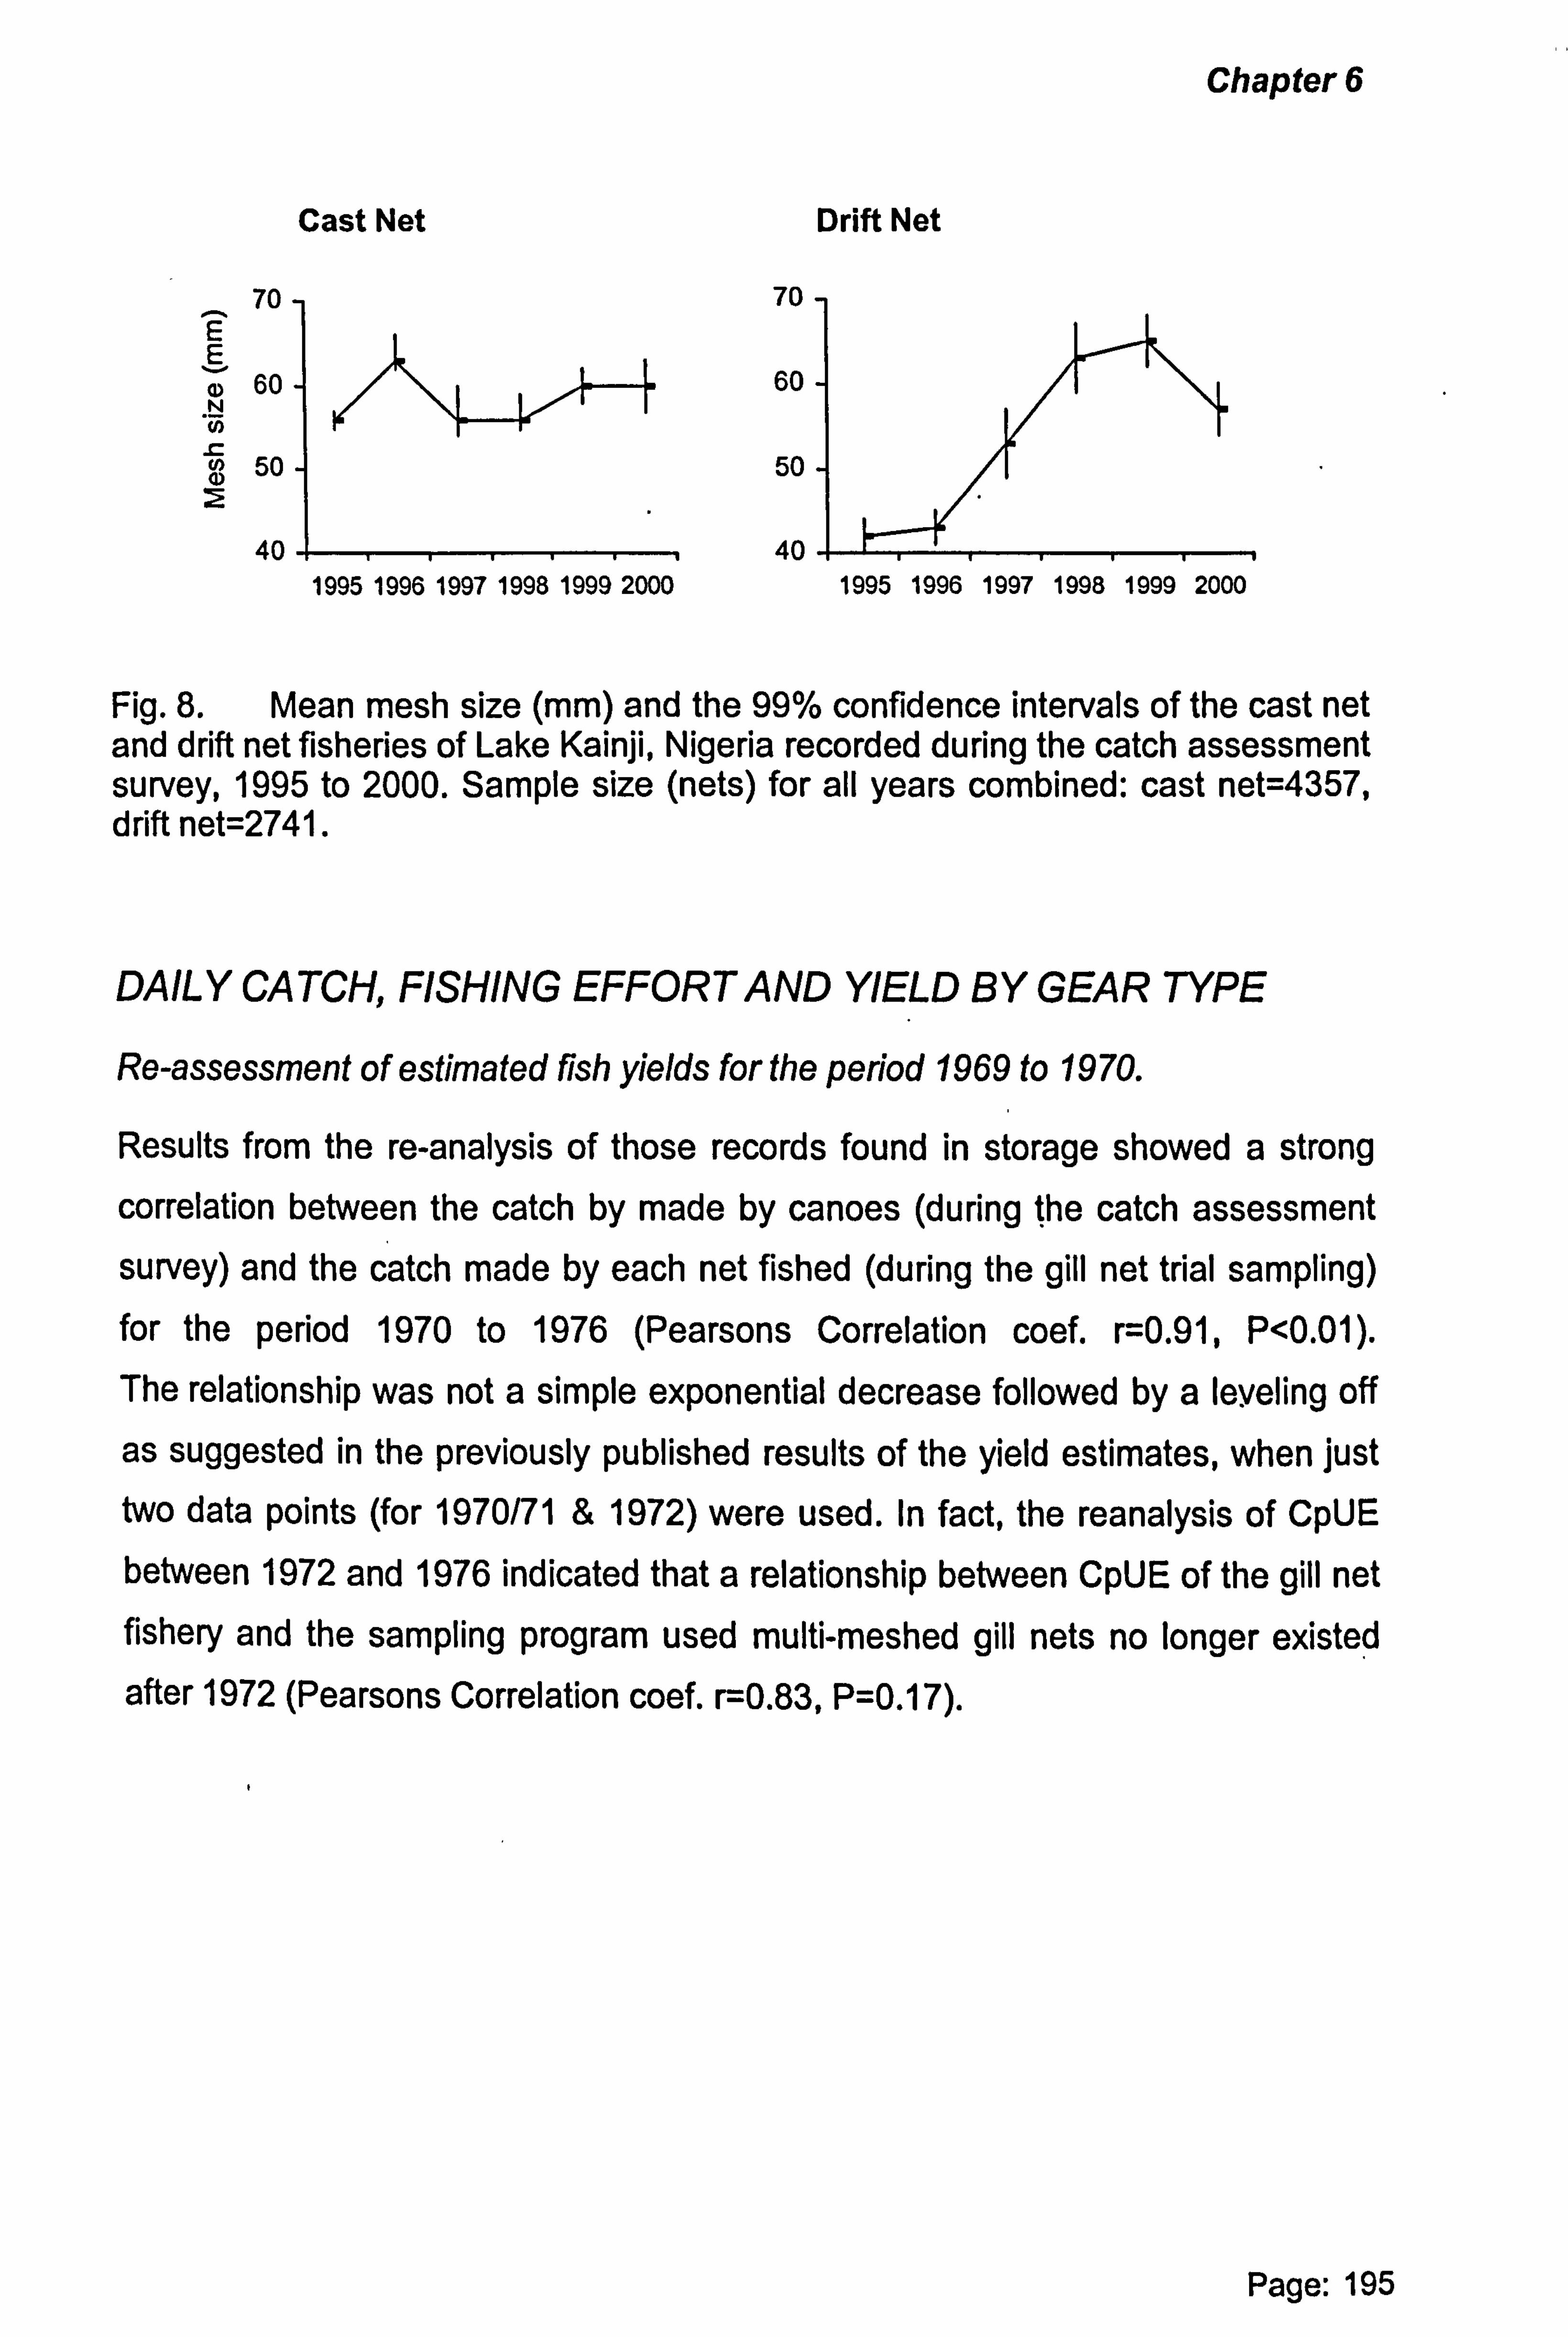
Chapter 6
Cast Net
70-, 70
Drift Net
E E CD 60 60 N
50 50
40 -1 11 40 1995 1996 1997 1998 1999 2000
Fig. 8. Mean mesh size (mm) and the 99% confidence intervals of the cast net and drift net fisheries of Lake Kainji, Nigeria recorded during the catch assessment survey, 1995 to 2000. Sample size (nets) for all years combined: cast net=4357, drift net=2741.
DAILY CATCH, FISHING EFFORT AND YIELD BY GEAR TYPE
Re-assessment of estimated fish yields for the period 1969 to 1970.
Results from the re-analysis of those records found in storage showed a strong
correlation between the catch by made by canoes (during the catch assessment survey) and the catch made by each net fished (during the gill net trial sampling) for the period 1970 to 1976 (Pearsons Correlation coef. r=0.91, P<0.01). The relationship was not a simple exponential decrease followed by a leyeling off
as suggested in the previously published results of the yield estimates, when just two data points (for 1970/71 & 1972) were used. In fact, the reanalysis of CpUE between 1972 and 1976 indicated that a relationship between CpUE of the gill net fishery and the sampling program used multi-meshed gill nets no longer existed after 1972 (Pearsons Correlation coef. r=0.83, P=0.17).
Page: 195
1995 1996 1997 1998 1999 2000
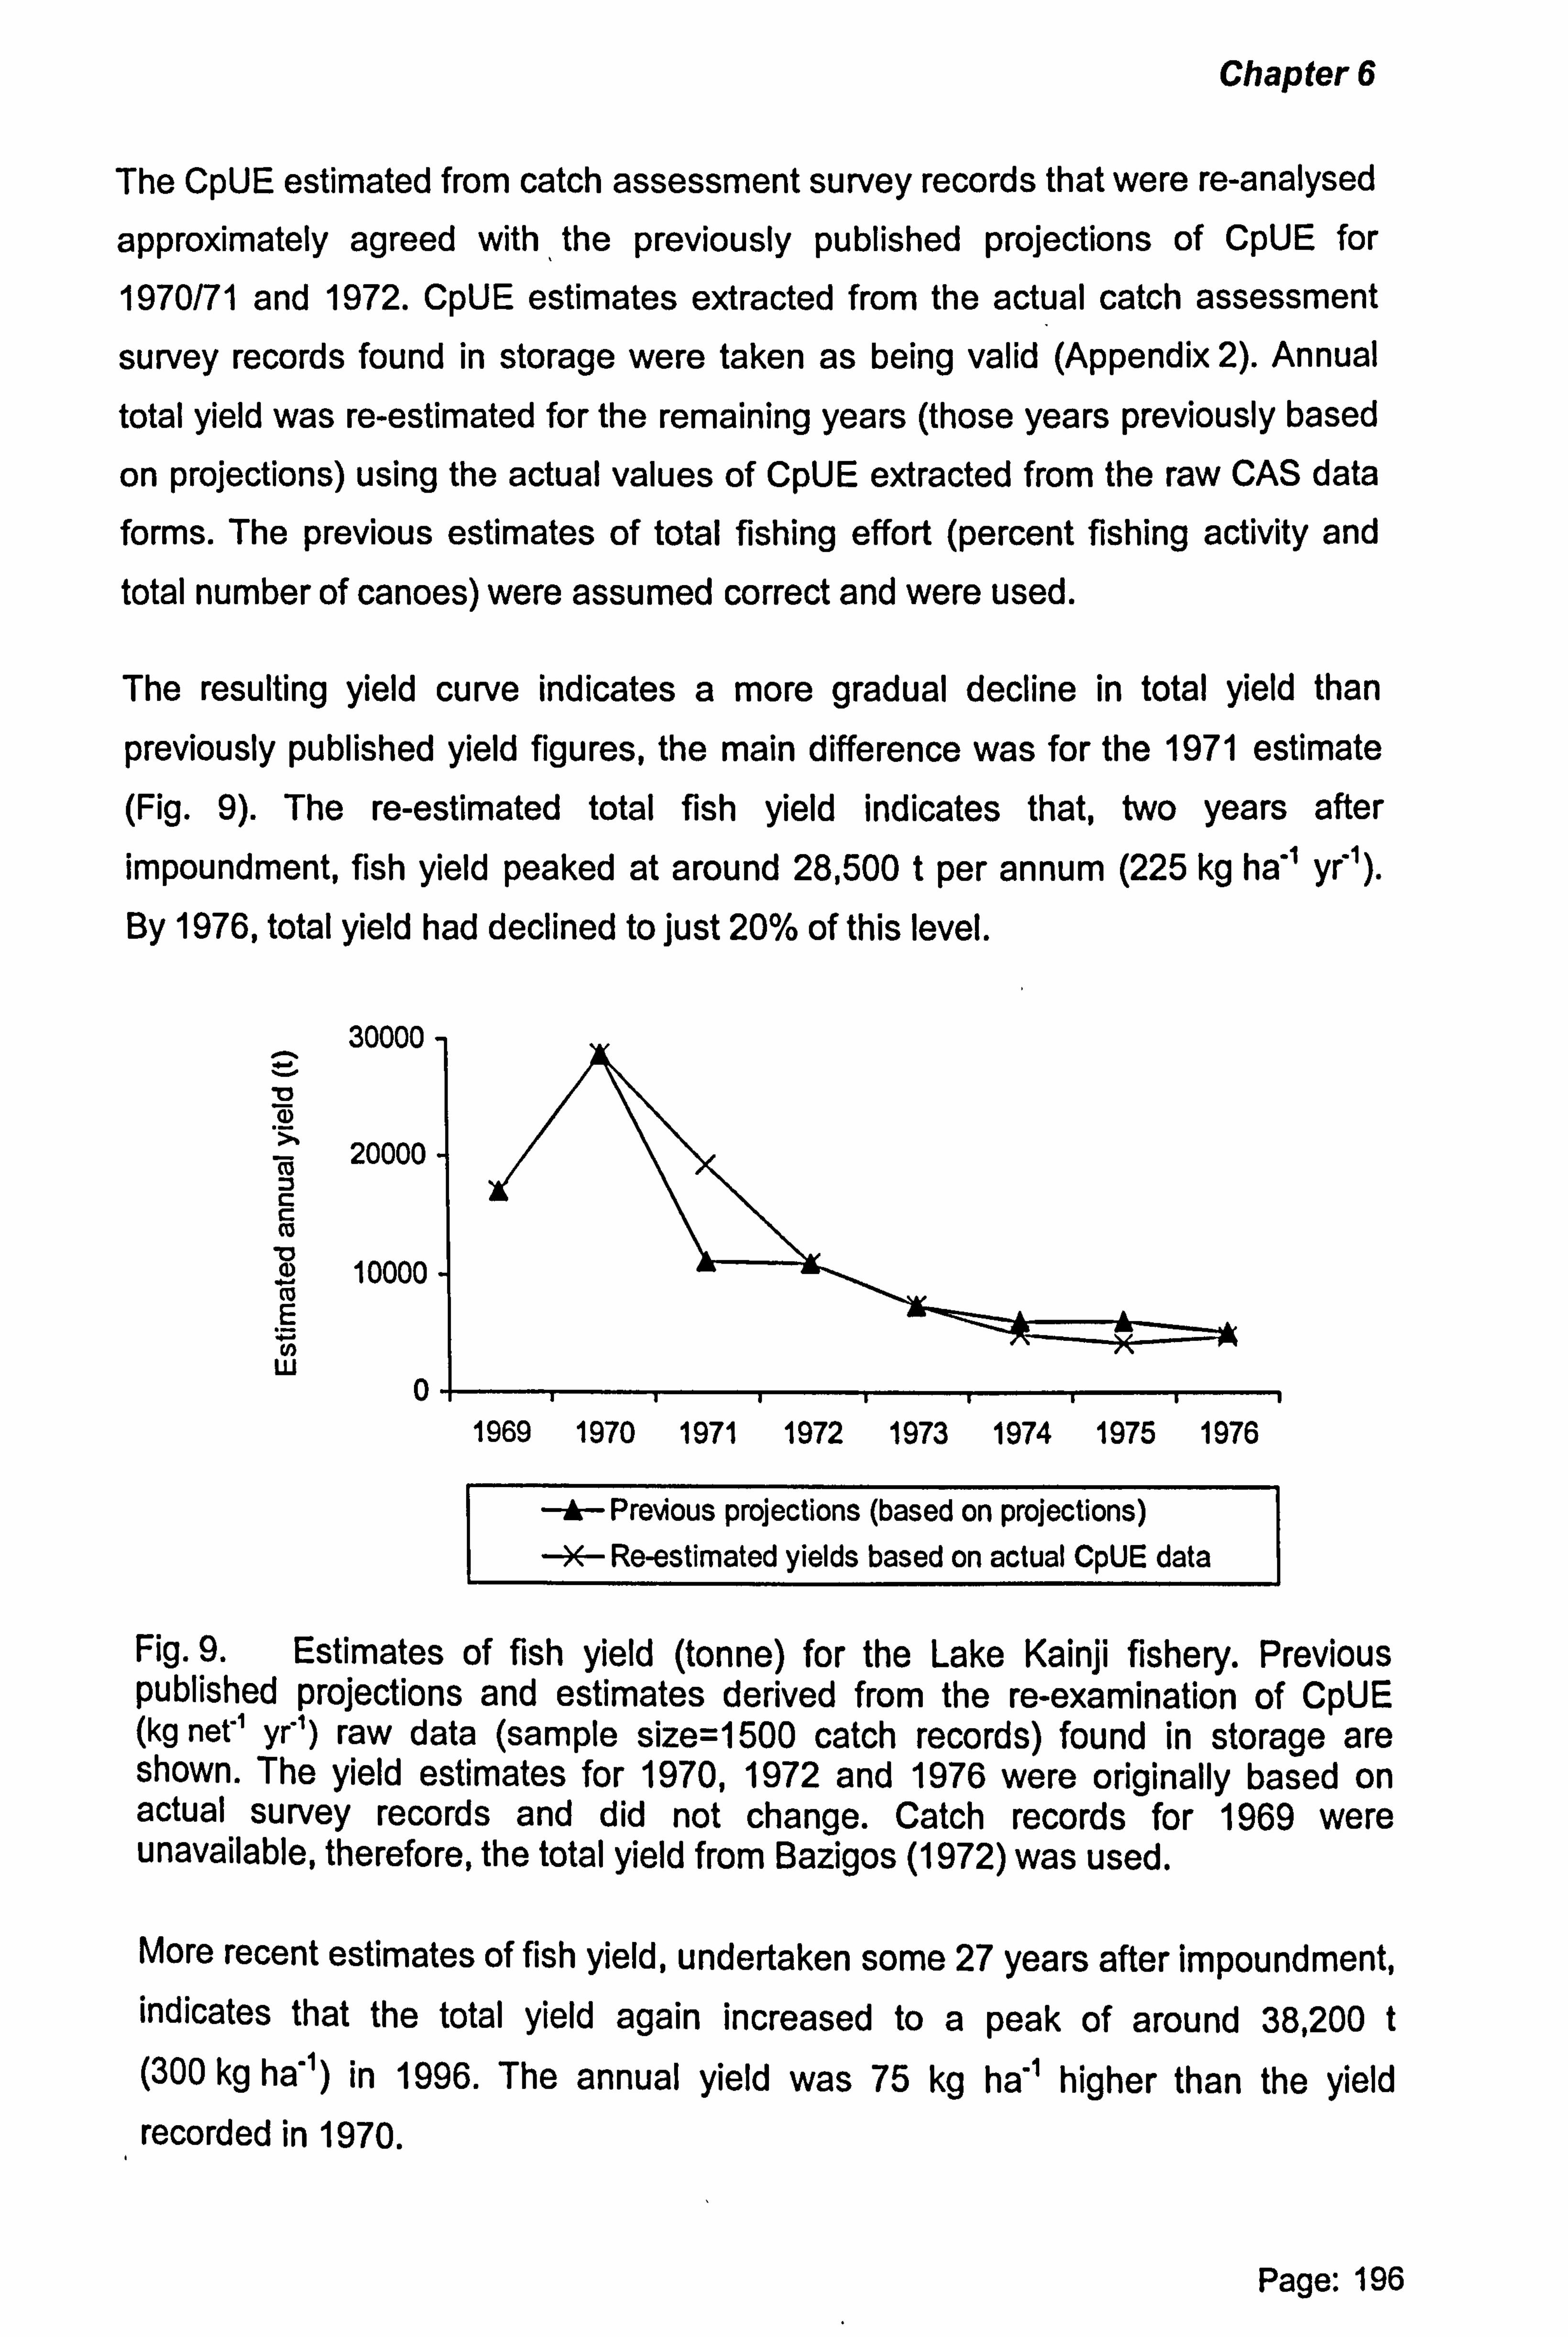
Chapter 6
The CpUE estimated from catch assessment survey records that were re-analysed
approximately agreed with, the previously published projections of CpUE for
1970/71 and 1972. CpUE estimates extracted from the actual catch assessment
survey records found in storage were taken as being valid (Appendix 2). Annual
total yield was re-estimated for the remaining years (those years previously based
on projections) using the actual values of CpUE extracted from the raw CAS data
forms. The previous estimates of total fishing effort (percent fishing activity and total number of canoes) were assumed correct and were used.
The resulting yield curve indicates a more gradual decline in total yield than
previously published yield figures, the main difference was for the 1971 estimate (Fig. 9). The re-estimated total fish yield indicates that, two years after impoundment, fish yield peaked at around 28,500 t per annum (225 kg ha"' yr). By 1976, total yield had declined to just 20% of this level.
30000
v a)
20000
10000
Ll. ý 0
1969 1970 1971 1972 1973 1974 1975 1976
-f- Previous projections (based on projections)
-X- Re-estimated yields based on actual CpUE data
Fig. 9. Estimates of fish yield (tonne) for the Lake Kainji fishery. Previous published projections and estimates derived from the re-examination of CpUE (kg net'' yr') raw data (sample size=1500 catch records) found in storage are shown. The yield estimates for 1970,1972 and 1976 were originally based on actual survey records and did not change. Catch records for 1969 were unavailable, therefore, the total yield from Bazigos (1972) was used.
More recent estimates of fish yield, undertaken some 27 years after impoundment, indicates that the total yield again increased to a peak of around 38,200 t (300 kg ha-) in 1996. The annual yield was 75 kg ha"' higher than the yield recorded in 1970.
Page: 196
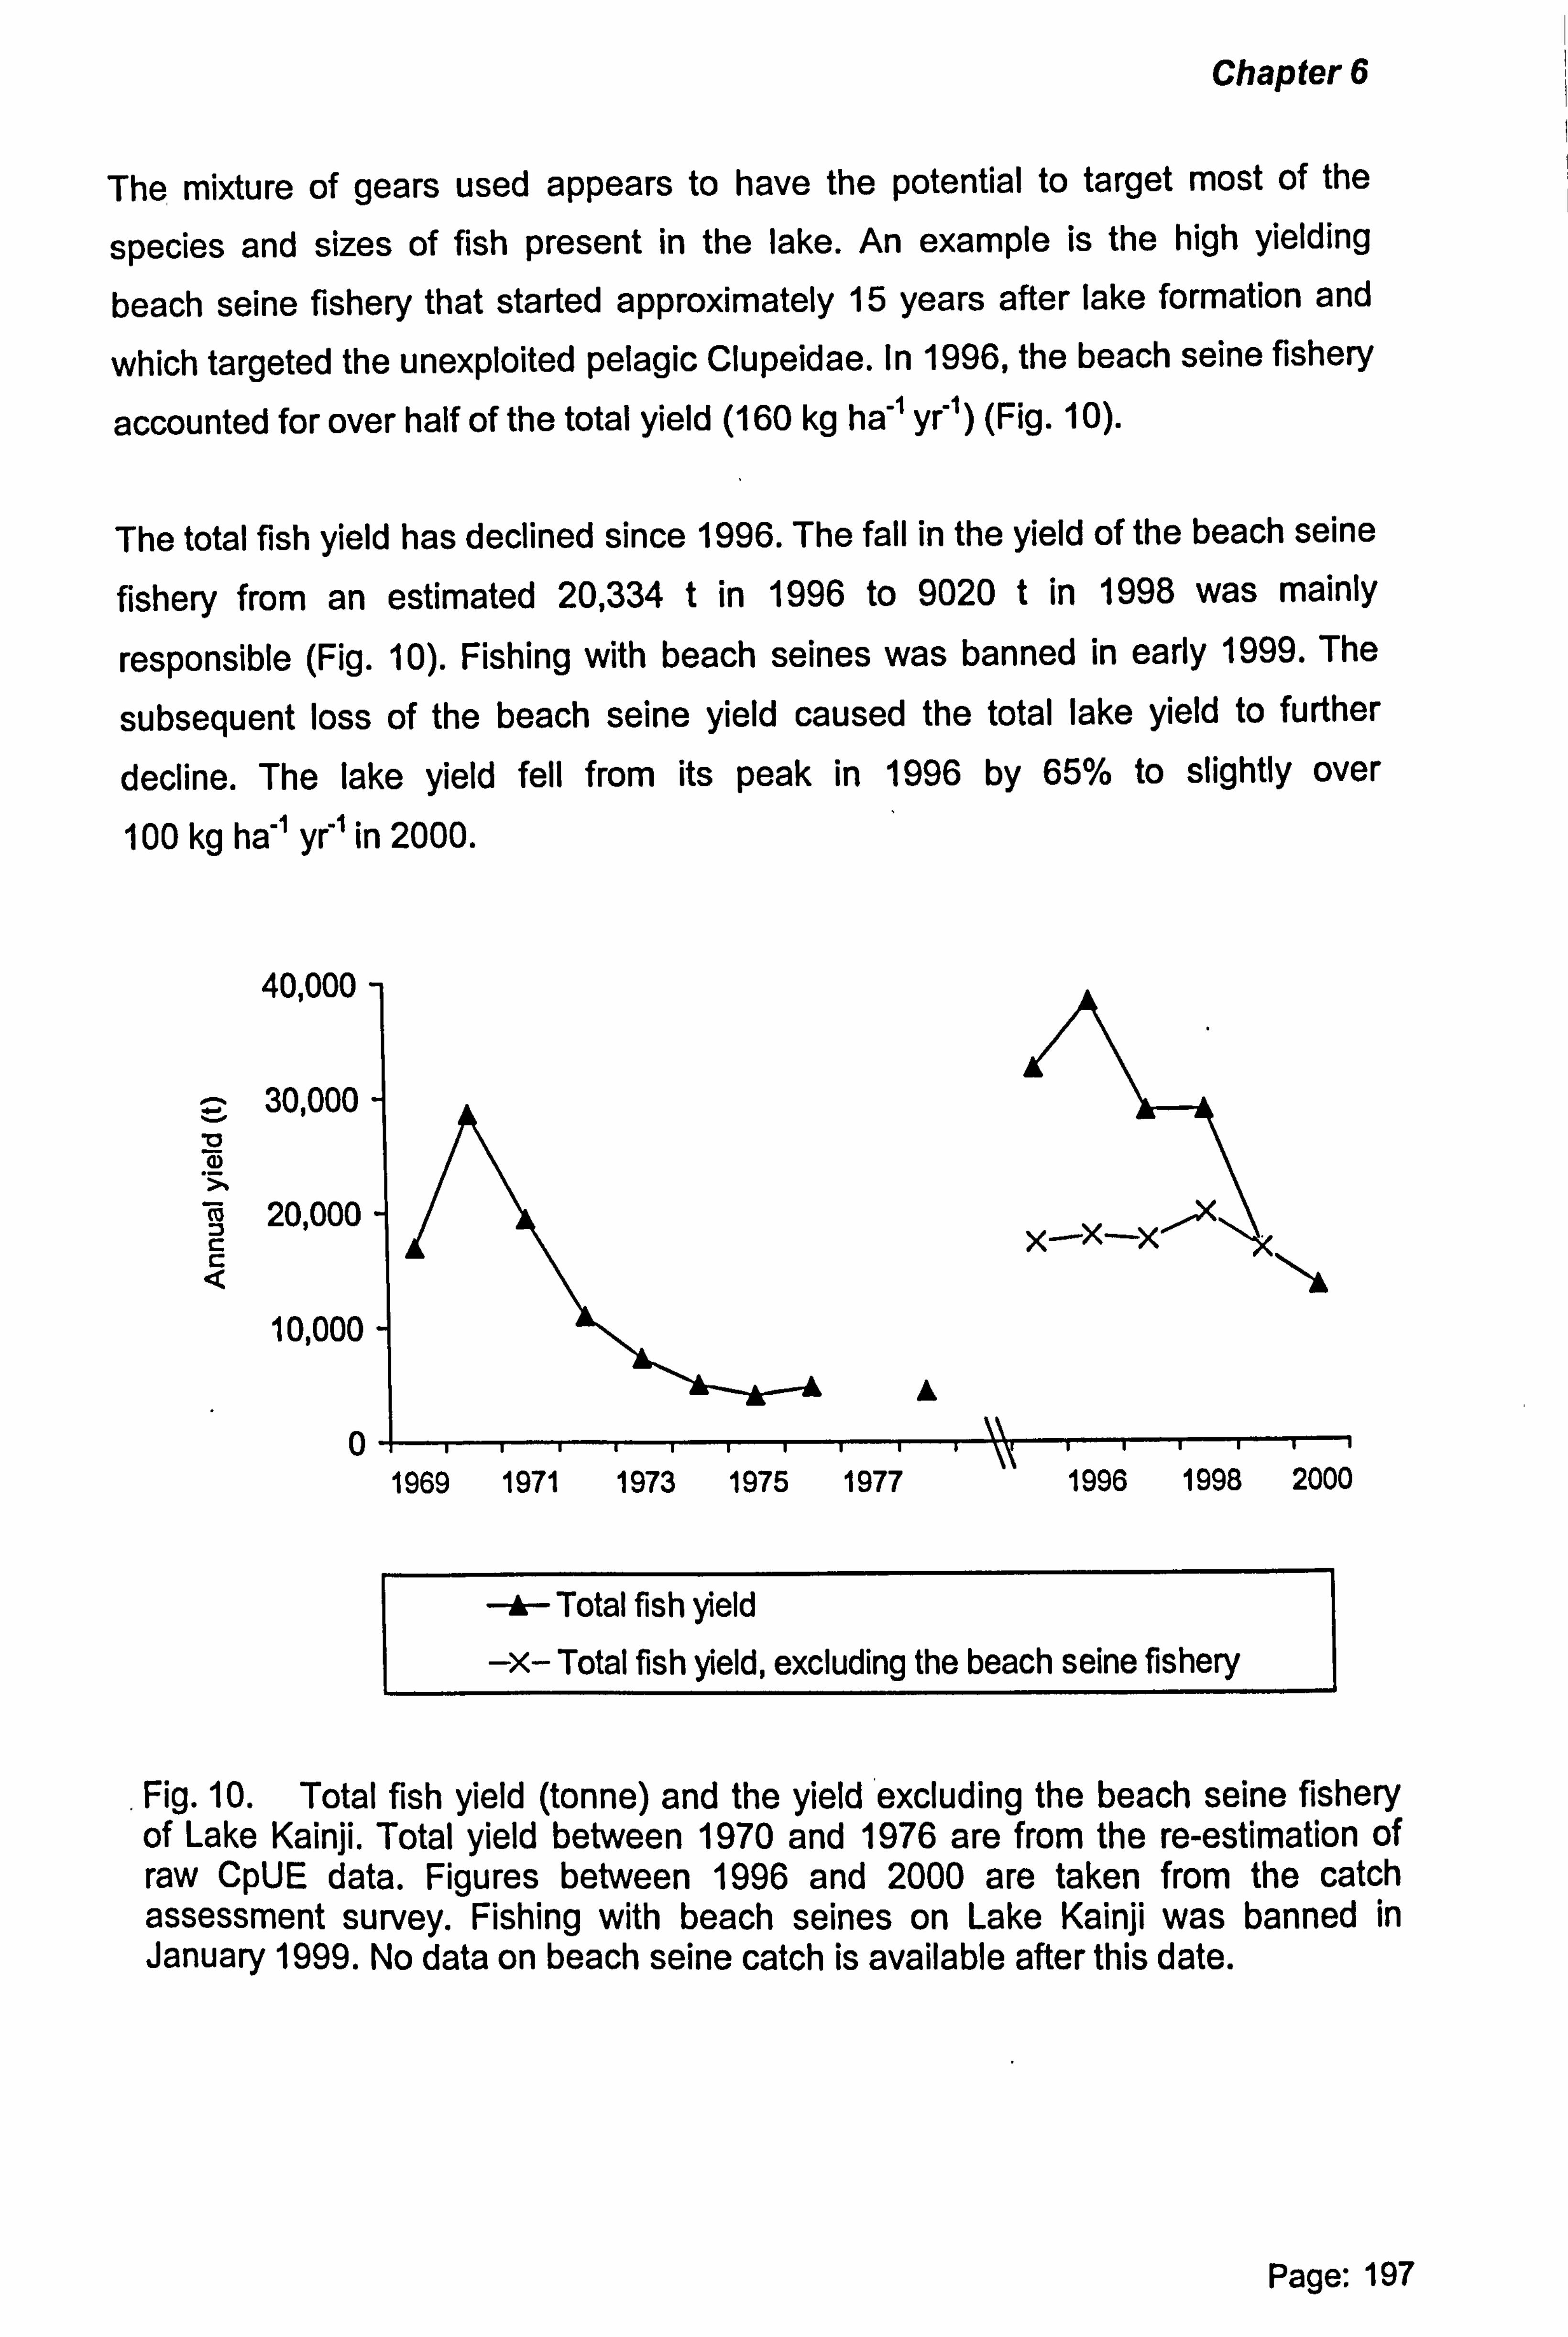
Chapter 6
The mixture of gears used appears to have the potential to target most of the
species and sizes of fish present in the lake. An example is the high yielding
beach seine fishery that started approximately 15 years after lake formation and
which targeted the unexploited pelagic Clupeidae. In 1996, the beach seine fishery
accounted for over half of the total yield (160 kg ha -1 yr ) (Fig. 10).
The total fish yield has declined since 1996. The fall in the yield of the beach seine
fishery from an estimated 20,334 t in 1996 to 9020 t in 1998 was mainly
responsible (Fig. 10). Fishing with beach seines was banned in early 1999. The
subsequent loss of the beach seine yield caused the total lake yield to further
decline. The lake yield fell from its peak in 1996 by 65% to slightly over
100 kg ha -1 yr' in 2000.
40,000
30,000 V 1)
20,000
10,000
A
0 1969 1971 1973 1975 1977 1996 1998 2000
A, Total fish yield x- Total fish yield, excluding the beach seine fishery
Fig. 10. Total fish yield (tonne) and the yield excluding the beach seine fishery of Lake Kainji. Total yield between 1970 and 1976 are from the re-estimation of raw CpUE data. Figures between 1996 and 2000 are taken from the catch assessment survey. Fishing with beach seines on Lake Kainji was banned in January 1999. No data on beach seine catch is available after this date.
Page: 197
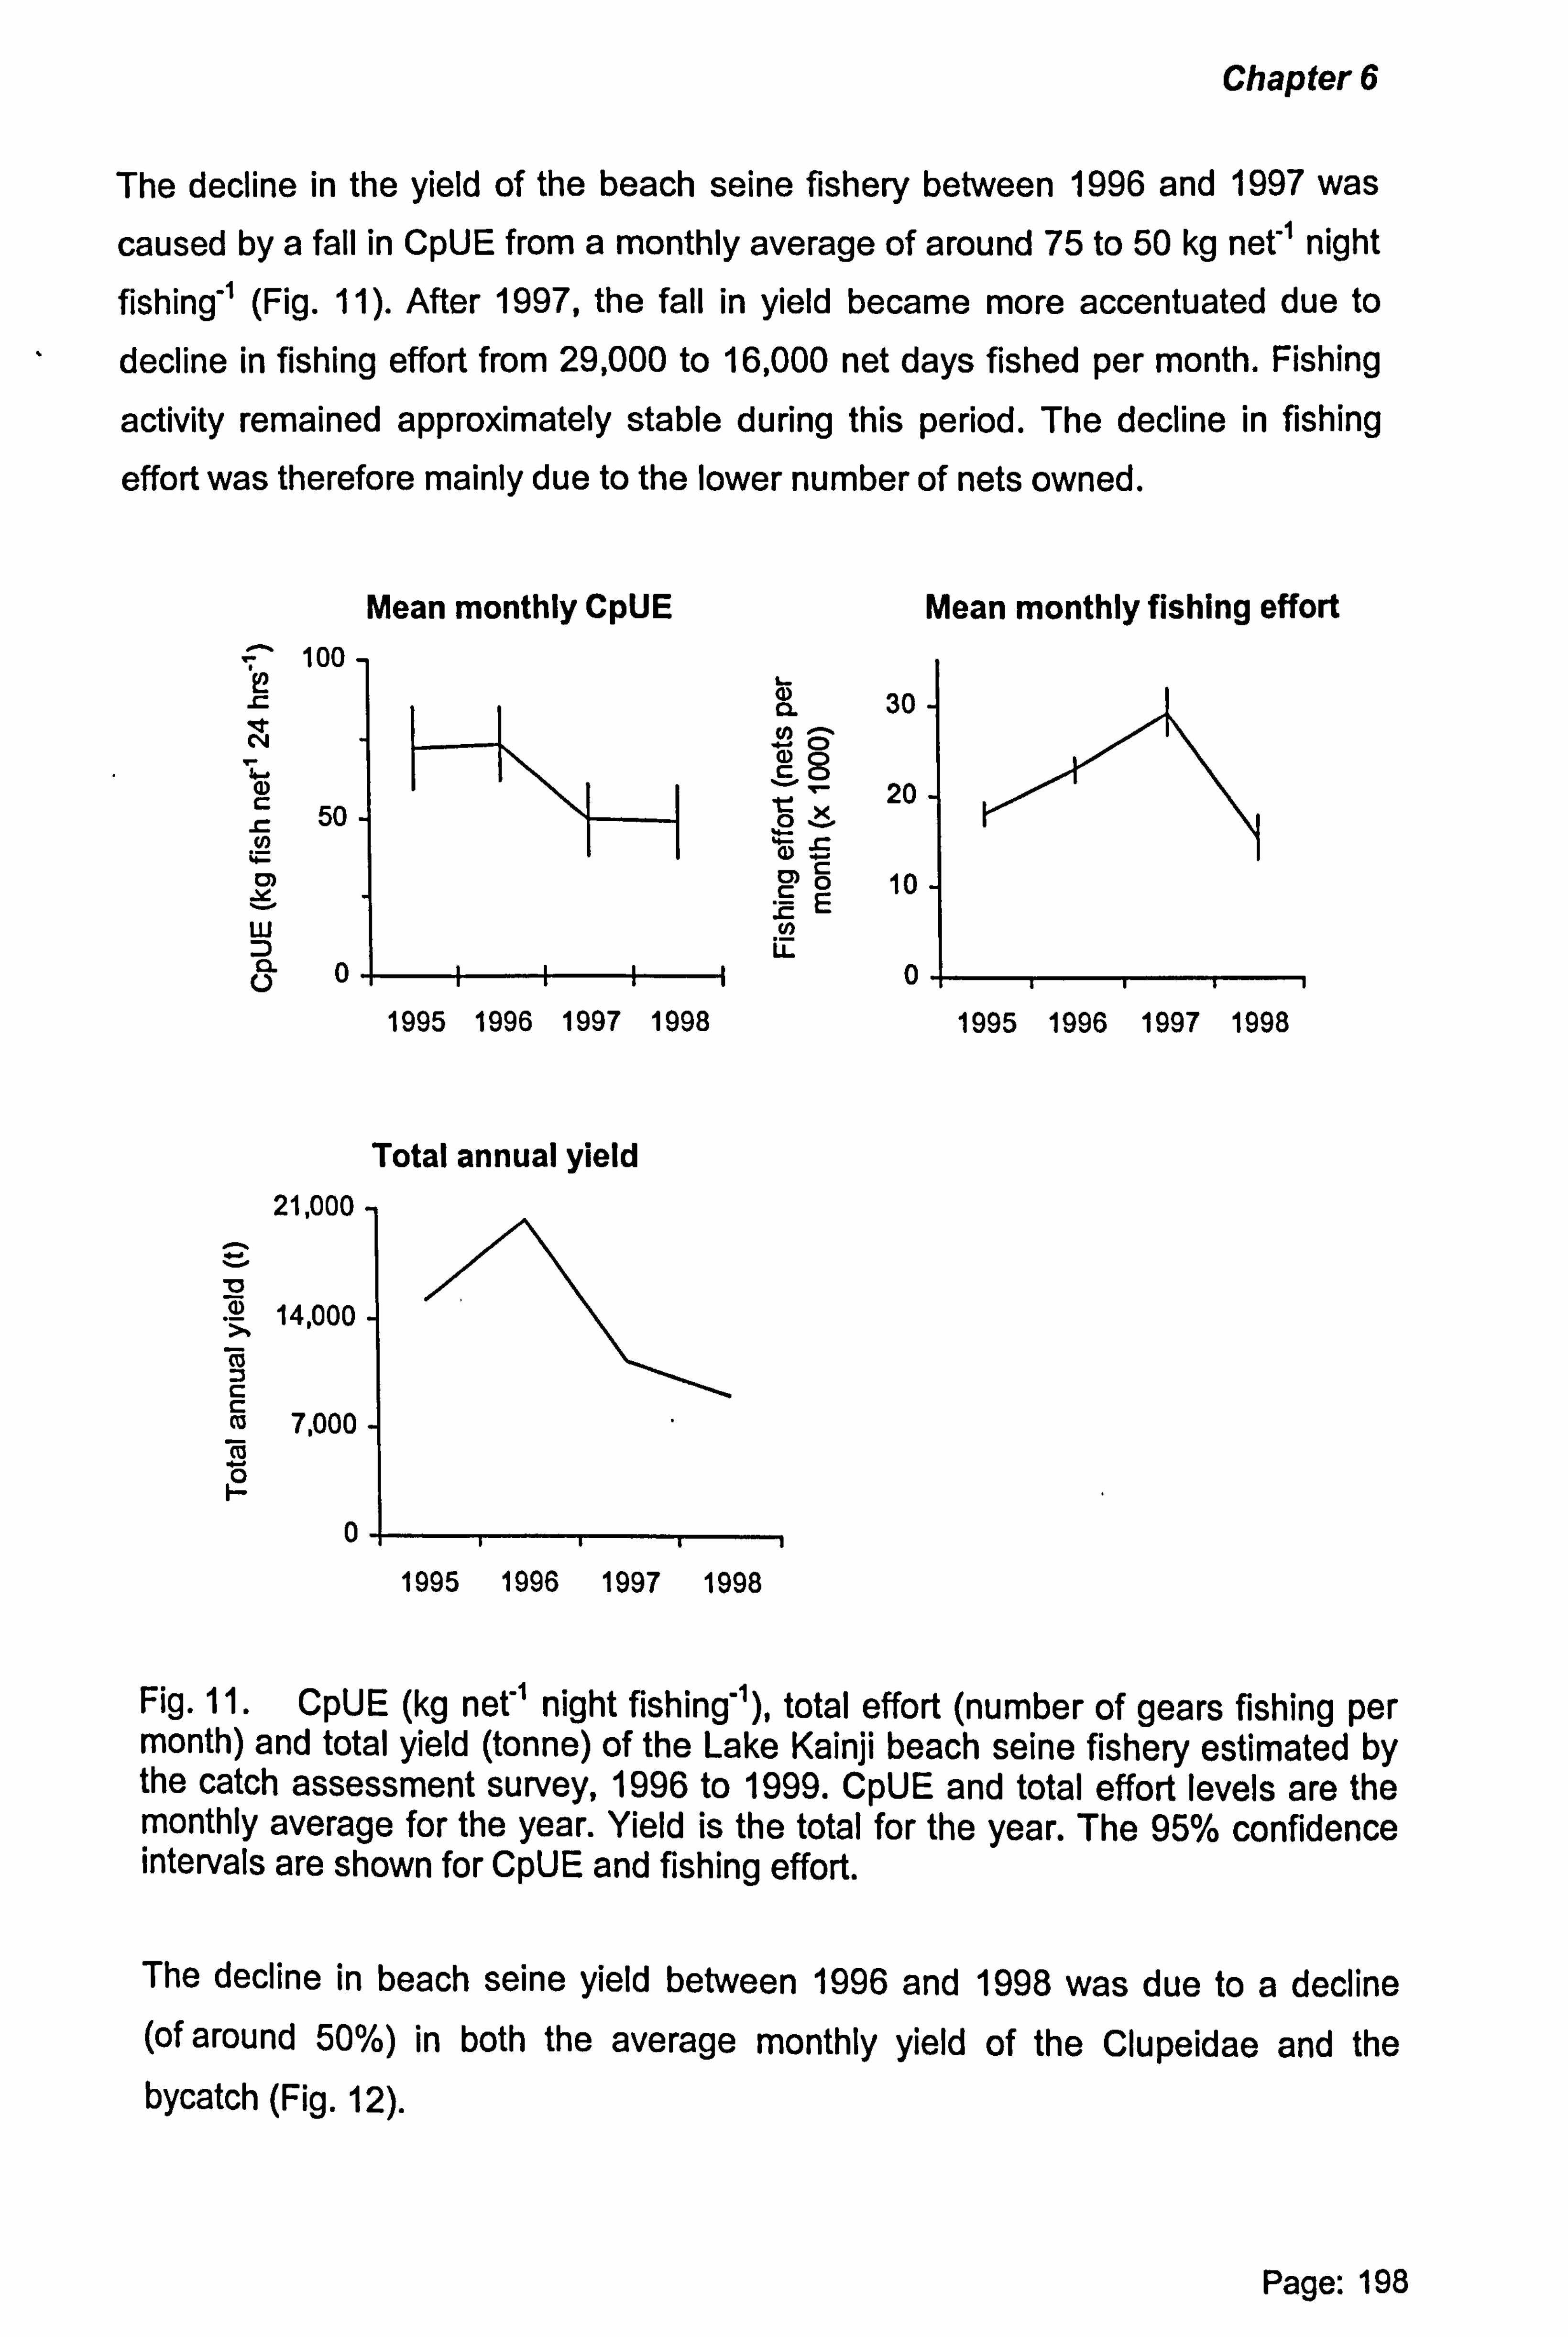
Chapter 6
The decline in the yield of the beach seine fishery between 1996 and 1997 was
caused by a fall in CpUE from a monthly average of around 75 to 50 kg net" night fishing" (Fig. 11). After 1997, the fall in yield became more accentuated due to
decline in fishing effort from 29,000 to 16,000 net days fished per month. Fishing
activity remained approximately stable during this period. The decline in fishing
effort was therefore mainly due to the lower number of nets owned.
Mean monthly CpUE 100
2 L
Q, 30 N
ý..
- Öp Cp
20 L
50 ý 0
ö E 10
w c Cl) 5=
Ü0 0
1995 1996 1997 1998
Total annual yield 21,000
v 14,000
m
m 7,000 M
0
Mean monthly fishing effort
Fig. 11. CpUE (kg net"' night fishing-'), total effort (number of gears fishing per month) and total yield (tonne) of the Lake Kainji beach seine fishery estimated by the catch assessment survey, 1996 to 1999. CpUE and total effort levels are the monthly average for the year. Yield is the total for the year. The 95% confidence intervals are shown for CpUE and fishing effort.
The decline in beach seine yield between 1996 and 1998 was due to a decline (of around 50%) in both the average monthly yield of the Clupeidae and the bycatch (Fig. 12).
Page: 198
1995 1996 1997 1998
1995 1996 1997 1998

Chapter 6
E rn
N_
A L
C 0
u) co
u)
15
10
5
Clupeidae
By-Catch
1995 1996 1997 1998 0
Fig. 12. The mean monthly yield (tonne) of Clupeidae and bycatch, showing 95% confidence intervals of the Lake Kainji beach seine fishery estimated by the catch assessment survey, 1995 to 1998. The average monthly yield of the Clupeidae was significantly higher in 1996 than 1998. Mann Whitney U test, two tailed test, P: 50.05.
The overall trends of CpUE (kg fish caught per haul) for the Clupeidae and bycatch is similar to the graphs of yield. There is some indication that the CpUE of bycatch increased between 1997 and 1998, perhaps as a result of the declining
effort of the seine fishery at this time (Fig. 13).
., 6
4
2
Clupeida By-Catch
0 1995 1996 1997 1998
E C)
C
C0
Q) C) 12 9)
Fig. 13. The mean CpUE (kg fish per haul) and the 95% confidence intervals of the Lake Kainji beach seine fishery estimated using data from the catch assessment survey, 1995 to 1998. Five percent trimmed means have been used. Sample size: 2500 catch records. The mean weight of Clupeidae and bycatch caught per haul in 1997 was significantly higher than the weight caught during the peak in 1996 (Tukey HSD Test. P: 50.00, P=0.00 resp. ).
Page: 199
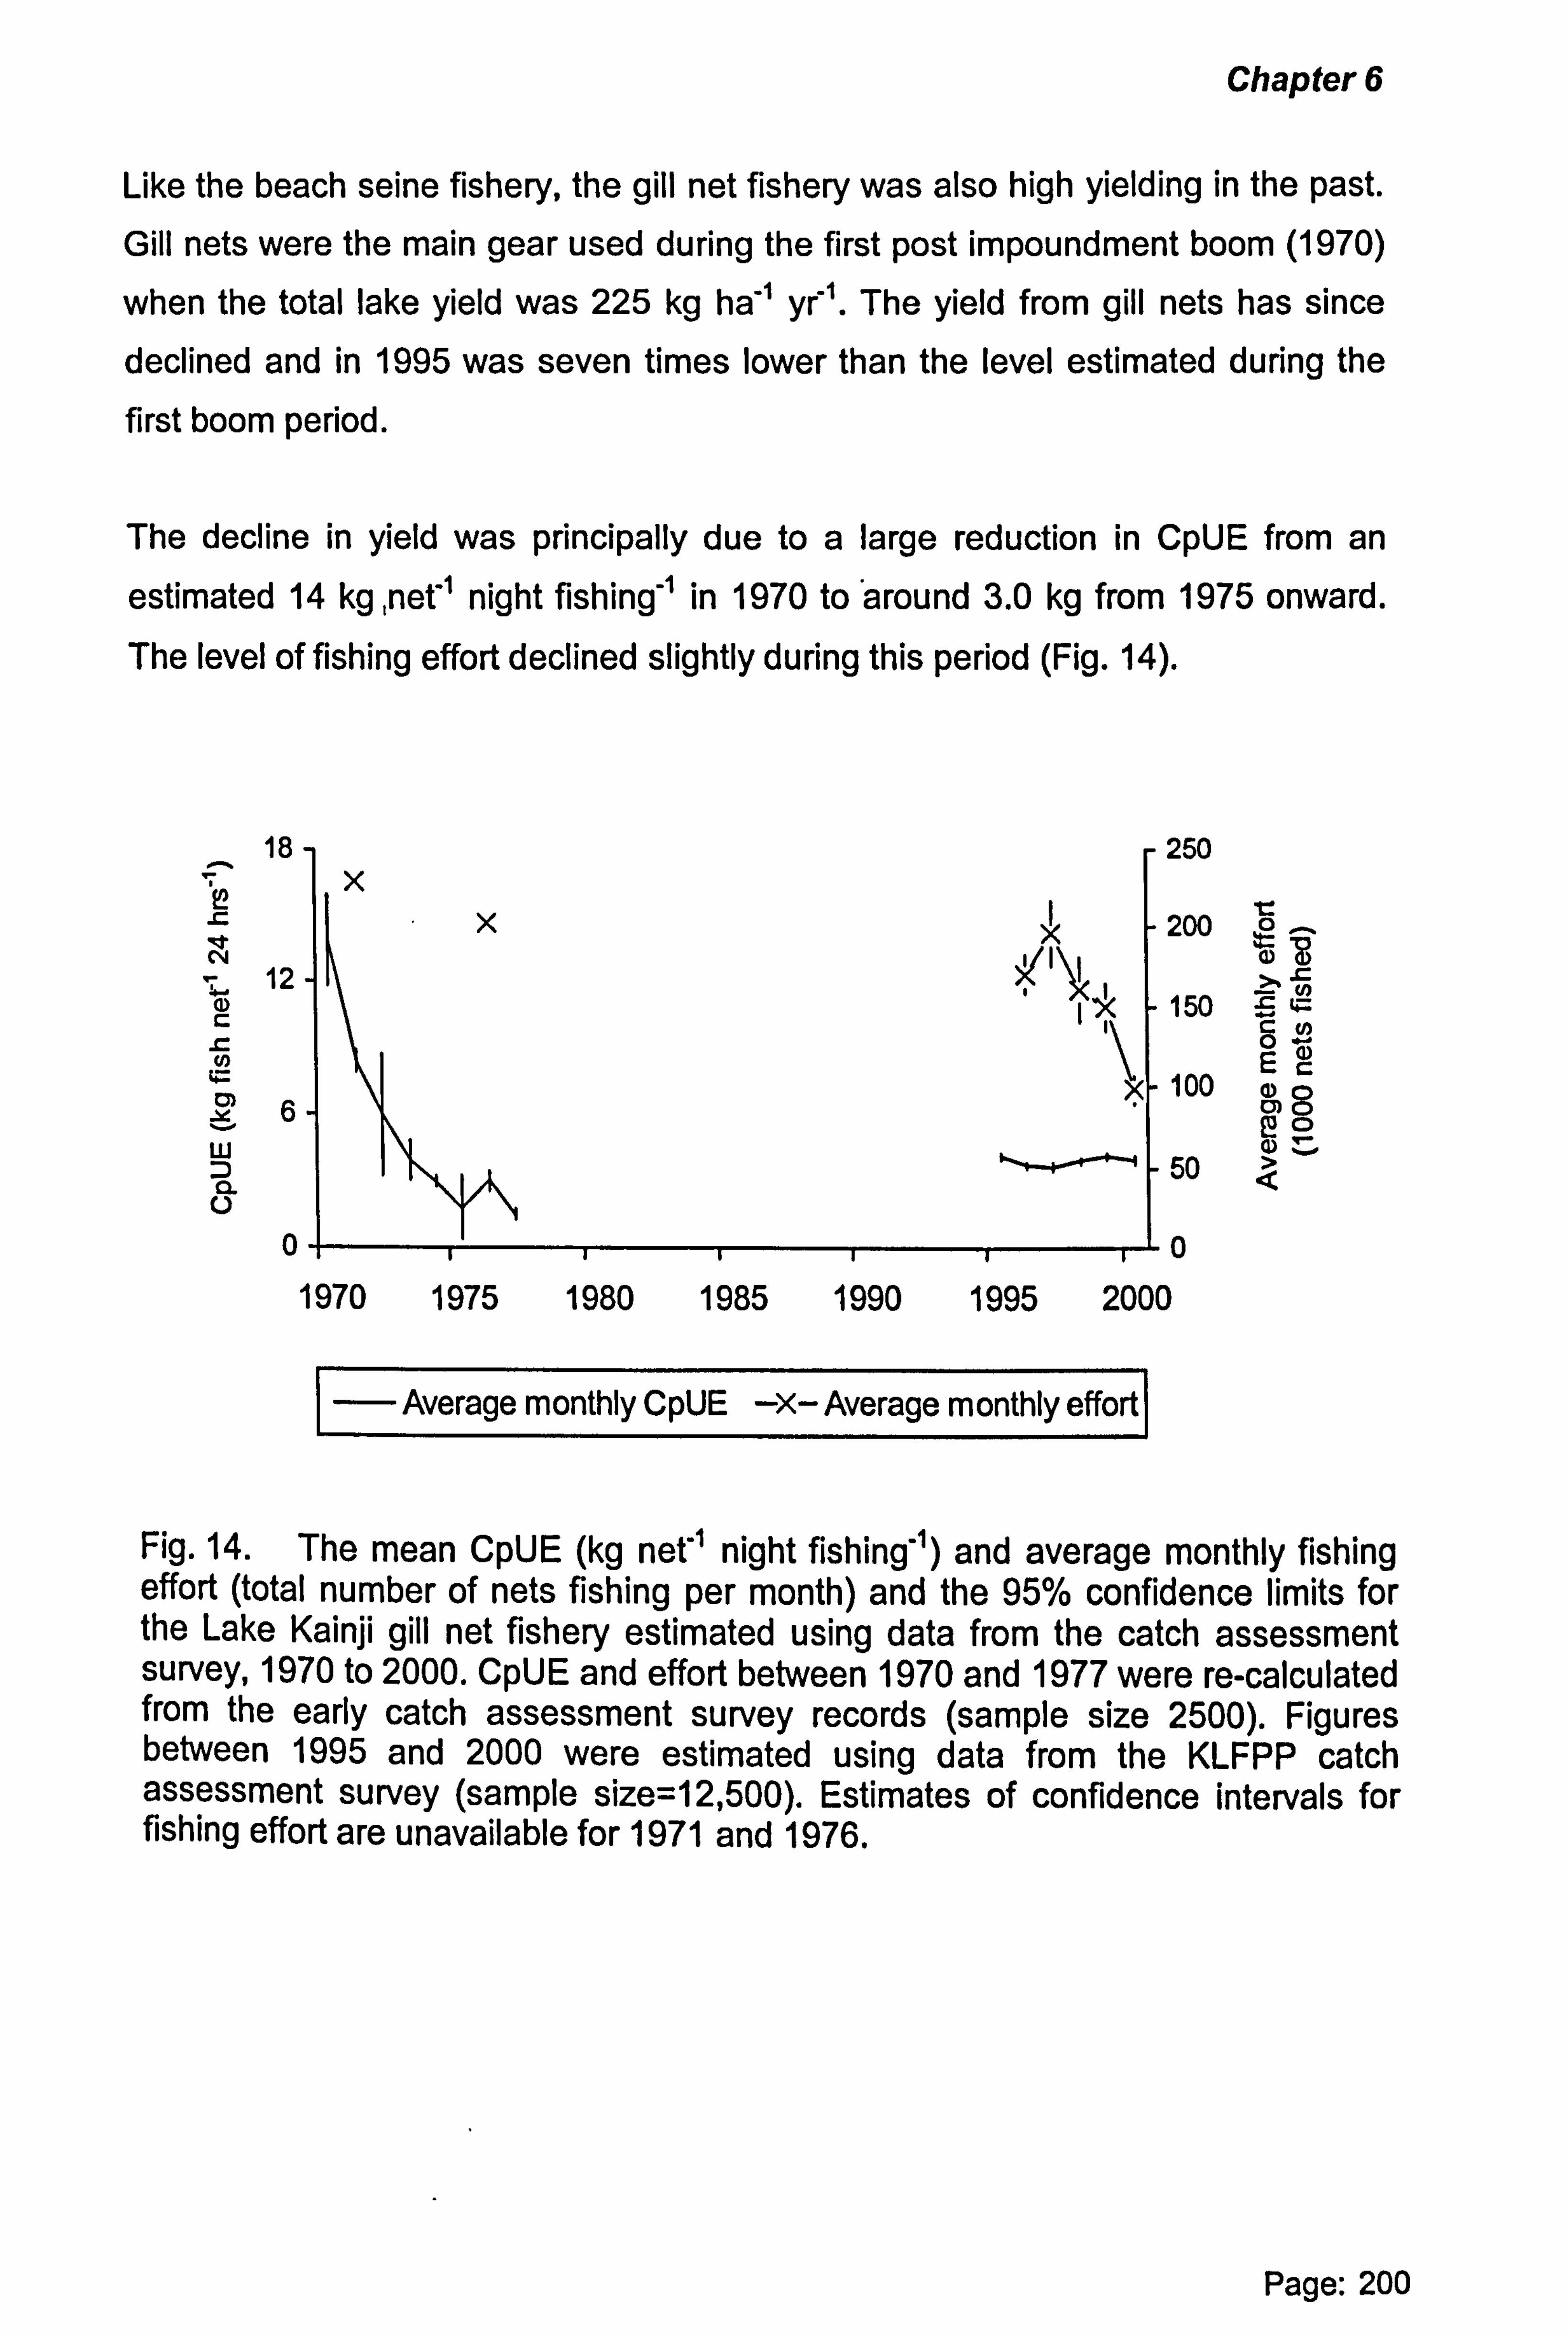
Chapter 6
Like the beach seine fishery, the gill net fishery was also high yielding in the past. Gill nets were the main gear used during the first post impoundment boom (1970)
when the total lake yield was 225 kg ha" yr'. The yield from gill nets has since declined and in 1995 was seven times lower than the level estimated during the
first boom period.
The decline in yield was principally due to a large reduction in CpUE from an
estimated 14 kg , nef1 night fishing" in 1970 to 'around 3.0 kg from 1975 onward.
The level of fishing effort declined slightly during this period (Fig. 14).
N
a) t N
D) Y
w D
a 0
18
12
6
0
250
o 200
150 c W- 0-
ä) 100
ýOo 50 Q
0
Average monthly CpUE -X- Average monthly effort
Fig. 14. The mean CpUE (kg net'' night fishing") and average monthly fishing effort (total number of nets fishing per month) and the 95% confidence limits for the Lake Kainji gill net fishery estimated using data from the catch assessment survey, 1970 to 2000. CpUE and effort between 1970 and 1977 were re-calculated from the early catch assessment survey records (sample size 2500). Figures between 1995 and 2000 were estimated using data from the KLFPP catch assessment survey (sample size=12,500). Estimates of confidence intervals for fishing effort are unavailable for 1971 and 1976.
Page: 200
1970 1975 1980 1985 1990 1995 2000
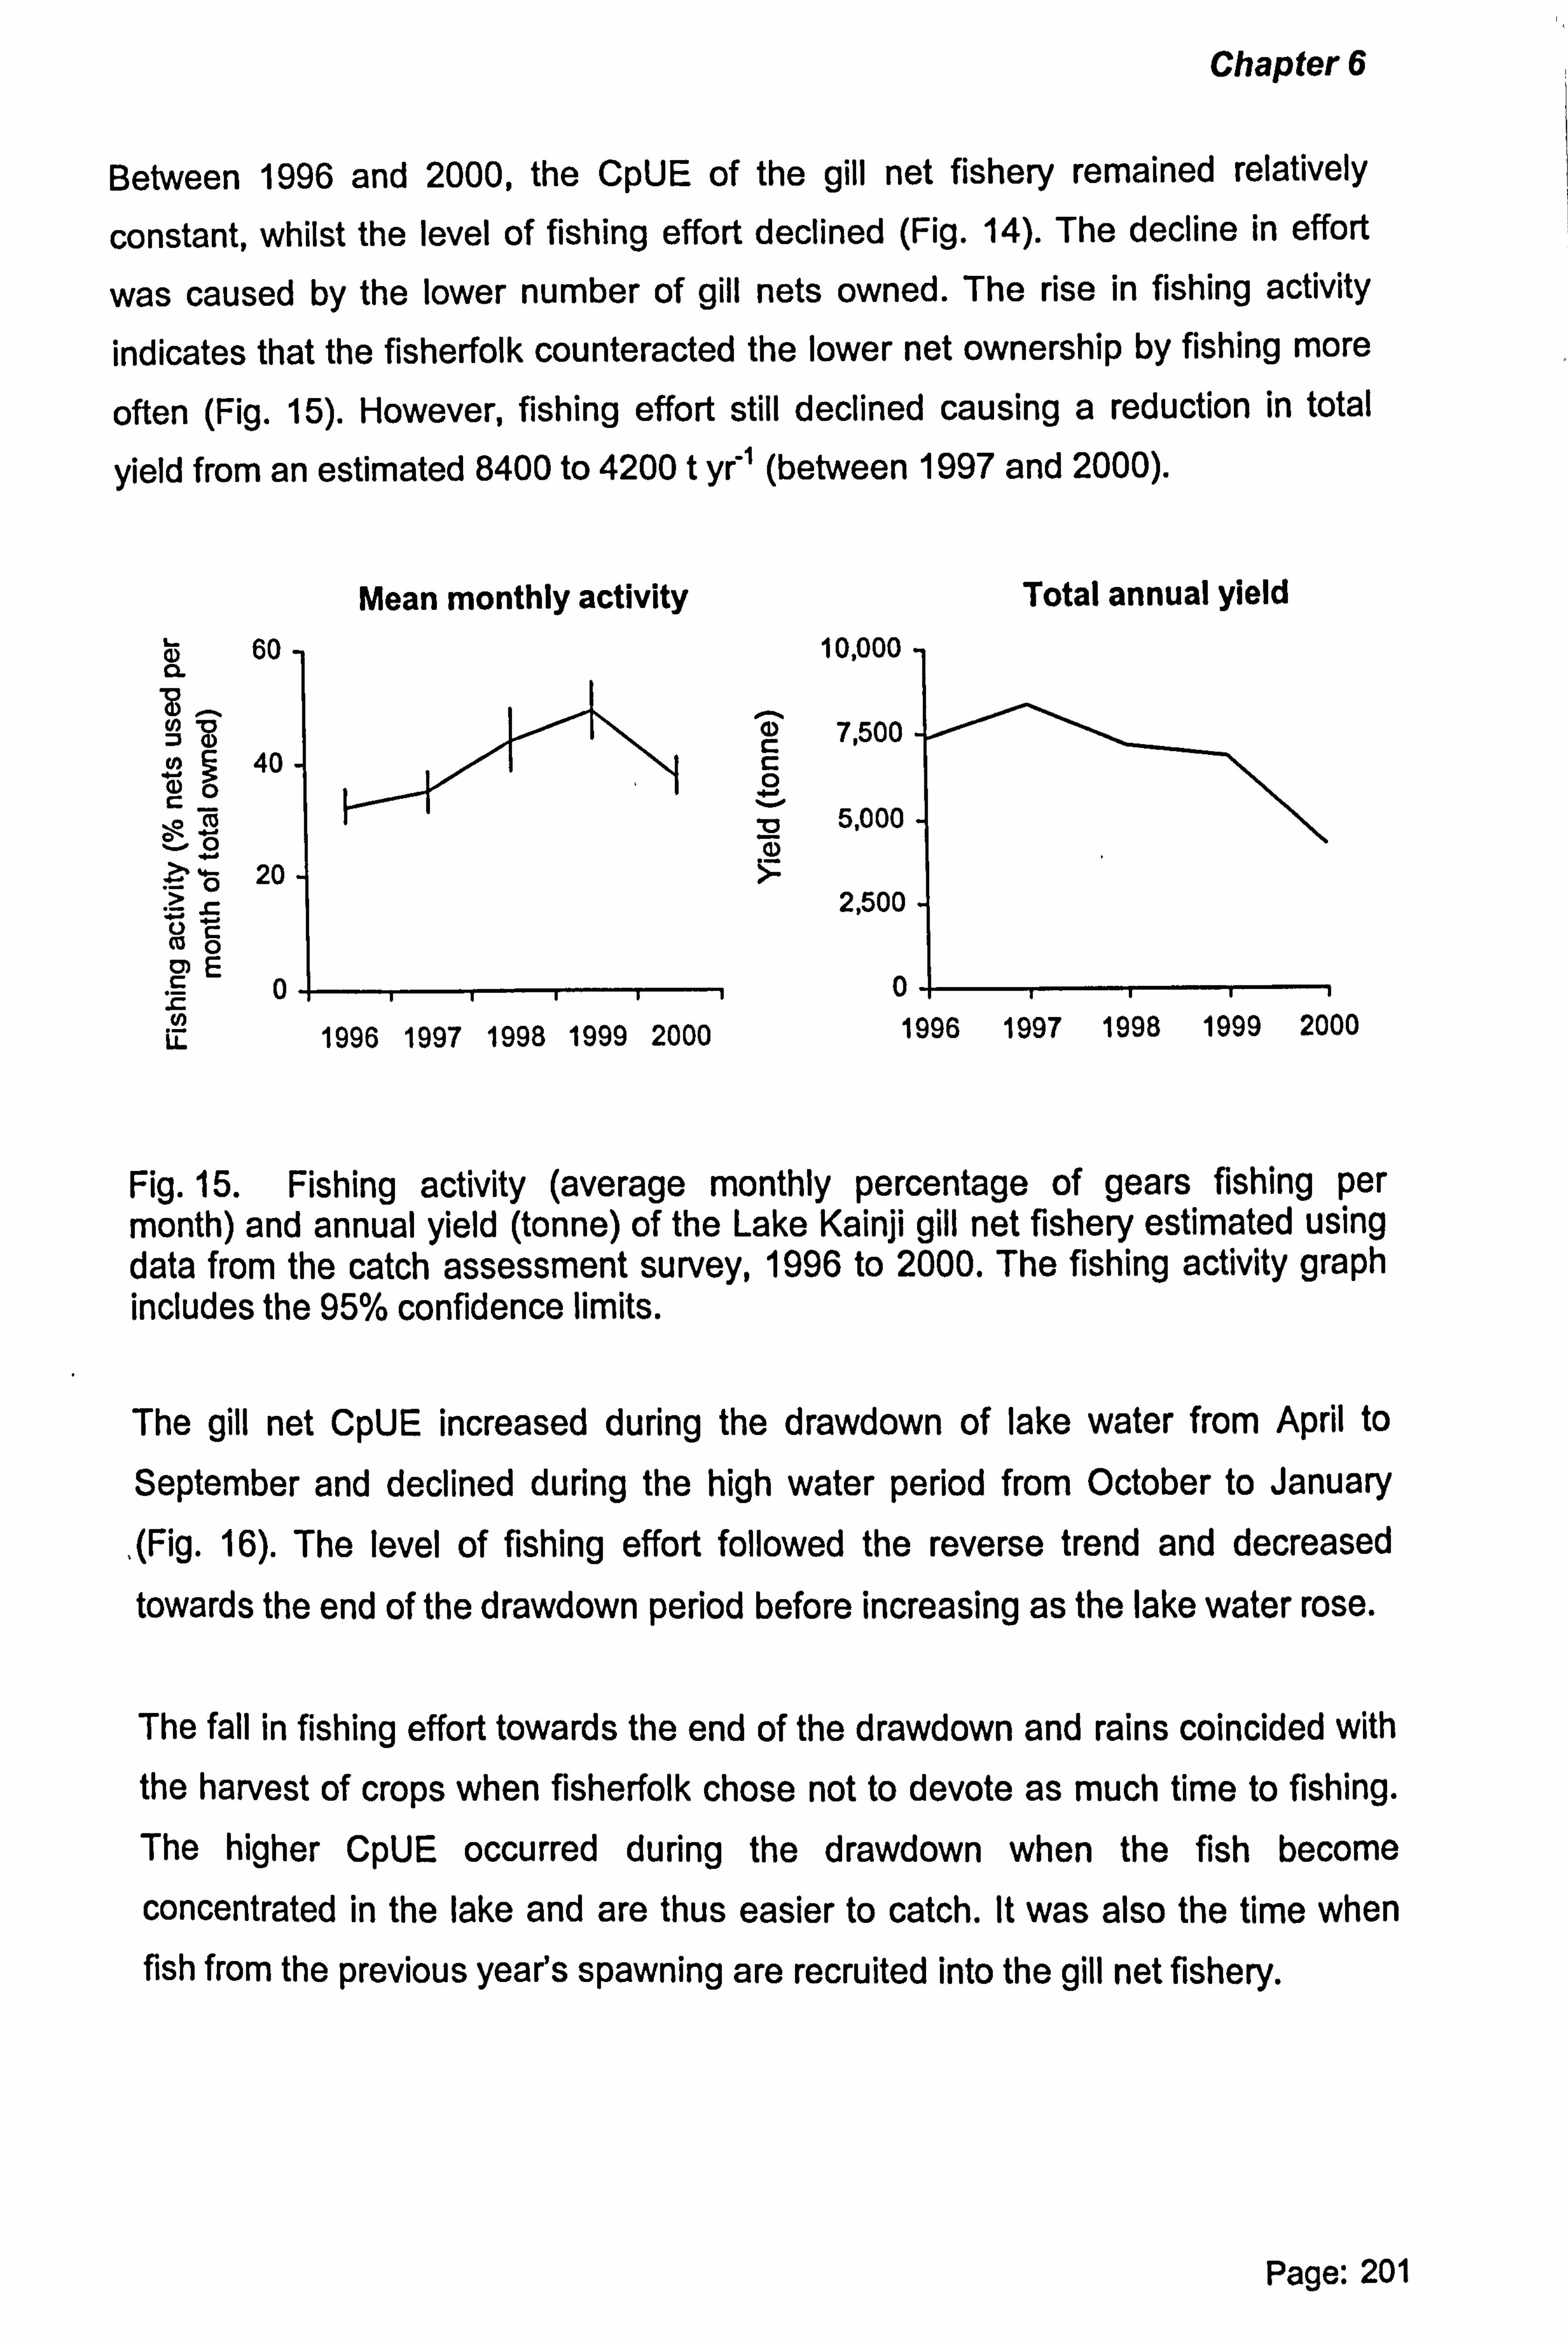
Chapter 6
Between 1996 and 2000, the CpUE of the gill net fishery remained relatively
constant, whilst the level of fishing effort declined (Fig. 14). The decline in effort
was caused by the lower number of gill nets owned. The rise in fishing activity
indicates that the fisherfolk counteracted the lower net ownership by fishing more
often (Fig. 15). However, fishing effort still declined causing a reduction in total
yield from an estimated 8400 to 4200 t yr 1 (between 1997 and 2000).
Mean monthly activity
0.
U) Z) 4) N
OO
.. O
t UC OO m
L N_ Li.
60
40
20
0
10,000
7,500-. --
5,000-
2,500
oL
Total annual yield
Fig. 15. Fishing activity (average monthly percentage of gears fishing per month) and annual yield (tonne) of the Lake Kainji gill net fishery estimated using data from the catch assessment survey, 1996 to 2000. The fishing activity graph includes the 95% confidence limits.
The gill net CpUE increased during the drawdown of lake water from April to
September and declined during the high water period from October to January
(Fig. 16). The level of fishing effort followed the reverse trend and decreased
towards the end of the drawdown period before increasing as the lake water rose.
The fall in fishing effort towards the end of the drawdown and rains coincided with the harvest of crops when fisherfolk chose not to devote as much time to fishing.
The higher CpUE occurred during the drawdown when the fish become
concentrated in the lake and are thus easier to catch. It was also the time when fish from the previous year's spawning are recruited into the gill net fishery.
Page: 201
1997 1998 1999 2000 1996 1997 1998 1999 2000
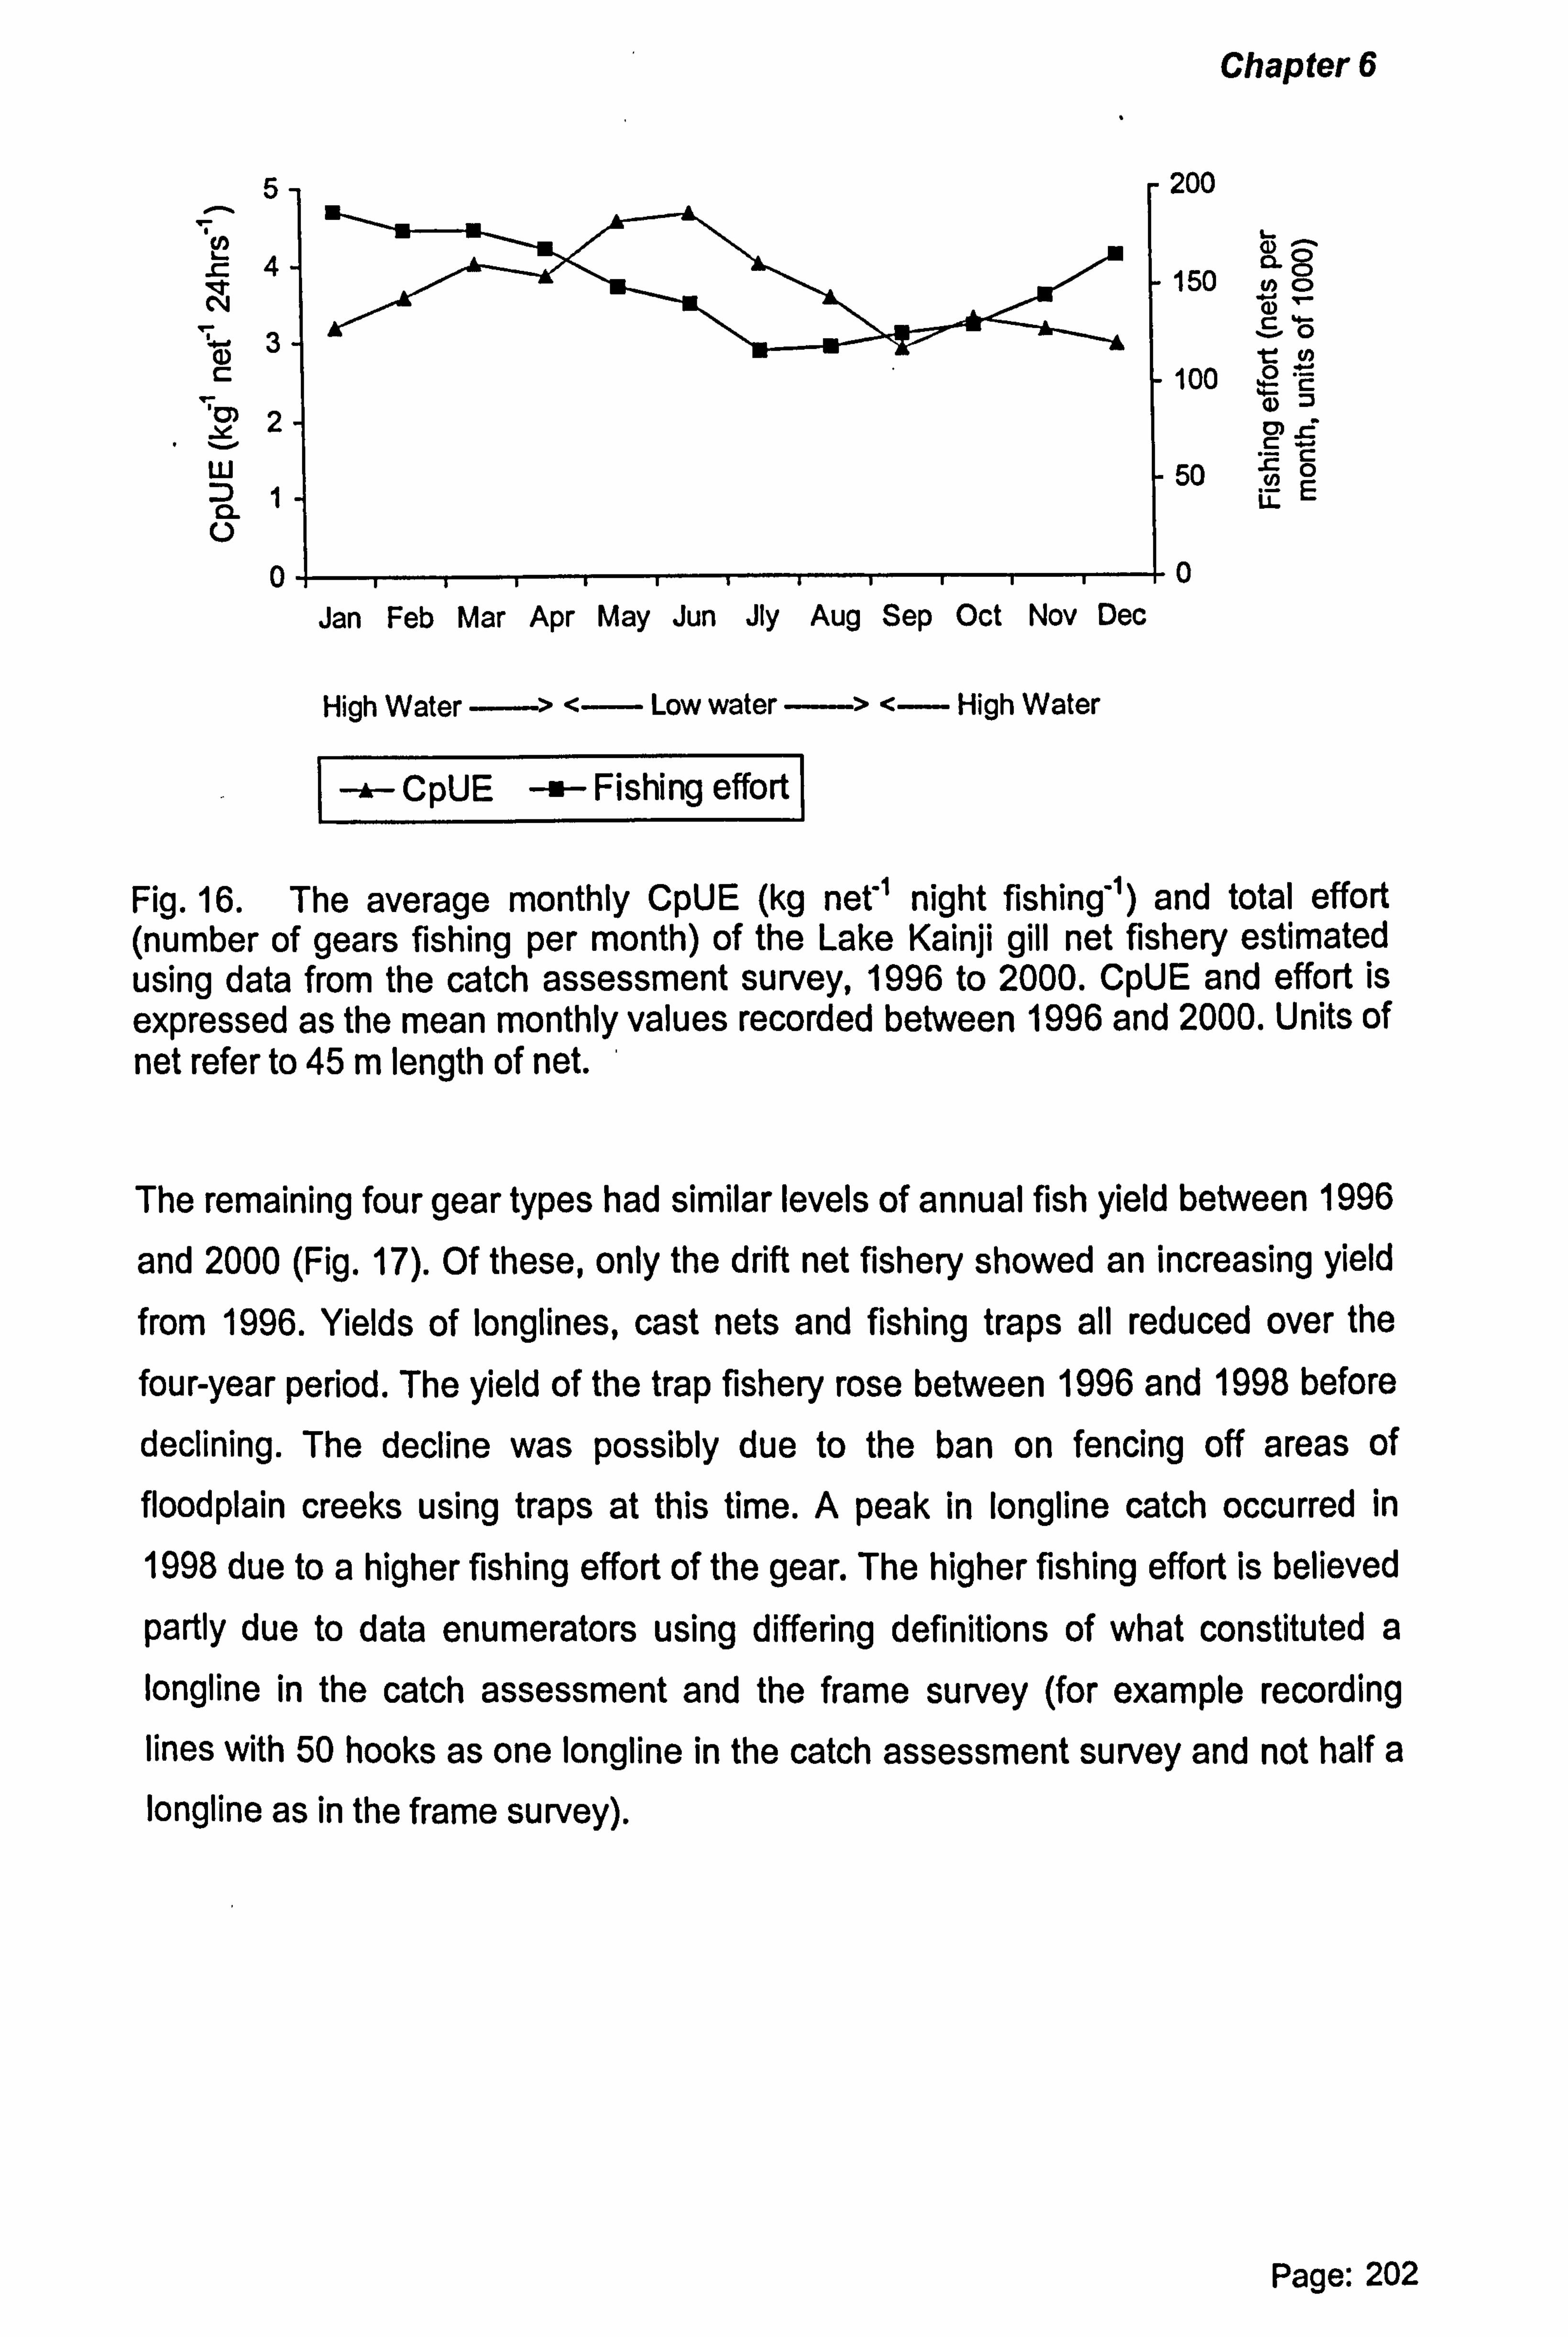
5
N .c4
C2
W
CL 1 U
0
High Water ---> < Low water >< High Water
-* CpUE -. -- Fishing effort
Chapter 6
200
' äS 150 o r" v0
100
50 C c
E 0=
0
Fig. 16. The average monthly CpUE (kg net's night fishing-) and total effort (number of gears fishing per month) of the Lake Kainji gill net fishery estimated using data from the catch assessment survey, 1996 to 2000. CpUE and effort is expressed as the mean monthly values recorded between 1996 and 2000. Units of net refer to 45 m length of net.
The remaining four gear types had similar levels of annual fish yield between 1996
and 2000 (Fig. 17). Of these, only the drift net fishery showed an increasing yield from 1996. Yields of longlines, cast nets and fishing traps all reduced over the
four-year period. The yield of the trap fishery rose between 1996 and 1998 before
declining. The decline was possibly due to the ban on fencing off areas of floodplain creeks using traps at this time. A peak in longline catch occurred in
1998 due to a higher fishing effort of the gear. The higher fishing effort is believed
partly due to data enumerators using differing definitions of what constituted a longline in the catch assessment and the frame survey (for example recording lines with 50 hooks as one longline in the catch assessment survey and not half a longline as in the frame survey).
Page: 202
Jan Feb Mar Apr May Jun Jiy Aug Sep Oct Nov Dec
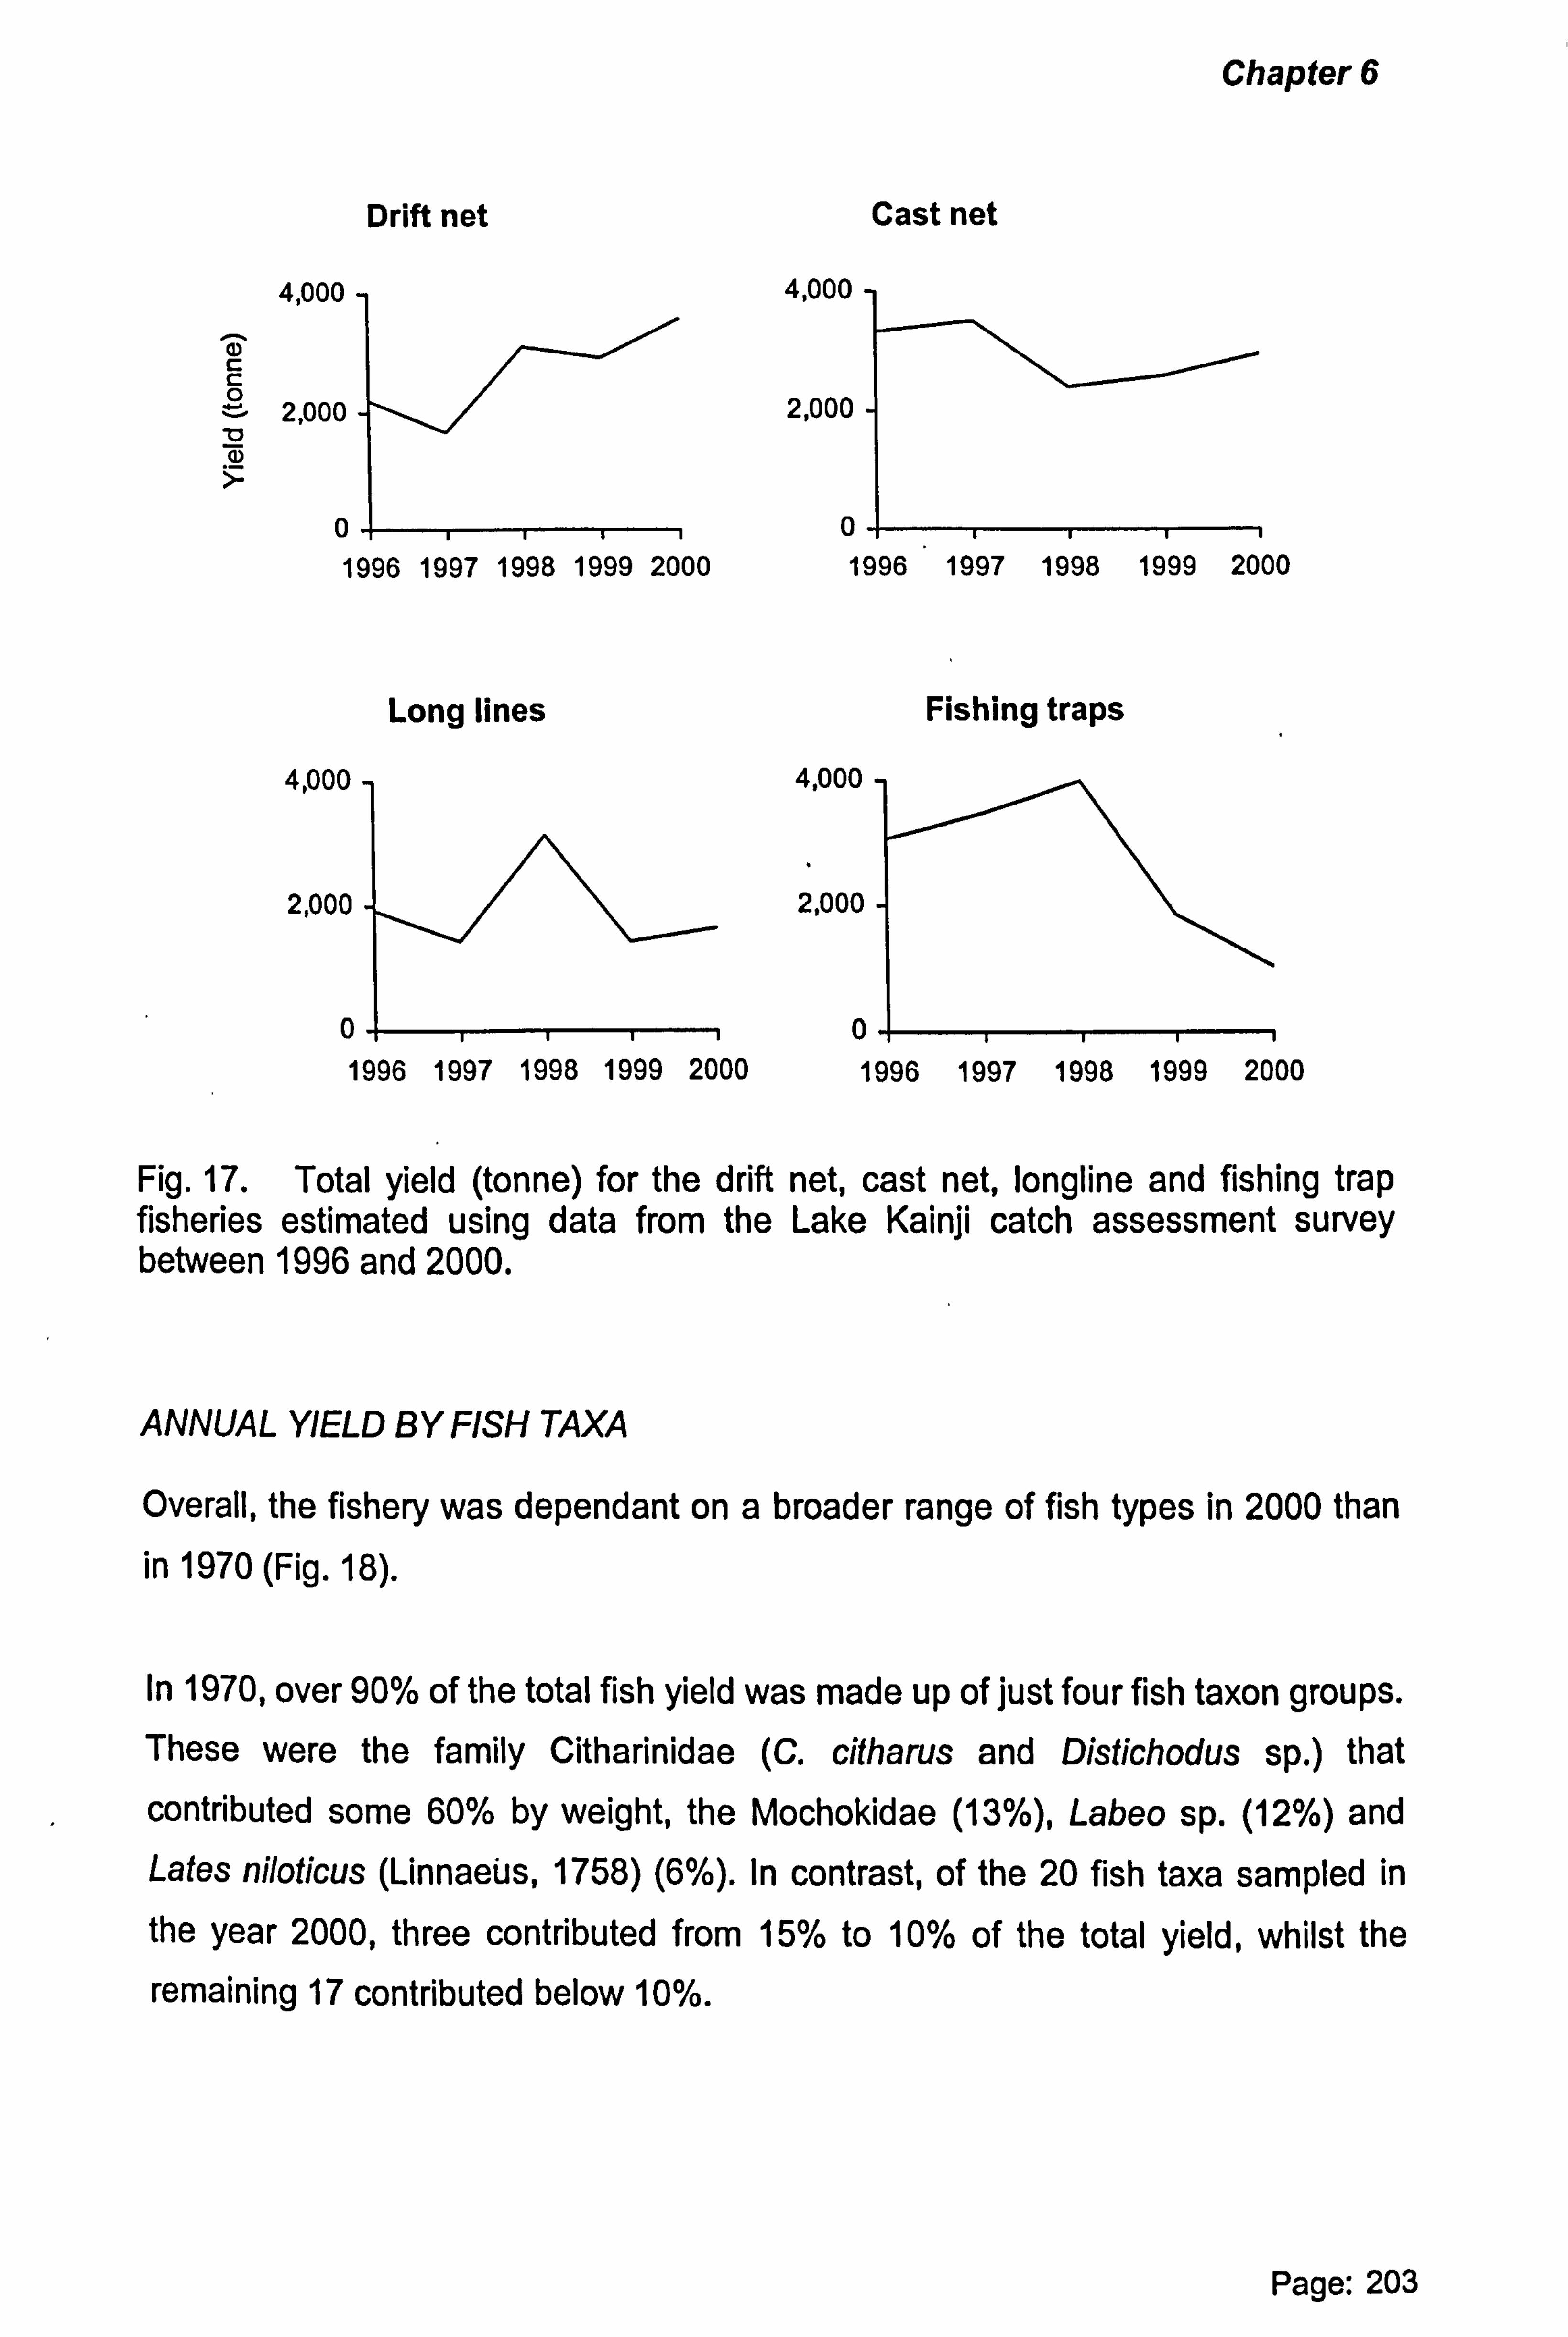
Chapter 6
Drift net
4,000
c c 0 2,000
0 1996 1997 1998 1999 2000
Long lines
4,000-
2,000
0 1996 1997 1998 1999 2000
Cast net
4,000
2,000
o. - 1996
Fishing traps
4,000
2,000
04- 1996
Fig. 17. Total yield (tonne) for the drift net, cast net, longline and fishing trap fisheries estimated using data from the Lake Kainji catch assessment survey between 1996 and 2000.
ANNUAL YIELD BY FISH TAXA
Overall, the fishery was dependant on a broader range of fish types in 2000 than in 1970 (Fig. 18).
In 1970, over 90% of the total fish yield was made up of just four fish taxon groups. These were the family Citharinidae (C. citharus and Distichodus sp. ) that
contributed some 60% by weight, the Mochokidae (13%), Labeo sp. (12%) and Lates niloticus (Linnaeus, 1758) (6%). In contrast, of the 20 fish taxa sampled in the year 2000, three contributed from 15% to 10% of the total yield, whilst the
remaining 17 contributed below 10%.
Page: 203
1997 1998 1999 2000
1997 1998 1999 2000
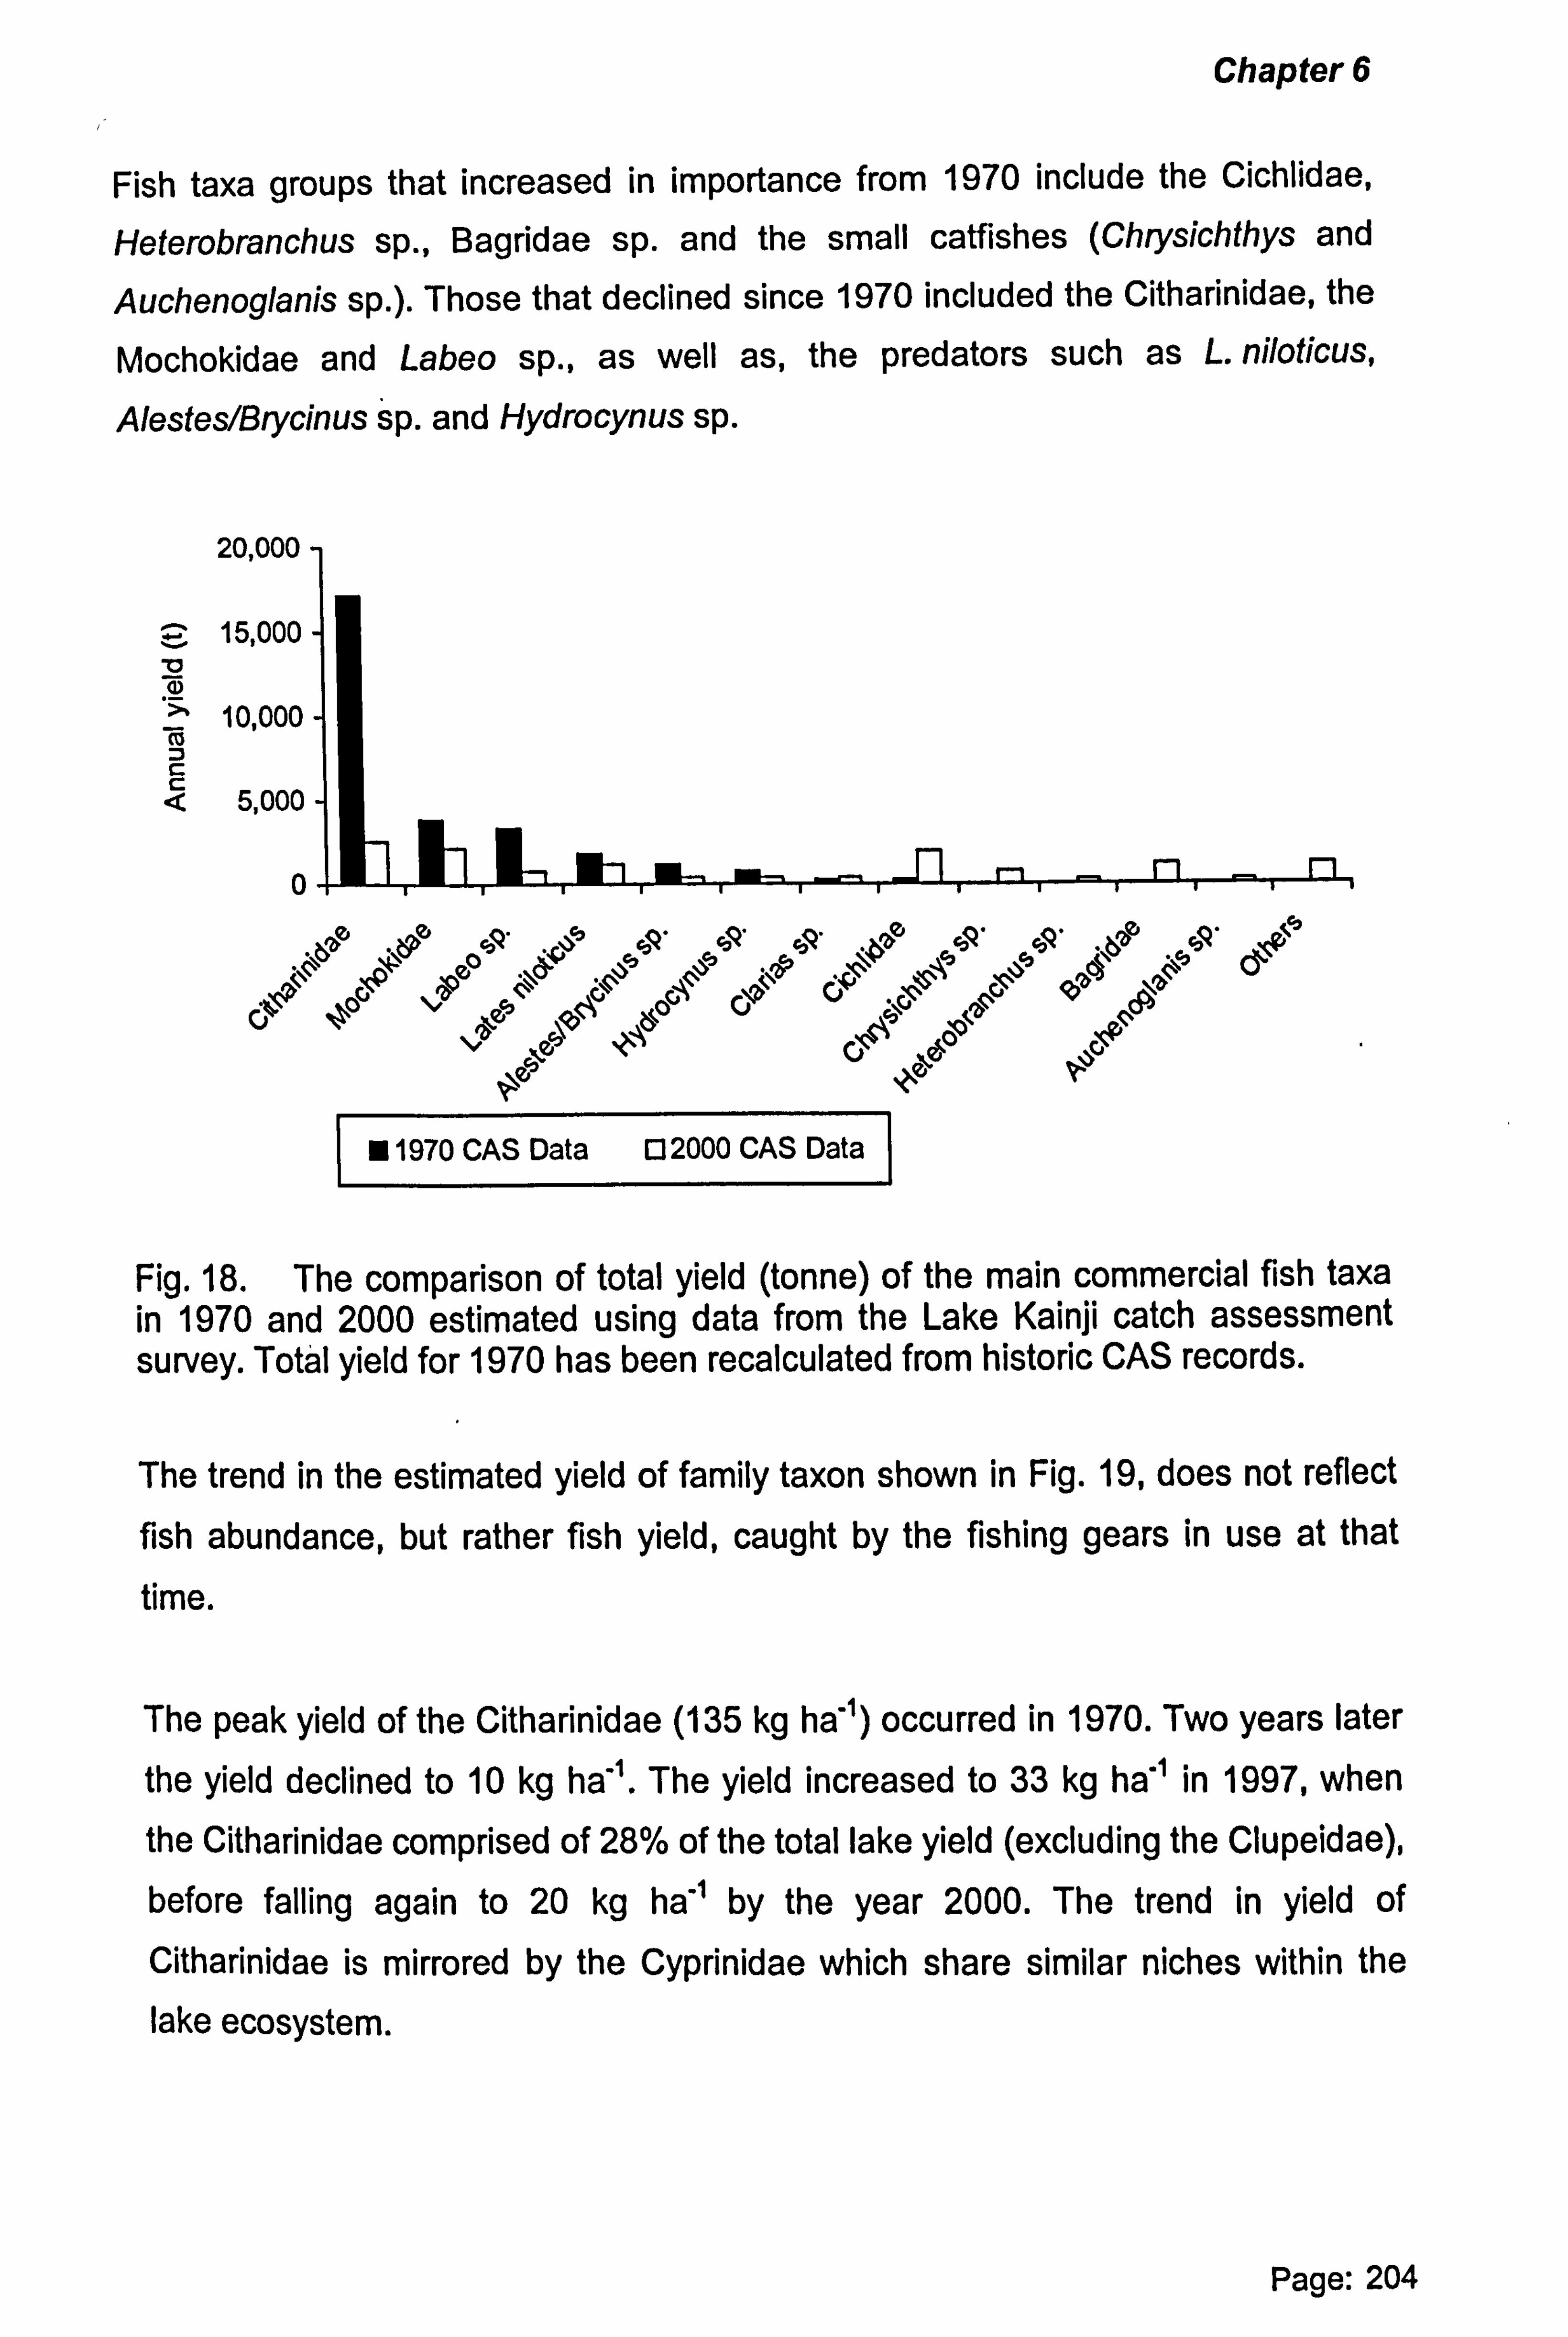
Chapter 6
Fish taxa groups that increased in importance from 1970 include the Cichlidae,
Heterobranchus sp., Bagridae sp. and the small catfishes (Chrysichthys and
Auchenoglanis sp. ). Those that declined since 1970 included the Citharinidae, the
Mochokidae and Labeo sp., as well as, the predators such as L. niloticus,
Alestes/Brycinus sp. and Hydrocynus sp.
20,000
v 15,000
a) 10,000
5,000
0
\aýz . ýýý o5Q ýJy ý5Q 54 yQ `ýao ý5Q
«. ?« ßc5
G
F 9970 CAS Data [32000 CAS Data
Fig. 18. The comparison of total yield (tonne) of the main commercial fish taxa in 1970 and 2000 estimated using data from the Lake Kainji catch assessment survey. Total yield for 1970 has been recalculated from historic CAS records.
The trend in the estimated yield of family taxon shown in Fig. 19, does not reflect fish abundance, but rather fish yield, caught by the fishing gears in use at that
time.
The peak yield of the Citharinidae (135 kg ha") occurred in 1970. Two years later
the yield declined to 10 kg ha-1. The yield increased to 33 kg ha" in 1997, when the Citharinidae comprised of 28% of the total lake yield (excluding the Clupeidae),
before falling again to 20 kg ha " by the year 2000. The trend in yield of Citharinidae is mirrored by the Cyprinidae which share similar niches within the lake ecosystem.
Page: 204
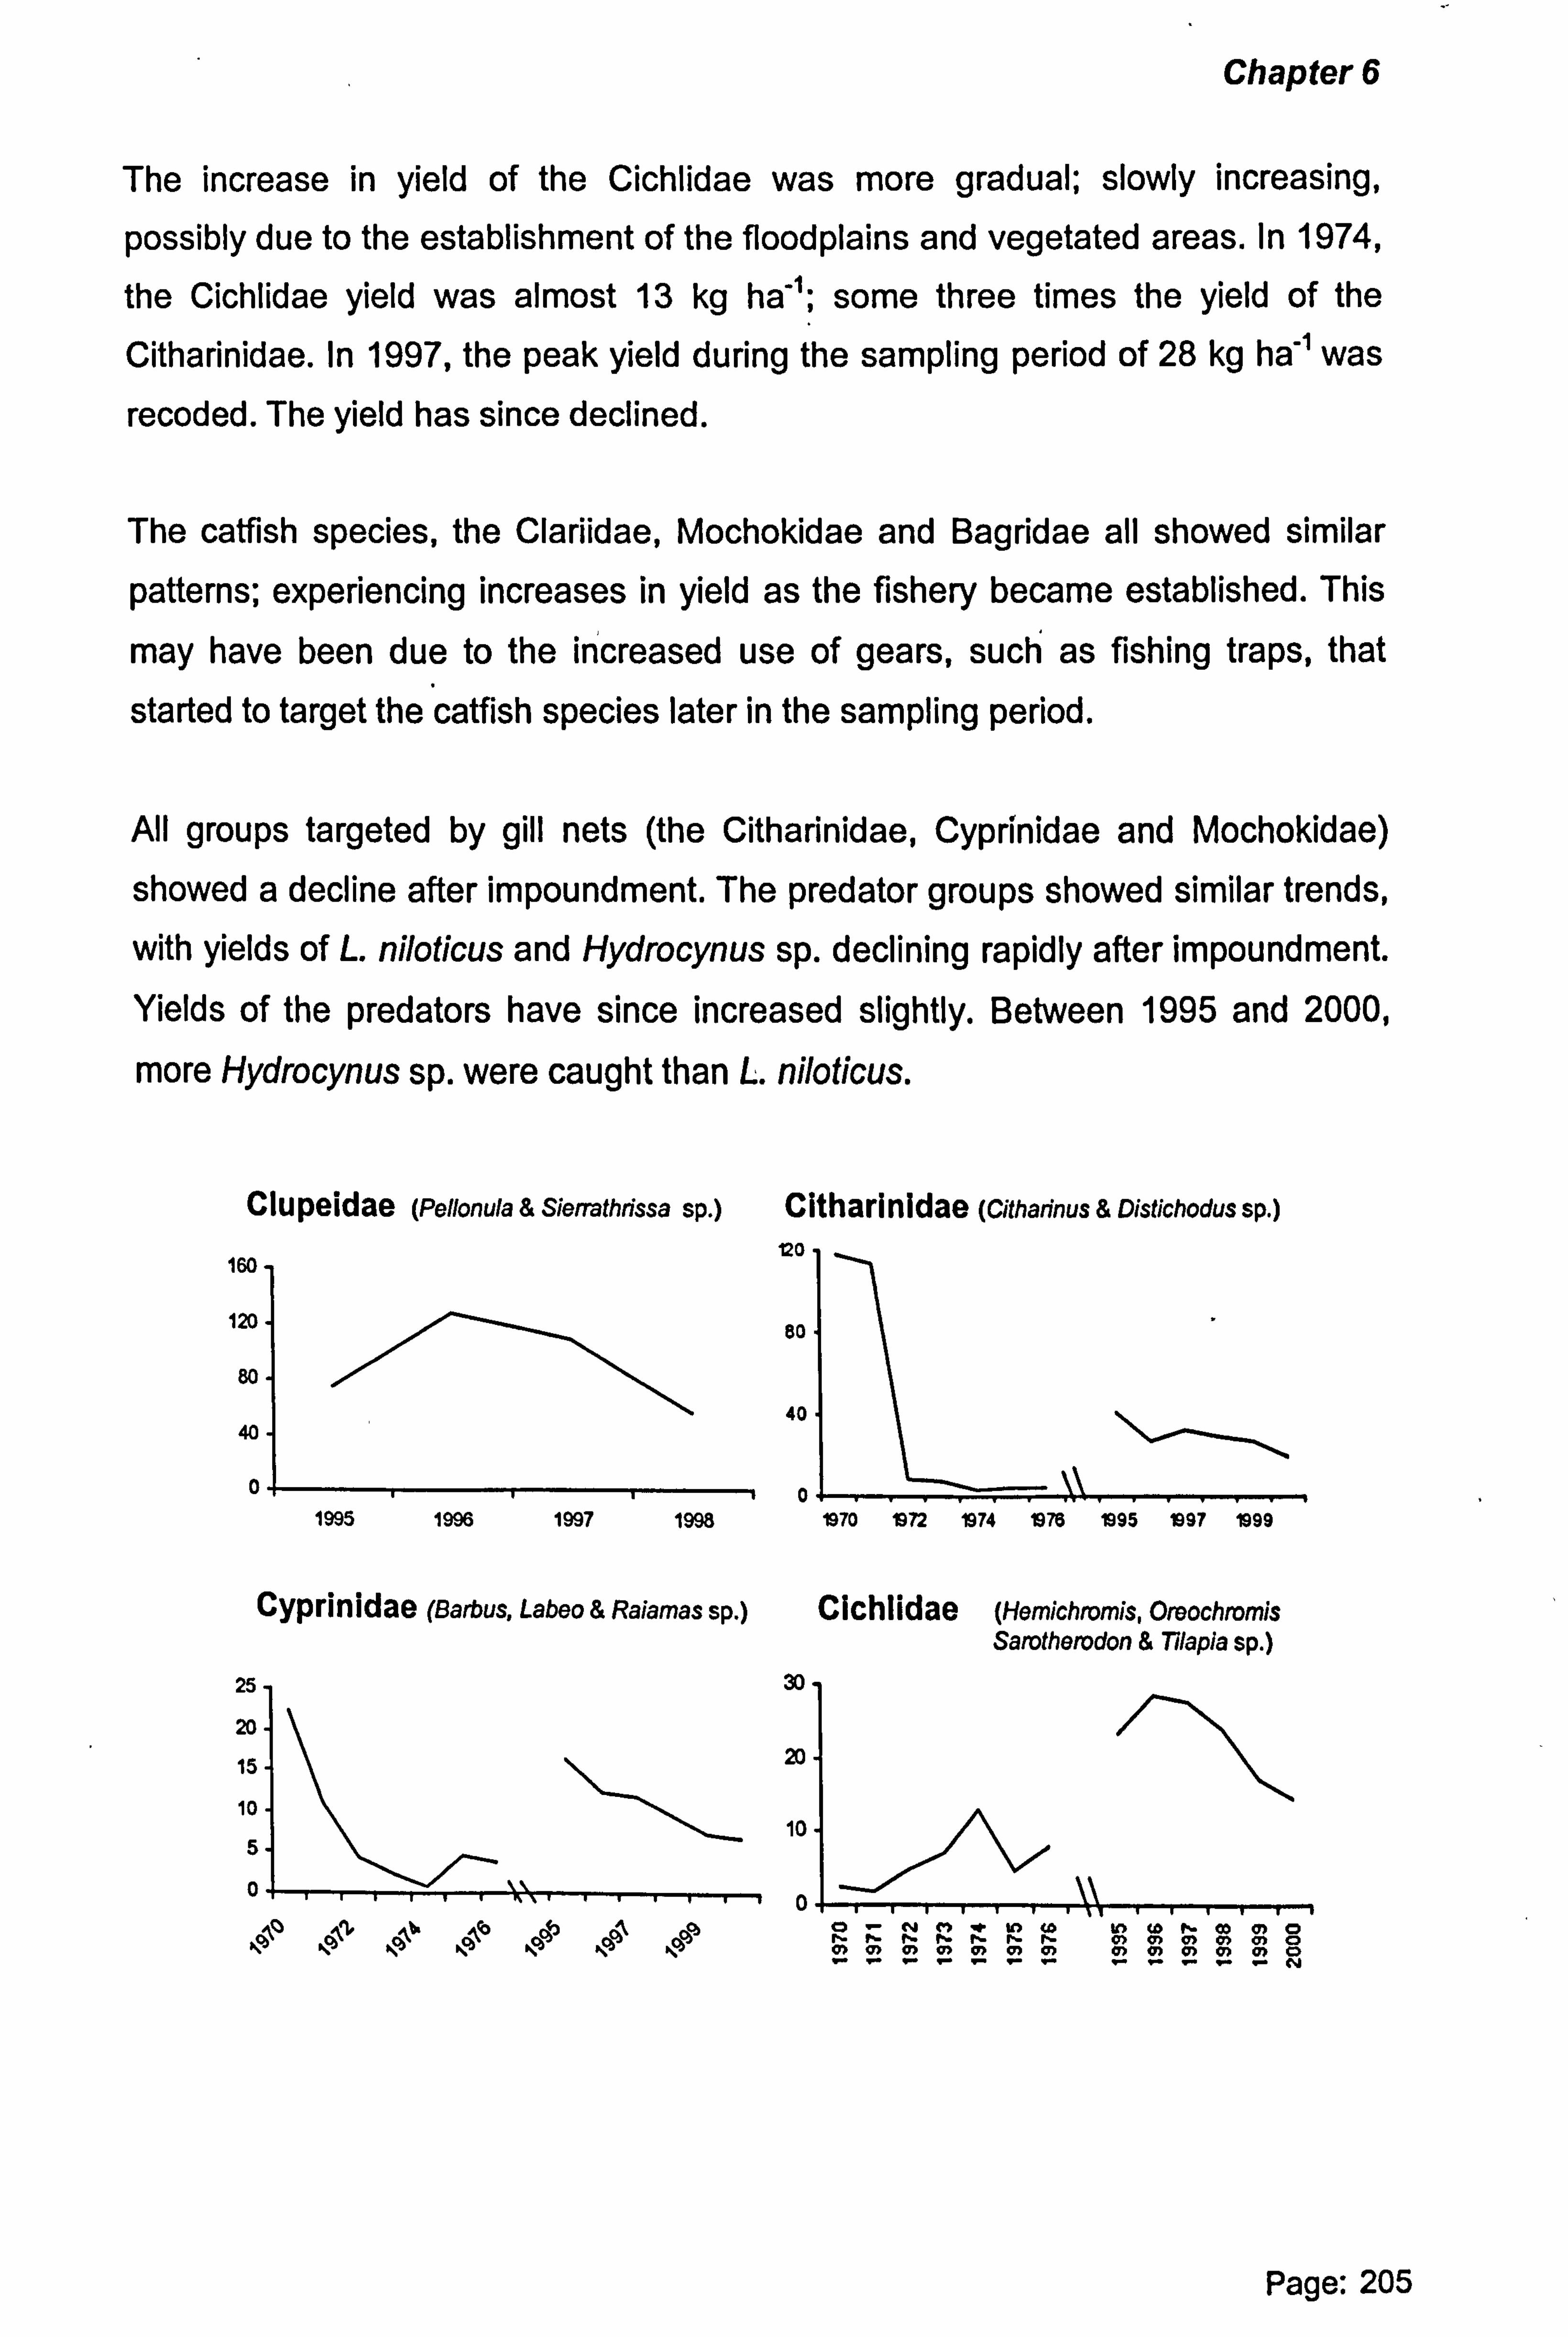
Chapter 6
The increase in yield of the Cichlidae was more gradual; slowly increasing,
possibly due to the establishment of the floodplains and vegetated areas. In 1974,
the Cichlidae yield was almost 13 kg ha"; some three times the yield of the
Citharinidae. In 1997, the peak yield during the sampling period of 28 kg ha -1 was
recoded. The yield has since declined.
The catfish species, the Clariidae, Mochokidae and Bagridae all showed similar
patterns; experiencing increases in yield as the fishery became established. This
may have been due to the increased use of gears, such as fishing traps, that
started to target the catfish species later in the sampling period.
All groups targeted by gill nets (the Citharinidae, Cyprinidae and Mochokidae)
showed a decline after impoundment. The predator groups showed similar trends,
with yields of L. niloticus and Hydrocynus sp. declining rapidly after impoundment.
Yields of the predators have since increased slightly. Between 1995 and 2000,
more Hydrocynus sp. were caught than L. niloticus.
Clupeidae (Penonuta & Sierrathrissa sp. ) 160
120
80
40
0
Cyprinidae (Barbus, Labeo & Raiamas sp. )
25
20
15
10
5
0
Citharinidae (Citharinus & Distichodus sp. ) 120 ,_
80
40
Cichlidae (Hemichromis, Oreochromis Sarotherodon & Tilapia sp. )
30
20
10
0
Page: 205
of .I. ,« 1970 1972 1974 1976 1995 1997 1999 1995 1996 1997 1998
O-N () rt 1[) (A to Cb h (0 0) O fti M1 M1 h M1 M1 M1 C) O) Of Of 0) O O> OT Of O 01 AO O1 OO O/ O rrrrrrrrrrrrN I-lb
A
Ncb 1140,11cp

Chapter 6
Characidae (Alestes, Brycinus sp. )
20-
Is-
10.
s
0 O~; NC! -& I[) (0
O~1 O) 2 0) O~) O~) O~)
40
30
Mochokidae (Hemisynodontis & Synodontis sp. ) (Hydrocynus separate below)
20
10
0 ff
)O Co
) C11 )) O co
) Off Ö
) O
22 2V 21 Z! G
Characidae (Hydrocynus sp. only)
Clarlidae (Clarias & Heterobranchus sp. )
15
10
5
0-
7.5
5.5
3.5
1.5
-0.50-N M w.
C) ~)
O~1 O~! 0) Q~1 O~ O )
Bagridae (Auchenoglanis, Bagrus, Chrysichthys & Clarotes sp)
40
30
20
10
0
Centropomidae (cares niroticus) 15-
10.
5
0 ONM wF 1[1 (b e CO M1 CO CO O M1 M1 M1 N 11 M1 M1 O) 0 Of 0) O1 0
Fig. 19. Annual yield (kg ha") of the main commercial fish genera and species estimated using data from the Lake Kainji catch assessment survey, 1970 to 2000. Values between 1970 and 1976 have been recalculated using historic CAS records. Estimates of the yield of the Clupeidae were unavailable before 1995. Vertical axis represent annual yield (kg ha"), horizontal axis years after impoundment.
It is suggested that the fisherfolk diversified their fishing methods to catch available species which occurred as a result of the change from riverine to lacustrine environments. The most apparent change in the gear configuration has been an increase in the number of small meshed nets. This has resulted in a reduction in the mean size of fish caught.
Page: 206
00 CO O ON Cf in 0 I) fD r- hhhh !-h f- O1 01 O) Ol O) O
ONm lF W) Co Il) Co f' 00 0) O NN P- h- h- P- P- O) O) O) O1 0) O
g! - 22 112 V g! g! g! g! c2 22 e114
O-NM e- ICf Co W) Co 1- CD CD O I- P N- N- 11 h M1 O) 0) 0) Q) 0) O 12 -2V c2 V2V2-N
1" u) tu f- Co v) o mmm C) m$ 2-V . °= N
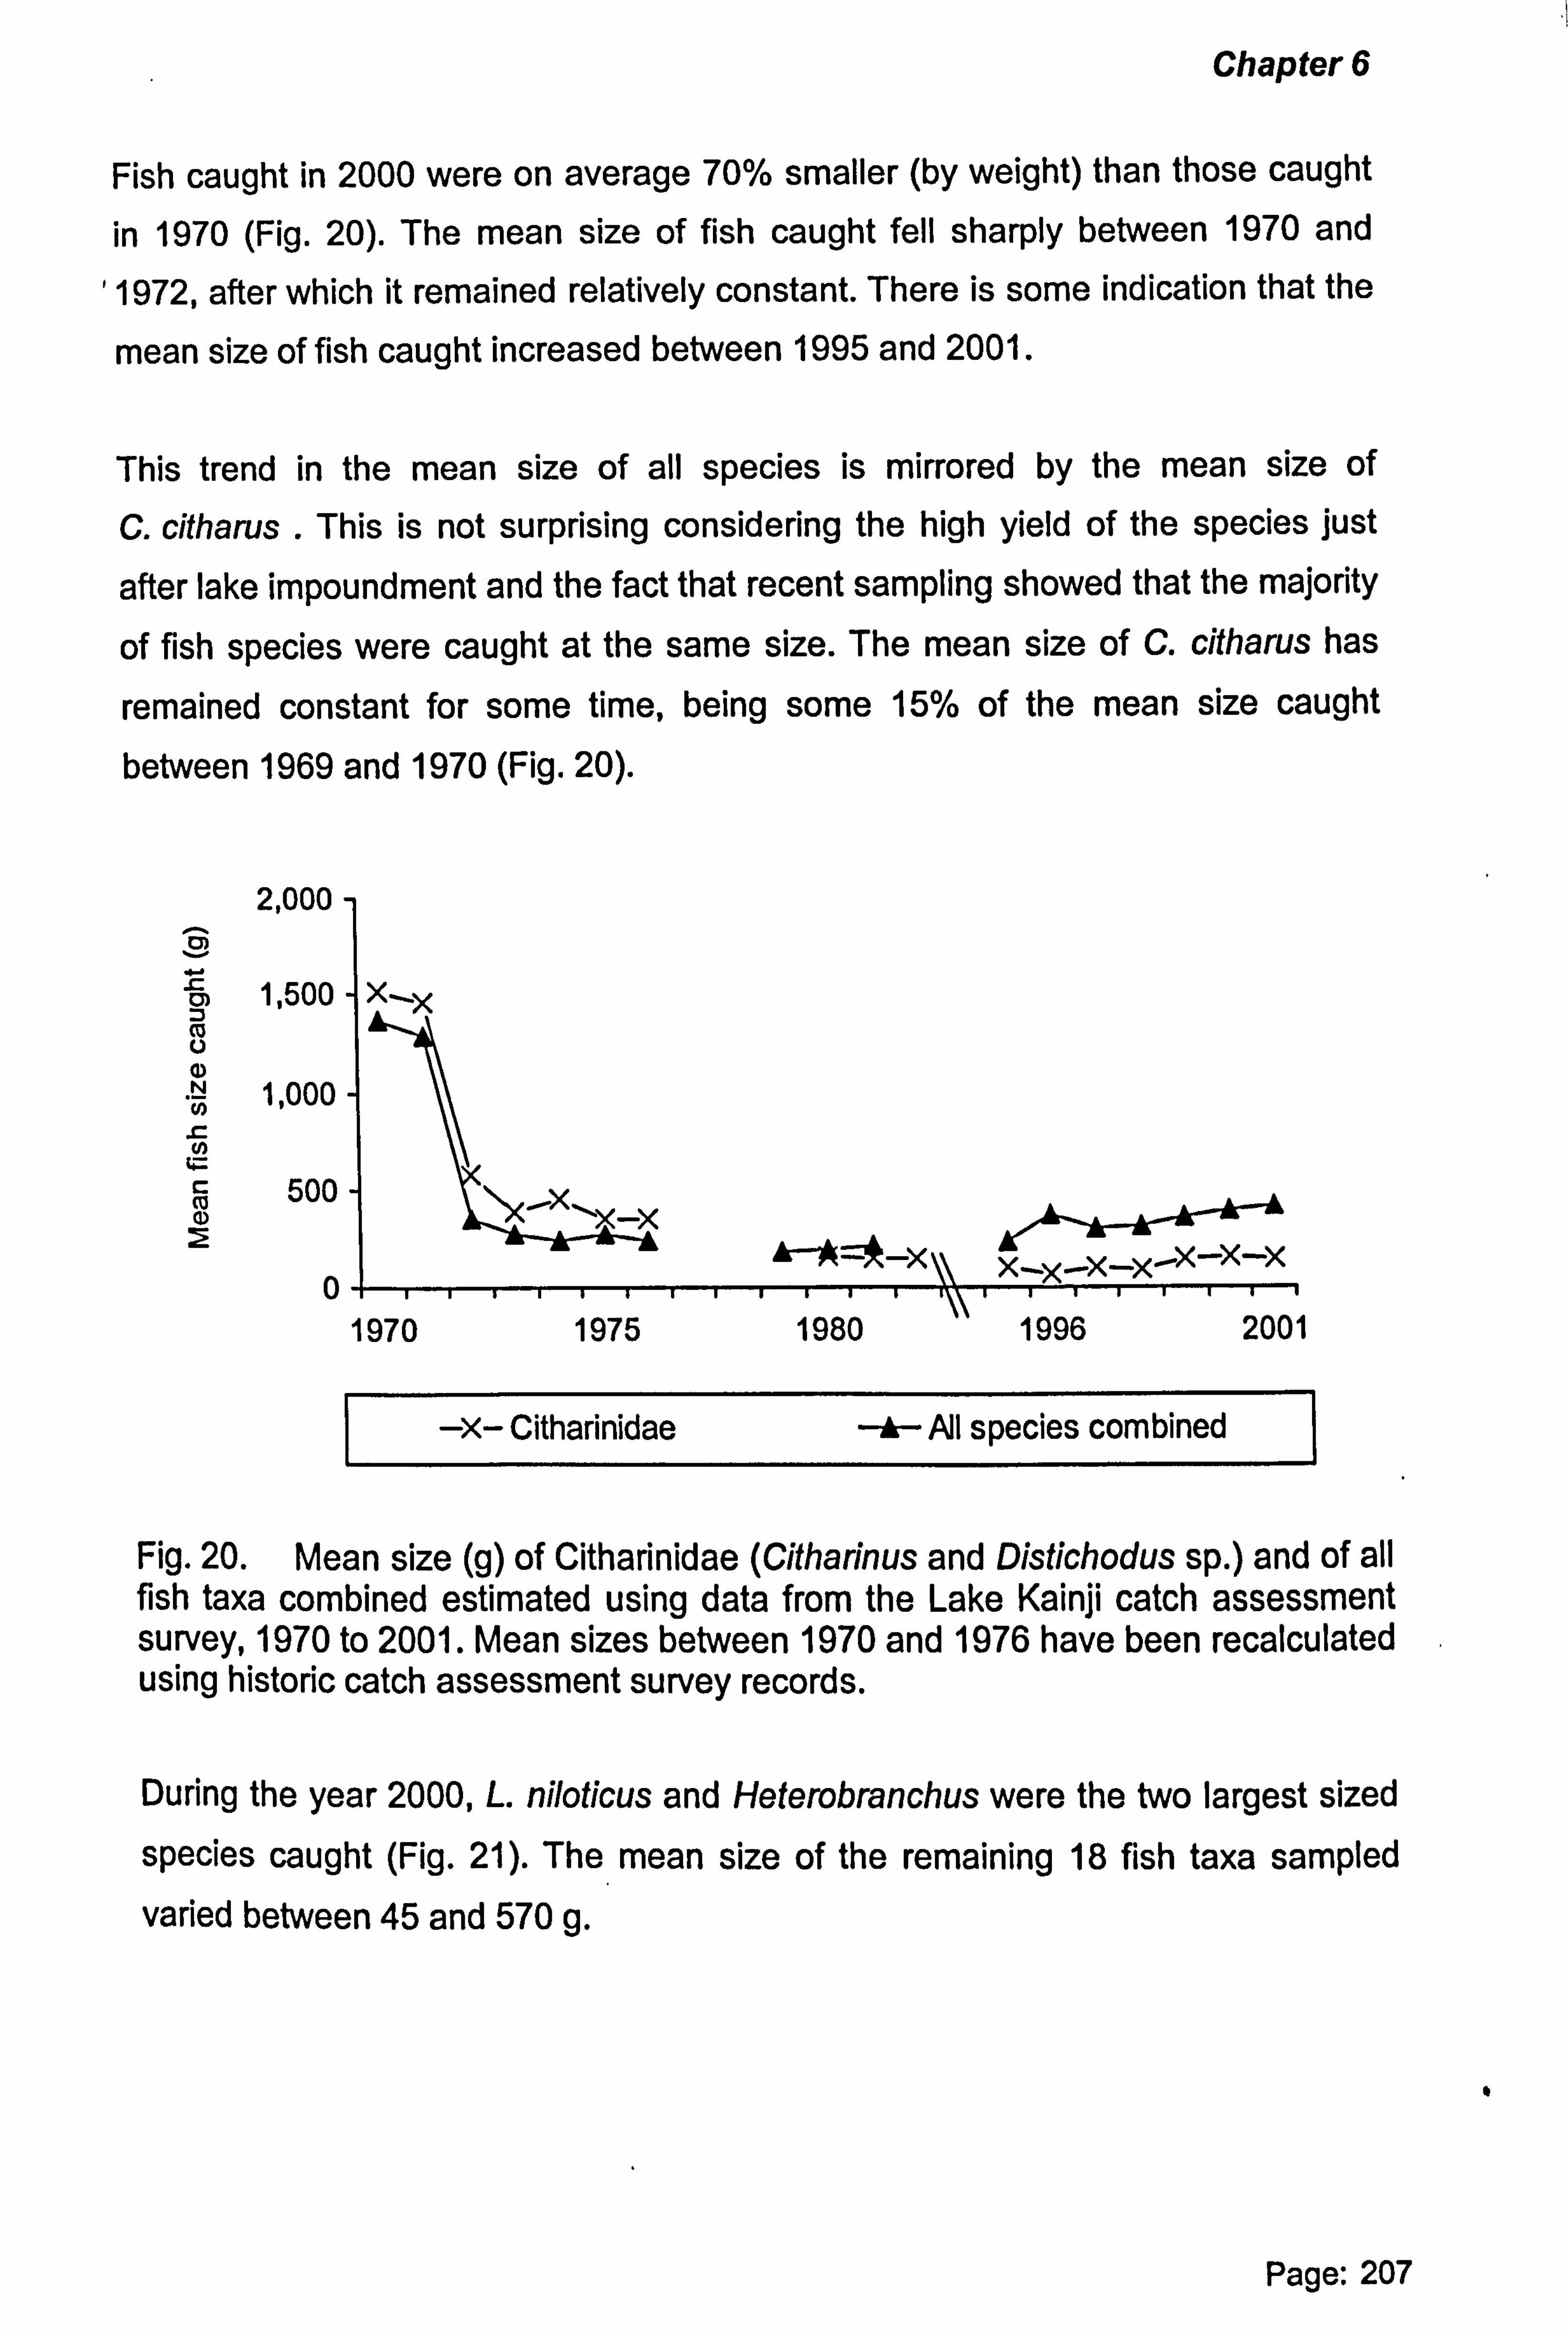
Chapter 6
Fish caught in 2000 were on average 70% smaller (by weight) than those caught
in 1970 (Fig. 20). The mean size of fish caught fell sharply between 1970 and
1972, after which it remained relatively constant. There is some indication that the
mean size of fish caught increased between 1995 and 2001.
This trend in the mean size of all species is mirrored by the mean size of
C. citharus . This is not surprising considering the high yield of the species just
after lake impoundment and the fact that recent sampling showed that the majority
of fish species were caught at the same size. The mean size of C. citharus has
remained constant for some time, being some 15% of the mean size caught between 1969 and 1970 (Fig. 20).
2,000 CD
m 1,500 U G) N 1,000 N
c 500
0 1970 1975
x- Citharinidae -*- All species combined
k** X\\ X- x xýX XX
1980 1.1996 2001
Fig. 20. Mean size (g) of Citharinidae (Citharinus and Distichodus sp. ) and of all fish taxa combined estimated using data from the Lake Kainji catch assessment survey, 1970 to 2001. Mean sizes between 1970 and 1976 have been recalculated using historic catch assessment survey records.
During the year 2000, L. niloticus and Heterobranchus were the two largest sized species caught (Fig. 21). The mean size of the remaining 18 fish taxa sampled varied between 45 and 570 g.
11
Page: 207

Chapter 6
2,000 m 4-
1,000 co a) m
5Q ý5Q ý`ýaao 5Q ýyQ ci reýa y5Q c y5Q ýyQ `y5Q C3 '`Soy 5Q' yQ `aa
ý tý\p GrJ Oýý (Jý
J pÖJ ýa(ýa
O PQ`s ýpIZPýý aý `pes 'p0 . ̀ýaQ -P
Ac' . Cý
ý
pý?
&
goy ýa° oc API, G ra Ada ýc c1' ýr '
`ý `ecoo
Oar pý5 `
ccm G, e
G. oý ýoF y4yý G, pcf' mat ýe
cýocý
QJ, ýeýtia
O
Fig. 21. Mean weight (g) of the main commercial fish taxa caught in the Lake Kainji fishery during 2000, estimated using data from the catch assessment survey.
ECONOMIC VALUE OF FISH YIELD BY GEAR TYPE
No information was available on the value of the landed catch prior to 1995. The
annual value of fish caught in 2000 declined by 40% from its peak of US$ 7.8 million in 1996 (Fig. 22). This equates to a fall in the average annual revenue for each entrepreneur from US $ 1900 to US $ 1000 (expressed as constant prices, referenced to 2000).
The decline was partly caused by a reduction in the market price of landed fish
since 1997 and the ban of the high valued beach seine fishery.
Page: 208
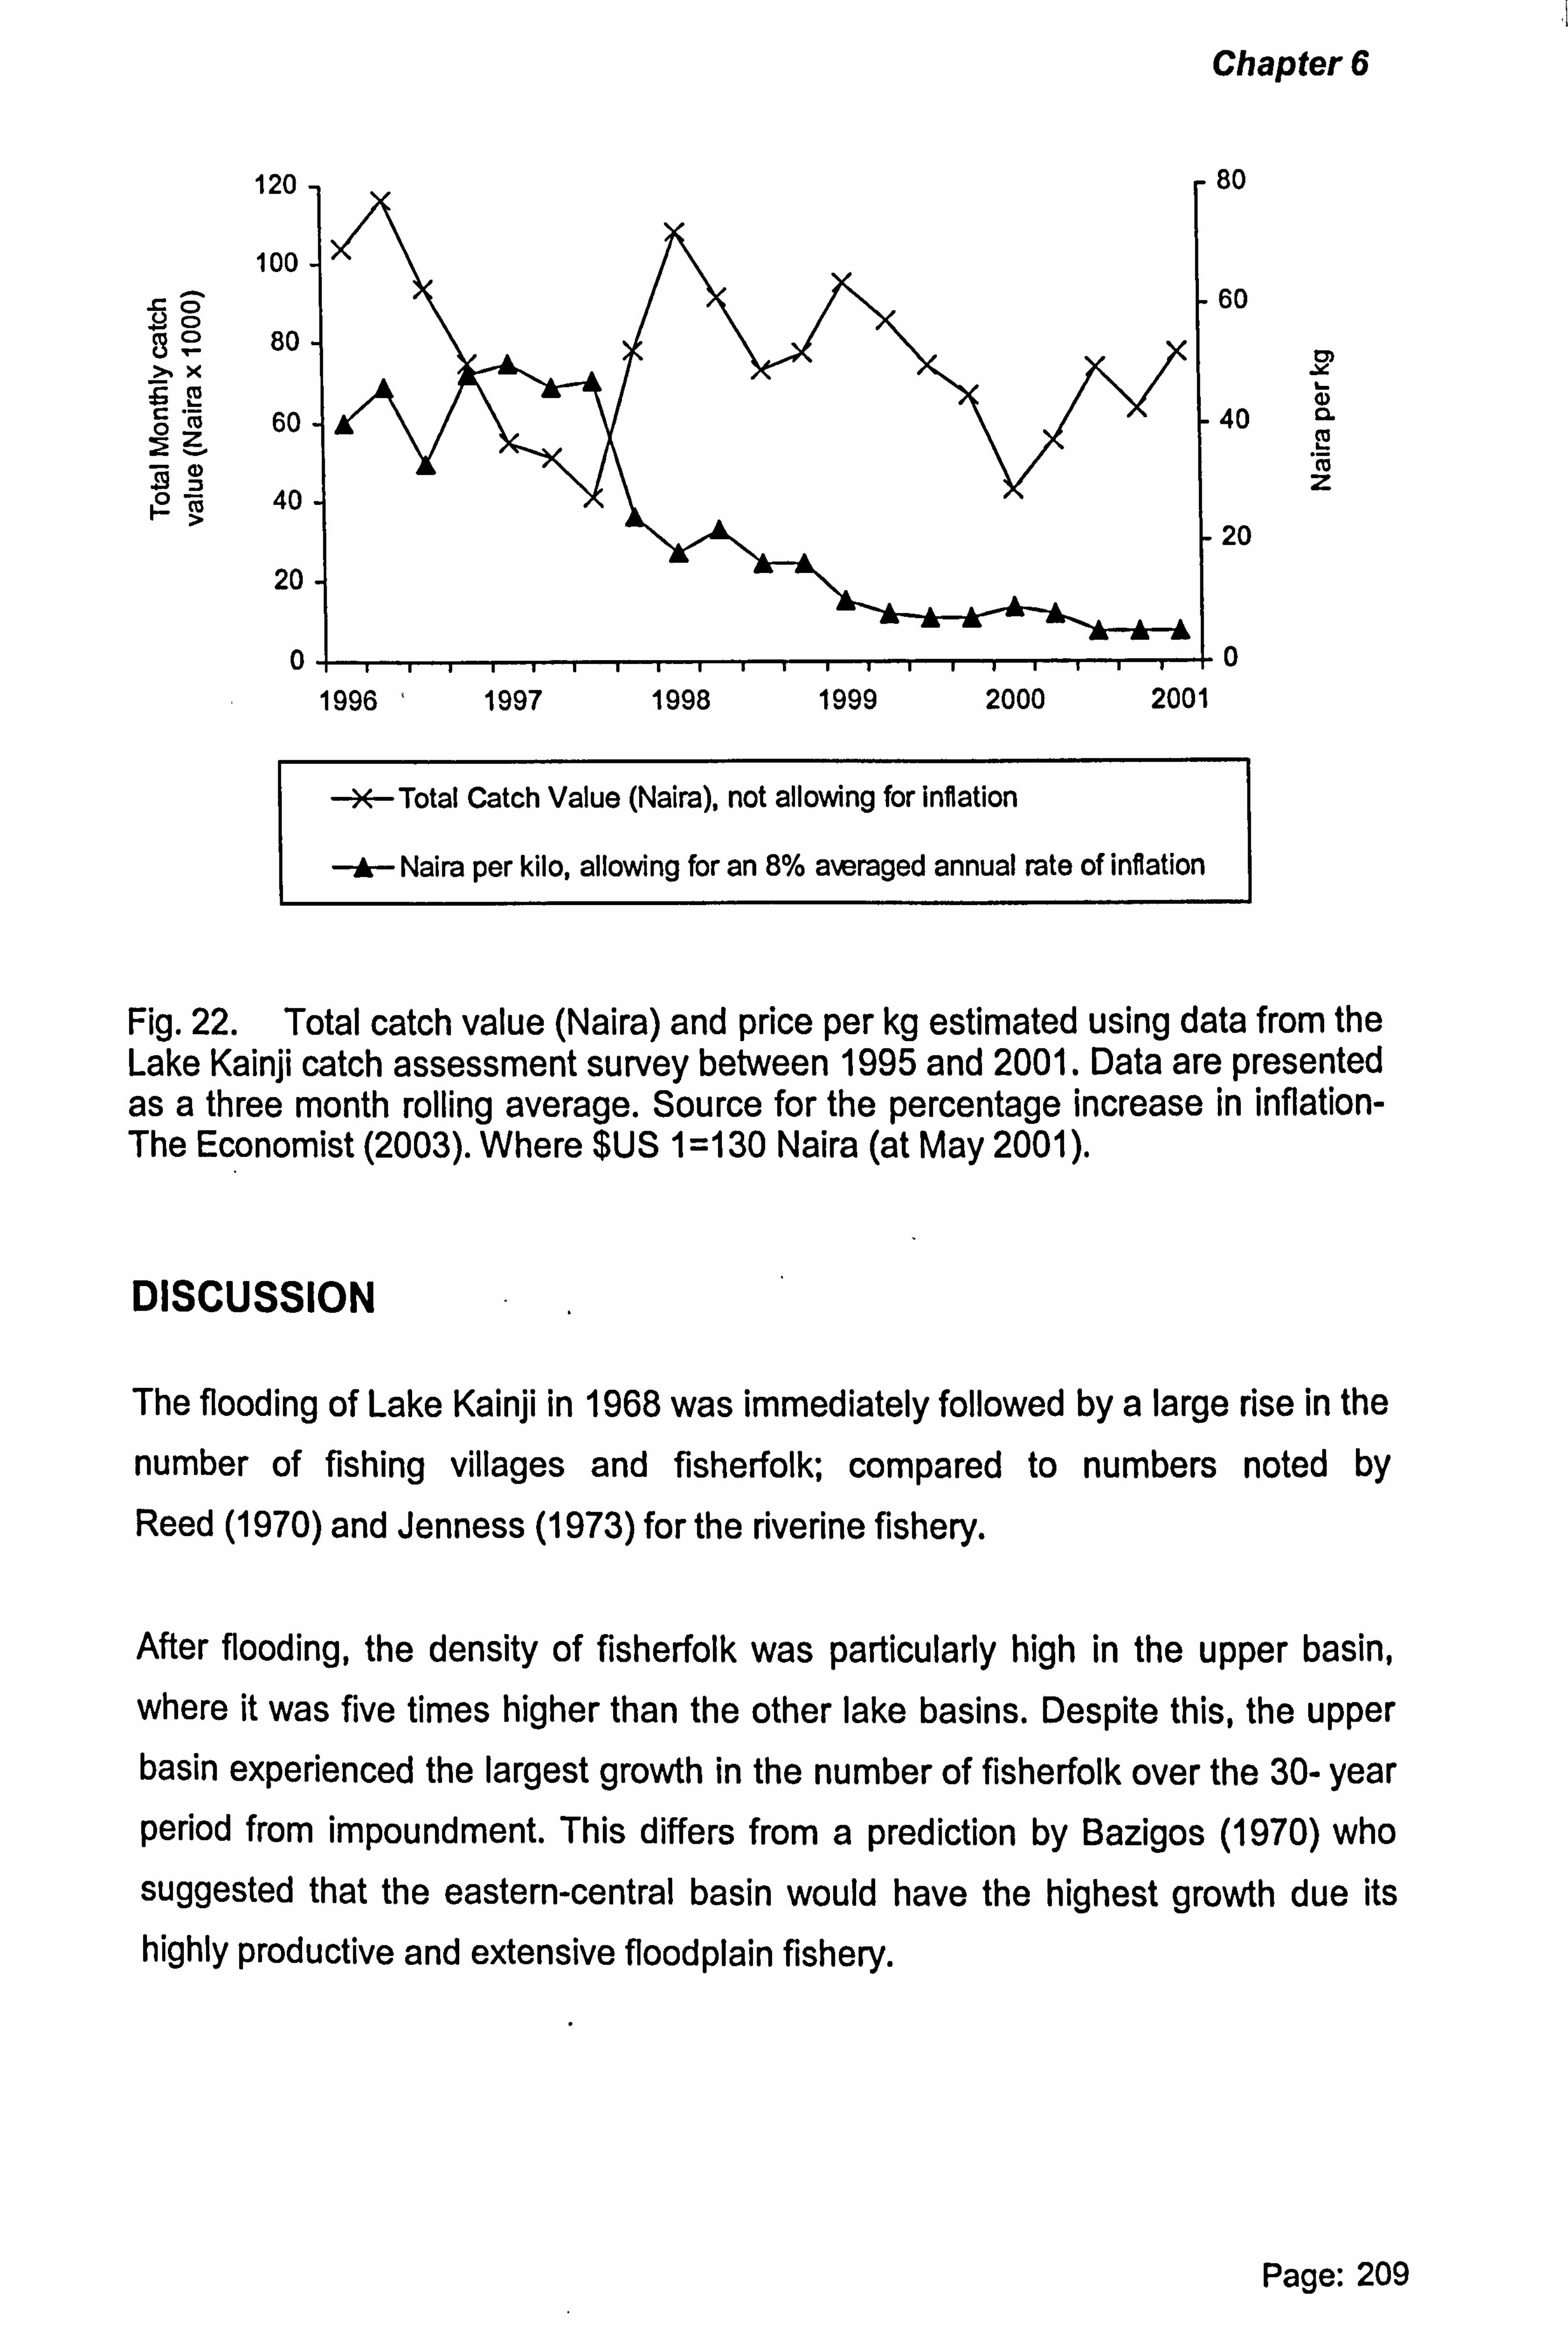
120
100
80 X
Z 60
I- >a) 40
20-
0 1996 1997 1998 1999 2000 2001
Chapter 6
80
60
tm I- 4)
40 °L T CD z
20
0
X Total Catch Value (Naira), not allowing for inflation
A Naira per kilo, allowing for an 8% averaged annual rate of inflation
Fig. 22. Total catch value (Naira) and price per kg estimated using data from the Lake Kainji catch assessment survey between 1995 and 2001. Data are presented as a three month rolling average. Source for the percentage increase in inflation- The Economist (2003). Where $US 1=130 Naira (at May 2001).
DISCUSSION
The flooding of Lake Kainji in 1968 was immediately followed by a large rise in the
number of fishing villages and fisherfolk; compared to numbers noted by
Reed (1970) and Jenness (1973) for the riverine fishery.
After flooding, the density of fisherfolk was particularly high in the upper basin,
where it was five times higher than the other lake basins. Despite this, the upper basin experienced the largest growth in the number of fisherfolk over the 30- year period from impoundment. This differs from a prediction by Bazigos (1970) who suggested that the eastern-central basin would have the highest growth due its highly productive and extensive floodplain fishery.
Page: 209
Chapter 6
A possible explanation is that, within the upper basin, the majority of fisherfolk
were part time fishers. They were therefore attracted to potential settlement areas by factors other than the fishery, such as road access, proximity of markets etc. More opportunities also existed in the upper basin for fisherfolk to diversify their
income through activities other than fishing (e. g. onion farming and river transport)
than elsewhere (Ayeni & Mdaihli, 1996).
A rise in the number of fisherfolk was also noted in Foge Island within the central basin. The area had wide shallow beaches which were cleared during pre- impoundment enabling the development of a highly profitable beach seine fishery
(du Feu & Omorinkoba, 1994).
The number of fisherwomen was difficult to determine. The strong influence of Islam in the lake area limited contact by data collectors and deterred villagers from
disclosing the full number of women who were fishing (Alamu & Mdaihli, 1995;
Rettberg et al., 1995). The problem was reduced by using female extension
workers, but the cited estimates are still considered to reflect only the minimum number.
The fisherfolk stated that the riverine dugout canoes were unsuited to the more
open water and rougher lake conditions (Jenness, 1970 & Reed, 1970). At the
time of impoundment, the supply of dugout canoes from the area was limited since most suitable trees had already been felled (Nordland, 1973a). As a solution, the KLRP designed planked canoes (Nordland, 1973a&b). In 2000, all fishing canoes used on the lake were based on this design (see du Feu, 2003). The canoes were manufactured by local carpenters and of shallow draft to enable access into
shallow creeks; yet were also stable, robust and relatively inexpensive. Ayeni et al. (1998) stated that the wide planks required for their construction were readily available in the Lake Kainji area.
Page: 210
Chapter 6
Jenness (1970 & 1973) and Reed (1970) described a large array of fishing gears
in the river fishery prior to impoundment. The number of differing gears reduced
following the transition from river to lake fishery. Gear types that were used both in
the river and lake fishery included the cast net, foul hooking or baited longline,
baited trap and fencing off areas of the floodplain.
Several fishing methods used in the river fishery were adapted for use in the lake.
These included the gill net that was made longer (from an average of 2 to 30 m)
and the drift net that was made wider (from 2 to 5 m). The hand seine that was
fished from the riverbank or within pools was no longer used in the lake fishery.
Various types of single set or drift hooks, chamber traps, plunge baskets, lift and
scoop nets, fishing spears and herbal poisons also became redundant.
The main fishing gear used after impoundment were gill nets with large mesh
sizes. The diversity of mesh sizes then increased, with smaller meshed nets
becoming more common. It is considered that this was partly due to the greater
local knowledge of the fisherfolk that enabled them to target most species at most
sizes during the different seasons. Many of the nets used were illegal. For
example, in the year 2000 some 40% of gill nets fished had a mesh sizes smaller
than 76 mm stipulated by the State Fisheries Edicts. Examples of the
diversification of gear types in other man-made lakes exist and have been noted by Postma & van der Knapp (1999) for neighbouring Lake Lagdo in Cameroon and for Tungabhadra Reservoir in India (Singit et al., 1988).
Johnson (1974) reported that small meshes of 25 mm were frequently used in the
gill net and cast net fisheries in Lake Kainji as far back as 1974. In 2000, some 10% of the gill nets used had a mesh size of 25 mm. These were made of fine
nylon twine. The high purchase cost of nylon nets was offset by their efficiency in
catching fish and between 1993 and 2000 they became increasingly popular. The development is of concern since they caught large numbers of undersized fish.
Page: 211
Chapter 6
Small meshed nylon nets were the main gear used by fisherwomen in Lake Kainji.
Fisherwomen owned only 6.5% of the total number of gill nets, however, they
possessed an estimated 60% of all nylon nets. The effect that any proposed
enforcement concerning minimum gill net mesh size has on the fisherwomen's
economic well-being must be carefully considered prior to implementation.
Of interest, is that fisherfolk preferred using small meshed nets, despite them having lower long-term catch rates than nets of larger mesh size. The reason
appeared to be that smaller meshed nets caught a sufficient quantity of fish every day to feed their family. This was unlike larger meshed nets, which despite
catching larger sized fish, often had days with no catch (du Feu & Abiodun, 1999). An added advantage was that smaller sized fish were easier to process by fish
smoking (Eyo & Mdaihli, 1997).
Prior to the impoundment of Lake Kainji, Banks et al. (1965) estimated the annual yield from the river fishery to be between 47 and 95 kg ha''. Daget (1961) made the first potential yield estimate for the Lake Kainji fishery. He extrapolated fish
catches from lakes further upstream of the Lake Kainji area to derive an estimate of between 6100 and 12,200 t yr' (48 to 95 kg ha'). Henderson (1971) used the
morpho edaphic index (MEI) and estimated a lower annual production of 4100 t yr' (32 kg ha''). Lelek & EI-Zarka (1973) calculated a higher lake yield of 8000 t (62 kg ha') based on estimates of the mean catch per canoe and total effort.
Yield estimates by Bazigos (1972) indicate that the yield from the Lake Kainji fishery exceeded these levels and increased to 28,639 t (225 kg ha") one year after impoundment. Total catch then quickly declined to just 20% of this level (Ekwemalor, 1977). Interestingly, the lower fish yield (40 kg ha"' yr-1) is only slightly below the estimation by Banks et al. (1965) for the river fishery and is approximately equal to the estimates from the MEI.
Page: 212
Chapter 6
Bazigos (1972) estimated the total lake yield using projections from the actual 1970 and 1976 catch assessment surveys results and a relationship between the
catch made by canoes in the fishery and that made during an experimental
sampling program using graded fleets of gill nets. The relationship was found to
hold for the early years when the fishery was gill net based, however, between
1972 and 1976 no correlation existed between the two different catches. This was
perhaps due to the fishery becoming more diversified and no longer based largely
on a gill net fishery. Yield estimates for the fishery were therefore recalculated for
1971 to 1975 using the estimates of CpUE discovered in storage. Annual yields for
the two sets of estimates are different, the revised estimate suggests that the fall
after the post impoundment boom in 1971 was less dramatic than previously
recorded.
Surprisingly, 28 years after impoundment the annual lake yield increased to a higher level than that recorded during the first boom period (estimated at 300 compared to 225 kg ha").
Adeniji et al. (2001) investigated whether the primary productivity of the lake could support the recent high fish yield. Estimates made between 1994 and 1996
suggested that productivity levels had not changed since previous measurements made in 1971 by Karlman (1973). Adeniji et al., concluded that the lake could still theoretically support an annual fish production of 236 kg ha" yr'.
The high yield estimated for Lake Kainji is not atypical for the region. Yields of 390 kg ha" yr' have been estimated for natural lakes in neighbouring Benin (Adite & Van Thielen, 1995), whilst yields of Lake Volta, Ghana were estimated at around 220 kg ha -1 yr' (de Graaf & Ofori-Danson, 1997). Those of Lake Lagdo, Cameroon peaked at 340 kg ha"' y(1 (Postma & van der Knapp, 1999).
Page: 213
Chapter 6
The productivity of the water for Lake Kainji is increased by a high exchange of
water, one of the highest of any tropical reservoir. High flow rates bring in nutrients
and help the mixing of the water column, so reducing the negative impact of thermoclines (Karlman, 1973). The lake's productivity is also enhanced by a high
annual drawdown of water of some 10 m. This exposes and floods large areas of fertile floodplains and adds to water fertility (Bidwell, 1976). The drawdown area
remains flooded during the breeding season thereby increasing growth and
survival of the fingerlings. This in turn boosts the number of recruits into the fishery
(Omorinkoba & du Feu, 1994).
A diverse fauna of fish species caught also supported the high yield. Many of these have a high fecundity and are thus able to supply large pulses of recruitment in the fishery. Du Feu & Abiodun (1998) have speculated that the high number of gears, that are selective for small-sized fish and the concentration of fishing effort near the littoral zone, has left the breeding population within the deeper central lake portions largely unfished. These adult fish are thus able to supply the large
numbers of fingerlings. Large numbers of recruits are needed for the Lake Kainji fishery, which is based on the capture of small-sized fish.
There are only a few examples of such increases occurring elsewhere. These include Lake Volta (de Graaf & Ofori-Danson, 1997) and a small reservoir in Laos,
where annual fish yield increased from 40 to 185 kg ha" (Mattson et a/., 2001). It is
suggested that one reason for the lack of examples may be a general lack of thorough catch assessment surveys in tropical reservoir fisheries that possibly leaves such increases unrecorded.
The findings in Lake Kainji support the notion that the higher yield noted from 1995
compared to pre-1978 was partly due to the diversification of the fishery. The fishery has developed from one using mainly large meshed gill nets targeting around four species to a fishery using a large array of gear types and gear configurations (mainly differing mesh sizes). Coupled with a developed local knowledge, the fisherfolk were therefore able to target a much wider array of fish species and fish sizes than was possible just after impoundment.
Page: 214
Chapter 6
The main contributor to the increased yield was the high yielding beach seine
fishery that targeted the endemic pelagic Clupeidae, which were unexploited during the time of the early catch assessment surveys. Beach seines accounted for some 53% (160 kg ha 1) of the total lake yield during the peak catch in 1996.
This suggests that endemic Clupeidae, which formerly inhabited the river, are able
to support a productive fishery. This is unlike other reservoir fisheries, such as
those in Lakes Kariba and Cahora Bassa, where a clupeid species from a natural lake is the target species of the fishery.
Between the 1970s and 1990s the number of canoes approximately doubled. It is
possible that the extra fishing effort also contributed to the rise in total yield. The
rise in canoe number was accompanied by an almost doubling of annual catch by
each canoe (excluding the beach seine fishery). Adeniji, Ovie & Mdaihli (2001)
investigated whether the rise in catch resulted from higher primary productivity of the water. Replications of experiments performed just after impoundment,
however, indicated that productivity had not significantly altered since lake creation.
It therefore appears that the rise in yield since the 1970s was caused principally by
the development of the beach seine fishery that was accompanied by higher levels
of fishing effort and a diversification in other fishing gears and use, which coupled with local knowledge, led to a greater array of fish species and sizes caught.
A high level of fishing effort existed on Lake Kainji. There was also an increasing
preference for small meshed gears, especially the beach seine that caught large
numbers of undersized bycatch. Du Feu & Abiodun (1998) suggested that the
situation resulted in growth and recruitment overfishing causing yields to decline from their peak in 1996. In just one year the estimated annual fish catch of around 300 kg ha" in 1996 declined to 225 kg ha"'. The reduced yield was mainly caused by a halving of the beach seine yield.
Page: 215
Chapter 6
A limited time series of data exists for the beach seine fishery. The mean weight of
clupeids caught by each beach seine haul declined from 6.6 to 4.8 kg between
1996 and 1998. Such variations in CpUE may be caused by environmental impacts on recruitment, as the beach seine targets the first-year cohort fish. The
fall does, however, support findings by Omorinkoba et al. (1997) who estimated that the 1996 catch of clupeids from the beach seine fishery was 34% greater than
the maximum sustainable yield (MSY) of the Clupeidae. These findings are
supported by results from du Feu & Abiodun (1998) that showed that in 1998 the
total lake fishery was being fished at a level some 40% higher than the MSY.
The decline in total catch from the fishery, and therefore income of the fisherfolk,
resulted in a reduction in the number of fishing gears owned by individual
entrepreneurs since 1993. The decline may have been accentuated by the decrease in the fish market price that occurred since early 1998. Balogun (1985)
reported that a similar situation occurred in 1984 and caused many fishermen to leave the lake area at that time.
The gill net and longline fisheries had the lowest daily catch revenue. Fisherfolk
also reported that the theft of these gears, which are left fishing overnight, was an increasing problem. This suggests that ownership levels of these gears may decline further in future. In light of the high level of fishing effort recorded in 1995,
a reduction in ownership and consequently fishing pressure could have been beneficial in reducing further declines in lake yield.
Management intervention was considered justified. The KLFPP developed a co- management based approach and in 1999 coordinated a ban on fishing with beach seines. Du Feu & Abiodun (1998) predicted that following the ban of beach seines the total catch revenue for the lake fishery would rise by 10%, as the lower priced clupeids were replaced by higher priced species that were previously caught as bycatch. Future monitoring of the fishery will indicate whether the expected output has been achieved.
Page: 216
Chapter 6
REFERENCES
Adeniji, H. A., Ovie, Si and Mdaihli, M. (2001). An evaluation of the pelagic primary
productivity and potential fish yield of Kainji Lake, Nigeria. Kainji Lake
Fisheries Promotion Project Technical Report Series. No. 19. GTZ,
Eschbom, Germany, ISBN 978 037 018 8.33pp.
Adite. A. and van Thielen, R. (1995). Ecology and fish catch in natural lakes of Benin,
West Africa. Environmental Biology of Fishes. 43: 381-391.
Aiyedun, B. A. and Adegboye, J. D. (1967). River fisheries surveys in northern Nigeria. The Nigerian Field, 32: 160-170.
Alamu, S. O. and Mdaihli, M. (1995). Socio-economic survey of women in artisanal fisheries in the Kainji Lake area: a case study of Wawu. National Institute for
Fresh water Fisheries Research (NIFFR), Annual Report, 1994.
ISSN 03319296: 195-203.
Ayeni, J. S. O. and Mdaihli, M. (1996). Identification of non fishing income
opportunities around Kainji Lake. Kainji Lake Fisheries Promotion Project
Technical Report Series. No. 4. GTZ Eschbom, Germany. ISBN 978 037
003 X. 69pp.
Ayeni, J. S. O., Yakubu, F. and Mdaihli, M. (1998). Promotion of woodlot establishment around Kainji Lake: a proposal. An internal report of the Kainji Lake Fisheries Promotion Project. GTZ, Eschborn, Germany. 64pp.
Balogun, J. K. (1985). The fisheries of Lake Kainji, past, present and future. The Nigerian Field, 50: 29-34.
Banks, J. W., Holden, M. J. and McConnell, R. H. (1965). Fishery report. In: The First Report of the Kainji Biological Research Team. Liverpool. E. White ed.: 21-42.
Page: 217
Chapter 6
Bazigos, G. P. (1970). Yield indices in inland fisheries with special reference to Volta Lake. FAO Volta Lake Research and Development Project, Statistical
Studies. FAO/SF/GHA/10/St. S. /3. FAO, Rome. 25pp.
Bazigos, G. P. (1971). Frame survey at Kainji Lake. Statistical Studies No. 1. (FI: SF/MIR 24/). Rome: FAQ. 50pp.
Bazigos, G. P. (1972). The yield pattern at Kainji Lake (Nigeria). Statistical Studies.
No. 2. UNDP/SF/NIR. 24. Rome, FAO. 25pp.
Bazigos, G. P. (1974). Recent trends in the yield pattern of Kainji Lake. Statistical Studies. No. 3. UNDP/SF/NIR. 24. Rome, FAO. l4pp.
Bidwell, A. (1976). The effect of water level fluctuations on the biology of Lake Kainji,
Nigeria. The Nigerian Field, 41, (4): 156-165.
Blake, B. F. (1977). Lake Kainji, Nigeria. A summary of the changes within the fish
population since impoundment of the Niger in 1968. Hydrobiologia. 53. (2):
131-137.
Daget, J. (1961). Rapport sur de projet de barrage de Kainji pecheries. Journal of Hydrobiology, 61, (4): 69-76.
De Graaf, G. J. and Ofori-Danson, P. K. (1997). Catch and fish stock assessment in
stratum VII of Lake Volta. Integrated Development of Artisanal Fisheries (GHZ/93/008). IDAF/Technical Report/97/1. FAO, Rome. 96pp.
du Feu, T. A. (1993). Frame survey, Kainji Lake Nigeria. An internal report of the Kainji Lake Fisheries Promotion Project. GTZ, Eschbom, Germany. 27pp.
du Feu, T. A. (2003). Co-management in reservoir fisheries: Lake Kainji, Nigeria-
a case study. PhD. Thesis submitted to the University of Hull, UK. Chapter 8: 262-309.
Page: 218

Chapter 6
du Feu, T. A. and Abayomi, O. S. (1997). Frame survey of Kainji Lake, Northern Nigeria, 1996. Kainji Lake Fisheries Promotion Project Technical Report
Series. No. 7. ISBN 978 037 006 4. GTZ, Eschborn, Germany. 37pp.
du Feu, T. A. and Abiodun, J. A. (1998). Predictions of fish yields and the status of the
Kainji Lake fishery. Kainji Lake Fisheries Promotion Project Technical Report
Series. No. 17. ISBN 978 037 015 3. GTZ, Eschbom, Germany. 56pp.
du Feu, T. A. and Abiodun, J. A. (1999). Fisheries statistics of Kainji Lake, Northern
Nigeria. Nov. 1994- Dec. 1998. Kainji Lake Fisheries Promotion Project
Technical Report Series. No. 13. ISBN 978 037 012 9. GTZ, Eschbom,
Germany. 128pp.
du Feu, T. A. and Omorinkoba, W. S. O. (1994). Survey of beach seine fishermen,
Kainji Lake. National Institute for Fresh water Fisheries Research (NIFFR),
Annual Report. 1994. ISSN 0331 9296: 216-222.
Ekwemalor, A. I. (1975). Frame survey at Kainji Lake. (Tech. Rep. No. 1/1975): Kainji
Lake Research Institute. 33pp.
Ekwemalor, A. I. (1977). The catch assessment survey (CAS) of Kainji Lake, Nigeria.
MSc. Thesis submitted to the University of New-South Wales, Sydney, Australia. 49pp.
Ekwemalor, A. I. (1978). Frame survey at Kainji Lake, April 1978. Report submitted to
the Kainji Lake Research Institute. 41 pp. ,
EI-Zarka, E. L. (1973). Kainji Lake Nigeria. In: Man-made Lakes. Their Problems and Environmental Effects. (eds. W. C. Ackerman, G. F. White and E. B. Worthington). Geophysical Monographs Ser. 17: 197- 219.
Eyo, A. A. and Mdaihli. M. (1997). Post harvest losses in fisheries of Kainji Lake. Kainji Lake Fisheries Promotion Project Technical Report Series. No. 5. GTZ, Eschborn, Germany. ISBN 978 037 004 8.75pp.
Page: 219

Chapter 6
Henderson, H. F. (1971). Estimation of potential catch of fish from Kainji Lake based
on the general ecology of the lake. A report prepared for the Kainji Lake
Research Project. FAO, 1971.9pp.
Ibeun, M. O. (1995). A preliminary bibliography and analysis of Kainji Lake related
publications, 1961-1991. In: Current Status of the Fisheries and Fish Stocks
of the Four Largest African Reservoirs: Kainji, Kariba, Nasser-Nubia and
Volta. (eds. R. C. M. Crul, and F. C. Roest). CIFA Technical Paper. No. 30.
Rome, FAO: 25-40.
Imevbore, A. M. A. (1970). Some preliminary observations on the sex-ratios and
fecundity of the fish in the River Niger. In: Kainji Lake Studies, Vol-1,
Ecology. S. A. Visser ed. Published by NISSER, Ibadan: 87-103.
Imevbore, A. M. A. (1975). The chemistry of Lake Kainji waters August 1968-
September 1969. In: The Ecology of Lake Kainji, the Transition from River to
Lake. (eds. A. M. A. Imevbore and 0. S. Adegoke). Ile-Ife, Nigeria, University
of Ife Press: 82-102.
Ita, E. O. (1975). A short historical review of experimental gill-net sampling
programme and data processing methods in Kainji Lake between 1969 and
1975. Unpublished report to the Kainji Lake Research Institute.
Ita, E. O. (1993). Inland Fishery Resources of Nigeria. CIFA Occasional Paper.
No. 20. Rome, FAO: 46-47.
Jenness, J. (1970). Fishermen of the Kainji basin. Kainji Lake Research Project, New
Bussa, Nigeria. Working Paper, No. 2. FI/SF/NIR/24.98pp.
Jenness, J. (1973). Fishing and the fishermen of the Kainji Lake Basin. In: Kam ]-
a Man-Made Lakes, Kainji Lake Studies. Vol. 2, Socio-economic Conditions.
A. L. Mabogunje ed. Published by the Nigerian Institute of Social and Economic Research. Ibadan: 49-69.
Page: 220
Chapter 6
Johnson, R. P. (1974). Observations on tilapia in Kainji Lake, with emphasis on T. galilaeus. A report prepared for the Kainji Lake Research (man-made
lake) Project. WS/F2974. FAO, Rome. 28pp.
Karlman, S. E. (1973). Primary production in Kainji Lake. FAO Technical Report. No. 3. A report prepared for the Kainji Lake Research Project. 58pp.
Karlman, S. E. (1982). Annual flood regime as a regulatory mechanism for
phytoplankton production in Kainji Lake, Nigeria. Hydrobiologia, 86, (1-2):
93-97.
KLFPP (Nigerian-German Kainji Lake Fisheries Promotion Project). (1996). Situation Report. An internal report of the Kainji Lake Fisheries Promotion Project. GTZ, Eschbom, Germany. 13pp.
Lelek, A. and EI-Zarka, S. (1973). Ecological comparison of fish fauna of the Niger
River before and after the formation of Kainji Lake. Geophys. Monogr., 17: 655-660.
Mattson, N. S., Balavong, V., Nilsson, V., Phounsavath, S. and Hartmann, W. D.
(2001). Changes in fisheries yield and catch composition at the Nam Ngum Reservoir, Lao PDR. In: Reservoir and Culture Based Fisheries: Biology and Management. Proceedings of an international workshop held in Bangkok, Thailand, 15-18 Feb. 2000. S. S. De Silva ed. ACIAR Proceedings, No. 98. ISBN 0 642 45694 1: 48-55.
Motwani. M. P. (1970). Fishery investigations on the Niger and Benue Rivers in the
northern region and development of a programme of riverine fishery
management and training. UNDPIFAO Technical Report to the Government
of Nigeria. (T. A. 2771). FAO, Rome. 196pp.
Nordland, C. D. (1973a). The boat building programme, Kainji Lake Research Project Working Paper, No. 8. FI: DP/NIR/66/524/8.12pp.
Page: 221
Chapter 6
Nordland, C. D. (1973b). Instructions for building 18ft, 22ft, 22ft and 24ft planked
canoes. Kainji Lake Research Project Working Paper, No. 6.
FI: DP/N I R/66/524/6.10pp.
Omorinkoba, W. S. O. and du Feu, T. A. (1994). The identification of breeding grounds
of the commercially important fish species in Lake Kainji. National Institute
for Fresh water Fisheries Research (NIFFR), Annual Report. 1994.
ISSN 0331-9296: 48-53.
Omorinkoba, W. S. O., Seisay, M. D. B., du Feu, T. A and Mdaihli, M. (1997). The
resource appraisal survey of clupeids in Kainji Lake, Nigeria. Kainji Lake
Fisheries Promotion Project Technical Report Series. No. 10. GTZ,
Eschbom, Germany. ISBN 978 037 009 9.25pp.
Oyedipe, F. P. A. (1983). Adjustment to resettlement: A study of the resettled peoples in the Kainji Lake Basin. University Press Limited, Ibadan. ISBN 0 19
575811 0.167pp.
Postma, D. J. and van der Knapp, M. (1999). Developments in the fishery of Lagdo
Reservoir, Cameroon. In: Fish and Fisheries of Lakes and Reservoirs in
Southeast Asia and Africa. (eds. W. L. T. van Densen and M. J. Morris).
Westbury Publishing, Otley, UK. ISBN 1 84103 004 X: 311-325.
Reed, W. (1970). Fishery technology in the Kainji Lake area. In: Kainji Lake Studies, Vol. 1, Ecology. S. A. Visser ed. Published by NISSER, Ibadan: 99-104.
Rettberg, S., Alamu, S. O. and Mdaihli, M. (1995). Fisherwomen of Kainji Lake. National Institute for Fresh water Fisheries Research (NIFFR), Annual Report. 1994. ISSN 0331-9296: 190-194.
Page: 222

Chapter 6
Singit, G. S., Ramamohan, R. and Krishnamaraju, H. V. (1988). Post impoundment
changes and effects of conflicting uses on the fisheries of Tungabhadra
Reservoir, India. In: Reservoir Fishery Management and Development in
Asia. Proceedings of a Workshop held in Kathmandu, Nepal, 23-28 Nov.
1987. S. S. De Silva ed. Ottawa, Canada. The International Development
Research Centre (Canada), ISBN: 0 88936 515 6: 136-144.
The Economist. (2003). World in figures. 2003 edition. Published by the Economist.
Profile Books. UK. ISBN 1 86197 424 8: 236pp.
Turner, G. F. (1994). Lake Kainji, Nigeria fisheries statistics and stock assessment. An internal report of the Kainji Lake Fisheries Promotion Project. GTZ,
Eschbom, Germany. 40pp.
Turner, J. L. (1971). The fish population of the newly impounded Kainji Lake in
Nigeria. Journal of West African Science Association. 16. (1): 49-58.
Page: 223
Chapter 6
Appendix 1. The frame and catch assessment surveys (CAS) undertaken and number of catch records that were sampled for the Lake Kainji fishery, Nigeria between 1970 and 2000. A break in data collection occurred between 1978 and 1993.
Frame Boat- Number of Number of catch records** survey based catch records GN DN BS CN LL TR
CAS analysed* 1970 Yes Oct, 1970 - 304 1971 June1971 838 1972 385 1973 235 1974 382 1975 Yes Dec. 1975 - 55 1976 Yes May 1976 170 1977 102 1978 1993 Yes 1994 Yes
1995 Yes 2,823 678 1,390 1,659 2,085 1,393 1996 Yes 2,787 640 836 737 1,219 796 1997 Yes 1,526 357 370 459 751 490 1998 Yes 1,844 323 251 484 855 430 1999 Yes 1,839 378 545 1,025 519 2000 Yes 1,572 365 .. 473 903 443
= No information available. * raw data forms that were found in storage and analysed for the present chapter. ** the number of fishing entrepreneurs sampled for fishing activity from 1995 to 1996=14,400 per year, 1997 to 2000=7,200 per year.
Appendix 2. Revised estimates of catch per net (kg night fishing'') and catch per canoe recorded from sampling using gill net trial and catch assessment survey of Lake Kainji, Nigeria from 1970 to 1976.
Gill net trial catch Catch per net fished Catch per canoe per net
(from reanalysed (from reanalysed data) data) Year 1970 2.61 13.85 29.42 1971 1.37 8.38 21.99 1972 1.17 5.99 11.29 1973 1.12 3.96 8.26 1974 0.8 3.00 5.67 1975 0.94 1.81 4.47 1976 0.79 3.52 6.07
Page: 224

Chapter 6
Appendix 3. Revised estimates of fish yield (tonne) using fishing activity (percentage of canoes fishing), catch per canoe (kg canoe 1 month-') from data that was re-analysed for the Lake Kainji fishery, 1969 to 1975. No re-estimation for 1969 was possible due to the lack of CpUE data.
Year
Catch per canoe
(kg canoe's month's from reanalysed data)
Activity of canoes
(%)
Number of canoes
Yield from reanalysed
data*
(tonne)
Yield from published data**
(tonne)
1969 68 1,800 17,000 17,000
1970 29.42 68 3,400 24,827 28,639
1971 21.99 69 3,500 19,384 11,037
1972 11.29 69 3,506 9,969 10,905
1973 8.26 70 3,500 7,387 7,320
1974 5.67 70 3,400 4,926 6,048
1975 4.47 71 3,502 4,057 6,000
1976 5.22 71 3,500 4,735 5,000
actual yield estimates cited in this chapter. '" previous estimates taken from Bazigos (1972) & Ekwemalor (1976).
Appendix 4. Numbers and types of fishing villages around Lake 'Kainji, Nigeria recorded during frame surveys, 1970 to 2000.
Village type Year Permanent village Fishing camp Total Reference
1970 25 233 258 Bazigos (1971)
1975 41 147 188 Ekwemalor (1975)
1978 46 171 217 Ekwemalor (1978) 1993 181 25 206 KLFPP (2001)
1994 220 38 258 1995 228 45 273
1996 245 41 286
1997 272 37 309
1998 271 34 305
1999 266 43 309 2000 276 38 314
Page: 225

Chapter 6
Appendix 5. Total, mean number and number per km2 lake area of fisherfolk, canoes, engines and fishing gear types for the Lake Kainji fishery, Nigeria recorded during frame surveys, 1970 to 2000. Ent: fishing entrepreneur (owner of the fishing gears), Ass: fishing assistants, Can: fishing canoes, Eng: outboard engines, GN: gill net bundles, DN: drift nets, BS: beach seines, CN: cast nets, LL: longlines, TR: fishing traps. The number of entrepreneurs and assistants include both fishermen and fisherwomen. One gill net bundle is approximately 46 meters of mounted gill net. One longline represents 100 hooks (1 packet).
Year Ent Ass Can Eng GN DN BS CN LL TR
1970 2,780 3,540 3,420 .. .. .. .. .. .. .. 1975 3,500 6,680 3,440 .. .. .. .. .. .. .. 1978 3,080 1,780 3,330 .. .. .. .. .. .. .. 1993 4,285 11,630 8,260 1,130 22,390 1,040 560 4,890 12,940 27,180
1994 3,915 9,440 7,360 1,130 19,590 940 620 5,080 12,550 32,330
1995 4,940 12,220 8,760 1,310 17,680 1,580 810 5,760 7,760 38,820
1996 5,400 12,450 9,280 1,200 18,660 1,560 750 5,550 7,390 36,980
1997 5,820 7,130 7,610 1,000 12,150 1,000 580 3,660 8,000 32,690
1998 5,580 6,140 7,130 590 10,160 970 490 2,740 3,450 23,650
1999 5,200 4,300 6,200 540 8,700 1,000 120* 2,070 5,360 22,560
2000 4,500 3,010 5,410 400 6,980 1,640 910 5,000 19,110
Mean number owned by each fishing entrepreneur 1993 1.0 2.7 1.9 0.3 5.2 0.2 0.1 1.1 3.0 6.3
2000 1.0 0.7 1.2 0.1 1.6 0.4 .... .... Mean numbers per km2 lake area
1993 3.3 9.1 6.5 0.9 17.5 0.8 0.4 3.8 10.1 21.2
2000 3.5 2.4 4.2 0.3 5.5 1.3 .... ....
.. = No information available. Numbers of fisherfolk and gears have been rounded to nearest 10 units.
* Theoretical number remaining after surrender and confiscation following the ban on fishing with BS. Reference: figures between 1969 and 1978 (Ita, 1993), figures between 1993 and 2000 (KLFPP, 2001).
Page: 226

Chapter 6
Appendix 6. Annual estimates of total fish yield (tonne) and yield by gear type and by unit area (kg hä-1 yr) for the Lake Kainji fishery estimated using the data from the catch assessment survey, 1969 to 2000. Estimates by gear type before 1995
are not available as the catch assessment survey used a boat-based sampling approach. Yield per area is given for the lake high water level (1270 km2).
Year GN Yield (tonne) by gear type
DN BS CN LL TR
Total yield tonne kg ha"yr1
1969 .. .. .. .. .. .. 17,000 134
1970 .. .. .. .. .. .. 28,640 225
1971 .. .. .. .. .. .. 19,380 87
1972 .. .. .. .. .. .. 10,900 86
1973 .. .. .. .. .. .. 7,390 58
1974 .. .. .. .. .. .. 4,930 48
1975 .. .. .. .. .. .. 4,060 47
1976 .. .. .. .. .. .. 4,740 39
1978 ., .. ,. .. 4,500 35
1995 5,300 3,830 15,210 4,070 2,450 1,620 32,470 256
1996 7,400 2,210 20,330 3,320 1,900 3,090 38,250 301
1997 7,360 1,650 11,330 3,490 1,420 3,500 28,750 226
1998 7,200 3,090 9,020 2,380 3,150 4,020 28,850 227
1999 6,890 2,940 2,560 1,410 1,850 16,800 132
2000 4,240 3,580 2,910 1,620 1,020 13,380 105
.. = No information available. Yield has been rounded to the nearest 10 tonnes. Reference: figures between 1969 and 1978 (Ita, 1993), figures 1993 to 2000 (KLFPP, 2001).
Appendix 7. Annual estimates of total catch value (Naira) and the catch value by gear type for the Lake Kainji fishery estimated using data from the catch assessment survey, 1995 to 2000. Catch value expressed in units of 1000 Naira (where $US 1=130 Naira; at May 2001).
Year GN DN
Gear type
BS CN LL TR Total
1995 163,900 108,600 264,200 114,700 87,800 48,200 787,400
1996 294,300 100,500 307,700 120,300 91,300 98,000 1,012,100
1997 290,400 70,000 196,600 111,800 73,700 109,200 851,700
1998 284,400 113,900 159,300 74,000 160,900 121,600 914,100
1999 264,000 81,200 .. 61,700 58,000 39,900 504,800
2000 171,600 179,600 100,300 97,600 34,300 583,400
.. = No information available. Catch values have been rounded to nearest 100 Naira.
Page: 227

Chapter 6
Appendix 8. Mean annual yield (tonne), percent contribution of the total yield and mean weight (g) estimated for each sampled fish taxa between the period 1996 to 1999 and the year 2000 for the Lake Kainji fishery.
1996-1999 Mean annual 2000
yield Annual yield
mean fish
tonne % tonne % weight (g)
Clupeidae** 12,370 37 .. .. .. Citharinus sp. 3,090 9 2,040 15 145
Tilapiines 3,010 9 1,780 13 85
Hemisynodontis membranaceus 2,430 7 1,570 12 210
Chrysichthys sp. 2,130 6 740 6 60
Labeo sp. 1,250 4 800 6 85
Other Mochokidae 1,220 4 580 4 45
Bagrus sp. 1,160 3 1,140 8 570
Others*** 1,110 3 1,170 9 200
Lates niloticus 1,100 3 1,120 8 1,815
Alestes & Brycinus sp. 790 2 360 3 65
Auchendglanis sp. 710 2 300 2 140
Clarias sp. 690 2 400 3 200
Distichodus sp. 620 2 470 4 220
Hydrocynus sp. 560 2 320 2 360
Heterobranchus sp. 360 1 300 2 1,500
Other Clariidae 280 1 150 1 415
Schilbeidae 130 0 60 0 60
Hemichromis sp. 70 0 40 0 135
Small Barbus sp. 50 0 50 0 150
Total 33,130 100 13,390 100 390
= No information available.
Percentage abundance and mean weights in 2000 were calculated excluding the beach seine fishery.
The average yield of Clupeidae is taken for the period 1996 to 1998.
"** Others include Mormyridae, Gymnarchidae, Osteoglossidae and Ophicephalidae. Yield has been rounded to nearest 10 tonnes, mean weight to nearest 5 g.
Page: 228
Chapter 7
Chapter 7
Data collection in a reservoir fishery (Lake Kainji,
Nigeria); the trade-off between cost and accuracy.
ABSTRACT
Accurate and long-term fisheries data are vital for managers to understand and manage
fisheries correctly. Only a few tropical reservoirs have such data. This is often due to the
difficulty and high cost, as well as the low priority given by governments to data collection
activities. Besides accuracy, practicality and cost are therefore also important
considerations when designing sustainable fishery data collection systems. I used a data
set from the reservoir fishery of Lake Kainji, Nigeria to assess how low cost, yet accurate, fisheries data collection can be achieved. Simulations of reducing the frequency of the
annual inventory of fishing manpower and gear (frame survey) and of lowering the
sampling effort of monthly fish catch and fishing activity (catch assessment survey) were
made. The effect of the reductions on daily catch, fishing activity and yield estimates was
then determined. Reducing the number of frame surveys is not recommended at present due to the variable numbers of gears each year that gave rise to errors in monthly yield
estimates. Reducing the number of sampling months or sampling stations for the catch
assessment survey produced large errors in fish catch and fishing activity estimates. The
errors were less when the number of sampling days was reduced from four to two per
month. The reduction in sampling days gave a cost saving of around 40% and a monthly
coverage of all fishing entrepreneurs for fishing activity of 0.5%. The effect of sampling from a large number of recording stations, but minimising the duration of sampling in
each, was assessed. A large number of sampling stations with low sampling effort in each is recommended for fisheries that have variable fishing patterns between areas. Using
villagers as enumerators may help lessen the cost of such high area coverage. Problems
of obtaining accurate and long-term fisheries data from tropical reservoirs are discussed.
Key words: catch and effort sampling; fisheries monitoring; frame survey; Lake Kainji; reservoir fishery; sampling strategies.
Page: 229
Chapter 7
INTRODUCTION
A clear understanding of the status and long-term trends of the fishery is the basis
of responsible fisheries management. The foundation of this is a data set that
accurately reflects the long-term trends of sociological, environmental and fishery
aspects. The need for fisheries data was highlighted during the International
Conference on Sustainable Contribution of Fisheries to Food Security in Kyoto,
1995 and has been widely recognised (Petr, 1985; Cowx, 1991; Mandima, 1996;
Sugunan, 1997; Verheust, 1998). Regions where the lack of quality fisheries data
has been noted for reservoir fisheries include Bangladesh (Rahman, 1988),
Indonesia (Goeltenboth & Kristyanto, 1994), South America (Gurgel & Fernando,
1994; Quirös, 1998), Malaysia, (Ali & Lee, 1995) and the Philippines
(Pomeroy eta/., 1997).
Entz (1984) stated that data collection systems tend to exist only in those
reservoirs benefiting from donor assisted projects. The concentration of projects
on larger water bodies (Sugunan, 1997) suggests that the lack of data collection
systems is particularly evident for smaller sized reservoirs.
There is therefore a general lack of long-term data on which management decisions can be correctly formulated. Despite this, governments and donor
agencies routinely expect managers to quickly implement management measures that are well designed and effective. Managers may opt for various approaches to
achieve this. Some may try to safeguard the resource and 'buy time' by immediately lowering levels of fishing effort. Alternatively, some managers may disregard the importance of data and try to increase levels of fish catch by raising fishing effort through the supply of fishing gears, new technologies or financial loans. Central authorities and the fisherfolk may be initially grateful for the extra fishing inputs. However, the problems of increasing fishing effort, on what maybe an already overcapacity fishery, will often only become apparent after the closure/ handover of the project.
Page: 230

Chapter 7
The lack of fisheries data therefore means that any responsible management initiatives must be often preceded by time consuming and costly data collection
activities. These required inputs frequently deter donor projects from funding
fishery assistance projects. Low funding levels of fisheries projects is, however,
also due to the sector's poor track record in managing fisheries caused by
managers implementing poorly identified regulations that were not based on
representative data.
Underlying problems of obtaining good quality fisheries data for reservoir fisheries include:
1. the high cost of fisheries surveys due to the practical difficulties of data
collection in villages around reservoirs that are often fragmented and dispersed (Entz, 1984; De Silva, 1988; Alimoso, 1991; Mandima, 1996; Rana et al., 1998). Du Feu (2003a) stated that there is a tendency for
reservoir fisheries to diversify as they get older, thereby increasing data
collection costs.
2. international and national funding agencies that frequently question whether the returns from the fishery justify the high cost of fisheries surveys (Orach-Meza, 1991).
3. the difficulty in making accurate assessments of the status and trends of reservoir fisheries. In particular:
a. a minimum of five year's data are required for use by surplus production models (Pauly, 1987).
b. reservoir fisheries are often characterised by highly variable flood
patterns, water drawdown, fishing manpower and levels of siltation and pollution. These will cause fluctuating yield patterns and make assessment of the fishery difficult.
Page: 231
Chapter 7
c. small-sized, highly fecund fish with high production to biomass ratios frequently form the main commercial species of reservoir fisheries.
This is likely to produce large fluctuations in recruitment/ abundance
and make assessment difficult (Lake Kariba; Mandima, 1996;
Lake Kainji; du Feu & Abiodun, 1999).
d. collection of a time series of data may be interrupted due to the
implementation of management measures (i. e. the ban of fishing
gear types).
4. poorly paid and motivated data collectors.
5. that data collection and fisheries enforcement are often carried out by the
same staff. This may lead to conflict and lack of cooperation from the fisherfolk (Lake Kariba: Mandima, 1996; Lake Kainji: du Feu & Abiodun, 1999).
6. the importance of the data collection exercise is seldom fully appreciated by
fisherfolk. This may also make them uncooperative.
Such data collection problems were evident around Lake Kainji, Nigeria (Fig. 1). Following the hand over of the monitoring system by the FAO/UNDP Lake Kainji Research Project (1968 to 1974) and prior to the start . of the Nigerian-German Kainji Lake Fisheries Promotion Project in 1993 only two frame surveys4 (Ekwemalor, 1975 & 1978) and six months of catch assessment survey' (Ekwemalor, 1977) had been undertaken by the national authorities.
I
4 Inventory of all fishing manpower and existing fishing gears. 5 Sampling of fish catch and fishing effort.
Page: 232
Chapter 7
Various methods have been tried to lower the costs of these surveys and optimise
their continuation. Costs were reduced in Lake Volta, Ghana by confining sampling
of fish catch and effort of fishing canoes to one portion of the lake (Bazigos, 1970).
The yield estimate from the smaller area was then raised to the total lake area to
produce lake-wide estimates. The disadvantage of this approach is that
differences in fishing practises are likely to exist between lake areas causing
errors when extrapolating yield data. In the Lake Kainji fishery, Bazigos (1972)
recognised that the catch per unit effort (CpUE; kg fish ner1 night fishing") from
experimental gill net trial fishing' and actual gill net catches by the fisherfolk were
related. He used this, with projected figures for fishing effort (total number of
canoes multiplied by frequency of fishing), to estimate total fish yield. The
disadvantage is that experimental gill net trial fishing is as costly to administer as
catch assessment surveys (Ita, 1998). Further, a relationship between gill net trial
catches and total lake yield did not exist beyond 1972 due to the increased
number of equal yielding fishing gear types in use (du Feu, 2003b).
In this chapter, I investigate alternative ways in which the cost of the frame and
catch assessment surveys can be reduced by optimising sampling strategies. A data set from the fisheries surveys conducted for the Lake Kainji fishery
between 1993 and 2000 has been used to assess how this might be achieved.
It is anticipated that the findings will help strengthen the chance of continuation of the Lake Kainji surveys, as well as to guide data collection activities within similar
reservoir fisheries. This may lead to increased understanding and therefore better
management of fisheries in tropical reservoirs.
6 Periodic sampling using fleets of multi meshed gill nets. 8 Where Yield by gear type = number of gear units x fishing activity() x catch per gear unit (kg)
Page: 233
Chapter 7
MATERIALS AND METHODS
METHODOLOGY OF FISHERIES SURVEYS
The typical information sought through fisheries data collection activities includes
the identification of the trends in the composition of the fishery (fisherfolk and gear
numbers), as well as, estimates of daily catch rates, fishing activity and total fish
yield. These estimates are usually determined through routine counts of fisherfolk
and fishing gears (frame survey) and sampling of fish catch and fishing effort (catch assessment survey).
Frame surveys of Lake Kainji between 1993 and 2000 involved an annual inventory of all the fishing villages, fishing entrepreneurs (owners of fishing
equipment), fishing assistants and fishing equipment owned (including the number
of canoes, engines and separate fishing gears). To avoid the double-counting of fisherfolk, the survey was undertaken by three teams, which separately
enumerated the three lake main lake stratums A to C (Fig. 1) for 18 days in
December each year (du Feu & Abayomi, 1997). The survey was undertaken at high water when movement of fisherfolk was minimal. All fisherfolk were coded so that 'not seen' or new fisherfolk could be verified with village officials, as well as, local villagers who were used as enumerators. Frame survey figures were verified by physical counts of gears existing in villages and a lake-wide count of fishing
canoes.
Catch assessment surveys undertaken between 1994 and 2000 sampled fish
catch and fishing activity from the six fishing gear types used in the fishery; gill
nets, drift nets, beach seines, cast nets, longlines and fishing traps. Two-stage
cluster sampling was used (Lohr, 1999). Analysis was performed on the pooled data from each gear type.
Page: 234
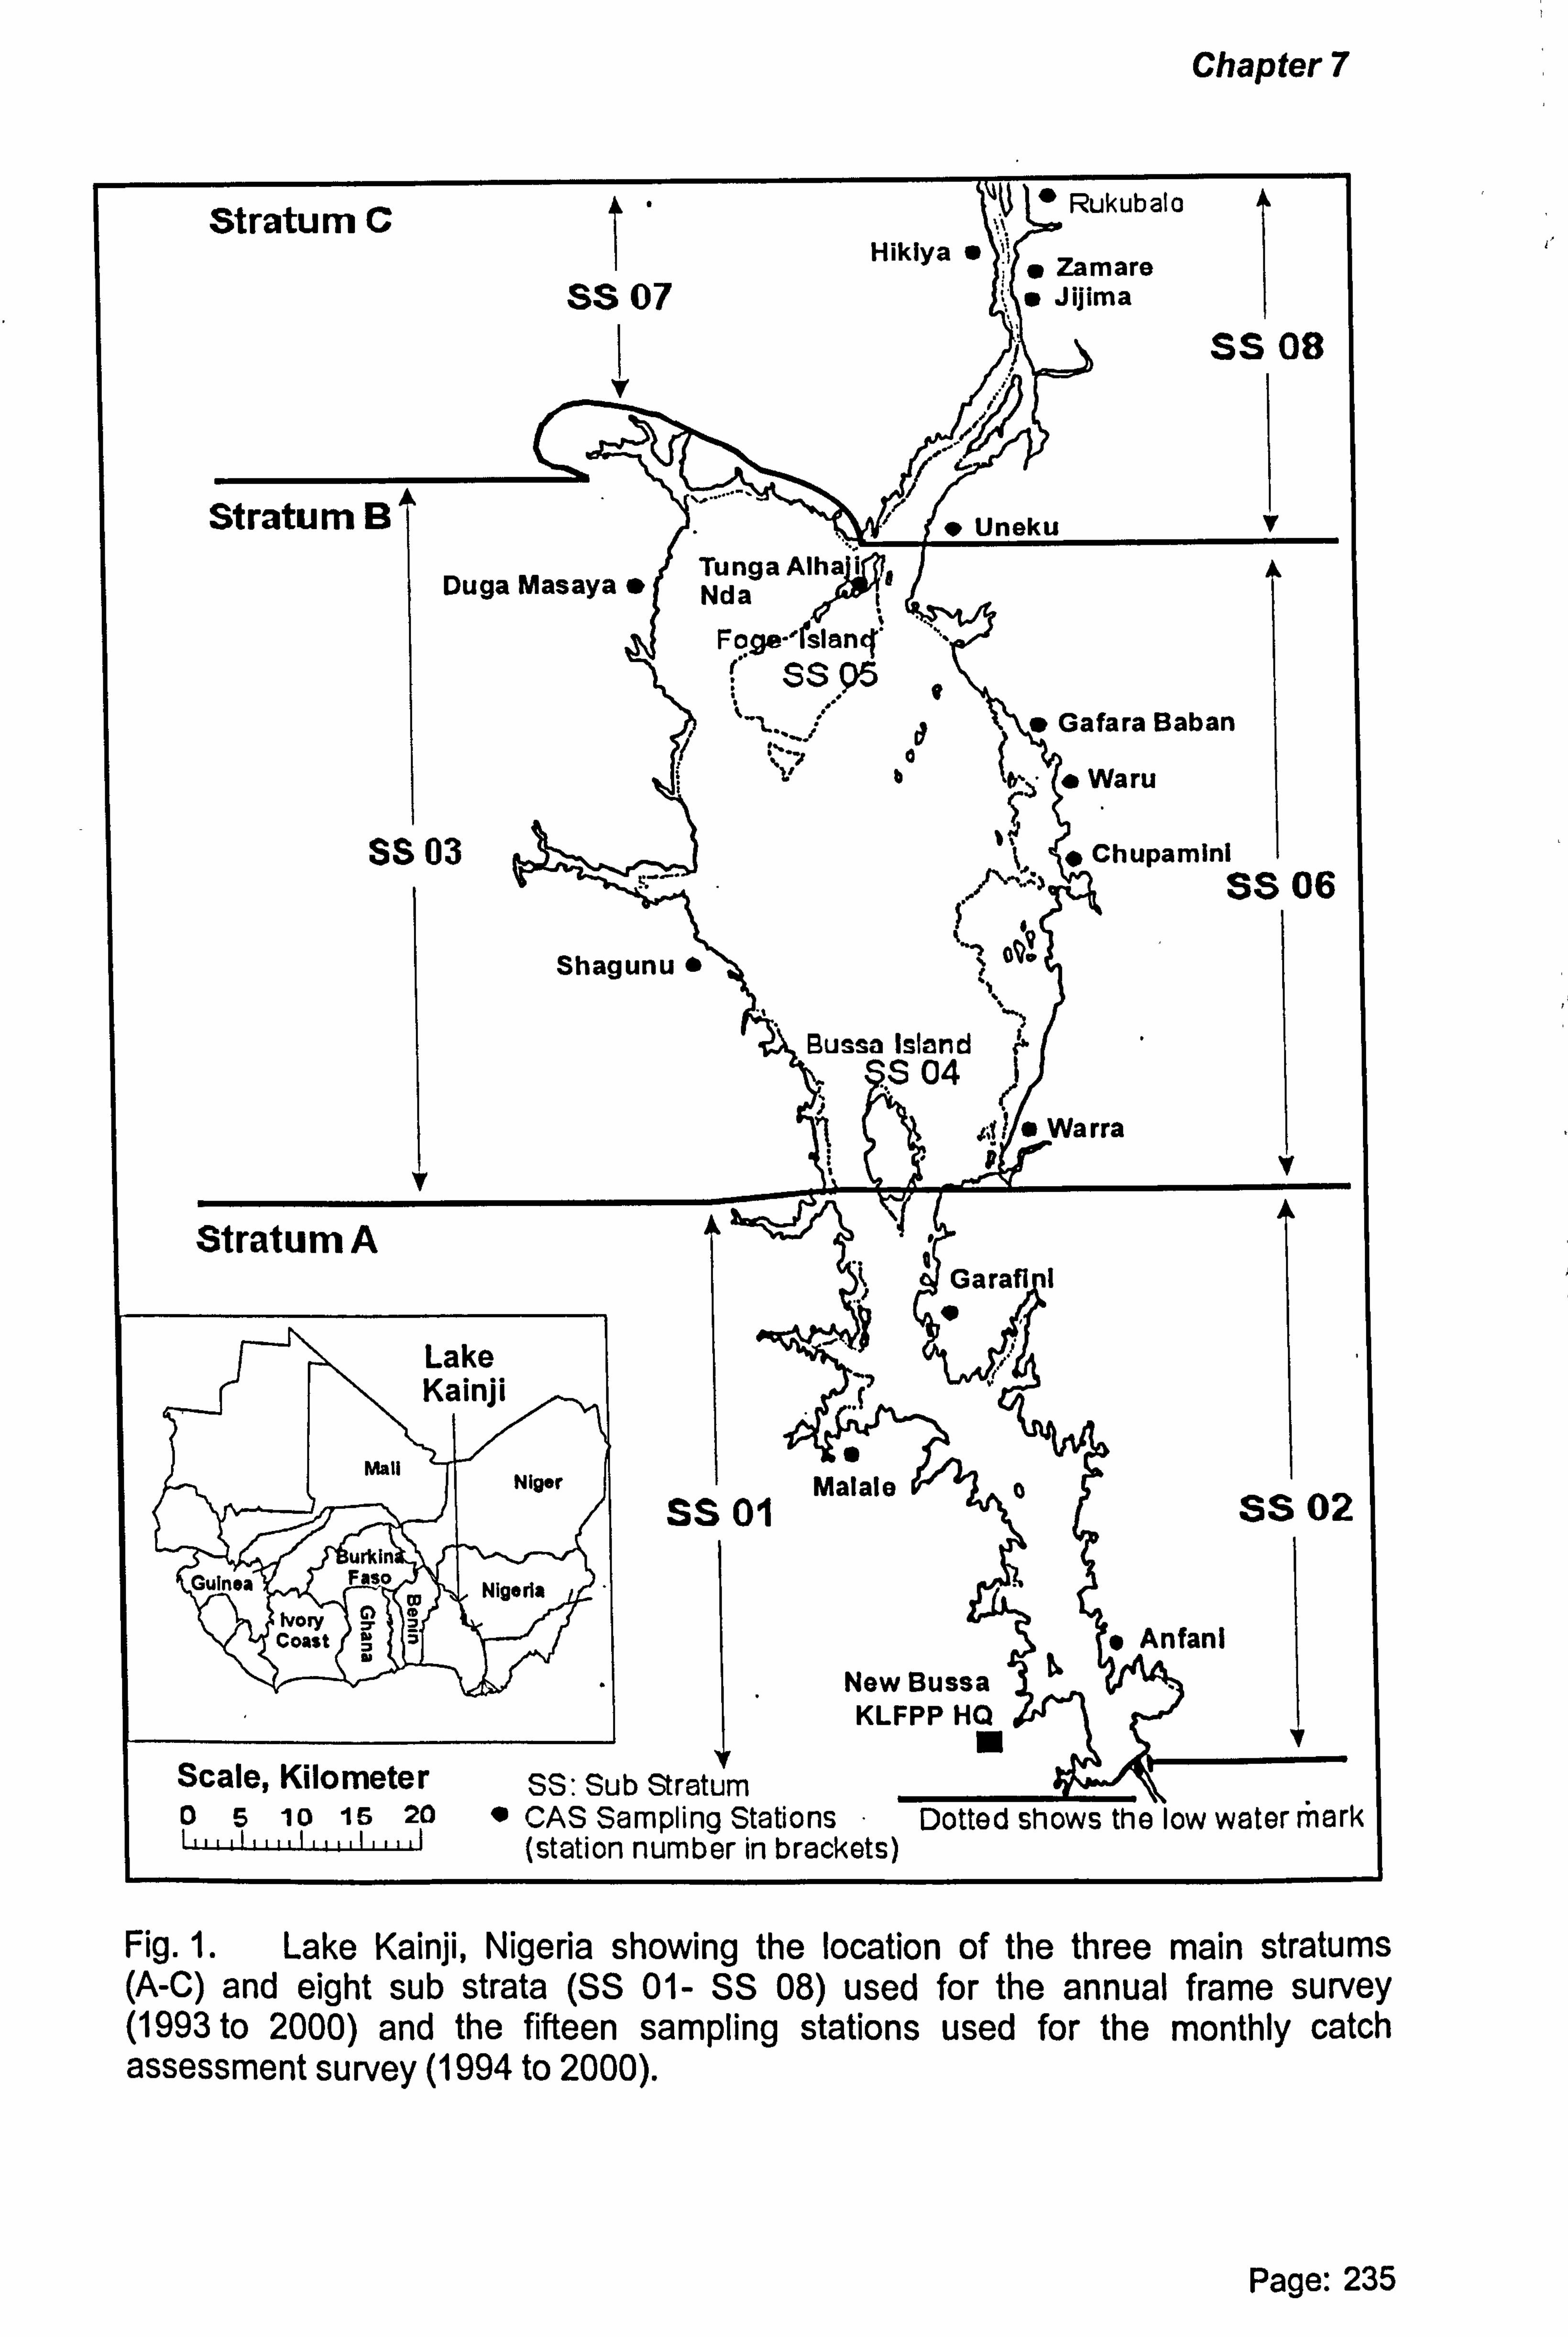
Chapter 7
Stratum C Hikiya "
'0 Rukubalo
" Zamare SS 07 " Jijima
Jo8
Stratum B" Uneku
Duga Masaya " Tunga Alha i Nda e
Foge4slan4 SSQS
SS 03
Shagunu "
I
Gafara Baban
" Waru
Chupamini SS 06
o0Q
Bussa Island y. S 04
f . a1 . Warra
V
Stratum A Garaflrl
0 fs
Lake \J1 Mall
Nig I-x. SS01
Malale 0 SS 02
ýumsa Nigsýla Rory ýý coy: i " Anfani
Now Bussaa Q KLFPP H
Scale, Kilometer SS: Sub Stratum 05 10 15 20 " CAS Sampling Stations Dotted shows the low water mark 1" .1.11 . 1111111 (station number in brackets)
Fig. 1. Lake Kainji, Nigeria showing the location of the three main stratums (A-C) and eight sub strata (SS 01- SS 08) used for the annual frame survey (1993 to 2000) and the fifteen sampling stations used for the monthly catch assessment survey (1994 to 2000).
t'
Page: 235
Chapter 7
For the catch assessment survey fifteen sampling villages (stations) were chosen (Fig. 1). Each year, counts of gear types from the frame survey were used to
ensure that the existing fishing gears in the stations represented the gear mix of that area. Fishing activity (the proportion of gears owned that were used for
fishing) was calculated from a sub-sample of 20 fishing entrepreneurs who were
randomly selected from each sampling station. Entrepreneurs with small and large
numbers of fishing gears (with presumed differing levels of fishing activity) were included. It was ensured that the sum of gears owned by the selected
entrepreneurs was in proportion to the gear mix recorded in the sampling village (verified using frame survey data). Fish catch (the weight of fish caught by each
gear) was sampled by measuring the catch from anyone who landed their fish at the sampling station beach during the recording day. Fishing activity and fish catch
was sampled for four days every month (two periods of two adjacent days) for
each station from January 1994 to December 1996 and for two separate days per month from January 1997 to December 2000.
METHODOLOGY FOR REDUCING THE SAMPLING INTENSITY
The Frame Survey
Annual frame survey data collected between 1993 and 2000 were used to determine the effect on monthly yield estimations of reducing the frequency of the frame survey to alternate years. For each year and gear type, the number of gears from the frame survey was replaced by the average number of gears recorded during the frame surveys conducted the year before and after.
Where: Replaced estimate= N+ (N+1) 2
N= actual estimate (from frame survey).
The replaced figures for the number of gears were substituted for the actual estimates, after which the monthly yield for each gear type was calculated.
Page: 236

Chapter 7
Where: Yield by gear type = total number of gear units in the lake fishery x
average fishing activity (%) x CpUE (kg).
Fishing activity is the percent of gears fished of total gears owned by the fisherfolk
sampled during the month from the total recorded for the lake for the month.
Catch per Unit Effort (CpUE): Weight of fish that are caught by a standard unit length of gear during a standard unit of time. For gill nets the CpUE is expressed
as kg fish per net bundle per night fishing. For longline as kg fish per 100 hooks
per 24 hr.
The monthly yield estimates using gear numbers from all and alternate frame
survey were calculated for both total yield and yield from two gear types (gill nets
and longlines). The yield estimates were compared with actual estimates (using all frame surveys) using using non-parametric Wilcoxen Signed Rank test.
During the sampling period, fishing with beach seines was banned; the number of
seines consequently reduced. The beach seine fishery has therefore been
excluded from the analysis involving frame surveys.
The Catch Assessment Survey
The impact of reducing the sampling intensity of the catch assessment survey was assessed using the data set from the four day per month sampling (January 1995 to December 1996). The sampling intensity was reduced and the effect on the
monthly yield and then CpUE and fishing activity assessed. The difference to the total cost of the survey for reduced sampling intensity was also calculated.
Page: 237

Chapter 7
Reductions in sampling intensity included:
i. Reduced number of sampling days per month from:
a. four to three days b. four to two days (where the two days were separated by at least one week)
c. four to two (where adjacent (combined) days were used) d. four to one day.
ii. Sampling on alternate months only (where the 'missing' months estimate
was replaced by the estimate during the previous month).
iii. Reduced number of sampling stations.
Reducing the size of the sub sample of the fishing entrepreneurs in each station was not considered since it would not have lowered cost (since recorders are
present at the station and therefore must be paid anyway). The sampling days
eliminated from the full data set were selected at random for each station and month. Sampling stations were reduced in areas where the density of stations was highest.
Results from two fishing gear types were used to demonstrate the effect of reduced sampling. These were the gill net fishery, that had a low CpUE, a low
variance in catch and a high coverage throughout the lake and the beach seine fishery that had a high CpUE, a high variance in catch and a scattered distribution.
Two replicate reductions, for all the examples listed above, of the full data set were made. The data for the 24 months were recompiled for each replicate to give two
new sets of monthly CpUE, fishing activity and yield estimates. The mean percentage difference for all months between the two sets of results and the
original full data set was calculated. To prevent negative and positive signs from
canceling each other all errors were treated as positive.
Page: 238
Chapter 7
The margin of error of the total monthly yield estimates expected from reductions in sampling days was assessed for the total monthly CpUE of the gill net fishery
and the CpUE of clupeids by the beach seine fishery.
Where: Margin of error = (1.96)2 standard deviation sample number
(from Lohr, 1999) ... 1)
The effect of reducing the number of sampling stations and sampling days were further assessed by investigating the impact of reducing the number of sampling stations (from fifteen to one) and sampling days each month (from four to one) on the mean monthly CpUE estimate and the confidence intervals of the gill net and beach seine clupeid catch. Reductions were made for each month in 1996.
The effect of reduced sampling intensity of the catch assessment survey on the
mesh size distribution was assessed for the cast net fishery.
RESULTS
REDUCED FREQUENCY OF THE FRAME SURVEY
The new frame survey estimates for fishing gears calculated from the mean of the
adjacent years 'actual' frame survey estimates are given in Table I. The difference in percent of the new'replaced' estimates from the actual estimates is given in the lower section of the table.
The percentage difference between the replaced totals and the actual frame totals varied between +94% and -32% (mean: -2.8%, s: 21). The largest difference was noted for gear types in which the number of gears did not rise uniformly between years.
Page: 239
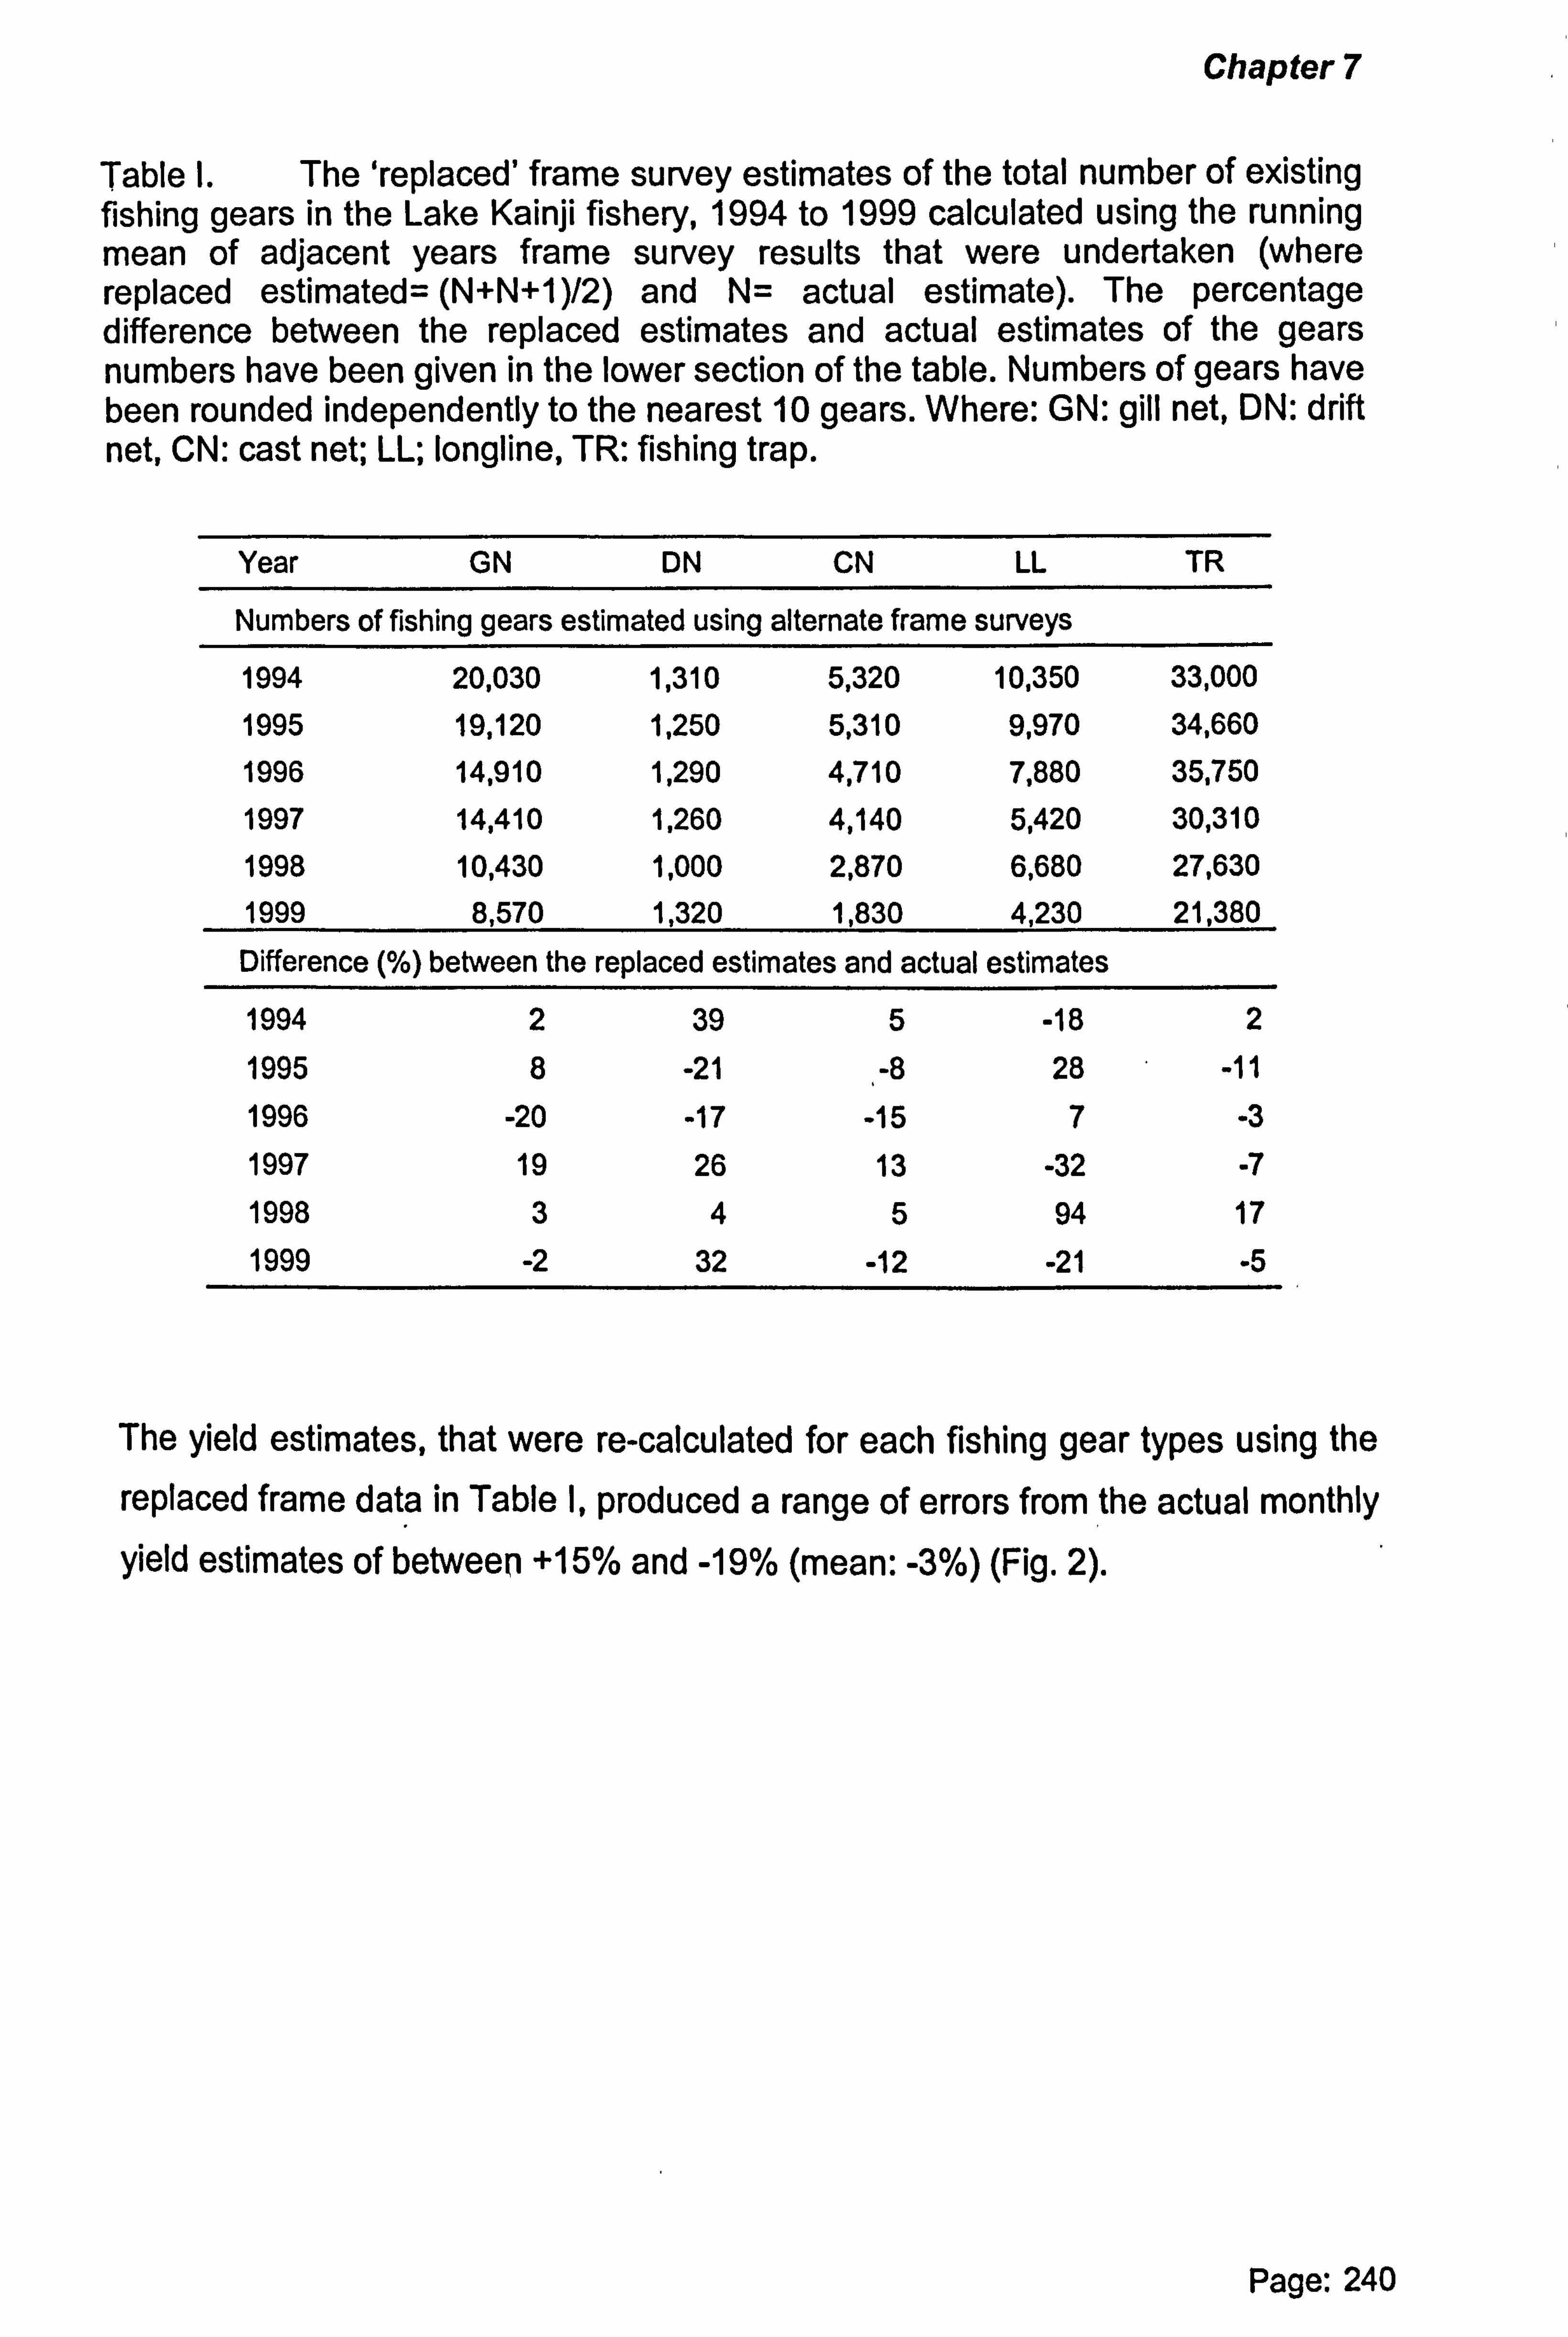
Chapter 7
Table I. The 'replaced' frame survey estimates of the total number of existing fishing gears in the Lake Kainji fishery, 1994 to 1999 calculated using the running mean of adjacent years frame survey results that were undertaken (where replaced estimated= (N+N+1)/2) and N= actual estimate). The percentage difference between the replaced estimates and actual estimates of the gears numbers have been given in the lower section of the table. Numbers of gears have been rounded independently to the nearest 10 gears. Where: GN: gill net, DN: drift net, CN: cast net; LL; longline, TR: fishing trap.
Year GN DN CN LL TR
Numbers of fishing gears estimated using alternate frame surveys
1994 20,030 1,310 5,320 10,350 33,000
1995 19,120 1,250 5,310 9,970 34,660
1996 14,910 1,290 4,710 7,880 35,750
1997 14,410 1,260 4,140 5,420 30,310
1998 10,430 1,000 2,870 6,680 27,630
1999 8,570 1,320 1,830 4,230 21,380
Difference (% ) between the replaced estimates and actual estimates
1994 2 39 5 -18 2 1995 8 -21 -8 28 -11 1996 -20 -17 -15 7 -3 1997 19 26 13 -32 -7 1998 3 4 5 94 17 1999 -2 32 -12 -21 -5
The yield estimates, that were re-calculated for each fishing gear types using the
replaced frame data in Table I, produced a range of errors from the actual monthly yield estimates of between +15% and -19% (mean: -3%) (Fig. 2).
Page: 240
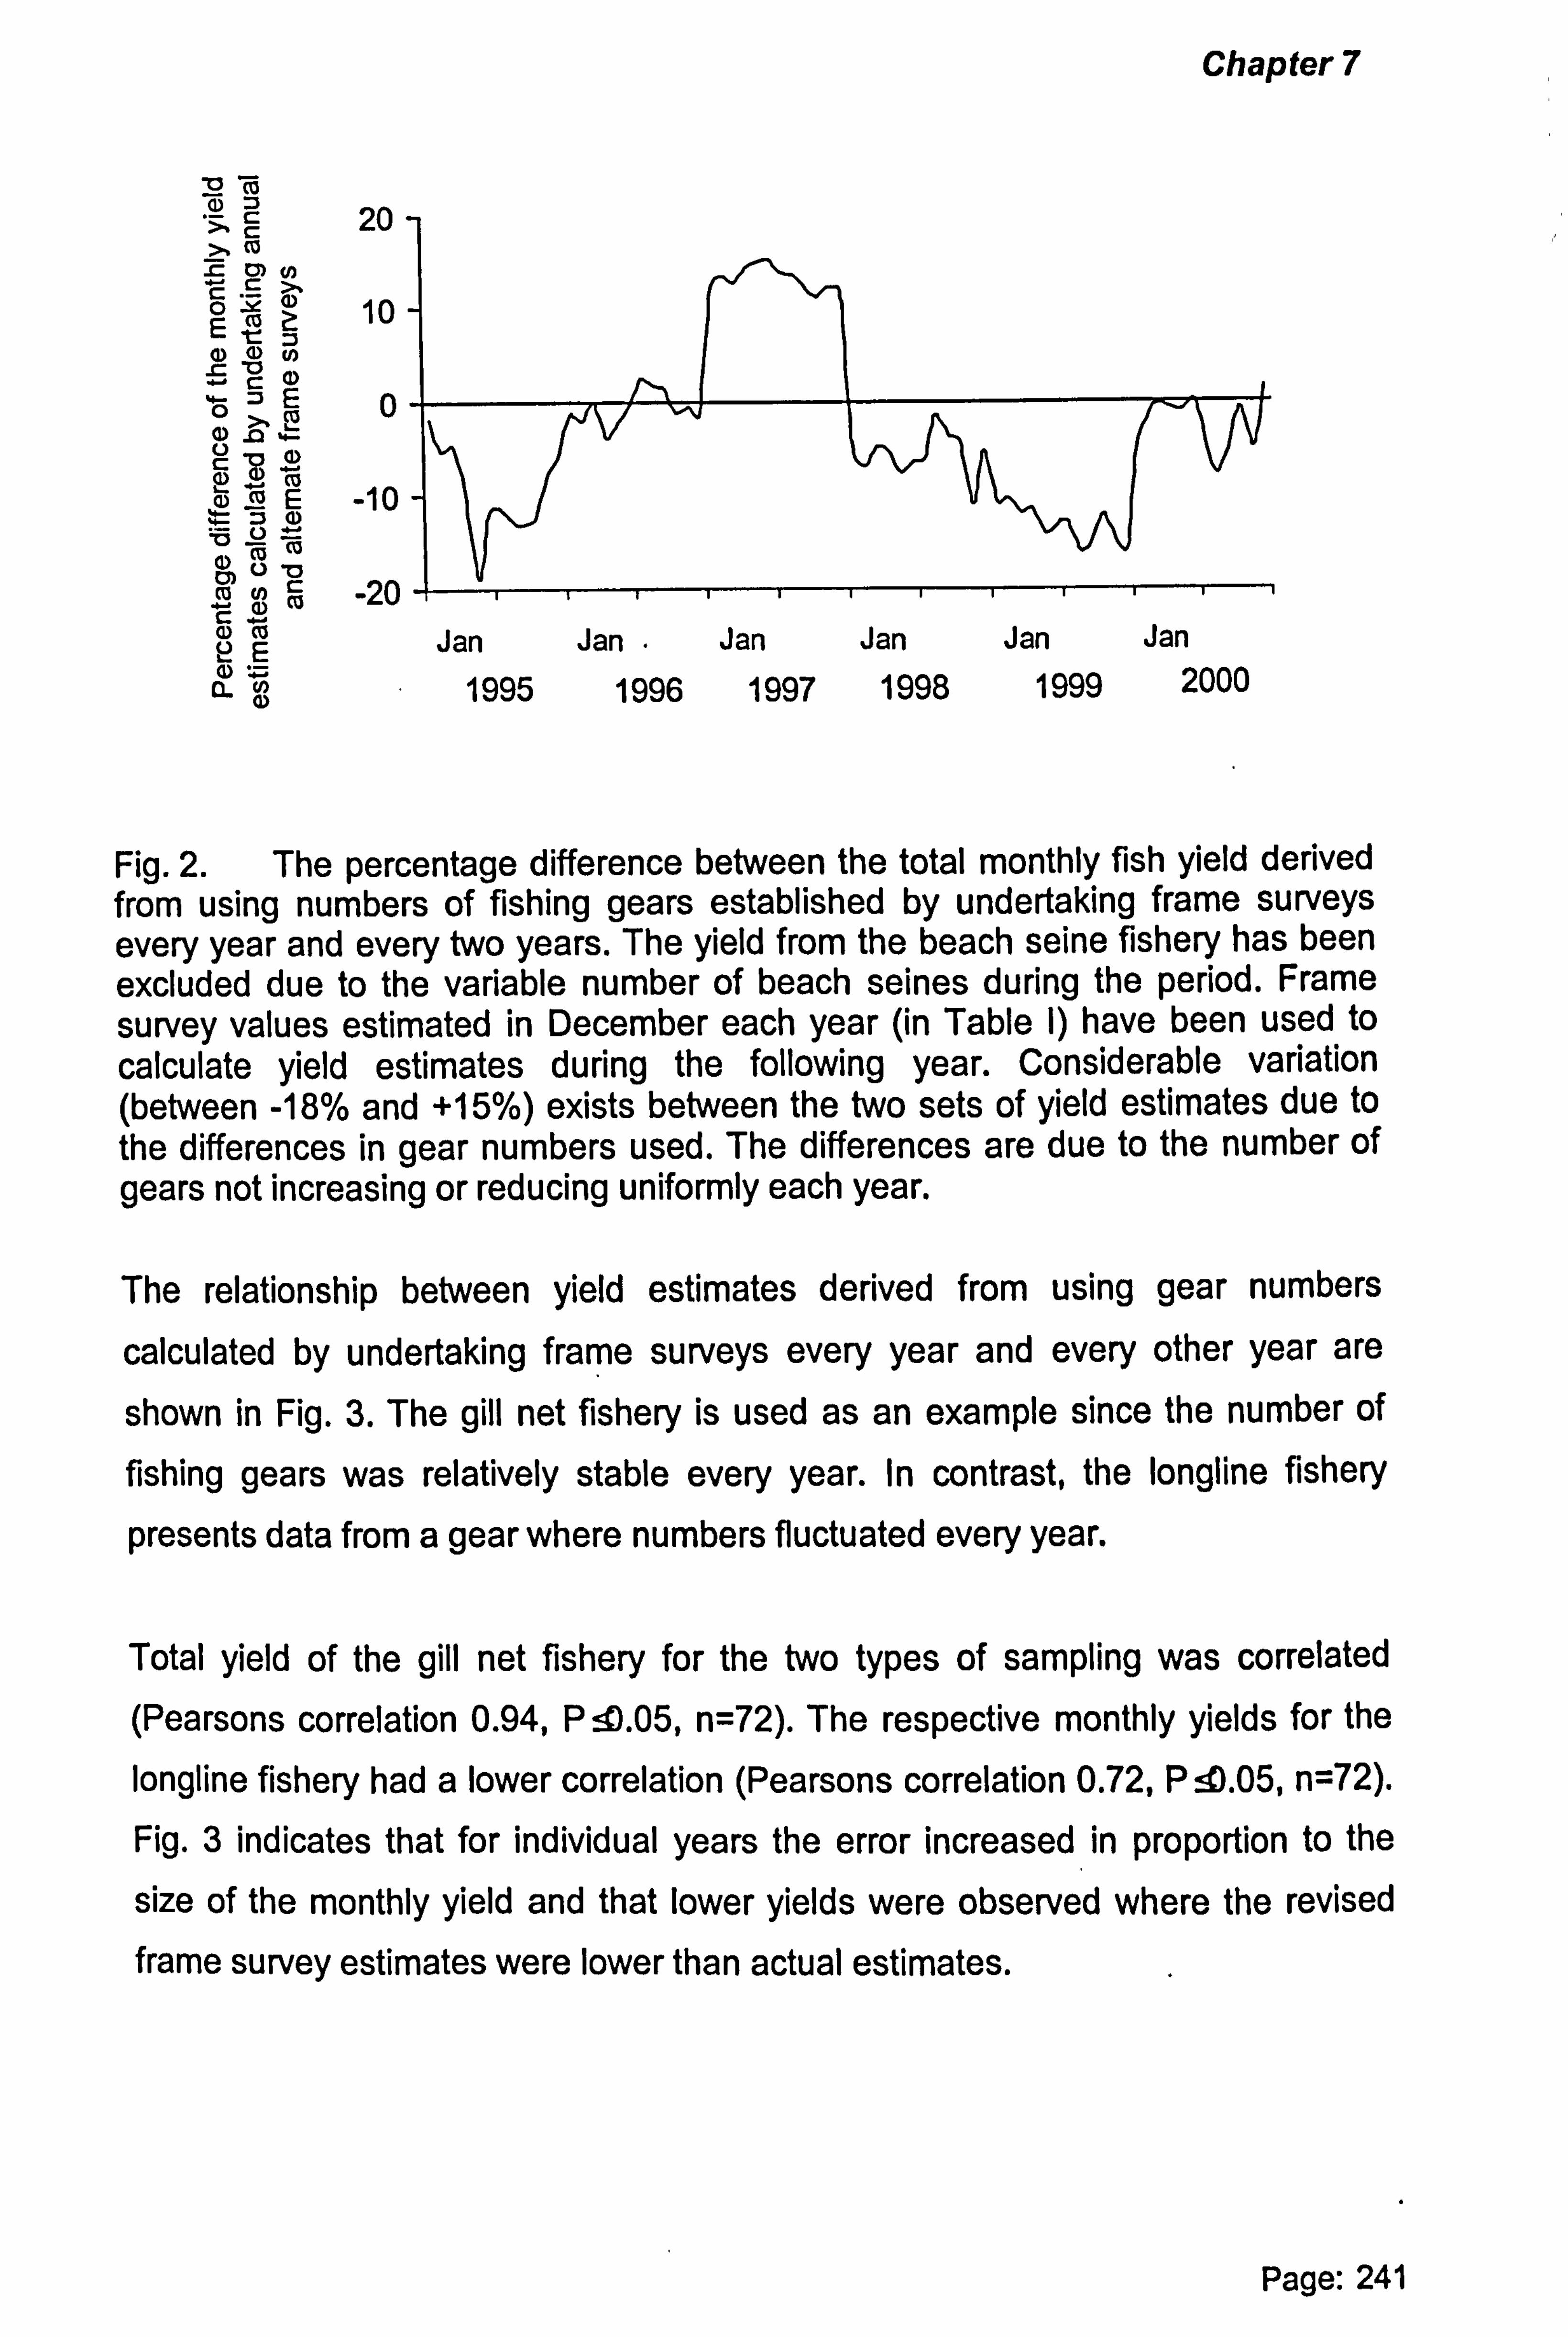
Chapter 7
;, ý 20 L d) V)
10 LN
Öm 0
(D 0 4- CV G)
(13 E -10 tr- 5aß
(ü Ü 0V
M -20 N (ß UP E N ý. aN
Fig. 2. The percentage difference between the total monthly fish yield derived from using numbers of fishing gears established by undertaking frame surveys every year and every two years. The yield from the beach seine fishery has been excluded due to the variable number of beach seines during the period. Frame survey values estimated in December each year (in Table I) have been used to calculate yield estimates during the following year. Considerable variation (between -18% and +15%) exists between the two sets of yield estimates due to the differences in gear numbers used. The differences are due to the number of gears not increasing or reducing uniformly each year.
The relationship between yield estimates derived from using gear numbers
calculated by undertaking frame surveys every year and every other year are
shown in Fig. 3. The gill net fishery is used as an example since the number of fishing gears was relatively stable every year. In contrast, the longline fishery
presents data from a gear where numbers fluctuated every year.
Total yield of the gill net fishery for the two types of sampling was correlated (Pearsons correlation 0.94, P -: D. 05, n=72). The respective monthly yields for the
longline fishery had a lower correlation (Pearsons correlation 0.72, P! 0.05, n=72). Fig. 3 indicates that for individual years the error increased in proportion to the
size of the monthly yield and that lower yields were observed where the revised frame survey estimates were lower than actual estimates.
Page: 241
Jan Jan " Jan Jan Jan Jan
1995 1996 1997 1998 1999 2000

Chapter 7
Only the gear totals from the frame survey were changed in the yield equations.
The CpUE and activity estimates therefore remained the same as values for the
original frame data. CpUE and activity are perhaps the most important indicators
used for monitoring fisheries.
Gill Net
I- NO
ZO
Eve Naýý -, OCLoo
Ic ýo a) Co
ZO 'C $"' CN 00C
YEAR
0
X
800
2000 1997
1996
1995
Monthly yield estimates (tonne) for frame surveys undertaken every year
Fig. 3. The relationship between yield estimates (tonne) calculated by using annual and alternate year frame surveys for two example fishing gear types (gill nets and longlines) used in the Lake Kainji fishery. For each year, the error in yield is the same for every month, being proportional to the size of the yield. The estimated monthly yield using alternative years frame sampling was significantly different from the original estimates for the gill net fishery (Wilcoxon Signed Ranks Test, Z=-2.52, n=72, P=0.12) and were most different for the longline fishery (Wilcoxon Signed Ranks Test, Z=-1 1, n=72, p=0.91) which had highly variable gear numbers each year.
REDUCED SAMPLING INTENSITY OF THE CATCH ASSESSMENT SURVEY
Sampling Intensity
For the original four day sampling, the highest sampling intensity for fishing activity
was noted for those fishing gears that were evenly distributed throughout the
sampling stations (such as longlines and gill nets). The intensity was also high for
the gears which, although have a more scattered distribution, had many sampling stations in areas where they occur (drift nets). This is unlike beach seines and traps, which although had a scattered distribution, were less well represented (Table II).
Longline
Page: 242
0 400 800 1200 0 200 400 600
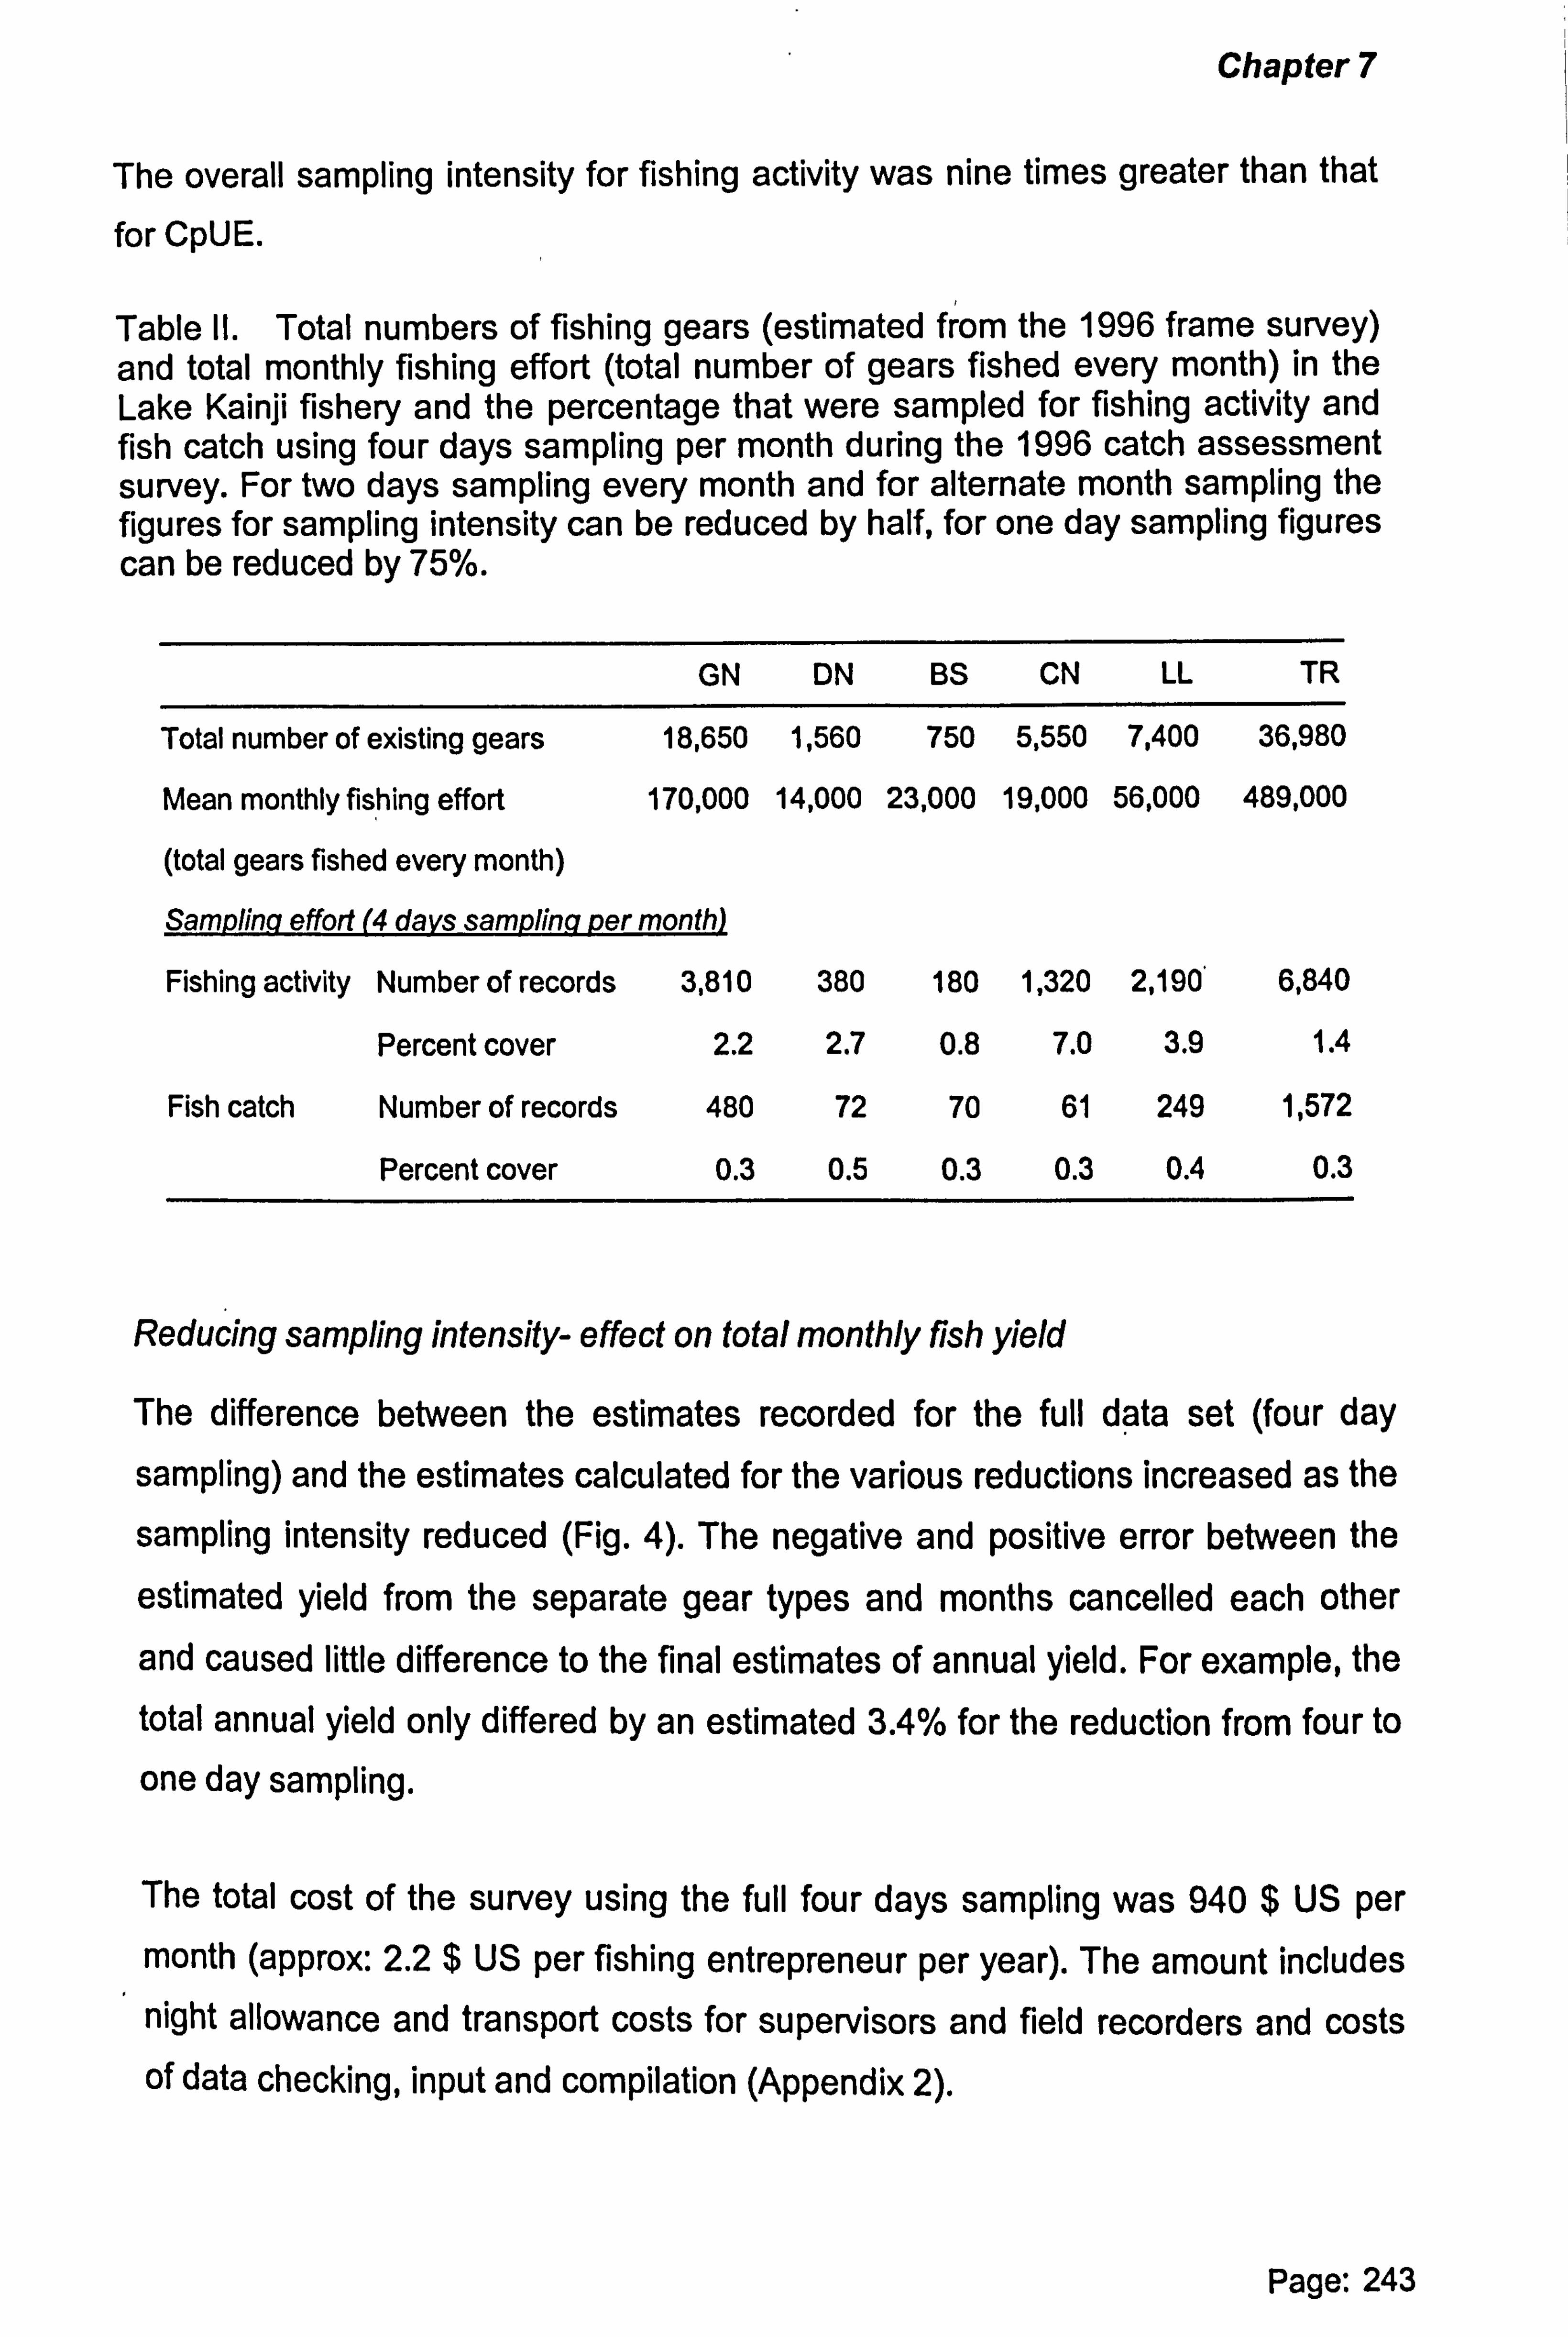
Chapter 7
The overall sampling intensity for fishing activity was nine times greater than that
for CpUE.
Table II. Total numbers of fishing gears (estimated from the 1996 frame survey) and total monthly fishing effort (total number of gears fished every month) in the Lake Kainji fishery and the percentage that were sampled for fishing activity and fish catch using four days sampling per month during the 1996 catch assessment survey. For two days sampling every month and for alternate month sampling the figures for sampling intensity can be reduced by half, for one day sampling figures can be reduced by 75%.
GN DN BS CN LL TR
Total number of existing gears 18,650 1,560 750 5,550 7,400 36,980
Mean monthly fishing effort 170,000 14,000 23,000 19,000 56,000 489,000
(total gears fished every month)
Sampling effort (4 days sampling per month)
Fishing activity Number of records 3,810
Percent cover 2.2
Fish catch Number of records 480
Percent cover 0.3
380 180 1,320 2,190 6,840
2.7 0.8 7.0 3.9 1.4
72 70 61 249 1,572
0.5 0.3 0.3 0.4 0.3
Reducing sampling intensity- effect on total monthly fish yield
The difference between the estimates recorded for the full data set (four day
sampling) and the estimates calculated for the various reductions increased as the
sampling intensity reduced (Fig. 4). The negative and positive error between the
estimated yield from the separate gear types and months cancelled each other
and caused little difference to the final estimates of annual yield. For example, the
total annual yield only differed by an estimated 3.4% for the reduction from four to
one day sampling.
The total cost of the survey using the full four days sampling was 940 $ US per month (approx: 2.2 $ US per fishing entrepreneur per year). The amount includes
night allowance and transport costs for supervisors and field recorders and costs of data checking, input and compilation (Appendix 2).
Page: 243

20 0
t 15 aý c 10 0 E m5 aý
0 W N N D m N N NN ((D
a.
a a n 9) c n c n (D 0
0
CD ä zr :3 N
3
Chapter 7
75 OTotal yield " (all gears)
50 c' ® GN yield .5
BS yield 25 CA 0 0
0 X- Percentage
cost saving of survey
Fig. 4. The expected percentage error of total, gill net and beach seine monthly yield (tonne) and the cost saving (%) from the full data set (four days per month sampling) caused by various reductions in sampling intensity of the catch assessment survey of Lake Kainji, Nigeria. Two replicate reductions were made with the mean error from the resulting data sets being used. Using alternate months and slightly fewer sampling stations produced the most error. Reducing the number of sampling days had less effect, with error increasing by 2.5% for each reduction of one sampling day per month.
Reducing sampling intensity- effect on CpUE and fishing activity by gear type
As well as investigating the effect that reducing sampling intensity has on total
yield, it is also important to assess the effect of the reduction on the components of the yield equation, namely fish catch (CpUE) and fishing activity.
For all reductions in sampling intensity the resulting errors in the estimate of CpUE
were almost double that of fishing activity. Larger errors were observed in the beach seine compared to the gill net fishery, especially in the case of CpUE (Fig. 5).
Page: 244
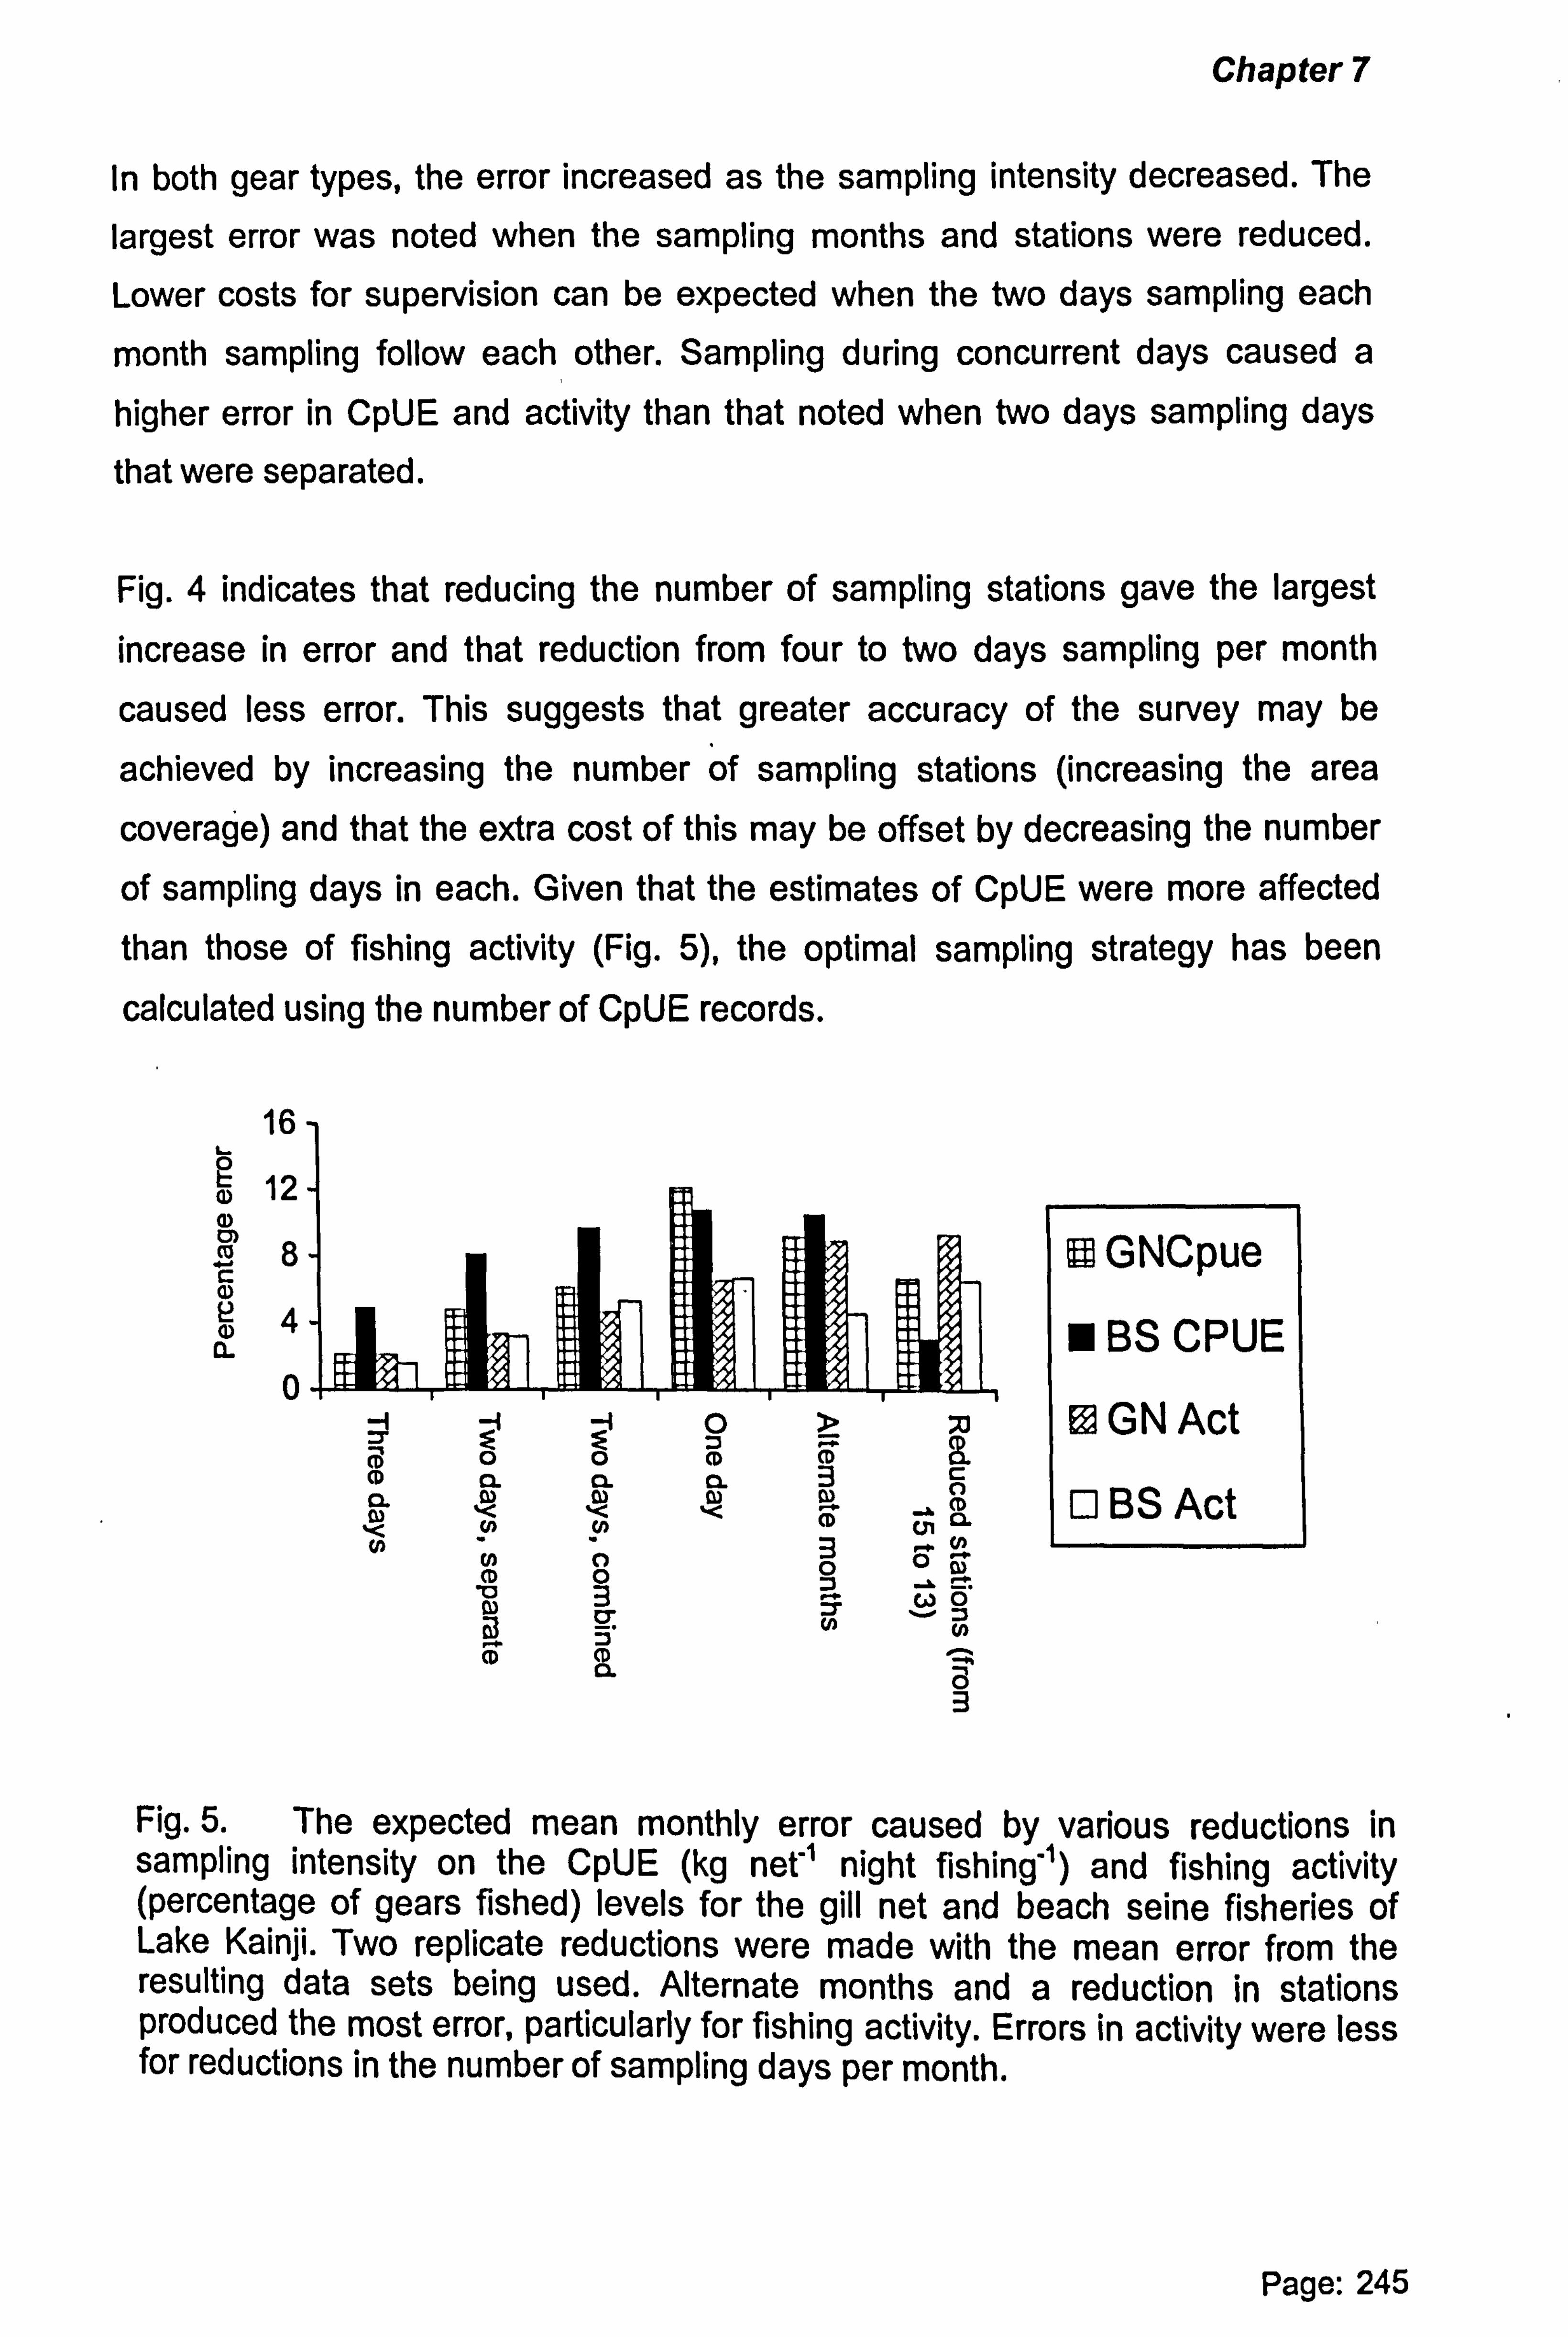
Chapter 7
In both gear types, the error increased as the sampling intensity decreased. The
largest error was noted when the sampling months and stations were reduced.
Lower costs for supervision can be expected when the two days sampling each
month sampling follow each other. Sampling during concurrent days caused a
higher error in CpUE and activity than that noted when two days sampling days
that were separated.
Fig. 4 indicates that reducing the number of sampling stations gave the largest
increase in error and that reduction from four to two days sampling per month
caused less error. This suggests that greater accuracy of the survey may be
achieved by increasing the number of sampling stations (increasing the area
coverage) and that the extra cost of this may be offset by decreasing the number
of sampling days in each. Given that the estimates of CpUE were more affected than those of fishing activity (Fig. 5), the optimal sampling strategy has been
calculated using the number of CpUE records.
aý aý rn co c aý
1) CL
16
12
8
4
0 s V - O D ý 0 0 CD CD ä
CD a a a 3 0 N N N cn O' N N
N CD
O 0 0 o
-" 3 0 ,ý, co CT N :3 @ N
CD Q' a
3
9 GNCpue
BS CPUE
®GNAct
El BS Act
Fig. 5. The expected mean monthly error caused by various reductions in sampling intensity on the CpUE (kg net -1 night fishing'') and fishing activity (percentage of gears fished) levels for the gill net and beach seine fisheries of Lake Kainji. Two replicate reductions were made with the mean error from the resulting data sets being used. Alternate months and a reduction in stations produced the most error, particularly for fishing activity. Errors in activity were less for reductions in the number of sampling days per month.
Page: 245
Chapter 7
EXPLORING THE HYPOTHESIS; THAT A LOW NUMBER OF RECORDING DAYS AND A LARGE NUMBER OF RECORDING STATIONS GIVES GREATER
ACCURACY
The section below determines the effect on estimates of CpUE of reductions in the
number of sampling stations and sampling days. Two examples from the Lake
Kainji fishery are used; gill net CpUE and the CpUE of clupeids by the beach seine fishery. The CpUE of clupeids is an important indicator of the status of the Lake
Kainji beach seine fishery and one which experienced the lowest number of
samples during the catch assessment survey.
Effect of reducing the number of sampling days
Fig. 6 indicates that decreasing sampling intensity leads to a larger margin of error. In both example fisheries the error increased markedly when sampling days
were reduced from two to one day per month. For the gill net CpUE two days
sampling resulted in an error only marginally higher than four days sampling. However, in the case of the catch of clupeids that has a lower number of samples the reduction from four to two days increased the margin of error by some 40%. If two days recording was used it would therefore be advantageous to boost the
number of samples for fisheries such as the beach seine that have a low sample number.
Page: 246
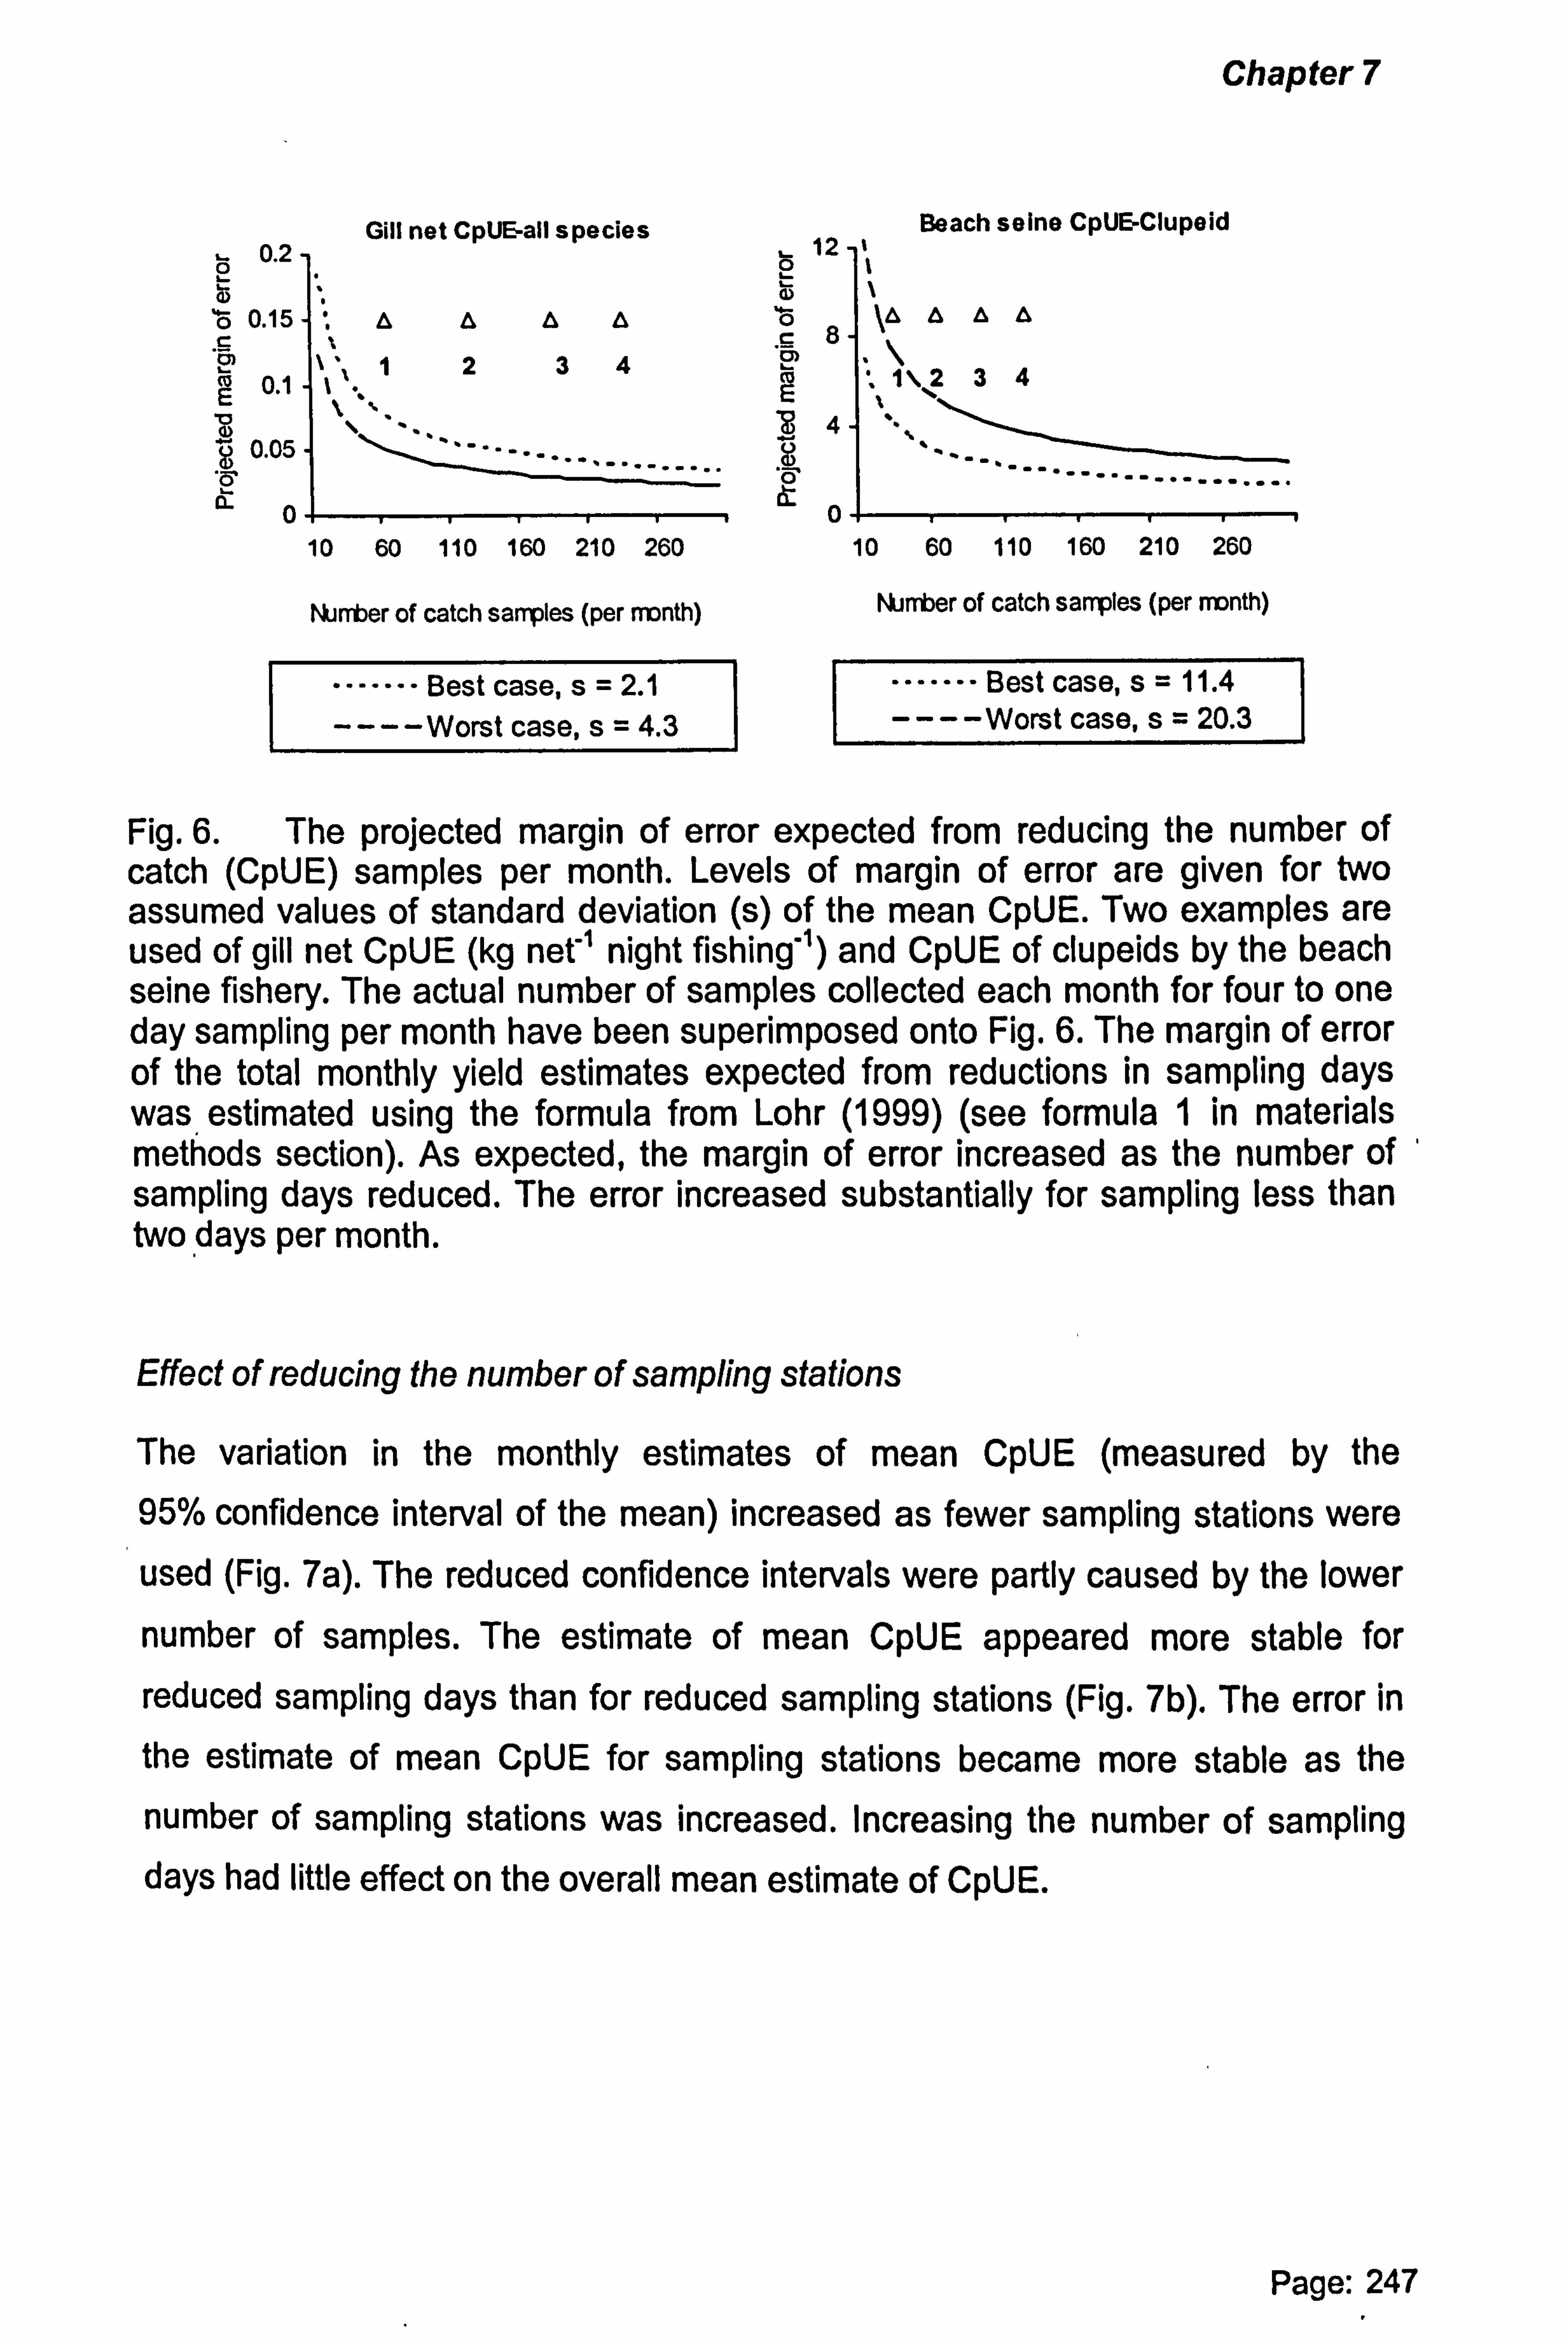
Chapter 7
Gill net CpUE-all species Beach seine CpUE-Clupeid 0.2 12 -1 ö ö
ö 0.15 ', OOOO ö 1ý e c
234 " \ S 8
" 1
t6 0.1 t 1 m . \234
ý 0.05
0. i
10 60 110 160 210 260 10 60 110 160 210 260
Number of catch samples (per month)
""----- Best case, s=2.1 ----Worst case, s=4.3
Number of catch samples (per month)
---"--- Best case, s= 11.4
----Worst case, s= 20.3
Fig. 6. The projected margin of error expected from reducing the number of catch (CpUE) samples per month. Levels of margin of error are given for two assumed values of standard deviation (s) of the mean CpUE. Two examples are used of gill net CpUE (kg net-' night fishing'') and CpUE of clupeids by the beach seine fishery. The actual number of samples collected each month for four to one day sampling per month have been superimposed onto Fig. 6. The margin of error of the total monthly yield estimates expected from reductions in sampling days was estimated using the formula from Lohr (1999) (see formula 1 in materials methods section). As expected, the margin of error increased as the number of sampling days reduced. The error increased substantially for sampling less than two days per month.
Effect of reducing the number of sampling stations
The variation in the monthly estimates of mean CpUE (measured by the
95% confidence interval of the mean) increased as fewer sampling stations were
used (Fig. 7a). The reduced confidence intervals were partly caused by the lower
number of samples. The estimate of mean CpUE appeared more stable for
reduced sampling days than for reduced sampling stations (Fig. 7b). The error in
the estimate of mean CpUE for sampling stations became more stable as the
number of sampling stations was increased. Increasing the number of sampling days had little effect on the overall mean estimate of CpUE.
Page: 247
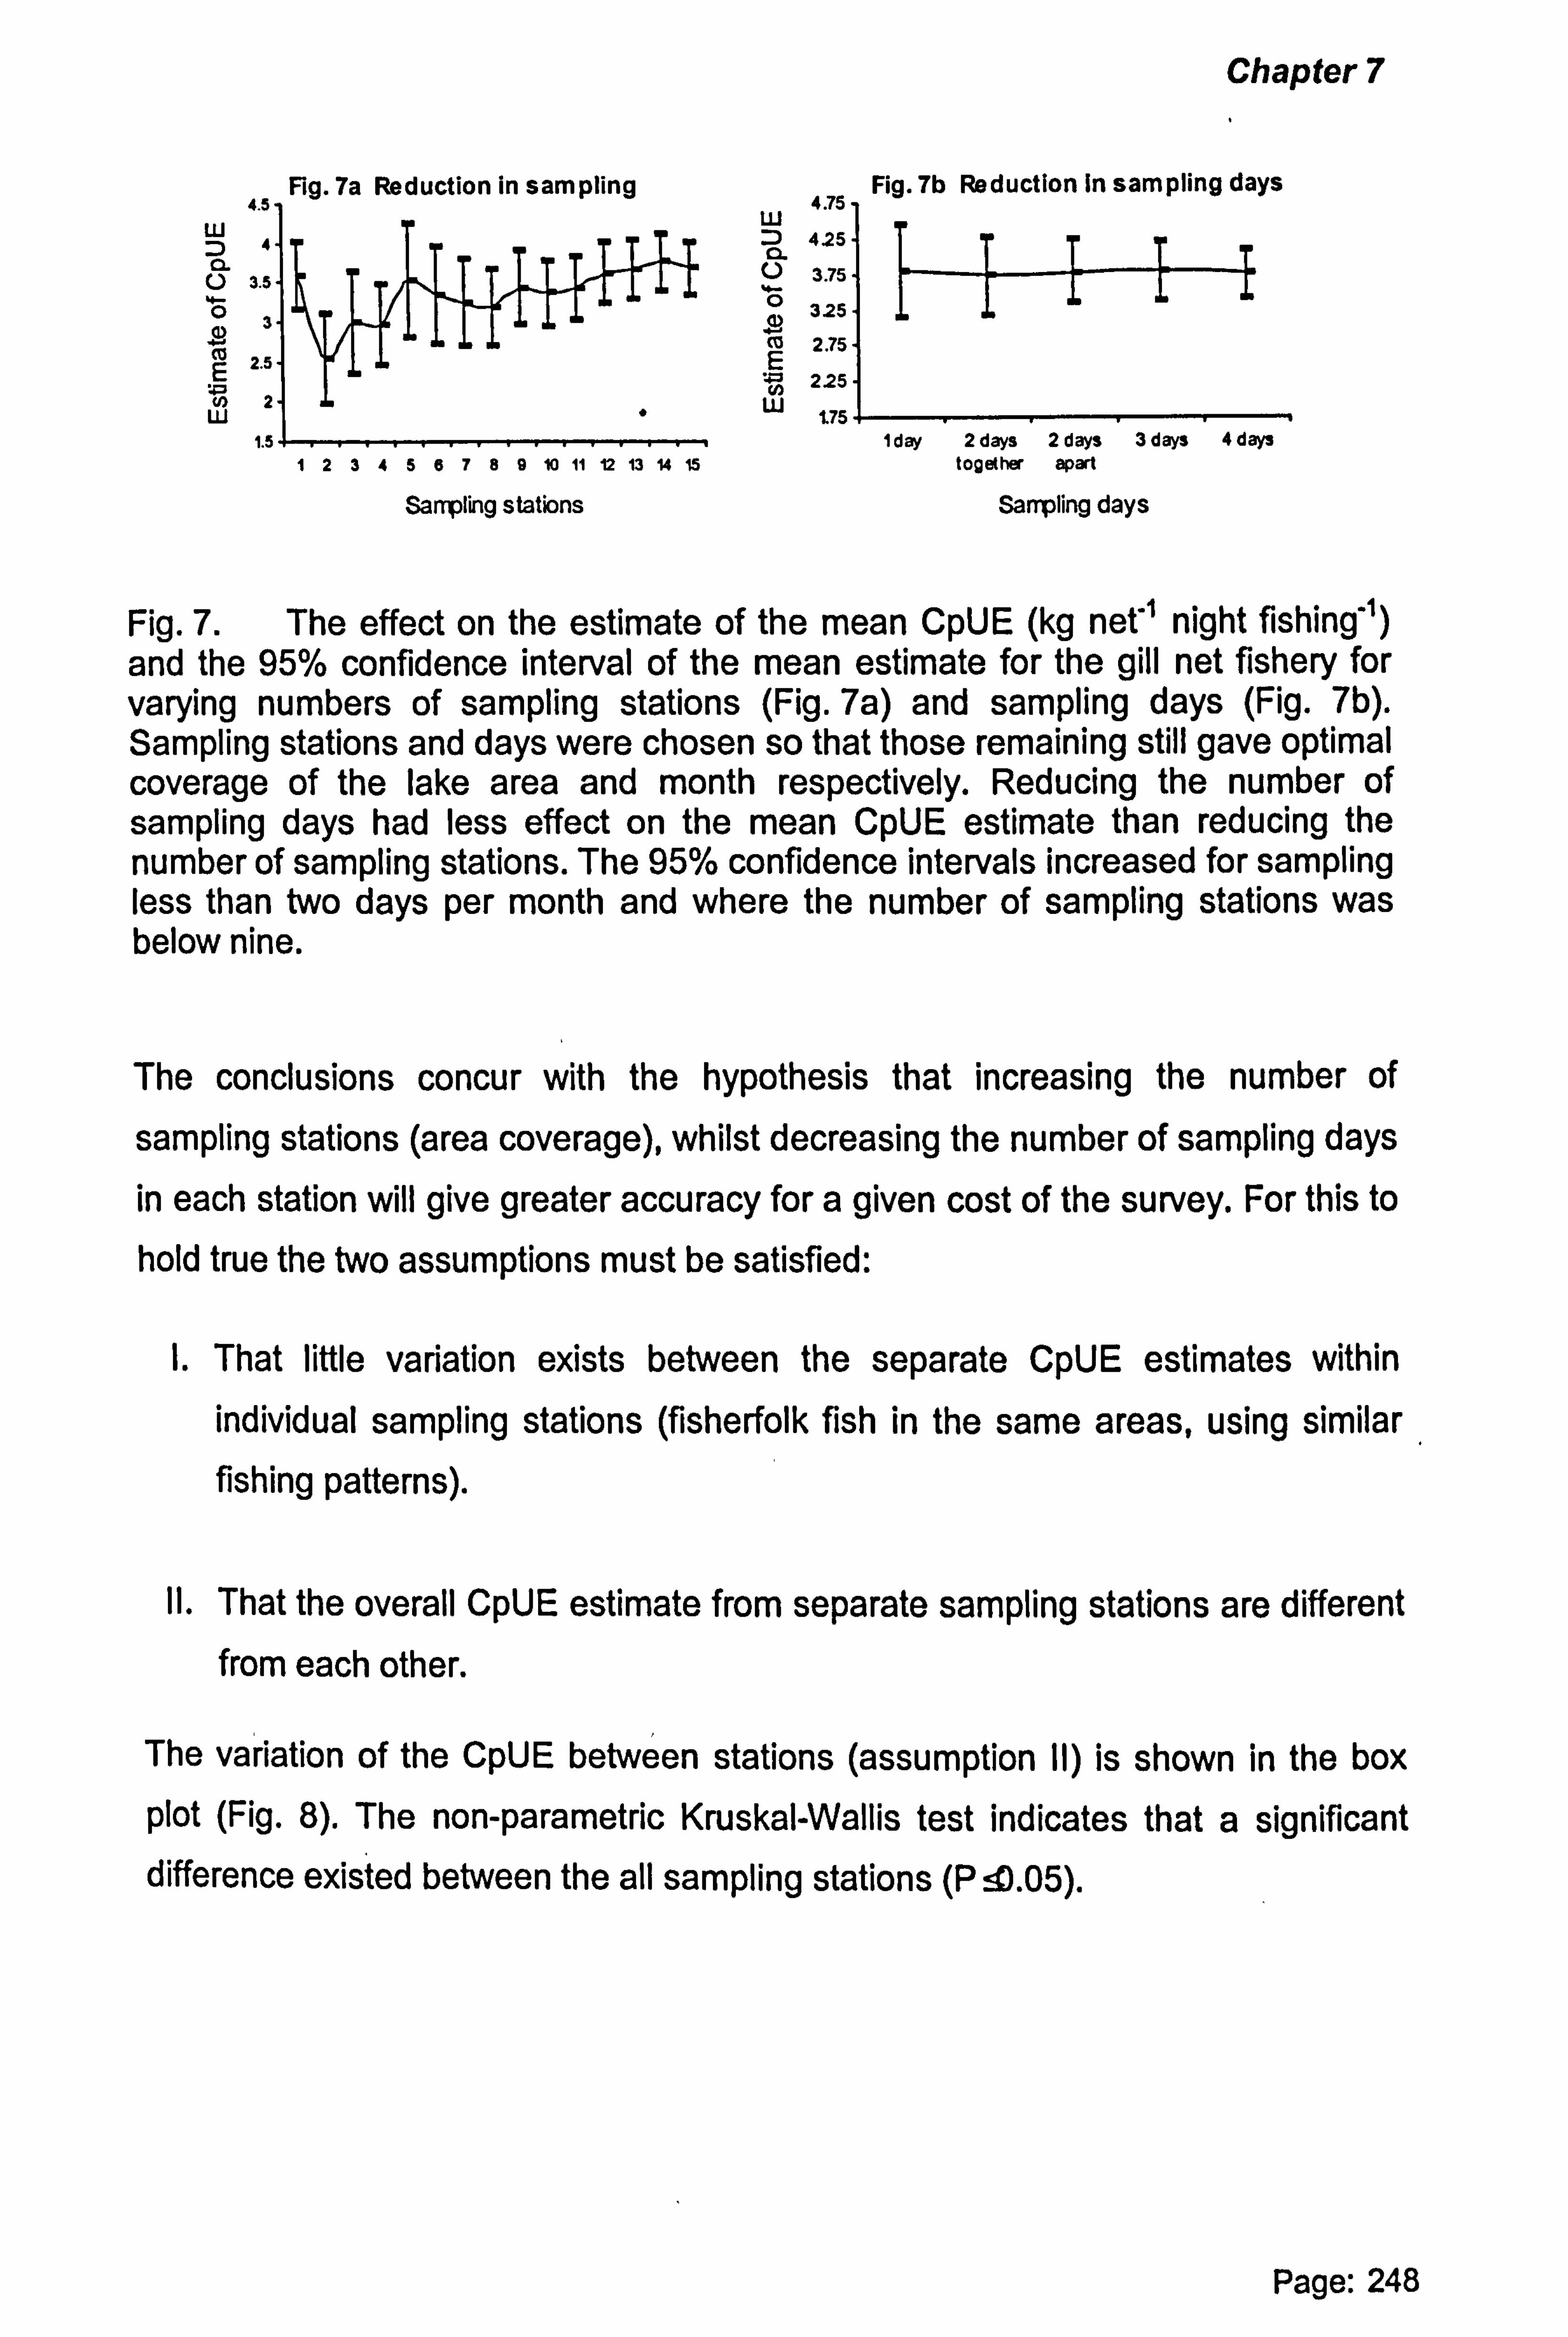
Chapter 7
Fig. 7a Reduction in sampling 4.5 W
4.75 w D 4 : 42S C V 3.75 Ö 325
`° 5 2 M E
2.75 EE . 225
w 2 W 1.75 1.5
123456789 10 11 12 13 14 15
Sampling stations
Fig. 7b Reduction In sampling days
I day 2 days 2 days 3 days 4 days together apart
Sarrpling days
Fig. 7. The effect on the estimate of the mean CpUE (kg net" night fishing') and the 95% confidence interval of the mean estimate for the gill net fishery for varying numbers of sampling stations (Fig. 7a) and sampling days (Fig. 7b). Sampling stations and days were chosen so that those remaining still gave optimal coverage of the lake area and month respectively. Reducing the number of sampling days had less effect on the mean CpUE estimate than reducing the number of sampling stations. The 95% confidence intervals increased for sampling less than two days per month and where the number of sampling stations was below nine.
The conclusions concur with the hypothesis that increasing the number of
sampling stations (area coverage), whilst decreasing the number of sampling days
in each station will give greater accuracy for a given cost of the survey. For this to
hold true the two assumptions must be satisfied:
I. That little variation exists between the separate CpUE estimates within individual sampling stations (fisherfolk fish in the same areas, using similar fishing patterns).
II. That the overall CpUE estimate from separate sampling stations are different from each other.
The variation of the CpUE between stations (assumption II) is shown in the box
plot (Fig. 8). The non-parametric Kruskal-Wallis test indicates that a significant difference existed between the all sampling stations (P O. 05).
Page: 248
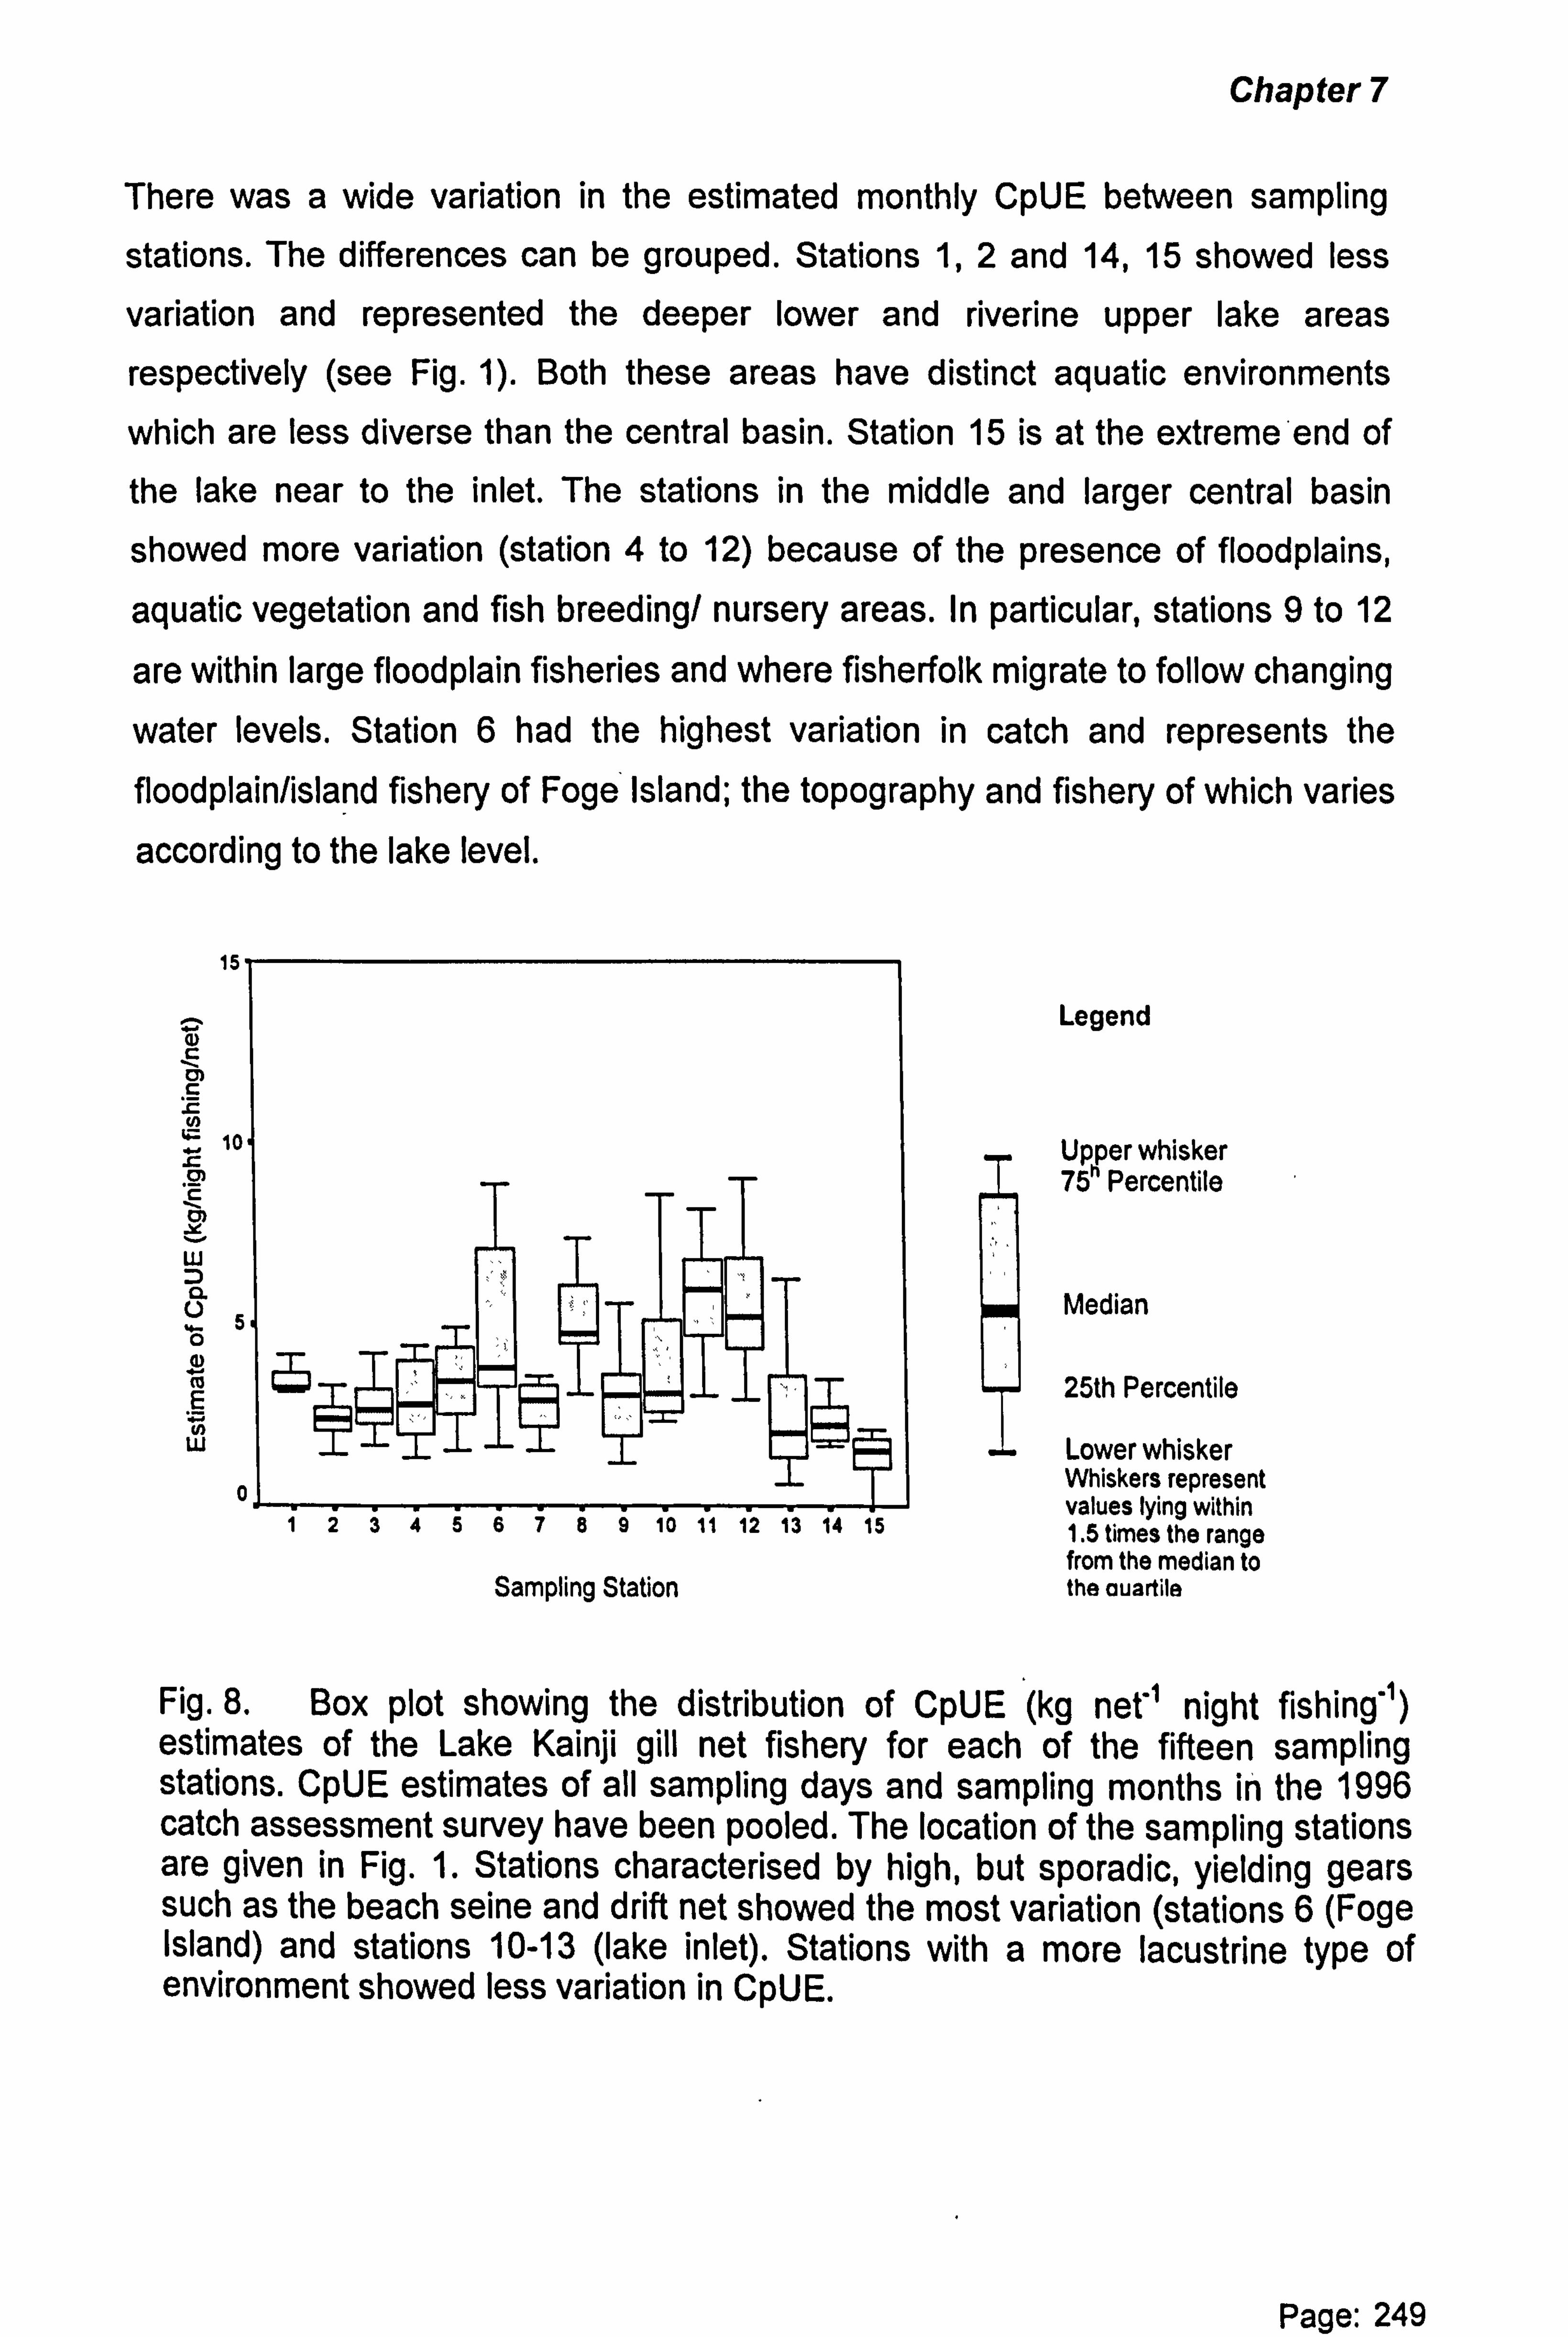
Chapter 7
There was a wide variation in the estimated monthly CpUE between sampling
stations. The differences can be grouped. Stations 1,2 and 14,15 showed less
variation and represented the deeper lower and riverine upper lake areas
respectively (see Fig. 1). Both these areas have distinct aquatic environments
which are less diverse than the central basin. Station 15 is at the extreme end of the lake near to the inlet. The stations in the middle and larger central basin
showed more variation (station 4 to 12) because of the presence of floodplains,
aquatic vegetation and fish breeding/ nursery areas. In particular, stations 9 to 12
are within large floodplain fisheries and where fisherfolk migrate to follow changing
water levels. Station 6 had the highest variation in catch and represents the
floodplain/island fishery of Foge Island; the topography and fishery of which varies
according to the lake level.
15
(D E rn c
1o
rn c rn Y
w CL
0 a) m E
w
123456769 10 11 12 13 14 15
Sampling Station
Legend
Upper whisker 75" Percentile
Median
25th Percentile
-ý Lower whisker Whiskers represent values lying within 1.5 times the range from the median to the auartile
Fig. 8. Box plot showing the distribution of CpUE (kg net" night fishing') estimates of the Lake Kainji gill net fishery for each of the fifteen sampling stations. CpUE estimates of all sampling days and sampling months in the 1996 catch assessment survey have been pooled. The location of the sampling stations are given in Fig. 1. Stations characterised by high, but sporadic, yielding gears such as the beach seine and drift net showed the most variation (stations 6 (Foge Island) and stations 10-13 (lake inlet). Stations with a more lacustrine type of environment showed less variation in CpUE.
Page: 249
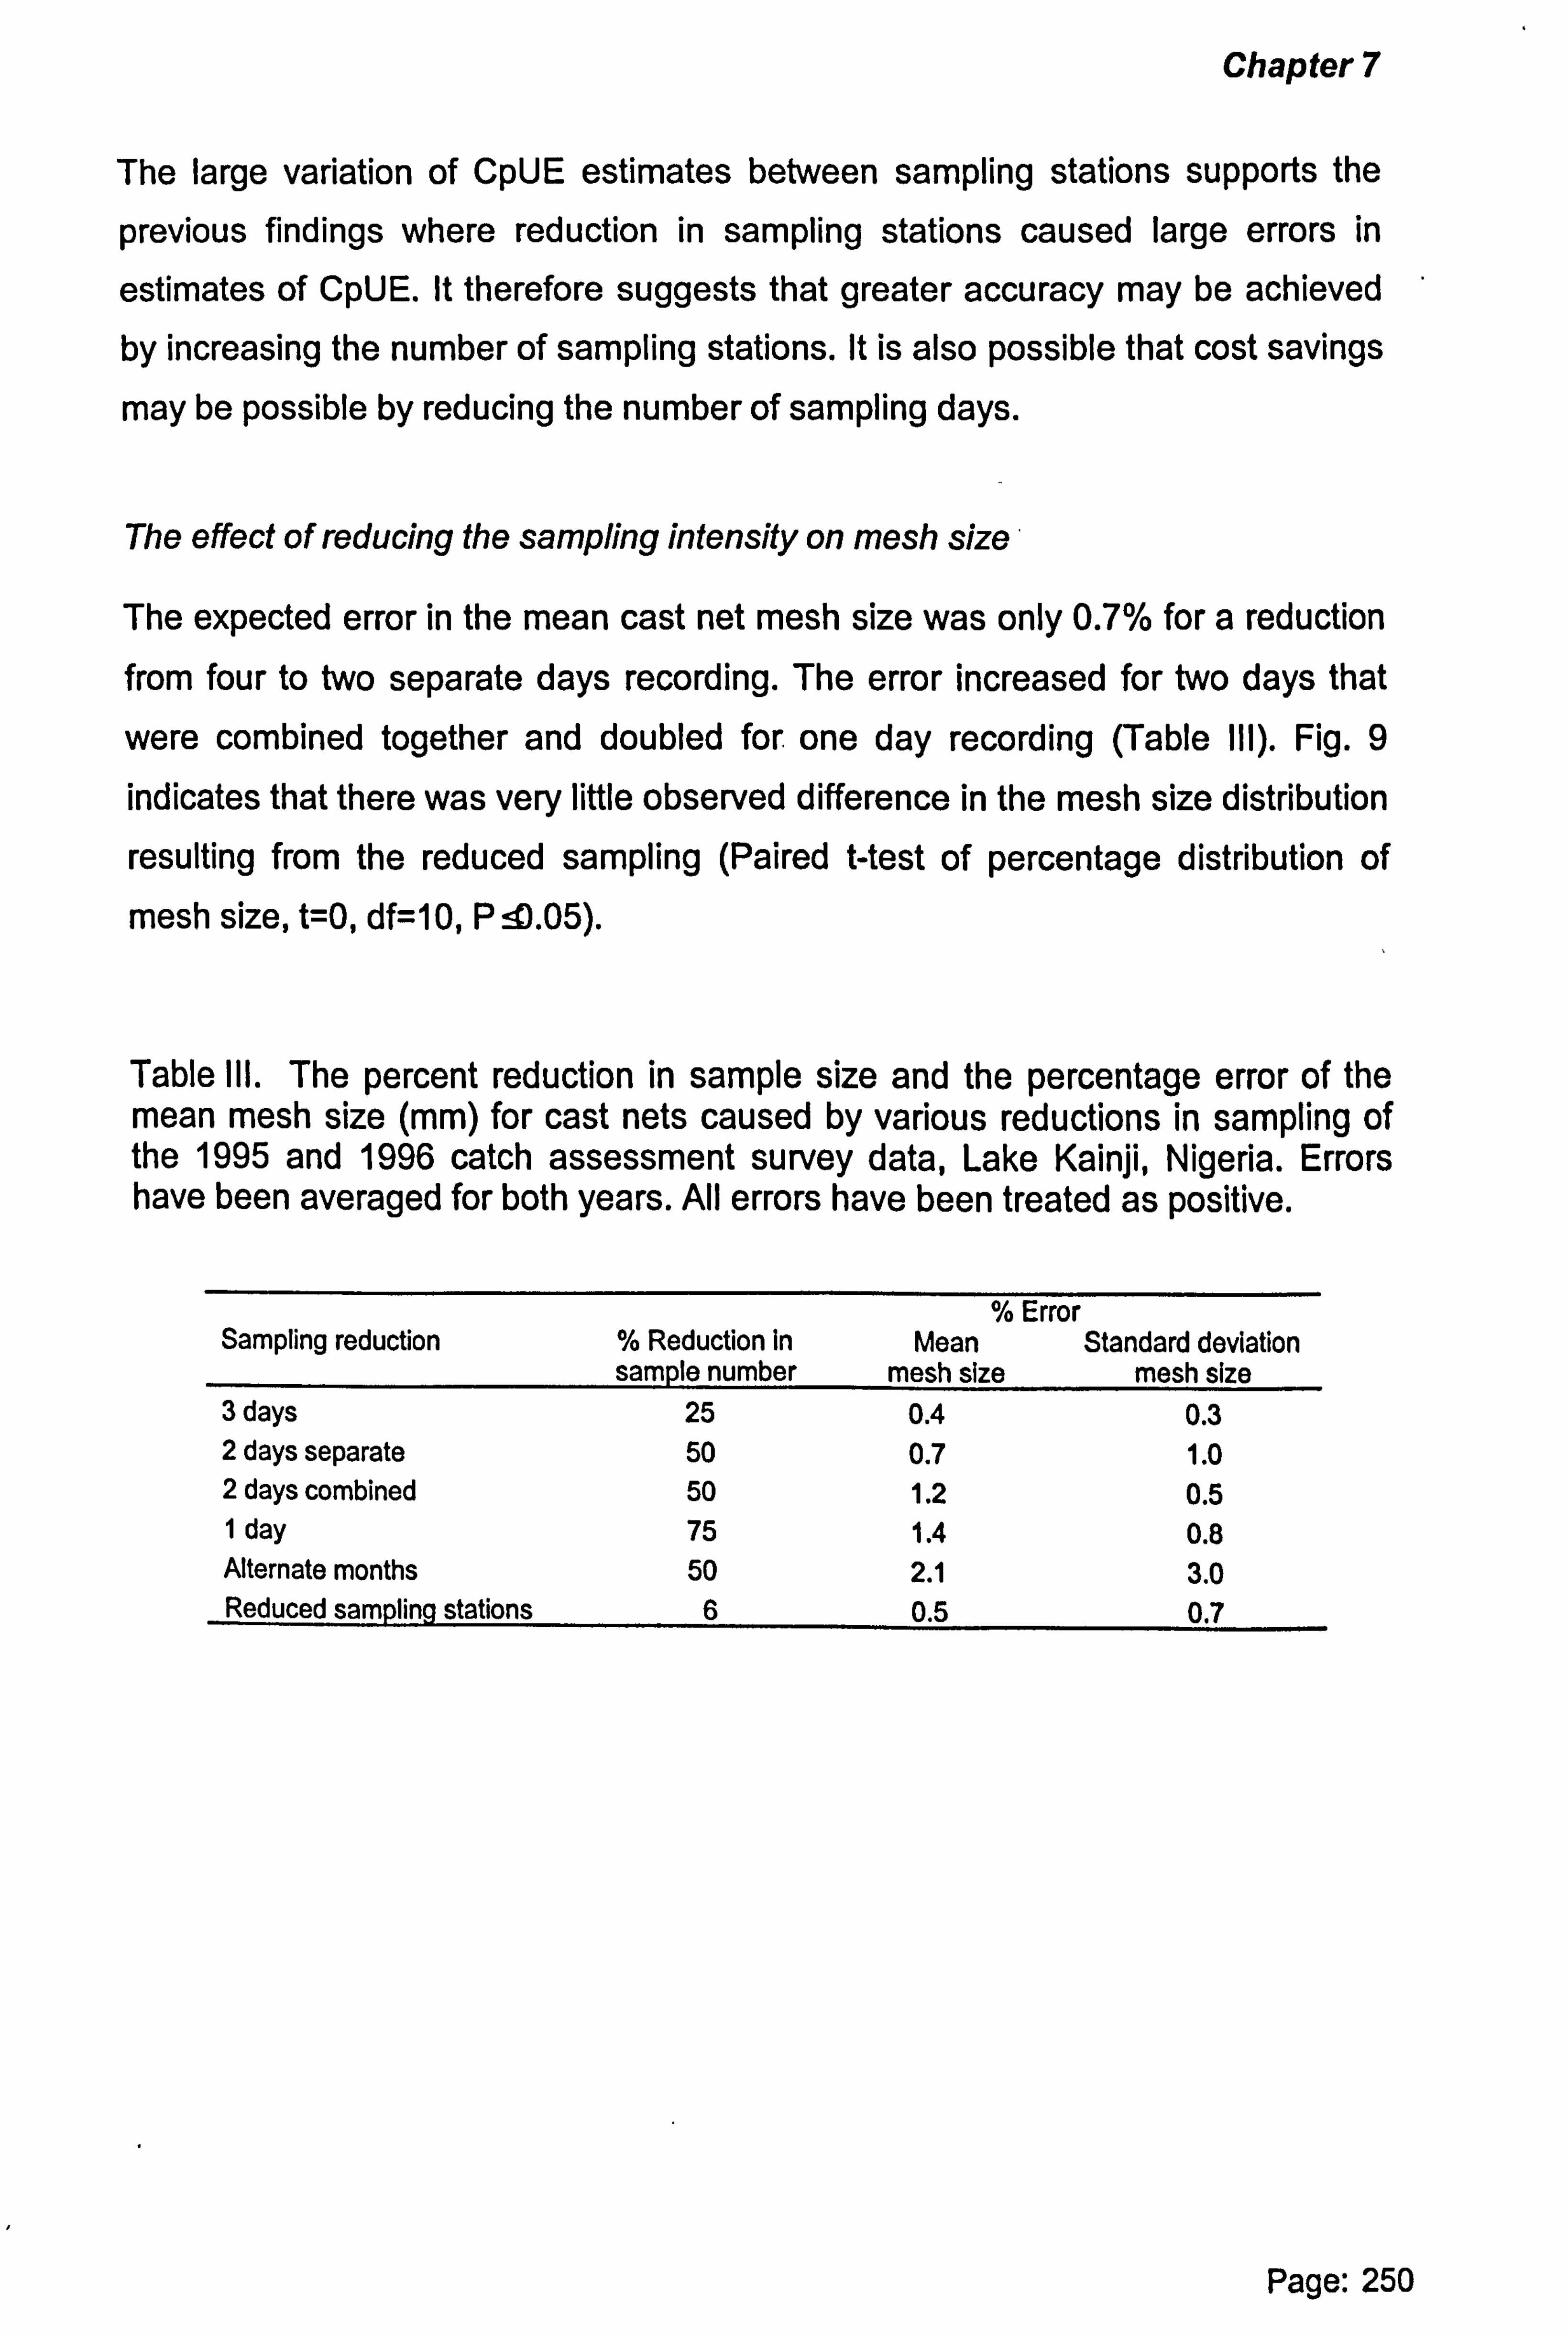
Chapter 7
The large variation of CpUE estimates between sampling stations supports the
previous findings where reduction in sampling stations caused large errors in
estimates of CpUE. It therefore suggests that greater accuracy may be achieved by increasing the number of sampling stations. It is also possible that cost savings
may be possible by reducing the number of sampling days.
The effect of reducing the sampling intensity on mesh size
The expected error in the mean cast net mesh size was only 0.7% for a reduction from four to two separate days recording. The error increased for two days that
were combined together and doubled for one day recording (Table III). Fig. 9 indicates that there was very little observed difference in the mesh size distribution
resulting from the reduced sampling (Paired t-test of percentage distribution of mesh size, t=0, df=10, P x. 05).
Table Ill. The percent reduction in sample size and the percentage error of the mean mesh size (mm) for cast nets caused by various reductions in sampling of the 1995 and 1996 catch assessment survey data, Lake Kainji, Nigeria. Errors have been averaged for both years. All errors have been treated as positive.
Sampling reduction % Reduction in sample number
% Error Mean
mesh size Standard deviation
mesh size 3 days 25 0.4 0.3 2 days separate 50 0.7 1.0 2 days combined 50 1.2 0.5 1 day 75 1.4 0.8 Alternate months 50 2.1 3.0 Reduced sampling stations 6 0.5 0.7
Page: 250
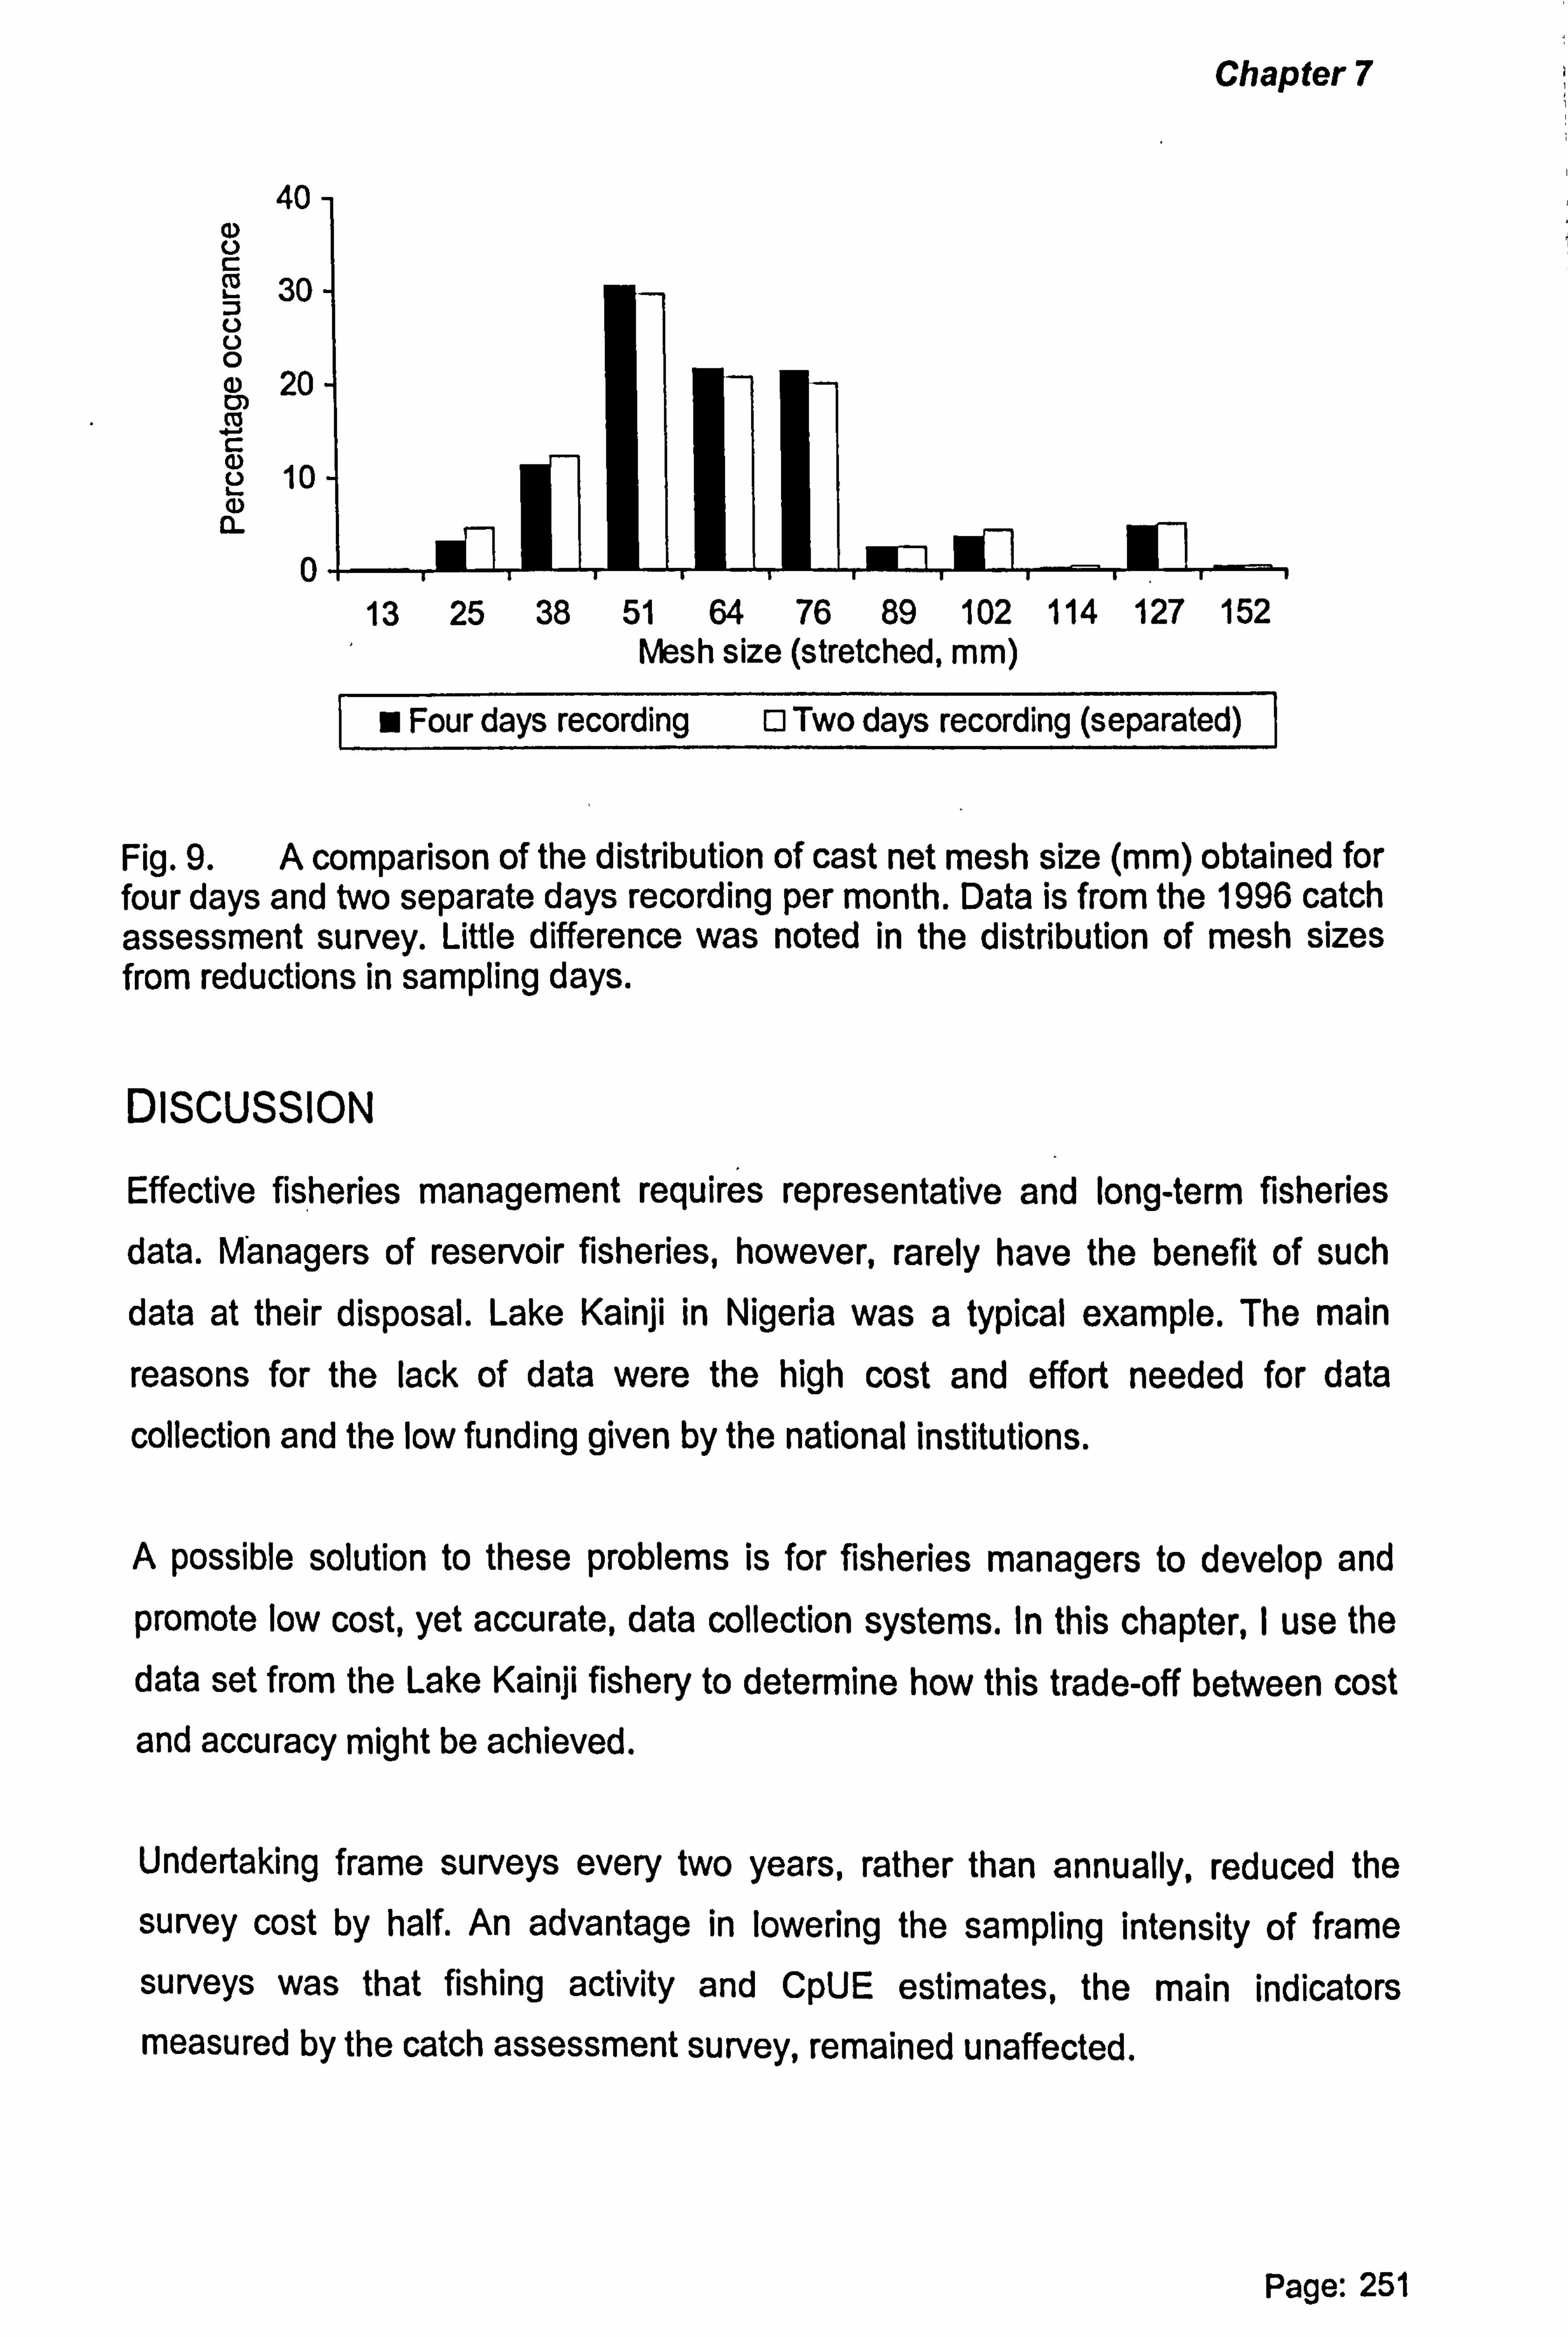
Chapter 7
40 N U
30
O 20
cß C e 10 a) a
0
Fig. 9. A comparison of the distribution of cast net mesh size (mm) obtained for four days and two separate days recording per month. Data is from the 1996 catch assessment survey. Little difference was noted in the distribution of mesh sizes from reductions in sampling days.
DISCUSSION
Effective fisheries management requires representative and long-term fisheries
data. Managers of reservoir fisheries, however, rarely have the benefit of such data at their disposal. Lake Kainji in Nigeria was a typical example. The main
reasons for the lack of data were the high cost and effort needed for data
collection and the low funding given by the national institutions.
A possible solution to these problems is for fisheries managers to develop and
promote low cost, yet accurate, data collection systems. In this chapter, I use the data set from the Lake Kainji fishery to determine how this trade-off between cost and accuracy might be achieved.
Undertaking frame surveys every two years, rather than annually, reduced the
survey cost by half. An advantage in lowering the sampling intensity of frame
surveys was that fishing activity and CpUE estimates, the main indicators
measured by the catch assessment survey, remained unaffected.
Page: 251
13 25 38 51 64 76 89 102 114 127 152 Mesh size (stretched, mm)
Four days recording 0 Two days recording (separated)

Chapter 7
The Lake Kainji example, however, indicated that reducing the number of frame
surveys should only be considered when the number of fishing gears are either
constant or increase/ decrease at a constant rate. For example, sudden changes
resulting from migration in or out of the fishery, the development of new fisheries
or implementation of management regulations will cause annual gear numbers to
fluctuate and so affect the accuracy of final yield estimates. However, the
collection of fisheries data is usually undertaken in order to evaluate or monitor impacts of management intervention, changes in annual gear numbers are therefore often to be expected.
For the Lake Kainji fishery, there was a large variation in gear numbers recorded each year. This was caused both by an increasing rate of decline in the number of gears owned by the fisherfolk, as well as, the implementation of new management regulations (du Feu, 2003b). A reduction in the frequency of the annual frame
survey is therefore not recommended. The case for not reducing the number of frame surveys is supported by Mandima (1996) for Lake Kariba who suggested that the frequency should be increased due to the constantly changing fishery that
caused the annual frame survey to quickly become outdated.
Reductions in sampling intensity of the catch assessment survey had little effect on the final estimate of total monthly yield due to negative and positive errors, mainly of CpUE and to some extent fishing activity, from canceling each other during the final compilation of yield. To understand the effect of reduced sampling it was therefore necessary to investigate the separate components of the yield equation; fishing activity and CpUE.
Estimates of fishing activity by gear type were found to vary less than CpUE. This
was due to fishing entrepreneurs fishing almost every day and using most of the fishing gears they owned. Meredith & Malvestuto (1991) made a similar finding when sampling downstream of Lake Kainji along the River Niger.
Page: 252
Chapter 7
Using alternate months sampling produced a large error in fishing activity and
CpUE estimates. This was caused by the high seasonality of the fishery. A further
factor deterring such sampling is that data recorders are likely to perform better if
they sample on a routine monthly schedule.
Reducing the number of sampling days did not produce any large noted difference
in estimates of CpUE. The reduction from four to two days equated to a sampling
intensity of 0.5% of all entrepreneurs for fishing activity and 0.25% for CpUE.
Corresponding survey costs were reduced by 40%.
The finding is perhaps understandable, given that fisherfolk resident in the same
sampling village will tend to use similar fishing methods and fish comparable areas (governed by daily paddling distances to fishing grounds). The abundance of fish
(due to migration or spawning etc. ) is also not likely to drastically change within the
monthly recording period.
The error noted for CpUE and fishing activity increased as the number of sampling
stations were reduced. The higher error was probably due to the differing
topography and the variable fishing patterns used between lake areas. This was
particularly the case for stations located within vegetated floodplain fisheries, in
which intensive and differing types of fishing is undertaken. It is therefore important for designers of sampling strategies to increase sampling intensity in
such areas.
In light of the diversity of reservoir fisheries and the variability caused by a
reduction in the number of sampling stations, it is recommended that a high
number of sampling stations and a low number of sampling days in each is used. This agrees with a general theory of sampling which states that the variability between sampling stations is almost always greater than within the stations themselves (Lohr, 1999).
Page: 253

Chapter 7
The use of local villagers (rather than salaried staff from the public sector) as data
recorders appears to be increasing. Examples where village based recorders have
been used include the Bangweulu Swamps, Zambia (Tichler et al., 1998),
Sri Lankan reservoirs (De Silva, 1988) and Lake Kariba (Mandima, 1996).
Using villagers to collect data may reduce the problems of the low motivation of data collectors from the public sector, the dual role of officers being enforcers and data collectors and the lack of understanding of data collection and poor
cooperation by the fisherfolk. Greater participation by the fisherfolk may also lessen data fabrication by recorders and so make further reductions in sampling intensity and cost possible. For this to be achieved, proper selection and training
of recorders and subsequent supervision, spot checks and data verification (i. e. similar to the procedures as for the public sector data collectors) must be
undertaken. Participation of villagers also support the ideals of community-based
management approaches and the provision of village based employment.
Any recommended sampling strategy depends on fisherfolk giving accurate information to data recorders. This may prove difficult, especially when fisherfolk
associate data collection with donor assistance projects. Fisherfolk must understand the need for accuracy when responding to survey questions. During
the frame survey of Lake Kainji, fishing entrepreneurs initially overstated the gears they owned, believing that the project would give 'handouts' of gears on a replacement basis. The issuing of fishing licenses had the reverse effect and encouraged some fishing entrepreneurs to understate numbers of gears, thinking that their fishing gears would be licensed in future. Mandima (1996) reported that
catch quotas also caused fisherfolk to under state catch in Lake Kariba.
Methods by which estimates from fisheries surveys can be verified are therefore
necessary and this may result in lower sampling intensity being possible. Verification of results from frame surveys may be achieved by counting the
number fishing canoes. In the Lake Kainji fishery, the number of canoes and fishing gears were correlated and counts of canoes provided an approximate verification of the total number of existing gears. The accuracy of this approach will be greater for fisheries which are not diverse and where fisherfolk each use approximately the same number of gears and gear types.
Page: 254

Chapter 7
In spite of the suggested rationalised sampling strategy, it remains that data
collection activities for reservoir fisheries are inherently expensive for national institutions to sustain. A further possible approach, therefore, may be sample a few representative reservoirs and extrapolate results to the total reservoir area. Likely variation in yields caused by differing limnology, topography, primary
productivity, fish assemblages and fishing patterns and pressure between differing
reservoirs, however, necessitates caution.
Sugunan (1997) suggested that funding for data collection may increase if the decision makers in national institutions fully acknowledge the social importance
and role in food security, as well as, the monetary contribution made by the fishery. Increasing budgets is, however, likely to be difficult given the often limited finance and other pressing needs of developing countries.
Designing and maintaining a fisheries monitoring system, particularly for reservoir fisheries, therefore presents real challenges. In this chapter, I have suggested ways to minimise cost, verify results and have outlined alternative approaches that
may be used. It remains, however, that national governments have a responsibility to ensure proper management (and associated data collection) of the fish
resources in reservoirs created by them, especially for those people affected by its
construction. If donor assistance is sought then host governments also have a duty to ensure that the donor projects undertake a full evaluation of the fishery as part of their envisaged program of assistance.
Finally, a functioning and accurate monitoring system for reservoir fisheries is
worthless unless the findings are used to establish and implement successful management of the resource.
Page: 255
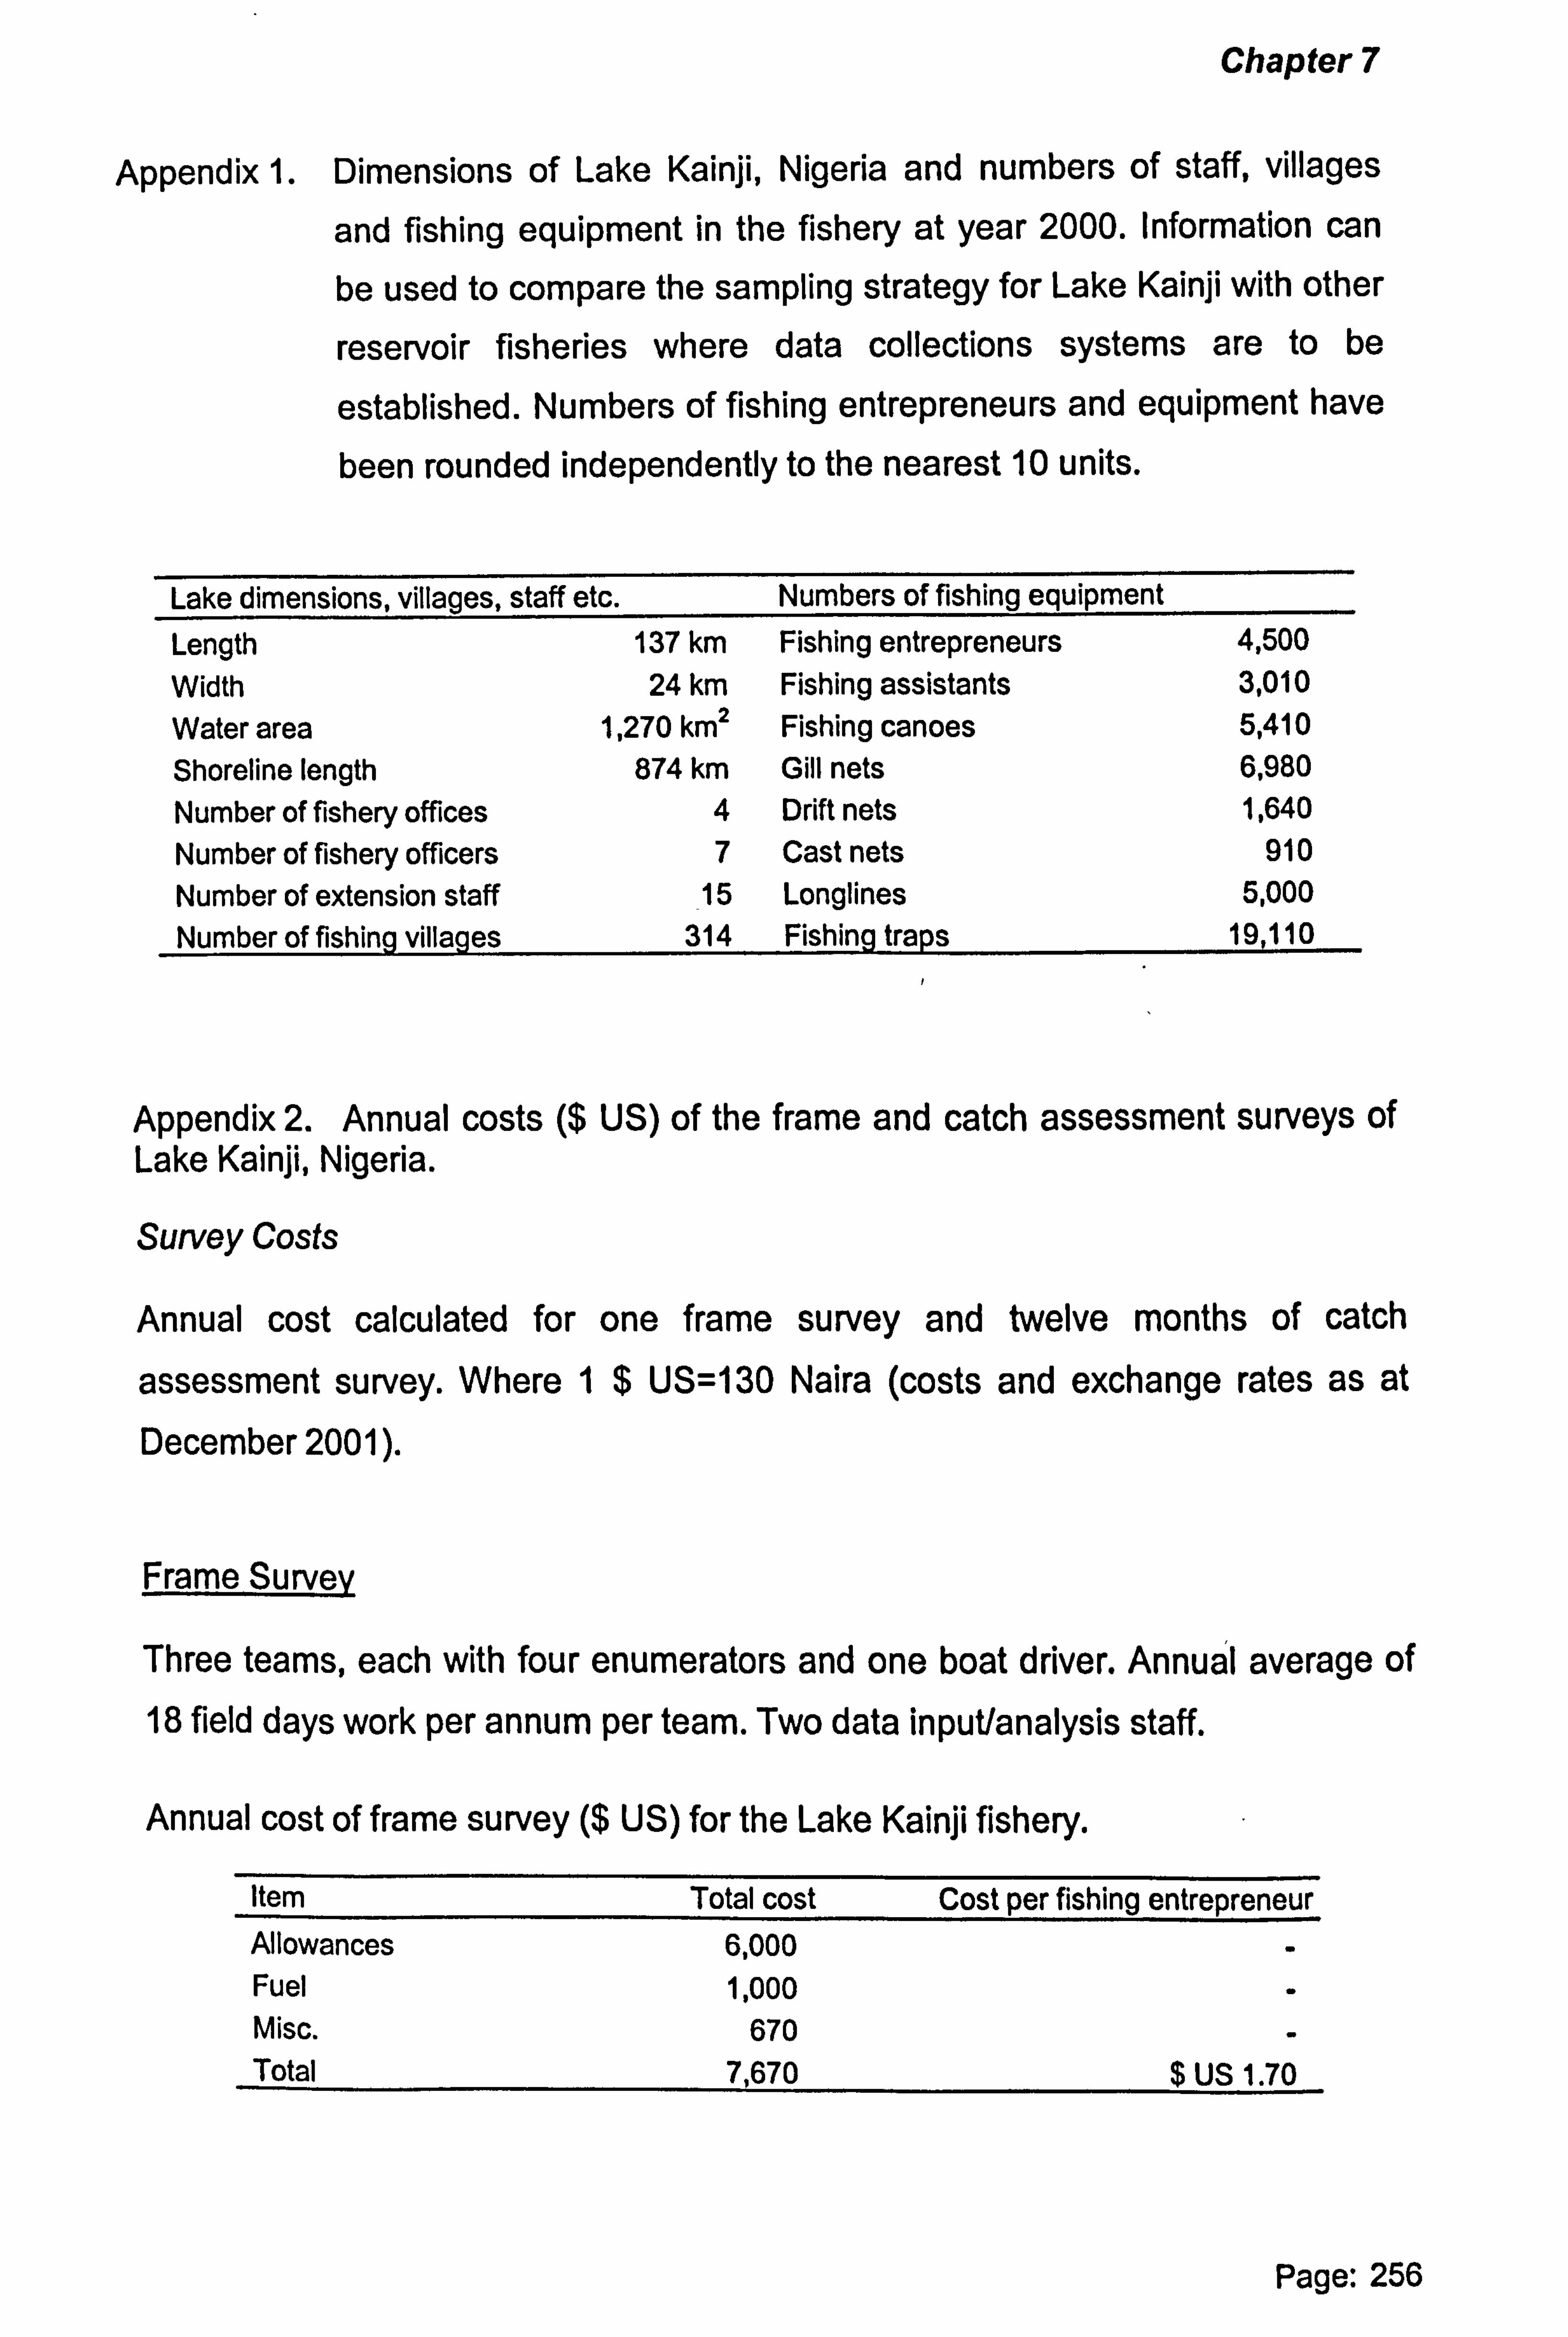
Chapter 7
Appendix 1. Dimensions of Lake Kainji, Nigeria and numbers of staff, villages
and fishing equipment in the fishery at year 2000. Information can
be used to compare the sampling strategy for Lake Kainji with other
reservoir fisheries where data collections systems are to be
established. Numbers of fishing entrepreneurs and equipment have
been rounded independently to the nearest 10 units.
Lake dimensions, villages, staff etc. Numbers of fishing equipment Length 137 km Fishing entrepreneurs 4,500 Width 24 km Fishing assistants 3,010 Water area 1,270 km2 Fishing canoes 5,410 Shoreline length 874 km Gill nets 6,980 Number of fishery offices 4 Drift nets 1,640 Number of fishery officers 7 Cast nets 910 Number of extension staff 15 Longlines 5,000 Number of fishing villages 314 Fishing traps 19,110
Appendix 2. Annual costs ($ US) of the frame and catch assessment surveys of Lake Kainji, Nigeria.
Survey Costs
Annual cost calculated for one frame survey and twelve months of catch assessment survey. Where 1$ US=130 Naira (costs and exchange rates as at December 2001).
Frame Survey
Three teams, each with four enumerators and one boat driver. Annual average of 18 field days work per annum per team. Two data input/analysis staff.
Annual cost of frame survey ($ US) for the Lake Kainji fishery.
Item Total cost Cost per fishing entrepreneur Allowances 6,000 - Fuel 1,000 - Misc. 670 - Total 7,670 $ US 1.70
Page: 256
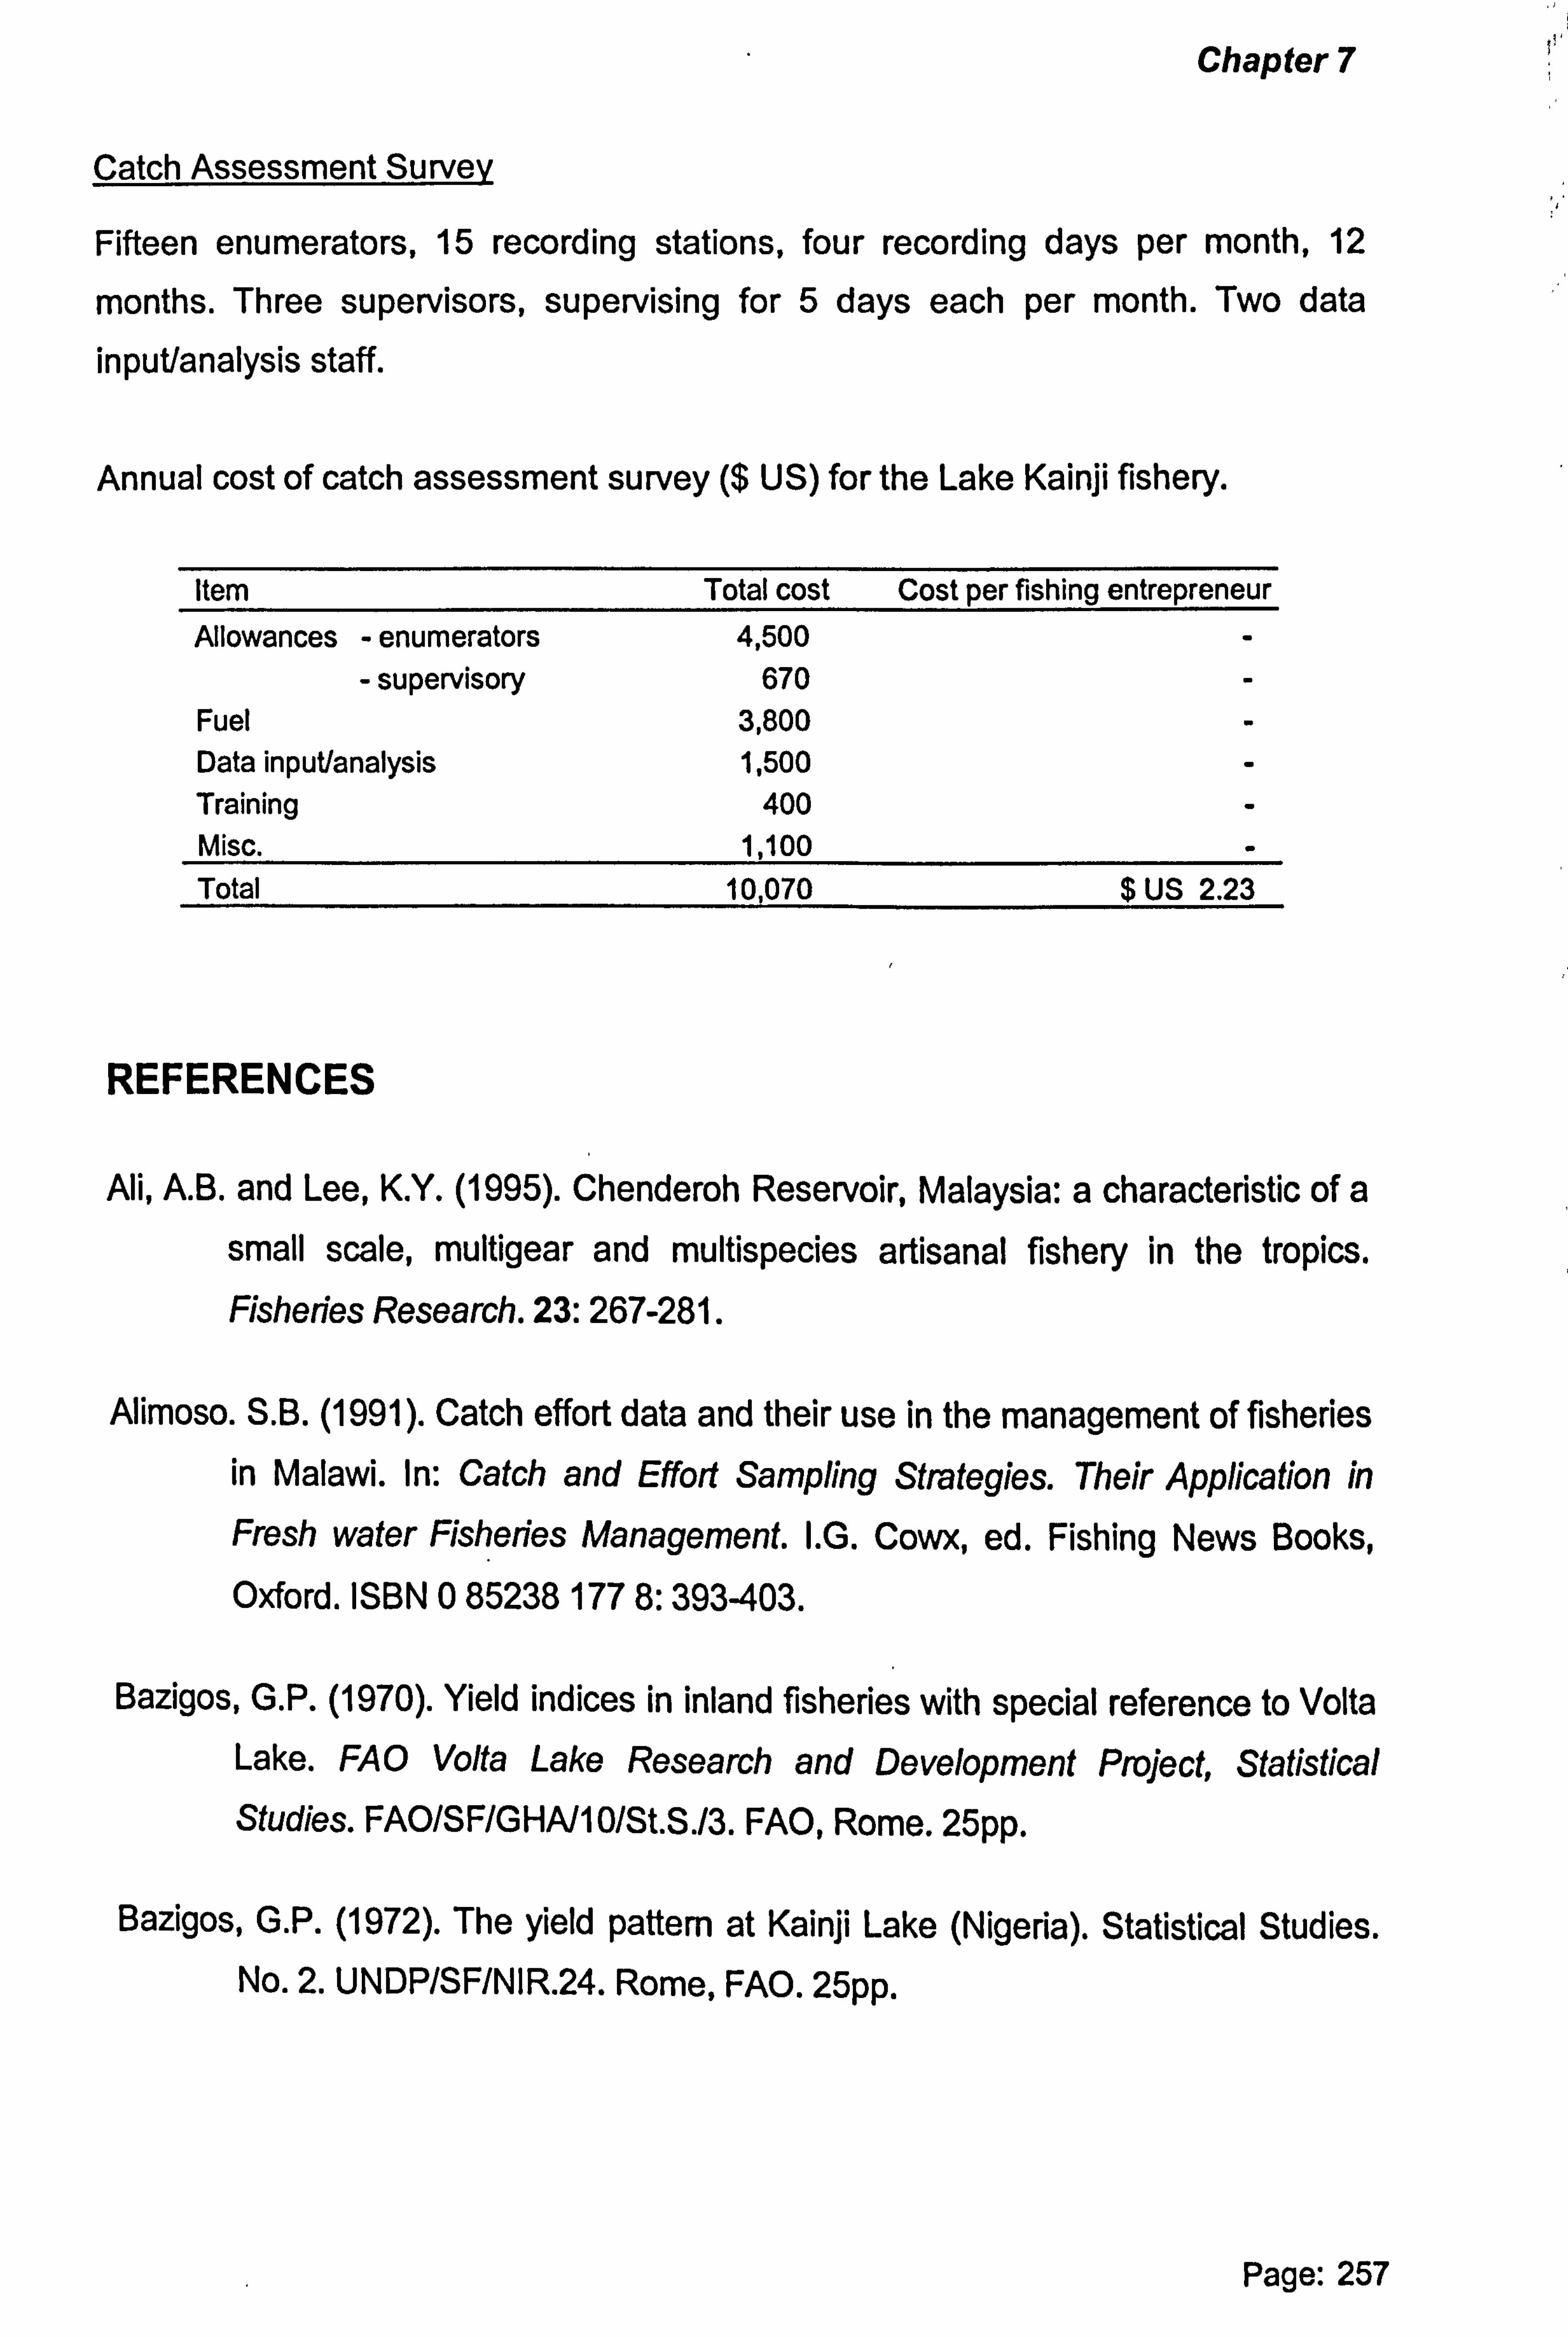
Chapter 7
Catch Assessment Survey
Fifteen enumerators, 15 recording stations, four recording days per month, 12
months. Three supervisors, supervising for 5 days each per month. Two data
input/analysis staff.
Annual cost of catch assessment survey ($ US) for the Lake Kainji fishery.
Item Total cost Cost per fishing entrepreneur Allowances - enumerators 4,500 -
- supervisory 670 - Fuel 3,800 - Data input/analysis 1,500 - Training 400 - Misc. 1,100 - Total 10,070 $ US 2.23
REFERENCES
Ali, A. B. and Lee, K. Y. (1995). Chenderoh Reservoir, Malaysia: a characteristic of a small scale, multigear and multispecies artisanal fishery in the tropics. Fisheries Research. 23: 267-281.
Alimoso. S. B. (1991). Catch effort data and their use in the management of fisheries in Malawi. In: Catch and Effort Sampling Strategies. Their Application in Fresh water Fisheries Management. I. G. Cowx, ed. Fishing News Books, Oxford. ISBN 0 85238 177 8: 393-403.
Bazigos, G. P. (1970). Yield indices in inland fisheries with special reference to Volta Lake. FAO Volta Lake Research and Development Project, Statistical Studies. FAO/SF/GHA/10/St. S. /3. FAO, Rome. 25pp.
Bazigos, G. P. (1972). The yield pattern at Kainji Lake (Nigeria). Statistical Studies. No. 2. UNDP/SF/NIR. 24. Rome, FAQ. 25pp.
Page: 257
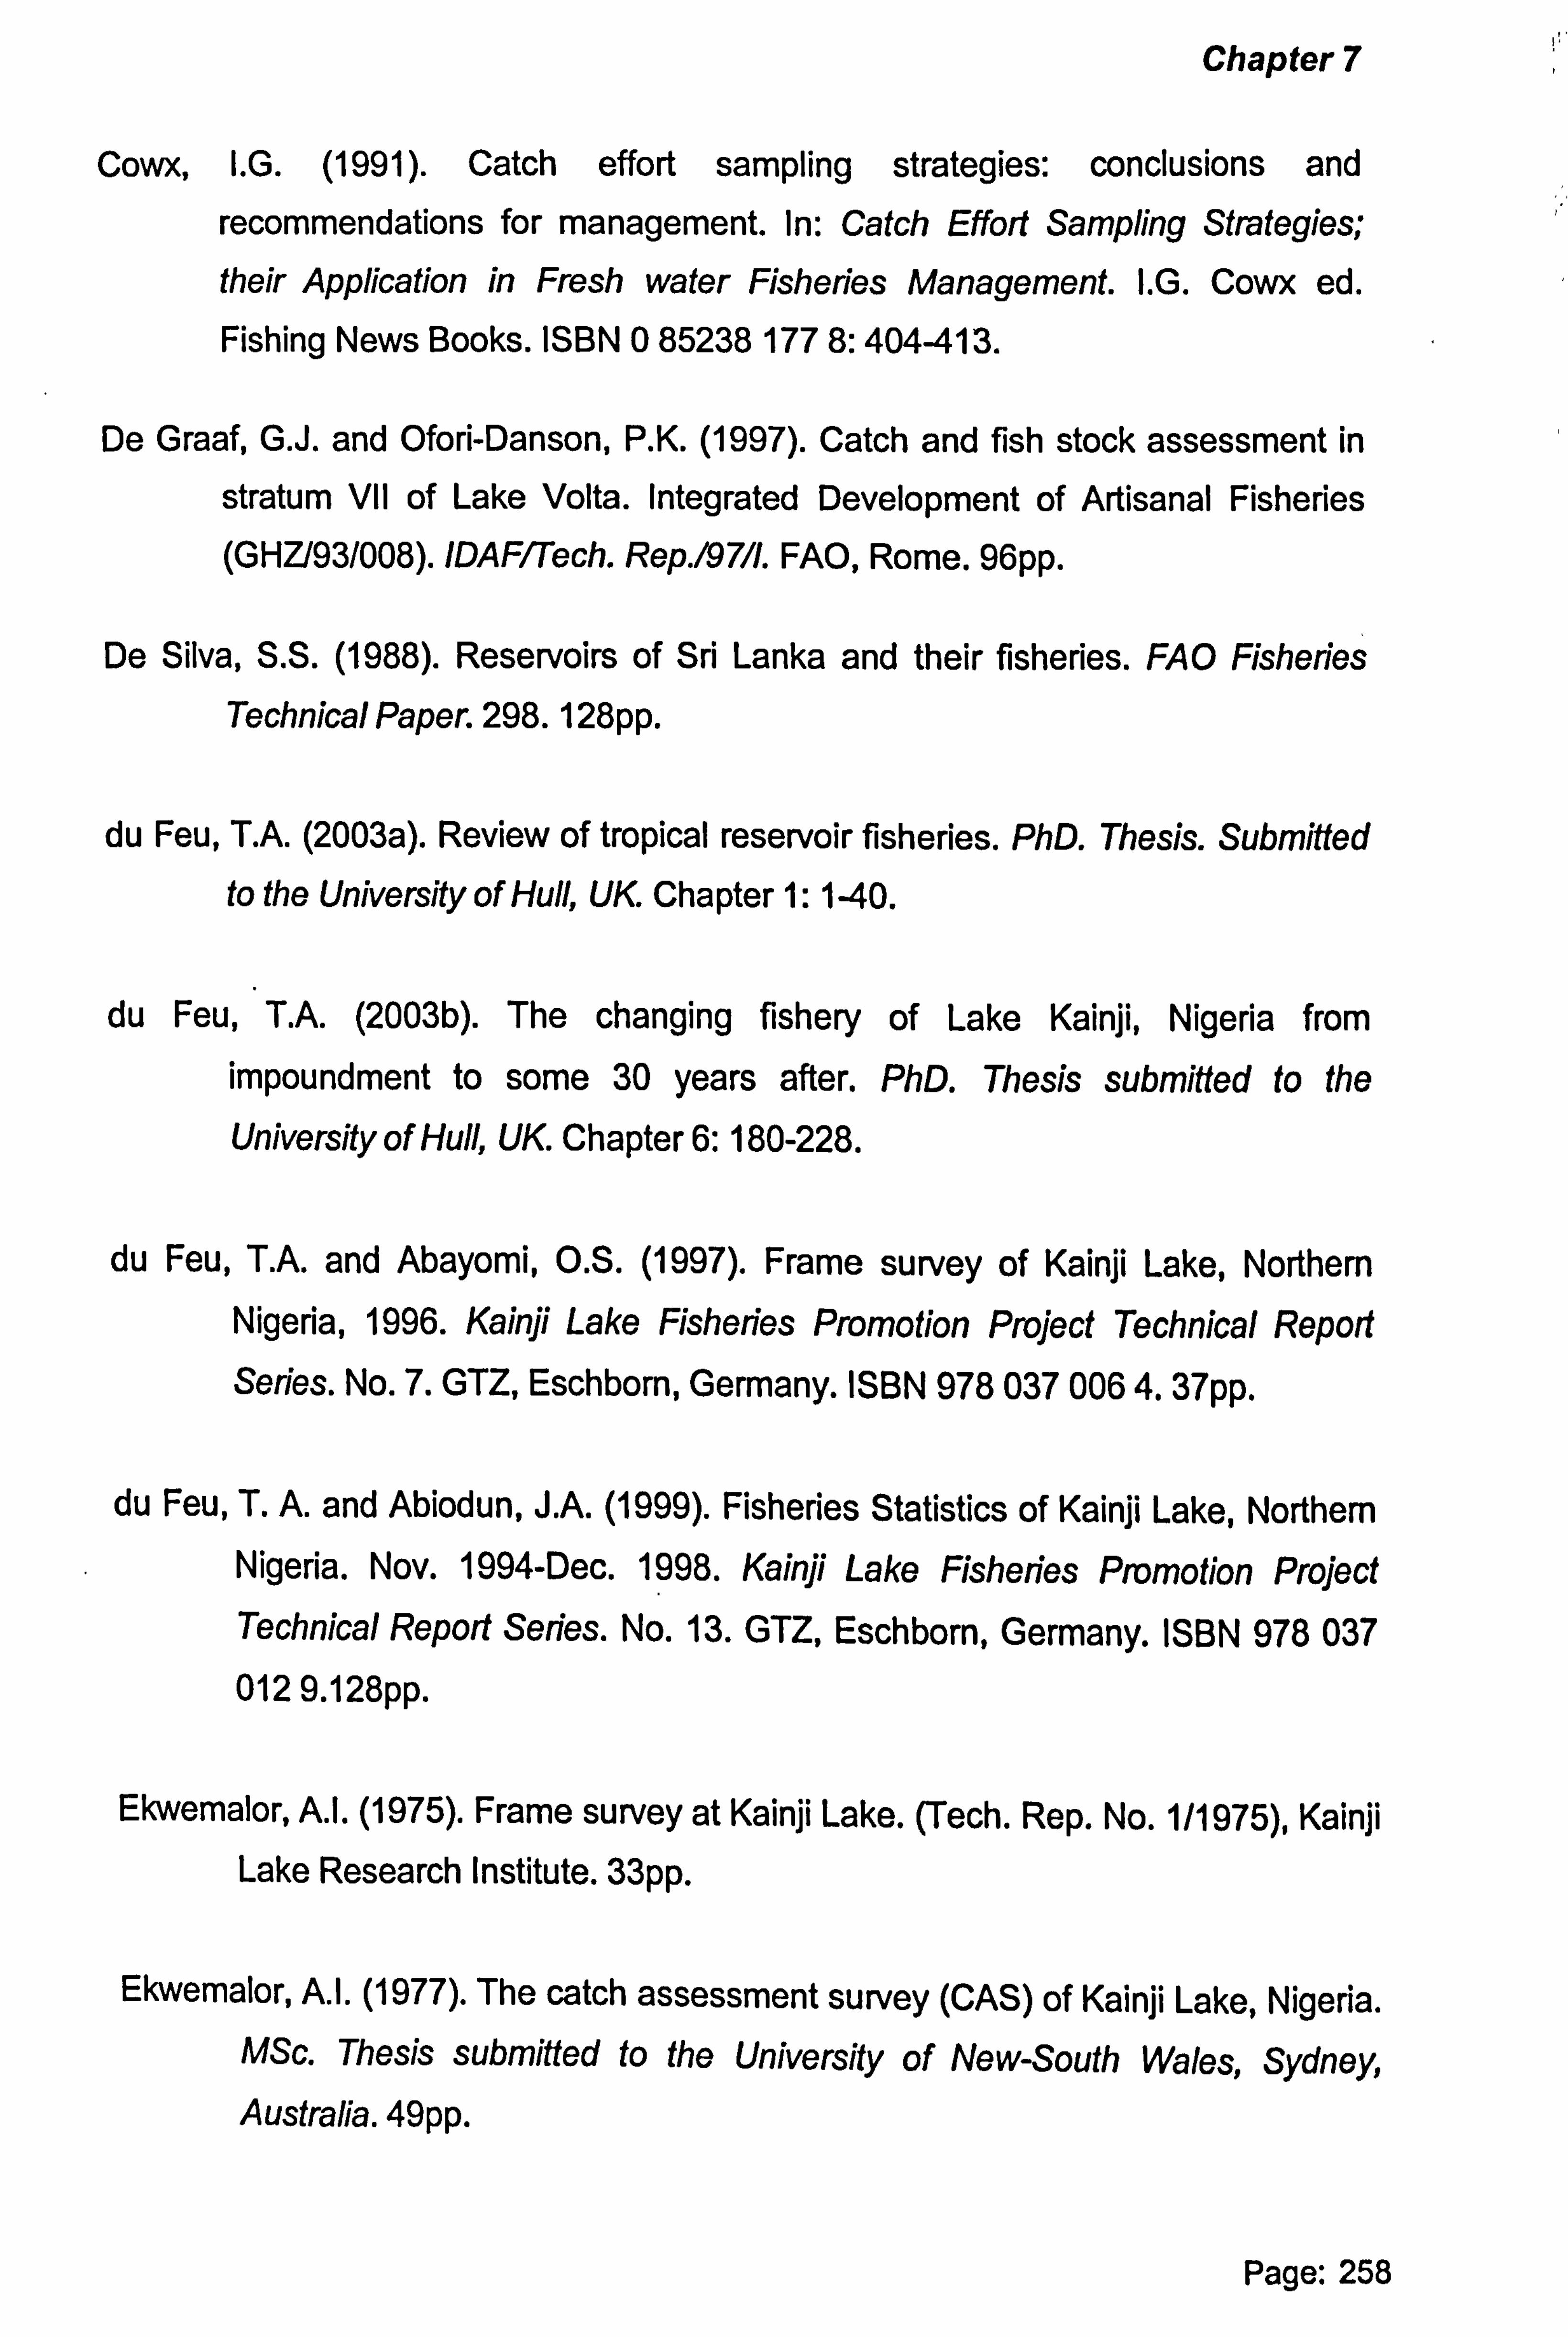
Chapter 7
Cowx, I. G. (1991). Catch effort sampling strategies: conclusions and
recommendations for management. In: Catch Effort Sampling Strategies;
their Application in Fresh water Fisheries Management. I. G. Cowx ed. Fishing News Books. ISBN 0 85238 177 8: 404-413.
De Graaf, G. J. and Ofori-Danson, P. K. (1997). Catch and fish stock assessment in
stratum VII of Lake Volta. Integrated Development of Artisanal Fisheries
(GHZ/93/008). IDAFifech. Rep. /97/1. FAO, Rome. 96pp.
De Silva, S. S. (1988). Reservoirs of Sri Lanka and their fisheries. FAO Fisheries Technical Paper. 298.128 p p.
du Feu, T. A. (2003a). Review of tropical reservoir fisheries. PhD. Thesis. Submitted to the University of Hull, UK. Chapter 1: 1-40.
du Feu, T. A. (2003b). The changing fishery of Lake Kainji, Nigeria from impoundment to some 30 years after. PhD. Thesis submitted to the University of Hull, UK. Chapter 6: 180-228.
du Feu, T. A. and Abayomi, O. S. (1997). Frame survey of Kainji Lake, Northern Nigeria, 1996. Kainji Lake Fisheries Promotion Project Technical Report Series. No. 7. GTZ, Eschbom, Germany. ISBN 978 037 006 4.37pp.
du Feu, T. A. and Abiodun, J. A. (1999). Fisheries Statistics of Kainji Lake, Northern Nigeria. Nov. 1994-Dec. 1998. Kainji Lake Fisheries Promotion Project Technical Report Series. No. 13. GTZ, Eschborn, Germany. ISBN 978 037 012 9.128pp.
Ekwemalor, A. I. (1975). Frame survey at Kainji Lake. (Tech. Rep. No. 1/1975), Kainji Lake Research Institute. 33pp.
Ekwemalor, A. I. (1977). The catch assessment survey (CAS) of Kainji Lake, Nigeria. MSc. Thesis submitted to the University of New-South Wales, Sydney, Australia. 49pp.
Page: 258

Chapter 7
Ekwemalor, A. I. (1978). Frame survey at Kainji Lake, April 1978. Report submitted to
the Kainji Lake Research Institute. 41 pp.
Entz, B. A. G. (1984). A synthesis and evaluation of activities of FAO/UNDP projects
on five African man-made lakes: Kainji, Kariba, Kossou, Nasser-Nubia and
Volta. FAO Fisheries Circular. No. 774.34pp.
Goeltenboth, F. and Kristyanto, A. I. A. (1994). Fisheries in the Rawa Pening
Reservoir, Java, Indonesia. International Revue Gesamten Hydrobiology.
79. (l): 113-129.
Gurgel, J. J. S. and Fernando, C. H. (1994). Fisheries in semi-arid Northeast Brazil
with special reference to the role* of tilapia. International Revue Gesamten
Hydrobiology. 79: 77-94.
Ita, E. O. (1998). The current status of fish stocks and fisheries in Kainji Lake, 1996.
An internal report of the Kainji Lake Fisheries Promotion Project. GTZ,
Eschbom, Germany. 45pp.
Lohr. S. L. (1999). Sampling design and analysis. Brooks/Cole Publishing Company,
Pacific Grove, California 93950, USA. ISBN 0 534 35361 4.494pp.
Mandima, J. J. (1996). Limitations of catch and effort data collection methods used for
inland fisheries in the SADC region, with particular reference to Zimbabwe.
In: Stock Assessment in Inland Fisheries. Cowx, I. G. [ed. ]. Fishing News
Books, Oxford. ISBN 0 85238 224 3.27: 368-377.
Meredith, E. K. and Malvestuto, S. P. (1991). An evaluation of survey designs for the
assessment of effort, catch rate and catch for two contrasting river fisheries.
In: Catch Effort Sampling Strategies; their Application in Fresh water Fisheries Management. I. G. Cowx ed. Fishing News Books. ISBN 0 85238
177 8: 223-232.
Page: 259
Chapter 7
Orach-Meza. F. L. (1991). Statistical sampling methods for improving the catch
assessment of lake fisheries. In: Catch Effort Sampling Strategies; their
Application in Fresh water Fisheries Management. I. G. Cowx ed. Fishing
News Books. ISBN 0 85238 177 8: 323-334.
Pauly, D. (1987). Studying single-species dynamics in a tropical multispecies
context. In: Theory and management of tropical fisheries. (eds.. D. Pauly and G. I. Murphy). ICLARM Conference Proceedings. 9: 33-65.
Petr. T. (1985). Inland fisheries in multiple-purpose river basin planning and development in tropical Asian countries. Three case studies. FAO Fisheries
Technical Paper. 265 FIRI/T 265.
Pomeroy, R. S., Pollnac, R. B., Katon, B. M. and Predo, C. D. (1997). Evaluating factors contributing to the success of community-based coastal resource
management: the Central Visayas Regional Project-1, Philippines. Ocean &
Coastal Management. 36.1-3: 97-120.
Quirös, R. (1998). Reservoir stocking in South America, an evaluation. In: Inland
Fishery Enhancements. Papers presented at the FAO/DFID Expert
Consultation on Inland Fishery Enhancements Dhaka, Bangladesh, 7-11 April 1997. T. Petr ed. FAO Fisheries Technical Paper. No. 374. Rome FAO: 91-118.
Rahman, M. A. (1988). The need for reservoir fishery management in Bangladesh. In: Reservoir Fishery Management and Development in Asia. Proceedings of a Workshop held in Kathmandu, Nepal, 23-28 Nov. 1987. S. S. De Silva ed. Ottawa, Canada. The International Development Research Centre (Canada), ISBN: 0 88936 515 6: 164-168.5pp.
Page: 260
Chapter 7
Rana, K. J., Grainger, R and Crispoldi-Hotta, A. (1998). Current methods and
constraints for monitoring production from inland capture fisheries and
aquaculture. In: Inland Fishery Enhancements. Papers presented at the
FAO/DFID Expert Consultation on Inland Fishery Enhancements Dhaka,
Bangladesh, 7-11 April 1997. T. Petr ed. FAO Fisheries Technical Paper.
No. 374. Rome FAO : 169-181.
Sugunan, V. V. (1997). Fisheries management of small water bodies in seven
countries in Africa, Asia and Latin America, FAO Fisheries Circular. No. 933
FIRI/C933.
Tichier, H. J., Kolding, K. and Chanda, B. (1998). Participation of local fishermen in
scientific fisheries data collection: a case study from the Bangweulu Swamps, Zambia. Fisheries Management and Ecology. 5: 81-92.
Verheust, L. (1998). Obtaining basic information for the enhancement of small water body fisheries: a regional project viewpoint. In: Inland Fishery Enhancements. Papers presented at the FAO/DFID Expert Consultation on Inland Fishery Enhancements Dhaka, Bangladesh, 7-11 April 1997. T. Petr ed. FAO Fisheries Technical Paper. No. 374. Rome FAO: 183-203.
Page: 261

Chapter 8
Chapter 8
Co-management in reservoir fisheries: Lake Kainji, Nigeria- a case study.
ABSTRACT
Management approaches based on centralised government intervention often fail
to stop declines in fish catch and thus fail to help the well-being of dependant
communities. The realisation has caused fisheries managers to seek greater
participation by the communities in the management process. In this chapter, I describe the rationale behind, and development of, community-based
approaches. A case study of Lake Kainji, Nigeria is used to assess the suitability
of co-management approaches for artisanal fisheries in tropical reservoirs. A
management unit comprising of government fisheries staff, Traditional Authorities
and fisherfolk coordinated the approach. Management priorities were to stop the decline in fish catch by banning fishing with beach seine nets and to license
fisherfolk to control long-term levels of fishing effort. A timetable of the
co-management approach is presented. Reasons for the successes and failures of the approach are discussed. The Lake Kainji example is compared to examples of
other co-management approaches in inland fisheries. Problems noted during implementation in the Lake Kainji fishery were the lack of traditional management that existed in the reservoir fishery, the diverse communities, the short project time
scale and the failure of the approach to adapt to change. The findings may be
useful for the planning and implementation of co-management approaches in other tropical reservoirs fisheries.
Key words: co-management; fisheries management; Lake Kainji; management plans; reservoir fishery.
Page: 262
Chapter 8
INTRODUCTION
It is estimated that global population will increase by some 50% during the
25 years up to 2025. The majority of the rise will occur in developing tropical
countries (United Nations, 2001). Fernando & Petr (1994) forecast that global
increases in population will require an extra 60 million tonnes of aquatic products,
if per capita fish protein intake are to be maintained.
Fish yield from inland fisheries is estimated to have increased by some 0.8 million
tonnes annually over the last 20 years (FAOSTAT, 2001). Reservoir fisheries are
an important contributor to this. The ongoing degradation of the environment
(UNEP, 2002), the reduced number of large reservoirs being constructed
(WCD, 2000), the already high use of fish enhancement techniques in Asia and
the continued rise in fishing effort coupled with use of detrimental fishing
techniques suggests that such increases in yield cannot continue indefinitely.
Reservoirs remain open access, the number of landless poor is becoming greater
and fisherfolk remain among the poorest of the poor (Viswanathan, 1999).
Management action therefore appears to be essential.
History of fishery management Unmanaged fisheries
The majority of reservoir fisheries can be referred to as 'the commons'. This
implies that they are not owned but are shared by a group of users. As such, they
are mainly 'open access' with any person being free to exploit their resources (Raakjarr Nielsen et al., 1995).
The behaviour of individuals under such circumstances has been described by
Hardin (1968) in a theory 'the tragedy of the commons'. Hardin proposed that
individuals have an inherent desire to maximise their own personal profit from a
resource before it is taken by others, and that they will continue to do this even when the well-being of society or the community suffers.
Page: 263
Chapter 8
Despite this, not all open access resources have become overexploited.
Furthermore, other types property regimes such as private, communal and State
property are known to be subject to overexploitation.
Top-down approach: enforcement & extension
The most common type of property rights of large reservoirs is 'State property'. Feeny (1992) described State property as being when government has the
ownership and exploitation rights to the resource. Government therefore has the
responsibility to ensure that regulations protecting the resource are adhered to.
The approach is usually authoritarian, centralised and top-down.
When correctly implemented, approaches of such 'top-down' type management
can provide a quick and effective management of natural resources. In practise, however, the approach has largely failed to result in rational exploitation (Thole & Dodman, 1996; Nathanael & Edirisinghe, 2002). In the case of in tropical
reservoirs fisheries the reasons for this include:
1. Centralised top-down management focuses on objectives relating to the fish
resource and not those of the communities who rely on the fishery (Raakjarr Nielson et al., 2002). Hence, fisherfolk frequently view the top- down approach as being distant, impersonal and extremely bureaucratic.
2. Decisions on the type of fisheries regulations to be implemented are often based on a low understanding of the fishery.
3. The high cost and effort required to regularly patrol and monitor reservoir fisheries usually cannot be sustained by the institutions of developing countries (Nieland et al., 2000). National institutions often question whether such high cost and effort can be justified by the often poor economic returns of the fishery (Roder, 1993).
Page: 264
Chapter 8
4. Patrol and fine activities offer ways by which poorly paid enforcement and
administrating officers can enhance personal income (KLFPP, 1996;
Barbosa & Hartmann, 1998; Neiland et al., 2000a).
5. Dishonesty of involved parties often leads to conflict and non-cooperation,
especially between the fisherfolk and enforcement officers (Mandima, 1996;
Abdullah et al., 1997; Nyikahadzoi & Songore, 1999).
Despite the above failings, the lack of success of top-down management is rarely
questioned by those involved, since all parties usually benefit. For example, bribery often gives enforcement officers a lucrative income (a proportion of which
maybe passed to the decision makers) and the fisherfolk are left to continue destructive fishing practises unhindered. The arrangement only holds for the short- term, before perhaps overfishing and collapse of the fishery occurs.
A consideration is that the past pressures on fish resources have not been as high
as they are at present. The need for proper management has, therefore perhaps,
never been such an urgent priority as it is now.
Increasing pressure on resources, both by the fisherfolk and other users, has led
to more cases of overfishing and has caused outside agencies to become
disenchanted with centralised top-down approaches (Sverdrup-Jensen &
Raakjaer Nielsen, 1997; Raakjaer Nielsen et al., 2002). Managers recognise that
the social, economic and political environment of reservoir fishery management is
unlikely to improve. Alternative management strategies are therefore being
investigated. One example is community-based management.
Page: 265

Chapter 8
Community-based management: origins and concepts
Since the 1970s, other natural resource sectors such as irrigation use, forestry and
wildlife conservation have been placing less attention on the enforcement of
regulations using top-down approaches and have been giving more responsibility for management to the communities (Little, 1994; Western & Wright, 1994;
Robinson & Bennett, 2000). Fishery managers are also recognising that fish
resources cannot be managed effectively without the co-operation and
participation of members of the fishing communities (Pomeroy & Berkes, 1997;
Raakjarr Nielsen et al., 2002).
Central to this, is the notion that the maintenance of infrastructures of the fishing
communities and of decent living conditions of its members are of an equal, or even higher, importance as that of sustaining healthy fish stocks upon which they depend.
A strategy to derive from this process has been to decentralise responsibilities away from the government and to allow almost total control for the management of the resource by the communities; whereby they define their own needs, goals and aspirations and decisions affecting their well-being (Sajise, 1995). The approach is
people centered and community focused and is termed 'community-based fisheries management' (CBFM). Key assumptions to this approach are that the
communities and users of the resource:
1. have the capacity to develop and maintain the CBFM approach.
2. ultimately rely on the resource for their livelihood and have the greatest incentive to ensure that it is managed correctly and sustained.
3. are more likely to be committed and supportive of regulations if they feel some ownership of the fish resource and have a say in the design and implementation of management regulations (Nielson, 1996; Pomeroy & Berkes, 1997; Jentoft et al., 1998; Raakjarr Nielsen et al., 2002).
Page: 266

Chapter 8
4. live and work in the area and have an in depth local knowledge that can
contribute to the design and implementation of regulations and the
monitoring of resources (Pomeroy, 1998; Gorjestani, 2000; Viswanathan
& Ahmed, 2002).
5. can quickly identify offenders and therefore may be best placed to ensure that management regulations are adhered to.
6. if involved in management activities the communities are more easily
engaged in other donor projects activities and that their strength and self- confidence is enhanced (Jentoft, 2000).
Within this process national institutions must be willing to:
1. recognise that previous top-down management of the resource has had limited effect.
2. be willing to stop revenue generating patrol and fine enforcement activities.
3. acknowledge the value of community input in resource management and conflict resolution and be willing to hand over property and management rights to them (Abdullah et al., 1997).
4. work alongside the communities to develop their awareness, knowledge
and capacity for community management approaches.
5. develop a trusting relationship and share resources, information and decision making with the communities.
6. undergo structural and administrative change to support the new CBFM approach.
Page: 267

Chapter 8
The irony is that in inland fisheries the social processes and traditional
management techniques on which these 'community-based' approaches are
founded have sometimes been practised for decades. At first glance, reservoir
fisheries would therefore appear to be an ideal candidate for community-based
management; simply through a re-activation of past traditional processes.
It is clear that this may be far from the truth. Years of successive top-down
management have frequently by-passed the communities and have often
marginalised and eroded the traditional structures that form building blocks for
future CBFM (Abdullah et al., 1997; Nyikahadzoi & Songore, 1999).
A further constraint is that the underlying factors required for CBFM rarely exist (i. e. that the resource is important to local livelihoods, local leaders endorse social justice and resource management objectives, the community is cohesive and that
social structures and values support cooperation).
lt is also becoming increasingly difficult for communities to manage resources in
isolation using pure CBFM approaches. There are many external factors and
requirements of the modern world and government that impact on the
management of reservoir fisheries. These include enabling legislation,
enforcement, prosecution and coordinating monitoring and evaluation activities
and dealing with wider issues such as pollution, sedimentation and pressure or
conflicts arising from other users of reservoir resources.
Problems specific to new reservoirs, as opposed to natural lake fisheries, are that indigenous fisherfolk must learn new fishing techniques for the still water fishery
and that they are often in competition with outside and differing communities of migrant fisherfolk who are attracted to the new fishery.
Page: 268

Chapter 8
More common than forms of pure CBFM (where communities manage resources totally independently of outside authorities) are instances in which the government has some input in the management process. Donor projects are also unlikely to
opt for management involving total CBFM, as such a narrow focus will be unlikely to address management issues arising from outside the fishing communities. This
has led to an approach of CBFM termed co-management.
Co-management: origins and concepts
Fishery managers over the last ten years have started to look towards a management approach using co-management. The approach represents a balance between top-down and pure CBFM. The definition of co-management is 'an approach whereby the responsibility and authority for the management of the fishery is shared within a partnership between the user groups (the fisherfolk),
governmental and non-governmental organisations and other stakeholders or interested parties' (Berkes, 1994; Pomeroy & Williams, 1994; Pomeroy, 1998; Raakjaer Nielsen et al., 2002).
Nielson (1996) stated that ideally government and user groups cooperate as equal partners. Pomeroy & Berkes (1997), however, recognised that in many cases the
role of the government and user group encompass a wide spectrum. These range from instances where the user groups are merely consulted by the management institutions to those in which they design, implement and enforce laws with advice and guidance from the institutions.
According to Nielson (1996) the level of user group involvement depends on the types of management measures being implemented. For example, banning of gears may require a more top-down approach than establishing licensing programs. Sen & Raakjaer-Nielsen (1996) further recognised that the level of community participation may vary according to the stage of the co-management process itself. A further consideration, is that governments are often unwilling to relinquish totally all of the property and management rights to the local communities, and prefer to remain in a position to intervene if needed.
Page: 269
Chapter 8
Co-management of reservoir fisheries offers specific challenges. Examples of the
approach exist in Sri Lanka (Medagama, 1989; Amarasinghe & De Silva, 1999;
Nathanel & Edirisighe, 2002), Lake Kariba and reservoirs in Zimbabwe
(Westerlund, 1993; Machongela et al., 1996; Sverdrup-Jensen & Raakjarr Nielsen,
1997; Malasha 1999; Nyikahadzoi & Songore, 1999), reservoirs in Brazil (Barbosa
& Hartmann, 1998) and Thac Ba Reservoir in Vietnam (Viswananthan & Ahmed,
2002) and Chenderoh Reservoir in Malaysia (Ali, 1996).
In this chapter, I assess the rationale behind, and the implementation of a
co-management approach that was developed for the reservoir fishery of Lake
Kainji, Nigeria. Problems and successes of the approach, particularly those
relating to the implementation of co-management in fisheries in tropical reservoirs,
are discussed.
LAKE KAINJI, NIGERIA: A CASE STUDY IN COMMUNITY
INVOLVEMENT IN FISHERY MANAGEMENT. The co-management approach was developed and implemented during a nine-
year technical cooperation project the 'Nigerian-German (GTZ) Kainji Lake Fisheries Promotion Project (KLFPP)' that commenced in 1993. The objective of the project was that 'a well-designed, yet workable, management plan was developed and implemented that maximised the participation and involvement by
the communities' (KLFPP, 1996).
Management issues, noted during the life-time of the KLFPP, were that:
1. The majority of fishing gears targeted small-sized fish.
2. The total lake yield had declined. Falling beach seine catches were mainly responsible.
3. The daily income from fishing had reduced.
4. The average number of fishing gears owned by each entrepreneurs had declined.
5. Migration of fisherfolk out of the fishery had increased.
6. Conflict between government fishery officers and the fisherfolk occurred.
Page: 270
Chapter 8
Two priority areas of management were developed to stabilise the decline in fish
catch and to regulate the level of future fishing effort. These were the ban on fishing with beach seines and the licensing of fishing entrepreneurs and
assistants.
Timetable of the KLFPP and the co-management approach
1993: Start of the KLFPP.
1993-1996: Orientation phase of the KLFPP: intensive collection of fishery and socio-economic data.
1994: Start of community participation in the clearance of water hyacinth to
assess the most suitable form of CBFM for the Lake Kainji area.
1995: Co-management approach recommended by the KLFPP.
1996: Lake Kainji fisheries management plan finalised.
1996: Management plan ratified by the State Government and included as part of their Fisheries Edicts.
1996: 'Kainji Lake Fisheries Management and Conservation Unit' formed (KLFMCU).
1996: Two priority management areas identified (ban on beach seines and licensing).
1996-1999: Implementation phase of the KLFPP: implementation of the co-management approach.
1999-2002: Handover phase of the KLFPP: handover of the co-management approach to national institutions.
Oct. 2002: Closure of the KLFPP, activities continued by the KLFMCU.
Page: 271
Chapter 8
Testing the CBFM approach for Lake Kainji
Research results of the KLFPP provided an understanding of the sociological and fishery setting of Lake Kainji and helped to determine the best way to establish
and implement a CBFM approach for the lake fishery. Despite this, CBFM was
new to the lake area. It was therefore necessary to familiarise members of the
communities with the approach and to test the method to see whether it could
meet the specific management requirements of the Lake Kainji fishery. It was also
crucial to establish a trusting and workable relationship between the KLFPP, the
Traditional Authorities and the fishing communities. The arrival of water hyacinth in
1993 provided a tool by which these two objectives might be achieved.
Staff from the project implementing agencies and the KLFPP advised the Traditional Authorities about the danger that hyacinth posed. The authorities then informed and sought the participation of the communities for the manual clearing of hyacinth that was infesting their shoreline. No remuneration was given to the
communities to clear the weed and they mainly acted through a shared
understanding and concern about the dangers that hyacinth posed to their livelihoods.
It was important that the communities saw their work as being both valued and part of a joint control approach alongside national institutions and the KLFPP. The
clearance was therefore supported by a program of biological control (using
weevils) and the installation of a floating and fixed barrier across the upper lake inlet to prevent new infestation by floating hyacinth arriving from the upper reaches of the River Niger.
Discussions with the communities during the program of water hyacinth control gave the chance for the KLFPP to adapt and refine the community approach prior to full implementation. The example highlighted that the administration by the Traditional Authorities in the lake area was extremely top-down, with the Emirs
and District Heads exercising a dominant role, whilst Village Heads and Village Councils had limited respect or authority among the fisherfolk. Despite their authority, the Emirs and District Heads did not possess sufficient government and legal backing or technical knowledge of resource exploitation to manage the fishery effectively alone. The situation made grassroots CBFM difficult.
Page: 272
Chapter 8
The Kainji Lake Fisheries Management and Conservation Unit
The above findings directed the KLFPP towards a co-management approach that
involved the sharing of responsibility between the State Fisheries Officers, who
had the government and legal backing, as well as, the technical knowledge, the
Traditional Authorities and the fishing communities.
Representatives from these bodies formed the membership of a new lake wide
management committee, the 'Kainji Lake Fisheries Management and Conservation Unit' (KLFMCU). The Unit consisted of eight members that included
the two Chief State Fisheries Officers from Niger and Kebbi (who shared the
chairmanship), three representatives from the Traditional Authorities and three fisherfolk representatives, one from each of the three Emirates. Non-voting
members included an officer from NIFFR and the three GTZ staff who gave technical advice.
A large number of villages existed around Lake Kainji. Inward migration of fisherfolk over the 30-year life of the reservoir resulted in a mix of cultural groups between villages. The system of traditional administration within these villages (Village Committees, consisting of Village Head and elders, that were co-ordinated by District Heads and the Emirs) appeared to function well. It was considered more appropriate and cost effective to use these existing Village Committees to
co-ordinate the co-management approach at the village level rather than to
establish a new and co-management bodies.
The program of water hyacinth control highlighted the need for a legal backing of the KLFMCU. A paragraph was included in the two revised Fisheries Edits of Niger
and Kebbi States in which the Chief Fisheries Officers granted special authority to
representatives from the communities and Traditional Authorities to perform enforcement functions normally undertaken by State Fisheries Officers.
Page: 273
Chapter 8
IMPLEMENTATION OF THE BAN ON FISHING WITH BEACH SEINES BY CO-MANAGEMENT
The first main activity of the KLFMCU was the implementation of the ban on fishing with beach seines on Lake Kainji.
The beach seine posed the greatest concern of any fishing method to the
sustained exploitation of the lake's fish resource. Problems of the fishing method
included the high bycatch of juveniles and the disturbance caused by the net to
breeding and nursery areas.
During the three-year orientation phase of the project, staff of the KLFPP regularly discussed the problems of the beach seine fishery with the Traditional Authorities
and the fisherfolk. Most of the fisherfolk mentioned that their daily catch rates, from
fishing gears other than beach seines, had declined. Some attributed this to the
destructive beach seine fishery. The non-beach seiners recommended a complete ban of the gear. They felt that a closed season, that limited fishing to outside of the
main spawning season, was not viable as the fisherfolk would continue to fish with beach seines so long as they still had access to them.
In 1995, the KLFPP advised the fisherfolk that a ban on fishing with beach seine
was imminent. Extension messages further stressed that fisherfolk should not replace worn-out sections of beach seine net or purchase new ones.
The passing into law of the revised State Fisheries Edicts in 1996 made it illegal to fish with beach seine on Lake Kainji. The Police Authorities were eager to
commence patrols. The KLFMCU, however, prevented them from disturbing the fisherfolk until the enlightenment campaigns and the agreed grace period to allow for some natural wastage of beach seine nets from the fishery had expired.
An important activity of the KLFPP was to investigate alternative fishing methods to exploit the clupeid stocks. Unfortunately, despite extensive fishing trials using light fishing, mid-water seines and pair trawling, no replacement fishing method to the beach seine could be found.
Page: 274

Chapter 8
In 1998, the ongoing monitoring of fish catch and effort indicated that any further
delay in reducing the fishing effort of the beach seine fishery would result in a
serious decline of catches from all the fishing methods used. In October 1998, the
beach seine users and non-users attended a meeting that was presided over by
the KLFMCU. They agreed that the users would stop fishing with beach seine after
three months (by the end of January 1999).
Between February and March 1999, fisherfolk voluntarily handed over 112 nets (23% of the total number) for burning by the KLFMCU (Table I). Fisherfolk who
relinquished their beach seine were given a token compensation of 100 m of gill
net for every 50 m of beach seine net. After the six week 'surrender period' had
expired, officers from the two State Judiciaries issued court summons to the
remaining owners of seines (identified from the annual frame survey). The action
resulted in a further 194 seines being confiscated and burnt. In addition to these
numbers were 58 fisherfolk who migrated away from Lake Kainji to continue fishing with their seines elsewhere. The total number of seines removed from the
Lake Kainji fishery was therefore 364 or 75% of the number estimated during the
1998 frame survey.
The majority of the beach seine nets remaining were owned by migrant fisherfolk
who had moved to the central and upper lake basins just after the initial flooding of the lake. The migrants were not from the Lake Kainji area and considered themselves exempt from the jurisdiction of the local Traditional Authorities. They
also saw themselves as 'professional fisherfolk' and somewhat superior to the local farmer/ fishers.
Prompt action had to be taken in order to prevent those fisherfolk who had
surrendered their nets from witnessing the 'undisturbed' continuation of seining, and thus being encouraged to restart beach seining. Court summons letters were therefore issued to the offenders and a Police seizing unit was established so that the remaining nets could be seized and burnt.
Page: 275

Chapter 8
The lower fishing effort of the beach seine fishery had, however, resulted in higher
catches and a higher market price of the, then scarce, clupeids. The income from
fishing with beach seine had therefore increased and the offenders were able to
bribe the officials of the State Judiciary to avoid prosecution.
The Police seizing units continued to patrol the lake throughout 1999 and early
2000. A rising number of conflicts between the few remaining beach seiners and
the seizing unit resulted in the patrols being discontinued by mid-2000. This led to
a rapid re-emergence of beach seining. A count of beach seines fishing in June
2001 indicated that the number had risen to a level that was half that prior to the
ban (Table I).
Table I. The total number of fishing entrepreneurs, the number and percent of entrepreneurs owning beach seines and the number of beach seine nets recorded in the Lake Kainji fishery by annual frame surveys, 1993 to 1999 and by a count of beach seines in 2001.
Month/Year Fishing entrepreneurs
Total number Number owning beach seine
Percent owning beach seines
Number of beach seine
nets
12/1993 4,300 510 12 550
12/1994 3,900 525 14 620
12/1995 4,940 765 15 810
12/1996 5,500 690 13 750
12/1997 5,800 570 10 580
12/1998 5,580 470 8 490
12/1999 5,180 .. .. *130
05/2001 4,560 .. .. **230
Where fishing entrepreneurs are owners of fishing gears. Fishing assistants are hired help/children who assist the entrepreneur.
Total number of entrepreneurs have been rounded to nearest 10 units. " Theoretical number of beach seine remaining. Visits to fishing villages indicated that very few of
the remaining 130 nets were fished between June 1999 and December 2000.
The number of nets remaining was estimated from: i. 58 nets that were carried away by fisherfolk migrating out of the fishery during the
extension campaign period (from 1995 to 2000). ii. 112 nets that were voluntarily handed over by fisherfolk for burning by the KLFMCU
during the six week surrender period (February to March 1999). iii. 194 nets seized by the courts after issuance of court summons (March 1999).
** Numbers estimated from a physical lake wide count of beach seine nets seen at the beach or fishing.
Page: 276
Chapter 8
Better control of the beach seine fishery may have been achieved had the
KLFMCU been able to adapt its approach and place less reliance on the patrols.
The departure of key personnel from the KLFPP (NIFFR and the GTZ) and the
death of two of the three Emirs was probably a reason why this did not occur.
The rapid re-emergence of the beach seine fishery was possibly caused by fishing
entrepreneurs only handing over half net or old worn-out nets during the earlier
surrender phase. A more positive aspect was that the fishery appeared to have
been quick to recover following the reduced effort of the seines from 1996 and its
almost elimination from fishing in 1999 and early 2000. There was some indication
that the decline in total fish yield had stabilised and that the yield, catch value, CpUE and mean size of fish caught had started to increase.
Timetable for the ban of beach seines
1993-1995: Number of beach seines increased from around 550 to 810 nets (1993 to 1995).
1993-1996: Traditional Authorities and fisherfolk enlightened about the problems
of the beach seine fishery.
1994-1998: Fishing trials (light fishing, mid water seining and paired trawling)
undertaken to determine an alternative fishing methods to the beach
seine (Adimula & du Feu, 1998).
1995: Ban of fishing with beach seines on Lake Kainji recommended by the Traditional Authorities.
1995:. Fisherfolk advised by the KLFPP that a ban on fishing with beach
seine was imminent.
1996: Results from a nutrition survey indicated that clupeids were sold outside of the lake area and, although low priced, were not consumed by residents of Lake Kainji.
Page: 277
Chapter 8
1996: State Fisheries Edicts ratified into law, making it illegal to fish with beach seines on Lake Kainji.
1996-1999: Enlightenment campaigns on the beach seine fishery continued by
the KLFPP.
Oct. 1998: Fisherfolk (users and non-users of beach seines) agreed that fishing
with beach seines would stop by the end of January 1999.
Feb. 1999: Six-week surrender period of beach seines.
Mar. 1999: Court summons issued to the remaining owners of beach seines.
Apr. 1999-Jun. 2000: Enforcement patrols undertaken by Police seizing units. Fisherfolk still fishing with beach seines were issued court summons and their nets confiscated and burnt.
Jun. 2000: Enforcement patrols abandoned due to increasing conflict at a few beach seining areas.
Jun. 2000-Jun. 2001: Rapid increase in beach seine fishing observed on Lake Kainji.
2001: Slight recovery in the fishery recorded, possibly caused by the
reduced effort of the seines from 1996 and the low fishing activity in 1999 and early 2000.
Page: 278
Chapter 8
THE LICENSING OF FISHING ENTREPRENEURS AND ASSISTANTS USING CO-MANAGEMENT
An almost constant number of fishing entrepreneurs around Lake Kainji was noted
between 1993 and 2000. Lower individual ownership of fishing gears by the
entrepreneurs resulted in the total number of gears decreasing during the same
period. There is a danger, however, that future cheap loans, or upturns in the
wealth of fisherfolk, could result in a rapid increase of fishing effort.
Lake Kainji has remained open access since its creation. In the past, fishing effort had only reduced when fisherfolk left voluntarily due to low catches. Between 1995
and 2000 the exodus of entrepreneurs increased from 1.1% to 4.8% of the total
number per annum.
The alternative is to regulate' fishing effort so that the critical point when fisherfolk
voluntarily leave is avoided. The KLFMCU decided to use the annual licensing of fishing entrepreneurs and their assistants as the means to achieve this, as well as, to provide funding for its future running. Fisherfolk were the most convenient unit
of fishing effort to license as they were listed during an annual inventory (frame
survey) undertaken by the KLFPP. Licensing of fishing gears or canoes was not felt appropriate due to possible under-recording of fishing gears, and hence fish
yield.
Licensing of fisherfolk on Lake Kainji involved both the practical aspects of setting up a licensing system, as well as, the required change in attitude of the fisherfolk from an open access fishery to one of controlled and 'valued' participation. The licensing program commenced in December 1997. The license fee was initially inexpensive (US $ 1.5 for entrepreneurs; US $ 0.4 for assistants) so as not to deter fisherfolk from purchasing licenses. The licensing procedure and the format of the license card were also kept as simple as possible; for example, no portrait photographs were included.
Page: 279
Chapter 8
Village/market meetings, radio programs, drama and song presentations and
posters were used to explain the advantages and legal obligation for obtaining a license. Many fisherfolk had access to radios and programs covering the lake
fishery were widely listened to.
Due to the resource limitations of the KLFPP, fisherfolk were initially encouraged to purchase licenses direct from government fisheries staff during the annual inventory of fishing effort (frame survey). Once fisherfolk understood the need to
obtain a fishing license this was stopped. Licenses were then sold at the eight
weekly fish markets or the Zonal Fisheries Offices during December each year (Fig. 1). Fisherfolk were also encouraged to pay for licenses via their Village Head.
A lack of trust, however, meant that this occurred in only a few cases. Fisherfolk
were allowed a grace period of two months (January to February each year) to
obtain a license. Those who failed were given a warning letter, followed by a court
summons from the relevant State Judiciary.
It was planned that, follwoing extension campaigns, the Village Elders and fisherfolk would be responsible for ensuring that all people fishing within their area were in possession of valid fishing licenses. The form of self-policing, however,
proved unworkable as cultural aspects made it difficult for fisherfolk to report their
unlicensed collegues.
The licensing of fishing assistants was not originally recommended by the KLFMCU. It was, however, later included by the State Governors who wished to
maximise revenue. The inclusion resulted in the number of assistants being under- recorded during the frame survey, however, this did not impact on yield estimates since assistants were not used during the compilation of the catch assessment survey.
Fisherwomen were not included in the licensing program as they were difficult to contact due to the Islamic practise of Purdah that kept them within their family compounds during the day. The majority of the fish that fisherwomen caught was consumed within the household and it was considered inappropriate for a development project to perhaps limit this through the imposition of license fees.
Page: 280
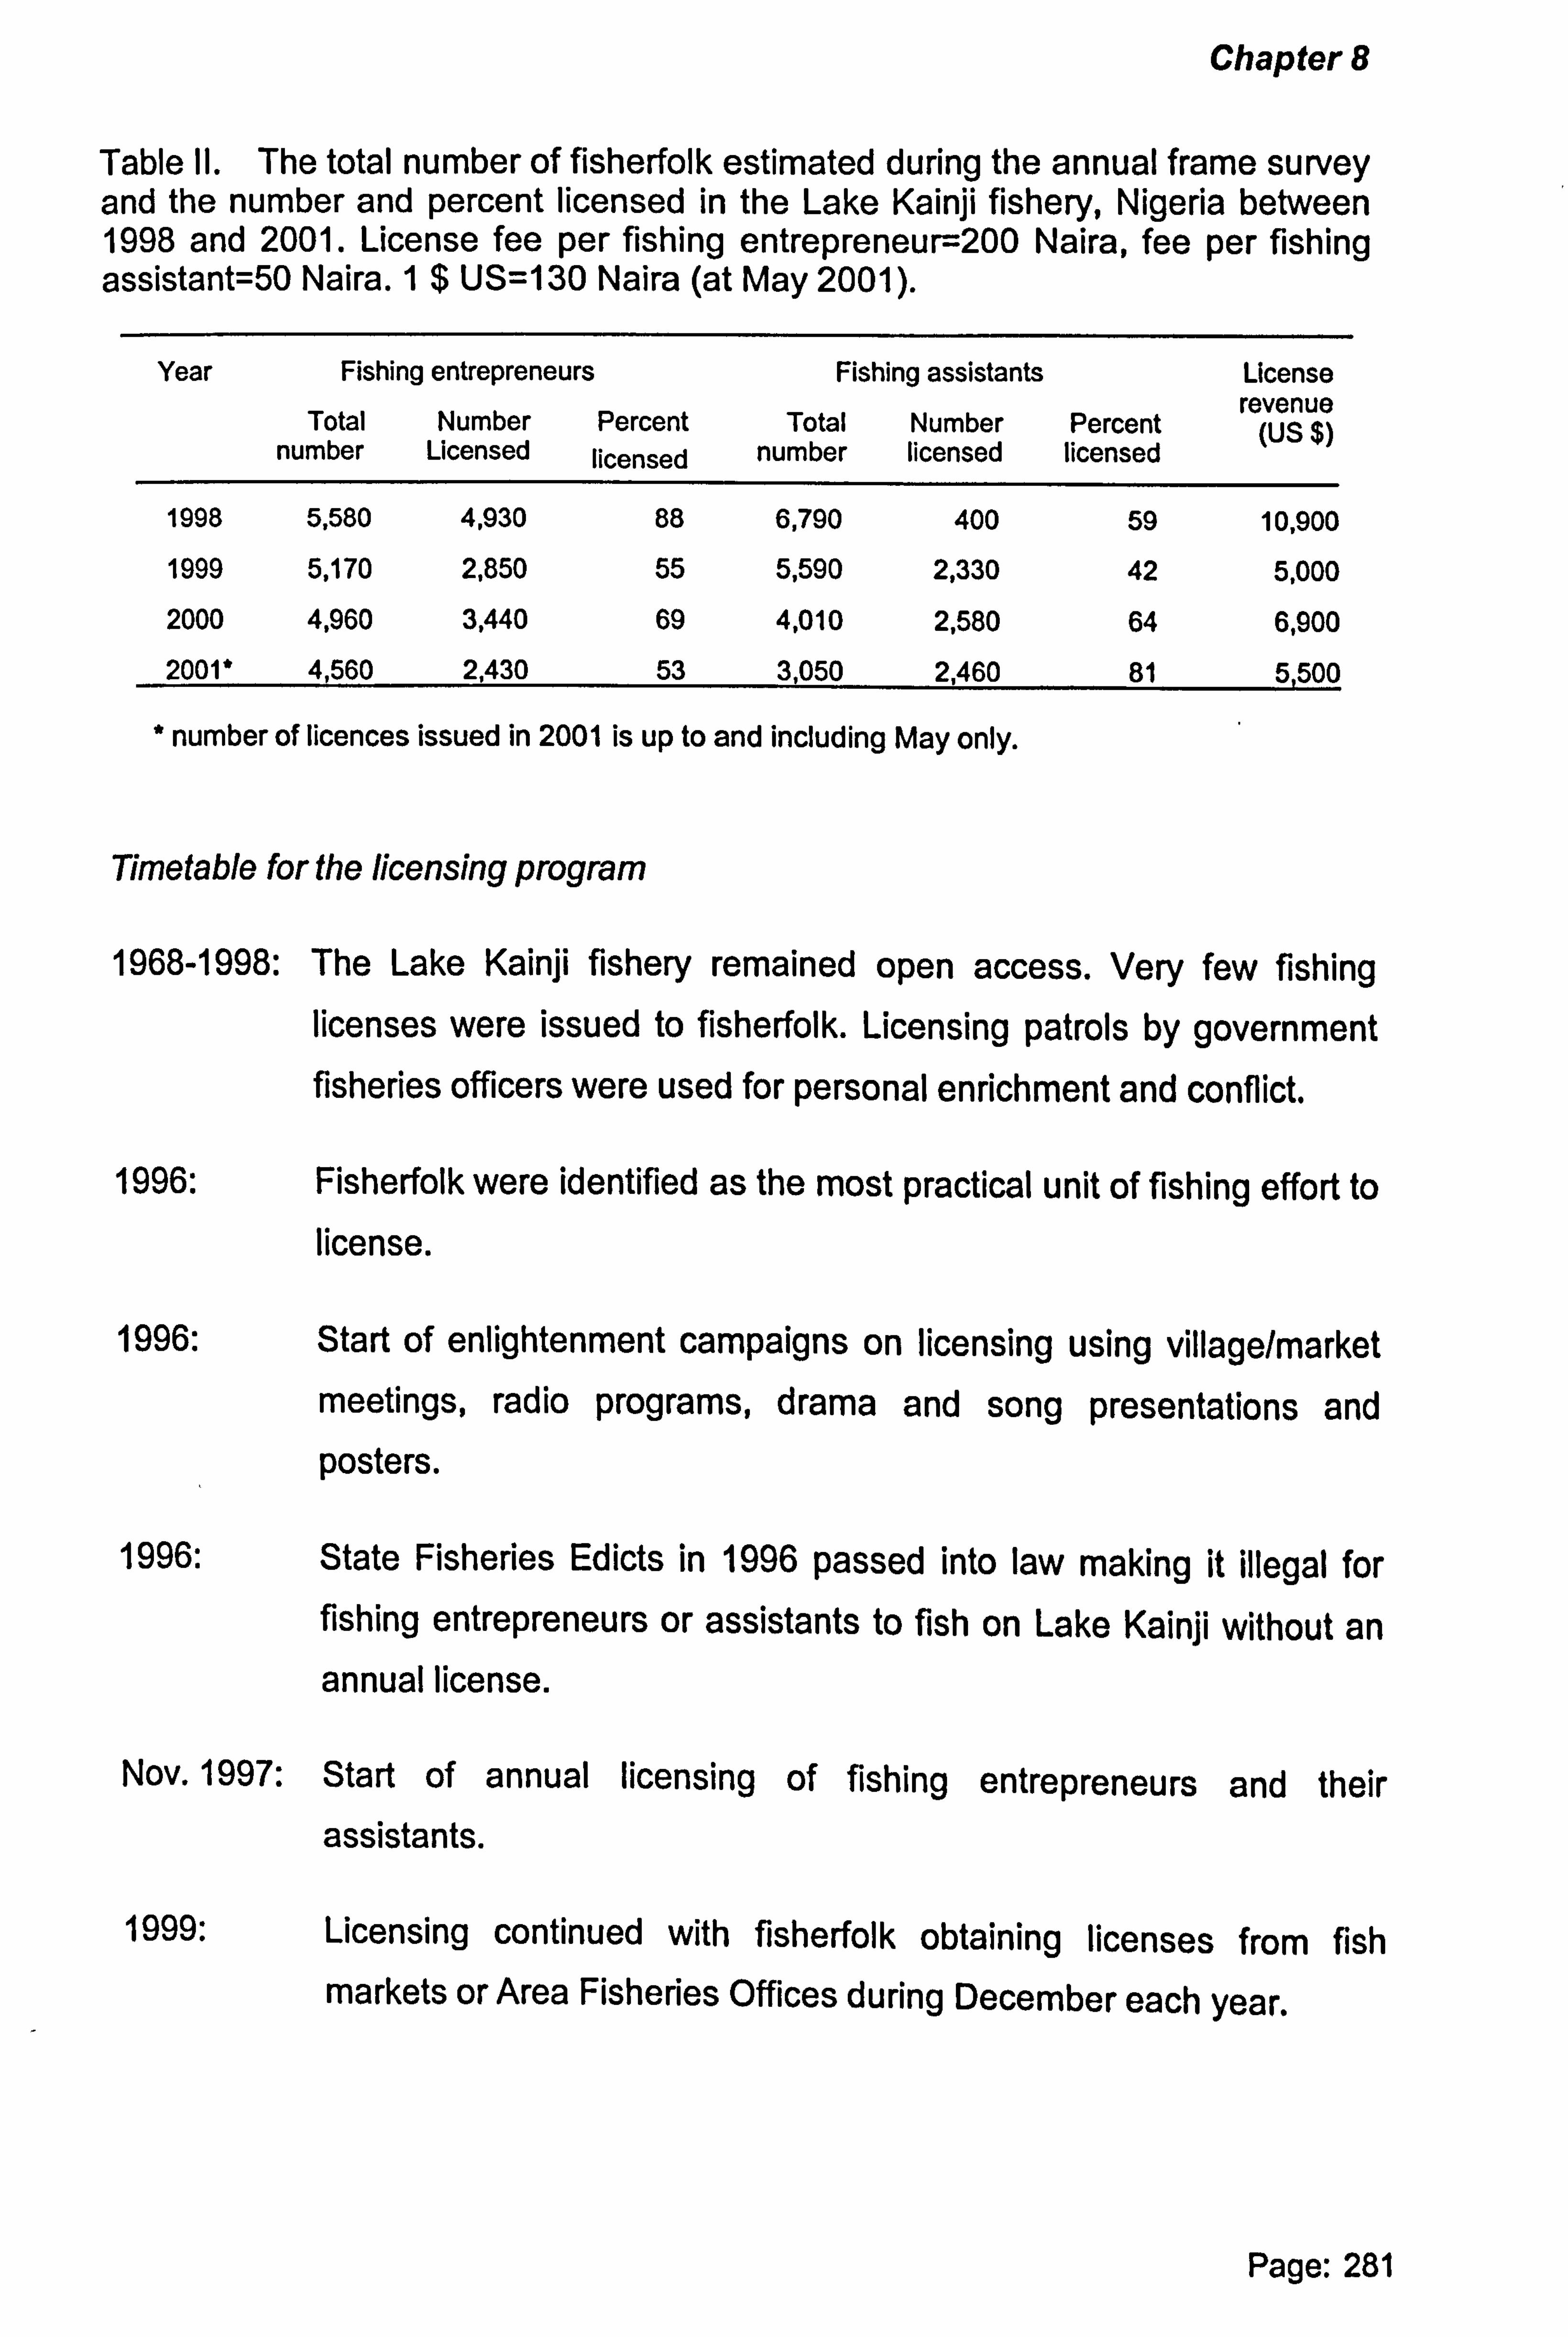
Chapter 8
Table II. The total number of fisherfolk estimated during the annual frame survey and the number and percent licensed in the Lake Kainji fishery, Nigeria between 1998 and 2001. License fee per fishing entrepreneur=200 Naira, fee per fishing assistant=50 Naira. 1$ US=130 Naira (at May 2001).
Year Fishing entrepreneurs Fishing assistants License
Total Number Percent Total Number Percent revenue (US $)
number Licensed licensed number licensed licensed
1998 5,580 4,930 88 6,790 400 59 10,900
1999 5,170 2,850 55 5,590 2,330 42 5,000
2000 4,960 3,440 69 4,010 2,580 64 6,900 2001* 4,560 2,430 53 3,050 2,460 81 5,500
* number of licences issued in 2001 is up to and including May only.
Timetable for the licensing program
1968-1998: The Lake Kainji fishery remained open access. Very few fishing licenses were issued to fisherfolk. Licensing patrols by government fisheries officers were used for personal enrichment and conflict.
1996: Fisherfolk were identified as the most practical unit of fishing effort to license.
1996: Start of enlightenment campaigns on licensing using village/market meetings, radio programs, drama and song presentations and posters.
1996: State Fisheries Edicts in 1996 passed into law making it illegal for fishing entrepreneurs or assistants to fish on Lake Kainji without an annual license.
Nov. 1997: Start of annual licensing of fishing entrepreneurs and their assistants.
1999: Licensing continued with fisherfolk obtaining licenses from fish markets or Area Fisheries Offices during December each year.
Page: 281
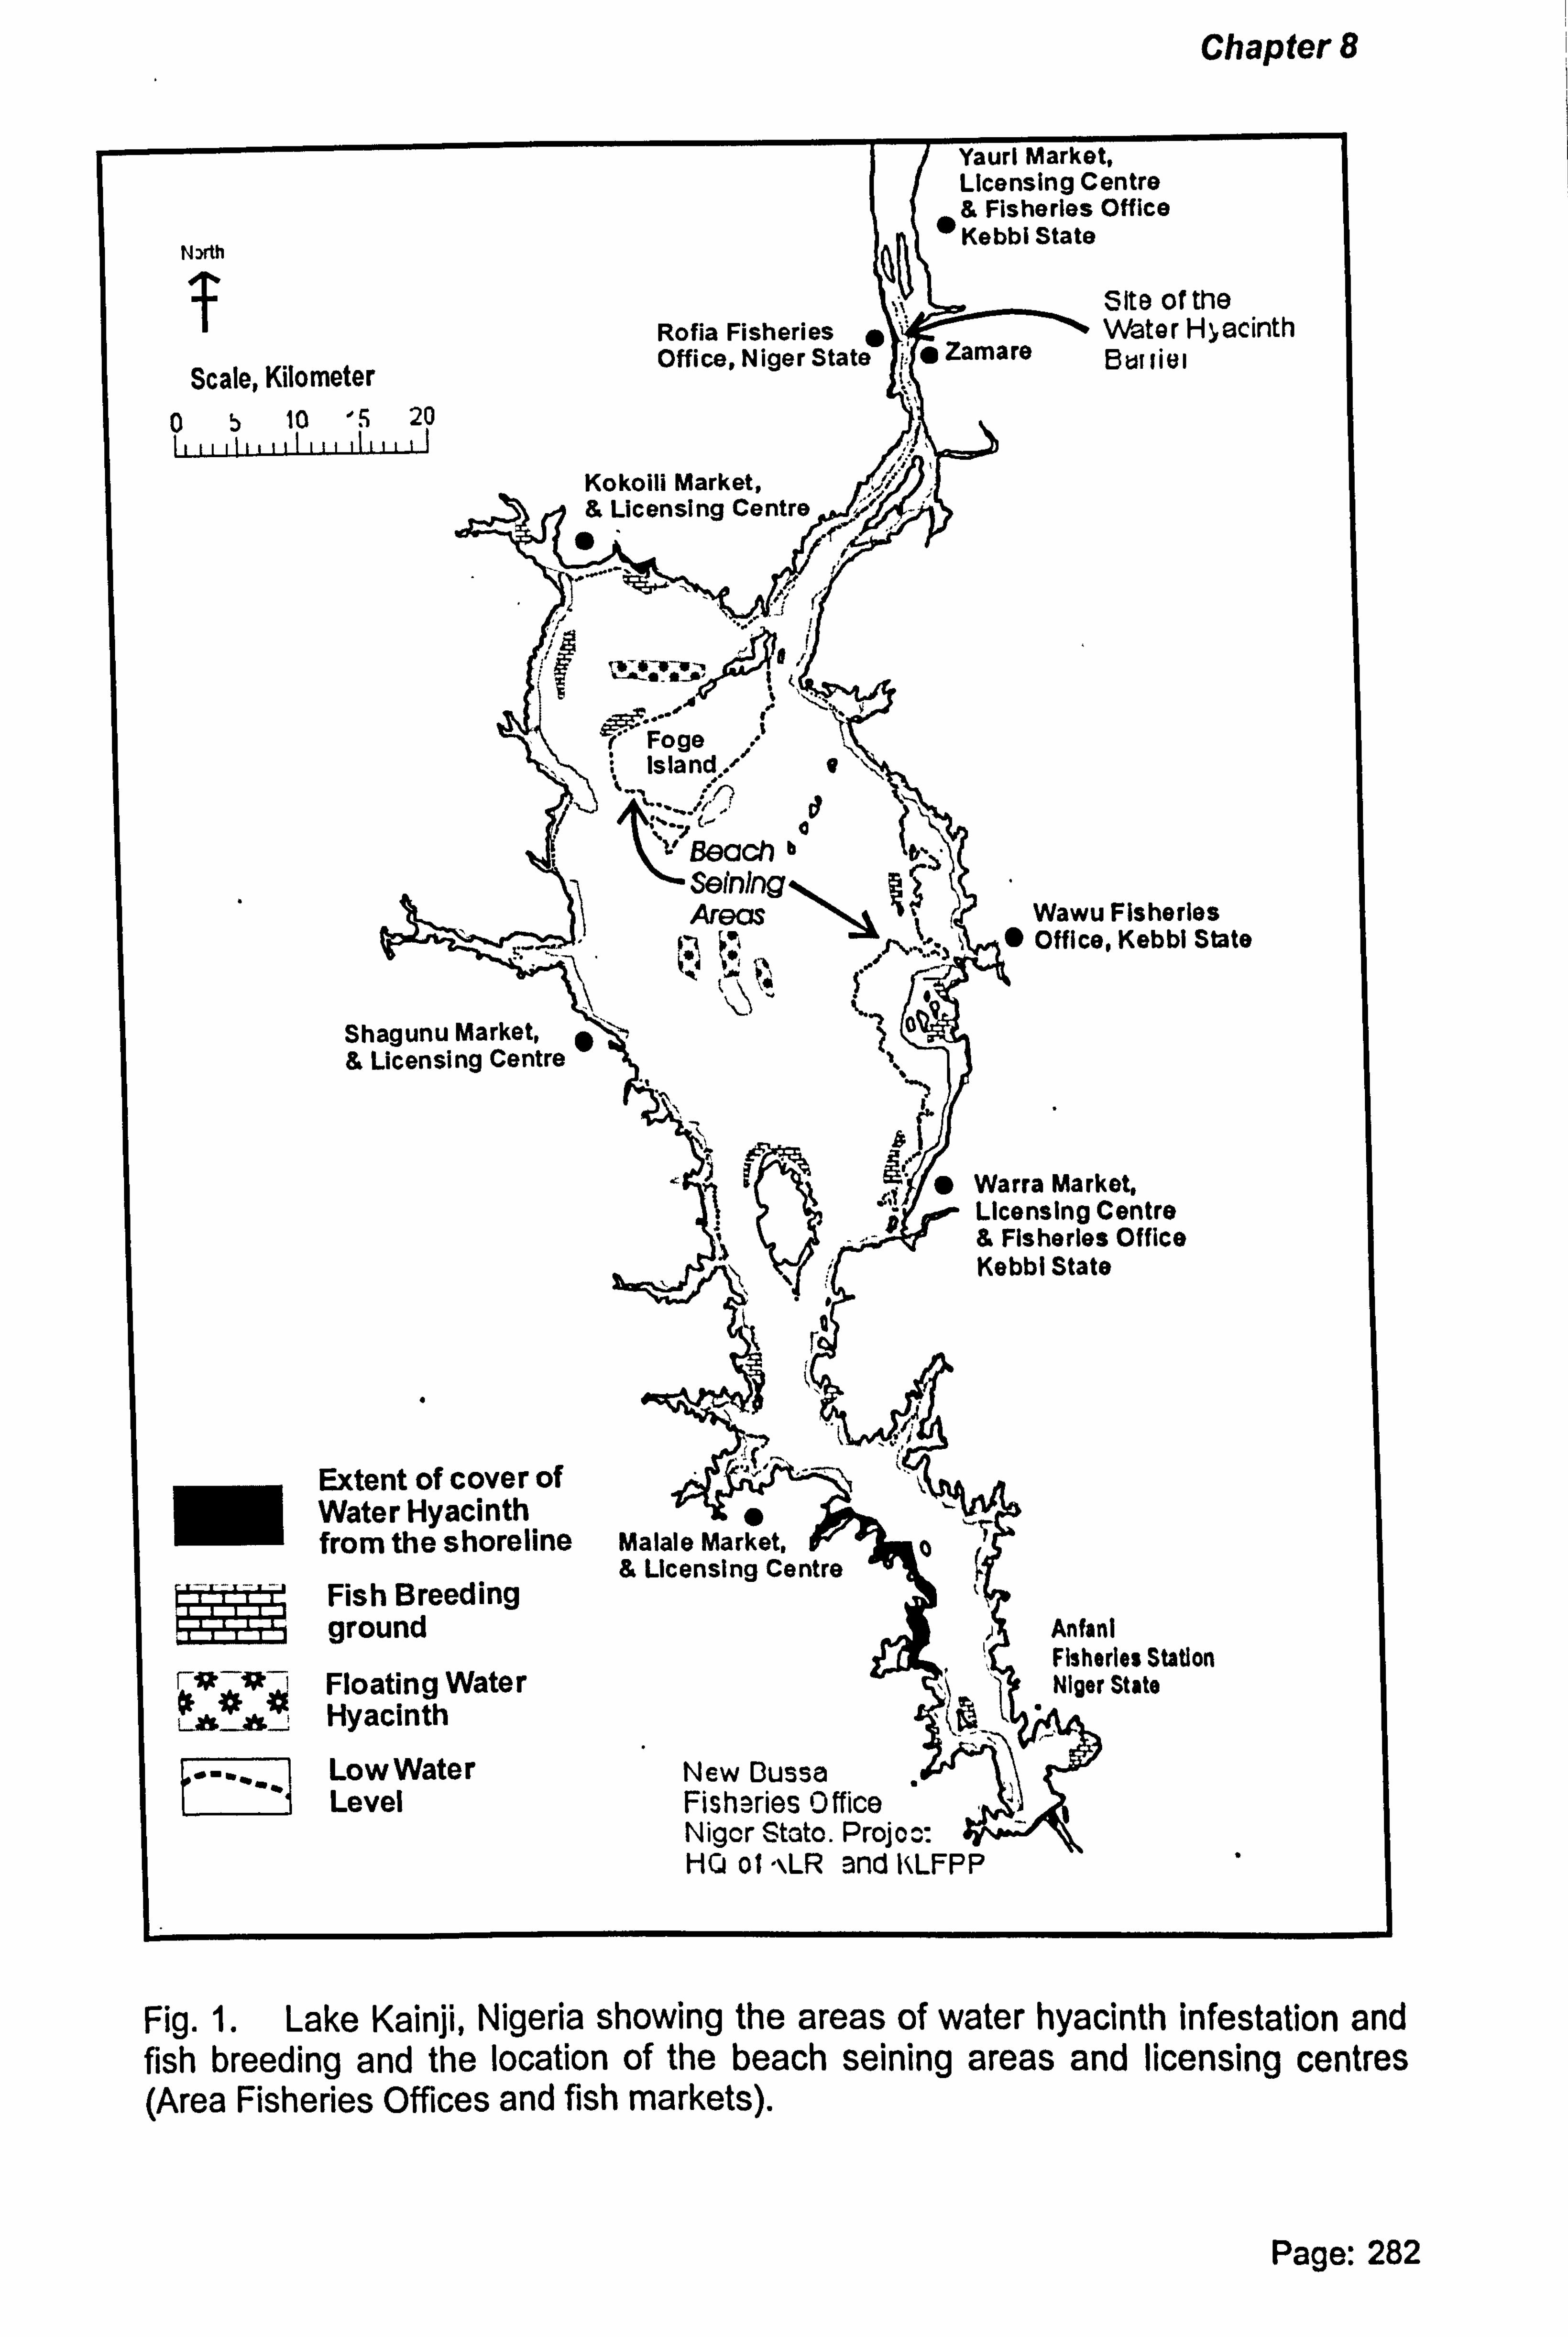
Chapter 8
Nxth
Scale, Kilometer 05 10 '5 20 III I III III
Shagunu Market, " & Licensing Centre
Extent of cover of Water Hyacinth from the shoreline
Fish Breeding ground
FV-V-1 Floating Water L* 0 Hyacinth
. -. ý- Low Water Level
Yaurl Market, Licensing Centre & Fisheries Office Kebbi State
Site of the Rofia Fisheries Water Hyacinth Office, Niger State " Zamare But Iiei
Kokoili Market, & Licensing Centre
re
Foge , Island.
`vl Beach b Seining Areas
k 'g. S.
Wawu Fisheries " Office, Kebbi State
" Warra Market, ow- Licensing Centre
& Fisheries Office Kebbi State
Anfani Fisheries Station Niger State
-4" Malale Market, & Licensing Centre
New Dussa Fisheries Office Niger Steto. Projoo: HO of "\LR and KLFPP
Fig. 1. Lake Kainji, Nigeria showing the areas of water hyacinth infestation and fish breeding and the location of the beach seining areas and licensing centres (Area Fisheries Offices and fish markets).
Page: 282

Chapter 8
DISCUSSION
CO-MANAGEMENT APPROACHES- CONSIDERATIONS FOR RESERVOIR
FISHERIES.
Features of reservoirs, as opposed to other inland water bodies, that influence
management of their fisheries are that they are man-made, are relatively recent,
often have a high flow through or drawdown of water and frequently support a large and socially diverse population and set of user groups. These features may
differ between reservoirs making them highly individual. This suggests that
separate reservoirs require their own tailored approach of co-management;
a situation that is perhaps not so apparent for coastal, lake or riverine fisheries.
A more favourable aspect for the management of reservoirs, as opposed to
riverine or coastal fisheries, is that they are generally closed systems with limited
migration of fish.
National governments often initiate and fund the construction of reservoirs. The
communities are generally not consulted during the decision making process. They therefore tend to view reservoirs as being under the ownership and the
managerial responsibility of the government. Such perceptions may discourage
the continuation of traditional fisheries management within newly created reservoirs, as well as, the willingness of communities to participate in the co- management process.
Co-management requires frequent discussions in villages. Poor roads existed around Lake Kainji and caused access problems. The young age of Lake Kainji
was partly to blame, since there had been little time for such infrastructure to become established. However, emphasis on more economic aspects, such as the development of HEP activities was also responsible. This is likely to be a common problem in reservoir fisheries. A review by the WCD (2000) stated that reservoir construction projects are often over budget and that few remaining funds are available for the development of supporting infrastructure.
Page: 283

Chapter 8
Migrant fisherfolk are often attracted to newly created reservoirs. Examples are Nyumba ya Mungu Reservoir, Tanzania (Bailey et al., 1978) and Selingue
reservoir, Mali (Anne et al., 1994). The expectation by migrants of the envisaged
co-management process often differs from the local fisherfolk and they may be
unwilling to participate in such an approach. Around Lake Kainji the migrants
considered themselves as professional fisherfolk, as opposed to the indigenous
fisher/ farmers, and were more reluctant to adhere to fishery regulations. As
`outsiders' they also saw themselves as being exempt from the jurisdiction of the
local Traditional Authorities. Other authors noted similar problems (Malasha, 1999;
Lake Kariba & De Silva, 1988; for reservoirs in Sri Lankan).
Migrant fisherfolk around Lake Kainji mainly opposed the ban on beach seine fishing. They may have been less resistant had they been identified as a potential problem group and contacted more during initial extension campaigns. This
suggests that if migrants exist (or other distinct groups such as those engaged in
aquaculture, sport fishers etc. ) it may be beneficial to anticipate problems and to target them early on with specific extension programs.
CO-MANAGEMENT APPROACHES: THE ROLE OF DONOR PROJECTS
The concept of co-management within reservoir fisheries is both new and different from conventional top-down approaches. Few national institutions have the
capacity or the legislation to support such a move. Donor projects must therefore assist this process.
According to Sverdrup-Jensen & Raakjarr Nielsen (1997) past interaction with the communities by the government through top-down approaches has caused communities to become extremely skeptical of any community approach that is put forward by government. Projects must attempt to break down these barriers and help establish a workable relationship between the two parties.
Page: 284

Chapter 8
It is often assumed that donor organisations have the well-being of the resource
and the communities as their main objective. Such considerations may be
overridden by decision makers being more concerned with expenditure-driven
actions, which often require short-term time scales and which offer the reward of further projects. Such notions will undermine the work of co-management
approaches that tend to require more dedicated and longer periods of implementation. An added consideration is that decision makers in head office
often expect projects to act quickly and therefore may question the longer
co-management approach, especially if prior data collection is required.
Donor organisations are not always to blame. Barbosa & Hartman (1998) noted that national governments also regularly push through poorly conceived and inappropriate fisheries management projects for their own interests. Fisheries
co-management projects therefore may initially be based on perceived problems which have little evidence to back them up. This can lead to projects being implemented even when the original management assumptions and decisions are
unfounded. An advantage of the KLFPP was that the project approach could be
adjusted as the understanding of the fishery/sociological setting improved. Such
an adaptive approach is considered important to develop individual
co-management approaches suited to specific situations.
DATA REQUIREMENTS FOR CO-MANAGEMENT
Management plans based on co-management may require less supporting fisheries data than those for top-down approaches. This is because
co-management ultimately relies, and responds to, the knowledge and views of the fisherfolk and should not be a process command driven by the findings of fishery biologists.
Fisherfolk in the Lake Kainji fishery stated that their daily catch had declined for all gears and that they considered the large by-catch of juvenile fish from the beach seine fishery to be predominantly responsible. These findings agreed with those of the survey work undertaken by the KLFPP.
Page: 285
Chapter 8
This therefore suggests that the fisheries data collection during the early stages of
the KLFPP could have been reduced and time more usefully spent developing the
co-management approach with the communities. There is the added
consideration that the fishery might collapse whilst gathering such reliable data.
Some data collection must take place to collaborate the views of the fisherfolk.
Data collection was mainly performed by the KLFPP through administering
questionnaires to selected villages/ households. Greater involvement of villagers in
data collection might have led to an earlier and more in depth understanding of the
concept of co-management by them and possibly given a clearer understanding of
the fishery to the KLFPP. Non involvement of communities in data collection is
likely to be a common problem and one that is difficult to address given the time
constraints of projects and the fear that fisherfolk may fabricate data. The lack of
participation by the fisherfolk has also been noted for Lake Kariba (Malasha,
1999). Barbosa & Hartmann (1998) noted that in Brazilian Reservoirs the
communities participate during monitoring and evaluation activities; the extent to
which this is done is unclear.
INVOLVEMENT OF THE FISHING COMMUNITIES IN CO-MANAGEMENT
Successful co-management of a resource depends upon the active and sustained participation of those communities who exploit it. Ensuring such inputs from fisherfolk, especially those around reservoirs, presents specific challenges.
Co-management approaches are perhaps often used as an alternative to other forms of management that have failed. Past failures mean that resources have
remained open access. This may cause the fisherfolk to believe that the exploitation of fish is a right to be enjoyed by all. Community-based approaches must therefore overcome this misconception and ensure that fisherfolk understand, and associate with, the rationale for fisheries management. An added difficulty is that the communities have often been 'by-passed' during the management process (Abdullah et al., 1997 & Nyikahadzoi & Songore, 1999) and that enlightenment and capacity building is needed to restore those community structures and processes required by co-management (Jencroft, 2000).
Page: 286

Chapter 8
Pomeroy et al. (1997) and Little (1994) stated that co-management was more
successful in cases where the communities participated in planning and that their
early participation allowed projects to adapt the approach to meet local needs. Sverdrup-Jensen & Raakjarr Nielsen (1997) & Raakjarr Nielsen et al. (2002),
however, recognised that communities tend to be involved in implementation
rather than its initial design. In defense, Nielsen (1996) noted that ensuring that
the communities have a say in the design of the management approach is a difficult and lengthy process. Perhaps too lengthy for short-term development
projects.
The findings are supported by the Lake Kainji example. The decision to use CBFM for Lake Kainji was initiated during intergovernmental discussions prior to the start of the KLFPP in 1993. The idea of CBFM was then endorsed by the seconded staff who then persuaded officers from the project implementing agencies, who in
turn encouraged the Traditional Authorities. Fisherfolk were last in the line to be
consulted. This is a long process and differs from the approaches which
encourage problem identification from the 'grass-roots' user groups (i. e. the fisherfolk).
To enable the communities to participate in community action early on, the KLFMCU embarked on a program of water hyacinth clearing. However, time and budget constraints, and perhaps an element of wishing 'to get on with the work', caused the project to by-pass important discussions with the communities about the actual design of the community-based approach. It is felt that greater impact
may have been achieved had the KLFMCU initially worked more closely with the
communities, rather than concentrating on the Traditional Authorities who were one step away from the fisherfolk.
The difficulty of involving communities in project planning appears common and was apparent in almost all of the eight case studies in Africa studied by Sverdrup- Jensen & Raakjaer Nielsen (1997), as well as in Zambia (Thole & Dodman, 1996) and Indonesia (Wickham, 1996). Early discussion with the communities appears greater in Asia (Baird, 1999). All authors agreed that greater initial consultation might have eased the later implementation of management measures.
Page: 287
Chapter 8
The extent that communities are involved in the design of management
approaches must be approached carefully. Baird (1999) stated that communities in
the Mekong Delta were able to establish and adjust management strategies to suit
local conditions. This appeared to work well. However, an example for Lake
Malombe, Malawi (Nara et al., 1999) indicated that in doing this communities may
seek to soften management measures, such as mesh size regulations, rendering
them ineffective.
Fisherfolk will be more willing to become involved in the co- management process if they associate themselves with the overall problem and need for management. Again, this is difficult to achieve. Fisherfolk will know about the detrimental fishing
practises being used and perhaps complain about the rise in fishing effort. The
logic of the surplus production model dictates that they will also experience smaller fish catches as fishing effort rises. Aspects that they will not fully appreciate, however, are the level of total lake yield and how it relates to overfishing as defined by the maximum sustainable yield. Thus, apart from falls in daily catches, the fisherfolk will have no knowledge that the fishery is being overexploited and
requires management intervention.
Little (1994) suggested that communities must firstly experience a real threat to
their livelihood before they understand the need to participate in co-management. For reservoir fisheries such an event may be the collapse of the fish resource. However, collapsed fisheries often require prompt and urgent attention, which may be best delivered using faster hitting top-down approaches. Hara of al. (1999)
reported that a large decline in fish catches from Lake Malombe, Malawi appeared to have contributed to the willingness of the communities to participate in co- management.
Little (1994) noted that communities can be encouraged to participate in
management activities by giving economic incentives. This is difficult for fisheries
and incentives are, perhaps, more easily obtainable within other natural resources sectors (e. g. revenue from increased tourism to wildlife parks or via fees from hunters, Richards (1997)).
Page: 288

Chapter 8
Claridge & O'Callaghan (1996) considered that monetary incentives to ensure
participation of the communities should not be given, but that the enticement
should be the direct benefit arising from the co-management activity itself. This is
likely to be the case for reservoir 'fisheries where incentives are usually those
directly linked to the supply of food for home consumption or local sale (Wickham, 1996).
In the theory the 'tragedy of the commons', Hardin (1968) concluded that
individuals try to obtain the maximum benefit from the resource before others. There is therefore a divergence of interests between that of individuals and that
required by community-based strategies. Asking fisherfolk to exercise responsible fishing practises, such as adhering to closed seasons or gear regulations, will therefore only be possible if every fisherfolk does the same and does it at the
same time.
The willingness of individuals to forsake personal gains for the increased well- being of the community appears to'contradict some of the traditional management
systems in the Lake Kainji area where small drawdown ponds are privately owned with the fishing rights being sold by auction. Neiland et al. (2000b) further noted that traditional management systems in the north east of Nigeria were based on
compromise and resolution of conflict. This is an important aspect of co-management, however, management often leads to increased conflict and may require more radical steps. Little (1994) and Malasha (1999) noted that the word 'community' can invoke a false sense of cohesion and that few communities are homogenous and free from conflict.
Jentoft (2000), however, argued that participation by the communities is only possible if they share common 'management' interests and identify themselves
with each other. Communities will always tend to be divided according to their perception as to how management measures will affect their livelihood. Divisions were perhaps less obvious when centralised top-down management was used that gave little cause for complaint and forced everybody, winners or losers, under the same management authority.
Page: 289
Chapter 8
Flooding of reservoirs and relocation of people often brings differing communities in close proximity and this may increase conflict situations during co-management. Some twelve diverse ethnic groups were relocated by the creation of Lake Kainji
(Mabogunje, 1973). Jenness (1973) noted that these groups were in conflict over boundaries even before the reservoir was flooded. Added to this, were groups of
migrant fisherfolk who were also not homogenous. A similar diversity of
communities, encompassing some 50 tribes was noted for Lake Lagdo by Postma
& van der Knapp (1999) and in reservoirs in South America (Quirbs, 1998).
Examples in Africa showed that conflict situations commonly arose between full
time (usually migrants) and part time (farmer-fishers) fisherfolk (Sverdrup-Jensen
& Raakjarr Nielsen, 1997; Malasha, 1999). A similar conflict arose in Lake Kainji.
Migrants felt somewhat superior to the local farmer-fishers and considered themselves exempt from the influence of the Traditional Authorities.
Problems caused by these various groups in Lake Kainji were evident by the need for policing/ confiscation units following the ban on beach seines. Whether such problems could have been alleviated by more enlightenment activities to the
offending groups is unclear. Time and budget constraints made such activities difficult. The differing needs and aspirations and the winner/loser situation in Lake Kainji makes it questionable whether all conflicting groups could have been brought together to manage the resource. This suggests that the use of Police
seizing units may have to remain an option in many cases, especially where co-management is trying to ban highly profitable fisheries operated by diverse
groups.
For Lake Kainji, the involvement of the communities became increasingly difficult
as the co-management approach was implemented. The virtual absence of beach seining activity in 1999 and early 2000 resulted in increased catches of clupeids by those few fisherfolk still seining. In turn, the scarcity of clupeids increased their value. The situation resulted in the few seiners being able to bribe police and court officials. It also resulted in them becoming unwilling to stop an extremely lucrative livelihood. Conversely, those who had stopped beach seining were given increasing cause to regret their decision. As a result, the division between the two groups and the ridiculing of those who had chosen to abandon seining increased.
Page: 290
Chapter 8
The problems caused by diverse communities appear greater for larger reservoirs.
Conflict situations may therefore be less common within smaller water bodies
which may have more cohesive communities. This agrees with Amarasinghe &
De Silva (1999) who found that less conflict existed in smaller sized reservoirs
(surface area around 60 km2) in Sri Lanka.
INVOLVEMENT OF NATIONAL BODIES IN CO-MANAGEMENT
The understanding and support of the traditional authorities and project implementing agencies was vital' for the development of the co-management
approach for Lake Kainji. These parties were required to play a leading and
persuasive role among national and local institutions.
Claridge & O'Callaghan (1996) & Sverdrup-Jensen & Raakjarr Nielsen (1997)
noted that national governments frequently appear uncommitted to the
co-management process and that few supporting programs or institutions exist. Nielsen (1996) & Pomeroy & Berkes (1997) also stated that the delegation of
power and authority by existing institutions is one of the most difficult tasks in
establishing co-management.
The Lake Kainji example indicated that one reason for these difficulties was that
national staff often viewed co-management as diminishing their role, since management responsibilities had to be shared with the communities. The previous patrol and fine management approach also generated revenue (both for public and private purses) and some government officers were unwilling to forsake this in favour of co-management. Pomeroy & Berkes (1997) added that decision makers may be unwilling to share authority for management if they are not convinced that the communities are interested in and have the ability to organise themselves to
manage and sustain the resources.
The management of reservoirs in developing countries is frequently characterised by a multitude of highly sectorised, fragmented and poorly coordinated and funded institutions. The situation has been noted for reservoirs in Bangladesh by Petr (1994), South America (Quirös, 1998) and the Philippines (Pomeroy et al., 1996; La Vina, 2002).
Page: 291

Chapter 8
The situation also existed in Nigeria. Interested parties around Lake Kainji that
were connected with the management of the fishery included the Federal
Department of Fisheries, the Fisheries Departments and Administrations of the
two bordering States, five Local Government Authorities, three Traditional
Authorities (Emirates: consisting of Emirs, District and Village Heads), 14 Districts
and a national research institute (NIFFR). The number and diversity potentially
made the implementation of co-management extremely complex. The KLFPP
therefore decided to work with only those parties who had defined roles in the
co-management process. These included the State Fishery Officers, Traditional
Authorities, researchers and fisherfolk representatives. The other parties were kept informed of management decisions.
It was apparent, however, that each person representing each organisation had a differing perspective on what constituted the appropriate management of the
reservoir fishery and how it should be implemented. The success and sustainability of the co-management approach ultimately rested with these players. A workable and accepted approach had to be developed through a building of trust backed by discussion, diplomacy and sometimes compromise.
The implementation of co-management for Lake Kainji was greatly facilitated by the highly functional and respected system of Traditional Authorities. This was channeled from the Emir, through District Heads, Village Heads and down to the fisherfolk through the Sarkin Ruwas (the head of fishing). However, the structure of the Traditional Authorities was extremely top-down. According to Sverdrup- Jensen & Raakjaer Nielsen (1997) such arrangements for co-management, where the Traditional Authorities act as a link between government and the communities, are common in Africa.
Many of the co-management discussions with the Traditional Authorities were held directly with the charismatic leaders and not with lower ranked traditional members or other community leaders. The result was that the death of these key personnel caused disruption in the approach and many enlightenment processes had to re-commence.
Page: 292
Chapter 8
FORMATION OF SPECIAL CO-MANAGEMENT UNITS
Using existing committees in the fishery to implement co-management will reduce the need to develop such bodies from scratch, including aspects such as elections for members, communication links etc. Within reservoir fisheries, however,
organisations that can be adapted and used for co-management rarely exist. Most
co-management projects have had to create their own. The exception may be
committees established to manage fishery cooperatives.
Experience of the Lake Kainji example highlighted that the co-management process relied strongly on the support of the State Judicial systems and opting members of the judiciary onto the KLFMCU may have encouraged them to
participate more fully.
The fisherfolk representatives on the KLFMCU were to act as a link between the KLFMCU and the fisherfolk. The dissemination of information back to the fishery
and the airing of other fisherfolk's opinions during meetings of the KLFMCU, however, was limited. This was especially the case for the large number of women who fished. The KLFMCU therefore relied on radio broadcasts, which although good at disseminating information, prevented good feedback. The initial
appointment of the fisherfolk representatives by the Chief Fisheries Officers, and not directly by the communities, may have contributed to this limited exchange of information. A possible solution is for the communities to elect all fisherfolk
representatives, including extra personnel who can assist the fisherfolk
representatives on the KLFMCU to exchange information with the communities.
Co-management committees that are village based, but which are coordinated by
a central body, may help reduce these problems. Such a system exists for Lake Malawi, however, Hara et al. (1999), however, noted that problems of information exchange still remain.
The two revised State Fisheries Edicts provided the legal framework of the KLFMCU. The also detailed how the State Fisheries Officers could grant authority to the communities and Traditional Authorities to undertake fisheries management activities.
Page: 293
Chapter 8
FUNDING OF CO-MANAGEMENT
Long-term funding of co-management, particularly after handover of the donor
project, is vital. Lack of adequate funding was a major reason why the previous top-down management in Lake Kainji had failed. During the development of the
co-management approach, who pays for and receives what, were contentious
topics among the differing interest groups of the KLFMCU (e. g. costs of data
collection, extension and revenue from licenses or fines etc. ).
The secondary importance of reservoir fisheries to HEP or irrigation activities
usually means that only limited funding is available for the management of the
fishery (e. g. Lake Lagdo; Postma & van der Knapp, 1999). A further consideration is that unlike co-management, top-down patrol and fine activities are usually designed to generate income through imposition of fines to offenders. There is a
need, therefore, to inform decision makers about funding requirements of
co-management.
Nielsen (1996) noted that the costs of establishing co-management are usually higher than top-down approaches. The infancy of co-management and its current
vogue within donor organisations means that often donor projects are expected to
pay for these costs. The future uptake of the approach in other water bodies,
however, may be hampered by national institutions being put-off by such high
initial costs.
As opposed to the setting up costs, the implementation of co-management is
generally less expensive than top-down approaches. The exception may be when fine revenue from the to-down approach generates revenue, however, the creation of income through the selling of fishing licenses (as in Lake Kainji) during the
co-management approach may offset this argument.
Page: 294
Chapter 8
A problem of the collection of license revenue by the KLFMCU was that, apart
from a retention of 10% for administrative costs, most had to be handed to the
respective States. However, once paid-in, it was almost impossible for the funds to
be reallocated for the development of the communities or the fishery. Ongoing
funding of the KLFMCU therefore had to be sourced via separate budgets and this
involved lengthy procedures. Similar government accounting systems are likely to
occur in other tropical countries and have been noted by Hara et al. (1999) in
Malawi.
THE TIME FRAME REQUIRED FOR CO-MANAGEMENT
The development of the co-management approach for Lake Kainji took a long
time. Many of the sociological and fishery related aspects of the reservoir appeared specific to Lake Kainji. Approaches from other reservoirs could therefore
not be followed and time was needed to understand the fishery and socio-
economic setting and to develop a management plan and management
committee. Enlightenment activities and encouraging the participation of national institutions and communities also took time.
Even with the full co-operation and resources of a national research institute
(NIFFR), the nine-year project period of the KLFPP only resulted in three years solely directed at implementation. It is suggested that a minimum of 10 years is
required for co-management, particularly if the approach is to handed over for
continuation by the national authorities. This disagrees with Claridge & O'Callaghan (1996) who suggested that three to five years is adequate.
The long time needed does have its drawbacks. Co-management projects are generally initiated on the basis of resource depletion (Sverdrup-Jensen & Raakja: r Nielsen, 1997). The time required prior to implementation of co-management may be too long and more immediate top-down approaches may be needed to safeguard the resource.
Page: 295

Chapter 8
A related problem is that the level of maximum sustainable yield is often only
identified after the stock has been overexploited (Nilborn & Walters, 1992). If this
is the point at which the need management is identified then little time maybe left
to design and implement a strategy of co-management.
Rushed implementation, and subsequent failure, will ultimately cause decision
makers to have little confidence in co-management. Co-management approaches
are usually promoted by donor projects. Therefore the main perpetrators of this
rush are likely to be the projects themselves. Designers of projects, including
representatives from national institutions, must therefore ensure that adequate
time is given.
ASSESSING THE RESULTS OF CO-MANAGEMENT
Co-management projects are often assessed in terms of increased economic or fish yield or participation rates of communities (Pomeroy et al., 1997). Whilst these
are important indicators they fail to reflect the impact of co-management on the
well-being of the community.
Whether community-based management has the potential to improve the well- being of reliant communities is unclear. Perhaps the approach is often tried merely as a last resort to top-down methods that have failed. It is also possible, that
community approaches may be implemented by fisheries managers who wish to do less and avoid taking all the blame for failures.
The problem, however, in assessing the success of co-management is that there is little to compare success with. This is partly because it tends to be undertaken in isolation rather than being seen as part of an all encompassing strategy for national fisheries management. Pomeroy et al. (1997) found that the lack of long- term base-line data of reservoirs is a further handicap, particularly for concepts such as 'well-being' which is difficult to quantify. The KLFPP tried to tackle this problem by measuring 'well-being' through indicators defining the nutritional status of infants (Adu, 1996,1999).
Page: 296
Chapter 8
Nielsen (1996) established criteria to assess co-management. These include
sustainability (the ability of the communities to maintain the resource and the
resilience of the approach to withstand change, efficiency (cost-effectiveness of the approach and improved net returns from the fishery) and equity (representation of interest groups and transparency of the management process).
The departure of several key personnel from the KLFPP, who had been involved in the design and initial implementation of the co-management approach and the
subsequent re-establishment of beach seine fishery suggested that the
co-management approach had not fully developed in Lake Kainji.; A question that
arose was whether the initial strength of the approach was due to key personnel or whether the approach itself was flawed? This is difficult to answer. Although the
enthusiasm of the first set of national and international project staff is thought to have contributed to initial successes. It is believed that the approach would have
still failed, albeit at a slower rate, had they stayed longer.
The change of personnel is not unique to Lake Kainji, but appears part of the development process within tropical countries. Barbosa & Hartmann (1998) noted similar re-organisational and structural changes for reservoirs in Brazil.
Efficiency of co-management may be measured by levels of production from the fishery. There was some evidence that mean size of fish and fish catch improved in Lake Kainji following the virtual absence of beach seine fishing in 1999 and 2000. However, this was probably reversed by the subsequent re-emergence of the seine fishery.
Equity, involving the representation of users and stakeholders and transparency of management also improved in the Lake Kainji fishery, however, perhaps not optimally due to the emphasis on channeling decisions through the Traditional Authorities rather than through the fisherfolk.
Page: 297
Chapter 8
An important consideration when assessing co-management in Lake Kainji was
that it was in its infancy. For example, the licensing exercise only Involved the
allocation of licenses and not controlling entry into the fishery. Likewise, there was little evidence that the communities assisted in preventing people from beach
seining. It was largely left to the government to identify, arrest and prosecute
offenders.
A similar situation occurred around Lake Malombe. Access by seiners was
controlled by fisherfolk. However, they did not arrest or prosecute offenders for
fear of recrimination (Nara et al., 1999). The control of access against family and friends living outside the community may be a major Issue In some cultures (Ayres of al., 1996).
The co-management approach for Lake Kainji relied on police seizing units to
'mop up' remnant groups of beach seiners. It Is thought unlikely that more
extension work could have entirely prevented the need for such units. It Is further
considered that most co-management projects regulating access or gear typo will
perhaps require some prosecution activity to ensure all groups comply. Case
studies by Sverdrup-Jensen & Raakja3r Nielsen (1997) found that communities
were able to develop regulations, but the implementation also ultimately relied on
government institutions.
On a more positive note, the implementation of co"managemont for Lako Kainji Improved the working relationship between government officers, the Traditional Authorities and the fisherfolk. The drawback was that the lack of success of the ban on beach seines increased tensions between beach seino users and non users, causing rifts In communities. This is possibly a healthy sign and a stage which must be gone through in order for the majority of fisherfolk not using beach
seines to prevent the few beach seiners from fishing.
Paff©: 298
Chapter 8
Sverdrup-Jensen & Raakjarr Nielsen (1997), who studied eight examples of
co-management, stated that it was too early in the history of co-management to
assess whether the approach can solve the management problems in inland fisheries. It remains that for fisheries in large tropical reservoirs that there are only a few examples of co-management approaches being maintained by communities and national institutions after the departure of donor projects.
Countries where co-management is reported as having been successful include
Malaysia (Ali, 1996); Sri Lanka (Amarasinghe & De Silva, 1999) and Kenya
(Gichuki, 1996). Common features are that co-management took place in small
reservoirs where the communities have some common interest outside the fishery (mainly religious). It may be therefore that co-management has more chance of success in smaller water bodies with more homogenous communities.
THE LAKE KAINJI EXAMPLE: ARE OTHER APPROACHES AVAILABLE?
The granting of property, and therefore management, rights to the communities for
separate sections of the reservoir is common in other co-management projects. Known as TURFs (Territorial Use Rights in Fisheries) they are viewed by many as having great promise, especially in coastal resources (King & Faasili, 1999). They have been used for Lake Kariba (Sverdrup-Jensen & Raakjaor Nielson, 1997),
along the Mekong Delta in Laos (Baird, 1999) and are being considered for use In Lake Malombe (Nara at al., 1999).
Despite these achievements, TURFs were not used for Lako KaInji. Dividing the reservoir into equitable management areas was difficult duo to the largo number of villages each with differing lengths of shoreline, some of which had to be shared. Several areas included important breeding or nursery grounds that may have become heavily exploited from communities confined to one area. The division of shoreline may also have caused conflict duo to the number of diverse groups involved, especially those fisherfolk who traditionally moved around the lake to fish
and with other users of the reservoir and shoreline such as farmers, aquatic grass gatherers and nomadic cattle herders.
Pag©: 299
Chapter 8
An alternative co-management approach is used in Malaysia. Ali (1996) stated that
fish traders are able to control fish size by controlling credit to fishermen and
refusing to buy small-sized fish. The approach would appear to suit small-sized
and organised fisheries, but is unlikely to succeed in larger and more diverse lakes
such as Lake Kainji, given the numerous landing sites and the lack of organisation
of the fish traders who, due to the shortage of fish, buy any species and size.
The co-management of Lake Kainji ultimately relied on top-down management. A solution may therefore be to develop a co-management system that would be
supported by patrol units that are developed through co-management rather than
being the responsibility of national institutions. The patrol unit may be funded
through the fines paid by offenders. To address accountability and honesty, the
unit could be staffed by elected representatives some of who are not fisherfolk.
CONCLUSION
The design and implementation of co-management for Lake Kainji and its
comparison with other case studies highlighted that:
1. Centralised top-down management is expensive to maintain. National
institutions are generally unable to justify or sustain such costs. When used, top-down methods often result in non-cooperation between fisheries officers and the fisherfolk.
2. National institutions may be unwilling to lot-go of revenue generating
opportunities from patrol and fine methods.
3. A minimum of 10 years is required to develop and ensuro sustainability of co-management approaches.
4. Co-management approaches need to be developed separately for each reservoir, taking into account the individual socio and fishery settings within each.
Page: 300

Chapter 8
5. Co-management approaches need to be able to adjust to suit changing
conditions and require a sense of 'learning by doing'.
6. An important function of donor projects is to develop dialogue between the
national institutions and the communities.
7. Communities should be involved in the initial decision to use co-management.
8. Donor projects should ensure that the communities understand and are
encouraged to participate in co-management themselves and not they act through the directives given by Traditional Authorities.
9. Reservoirs often have large migrant groups who have differing interests and
expectations of co-management. These need to be targeted early on, through extension to encourage their participation in co-management.
10. Reservoir fisheries attempting to ban profitable fisheries are likely to have to
resort to top-down methods of enforcement (at least in Africa).
11. There is need for greater coordination and multi sector approach among donor institutions and national institutions in co-management activiti©s.
REFERENCES
Abdullah, N. M., Kuperan, K. and Pomeroy, R. (1997). Transaction costs and fisheries co-management. University P©rtanian Malaysia & ICLARM Serdang Selangor & Manila: Fisheries Co-management Research Project, Working Document. 12pp.
Adimula, A. and du Feu, T. A. (1998). The construction and performance of a mid- water seine net for the sustainable exploitation of clupeids in Kainji Lake. An internal report of the Kainji Lake Fisheries Promotion Project. GTZ, Eschbom, Germany. 15pp.
Pag©: 301
Chapter 8
Adu, F. A. (1996). The nutritional status of pre-school children, Kainji Lake
communities, Nigeria :a baseline survey. Kainji Lake Fisheries Promotion
Project Technical Report Series. No. 3. GTZ, Eschbom, Germany. ISBN 978 037 002 1.37pp.
Adu, F. A. (1999). The nutritional status of pre-school children, Kainji Lake
communities. A follow-up survey. Kainji Lake Fisheries Promotion Project Technical Report Series. No. 16. GTZ, Eschbom, Germany. ISBN 978 037
0161.29pp.
Ali, A. B. (1996). Community-based management in inland fisheries: case studies from two Malaysian fishing communities. In: Stock Assessment in Inland
Fisheries. I. G. Cowx, ed. Fishing News Books, Oxford. ISBN 0 85238 224 3.
27: 482-494.
Amarasinghe, U. S. and De Silva, S. S. (1999). Sri Lankan reservoir fishery: a case
study for introduction of a co-management strategy. Fisheries Management
and Ecology. 6: 387-399.
Anne, I., A. Lelek and W. Tobias. (1994). Post-impoundment changes in water
quality and fish stocks in two large West African reservoirs (Manantali and Selingue, Mali). International Revue Gesamten Hydroblology, 79, (1): 61.75.
Ayres, J. M., Lima-Ayres, D., Albemaz, A. L., Marmontol, M., Quoiroz, H. L.,
Bartherr, R. B., Alves, A. R., Moura, E., da Silveira, R. and Santos, P. (1996).
Mamiraufi: the conservation of Amozonlan flooded forests. Workshop 3: of the International Conference on Wetlands and Development hold In Kuala
Lumpur, Malaysia, 9-13 Oct. 1996. Case Study 1: 105-120.
Bailey. R. L., Churchfield, S., Petr, T. and Pimm, R. (1978). The ecology of the fishes
in Nyumba ya Mungu reservoir, Tanzania. Biological Journal of th© Llnnoan Society. 10: 109-137.
Page: 302

Chapter 8
Baird, I. G. (1999). The Co-management of Mekong River Inland Aquatic Resources
in Southern Lao, PDR. Paper presented at the International Workshop on Fisheries Co-Management Berjaya Georgetown Hotel Penang, Malaysia
23-28 Aug. 1999: 28pp.
Barbosa, F. I. and Hartmann, W. D. (1998). Participatory management of reservoir fisheries in North-Eastern Brazil. In: Inland Fishery Enhancements. Papers
presented at the FAOIDFID Expert Consultation on Inland Fishery
Enhancements Dhaka, Bangladesh, 7-11 April 1997. T. Petr ed. FAO
Fisheries Technical Paper. No. 374. Rome FAO: 427-445.
Berkes, F. (1994). Co-management: bridging the two solitudes, Northern
Perspectives. 22: 18-20.
Claridge, G. and O'Callaghan, B. (1996). Wetlands, Local People and Development,
Workshop 3: of the International Conference on Wetlands and Development
held in Kuala Lumpur, Malaysia, 9-13 Oct. 1996.1: 3-7.
De Silva, S. S. (1988). Reservoirs of Sri Lanka and their fisheries. FAO. FAO Fisheries Technical Paper. 298.128pp.
du Feu, T. A. (2003). Data collection in a reservoir fishery (Lake Kainji, Nigeria); the trade-off between cost and accuracy. PhD. Thesis submitted to the University of Hull, UK. Chapter 7: 229-261.
FAOSTAT. (2001). CD-ROM. FAO Statistical Databases. FAO, Rome, Italy, ISBN 9250 045 352.
Feeny, D. (1992). Where do we go from here? Implications for the research agenda. In: Making the Commons Work. D. W. Bromley, ed. Institute of Contemporary Studies Press: San Francisco.
Fernando, H. and Petr, T. (1994). Reservoir fishery management and tropical limnology. International Revue Gesamten Hydrobiology. 79, (1): 3.5.
Pago: 303

Chapter 8
Gichuki, C. M. 1996. Community participation in wetland conservation in Africa. A
case study of Lake 01 Bolossat, Kenya. Proceedings of Workshop of the
International Wetlands and Development Conference, Kuala Lumpur,
9-13 October 1995. J. van Vessem, ed. Wetlands International, ' Kuala
Lumpur, Malaysia. 71 pp.
Gorjestani, N. (2000). Indigenous knowledge for development: opportunities and
challenges. Paper presented at the UNCTAD Conference on Traditional
Knowledge, Geneva, Nov., 2000.8pp.
Hara, M. M., Donda, S. J and Njaya, F. (1999). An evaluation of the Lake Malombe
co-management programme. Paper presented at an international workshop
on fisheries co-management, Penang, Malaysia. 23-28 Aug. 1999.
Hardin, G. (1968). The Tragedy of the Commons. Science, 162: 1243-1248.
Hilbom, R. and Walters, C. J. (1992). Quantitative fisheries stock assessment: Choice, dynamics and uncertainty. London: Chapman & Hall. 570pp.
Jenness, J. (1973). Fishing and the fishermen of the Kainji Lake Basin. In: KalnJi-
a Man-Made Lakes, Kainji Lake Studies. Vol. 2, Socio-oconomlc Conditions.
A. L. Mabogunje ed. Published by the Nigerian Institute of Social and
Economic Research. I badan: 49-69.
Jentoft, S. (2000). The community: a missing link of fisheries manag©m©nt. Marino
Policy. 24: 53-59.
Jentoft, S., McCay, B. J. & Wilson, D. C. (1998). Social theory and fishorios
co -management. Marine Policy. 22: 423-436.
King, M. and Faasill, U. (1999). Community-based management of subsistonco fisheries in Samoa. Fisheries Management and Ecology. 6: 133-144.
Pago: 304
Chapter 8
KLFPP (Nigerian-German Kainji Lake Fisheries Promotion Project). (1996). Situation
Report. An internal report of the Kainji Lake Fisheries Promotion Project.
GTZ, Echbom, Germany. l3pp.
La Vina, A. G. M. (2002). Community- based approaches to marine and coastal
resources management in the Philippines: a policy perspective. In: Institutional Issues and Perspectives in the Management of Fisheries and Coastal Resources in Southeast Asia. ICLARM: ISBN: 983 2346 07 X:
ICLARM: 91-142.
Little, P. D. (1994). The link between participation and improved conservation: a review of issues and experiences. In: Natural Connections: Perspectives in Community-Based Conservation. (eds. D. Western and R. M. Wright). Proceedings of a workshop held in Airlie, Va., Oct. 18-22,1993. ISBN: 1 55963 346 8 X. 15: 347-372.
Mabogunje, A. L. [ed. ]. (1973). Kainji- a man-made lake, Kainji Lake Studies. Vol. 2,
Socio-economic Conditions. Published by the Nigerian Institute of Social and Economic Research. I badan. 185pp.
Machongela, P., Jackson, J., Malasha, I., Muriritirwa, W., Nyikahadzo, K. and Sen,
S. (1996). An analysis of emerging co-management arrangements. The
Zambian and Zimbabwean inshore fisheries of Lake Kariba. S. Sen, ed. IFM & ICLARM, Hirtshals & Manila. Fisheries Co-management Research
Project.
Malasha, I. (1999). Taking advantage of co-management: The institutional landscape in the Zambian inshore fishery of Lake Kariba. Paper presented at the International Workshop on Fisheries Co-management, Berjaya Georgetown Hotel, Penang, Malaysia, 23-28 Aug. 1999.12pp.
Page: 305
Chapter 8
Mandima, J. J. (1996). Limitations of catch and effort data collection methods used for inland fisheries in the SADC region, with particular reference to Zimbabwe. In: Stock Assessment in Inland Fisheries. I. G. Cowx, ed. Fishing News Books, Oxford. ISBN 0 85238 224 3.27: 368-377.
Medagama, J. (1989). Adjusting the Process for Participatory Management in Small
Scale Reservoir Systems through Team Approach: A Case Study in North
Central Sri Lanka.
Nathanael, S. and Edirisinghe, U. (2002). Developing co-management in an artisanal
gill net fishery of a deep hydro-electric reservoir in Sri Lanka. Fisheries
Management and Ecology, 9: 267-276.
Neiland, A. E., Weeks, J., Madakan, S. P., and Ladu, B. M. B. (2000a). Inland fisheries
of North East Nigeria including the Upper River Benue, Lake Chad and the
Nguru-Gashua wetlands. II. Fisheries management at village level. Fisheries
Research. 48: 245-261.
Neiland, A. E., Jaffry, S., Ladu, B. M. B., Sarch, M. T, and Madakan, S. P. (2000b).
Inland fisheries of North East Nigeria including the Upper River Benue, Lake
Chad and the Nguru-Gashua wetlands. I. Characteristics and analysis of
planning suppositions. Fisheries Research. 48: 229-243.
Nielson. J. R. (1996). Fisheries co-management. Theoretical aspects, international
experiences and future requirements. Presentation at the Annual Finnish Fisheries Conference. 28-29 Nov. 1996. Turku, Finland. 15pp.
Nyikahadzoi, K. and Songore, N. (1999). Towards co-management arrangements in Lake Kariba Inshore fishery. progress, constraints and opportunities. Paper
presented at the International Workshop on Fisheries Co-management, Berjaya Georgetown Hotel, Penang, Malaysia, 23-28 Aug. 1999: 17pp.
Petr, T. (1994). Intensification of reservoir fisheries in tropical and subtropical countries. International Revue Gesamten Hydrobiology, 79, (1): 131-38.
Page: 306
Chapter 8
Pomeroy, R. S. (1998). A process of community-based fisheries co-management. NAGA, The ICLARM Quarterly, 1998.21, No. 1: 71-76.
Pomeroy, R. S. and Williams, M. J. (1994). Fisheries co-management and small scale fisheries: a policy brief. International Centre for Living Aquatic Resources, Manila (ICLARM). 15pp.
Pomeroy, R. S., Pollnac, R. B., Predo, C. D., and Katon, B. M. (1996). Impact
evaluation of community-based coastal resource management projects in
the Philippines. NAGA. The ICLARM Quarterly. 19: 9-12.
Pomeroy, R. S. and Berkes, F. (1997). Two to tango: the role of governments in fisheries management. Marine Policy. 5: 465-480.
Pomeroy, R. S., Pollnac, R. B., Katon, B. M and Predo, C. D. (1997). Evaluating factors
contributing to the success of community-based coastal resource
management: the Central Visayas Regional Project-1, Philippines. Ocean & Coastal Management. 36.1-3: 97-120.
Postma, D. J. and van der Knapp, M. (1999). Developments in the fishery of Lagdo
Reservoir, Cameroon. In: Fish and Fisheries of Lakes and Reservoirs in
Southeast Asia and Africa. (eds. W. L. T. van Densen and M. J. Morris).
Westbury Publishing, Otley, UK. ISBN 1 84103 004 X: 311-325.
Quirös, R. (1998). Reservoir stocking in South America, an evaluation. In: Inland
Fishery Enhancements. Papers presented at the FAO/DFID Expert Consultation on Inland Fishery Enhancements Dhaka, Bangladesh, 7-11 April 1997. T. Petr ed. FAO Fisheries Technical Paper. No. 374. Rome FAO: 91-118.
Raakjarr Nielsen, J., Sen, S., Sverdrup-Jensen, S., and Pomeroy, R. S. (1995). Analysis of fisheries co-management arrangements: A research framework. Joint Institute of Fisheries Management (IFM) & ICLARM publication. Co-
management Working Paper, No 1.28pp.
Page: 307
Chapter 8
Raakjarr Nielsen, J., Degnbol, P., Kuperan Viswanathan, K. and Ahmed, M. (2002).
Fisheries co-management: an institutional innovation. Perspectives and
challenges ahead. IIFET 2002 Conference, Aug. 19-22, Wellington, New
Zealand. Paper no. 216.1 Opp.
Richards, M. (1997). Common property resource institutions and forest management in Latin America. Development and Change. 28: 95-117.
Robinson, J. G. and Bennett, E. L. [eds]. (2000). Hunting for sustainability in tropical forests. Columbia University Press. ISBN 0 231 10976 8.
Roder, W. (1993). Human adjustment to Kainji Reservoir in Nigeria. An assessment
of the economic and environmental consequences of a major man-made lake in Africa. University Press of America, Inc. Maryland. ISBN 0 8191 9333
X. 188pp.
Sajise, P. (1995). Community-based resource management in the Philippines:
perspectives and experiences. A paper presented at the Fisheries
Co-management workshop at the North Sea Centre, 29-31 May, Denmark.
Sen, S. and Raakjaer-Nielsen. J. (1996). Fisheries co-management: A comprehensive analysis. Marine Policy. 20. (5): 405-418.
Sverdrup-Jensen, S. and Raakjaer Nielsen. J. (1997). Co-management in small-scale fisheries. A synthesis of Southern and West African experiences. Paper
presented at IASCP conference in Vancouver, Canada, 9-14 June.
In: Fisheries Co-management in Africa. Proceedings from a regional workshop on fisheries co-management research held 18-20 March 1997, Mangochi, Malawi. 23pp.
Thole, L. S. and Dodman, T. (1996). Traditional and modern approaches to
community wetland management in Zambia. Indonesia. Workshop 3: of the International Conference on Wetlands and Development held in Kuala Lumpur, Malaysia, 9-13 Oct. 1996. Case Study 8: 202-213.
Page: 308
Chapter 8
UNEP. (2002). Global Environment Outlook 3, UNEP, Earthscan Publications Ltd,
London, ISBN: 1853 8384 54.416pp
Viswanathan K. K. (1999). Community perspectives- exclusivity of rights. In: Use of
Property Rights in Fisheries Management. R. Shotton [ed. ] Proceedings of
the FishRights99 Conference. Freemantle, Western Australia. 11-19 Nov.
1999. FAO Fisheries Tech. Pap. No. 404/1. Rome, FAO. 29pp.
Viswanathan K. K. and Ahmed, M. (2002). Communities and Institutions for common
property. Fisheries co-management news. 10 May 2002: 1.
WCD (World Commission on Dams). (2000). Dams and development: a new framework for decision making. Published by Earthscan Publications Ltd.
ISBN 1 85383 798 9.
Western, D. and Wright, R. M. [eds]. (1994). Natural connections: perspectives in
community-based conservation. Proceedings of a workshop held in
Airlie, Va., Oct. 18-22 1993. ISBN: 1 55963 346 8 X.
Westerlund, L. (1993). Community-based management of reservoirs: Experiences
from Zimbabwe. ALCOM News: 23-25.
Wickham, T. (1996). Community-based participation in wetland conservation:
activities and challenges of the Danua Sentarum Wildlife Reserve
Conservation Project, Danau Sentarum Wildlife Reserve, West Kalimantan,
Indonesia. Workshop 3: of the International Conference on Wetlands and Development held in Kuala Lumpur, Malaysia, 9-13 Oct. 1996. Case Study
5: 157-178.
Page: 309

Abbreviations
Abbreviations
NIGERIAN ABBREVIATIONS
KLFMCU: Kainji Lake Fisheries Management and Conservation Unit.
KLFPP: Nigerian-German (GTZ) Kainji Lake Fisheries Promotion Project.
KLRI: Kainji Lake Research Institute.
KLRP: Kainji Lake Research Project.
LGA: Local Government Authority.
NEPA: National Electricity Power Generating Authority.
NIFFR: National Institute for Fresh water Fisheries Research.
NISSER: Nigerian Institute for Social and Economic Research.
INTERNATIONAL/ OTHER ABBREVIATIONS
ACIAR: Australian Centre for International Agricultural Research.
BS: Beach seine.
CAS: Catch assessment survey.
CBFM: Community-based fisheries management.
CIFA: Committee for Inland Fisheries for Africa.
CN: Cast net.
CpUE: Catch per unit effort.
DFID: Department for International Development (UK).
DN: Drift net.
FAO: Food and Agricultural Organisation.
FiSAT: FAO-ICLARM stock assessment tools.
GIS: Geographic information system.
Page: 310

Abbreviations
GN: Gill net.
GTZ: Deutsche Gesellschaft für Technische Zusammenarbeit (GmbH); German Technical Co-operation Agency.
HER Hydroelectric power.
ICLARM: International Center for Living Aquatic Resources Management.
ICOLD: International Commission on Large Dams.
IDRC: International Development Research Centre.
IFM: Institute for Fisheries Management and Coastal Communities Development.
IPFC: Indo-Pacific Fisheries Commission.
IRN: International Rivers Network.
K: Growth rate (year").
L..: Asymptotic length at capture (cm).
Lopt : Optimal length at capture (cm).
Lmax : Maximum length at capture (cm).
LL: Long line.
M: Natural mortality (year 1).
MEI: Morpho-edaphic index.
MSY: Maximum sustainable yield.
MW: Mega Watt. Unit of electrical generating output.
NEDECO: Netherlands Engineering Company.
NGO: Non-governmental organisation.
s: Standard deviation.
SADC: Southern Africa Development Community.
SL: Standard length.
Page: 311
Glossary
to: Length at age to (cm).
UNDP: United Nations Development Project.
WCD: World Commission on Dams.
Z: Estimate of total mortality (year').
Glossary.
NIGERIAN GLOSSARY
Bundle: Refers to the bundle of gill netting material sold by traders. A bundle is
90 yards long, which reduces to 45 yards (approximately 46 meters) when
mounted and hung at a net hanging ratio of 0.5.
Catch assessment survey (CAS): Sampling of landed catch (CpUE) and fishing
activity, which is scaled up to the total number of fishing equipment (using
frame survey data) to derive fish yield. Yield for Lake Kainji is estimated for
each gear type and for each of the 20 sampled groups of fish taxon.
Coffer dam: A small dam formed upstream of the dam construction site prior to the
main flooding of the lake.
District Head: A Traditional Leader who is appointed by the Emirate Council to
administer the District and villages within the Emirate area.
Enumerators: Personnel engaged in the collection of fisheries data. Around
Lake Kainji they are employed either by the ADP or the State Fisheries
Departments.
Fish taxon groups: Fish species that share many biological characteristics and, as
such, are grouped together for measurement and yield estimation in the
catch assessment survey.
Page: 312

Glossary
Frame survey: An inventory of all the fishing villages, fishing entrepreneurs and the equipment they own. The exercise is usually done annually at a set time
and includes a total enumeration and listing of all villages, fishing
entrepreneurs (male and female), shoreline fisherfolk, canoes, engines, gill
nets, drift nets, cast nets, beach seines, longlines, and fishing traps owned.
HRH The Emir: The main traditional title holder appointed by the Council of Elders
to administer all District Heads, Village Heads and affairs and conflicts in
the Emirate area. Liaises with Central Government (Government Ministers,
State Administrators, Local Government Authorities and national institutions).
Permanent villages: Resettlement villages that were built by the Government after flooding. Also includes subsequently villages created by immigrants. The
villages usually have permanent (brick) structures.
Sarkin Ruwa: A traditional title holder in the Lake Kainji area who is responsible for
all matters pertaining to the river or lake. The Sarkin Ruwa administers
several villages and is usually less respected by the fisherfolk than the Village Head.
Temporary fishing camps: Villages that are located on the floodplain and move to
follow the annual drawdown/flood water level. -Houses are made of woven
grass matting (termed zana). They are common in the floodplain and
seasonally flooded islands of Foge Island and the eastern lake areas. Temporary fishing camps are mainly used by fisherfolk using beach seines.
Traditional Authorities: Traditional title holders who administer the Lake Kainji area through the Emirate Council. They include (in decreasing authority): HRH The Emir, Members of the Emirate Council, District Heads, Members of the District Traditional Council, Village Heads and members of the Village Council.
Page: 313
Glossary
Village Council: An elected group of villagers in each village who assist the Village
Head in the administration of the village (also termed Village Elders).
Village Head: Elected head of the village who administers the village and who
comes under the authority of the District Head and Emir.
GENERAL GLOSSARY
Amplitude (C): Represented by a value between zero and one, describes the
magnitude of the annual (seasonal) fluctuation of growth rate (K) of a species.
Asymptotic length (L. ): The mean length that a fish in a population would reach if it
were to grow indefinitely. The value often approximates the length of the
oldest fish.
Bycatch: Describes fish that are caught incidental to the main target species. Usually comprised of uneconomic/undersized species.
Catch per Unit Effort (CpUE): Weight of fish that are caught by a standard unit length of gear during a standard unit of time. For gill nets the CpUE is
expressed as kg fish per net bundle per night fishing. For cast, drift net, beach seine, fishing trap as kg fish per net (or trap) per 24 hr. For longline
as kg fish per 100 hooks per 24 hr.
Co-management: An informal or legal arrangement or partnership whereby the
authority and responsibility for the management of a resource is undertaken by the communities and interested parties (these may include Government Departments, institutions, Traditional Authorities). Co-management in a management approach that lies between State control and community- based management.
Commons: includes natural resources, such as fisheries, wildlife, forests and pasture lands, which are not owned by individuals but are shared by a community or group of users.
Page: 314

Glossary
Community: a group of people with shared common values and who have similar
stances regarding modes of behaviour and expectations and responses.
Community-based fisheries management: Where the communities, who have a long-term stake and interest in the management/ conservation of resources, have the sole authority and responsibility for the management fisheries
resource.
Drawdown: The vertical distance that the water level in reservoir falls on a daily or
seasonal basis due to extraction by uses such as HEP or irrigation.
Drawdowns may also be made for safety reasons in anticipation of a flood.
ECOPATH: Trophic modelling of aquatic ecosystems.
Fish traders: Any person who buys and sells fresh or processed fish for
commercial purposes.
Fisherfolk: A term used to describe both fishing entrepreneurs and fishing
assistants. May be either female or male.
Fisheries regulations: Restrictions placed on fishing effort or catch that are designed to limit growth or recruitment overfishing and so maximise either the fish weight or economic yield derived from the fishery.
Fisheries: A generic term used to encompass marine, inland capture and
aquaculture.
Fishery enhancement: Any intervention that is used to artificially raise the fish yield from a water body beyond that achieved purely through an open access fishery. Enhancement activities include fertilisation of the water, introductions of fish species, stocking of fish and aquaculture.
Page: 315
Glossary
Fishing activity: An indicator used to expresses the proportion of the number of
gears fishing of the total number of gears owned at any one time. It is
usually expressed as the percentage of gears fishing per month.
Fishing assistant: Any person who fishes using equipment owned by an
entrepreneur. The person either acts as the head of the fishing unit by
taking charge of the fishing operation or is an assistant to the head. Around Lake Kainji assistants are usually the children of the entrepreneur or hired
help. They can be either female or male.
Fishing effort: An indicator used to express the total number of gears in the fishery that are actively fishing. Derived by multiplying the fishing activity by the total number units of gears recorded in the frame survey.
Fishing entrepreneur: Owner of fishing equipment, including canoes, gill nets, drift
nets, cast nets, beach seines, longlines or fishing traps. An entrepreneur may own several fishing units. Can be actively fishing or shore based,
either male or female.
Fishing localities: A term used to describe all the various types of fishing
villages/camps.
Fishing mortality (F): Instantaneous rate of fishing mortality, i. e. all mortality caused to a fish population by fishing (irrespective of whether the fish is landed or not).
Growth overfishing: Where the recruits into the fishery are captured before they are able to grow to the optimal length at capture (below the size at which the yield per recruit is optimised).
Hanging ratio: A measure expressing how loosely a net is hung when mounted on head and footropes. The common ratio of 0.5 will have a 50% reduction in net length along the mounting ropes and result in mesh sizes being diamond shaped.
Page: 316
Glossary
Household: A household is one or more people, who may or may not be related, but
for whom meals are prepared using the same cooking facilities. Each
compound may therefore have one or more households.
Implementing agencies (counterpart Institution): A national institution that, through the seconded staff, works as a partner within a donor assistance project. The imlementing agencies help guide the project and contribute towards its
funding. The project is handed over to the counterpart institutions who, it is
hoped, then fully administer and fund the continuation of the project.
Impoundment: Body of water formed behind a dam.
Inland fisheries: Includes both the inland capture fisheries and production through
enhancements (stocking, aquaculture etc. ).
Instantaneous growth rate (K): The curvature parameter of VBGF, signifying the
growth rate of a species.
Institution: social structures that enable individuals and groups in a society to
access resources and address key problems such as allocation of
resources among users.
Large Dam: A dam with a height of 15 m or more from the foundation, or dams that
are between 5m and 15 m high and have a storage volume greater than
3 million. m3. Definition is according to the classification by the International
Commission on Large Dams.
Maximum economic yield (MEY): The yield above which the revenue generated from increased effort is less than that expended. MEY represents the level
of effort at which profits are maximised in the fishery.
Maximum sustainable yield (MSY): The maximum quantity of fish that can be
continually taken from the fish stock (captured) without reducing the fish
catch made during subsequent years.
Page: 317

Glossary
Immigrant fisherfolk: Fisherfolk who moved into the area to fish after lake formation and who are not indigenous to the area. Immigrants may also include those fisherfolk who come to fish every year during the main fishing
season.
Natural mortality (M): Instantaneous rate of natural mortality, i. e. all mortality to a fish population caused by factors other than fishing.
Open access fishery: A fishery where no regulations or enforcement exists to limit
the numbers of units or gears fishing. Access is free to anyone.
Optimal length at capture (Copt): The length of fish at which yield per recruit is
maximised.
Recruitment overfishing: A level of fishing effort where the adult population is
unable to replenish recruits required to maintain the population size. Recruitment overfishing is usually caused by capturing many fish below
their size at maturity.
Reservoir: Any natural or artificial holding area used to store, regulate or control
water.
Resettlement: Relocation of people who are resident in areas affected by the flooding of new reservoirs.
" State property: Rights to the resource are vested exclusively in the government which makes decisions concerning access to the resource and the level
and nature of exploitation.
Stretched mesh size: The measured distance between the two knots of an individual mesh (made by stretching them apart). All mesh sizes given within the thesis are for stretched mesh.
Page: 318
Standard conversion factors
Winter point (WP): Refers to the fraction of a year at which the species' growth
rate (K) is minimal.
World register of dams: Compiled by ICOLD. Additions to the register are voluntary. The numbers of dams listed therefore represents the minimum number existing.
Standard conversion factors.
Stretched mesh size Inch mm Inch mm 0.5 13 3.5 89 1.0 25 4.0 102 1.5 38 5.0 127 2.0 51 6.0 152 2.5 64 7.0 178 3.0 76 8.0 203
Length 1 millimetre (mm) = 0.0394 inch
= 0.3937 inch = 1.0936 yards = 0.6214 mile
I centimetre (cm) 1 meter (m) 1 kilometer (km)
Area 1 sq m (m2) 1 sq km (km2)
Weight 1 pound (lb) 1 kilogram (kg) 1 tonne (t)
Volume 1 cubic meter m3) 1 cubic foot (ft )
Power 1 kW 1 megawatt (MW)
= 10 mm = 100 cm =1.000m
= 10,000 cm2 = 1.1960 yard2 =100 hectares = 0.3861 mile2
16 ozs =1000g = 1,000 kg
=1.0dm3
= 1.34 hp = 1,000 kW
= 0.4536 kg = 2.2046 lb = 0.9842 ton
= 35.31 ft3 = 0.02832 m3
Temperature I scale degree Celsius = 1.8 scale degree Fahrenheit for Conversion °C = 5/9 (°F - 32); OF = 9/5 °C + 32
All mesh sizes mentioned in the thesis are stretched mesh sizes in mm. All measurements of lake surface area and densities of fishing entrepreneurs, canoes and gears and yield per unit area are given for lake surface area at high water (1270 km2 or 12700 ha).
Page: 319

Internet addresses
Internet addresses associated with reservoir fisheries.
www. co-management. org: A web-site concerned with co-management by the
collaborative Research Project between ICLARM, IFM and national research
partners in Asia and Africa.
www. capri. cgiar. org: CGIAR. System-wide Program on Collective Action and Property Rights, (CAPRi) promotes comparative research on the role played by
property rights and collective action institutions in shaping the efficiency,
sustainability, and equity of natural resource systems.
www. dams. org: An independent commission mandated to review the development effectiveness of large dams and developing standards, criteria and
guidelines to advise future decision making.
http: //genepi. louis-jean. com/cigb/index. htmi: International Commission on Large Dams (ICOLD). A non-governmental organisation which provides a forum
for the exchange of knowledge and experience in dam engineering.
www. iclarm. org: International Centre for Living Aquatic Resources Management,
ICLARM - The World Fish Center, an autonomous, nongovernmental, non-profit, international scientific and technical center which conducts, stimulates and
accelerates research on all aspects of fisheries and other living aquatic resources.
www. irn. org: International Rivers Network. IRN supports local communities working to protect their rivers and watersheds. Emphasis is on halting destructive
river development projects, and to encourage equitable and sustainable methods of meeting needs for water, energy and flood management.
http: //www. sandelman. ottawa. on. ca/dams/: General information on dams, water diversions, impoundments, and hydroelectric projects.
http: /lwww. worldbank. org/htmI/extdr/pb/dams/factsheet. htm: Statistics on the World Bank's Dam Portfolio.
Page: 320
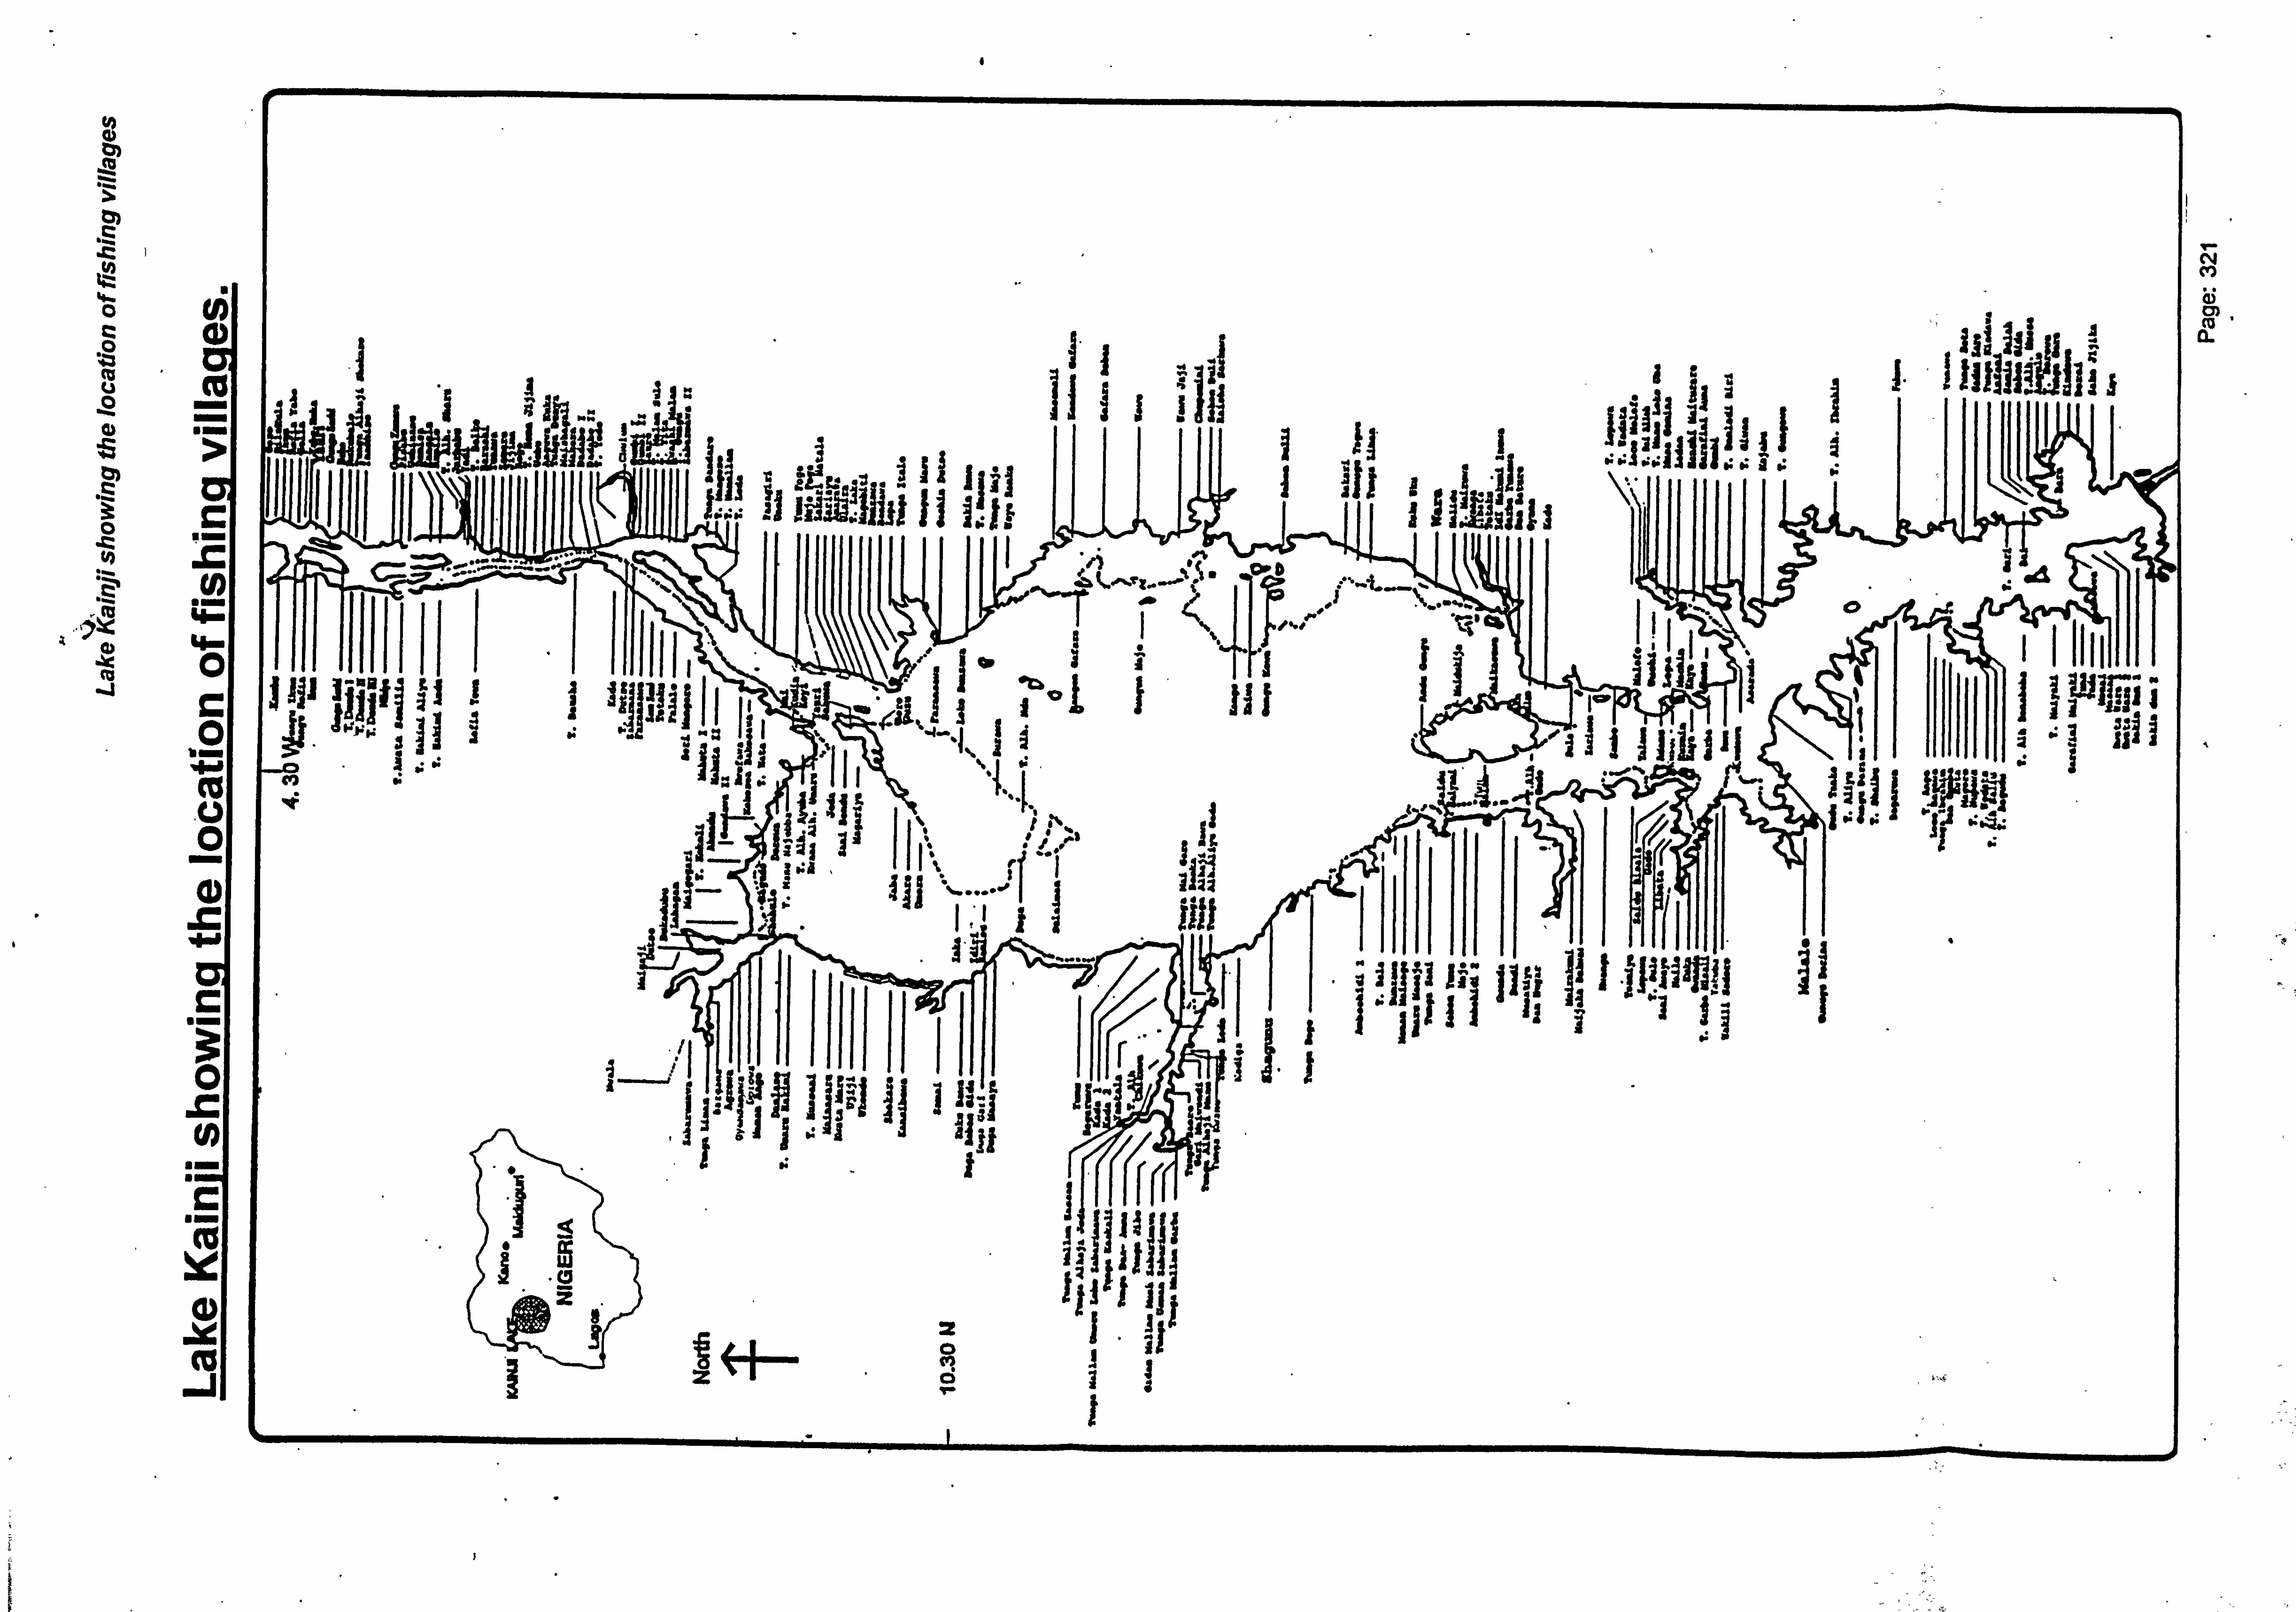
Cf
O1
,C tz
0
cu u
d
0 r y
ro
0)
m
4-
0
ti-
.v
W
C
a) J
ij 1
NN N' li_i Ji i.
fill
it
13.
iIIIIiI
ý. 3
. rK. III: ýý s Mý ` %
i 1' ,4
3
11
I ý'ýýý
1
a
H
I# .ý
dpa
MF. 1 ýhiýM M 1ý M
0 4, "W
imp it 00, 00-
tiff IIII ýý
Is: 62 8 ýýd In m6ri
s j
"'a ,; gb" 2
N i'I -
2 0 M Ö
I
1
11 till'
11
Ifill I
ist ýý1 K I. I HIiIýJ
HRWU ý IýIiI
Mill
10.14 8: .
4
V- N M a)
a
A
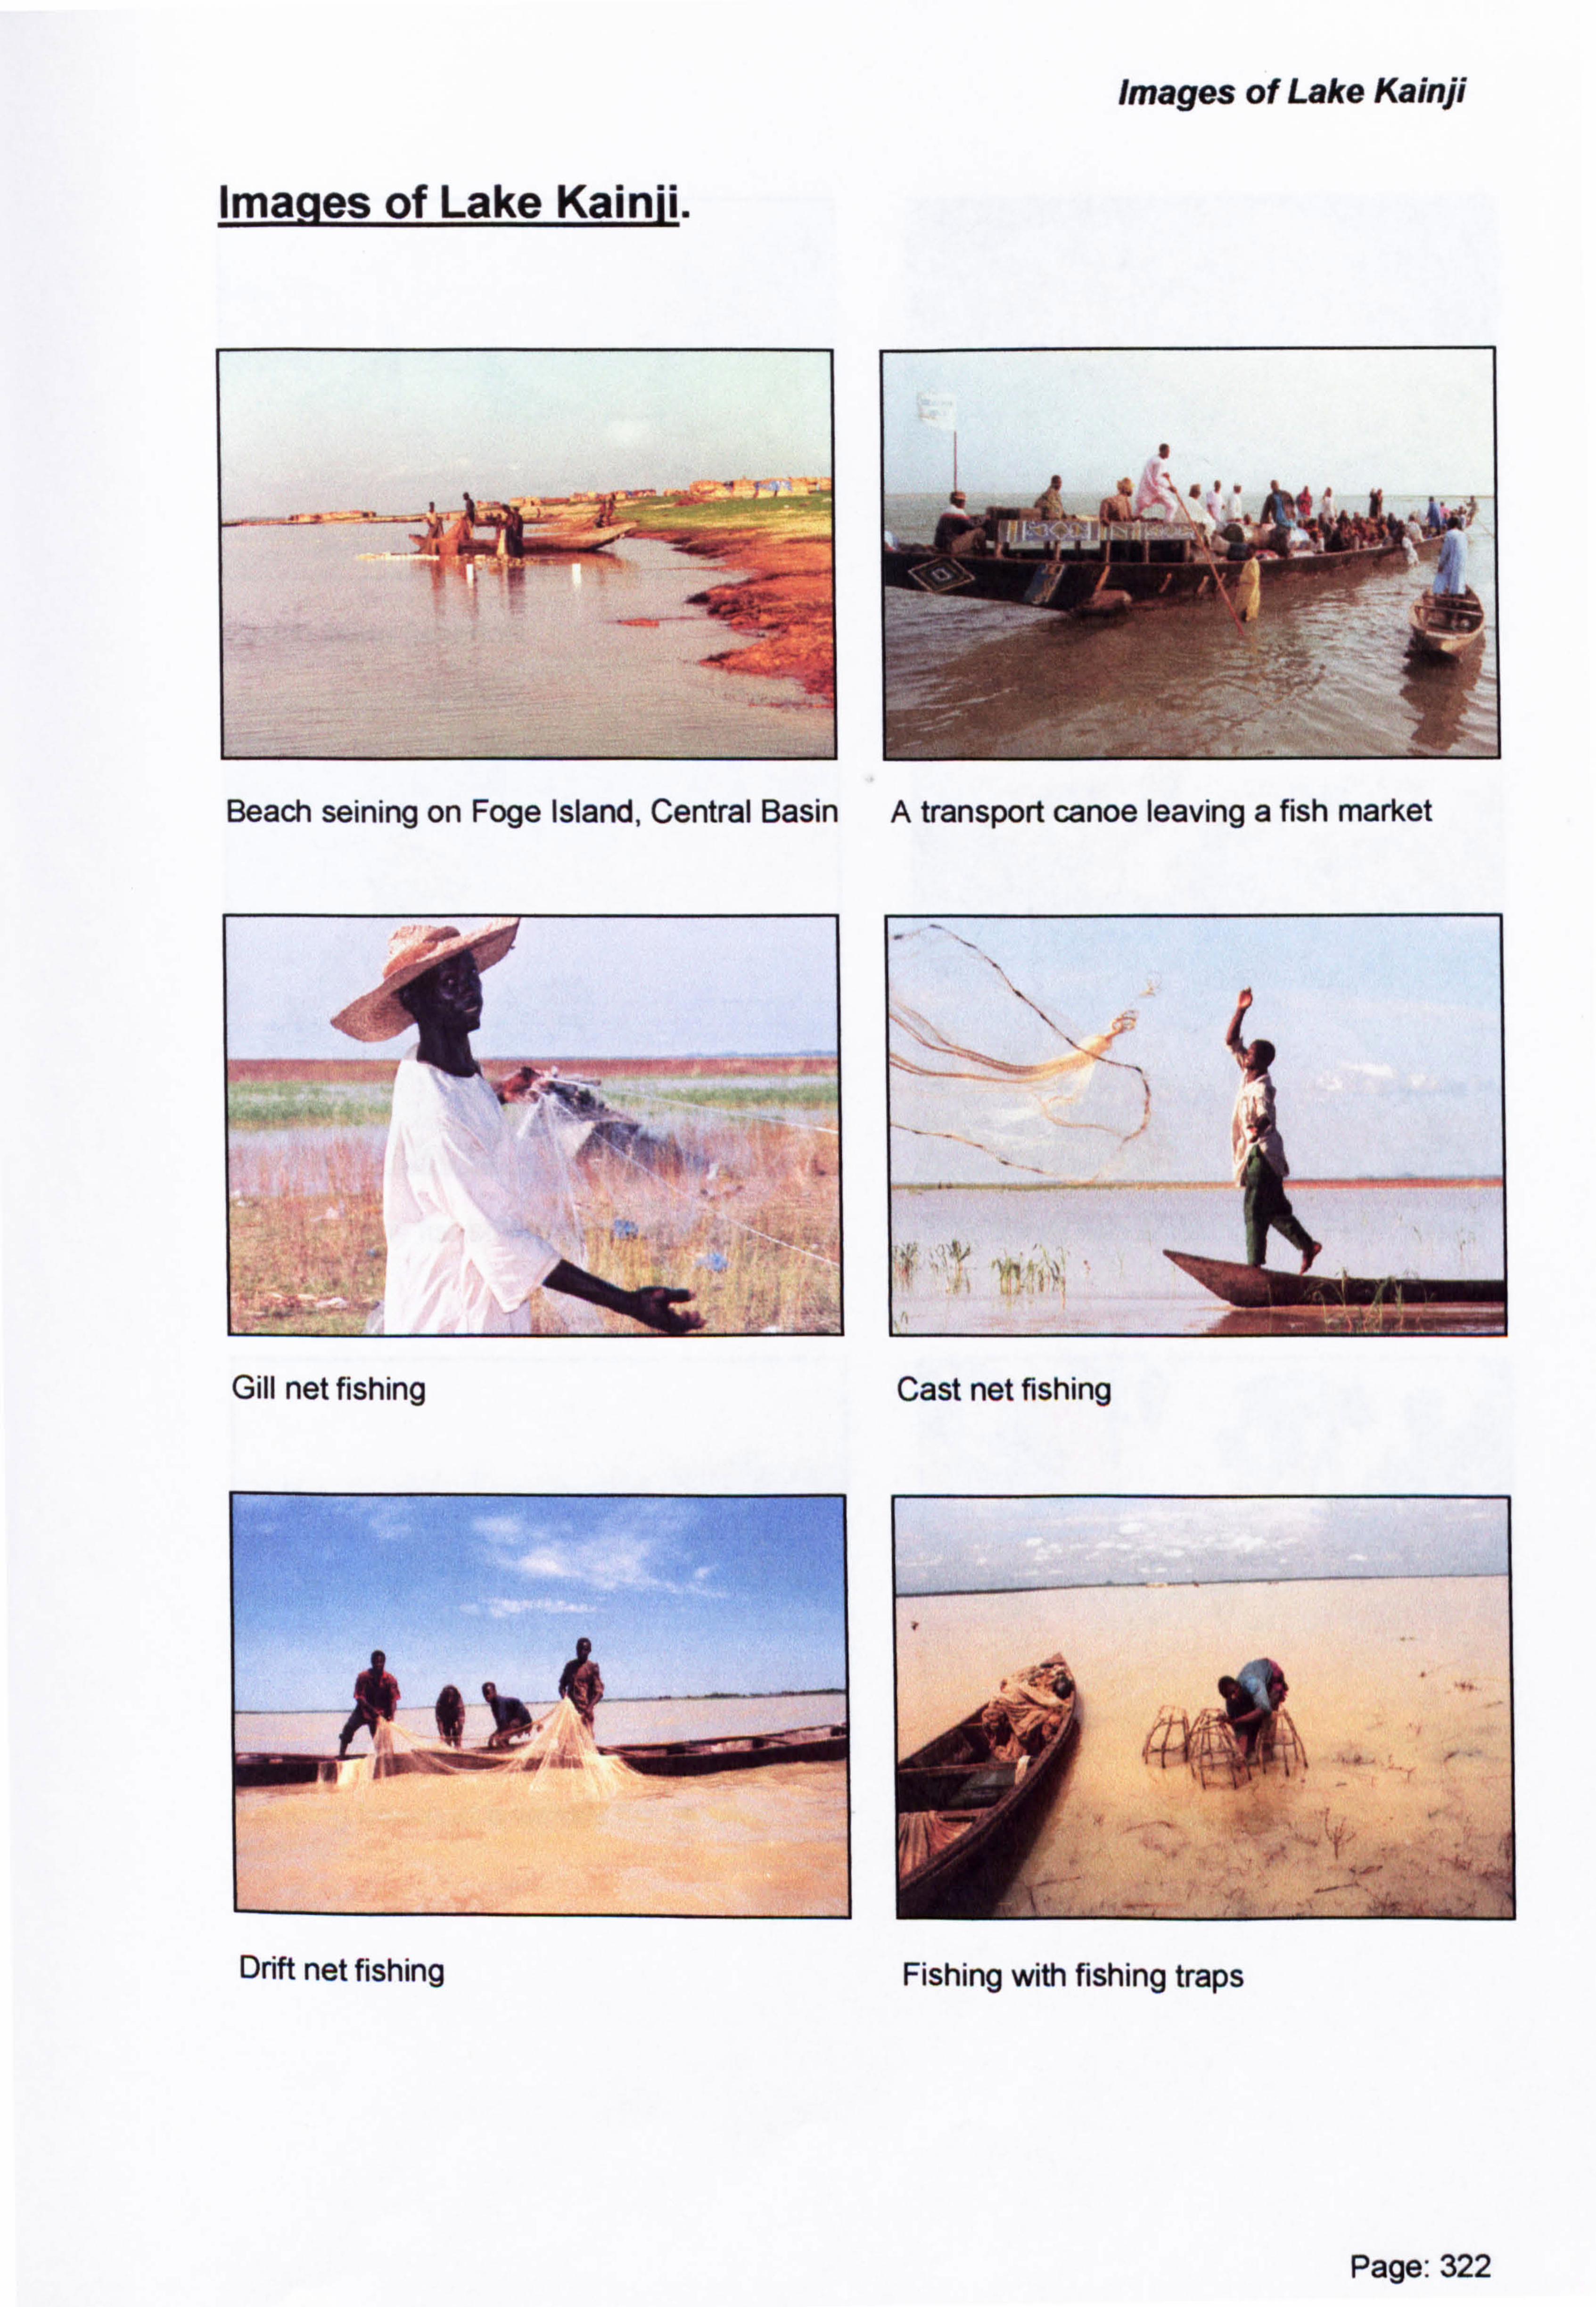
Images of Lake Kainji
Images of Lake Kainii.
M(_
I
I -. I
4
Beach seining on Foge Island, Central Basin A transport canoe leaving a fish market
-4
, ý"'"
ý-
;, ýý
ýýý, ýý _.
Gill net fishing
I
Drift net fishing
Cast net fishing
Fishing with fishing traps
Page: 322

Images of Lake Kainji
Beach seine fisherfolk Beach seine catch- Clupeidae and bycatch
Traditional fish smoking kiln, Foge Island
Landing beach at a weekly fish market Smoked fish for sale
Page: 323
One of many fisherwomen around the lake
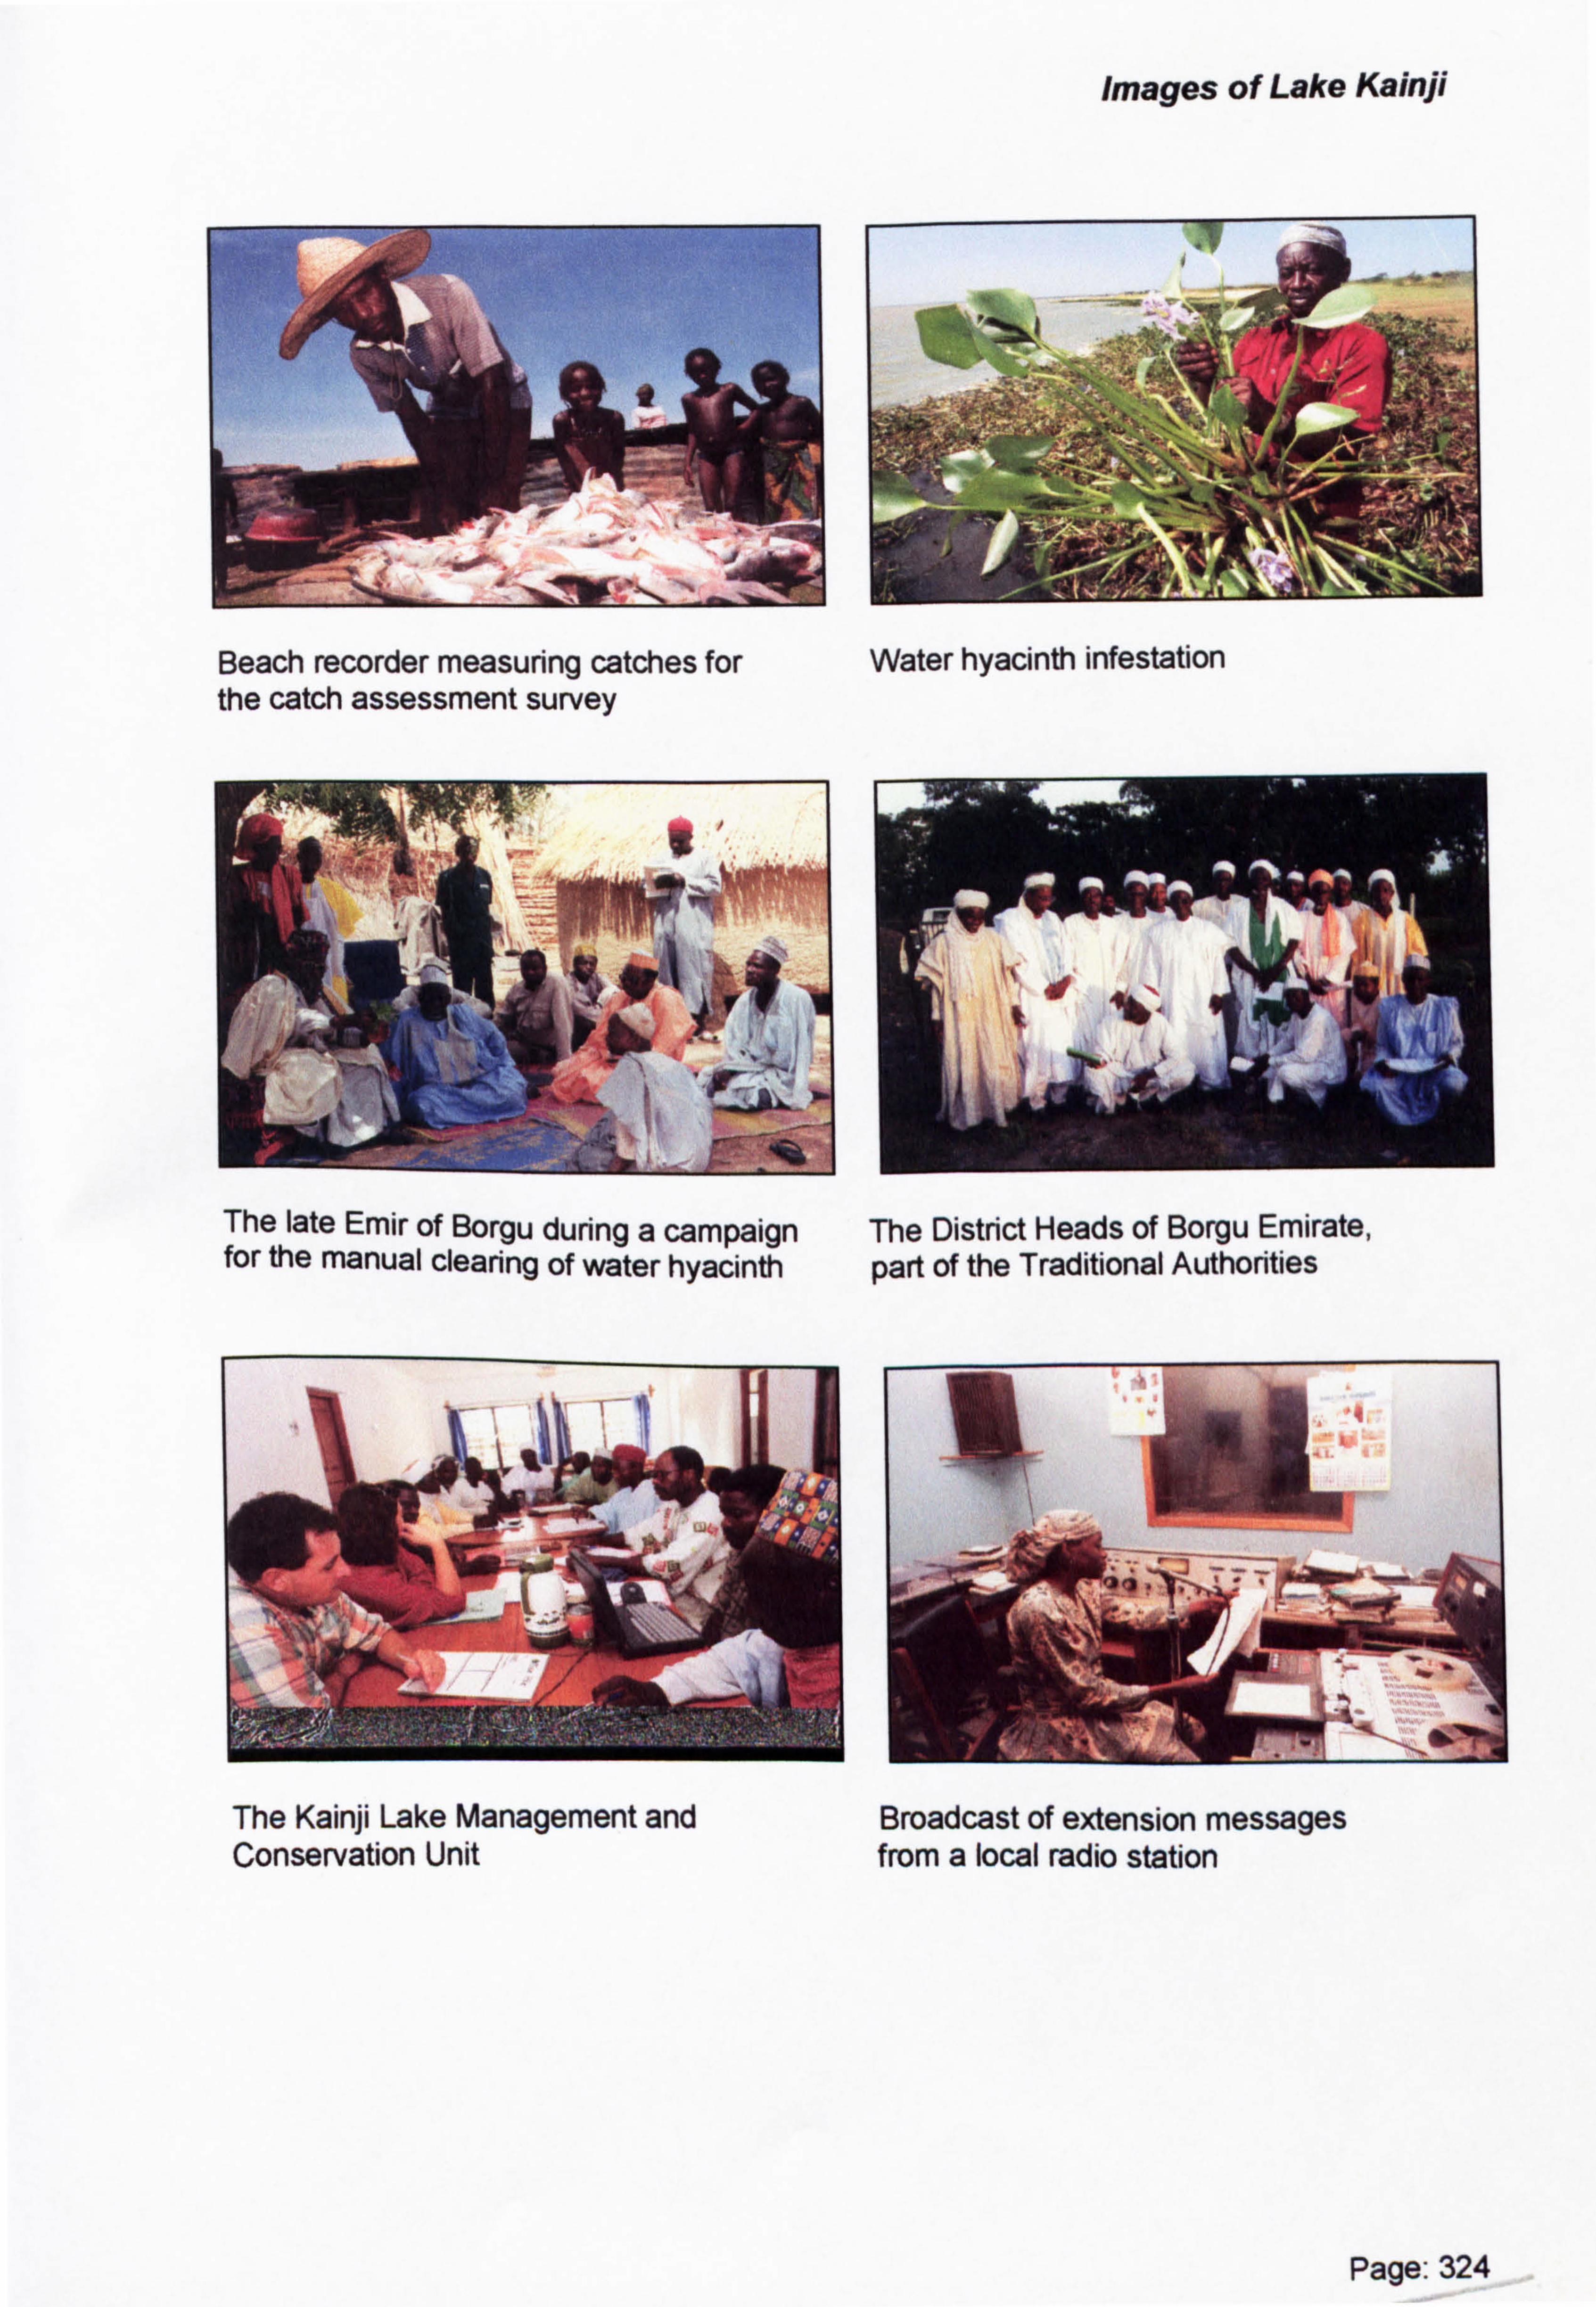
Images of Lake Kainji
: IL
Beach recorder measuring catches for Water hyacinth infestation the catch assessment survey
i ne late Emir of Borgu during a campaign The District Heads of Borgu Emirate, for the manual clearing of water hyacinth part of the Traditional Authorities
The Kainji Lake Management and Conservation Unit
Broadcast of extension messages from a local radio station
Page: 324