Tropical river fisheries valuation: background papers to a ...
301
Tropical river fisheries valuation: background papers to a global synthesis www.worldfishcenter.org Reducing poverty and hunger by improving fisheries and aquaculture STUDIES & REVIEWS | 1836
-
Upload
khangminh22 -
Category
Documents
-
view
1 -
download
0
Transcript of Tropical river fisheries valuation: background papers to a ...

Tropical river fisheries valuation: background papers to a global synthesis
Tropical river fisheries valuation: background papers toa global synthesis
Prin
ted
on 1
00%
recy
cled
pap
er.
The W
orldFish C
enter
www.worldfishcenter.orgReducing poverty and hunger by improving fisheries and aquaculture
For further information on The WorldFish Center publications please contact:Business Development and Communications DivisionThe WorldFish CenterPO Box 500 GPO, 10670 Penang, MalaysiaTel : (+60-4) 626 1606Fax : (+60-4) 626 5530Email : [email protected]
This publication is also available from: www.worldfishcenter.org
This report is a compilation of five regional reviews that document the global status of tropical rivers and inland fisheries in three continents: Latin America, Africa and Asia. It explores the role of ‘valuation’ methods and their contribution to policy-making and river fishery manage-ment. From the compilation, the best estimate of the global value of inland fisheries for those three continents is US$ 5.58 billion (gross market value), which is equivalent to 19 percent of the current value of annual fish exports from developing countries (US$ 29 billion) for 2004.
The compilation shows that there is a general shortage of information on inland fisheries, especially derived from conventional economic valuation methods, though infor-mation from economic impact assessment methods and socio-economic and livelihood analysis methods is more widely available.
The status of knowledge about the impact of changes in river management on the value of tropical river fisheries is weak and patchy. Although the impacts of large dams on the hydrology, ecology and livelihood support attributes of tropical rivers are well-recognized, there have been only few valuation studies of these issues.
The document highlights the need for further valuation studies of tropical river and inland fisheries in developing countries. It underlines how vital it is for policy-makers and other stakeholders to understand the importance of these natural resources in order to make appropriate decisions concerning their role in development policy and illustrates why capacity building in valuation should become a major priority for agencies concerned with fisheries management and policy-making.
STUDIES & REVIEWS | 1836
SR1836 cover.indd 1 5/3/2008 9:50:25 AM


Tropical River Fisheries Valuation:background papers to a global synthesis
This publication and the projects to which it relates were carried out in partnership with, and through generous funding support from,
the Comprehensive Assessment of Water Management in Agriculture and the Challenge Program on Water and Food. WorldFish
also gratefully acknowledges the highly valued unrestricted funding support from the Consultative Group on International Agricultural
Research (CGIAR) specifically the following members: Australia, Canada, Egypt, Germany, India, Japan, New Zealand, Norway, the
Philippines, Sweden, the United Kingdom and the United States of America.

ii
This publication should be cited as:
Neiland, A.E. and C. Béné (eds.) 2008. Tropical river fisheries valuation: background papers to a global synthesis.
The WorldFish Center Studies and Reviews 1836, 290 pp. The WorldFish Center, Penang, Malaysia.
National Library of Malaysia Cataloguing-in-Publication Data
ISBN 978-983-2346-61-6
Photographers (cover photo): Chris Béné (Man operating a giant net on the Benue River, Nigeria)
Printed by: Viper Solution
© 2008 The WorldFish Center
All rights reserved. This publication may be reproduced in whole or in part for educational or non-profit purposes
without permission if due acknowledgement is given to the copyright holder. This publication may not be
reproduced for profit or other commercial purposes without prior written permission from the The WorldFish
Center. To obtain permission, contact the Communications Division <[email protected]>.
iii
Contents
Foreword iv
Executive summary v
Introduction vi
Chapter
1 Review of River Fisheries Valuation in Central and South America 1
2 Review of River Fisheries Valuation in West and Central Africa 47
3 The Valuation of Riparian Fisheries in Southern and Eastern Africa 107
4 Review of River Fisheries Valuation in Tropical Asia 147
5 Values of Inland Fisheries in the Mekong River Basin 227
iv
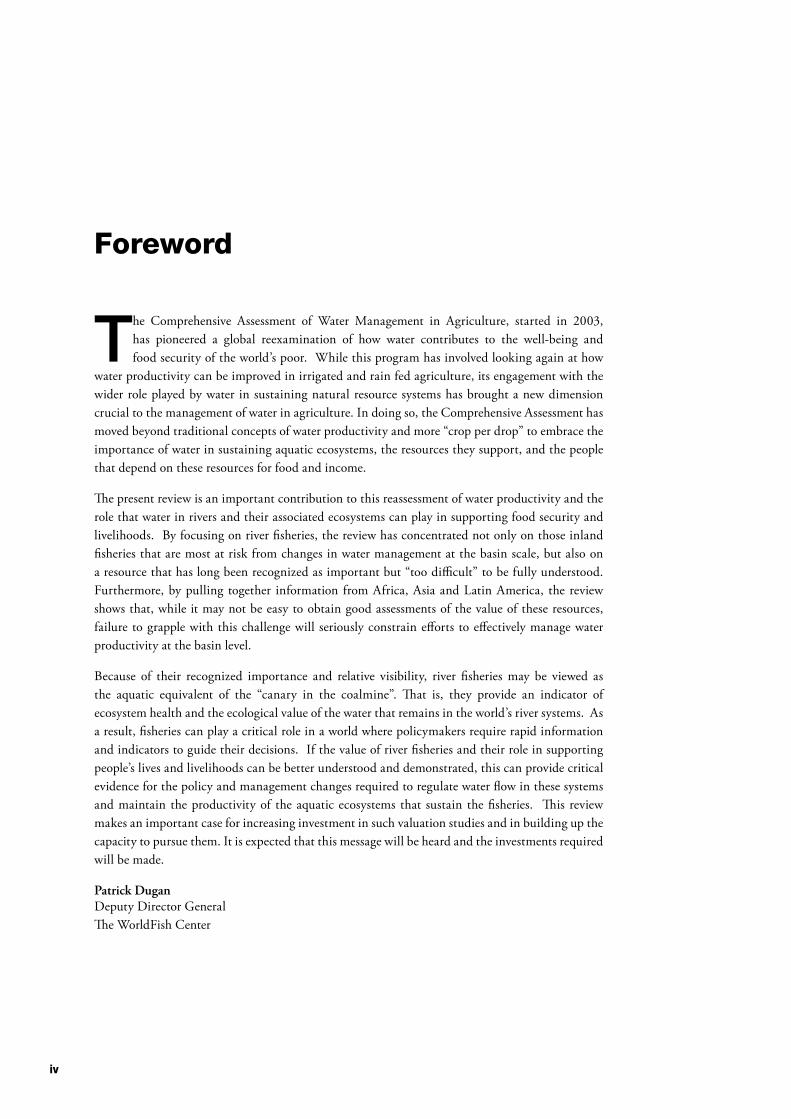
The Comprehensive Assessment of Water Management in Agriculture, started in 2003, has pioneered a global reexamination of how water contributes to the well-being and food security of the world’s poor. While this program has involved looking again at how
water productivity can be improved in irrigated and rain fed agriculture, its engagement with the wider role played by water in sustaining natural resource systems has brought a new dimension crucial to the management of water in agriculture. In doing so, the Comprehensive Assessment has moved beyond traditional concepts of water productivity and more “crop per drop” to embrace the importance of water in sustaining aquatic ecosystems, the resources they support, and the people that depend on these resources for food and income.
The present review is an important contribution to this reassessment of water productivity and the role that water in rivers and their associated ecosystems can play in supporting food security and livelihoods. By focusing on river fisheries, the review has concentrated not only on those inland fisheries that are most at risk from changes in water management at the basin scale, but also on a resource that has long been recognized as important but “too difficult” to be fully understood. Furthermore, by pulling together information from Africa, Asia and Latin America, the review shows that, while it may not be easy to obtain good assessments of the value of these resources, failure to grapple with this challenge will seriously constrain efforts to effectively manage water productivity at the basin level.
Because of their recognized importance and relative visibility, river fisheries may be viewed as the aquatic equivalent of the “canary in the coalmine”. That is, they provide an indicator of ecosystem health and the ecological value of the water that remains in the world’s river systems. As a result, fisheries can play a critical role in a world where policymakers require rapid information and indicators to guide their decisions. If the value of river fisheries and their role in supporting people’s lives and livelihoods can be better understood and demonstrated, this can provide critical evidence for the policy and management changes required to regulate water flow in these systems and maintain the productivity of the aquatic ecosystems that sustain the fisheries. This review makes an important case for increasing investment in such valuation studies and in building up the capacity to pursue them. It is expected that this message will be heard and the investments required will be made.
Patrick DuganDeputy Director GeneralThe WorldFish Center
Foreword
v
River fisheries, and in general inland fisheries, in the tropical regions of the world provide a range of benefits including a means of livelihood and a source of food for millions of people. However, national policies relating to crucial issues, such as economic development,
poverty alleviation, food security, conservation and sustainability, often fail to recognize these important attributes. This compilation of regional reviews documents the role of valuation and its contribution to policy-making and river fishery management. The document aims to provide a review of the global status of tropical river and inland fisheries valuation. It also considers the impact of changes in river basin management and compares valuation approaches used in different places. From this compilation, the main findings are as follows.
The best estimate of current tropical river and inland fisheries production is 5.46 million tonnes valued at US$ 5.58 billion (gross market value), which is equivalent to 19 percent of the current value of annual fish exports from developing countries (US$ 29 billion).
There is a general paucity of information globally. This is especially the case for information derived from conventional economic valuation (CEV) methods. Information derived from economic impact assessment methods (EcIA) and socio-economic and livelihood analysis (SE-LA) methods is more widely available. However, there are still serious gaps and deficiencies in these domains.
The status of knowledge on the impact of changes in river management on the value of tropical river fisheries is weak and patchy although there is widespread recognition of these issues. Impacts of large dams on the hydrology, ecology and livelihood support attributes of tropical rivers are well-recognized, but there have been only few valuation studies of these impacts. Among other reasons, the generation of information in this area is severely constrained in many countries and river systems by a lack of institutional capacity and skills to undertake valuation studies.
Finally, the document highlights the need for further valuation studies of tropical river fisheries and inland fisheries in developing countries. It is vital for policy-makers and other particular groups of stakeholders to understand the importance of these natural resources to society and to use this understanding as a basis for making appropriate decisions concerning the role of tropical river fisheries in development policy. The importance of matching valuation methodologies and their application to the needs of policy-makers and the policy process in each country is also critical. Capacity building in valuation should, therefore, become a major priority for agencies concerned with fisheries management and policy-making.
Executive Summary

vi Tropical river fisheries valuaTion: background papers To a global synThesis
INTRODUCTION
Freshwater resources underpin the livelihoods of millions of people in developing countries. As a form of natural capital and a source of wealth, these aquatic resources, particularly small-scale fisheries that depend on these resources, can be utilized both directly (e.g., through employment) and indirectly (e.g., wealth generated and extracted is reinvested in the economy) to contribute to economic development and poverty reduction. These resources and their associated fisheries can also provide a livelihood safety net and an element of food security for poor people in many situations where there are few other economic opportunities, and where the barriers of entry to these resources are minimal.
Despite the apparent importance of fisheries and other freshwater aquatic resources for large numbers of people in developing countries, national policies relating to such central issues as economic development, poverty alleviation, food security, conservation and sustainability often fail to recognize their role. This has contributed to a widespread failure to establish effective management systems. As a consequence, it seems likely that these resources and the benefits that they provide will become increasingly overexploited and degraded in the near future. This pattern of decline, which clearly has already started to take hold, will lead to severe competition and conflict between resource users, and may lead to a gradual lowering of socioeconomic conditions and increased poverty.
What can be done to address this serious and widespread problem? For a start, there is a chance that if the importance (or ‘value’) of these aquatic resources were given greater recognition and better integrated in national policy-making, then declines might be halted and even reversed. However, in order that national policy processes can be better informed about choices and decisions relating to the
management and sustainable development of these resources, policy-makers will need a wide range of appropriate information. For most developing countries, institutional and capacity constraints mean that information about common pool resources in general is very limited. This is particularly the case for information on the value of small-scale fisheries and freshwater resources, which has tended to be overshadowed by the technical and environmental information priorities of government agencies responsible for resource utilization, development and management.
In many countries, the need to incorporate fisheries valuation within the policy process has become increasingly recognized. At the same time, new valuation techniques are starting to emerge internationally. The big challenge now is to devise approaches by which developing countries can use these new valuation approaches to assist policy-making. Among the key questions to be addressed in order to develop an appropriate information-policy approach or strategy are: What information is needed by policy-makers? What methods can be used to generate this information? And what institutional capacities are needed to use valuation methods?
Valuation of river fisheries is particularly challenging for a number of reasons. First, river and inland fisheries are often well integrated into farming systems and associated agrarian livelihoods; this makes the valuation of fisheries using a strictly sectoral approach problematic. Second, river fisheries have been greatly impacted by new water management regimes, including dams and irrigation. This means that the nature of these changes must also be included within the valuation methodology. Third, there is a strong interaction between river fisheries and other users of water resources, including power generation, farming, navigation, industry and water supply for urban uses. This requires that the process of valuation should be treated with urgency to help deal with resource-use conflicts and interactions.

eXecuTive suMMary vii
1 From these regional reviews a synthesis report was produced and published as a stand-alone document: Neiland, A. E. and C. Béné. 2006. Tropical river fisheries valuation: A global synthesis and critical review. Comprehensive Assessment of Water Management in Agriculture Research Report 15, Colombo, Sri Lanka: International Water Management Institute, 45 pp.
In order to consider how valuation might make an important contribution to future policy decisions on tropical river fisheries in developing countries, three important issues, framed as questions are considered in this document.
• What is the status of knowledge on the value of tropical river fisheries at present?
• What is known about the impact of changes in river or water management?
• What valuation techniques have been used to date and how do they compare in terms of their usefulness for future valuation assessments?
In the following chapters, the valuation of tropical river fisheries has been considered in relation to these questions through a series of review papers, commissioned to provide a global perspective covering Central and South America, West and Central Africa, Eastern and Southern Africa, and Asia1. In addition, a special review focusing on values of inland
fisheries in the Mekong River Basin – one of the most important inland fisheries in the world – is also included.
This study represents a first contribution in the field of tropical river fisheries valuation. The compilation has focused on rivers and river fisheries because it is considered that these features of inland aquatic systems throughout the tropical regions have been greatly impacted by changes in water management over the past 50 years. In turn, this has affected the value of the river fisheries and their role in the economies of the riparian countries concerned, most of which are developing countries. Inevitably, the chapters also cover other inland aquatic systems and fisheries, particularly large lakes and swamplands, and wherever possible this overlap has been identified in this report. In future, a more comprehensive survey and assessment of tropical inland fisheries will be required to take this initial study forward.

�
Elizabeth Bennett(1) and Andy Thorpe(2)
(1) Department of GeographyUniversity of PortsmouthLion TerracePORTSMOUTH PO1 3HEHampshireUnited KingdomTel: +44 2392 842489E-mail: [email protected]
This paper written whilst at:IDDRA (Institute for Sustainable Development & Aquatic Resources)Portsmouth TechnopoleKingston CrescentPortsmouth PO2 8FAHampshireUnited Kingdom
(2) Department of EconomicsUniversity of PortsmouthPortland StreetPortsmouth PO1 3DEHampshireUnited KingdomTel: +44 2392 876543E-mail: [email protected]
Review of River Fisheries Valuation in Central and South America
C H A P T E R 1
� Tropical river fisheries valuaTion: background papers To a global synThesis
Contents - Chapter 1
1. Introduction 3 1.1 Methodology 4
2. TheRivers,EnvironmentandFishingActivityofCentraland SouthAmerica 4 2.1 The Main River Basins in Central and South America 4 2.2 Other Water Resources: Lakes and Reservoirs 6 2.3 Main Species Caught in the Region 6 2.4 Central and South America River Fisheries in a Regional and Global Context 8 2.5 Freshwater Production Trends on the Continent 10 2.6 Aquaculture and Harvest of Aquarium Fish and Other Aquatic Species 10 2.7 Regional Importance of Fishing as a Livelihoods Option 10
3. TheEconomicValueofRiverFisheries 12 3.1 Total Economic Value 14 3.2 Valuation Techniques (Applicable to River Fisheries). 15 3.3 Aggregating Use and Non-Use Values and Decision-Making 17
4. TEVoftheRegion’sFisheries 19 4.1 The Amazon Basin 19 4.2 Other Inland Waterbodies 24
5. TheEconomicImpactonFisheriesofDamsandWater ManagementSchemes 25 5.1 The Itaipu Dam 27 5.2 The Tucurui Dam 27 5.3 The Yacyretá Dam 28 5.4 The Itá Dam 29 5.5 The Porto Primavera Dam 29 5.6 The URRA Dam 29 5.7 The Ralco Dam 29 5.8 Hidrovia Projects 30 5.9 Pollution Effects 31
6. Conclusion 31
References 32
Appendix 1: Major River Basins and Their Tributories in South America 37Appendix 1a: Map of Latin American Rivers 39Appendix 2: Crocodile Captures in Central and South America 1985-2001 40Appendix 3: Freshwater Culture Production in Central and South America 1965-2000 41Appendix 4: Freshwater Capture Production for Central and South America 1950-2000 44
chapTer 1 �
�. INTRODUCTION
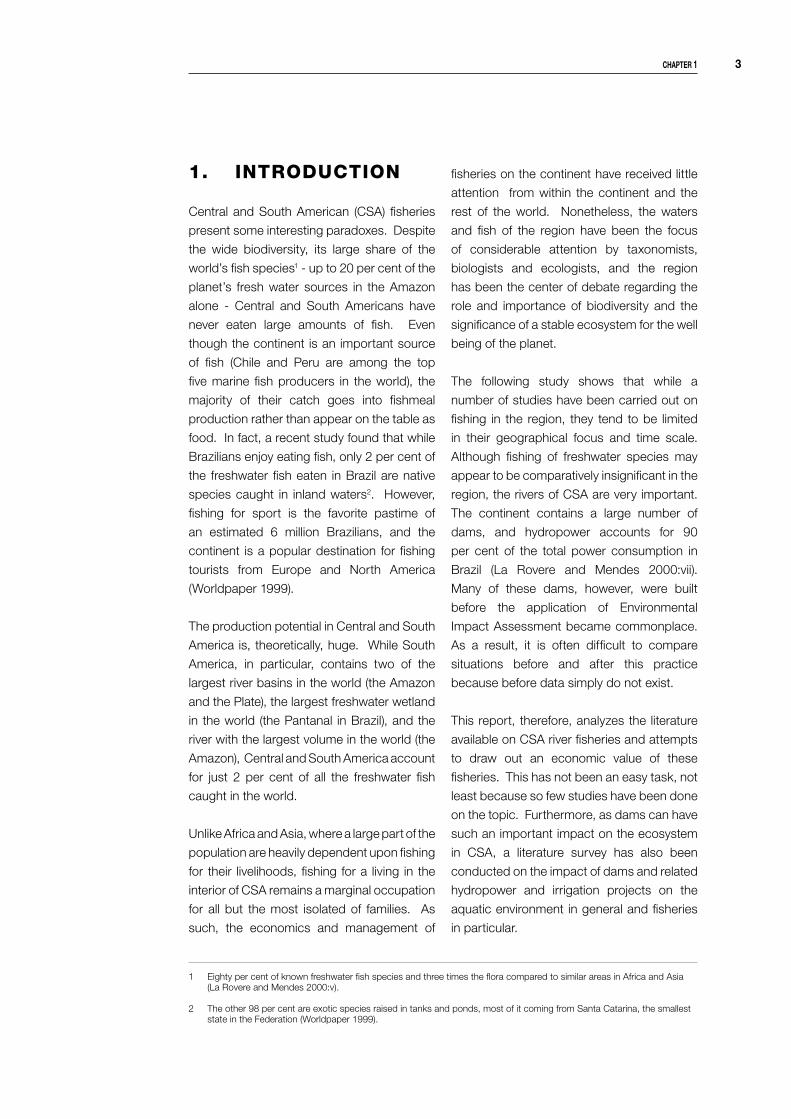
Central and South American (CSA) fisheries
present some interesting paradoxes. Despite
the wide biodiversity, its large share of the
world’s fish species1 - up to 20 per cent of the
planet’s fresh water sources in the Amazon
alone - Central and South Americans have
never eaten large amounts of fish. Even
though the continent is an important source
of fish (Chile and Peru are among the top
five marine fish producers in the world), the
majority of their catch goes into fishmeal
production rather than appear on the table as
food. In fact, a recent study found that while
Brazilians enjoy eating fish, only 2 per cent of
the freshwater fish eaten in Brazil are native
species caught in inland waters2. However,
fishing for sport is the favorite pastime of
an estimated 6 million Brazilians, and the
continent is a popular destination for fishing
tourists from Europe and North America
(Worldpaper 1999).
The production potential in Central and South
America is, theoretically, huge. While South
America, in particular, contains two of the
largest river basins in the world (the Amazon
and the Plate), the largest freshwater wetland
in the world (the Pantanal in Brazil), and the
river with the largest volume in the world (the
Amazon), Central and South America account
for just 2 per cent of all the freshwater fish
caught in the world.
Unlike Africa and Asia, where a large part of the
population are heavily dependent upon fishing
for their livelihoods, fishing for a living in the
interior of CSA remains a marginal occupation
for all but the most isolated of families. As
such, the economics and management of
fisheries on the continent have received little
attention from within the continent and the
rest of the world. Nonetheless, the waters
and fish of the region have been the focus
of considerable attention by taxonomists,
biologists and ecologists, and the region
has been the center of debate regarding the
role and importance of biodiversity and the
significance of a stable ecosystem for the well
being of the planet.
The following study shows that while a
number of studies have been carried out on
fishing in the region, they tend to be limited
in their geographical focus and time scale.
Although fishing of freshwater species may
appear to be comparatively insignificant in the
region, the rivers of CSA are very important.
The continent contains a large number of
dams, and hydropower accounts for 90
per cent of the total power consumption in
Brazil (La Rovere and Mendes 2000:vii).
Many of these dams, however, were built
before the application of Environmental
Impact Assessment became commonplace.
As a result, it is often difficult to compare
situations before and after this practice
because before data simply do not exist.
This report, therefore, analyzes the literature
available on CSA river fisheries and attempts
to draw out an economic value of these
fisheries. This has not been an easy task, not
least because so few studies have been done
on the topic. Furthermore, as dams can have
such an important impact on the ecosystem
in CSA, a literature survey has also been
conducted on the impact of dams and related
hydropower and irrigation projects on the
aquatic environment in general and fisheries
in particular.
1 Eighty per cent of known freshwater fish species and three times the flora compared to similar areas in Africa and Asia (La Rovere and Mendes 2000:v).
2 The other 98 per cent are exotic species raised in tanks and ponds, most of it coming from Santa Catarina, the smallest state in the Federation (Worldpaper 1999).
� Tropical river fisheries valuaTion: background papers To a global synThesis
1.1 Methodology
As noted above and expounded below, there is
a paucity of information on freshwater fisheries
in Central and South America compared to
the same resources in other continents. The
Internet provides a considerable amount of
gray literature – particularly statistics from
government web sites and information on
locally managed projects dealing with fishery
issues. Standard bibliographic databases
reveal a considerable amount of literature
published on biological matter in the region,
but very little on the economics or the value
of the fisheries in Central and South America.
Unlike Africa and Asia, where English is often
the academic lingua franca, Central and South
America use Spanish and Portuguese as the
main languages in all sectors. Consequently, it
is possible that studies have been conducted
on the economic valuation of river fisheries
that have never been published in English-
language journals.
A substantial part of the statistics used in
section 2 is from the FAO FISHSTAT PLUS
database. FAO statistics are, however,
only as reliable as the underlying (national)
sources and it is very possible that capture
statistics for remote areas – particularly those
fish destined for subsistence household
consumption –do not appear in the figures
presented here. Few studies on the region
have specifically mentioned the problem
with data collection, although the work of
Dias-Neto and Dornelles (1996) and Paiva
(1997) stand out in this regard. They point
out the difficulty of establishing the veracity of
statistics for the Amazon basin in particular.
Common to all isolated fishing communities,
collecting statistics for artisanal fisheries in
the Amazon basin is complicated because
fishers tend to catch a large variety of fish
and the catches are distributed at a large
number of landing sites, many of which are
only accessible by river.
This report is divided into a number of
sections. First, the authors describe the major
river basins on the continent, characterize
their fisheries, and place freshwater fisheries
in CSA into a global context. Second,
the authors provide a review of valuation
techniques for fisheries and use this analytical
framework to review the principal literature on
freshwater fisheries in the region. Then they
turn their attention to the economic impact
of dams and water abstraction schemes,
reviewing the available literature to ascertain
how/if economic values are computed for
the impact on fisheries. Finally, they offer
some conclusions and recommendations on
the direction for future studies of freshwater
fisheries in CSA.
2. THE RIVERS, ENVIRONMENT AND FISHING ACTIVITY OF CENTRAL AND SOUTH AMERICA
�.1 The Main river basins in central and south america
Because of their importance from a
hydrological and ecological point of view, the
rivers of Central and South America (those
in Brazil in particular) have received a great
deal of biological attention, but little work has
been done on the economics of the fisheries
operated there3.
All the major rivers of the continent are to be
found in South America as opposed to Central
America (see Appendix 1). The Brazilian
Amazon covers an area of 5 million km2, nearly
60 per cent of the territory of Brazil4. The river
3 However, a £3 million project funded by CIDA started work in Brazilian inland waters in January 2003. This project (Brazil inland fisheries, sustainable livelihoods and conservation http://www.worldfish.org/proj_sa_3.htm) aims to focus on the social and economic side of fishing in the region.

chapTer 1 �
runs 5,700 km from the Andes to the Atlantic
Ocean; with all its entire system including
about 1,100 rivers and lesser streams. The
Amazon basin, which accounts for a fifth of
the freshwater on the planet, includes the
white water rivers such as the Amazon that
are rich in minerals and suspended particles,
the clear water rivers such as the Tapajos that
also carry important quantities of suspended
particles, and the black water rivers such as
the Negro that are much poorer and owe their
dark color to acids derived from decomposing
organic materials in the flooded forests
at their margins. The basin is also divided
into the Lower and the Upper Amazon. The
Lower Amazon has been analyzed by various
authors (Bayley and Petrere 1989; Merona
1990; Santos and Ferreria 1999; Ceideira,
Ruffino and Isaac 2000).
The Amazon River system drains the world’s
largest tropical rain forest as well as the
Pantanal, the largest freshwater wetland in
the world. The Amazon basin provides over
50 per cent of Brazil’s freshwater supply,
and substantial parts of that of Peru, Bolivia,
Venezuela, Colombia and Ecuador (Map 1).
Petrere et al. (1992, 2003) studied the West
Amazon Basin and Almeida et al. (2003)
studied the Amazon as a whole (See Section
4 for more details, and Appendix 1a for the
map).
Brazil has the majority of the principal river
basins of the continent: the Nordeste,
Tocantins-Araguaia, Paraguay, Leste, Do Sul
and Sao Francisco lie exclusively within Brazil
although information on these other rivers
and river basins is limited. Despite a large
number of biological studies conducted in the
region, basic information on its fish species
is still patchy; taxonomic descriptions and
life-cycle studies are only limited to species
of greatest commercial importance (Petrere
1994) or to specific rivers, e.g., Tejerina-Garro
et al. (1998) conducted a biological study of
fish communities in the Araguaia river (part of
the Amazon basin). A few studies have been
conducted on fishers and their interactions
with the environment: Cetra and Petrere
(2001) on the middle Tocantins and the impact
of the Tucuruí dam on the fisheries; Batista et
al. (1998) on fishing gears used in the Lower
Solimões river (the local name for the western
part of the Amazon); and Agostinho and
Gomes (nd) on the links between biodiversity
and fisheries management in the Paraná
basin. In addition, Silva (1986) documented
the upper Paraguay basin, which is the
habitat of many large migratory fishes and
thus popular with recreational fishers.
Many of the rivers in the region are highly
seasonal, resulting in the basins having a
flooding and emptying cycle. The DFRP (2001)
notes that a number of rivers in the Parnaiba
basin (362,000 km2) dry up completely during
the summer. However, the larger rivers have
been dammed to generate hydropower (see
Section 5) and have in turn created a large
number of reservoirs: the São Francisco
basin, for example, has 11 dams that account
for 25 per cent of the reservoir area of the
whole country (PLANSVAF 1989).
If information on rivers within Brazil is scarce,
information on rivers in the rest of the continent
is even more limited. Take, for example, the
case of the Rio de la Plata basin, which is the
second largest in the region and the fourth
largest in the world. Covering Paraguay and
large parts of Bolivia, Brazil and Uruguay,
it forms the largest wetland corridor in the
world, from the Pantanal in Mato Grosso to
Rio de la Plata, which flows into Argentina.
Surprisingly, there are no known studies on
this basin, although a search on the Internet
demonstrates that sport fisheries predominate
4 Usage of the word “Amazon-“’ is often very loose. Amazonas is the name of a State in Brazil, which stretches from the western-most border to just east of Manaus. About three-fourths of the Amazon river is in Amazonas State, and the other quarter is in Para State. The western-most stretch of the Amazon is also called the Solimões. Amazonia tends to be used to refer to the rainforest that covers the basin.
� Tropical river fisheries valuaTion: background papers To a global synThesis
here. The Orinoco basin is shared by three
countries: Brazil, the Guyanas and Venezuela,
but the only reference encountered on
this river system was from the 1970s when
Auburn University (USA) conducted a survey
on the Upper Meta River System. Ninety-two
per cent of the Pilcomayo basin lies in Bolivia;
the river then runs down into Paraguay,
where it joins the Uruguay River, which flows
into Argentina and empties into the Atlantic
Ocean. There are currently around 30 small
mining companies operating at Potosi on
the Upper Pilcomayo; these contribute
considerable waste to the river system. As
a result, considerable attention has been
focused on water quality in this basin. Various
projects have been put forward to monitor
water quality in the river and to control mining
pollution, but few appear to have met with
any degree of success (http://www.gci.
ch/GreenCrossPrograms/waterres/water/
pilcomayo.html).
The Bio-Bio River in Chile empties into
the Pacific and is a significant source of
hydroelectric power for the country as is the
Colorado River in Argentina, which drains
into the Atlantic. This river, the traditional and
historic border between Spanish/Mapuche
populations in Chile, is 380 km long, flows
down the Andes into the Pacific, and has
a number of dams constructed across it. It
has a watershed surface area of 24,260 km2.
Over a million inhabitants are estimated to rely
upon its resources for drinking and irrigation
water, recreation and fisheries.
Finally, Mérigoux et al. (1998) described
freshwater fisheries in coastal streams in
French Guiana; Mol et al. (2000) examined the
effects of drought on freshwater fisheries in
Suriname; and Beltran Zurriago and Villaneda
Jiménez (2000) briefly mentioned inland
artisanal fishing in Colombia.
Central America has many rivers (e.g., the
Belize and Monkey rivers in Belize; the
Corobibi, Sarapiquí and Tabacón rivers in
Costa Rica; and the Rio San Juan River
in Nicaragua), but no evidence could be
found of any studies on the economics or
management of fisheries in those rivers.
However, it appears that several of the
rivers offer excellent opportunities for
sport fishing and whitewater rafting (www.
uncommonadventure.com); many offer
ecologically unique habitats to fish species
(See www.si.edu/bermlab, for examples.) and
quite a few are linked to important wetlands
such as the Laguna del Tigre National Park
in Guatemala (www.worldbank.org) and a
variety of Ramsar sites in Nicaragua (www.
ramsar.org/profiles_nicaragua.htm).
�.� other Water resources: lakes and reservoirs
With such a large quantity of water,
hydroelectric power has always been
important to the region. As a consequence
of having a large number of dams built across
the region (see section 5), numerous artificial
lakes and reservoirs have been created
(Paiva 1976; 1983). Lake Titicaca, however, is
the largest natural lake in CSA and the only
natural lake upon which any information could
be found. The lake, which is shared by Peru
and Bolivia, covers 8,372 km2 and consists of
two parts: Lago Mayor, the deep main basin
and Lago Pequeño, the smaller, shallower one
(Ghishan nd). Extensive anthropological work
has been conducted on the fishers that work
the lake (see Orlove 1986, 1989, 1990), but
no economic assessment has been done.
�.� Main species caught in the region
Amazon fisheries, in common with other
tropical freshwater fisheries, have a number
of special characteristics. They are multi-
species and fished with a wide range of
gears. Temporal variation in capture is high
because most fish are caught during the dry
chapTer 1 �
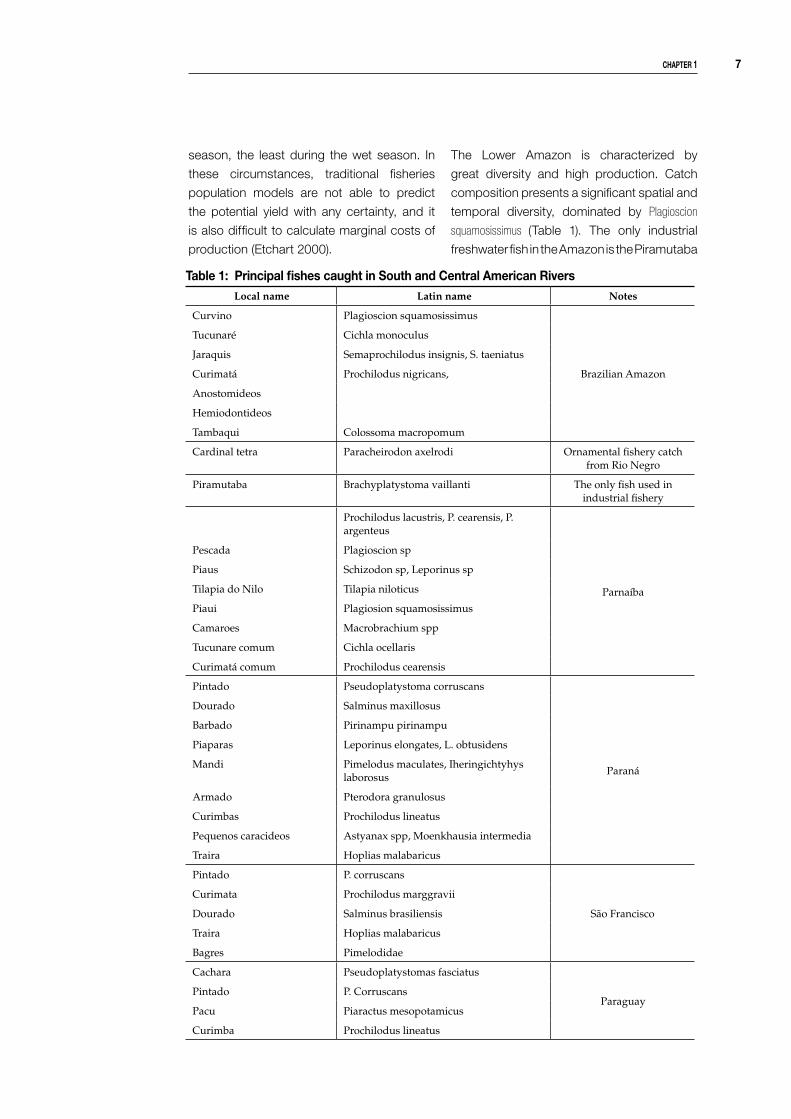
Table 1: principal fishes caught in south and central american riversLocal name Latin name Notes
Curvino Plagioscion squamosissimus
Brazilian Amazon
Tucunaré Cichla monoculus
Jaraquis Semaprochilodus insignis, S. taeniatus
Curimatá Prochilodus nigricans,
Anostomideos
Hemiodontideos
Tambaqui Colossoma macropomum
Cardinal tetra Paracheirodon axelrodi Ornamental fishery catch from Rio Negro
Piramutaba Brachyplatystoma vaillanti The only fish used in industrial fishery
Prochilodus lacustris, P. cearensis, P. argenteus
Parnaíba
Pescada Plagioscion sp
Piaus Schizodon sp, Leporinus sp
Tilapia do Nilo Tilapia niloticus
Piaui Plagiosion squamosissimus
Camaroes Macrobrachium spp
Tucunare comum Cichla ocellaris
Curimatá comum Prochilodus cearensis
Pintado Pseudoplatystoma corruscans
Paraná
Dourado Salminus maxillosus
Barbado Pirinampu pirinampu
Piaparas Leporinus elongates, L. obtusidens
Mandi Pimelodus maculates, Iheringichtyhys laborosus
Armado Pterodora granulosus
Curimbas Prochilodus lineatus
Pequenos caracideos Astyanax spp, Moenkhausia intermedia
Traira Hoplias malabaricus
Pintado P. corruscans
São Francisco
Curimata Prochilodus marggravii
Dourado Salminus brasiliensis
Traira Hoplias malabaricus
Bagres Pimelodidae
Cachara Pseudoplatystomas fasciatus
ParaguayPintado P. Corruscans
Pacu Piaractus mesopotamicus
Curimba Prochilodus lineatus
season, the least during the wet season. In
these circumstances, traditional fisheries
population models are not able to predict
the potential yield with any certainty, and it
is also difficult to calculate marginal costs of
production (Etchart 2000).
The Lower Amazon is characterized by
great diversity and high production. Catch
composition presents a significant spatial and
temporal diversity, dominated by Plagioscion
squamosissimus (Table 1). The only industrial
freshwater fish in the Amazon is the Piramutaba

� Tropical river fisheries valuaTion: background papers To a global synThesis
Acarahuazu
Peruvian Amazon (many of these terms are used by the
locals in the region and scientific names are not
known).
Boquichico
Corvina Ray
Doncella Ophidiidae
Dorado Spanis aurata
Gamitana
Llambina
Maparate
Paiche
Palometa Trachinotus
Ractacara
Sardina
Yahuarachi
Yulilla
Zungaro
Camaron de Rio Crayfish
Sierra waters Carachi
Pejerrey Argentina elongata
Trucha Salmo
Source: DFRP 2001; Siamazonia 2002
(Brachyplatystoma vaillant, Prochilodus
lacustris, P. cearensis, P. argenteus), found
at the mouth of the river. Catches of these
fish reached 28,829 tonnes in 1977, declined
to 7,070 tonnes 1992, but had again risen to
22,087 tonnes by 1999 when the fish were
considered to be recovering from overfishing
(DFRP 2001). There is a significant fishery
for ornamental fish in the lower Rio Negro,
which is dominated by the Cardinal Tetra. In
general, fisheries resources in Amazonia were
considered underexploited by Petrere (1983)
and Welcomme (1990), but with localized
risk. Recent literature has reported declining
catches close to large urban centers, and
the decline in catches landed at Manaus
was demonstrated by Bittencourt (1991),
who suggested that fishing in this region was
approaching the MSY level.
�.� central and south america river fisheries in a regional and global context
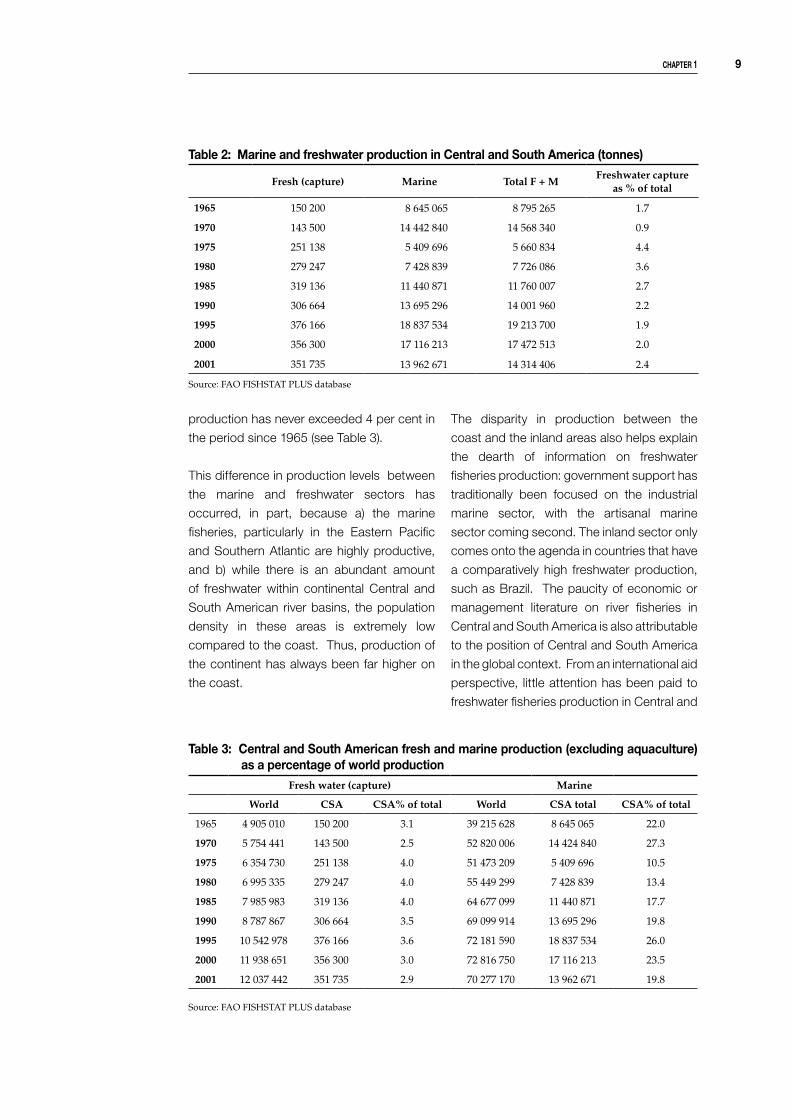
Since 1965, fisheries production from
freshwater resources in Central and South
America has never amounted to more than 4.2
per cent of fisheries production overall; it has
normally been in the region of 1-3 per cent5.
Over that same period, marine production
has generally been above 10 million tonnes
per year6 (Table 2).
In a global perspective then, while a number
of South American nations (notably Peru,
Chile and Argentina) remain among the
top marine capture producers in the world,
the CSA share of global inland fish capture
5 Freshwater capture fisheries data do not include other aquatic animals (crocodiles, etc.) nor cultured fish production. A complete breakdown of capture production by species and country can be found in Appendix 2; figures for culture production can be found in Appendix 3; and those for crocodiles in Appendix 4.
6 Most of the marine production is destined for fish meal and the majority of this is caught by Peru and Chile, the second and fifth highest capture fisheries producers in the world (FAO 2000a).
chapTer 1 �
Table �: central and south american fresh and marine production (excluding aquaculture) as a percentage of world production
Fresh water (capture) Marine
World CSA CSA% of total World CSA total CSA% of total
1965 4 905 010 150 200 3.1 39 215 628 8 645 065 22.0
1970 5 754 441 143 500 2.5 52 820 006 14 424 840 27.3
1975 6 354 730 251 138 4.0 51 473 209 5 409 696 10.5
1980 6 995 335 279 247 4.0 55 449 299 7 428 839 13.4
1985 7 985 983 319 136 4.0 64 677 099 11 440 871 17.7
1990 8 787 867 306 664 3.5 69 099 914 13 695 296 19.8
1995 10 542 978 376 166 3.6 72 181 590 18 837 534 26.0
2000 11 938 651 356 300 3.0 72 816 750 17 116 213 23.5
2001 12 037 442 351 735 2.9 70 277 170 13 962 671 19.8
Source: FAO FISHSTAT PLUS database
production has never exceeded 4 per cent in
the period since 1965 (see Table 3).
This difference in production levels between
the marine and freshwater sectors has
occurred, in part, because a) the marine
fisheries, particularly in the Eastern Pacific
and Southern Atlantic are highly productive,
and b) while there is an abundant amount
of freshwater within continental Central and
South American river basins, the population
density in these areas is extremely low
compared to the coast. Thus, production of
the continent has always been far higher on
the coast.
The disparity in production between the
coast and the inland areas also helps explain
the dearth of information on freshwater
fisheries production: government support has
traditionally been focused on the industrial
marine sector, with the artisanal marine
sector coming second. The inland sector only
comes onto the agenda in countries that have
a comparatively high freshwater production,
such as Brazil. The paucity of economic or
management literature on river fisheries in
Central and South America is also attributable
to the position of Central and South America
in the global context. From an international aid
perspective, little attention has been paid to
freshwater fisheries production in Central and
Table �: Marine and freshwater production in central and south america (tonnes)
Fresh (capture) Marine Total F + MFreshwater capture
as % of total
1965 150 200 8 645 065 8 795 265 1.7
1970 143 500 14 442 840 14 568 340 0.9
1975 251 138 5 409 696 5 660 834 4.4
1980 279 247 7 428 839 7 726 086 3.6
1985 319 136 11 440 871 11 760 007 2.7
1990 306 664 13 695 296 14 001 960 2.2
1995 376 166 18 837 534 19 213 700 1.9
2000 356 300 17 116 213 17 472 513 2.0
2001 351 735 13 962 671 14 314 406 2.4
Source: FAO FISHSTAT PLUS database

10 Tropical river fisheries valuaTion: background papers To a global synThesis
South America simply because African and
Asian fisheries offer more scope (production
is much higher and is more significant in terms
of livelihoods and poverty reduction).
However, while considerable attention has
been paid to the biology of freshwater fish in
Central and South America, in particular in
the Amazon, little academic interest has been
placed on fishing as an economic activity.
�.� freshwater production Trends on the continent
Overall capture production rose every year
from the 71,600 tonnes recorded in 1950 to a
peak of 376,166 tonnes in 19957. Freshwater
production since 1950 (the earliest available
FAO data) shows that Brazil is by far the
largest producer. Production from Brazilian
freshwater resources rose from 30,600
tonnes in 1950 to 199,159 tonnes in 50 years,
having peaked at 200,621 tonnes in 1985. For
much of the same period, Colombia was the
second most significant producer recording
a growth of some 140 per cent, although
production in 2000 stood at 24,854 tonnes,
still significantly less than Brazil. Argentina’s
production has been erratic; although
production in 1950 was recorded at 13,700
tonnes, it dipped to 5,400 tonnes by 1970,
then climbing to 15,045 tonnes five years
later before dipping again in 1980. Towards
the end of the 1990s, however, Argentinian
production experienced a sharp rise and, by
2000, it was the third largest producer on
the continent. Peruvian production has also
experienced a dramatic rise since the 1980s,
making it the second largest producer in
2000. Other countries that have experienced
a growth in their capture fisheries production
include Venezuela and Paraguay, which saw
production almost double between 1990 and
1995; and Guatemala, where production has
increased from 4,500 tonnes in the 1970s to
7,301 tonnes in 2000 (Table 4).
�.� aquaculture and harvest of aquarium fish and other aquatic species
While the bulk of freshwater production
comes from capture fisheries (85%), inland
culture fisheries production rose 168 per cent
in the five years between 1995 and 2000.
Much of this rise is attributable to Brazil
and Colombia. There is also a sizeable and
growing fishery for other aquatic animals from
the freshwaters of Central and South America.
Most notable of these is the market for
crocodiles, caimans and alligators (Appendix
2). While there are no readily available figures
for the price of meat from these animals,
caiman skins have a first sale value of US$ 5-
10, an export value of US$ 50 each and up to
US$ 200 each on reexport from European
tanneries. Crocodile skins retail at about five
times the price of caiman skins, with a typical
shipment of 2,000 skins for export selling for
up to US$ 200,0008. There is also evidence
that the hunting of manatees (a protected
species) provides livelihoods in certain parts
of the Peruvian Amazon (Reeves et al. 1996).
Manatees – large aquatic mammals that
were recorded in Brazilian fisheries statistics
during the 1950s – are no longer included.
Also of note is the trade in tropical aquarium
fish. Most of the fish destined for aquaria
in Europe, North America and the Far East
come from the Rio Negro. Fish caught in the
wild from Brazil make up 5-10 per cent of the
global ornamental fish market and cardinal
tetra make up 85 per cent of the total catch in
the Rio Negro basin (OFI Journal 2002; Chao
and Prang 1997).
�.� regional importance of fishing as a livelihoods option
South America still has a low share of the
total global fishers although after a marginal
decrease in absolute numbers between 1970
7 A complete breakdown of production by species in all Central and South American countries is found in Appendix 4.8 http://www.wcoomd.org/ie/En/Topics_Issues/Cross_borderCrime/Cites/broche/17.htm

chapTer 1 11
Table �: freshwater capture production in central and south america (tonnes)1950 1955 1960 1965 1970 1975 1980 1985 1990 1995 2000
Argentina 13 700 7 900 14 700 12 900 5 400 15 045 8 327 9 715 10 281 17 111 30 298
Belize . . . . <0.5 25 25 1 1 <0.5 <0.5
Bolivia 500 600 700 1 800 1 100 1 050 4 179 3 770 3 223 4 842 5 256
Brazil 30 600 41 200 54 000 94 000 93 300 173 327 184 273 200 621 191 111 193 042 199 159
Chile . . . . . . . 1 32 . .
Colombia 14 500 17 000 11 400 25 900 33 200 42 027 46 706 47 708 33 940 23 524 24 854
Costa Rica <0.5 <0.5 <0.5 <0.5 <0.5 48 323 300 300 900 1 000
Ecuador . . . . . . 206 867 600 300 400
El Salvador 800 900 1 400 1 600 800 869 1 818 2 791 3 641 4 324 2 831
French Guiana . . . . . . . . . . .
Guatemala . 100 200 200 400 550 400 47 2 599 4 025 7 301
Guyana . . . . . . 681 800 800 700 800
Honduras . . . . 100 170 76 32 45 127 61
Nicaragua 100 200 600 1 100 1 300 359 79 84 150 538 1 076
Panama . . . . . . . 50 15 130 20
Paraguay 400 500 600 700 1 800 2 800 3300 7 500 12 490 21 000 25 000
Peru . 1 000 1 000 3 000 2 000 6 671 12 538 27 791 28 321 50 789 32 297
Suriname . 300 300 500 300 295 71 228 350 140 200
Uruguay . . . . . 245 312 660 218 844 2 295
Venezuela 11 000 7 300 7 900 8 500 3 800 7 657 15 933 16 170 18 547 53 830 23 452
TOTALS 71 600 77 000 92 800 150 200 143 500 251 138 279 247 319 136 306 664 376 166 356 300
Source: From FAO FISHSTAT PLUS database
and 1980, the number of South American
fishers and fish farmers grew by over
50% during the 1990s (FAO nd) However,
throughout this period fishing has been a
locally important livelihood option.
Artisanal fisheries in the Amazon basin are
a very important source of employment
and income (DFRP 2001). In inland areas,
these fisheries often provide one source of
employment for lowly or unqualified persons (in
urban and rural areas), and they are generally
conducted in conjunction with agriculture.
The Solimões river at the western end of the
Amazon accounts for around 45 per cent of
all fishers in the Amazon River basin (Bayley
and Petrere 1989), yet as demonstrated
in Table 5, accurate data on the number of
fishers are hard to find, and the figures are
often conflicting among reports. Part of
the accounting problem arises because
artisanal fishers often combine the fishing
activity with farming or off-farm work and the
fishing portion of labor is aggregated into the
agricultural statistics, or because many parts
of the Amazon and other river basins are very
remote and accurate counting of fishers is not
possible. In the more remote parts of South
America , where many fishers are subsistence
fishers and do not join cooperatives or
organizations to which commercial and
many artisanal fishers belong, attempts at
counting fishers through official organization
membership can be misleading.
What is known is that in more remote parts
of the interior, fishing is likely to make up a
sizeable proportion of the animal protein
intake and annual income, especially where
alternative sources of employment or farming
are not possible (Fernandez-Para 1998).
Diegues (2002) has conducted extensive
work on the artisanal fishers of Brazil where
the form of fishing, the organization of
fishing firms and the marketing relations are
described. The DFRP (2001) highlights issues
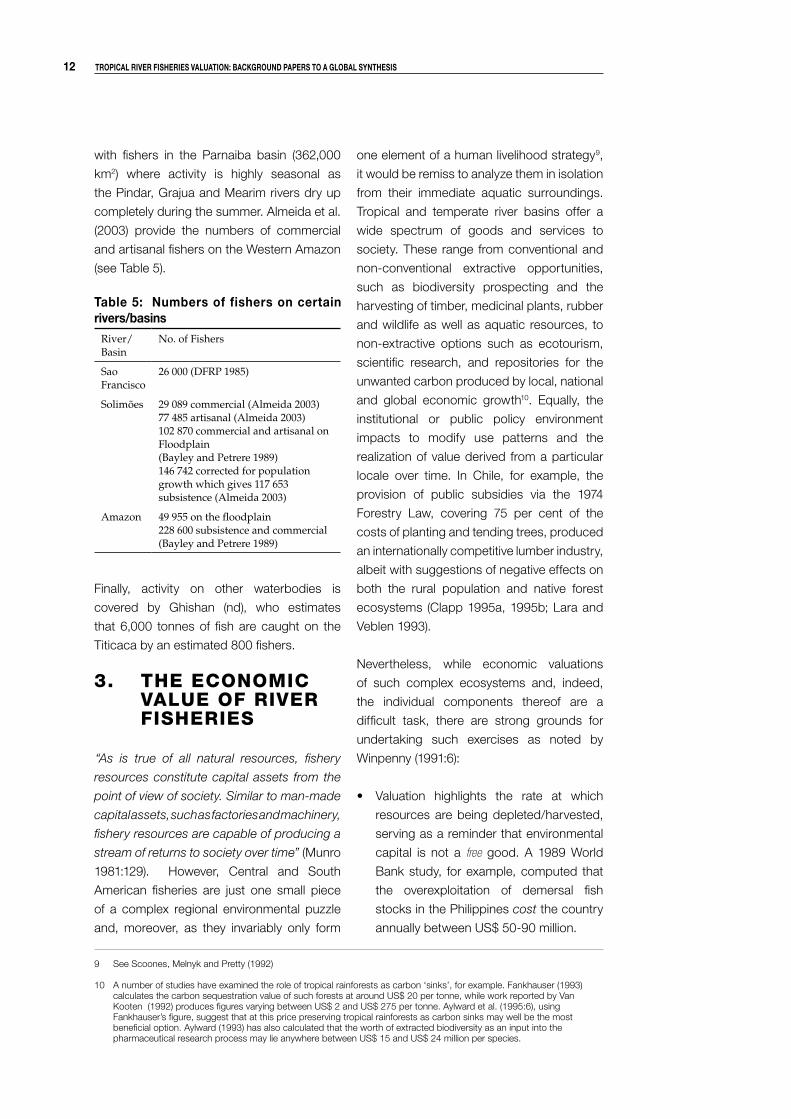
1� Tropical river fisheries valuaTion: background papers To a global synThesis
with fishers in the Parnaiba basin (362,000
km2) where activity is highly seasonal as
the Pindar, Grajua and Mearim rivers dry up
completely during the summer. Almeida et al.
(2003) provide the numbers of commercial
and artisanal fishers on the Western Amazon
(see Table 5).
Finally, activity on other waterbodies is
covered by Ghishan (nd), who estimates
that 6,000 tonnes of fish are caught on the
Titicaca by an estimated 800 fishers.
3. THE ECONOMIC VALUE OF RIVER FISHERIES
“As is true of all natural resources, fishery
resources constitute capital assets from the
point of view of society. Similar to man-made
capital assets, such as factories and machinery,
fishery resources are capable of producing a
stream of returns to society over time” (Munro
1981:129). However, Central and South
American fisheries are just one small piece
of a complex regional environmental puzzle
and, moreover, as they invariably only form
one element of a human livelihood strategy9,
it would be remiss to analyze them in isolation
from their immediate aquatic surroundings.
Tropical and temperate river basins offer a
wide spectrum of goods and services to
society. These range from conventional and
non-conventional extractive opportunities,
such as biodiversity prospecting and the
harvesting of timber, medicinal plants, rubber
and wildlife as well as aquatic resources, to
non-extractive options such as ecotourism,
scientific research, and repositories for the
unwanted carbon produced by local, national
and global economic growth10. Equally, the
institutional or public policy environment
impacts to modify use patterns and the
realization of value derived from a particular
locale over time. In Chile, for example, the
provision of public subsidies via the 1974
Forestry Law, covering 75 per cent of the
costs of planting and tending trees, produced
an internationally competitive lumber industry,
albeit with suggestions of negative effects on
both the rural population and native forest
ecosystems (Clapp 1995a, 1995b; Lara and
Veblen 1993).
Nevertheless, while economic valuations
of such complex ecosystems and, indeed,
the individual components thereof are a
difficult task, there are strong grounds for
undertaking such exercises as noted by
Winpenny (1991:6):
• Valuation highlights the rate at which
resources are being depleted/harvested,
serving as a reminder that environmental
capital is not a free good. A 1989 World
Bank study, for example, computed that
the overexploitation of demersal fish
stocks in the Philippines cost the country
annually between US$ 50-90 million.
9 See Scoones, Melnyk and Pretty (1992)
10 A number of studies have examined the role of tropical rainforests as carbon ‘sinks’, for example. Fankhauser (1993) calculates the carbon sequestration value of such forests at around US$ 20 per tonne, while work reported by Van Kooten (1992) produces figures varying between US$ 2 and US$ 275 per tonne. Aylward et al. (1995:6), using Fankhauser’s figure, suggest that at this price preserving tropical rainforests as carbon sinks may well be the most beneficial option. Aylward (1993) has also calculated that the worth of extracted biodiversity as an input into the pharmaceutical research process may lie anywhere between US$ 15 and US$ 24 million per species.
Table �: numbers of fishers on certain rivers/basins
River/Basin
No. of Fishers
Sao Francisco
26 000 (DFRP 1985)
Solimões 29 089 commercial (Almeida 2003)77 485 artisanal (Almeida 2003) 102 870 commercial and artisanal on Floodplain (Bayley and Petrere 1989)146 742 corrected for population growth which gives 117 653 subsistence (Almeida 2003)
Amazon 49 955 on the floodplain228 600 subsistence and commercial (Bayley and Petrere 1989)

chapTer 1 1�
• Valuation seeks to monetize unpriced
benefits and costs so that they are not
precluded from consideration in decision-
making processes. Samples et al. (1986),
for example, have calculated preservation
bids that can be used in estimating the
social value of species preservation
(their research encountering an annual
willingness to pay approx. US$ 36-57 for
the humpback whale within a group of
240 paid student subjects).
• Valuation, by internalizing such benefits
and costs, offers a more comprehensive
frame-work for policymaking. The
environmental and social impact report on
the Cana Brava Hydroelectric power plant
on the Toncantins river in the central and
western parts of Brazil, for example, led to
a figure of US$ 25.5 million [6 per cent of
the total project cost] being incorporated
subsequently into the Management
Plan to provide for the rehabilitation of
degraded areas, to conserve the local
fauna, to mitigate impacts on the wild
fauna and ichtyofauna, and to rescue
important archeological artifacts among
other things (IADB 2000).
Valuation is not an unchallenged panacea,
however, and has its fair number of critics11.
These challenges notwithstanding, accurate
evaluation also remains critically dependent
upon precise technical, scientific and
economic data – data which may frequently
be either unavailable, or costly to obtain. This
is particularly true, as Section 4 of this paper
shows, in the case of Central and South
American river fisheries. Yet, in the absence
of an accepted alternative technique that
permits the aggregation of both monetary
and non-monetary benefits and non-benefits
within a standard evaluating framework,
such methodological limitations are perhaps
excusable. Consequently, this report elects
to summarize the extant literature [published
and gray] through recourse to the TEV (Total
Economic Value) framework advanced
by Hodge (1995:7), with the objective of
assessing the direct economic and the wider
11 Criticisms of economic valuation techniques generally divide into three categories. First, that it is impossible to assign a monetary value to intangibles like human life, the importance of species diversity, depletion of the ozone layer, preservation of pristine rainforests etc., and attempts to do so merely degrade the whole exercise. Second, that the valuation process is open to manipulation, whether consciously or unconsciously [given the set of values held by the evaluator], with the means – the valuation process – simply being used to justify the desired ends (Bowers 1990). Third, that valuation techniques derived in the developed world are rendered meaningless in the developing world – for example much of the work on fish population dynamics and eutrophication resulting from farm chemical runoff used to inform valuation methodologies has been done in temperate conditions, and similar causal relationships may not prevail in the tropics.
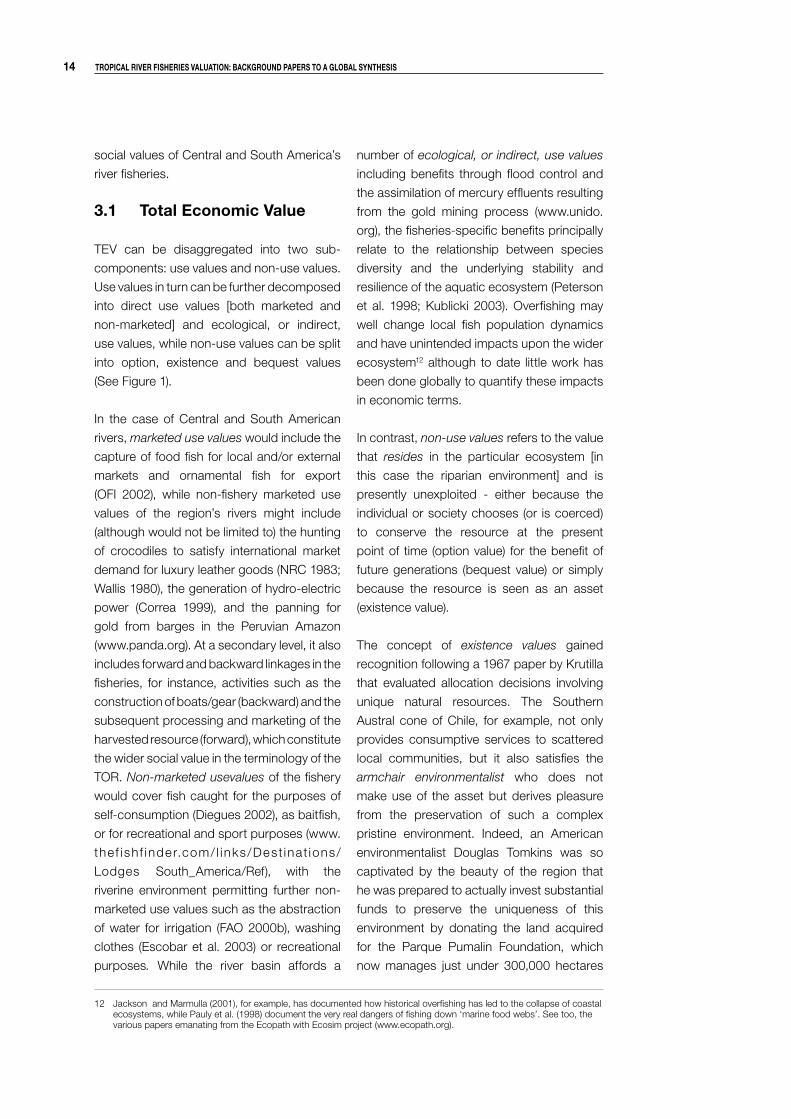
figure 1: Total economic value and its components
Source: Hodge (1995:7)
TOTAL ECONOMIC VALUE
Use Value Non-Use Value
BenefitsSatisfaction
fromknowledge
of existence
ExistenceValues
BenefitsPassingbenefitsto future
generations
BequestValues
BenefitsFuture drugs
Potentialgene poolRecreation
options
BenefitsFlood control
Carbon storageWater catchment
Waste assimilation
EcologicalFunction Values
Direct UseValues
Marketed Outputs
CropsMeat
TimberRenewable
Energy
UnpricedBenefitsRecreationLandscape
Local culture
OptionValues
1� Tropical river fisheries valuaTion: background papers To a global synThesis
social values of Central and South America’s
river fisheries.
�.1 Total economic value
TEV can be disaggregated into two sub-
components: use values and non-use values.
Use values in turn can be further decomposed
into direct use values [both marketed and
non-marketed] and ecological, or indirect,
use values, while non-use values can be split
into option, existence and bequest values
(See Figure 1).
In the case of Central and South American
rivers, marketed use values would include the
capture of food fish for local and/or external
markets and ornamental fish for export
(OFI 2002), while non-fishery marketed use
values of the region’s rivers might include
(although would not be limited to) the hunting
of crocodiles to satisfy international market
demand for luxury leather goods (NRC 1983;
Wallis 1980), the generation of hydro-electric
power (Correa 1999), and the panning for
gold from barges in the Peruvian Amazon
(www.panda.org). At a secondary level, it also
includes forward and backward linkages in the
fisheries, for instance, activities such as the
construction of boats/gear (backward) and the
subsequent processing and marketing of the
harvested resource (forward), which constitute
the wider social value in the terminology of the
TOR. Non-marketed usevalues of the fishery
would cover fish caught for the purposes of
self-consumption (Diegues 2002), as baitfish,
or for recreational and sport purposes (www.
thef ishf inder.com/ l inks/Dest inat ions/
Lodges South_America/Ref), with the
riverine environment permitting further non-
marketed use values such as the abstraction
of water for irrigation (FAO 2000b), washing
clothes (Escobar et al. 2003) or recreational
purposes. While the river basin affords a
number of ecological, or indirect, use values
including benefits through flood control and
the assimilation of mercury effluents resulting
from the gold mining process (www.unido.
org), the fisheries-specific benefits principally
relate to the relationship between species
diversity and the underlying stability and
resilience of the aquatic ecosystem (Peterson
et al. 1998; Kublicki 2003). Overfishing may
well change local fish population dynamics
and have unintended impacts upon the wider
ecosystem12 although to date little work has
been done globally to quantify these impacts
in economic terms.
In contrast, non-use values refers to the value
that resides in the particular ecosystem [in
this case the riparian environment] and is
presently unexploited - either because the
individual or society chooses (or is coerced)
to conserve the resource at the present
point of time (option value) for the benefit of
future generations (bequest value) or simply
because the resource is seen as an asset
(existence value).
The concept of existence values gained
recognition following a 1967 paper by Krutilla
that evaluated allocation decisions involving
unique natural resources. The Southern
Austral cone of Chile, for example, not only
provides consumptive services to scattered
local communities, but it also satisfies the
armchair environmentalist who does not
make use of the asset but derives pleasure
from the preservation of such a complex
pristine environment. Indeed, an American
environmentalist Douglas Tomkins was so
captivated by the beauty of the region that
he was prepared to actually invest substantial
funds to preserve the uniqueness of this
environment by donating the land acquired
for the Parque Pumalin Foundation, which
now manages just under 300,000 hectares
12 Jackson and Marmulla (2001), for example, has documented how historical overfishing has led to the collapse of coastal ecosystems, while Pauly et al. (1998) document the very real dangers of fishing down ‘marine food webs’. See too, the various papers emanating from the Ecopath with Ecosim project (www.ecopath.org).

chapTer 1 1�
(Larrain and Stevens 2002; www.gochile.
cl)13. Some organizations (Rainforest Alliance,
Save the Whale, etc.) explicitly use existence
values as a means of encouraging concerned
individuals to donate to causes oriented
towards protecting endangered species and/
or ecosystems. Fish species and fisheries
too may have existence values, and Samples
et al. (1986) have analyszd the preservation
value of the humpback whale.
Option values refer to the returns that
might be expected if the resource were to
be subsequently exploited by the current
generation. Peters et al. (1989), for example,
suggest that the option value of a hectare of
Amazonian rainforest could rise to as much
as US$ 9,000 once the commercial value
of the standing forest has been factored in,
while Myers (1988) suggests that a hectare
of tropical forest could produce US$ 200 of
wildlife products annually14. The benefits are
perhaps even greater once the potential of the
resource as a gene pool is incorporated; the
US pharmaceutical giant Merck, for example,
paid US$ 2 million for the right to evaluate the
commercial prospects of a limited number
of plant, insect and microbial samples
collected from Costa Rica’s conservation
areas in 1991/2 (Eberlee 2000)15. While the
aquatic gene pool is presently being tapped
to support transgenic crop research (Thorpe
and Robinson 2003), the more palpable
(fisheries) option value is related to the failure
to fully exploit fish stocks. As increased fishing
effort would simply convert this option value
into a direct, observable use value, there is
a strong case for incorporating such option
values (where computation is possible) into
any TEV evaluation.
Related to option values is the notion of
bequest values, whereby the individual
or society elects to conserve the resource
for the benefit of descendents or future
generations16. Generally unquantified,
although frequently expressed, such motives
are often encountered in field research.
Ideally then, a thorough assessment of the
TEV of Central and South American river
fisheries would aggregate both use and
non-use values of the underlying resource.
However, as many of these values [particularly
non-use ones] remain unpriced, it is crucial to
apply appropriate evaluation techniques to
accurately capture their true value.
�.� valuation Techniques (applicable to river fisheries)
The market analysis/value approach is the
most commonly used natural resource
valuation method, largely due to its ease
of application. It is relatively undemanding
to count the ornamental fish and reptiles
extracted from the Orinoco River and to
obtain a figure for the value of the Negro’s
ornamental fish and reptile trade by weighing
them in accord with their marketed price.
Two caveats are in order. First, while there are
well-established marketing channels for such
products that aid information retrieval, not all
trade may pass through such formal avenues,
particularly if such a trade is prohibited due
13 Pumalin was one of the six protected areas included in a 1997 Chilean National Parks Service study on the total economic value (TEV) of such areas. Significantly, the study concluded that, thanks to non-use values, the estimated TEV was almost 40 times higher than the monetary incomes obtained by the residents of the areas (De la Maza 1997).
14 Both of these studies indicate the superiority of a managed approach to the forest resource, and the alternatives such as ranching in the Peters case and logging in the Myers study generate less income (US$ 3,000 and US$ 150, respectively).
15 Crook (cited in Eberlee 2000), however, is more downbeat about such bioprospecting, commenting: “compared to alternative values of the land, for example in timber values alone, the earnings appear unlikely to increase the real value of natural ecosystems to any real extent.” (The emphasis is the author’s.)
16 If there is no expressed desire to either subsequently exploit the resource for one’s own benefit, or to conserve it for the benefit of one’s descendents, then bequest and option values become indistinguishable.
1� Tropical river fisheries valuaTion: background papers To a global synThesis
to the fish/reptile being placed on the CITES
Appendix I list of most endangered species,
as is the case with Dermatemydidae, the
Central American river turtle. Second, there
is a question of which price is the appropriate
one, the final price paid by the British collector
of tropical fish in Manchester, or the price
paid to the Brazilian fisher who ensnares the
fish.17
In relation to this, the Effect on Production
(EOP) method is used to examine the change in direct use values resulting from a given environmental activity, such as identifying the physical effects associated with the change. Market values can be generated if these physical effects are then monetized through recourse to relevant market and/or shadow prices. The partial closing of the local river channel following construction of the Porto Primavera dam in Brazil, for example, sharply reduced fish migration and caused upstream fish catches to fall by around 80 per cent (Kudlavicz 1999), although no monetary value was imputed to such losses.
Alternative techniques are necessary to establish the economic value of sport fishing as the market value of the fish caught by recreational fishers invariably bears little relation to the value placed on the activity itself. For example, The Travel Cost Method (TCM), although originally developed to evaluate the worth of public recreation locations in the USA, could potentially be deployed to gauge the benefits of freshwater dorado (bream) fishing in the Plate and Parana rivers in Argentina (www.jeep-ika.com.ar, www.acuteangling.com). In this case, aggregating the travel and opportunity costs incurred by surveyed individuals would produce an indirect measure of the unpriced benefits of recreational fishing on the river.
In some instances, direct markets (and prices) are absent and so hedonic methods are used by observing the prices of surrogate goods (generally property values and labor wage-rates) –that are affected by the environmentally based activity. Although the authors are not aware of any studies employing hedonic pricing methods to capture non-marketed use values within a fisheries context, riverine environments do offer some scope for the application of such techniques. For example, water abstraction for irrigation purposes could be valued by interrogating property registers to identify the price differential between irrigated and non-irrigated land that is identical in all other respects.
Preventative Expenditures (PE) and Replace-
ment/Relocation Cost (RC) methods are more commonly used to track the amounts that people are prepared to spend to mitigate the degradation of the environment or ecosystem (PE) or alternatively, to either spend to restore the environment to its original state after it has been adversely affected (Replacement Cost), or to replace the environment by moving away from the degraded area (Relocation Cost). Although income constraints in the developing world are likely to bias both PE and RC valuations downwards, this can be offset by commissioning objective professional estimates of such costs, as is increasingly commonplace in Environmental Impact Assessments (EIA). In the case of the Porto Primavera dam alluded to above, the construction of fish ladders to minimize the impact of the dam on species migration would have been an example of PE, while the RC of fishing and other displaced households following construction of the Yacyretá dam was priced at US$ 24,000 per household.18
17 Equally, the quantity of food fish harvested from, say, the Bio-Bio river can be multiplied by market prices to obtain the direct food fish value of the fishery. If levels of fish used for bait or subsistence can be ascertained, then appropriate shadow prices may be applied to generate the non-marketed use values of food fish. While there is a greater likelihood of food fish catches going unrecorded, the difference between the price paid to the fisher and the final market price is likely to be correspondingly lower than in the ornamental fish case.
18 This value was the cost of the homes built at the beginning of the relocation process, but cheaper constructions, known as shellhouses were later estimated to have cost just US$ 4,000 by the residents. This discrepancy raised questions as to which figure (if either) represents the true relocation cost. Kudlavicz (1999) has also pointed out that the limited number of displaced Brazilian fishermen who were actually compensated following the early Brazilian dam projects were often rehoused in the city, forcing them to abandon their traditional activities.

chapTer 1 1�
Finally, the Contingent Valuation Method
(CVM) surveys seek to elicit people’s
willingness to pay (WTP) to maintain/retain
a specified environmental benefit such as
the preservation of the Amazonian river
dolphin (currently on the CITES Appendix
II list of threatened species), or willingness
to accept [WTA] compensation for a loss
of environmental quality. Although widely
applicable, and indeed indispensable if option
and existence values are to be obtained, the
technique has two principal weaknesses.
First, unlike the TCM, it does not require survey
participants to back up their response by
parting with cash, and so a hypothetical bias
is more likely19. Second, there are problems in
identifying the relevant target group to survey,
particularly in developing countries where
information about environmental benefits is
limited, and then grossing-up these values to
get an aggregate WTP or WTA, particularly
in those instances where non-use values are
concerned (Winpenny 1991:60/1).
A variety of techniques are available to
help determine the value of the distinctive
components of riverine ecosystems and the
fisheries found therein. While the methodology
used for computing the value emanating
from the direct use of fisheries resources is
relatively straightforward, measurement of
both indirect use values and non-use values
is more problematic. The main difficulty in
applying such techniques in the developing
world is, however, the paucity of primary
data that is presently available and the cost
of augmenting such a limited knowledge
base. Such shortcomings seriously hamper
attempts to construct a robust picture of the
TEV of any region’s fisheries, including Central
and South America.
�.� aggregating use and non-use values and decision-Making
Barbier (1993) suggests that a comprehensive evaluation of the full potential TEV of any environmental resource or ecosystem can be obtained by adding the various components together. In other words,
TEV = (Use + Non-Use) Values
or alternatively,
TEV = (Marketed + Non-marketed + Ecological + Option + Bequest + Existence) values
A failure to either include, or correctly value,
any of the component parts is likely to result
in environmental degradation. For example, if
both ecological and non-use (option, bequest
and existence) values are excluded from the
equation, then the misleading impression
is given that TEV can be maximized by
identifying marketed and non-marketed
outputs. In the riverine fisheries case, a logical
corollary of this is overfishing, although the
private returns to increased fishing effort
have a high opportunity cost at the margin
(possible species extinction leading to an
irreversible loss in option, bequest, existence
and ecological values). It is equally crucial that
decision-making that may affect the prevailing
status quo, whether it be to authorize new
nets or vessels in a fishery, to abstract or
change the volume and flow of water, or to
construct new settlements on the river banks,
is subjected to scrutiny in terms of the impact
such a policy/project will have on aggregate
TEVs.
19 In the real world, actual bids have a resource cost. In the hypothetical CVM world, bids do not and so the respondent may be inclined to over- or underbid. Pearce and Turner (1990) further identify other factors, such as design (respondents may be swayed in their valuation decision by the information supplied to them), starting-point (responses are affected by the initial valuation price suggested by the researcher), strategy (respondents believe their response may, in fact, affect the course of events), or vehicle (payment method proposed), as potential obstacles to the effective application of CVM methodologies.
1� Tropical river fisheries valuaTion: background papers To a global synThesis
Historically, following the lead of Dupuit
(1844), cost-benefit analyses (CBA) were
deployed as a decision-making tool to
quantify the costs and benefits accruing
from major proposed projects. Project
acceptance was conditional upon TEV being
improved (i.e., net benefits exceeding net
costs), with a positive net present value (NPV)
the normal guiding criterion. However, the
utilitarian and anthropocentric basis of CBAs
(Turner 1991:213) and their depreciation
of environmental values (Rees 1985:324)
led some to place more emphasis on the
generation of Environmental Impact Analyses
(EIA). First advanced by the US environmental
lobby during the 1960s, EIA purports to
provide a more comprehensive appreciation
of the environmental consequences of a
proposed course of action20 although the
technique is open to similar criticisms to those
leveled at CBA. The most common criticisms
of such aggregating techniques include:
• The Distribution of Costs and Benefits.
Although the net outcome may be
favorable, not everyone benefits. For
example, while the Tucurui Hydropower
Complex (THC) in Brazil raised the
total commercial fish catch from
1,500 to 4,600 tonnes per year, catches
downstream from the dam fell by 80
per cent (WCD 2000:61). Some projects
make specific provision for the losers to
be compensated, as in the case of the
Yacycretá dam project where affected
fishers were offered US$ 8,000 to renounce
any further claims for compensation.
• Irreversibility. Project acceptance sets in
motion a chain of events that may well
be irreversible. The decision to construct
the THC, for example, is irreversible and
had the consequence of causing the total
number of fish species to decline by over
28 per cent (50 species) in the reservoir
area after damming (WCD 2000:60).
• Discounting. As individuals generally
exhibit a positive time preference
(preferring present to future satisfaction),
it is incumbent to discount future benefits
and costs so that they reflect such a
preference. The problem arises in choosing
the appropriate discount rate, particularly
as Foy and Daly (1989), among others,
have argued that environmentally sensitive
benefit streams should be subject to a
low(er) discount rate. In the case of the
THC, for example, hydroelectric costs
per MWh ranged from US$ 40 to US$ 58
depending on whether an 8 or 12 per cent
discount rate was applied.
• Immeasurable Items. Despite the
plethora of valuation techniques identified
above, the worth of certain resources or
ecosystems may still remain unquantifiable
in monetary terms. Regional examples of
this include, for example, Lake Titicaca
(Peru and Bolivia), the El Tigre wetlands
(Guatemala), Laguna Merim and Bañados
del Este (Brazil and Uruguay), the
Patagonian wetland lagoons (Argentina),
the Llanos (Venezuela) and the Pantanal
(Brazil, Bolivia and Paraguay), all of which
have been identified for possible inclusion
on the list of World Heritage sites (www.
unep-wcmc.org).
These caveats notwithstanding, the objective
of the next section of this report is to apply
the methodological principles enunciated
above in reviewing the extant literature
(both published and gray) so as to provide
some preliminary indications as to the true
economic value of the region’s fisheries.
20 Bisset (1978), however, has shown they are just as prone to manipulation and value judgments as CBAs.
chapTer 1 1�
21 See for example “The Catfish Connection: Ecology, Migration, and Conservation of Amazon Predators” (Barthem and Goulding 1997), “Floods of Fortune: Ecology and Economy along the Amazon’ (Goulding et al. 1997), and “So Fruitful a Fish: Ecology, Conservation and Aquaculture of the Amazon’s Tambaquí” (Araujo-Lima and Goulding 1997). In contrast, only a cursory three-page article “The Economic Value of the Amazonian Flooded Forest from a Fisheries Perspective” (Araujo-Lima et al. 1998) appears to have emanated from the project regarding valuation of the resource.
22 The R$ was worth approximately US$ 0.34 in September 2003.
4. TOTAL ECONOMIC VALUE OF THE REGION’S FISHERIES
�.1 The amazon basin
While Central and South America’s principal river system, the Amazon, accounts for 20 per cent of the world’s freshwater and is home to four-fifths of the 2,500 known species of freshwater fish, it is paradoxically the very size and associated diversity of its ecosystem that has precluded extensive study of the TEV of the system. Indeed, the most comprehensive work undertaken on this river basin, by the Amazon Rivers Program of the Rainforest Alliance under the direction of Michael Goulding between 1990 and 1999, focused on methods to protect and promote the conservation of Amazonian aquatic wildlife rather than place a tangible value on its economic or social worth21. Equally, even the economic research on specific riverine subsystems has generally not been formulated with the primary objective of assessing economic value, but rather to document information deficiencies (viewed from a management perspective) and alternative or improved management models, as will become clear in the ensuing review below (in which the studies are grouped together by region rather than by their relative merits in relation to the given TOR). Fortunately, information and data on economic values are a little more apparent in those instances where major ecosystem changes, such as the construction of dams or new industrial waterways, are proposed, as detailed in Section 5.
A. The Commercial Fishing Sector in the
Regional Economy of the Brazilian Amazon
(Almeida et al. 2003).
This study attempts to highlight the importance
of the Amazon-Solimões river to the regional
economy by estimating employment within
and the gross income and value added
generated by the commercial fisheries sector
in 2001. In their quest, the authors visited all
three major cities with the population over
250,000 (Belém, Manuas and Santarém)
and one quarter of the 48 smaller cities to
interview Municipal Fishers’ Union leaders,
the Coastguard and all boatyards, fish
processing plants, fishing gear stores, gas
stations, ice factories and fish restaurants. In
addition, a few fish vendors were interviewed
in all public fish markets (with the exception
of Belém and Manuas, where sample groups
were chosen).
On the basis of the information collected,
statistics were collected of the total fleet
[5,457 vessels], number of commercial
[29,089] and subsistence [49,955] fishers,
and landings in urban markets [46,269
tonnes]. The total estimated sectoral
income of R$ 472 million (US$ 160 million)
is computed by aggregating the assumed
income arising from four subactivities (input
and input provision, fishing, processing and
marketing, and services), although the major
portion is derived from fishing, processing
and marketing (89%). The authors then used
these amounts to show both the lacunae
in official survey methods and the real
economic superiority of fishing over forestry
in the region. For the former, the most recent
agrarian census of 1997 estimated that just
17,742 persons were employed in the fisheries
sector, resulting in the sector not receiving
the attention and support it merits. For the
latter, the authors pointed out that the NPV
of the fisheries sector, at R$ 93 million or
R$ 11,238 per hectare (US$ 31.62 million or
US$ 3,821, respectively), is almost double
that derived from forestry, at R$ 50 million or
R$ 6,250 per hectare22.
�0 Tropical river fisheries valuaTion: background papers To a global synThesis
While the contribution of Almeida et al. is
welcomed, providing as it does a tangible
figure for the primary and secondary
marketed use values generated by fisheries in
the region, the findings must be treated with
some caution. Not only do the authors provide
no details as to how they arrived at various
figures, for example, the assumption of 1.14
fishers per household used in estimating the
number of subsistence fishers, and the stated
NPV quoted above, but there also appears to
be a fundamental definition problem because
the term commercial is used in two senses.
On the one hand, it is used to identify those
employed in the commercial fleet while, on
the other hand, it is used to encompass the
value of the landings of both the commercial
and subsistence sectors, which are two
rather different things23. Equally, MacFadyen’s
global findings (2002: Box 1) that for every one
fisher there are approximately ten employed
in input or postharvest operations stands in
stark contrast to the study’s findings, which
suggest that there are nine fishers for every
one person involved in other fish-related
activities.
B. Production Analysis of Commercial
Fishing in the Lower Amazon (Almeida et
al. 2000)
In this paper, Almeida et al. use a Cobb-
Douglas regression model to estimate the
production function of commercial fishers in
the Lower Amazon (defined as those fishers
supplying the fourth largest fish market in
the Amazon, at Santarém), with a view to
contributing to the “formulation of policies in
support of the region’s small-scale floodplain
lake fisheries” (p.1). While fishers operate
in pairs from canoes using nets, long lines,
harpoons and fishing poles, the catch is
stored in a separate boat with a built-in
storage compartment. Larger storage boats
are often owned by non-fishers who supply
the boat and cover the expenses for every
voyage, purchasing the daily catch at a price
related to the prevailing market price for each
species.
Standard economic assumptions were
applied (boat owners are profit maximizing
pricetakers who possess perfect market
information, and input and output markets
are perfectly competitive) although the paper
made no subsequent attempt to either relax
such assumptions or discuss the likely impact
of relaxing them upon the regression findings.
Catch size and composition were obtained
for 2,992 landings in 1997 as part of an IARA/
IBAMA project, and supplementary research
established local values for gear, canoes, fuel
and ice24.
The paper concluded that economies of
scale were minimal in the Lower Amazonian
commercial fishery, before suggesting that
production could be increased through the
provision of lower cost ice. While the paper
did not go as far as computing the revenues
generated by the fishery, and hence marketed
use values, access to the raw data would
permit such a calculation to be made. No
consideration of non-marketed use values
or non-use values was attempted beyond
the recognition that four major species in the
Lower Amazon (i.e., the tambaqui, surubim,
piramutaba and pirarucu) are under excessive
pressure, and the final rejoinder that the
best policy is more cheap ice “combined
with appropriate management measures to
protect vulnerable species” (p.7).
C. Amazonian Fisheries: Socioeconomic
Issues and Management Implications
(Fernandez-Boca 1998)
Fernandez-Boca reviews the current state of
inland fisheries in the Peruvian Amazon with a
view to identifying key gaps in the economic,
23 Equally, using the term subsistence in this sense is incorrect as it fails to capture the values generated by the wholly subsistent fishers [non-market use values] whose landings do not enter the market. Semi-commercial fishers might be a better term.
24 Information on voyage duration and trip itinerary, ice and fuel consumption, number of fishers and canoes, and sale price of fish was obtained at the same time.

chapTer 1 �1
social and biological information needed to
assist fishery decision-makers.
Noting the high levels of animal protein derived
from fish products in parts of the Amazon
(for example, 61 per cent in the Ucayali
valley), the author proceeds to show how
commercial fisheries have grown considerably
in importance to service this demand, with
commercial vessels from Manaus now under-
taking round trips of up to 2,500 km in pursuit
of fish. While official data are plotted to show
a modest upward tendency in landings at
both Iquitos and Pucallpa over the period
1980-92, this was accompanied by a sharp
increase in effort (and a marked drop in cpue)
that suggested some likelihood of overfishing.
The failure to value these recorded landings,
however, preclude us from identifying whether
marketed use values have risen, declined or
remained stable over time.
D. The Experience of Community-based
Management of Middle Amazonian
Fisheries (Isaac et al. 1998)
This paper by Isaac et al. seeks to propose
a new management model for floodplain
fisheries in the state of Pará in the Middle
Amazon, where around 1.2 million people
depend on fishing for their livelihood and
200,000 are active fishers. In order to
emphasize the importance of developing an
effective management model, the authors
provide a fleeting idea of the marketed use
value of the fishery by multiplying the 4,000
to 6,000 tonnes annually landed at the
four principal towns in the Middle Amazon
(Santarém, Alenquer, Monte Alegre and
Óbidos) by average fish prices [US$ 1 per
kg] to produce a regional income figure of
US$ 4-6 million per year. Although the authors
comment that the subsistence portion of the
total catch is much larger, they fail to impute
a value for this.
E. Strategies for Managing Biodiversity in
Amazonian Fisheries (Ruffino 2001)
Ruffino’s paper examines the experience of,
and lessons learned from, the 1991-98 IARA
project on participatory management in the
Middle Amazon25. While chiefly concerned
with documenting how biodiversity has been
incorporated into fisheries management in
the case of migratory caracoideae, sedentary
species and large migratory catfish, the paper
suggests that the Amazon fishery has a use
value [marketed and non-marketed food
fish] in the order of US$ 100 million per year,
based on a catch of 200,000 tonnes per year
(as estimated by Bayley and Petrere 1989)
and an average price of US$ 0.50 per kg.
Ancillary information culled from secondary
historic sources is provided on the export
fishery; prawn and piramutaba exports from
Pará alone were worth around US$ 35-45
million between the 1970s and 1990s (10
per cent of the state’s total exports), and
ornamental fish exports numbering around
17 million by the late 1980s were worth
US$ 2 million (employing 10,000 people,
principally in the Rio Negro region of Amazonas
State). An overview of stock exploitation levels
for the major riverine species is also given, as
shown in Table 6, although no price data are
disclosed).
While the paper notes the recent emphasis
given to sport fishing with the establishment
of “The National Program for the Development
of Amateur Fishing” [PNDPA], it also confirms
the absence of reliable statistics to help gauge
its economic worth or impact.
F. The Floodplain Resources Management
Project (FRMP- Provárzea)
The FRMP has four components: strategic
studies to support public policy formulation
(notably in the areas of natural resource
25 The findings from this project contributed to formulation of the Floodplain Resources Management Project (FRMP-Provárzea 2000) sponsored by IBAMA and the international community [See F.].

�� Tropical river fisheries valuaTion: background papers To a global synThesis
management, environmental legislation,
and the economic and environmental use
of the region’s resources); promoting the
development of innovatory systems of
management that are economically, socially
and environmentally sustainable; co-
ordination of the project; and, most
significantly in the context of this report,
implementation of an integrated monitoring
and control program, including the construc-
tion of a statistical data-bank on the riparian
fishery. The program produces excellent
monthly data on landings (by species,
waterbody, vessel and gear type) and average
prices for seventeen municipalities scattered
along the river26. The results for 2001 were
published in a 73-page document, Estatística
Pesquiera do Amazonas e Pará – 2001,
which details the methodology employed to
collect and store the data, and an analytical
summary for each municipality. The report is
accompanied by one hundred tables, plus an
annex containing the questionnaire applied in
the study. On the basis of the data provided,
it is a relatively simple matter to compute the
marketed use value of the fishery in each
municipality, while complementary tables
can be constructed to show the economic
value of individual species fisheries (such as
the Apapá and the Mapará) for the surveyed
municipalities. However, it is interesting to
note that the project has not conducted this
level of analysis so far with the large quantity
of verifiable and good quality data available.
Two things emerged from this project. First,
the wide variation in prices that prevail across
regional Amazonian ports (in the case of
Apapá, average prices vary from R$ 0.50 (US$
0.21) in Monte Alegre to R$ 2.17 (US$ 0.93) in
Tabatinga, a difference of 334 per cent, the
difference for Mapará is even greater – 592
per cent), variations that complicate further
the task of placing an economic value on the
Amazonian fishery (See Table 7.).
Second, based on the figures available in the
2001 report, it is possible to calculate a crude
figure for the first sale value of the fishery then
and the quantity of landings (See Table 8.).
However, it should be noted that for whatever
reason, the project team has not done this
and there may be a good reason why they feel
that such a calculation would be misleading.
Thus, according to the Provarzea project,
the current best estimate of the value of the
fishery on the Amazon River is R$ 49,622,541
or US$ 21,337,692.
G. The Sustainable Development Reserve
of Mamirauá, Amazonas State (Begossi
2002).
Begossi’s paper provides an overview of
Mamirauá, a 1.1 million-hectare reserve
located entirely in the Amazonian flooded
forest, between the Solimões, Japurá and
Auati-Paraná rivers. Created in 1991, the
reserve is home to 5,277 individuals. The
annual mean earning of families in the reserve
is US$ 900, with 72 per cent of this income
being generated through fisheries activity.
While the author suggests that primary
exploitation of the reserve [i.e., fishing,
logging, caiman hunting and agriculture]
26 The municipalities chosen extend from Tabatinga in the far western reaches of the Upper Amazon, to Belém in the lower eastern reaches. The locations can be seen, and the statistics also accessed, via the main web page [http://www.ibama.gov/br/provarzea/varzea/menu.php?id=7].
Table �: landings in amazonas stateSpecies/Landing
PointPeak Landings –
tonnes (Year)Present Landings-
tonnes MSY? Status of Stock
Piramutaba 32 000 (1977) 20 000 20-21 000 Overexploited
Tambaqui (Manaus) 15 000 (1972) 800 Overexploited
Surubim (Amazonas) 2 500 Overexploited

chapTer 1 ��
yields a marketed use value of US$ 2.4 million
annually between 1991 and 1995, this figure
is significantly overstated due to summative
errors in the accompanying table27.
H. Projeto Piaba: Developing toward a
Sustainable Natural Resource in Amazon
Freshwater Fisheries
Projeto Piaba is an ongoing community-
based interdisciplinary project established
in 1989 to understand the ecological and
sociocultural systems of the middle Rio Negro
basin, Amazonas, Brazil, in order to conserve
and maintain the live ornamental fishery and
other renewable resources at commercially
feasible and ecologically sustainable levels.
Nevertheless, it does also provide some
aggregated data on the ornamental fish for
export market, suggesting export receipts
totaled US$ 2,216,620 in 1998 when 18.5
million fish were exported29.
I. Siamazonía (Sistema de Información de
la Diversidad Biológica y Ambiental de la
Amazonía Peruana)
Siamazonía is an offshoot of the National
Environmental Council (CONAM), being
entrusted with the management and
exchange of information relating to the
biodiversity and ecology of the Peruvian
Amazon. As such, it does not purport to
value the watershed, nor has it produced any
27 Table 1 [p.17] effectively double-counts fishery resources. Removing the double-counting error produces a lower revenue stream [US$ 1.5 million], of which fisheries accounts for about two-thirds.
28 In mid-2001, the Real was worth US$ 0.43.
29 The project authors note that this is only the figure for ornamental fish exported officially from Manaus. If, as the authors suggest, between 30-40 million ornamental fish are caught annually, then this component of marketed use value may be substantially underestimated.
Table �: landings and price data for amazonasMunicipal Landings Ave Price VALUE R$ Landings Ave Price Value
Abaetetuba 155 109 0.95 147 353.55 1 066 811 1.10 1 173 492.1
Alenquer 80 1.43 114.4 5 030 0.95 4 778.5
Alvarães - - - - - -
Belém 177 505 1.01 179 280.05 220 870 1.17 258 417.9
Coari - - - - - -
Fonte Boa - - - 245 N/A -
Itacoatiara - - - 384 795 0.69 265 508.55
Manacapuru - - - 226 104 0.51 115 313.04
Manaus - - - 2 481 1.25 3 101.25
Monte Alegre
8 169 0.5 4 084.5 198 262 0.74 146 713.88
Óbidos 5 011 0.77 3 858.47 1 046 976 0.65 680 534.4
Oriximiná 1 144 1.02 1 166.88 19 683 0.94 18 502.02
Parintins 3 703 0.81 2 999.43 264 831 0.83 219 809.73
Prainha - - - 111 0.70 77.7
Santarém 40 840 1.19 48 599.6 860 216 0.76 653 764.16
Tabatinga 983 2.17 2 133.11 18 375 2.56 47 040
Téfe 1 010 0.52 525.2 2 420 0.37 895.4
Totals 393 554 390 115.19 4 317 210 3 587 948.3
* The first three columns relate to the Apapá fishery, the latter three to the Mapará fishery. Landings are in kilograms, and prices are average prices in R$ per kilogram.

�� Tropical river fisheries valuaTion: background papers To a global synThesis
working papers. Its database, however, does
offer a limited snapshot of the quantities of fish
extracted and/or marketed in the municipality
of Loreto that could be used to compute a
use value [marketed and non-marketed food
fish] for the vicinity.
�.� other inland Waterbodies
If there are few sources offering any indication
as to the economic value of Amazonian
fisheries, there is a real paucity of information
of any sort on the other river systems in the
region. An extensive Internet search allied
to a thorough search of the main economic
and social science bibliographic databases
disclosed no articles of any relevance to this
report.
A number of other studies on river fisheries
make only a cursory mention of documented
landings in the study region. Such studies
include the following:
Coordenação-Geral de Capítulo 2: Tema:
Recursos Pesqueiros: Pesca Extractiva e
Aqüicultura (DFRP 2001)
This review of catch statistics for Brazil notes
that overall catches rose steadily during
1960-85 when around 78 per cent of catches
came from marine waters and 22 per cent
from inland waters. Since that time, there
has been a decline to 744,600 tonnes/yr:
60% from marine sources and 40% from
inland waters. But by 1990, the production
had fallen to 640,300 tonnes. The rise in
production, however, was largely attributable
to inland (culture) production, given that
marine production appears to be stagnating.
Inland capture fisheries (of which 98 per
cent were fish and 2 per cent crustacean,
represented 25 per cent of the national
production for that year) have declined since
1996 due to gold mining, domestic and
industrial pollution, and agricultural inputs, the
construction of barriers for hydroelectricity
and the canalization of rivers (DFRP 2001).
However, many of the instruments used to
mitigate these problems cause new problems
for the maintenance of fish stocks such as
the restocking of exotic species. The study
also notes that marketing of inland fisheries
is dominated by a network of intermediaries,
from the individual trader (generally someone
from within the community) that specializes in
buying and selling fish to the representatives of
companies that buy and finance production.
Because the extent of this marketing is small
and irregular, it is difficult to generate internal
capital. Producers are highly dependent on
sources of finance, be it for the improvement
of the species, and credit for hut supplies,
ice, diesel oil, or fishing equipment.
Table �: landings and gross first-sale value on the solimões and amazon rivers, �001��
Municipality Tonnes Gross first-sale
value in R$
Abaetetuba 3 363 2 690 400*
Alenquer 247 254 381
Alvarães 73 nd
Belém 9 295 13 570 116*
Coari 577 766 373
Fonte Boa 337 nd
Itacoatiara 1 593 1 593 039
Manacapuru 2 544 2 174 551
Manaus 12 868 13 250 229
Monte Alegre 785 594 234
Óbidos 1 879 1 570 528
Oriximiná 269 290 548
Parintins 2 793 3 644 405
Prainha 104 80 000
Santarém 3 995 4 417 097
Tabatinga 1 197 3 394 015
Tefé 1 986 1 332 624.50
TOTAL 43 904 49 622 541
Source: ESTATÍSTICA PESQUEIRA DO AMAZONAS E PARÁ - 2001
* The total value is not known; these figure are average values based on the average first-sale price in that municipality multiplied by total landings.

chapTer 1 ��
5. THE ECONOMIC IMPACT ON FISHERIES OF DAMS AND WATER MANAGEMENT SCHEMES
According to the Pilot Analysis of Global
Ecosystems (PAGE): Freshwater Systems
report, much of the degradation of the
world’s freshwater systems is due to habitat
destruction, construction of dams and canals,
introduction of non-native species, pollution,
and overexploitation. (www.rivernet.org/gen-
eral/WRI%20report.htm). With comparatively
few non-renewable sources of power and so
much water, it is not surprising that states in
Central and South America have harnessed
their water resources to generate energy,
improve transportation across long distances,
and for irrigation development. The continent
provides many examples of large dams,
hidrovias (large scale industrial canals), and at
least one example of a large-scale irrigation
development (Sistema Hidraulico Yacambú in
the Llanos of Venezuela Nucete 2000).
An evaluation of the full impact of dams
is an integral part of the EIAs and with
increased public awareness of the potential
negative side-effects of dam building, the
costs of building dams is now expected
to accommodate their impacts on the
environment and populations from the local
level up to the global level, as it is possible
(See Section 3.) to place a value on the loss
of biodiversity and cultural heritage among
other things. The negative effects of dams
are most observable in the short term, i.e., in
the immediate aftermath of the construction.
Such impacts include damage to the physical
environment (first order impacts) as large
areas of land (often forest in the case of
Central and South America) are flooded; loss
of aquatic and land-based species diversity
as land disappears and the oxygen levels of
water change; downstream effects as natural
changes in flooding cycles are disrupted;
increased erosion of river banks as the flow of
water rises in parts of the river; and increased
anoxia in other parts of the river as the natural
water flow is disrupted (second order impacts).
Finally, there are third order impacts that follow
from the first two and are characterized by
lower fish catches; a rise in disease (malaria
for example) as water levels and ecosystems
change; changes in microclimate as valuable
wetlands and watersheds are damaged; and
social displacement that has direct costs (of
moving peoples) and indirect costs (such as
the fragmentation of vulnerable indigenous
groups in parts of Brazil).
Some positive social benefits are also derived
from dam construction. For example, Boa
Nova and Goldemberg (1999 cited in WCD
2000) note that demographers attribute the
reduction of the birth rate in Brazil to the
increased availability of cheap hydroelectricity
that the authorities in Sao Paolo (among
others) provide to 2 million slum residents.
With access to electricity, residents are
able to watch television (a prime source of
information on family planning). Other benefits
that accrue from dam construction include
increased employment opportunities in the
construction phase and later in (expanding)
industry as a result of increased power
production. It is worth noting, however, that
the WCD 2000 review of large dam projects
came to the conclusions that while there are
benefits accruing from their construction,
these are not likely to trickle down to those
who have borne the brunt of the costs of the
construction.
Creating a legislative framework that would
allow adequate consideration of the economic
and social impacts of large dams would be a
step forward in minimizing (if not eliminating)
the negative impacts of dams. The WCD
notes that the Rio Grande Hydroelectric

�� Tropical river fisheries valuaTion: background papers To a global synThesis
Project in Colombia incorporated a royalty
payment scheme whereby those benefiting
from the production of electricity contributed
to a fund that was used to compensate those
who had lost out through the building of the
dam. The same principle was also applied in
the Tucurui dam case. (See below.)
Evaluating the impacts of dams, canalization
and water abstraction is a complex task
because the effects can spread much further
than the immediate physical area. The WCD
report (2000) notes that while a cost-benefit
spreadsheet analysis may be useful for some
projects to evaluate impacts, in the case of
most large dams they are often too complex
for such an exercise to have any meaning;
for example, livelihood, environmental and
economic impacts do not allow for easy
currency or metric comparisons. Furthermore,
the report notes that poor accounting of the
true costs and benefits of large dams in
economic terms may mean that the efficiency
and profitability of such schemes remains
occluded (WCD 2000).
The available literature on dams (examined
below) offers little in the way of economic
evaluation of the impacts on fisheries. Dams
certainly hinder the migratory routes of fish
even though there are means of mitigating
this (see below). Goulding et al. (1997) noted
that no studies on the impact of fish had been
conducted on the five large dams built in the
Amazon River basin by 1996. The impact
on fishing is often contradictory: while the
type of fish caught and the level of catch in
specific areas may fall, catch levels overall
can rise. However, Jackson and Marmulla
(2001) urged caution in this regard, noting
that the further downstream the dam, the
less likely the fishery in the newly flooded
reservoir can compensate for lost catches on
the other side of the dam wall. Yet, in many
cases, the change in fish catches is rarely
mentioned (i.e., little data available on values
of the catch before and after construction)
although relocation and compensation
costs are provided. Relocation costs (in so
far as these can act as proxy values for the
livelihoods of fishers) can be problematic
because resettlement is frequently to areas
that are wholly unsuitable (for example,
fishers/farmers offered apartments in the
city; occupants of wetlands moved to dry
savannah areas) or at best less productive.
The Influence of Dams on River Fisheries
(Jackson and Marmulla 2001)
The authors assess the status of catches
from reservoirs in South America (principally
Brazil) and find that more than half the catch
from northeastern Brazil is made up of tilapia.
They also state that, compared to other
regions, the productivity of reservoirs is very
low (from 2.1 kg/ha/year in the Uatum river
up to 11.5 kg/ha/year in the Itaipu dam); they
conclude that this is due to the length of time
the water stays in the reservoir, affecting its
quality and its suitability as a habitat for many
species. The authors also assess dams in
Central America (the only article that does
so). Because rivers in Central America are
generally much shorter and less important
from a livelihoods point of view, reservoirs
created by damming have served to provide
extra fisheries opportunities. The authors
cite the case of Panama where peacock
bass, an exotic species (which had previously
decimated native stocks) rapidly became an
important commercial species providing a
good source of income for local small fishers.
Unfortunately, with no price or systematic
landings data, it is not possible to derive
any use value of peacock bass from the
information given by the authors.
chapTer 1 ��
30 A term used to describe non-indigenous Brazilians encouraged to migrate to the remote interior mainly during a period of border securing in the 1970s.
�.1 The itaipu dam
Biodiversity and Fisheries Management in
the Paraná River Basin: Successes and
Failures (Agostinho and Gomes 2003)
The Upper Paraná river is defined as the
upper third of the Paraná river basin,
stretching down to the Itaipu dam. Agostinho
and Gomes analyze how biodiversity in this
river has been affected by past fisheries
management decisions, focusing in particular
on adverse impacts of the construction of
dams on fisheries. As reported, 130 of the
dams are greater than 10 meters in height,
and 26 of them cover an area larger than 100
square kilometers. Besides, it was not until
relatively late in the day (1981) that it became
mandatory for hydroelectric companies to
produce EIAs ex-ante. While the article notes
the failure of management programs designed
to facilitate fish migration (1920-50s), and
to increase yield by stocking exotic and/or
native species (1950-90s), it merely alludes
to the virtual absence of large fish species
in the Upper Paraná and the low yields of
artisanal fisheries in the south-southeastern
reservoirs as evidence of the impact of dam
construction. No corroborative figures are
cited to support the authors’ assertions.
�.� The Tucurui dam
Tucurui Hydropower Complex Brazil (La
Rovere and Mendes 2000)
This study was conducted as part of a global
report entitled “Dams and Development – a
new framework for decision making” for the
World Commission on Dams. The Tucurui
Hydropower Complex (THC) is located in the
Tocantins River on the Tocantins-Araguaia
River Basin. Construction was started in 1975
and completed in 1984. Phase II began in 1998
with the turbine starting in 2002. Although
primarily built for hydropower production, it
has a secondary goal of providing a navigable
water route.
The river is estimated to contain some
300 species of fish and the ecosystem is
reportedly one of the richest in the world.
Prior to the construction of the dam, there
were two distinct groups in the region: (three)
indigenous peoples and the colonists30 who
survived mostly on fishing, gold and diamond
mining, and subsistence agriculture. Fishing
was estimated to produce 1,534 tonnes per
year, 900 of which came from downstream
of the dam. The dam was started under the
Military Junta and the process was largely
driven by the industrial sector, with concern at
the time more on the impact of the ecosystem
on the dam than vice versa. An attempt at
an EIA was made in 1977, two years after
construction began, but it was too late to
have had any influence. The regularization
of water flow affected natural flooding cycles
that were responsible for natural fertilization
processes; a large amount of nutrient-rich
organic matter was now trapped behind
the dam wall with lower agricultural yields
downstream as a result. Although the 1977
assessment predicted that fish populations
would be affected, there was insufficient
information available on pre-dam populations
to allow any realistic predictions. However,
with reduced water quality downstream of the
dam, observations suggested that large-scale
fish deaths were occurring and the diversity of
species was estimated to have been reduced
by 19 per cent. In particular, the ubarana, a
commercially significant fish species, came
close to extinction as a marked decline in
downstream catch rates was reported by
fishing populations. But no bequest value for
the ubarana was identified. Fish populations
also suffered, with a reported 29 per cent

�� Tropical river fisheries valuaTion: background papers To a global synThesis
drop in reservoir species diversity and 25
per cent drop of species upstream of the
reservoir. By the mid-1990s, scientists were
able to demonstrate that fish productivity
overall had risen by 200 per cent and reservoir
catch had increased by 900 per cent, while
the downstream catch had dropped by 45
per cent. No attempt is made, however, to
ascribe a monetary value to the lost catches.
While the report does not put a monetary
figure on the TEV of the dam, it does provide
a breakdown of financial compensation paid
to the various municipal districts [based on
flooded area affected and ranging in price from
R$ 30,000 for Itupiranga to R$ 287,900 for N.
Repartimento (p. 89)]. This could be seen as
providing an indication of the perceived value
of the resource in terms of its foregone option
and bequest values. However, the authors
also note that while some indigenous groups
(eventually) received sizeable compensation
(replacement/relocation costs) for loss of land
and livelihoods and a fund of US$ 740,000
was made available to assimilate one group
into modern society, other non-indigenous
small holders did not. This information
suggests that using such figures as proxies
for the economic impact of the dam would
be incomplete. The authors also provide
a rudimentary cost/benefit analysis of the
various components of the dam project (p.
132).
Cana Brava Hydroelectric Power Plant:
Environmental and Social Impact Report
(IADB 2000)
As this power plant on the Tocantins River was
still under construction at the time of writing,
this report only offers an examination of the
potential impacts of the dam. Implications
of the construction are identified, namely,
environmental implication (the loss of land
through flooding, increase of soil erosion,
and decrease in fish populations); mineral
implication (the loss of potentially valuable
alluvial deposits under the reservoir); and
socioeconomic implication (258 families to
be relocated with $ 4 million allocated to
cover resettlement costs). The US$ 15,503
value attached to each family relocation
appears to be much lower than other values
given in reports on other dam resettlement
calculations. The project has, however, a very
sophisticated program in place to evaluate
environmental changes following flooding.
�.� The yacyretá dam
Report of Social Impacts of Dams;
Distributional and Equity Issues – Latin
American Region (Ferradas 2000)
This author notes that most studies focus
on the upstream impacts of dams. Also,
because many of the large dams from the
1970s were built as much for power as for
political reasons, studies and information on
the possible effects of impacts of the dams
were negligible at the time. Besides, these
dams were often built before EIA evaluation
methods were commonly applied, and so
there was little necessity to collect data
before and after the construction. Largely
based on her experience with the Yacyretá
dam on the Paraná river, the author describes
the political and economic contexts of the
building of many large dams on the continent
and outlines some of their biggest problems
(lack of public consultation, relocation and
requisition of indigenous lands, destruction
of habitat and fishing livelihoods, etc). She
notes that only when the democratization
process began in the region did the issue of
the social impacts of dams find a way onto
the agenda.
Ferradas notes that fishers who were affected
by the Yacyretá dam were offered US$ 8,000
each as compensation for loss of earnings
(i.e., low catches, harder access to the river)
provided they agreed to make no further
claims. However, according to Ferradas,

chapTer 1 ��
fishing activities were not identified as a
possible source of conflict in the original plans
for the dam possibly because many fishers
were reluctant to identify themselves as such
because it was an admission of poverty.
The paper highlights a number of important
issues. First, it assumes that decisions to
accept the offer on the table were taken on
the basis of perfect information. Given the
isolated nature of the communities, their lack
of access to public information services,
the high levels of functional illiteracy and an
inability to foresee the consequences, it is
likely that the compensation accepted placed
a far lower value on the resource and the
livelihoods affected than was appropriate.
Brazil employs a system of royalties as a means
of redistributing the benefits from dams.
Ferradas mentions the distribution of some
US$ 989 million from the Itaipú dam (Brazil,
Argentina, Paraguay border) although states
have no control over how monies received are
allocated. While ideally this amount should
go towards compensating the losers from
the project, it is not guaranteed nor protected
by law. Again, the royalties could be viewed
as an indication of the lost use values of the
resource (in terms of foregone earnings from
fishing, for example) and the non-use values
of the environment as a whole (in terms of the
loss of natural habitat, for example).
�.� The itá dam
Large Dams and Their Alternatives: Social
and Resettlement Issues (World Commission
on Dams)
Bermann (1999) reports on the Itá dam, built
on the Uruguaia River. The figure given in
compensation (the relocation value) to each of
the displaced 4,000 families was US$ 93,750
per family under the conventional resettlement
plan, but this amount fell to only US$ 47,920
per family under the community-managed
resettlement plan that was introduced
following the privatization of the company
building the dam. Although the reduction in
the cost of relocation is cited in the report
as a benefit, this is only obviously so from a
corporate perspective, and it is unclear which
of the two figures is the more realistic forgone
use value of the resettled inhabitants.
�.� The porto primavera dam
Kudlavicz (1999) reports that the building
of the Porto Primavera dam on the Parana
River (that began in the 1970s and is still
uncompleted) has had a dramatic effect on
fish stocks: there are no mechanisms in place
to mitigate upstream migration problems;
the flooding of natural upstream lakes has
impacted upon breeding cycles with the
result that downstream catches have fallen
by 80 per cent and some 700 fishers have
been affected by the dam. Kudlavicz does
not, however, attempt to place a monetary
value on the use values foregone through the
decreased catches.
�.� The urra dam
Fishing production dropped from 6,000 to
1,700 tonnes per year (Correa 1999) in the
lower Sinu Basin following the construction
of the URRA dam in Colombia in the early
1990s. This has had a particularly devastating
effect on the people who depended upon
fish as their main source of animal protein
even though the study failed to quantify this
consumption shortfall.
�.� The ralco dam
The Ralco Dam and the Pehuenche People in
Chile: lessons from an ethno-environmental
conflict (Aylwin 2002)
As with many dams built in Central and South
America, the issue of indigenous peoples is
prominent in the discussion. The standoff
between the Pehuenches and the Chilean
�0 Tropical river fisheries valuaTion: background papers To a global synThesis
government over the imminent flooding of the
Bio-Bio river, downstream of the Ralco dam,
is analyzed by Aylwin. In common with all the
available literature on the dam, the indigenous
rights aspect of the project has overshadowed
the environmental aspects; indeed, there is
evidence that environmental assessments
ordered by the World Bank on the Pangue
dam further upstream were suppressed by the
government. However, Aylwin does describe
the impact of the dam on the fisheries, noting
that six species endemic to the Bio-Bio River
are likely to be lost when the valley is flooded,
resulting in some loss of existence values.
Moreover, he points out that the Pehuenche
people who have traditionally relied upon the
river for their livelihoods will suffer a potential
loss in income as the river changes in nature
(from a fast-flowing, steep river to a sluggish
river) and the fisheries are consequently
affected. No values are ascribed to the
fisheries or their potential loss or change. In
terms of relocation values, the figures quoted
by the Miami Herald (6 November 2002) show
that 84 of the 92 families who were affected
by the dam have already moved out while 7
remained (the core of the indigenous protest),
and that US$ 20 million was allocated for the
relocation (which amounts to US$ 217,391
per family). This comparatively high figure
perhaps reflects the bequest value assigned
to the unique Pehuenche culture as much as
the costs of moving and rebuilding. Evidence
available on various environmental lists on the
Internet also suggests that the marketed non-
use value of tourism on the Bio-Bio (renowned
as a white-water rafting destination) will be
adversely affected by the flooding of the
valley, although, once again, no supporting
figures are given.
�.� hidrovia projects
Critical environmental costs of the Paraná-
Paraguay waterway project in South America
(Bucher and Huszar nd)
The Hidrovia project aims to create a
navigable waterway 3,442 km long between
Caceres in Brazil and the harbor at Nueva
Palmira in Uruguay. This will involve drastically
altering the course of the river and would
affect the Pantanal, the largest wetland in
the world. Bucher and Huszar argue that if
the critical value of the environmental costs
of the project (i.e., the existence and bequest
values) were included in the evaluation, they
would tip the balance towards preserving the
Pantanal rather than building the Hidrovia.
Although no figures are presented to back
up their assertions, the authors indicate that
the implications of disturbing the water flow
through the Pantanal would be complex
and critical; water flow in rivers would
increase, causing increased erosion and
flooding during the rainy season. They also
cite the potential loss of fish biodiversity as
particularly important, but again no figures
are given. Finally, the authors argue that
while the current economic evaluation of
the project shows a net positive return, the
underlying assumptions are very sensitive
and the environmental costs have not been
internalized.
Analysis of the EIA for the Araguaia-Tocantins
Hidrovia Project (CEBRAC 2000)
The Hidrovia is set to be an industrial waterway
designed to transport grain from the interior
of Brazil to the coast for onward export. The
system will link to the Tucurui hidrovia through
a system of locks. CEBRAC evaluated the
resubmitted EIA for the Hidrovia project
because the first EIA for the project was
rejected wholesale by the Federal Chamber
of Deputies of Brazil on the grounds that it
was full of errors. They list a catalogue of
potential ecological, social and economic
disasters should the plan be carried out.
Many indigenous groups dependent on fish
for their livelihoods will be directly affected;
changes in fish populations will also have
knock-on effects on other species in the
food web. The analysis is scathing of the
impact of this vast hydrological project; the
authors find no justification at all for it. They
argue that the economic cost of the project
chapTer 1 �1
is seriously underestimated as the feasibility
of the project is simply based on comparing
the savings in transportation costs with the
costs of building the hidrovia. Unfortunately,
the authors provide no data to support their
claims.
�.� pollution effects
Mining has been present on many rivers in
CSA since the time of the Spanish occupation
in the 16th century; as a result, the rivers
have often acted as sinks for mining debris
and the inputs used in the mining process
(notably mercury). Research on the Internet
also reveals that mining is currently the most
commonly mentioned factor in river pollution
in CSA. Many cases are cited on the Internet
about the pollution of rivers in the region
(See http://www.globalminingcampaign.org/
theminingnews/case.html.), but many of them
are anecdotal, and there are few academic
texts that quantify the level of pollution and its
impact on fish resources. A recent cyanide
spill on the Omai River (in the Essequibo
River basin in Guyana), for example, caused
the death of thousands of fish, and the Pan-
American Health Organization, responding to
the call for assistance by the government of
Guyana, concluded that the Omai River was
a dead river, devoid of any life. The fact that
no baseline data exist for the many aquatic
species of the river means that the impact will
never be fully known.
6. CONCLUSION
In order to calculate a TEV for the river fisheries
of Central and South America, a considerable
amount of data is required on both direct and
indirect use values. Thus, data are needed not
only on the value of the fishery (marketed and
non-marketed values) but also on the value of
the underlying biodiversity of the system, the
existence of the fishery, the livelihoods of the
fishers, the existence (now and in the future) of
the environment in a pristine or altered state,
the continued existence of certain indigenous
groups, the aesthetic value of the resource
(the river, the falls, the lake), and so on.
Yet, the importance of the inclusion of non-
use values is highlighted in the study carried
out in the Chilean National Parks (see section
3), where the TEV for the parks exceeded by
forty times the non-use values calculated.
In other words, a failure to account for both
the value of the fishery and the surrounding
ecosystem is likely to seriously undervalue
the real value of the resource. However,
with much of the necessary data on non-use
values absent and very little data on the value
of the fishery itself, computing a TEV for the
freshwater river fisheries of CSA is impossible
at present.
This report also looked at the impact of
altered water courses on fisheries, particularly
the impact of dams and water abstraction
schemes. The report found that, again,
there was a paucity of information on this
topic. While many dam evaluations have
cited a change in catches from rivers, or a
change in the diversity of fish stocks, few
attach numbers to such assertions and not
one report attempts to quantify the level of
impact in an economic/market sense. The
only indication the reports give of the value
ascribed to the area is in the size of the
relocation grants given to affected households.
These relocation monies represent the cost of
rebuilding a house, and some also represent
the potential lost earnings as a result of being
shifted to less productive land or to an entirely
different environment. There is an additional
problem, however, of using relocation prices
as a proxy for the impact of dams on fisheries.
The bargaining power of the fishers is very
weak and their acceptance of the relocation
package may be wrongly interpreted as
a willing-to-accept payment for their lost/
changed livelihood rather than as a having-
to-accept payment. Many of the fishers are
functionally illiterate and are certainly not

�� Tropical river fisheries valuaTion: background papers To a global synThesis
able to negotiate relocation costs either on
the basis of a good understanding of the
implications of these decisions, or on the
basis of complete information. Conversely, of
course, in some cases the sums offered (and
accepted) for relocation may stand for a fair
representation of the impact of the dam on
livelihoods; for example, some fishers may be
more than happy to accept an apartment in
the city in exchange for a precarious livelihood
based on an unstable resource in the rural
areas.
However, despite the less than positive
summary above, some studies conducted on
discrete parts of the continent have provided
us with examples of the sorts of values we
might hope to obtain. The authors suggest
that attempts to value CSA river fisheries
could be developed in two directions. First,
the Provarzea project run by IBAMA (see
section 3) has offered detailed catch and price
data for selected parts of the Amazon basin
and could provide a useful starting point for
computing a more all-embracing value of the
TEC of local fisheries. However, it will not be
easy to extend such analyses to encompass
the entire river basin, let alone the continent’s
other inland fisheries.
Second, the value of sport fishing in CSA
(like in most parts of tropical Africa and Asia)
remains an unknown quantity. A cursory
glance on the Internet shows that the Amazon
and Plate river basins offer numerous
opportunities for sport fishing ventures (both
for locals and foreign tourists), yet sport
fishing as a contributor to the local economy
is rarely taken seriously. Likewise, the role
of white-water rafting and other riverine-
based tourist activities could (and probably
do) contribute significant amounts of foreign
exchange to Peru, Bolivia, Chile, and many
countries in Central America; yet there are
no studies known that attempt to establish
an economic value of these activities. The
authors thus propose that a series of CVM
studies be conducted on the principal sport
fishing venues in Brazil, Uruguay, Argentina
and Chile as a first step in generating a value
for recreational fishing in the region.
REFERENCES
Agostinho, A.A. and L.C. Gomes. 2003. Biodiversity and fisheries management in the Paraná river basin: successes and failures. Unpublished UNDP manuscript, Universidade Estadual de Maringa, Brazil. www.unep.org/bpsp/Fisheries/Fisheries%20Case%20Studies/AGOSTINHO.pdf (Accessed 24 April 2003).
Almedia, O.T., D. McGrath, E. Arima and M.L. Ruffino. 2000. Production Analysis of Commercial Fishing in the Lower Amazon. Paper presented at Constituting the Commons: Crafting Sustainable Commons in the New Millennium, the Eighth Conference of the International Association for the Study of Common Property, 31 May - 4 June 2000, Bloomington, Indiana, USA.
Almeida, O.T., K. Lorenzen and D. McGrath. 2003. Commercial fishery sector in the regional economy of the Brazilian Amazon. Paper presented a t the Second In terna t iona l Symposium on the Management of Large Rivers for Fisheries, 11-14 February 2003, Phnom Penh, Cambodia.
Araujo-Lima, C.A.R.M. and M. Goulding. 1997. So fruitful a fish: Tambaqui, aquaculture and conservation in the Amazon. Columbia University Press, New York.
Araujo-Lima, C.A.R.M., M. Goulding, B. Forsberg, R. Victoria and L. Martinelli. 1998. The Economic Value of the Amazonian Flooded Forest, 26 (5):2177-9. In Proceedings of the 26th Congress held in São Paulo, Brazil. International Association of Theoretical and Applied Limnology.
Aylward, B., J. Echeverría and E. Barbier. 1995. Economic incentives for watershed protection: a report of an ongoing study of Arenal, Costa Rica. CREED Working Paper Series No.3. International Institute for Environment and Development (IIED),London.
Aylward, B.A. 1993. The economic value of pharmaceutical prospect ing and i ts role in biodiversi ty conservation. LEEC Discussion Paper Series, DP 93-06. International Institute for Environment and Development (IIED), London.
Aylwin, J. 2002. The Ralco dam and the Pehuenche people in Chile: lessons from an ethno-environmental conflict. Paper presented at the Conference Towards Adaptive Conflict Resolution: lessons from Canada and Chile” Centre for the Study of Global Issues, University of British Columbia, 25-27 September 2002, Vancouver, Canada.
Barbier, E. 1993. Sustainable use of wetlands; valuing t rop ica l we t l ands bene f i t s : economic
chapTer 1 ��
methodo log ies and a pp l i ca t i ons . The Geographical Journal 159(1): 22-32.
Barthem, R. and M. Goulding. 1997. The catfish connection. Columbia University Press, New York.
Batista, V.S., A.J. Inhamuns, C.E.C. Freitas and D. Freire-Brasil. 1998. Characterization of the fishery in river communities in the low-Solimões river, Amazon region. Fisheries Management and Ecology 5(5):419-428.
Bayley, P. N. and M. Petrere. 1989. Amazon fisheries: assessment methods, current status and management options. Special publications of the Canadian Journal of Fisheries and Aquatic Sciences 106: 385-398.
Begossi, A. 2002. The sustainable development of the Mamirauá Amazonas State (Brazil). In D.C. Wilson, A. Hough, A. Jarre, A. Sverdrup-Jensen, M. Ahmed, A. Begossi, S. Donda and M. Pido. Guidelines for the assessment of small-scale fisheries against the MSC standard. Report to the MSC, Institute for Fisheries Management and Coastal Community Development (IFM), Denmark.
Beltrán Zurriago, C.S. and A.A. Villaneda Jiménez. 2000. Perfil de la Pesca y la acuicultura en Colombia. Instituto Nacional de Pesca y Acuicultura (INPA), Subdirección de Investigaciones. FAO, Santiago, Chile.
Bermann, C. 1999. Community-managed resettlement: the case of I ta dam. Large dams and their alternatives: social and resettlement issues. World Commission on Dams. www.dams.org/kbase/consultations/latin/abs_p5_en.htm. (Accessed 16 April 2003).
Bisset, R. 1978. Quantification, decision-making and environmental impact assessment in the United Kingdom. Journal of Environmental Management 7:43-58.
Bittencourt, M.M. 1991. Explorção dos recursos pesqueiros na Amazônia Central: situação do conhecimento atual, p. 321-325. In A.L. Val, R. Figliuolo and E. Feldberg (eds.) Bases Cientificas para estrategias de preservacao e desenvolvimento da Amazônia: fatos e perspectivas. Vol. 1. INPA, Manaus, Amazonas. Cited in Directoria de Fauna e Recursos Pesquieros, Coordenação-Geral de Gestão de Recursos Pesqueiros – CGREP, Capítulo 2, Tema, Recursos Pesqueiros, Pesca Extractiva e Aqüicultura.
Bowers, J. 1990. Economics of the environment: the conservationists’ response to the Pearce Report. British Association of Nature Conservation, London.
Bucher, E.H. and P.C. Huszar. nd. Critical environmental costs of the Prana-Paraguay waterway project in South America. www.dare.agsci.colostate.edu/ea240/critical/html. (Accessed 4 April 2003).
CEBRAC. 2000. Analysis of the EIA for the Araguaia-Tocantins Hidrovia Project. The CEBRAC Foundation, Brazil.
Ceideira, R.G.P., M.L. Ruffino and V.J. Isaac. 2000. Fish catches among riverside communities around Lago Grande de Monte Alegre, Lower Amazon. Fisheries Management and Ecology 7:355-374.
Cetra, M. and M. Petrere. 2001. Small-scale fisheries in the middle river Tocantins, Imperatriz (MA), Brazil. Fisheries Management and Ecology 8(2):153-162.
Chao, N.L. and G. Prang. 1997. Project Piaba – Towards a sustainable ornamental fishery in the Amazon. Aquarium Sciences and Conservation 1(2):105-111.
Clapp, R.A. 1995a. Creating economic advantage: forest policy as industrial policy in Chile. Economic Geography 71(3):273-296.
Clapp, R.A. 1995b. The unnatural history of the Monterey Pine. Geographical Review 85(1):1-19.
Correa, I. 1999. Urra dam project, Colombia. In Large dams and their alternatives: social and resettlement issues. World Commission on Dams. www.dams.org/kbase/consultations/latin/abs_p5_en.htm. (Accessed 16 April 2003).
De La Maza, C.L. 1997. Beneficios Monetarios en Areas Silvestres Protegidos: Aplicación de los Métodos de Valoración Contingente y Costo de Viaje. Proyecto CONAF/PNUD/CHI/89/003 (Mimeo).
Dias-Neto, J. and L.C.C. Dornelles. 1996. Diagnostico da pesca marítima do Brasil. IBAMA, Brasilia. Cited in Directoria de Fauna e Recursos Pesquieros, Coordenação-General de Gestão de Recursos Pesqueiros – CGREP, Capítulo 2, Tema, Recursos Pesqueiros, Pesca Extractiva e Aqüicultura.
Diegues, A.C. 2002. Sea tenure, traditional knowledge and management among Brazi l ian art isanal f ishermen. NUPAU, Research Centre on Population and Wetlands, University of Sao Paolo, Brazil.
Directoria de Fauna e Recursos Pesquieros (DFRP). 2001. Coordenação-General de Gestão de Recursos Pesqueiros – CGREP, Capítulo 2, Tema, Recursos Pesqueiros: Pesca Extractiva e Aqüicultura.
Dupuit. J. 1844. On The Measurement of the Utility of Public Works. Annales des Ponts de Chaussees, Vol. 8.
Eberlee, J. 2000. Assessing the benefits of bio-prospecting in Latin America. IDRC Reports: Science from the Developing World. www.idrc.ca/reports/read_article_english.cfm?article_num=609 (Accessed 15 April 2003).
Escobar, D.F., H.R. Morales, D.L. Sanchez and J.C.A. Sanchez. 2003. Actitudes Ambientales Frente al Rio Quilichao. www.puj.edu.co/fhumanidades/psicologia/proyectosintesis/HIPERVINCULOS/PSICOLOGIA_AMBIENTAL/PA99206a.htm (Accessed 12 April 2003).
Etchart, G. 2000. Un modelo económico empírico para el uso de los recursos piscícolas y forestales. www.ecoiuris.com/paginas/art102.htm. (Accessed 24 March 2003).
�� Tropical river fisheries valuaTion: background papers To a global synThesis
Fankhauser, S. 1993. Global warming damage costs: some monetary estimates. Working Paper GEC 92-29. The Centre for Social and Economic Research on the Global Environment (CSERGE), University of East Anglia and the University of London.
Food and Agriculture Organization (FAO). Fish-Stat Plus database. [Universal software for fisheries statistical time series available from:www.fao.org/statistics]. (Accessed March-April 2003).
Food and Agriculture Organization (FAO). 2002. The State of World Fisheries and Aquaculture. FAO, Rome.
Food and Agriculture Organization (FAO). nd. Number of f ishers doubled since 1970. Non-serial publications C929 webarticle. www.fao.org (last accessed 18 July 2007).
Food and Agriculture Organization (FAO). 2000a. Capture fisheries production, 2000. FAO, Rome.
Food and Agriculture Organization (FAO). 2000b. Water as a resource for food production. Twenty-sixth FAO Regional Conference on Latin America and the Caribbean, 10-14 April 2000, Merida, Mexico.
Fernandez-Baca, J. 1998. Amazonian fisheries: socio-economic issues and management implications. Env i ronmenta l Economics Programme Discussion Paper DP98-02. International Institute for Environment and Development (IIED), London.
Ferradas, C. 2000. Report of social impacts of dams: distributional and equity issues – Latin American region. World Commission on Dams. www.dams.org
Foy, G. and H. Daly. 1989. Allocation, distribution and scale as determinants of environmental degradation: case studies of Haiti, El Salvador and Costa Rica. Environment Department Working Paper No.19. World Bank, Washington D.C.
FRMP-Provárzea. 2002. Estatística Pesqueira do Amazonas e Pará – 2001. Mimeo. Manaus.
Ghishan, P. nd. Fishery in Lake Titicaca. Andes of Bolivia. www.duke.edu/~bsb3/bolivia/pete.htm
Goulding, M., N.J.H. Smith and D. Mahar. 1997. Floods of fortune: ecology, conservation and aquaculture of the Amazon’s Tambaquí. Columbia University Press, New York.
Hodge, I. 1995. Environmental economics: individual incentives and public choices. Macmillan, Basingstoke.
IADB. 2000. Cana Brava hydroelectric power plant: environmental and social impact report.
Isaac, V.J.; M.L. Ruffino and D. McGrath. 1998. The experience of community-based management of middle Amazoinian fisheries. Paper presented at Crossing Boundaries, the Seventh Annual Conference of the International Association for the Study of Common Property, 10-14 June 1998, Vancouver, British Columbia, Canada.
Jackson, D.C. and G. Marmulla. 2001. The influence of dams on river fisheries. In G. Marmulla (ed.) Dams, f ish and fisheries. Opportunit ies,
challenges and confl ict resolution. FAO, Rome.
Krutilla, J.V. 1967. Conservation reconsidered. American Economic Review 47:777-786.
Kublicki, M. 2003. Considerations of general ecology in a global comparison of fisheries in a north-south perspective. FISHGOVFOOD Working Paper. MARE, Amsterdam.
Kudlavicz, M. 1999. Porto Primavera dam, Parana river. Large dams and their alternatives: social and resettlement issues. World Commission on Dams. www.dams.org/kbase/consultations/latin/abs_p5_en.htm. (Accessed 16 April 2003).
La Rovere, E.L. and F.E. Mendes. 2000. Tucurui hydropower complex, Brazil. A World Commission on Dams case study prepared as an input for the World Commission on Dams, Cape Town. www.dams.org
Lara, A. and T. Veblen. 1993. Forest plantations in Chile: a successful model. In A. Mather. Afforestation: policies, planning and progress. Belhaven Press, Boca Raton.
Larraín R.-T., S. and R.C. Stevens. 2002. Parque Pumalin: Obstaculo u Oportunidad para el Desarrollo. Lom Ediciones, Santiago.
Macfadyen, G. and E. Corcoran. 2002. Literature review of studies on poverty in fishing communities and of lessons learned in using the SLA in poverty al leviation strategies and projects. FAO Fisheries Circulars C979. FAO, Rome.
Mérigoux, S., D. Ponton and B. Merona. 1998. Fish richness and species-habitat relationships in two coastal streams of French Guiana, South America. Environmental Biology of Fisheries 51(1):25-39.
Merona, B. 1990. Amazon fisheries: general characteristics based on two case studies. Interciencia 15(6):461-468.
Mol, J.H., D. Resida; J.S. Ramlal and C.R. Becker. 2000. Effects of El Niño-related drought on freshwater and brackish-water fisheries in Suriname, South America. Environmental Biology of Fishes 59(4):429-441.
Munro, G.R. 1981. The economics of fishing-an introduction. In J.A. Butlin (ed.) Economics and resources policy. Longmans, London.
Myers, N. 1988. Natural resource systems and human exploitation systems, physiobiotic and ecological linkages. Environment Department Working Paper No.12. World Bank, Washington, D.C.
National Research Council (NRC). 1983. Managing tropical animal resources-crocodiles as a resource for the tropics. Report of an ad hoc panel on crocodile farming. http://music-ir.org/gsdl/collect/demo/import/bostid/b20cre/b20cre.htm (Accessed 10 April 2003).
Nucete, M. 2000. Conflicts resolution and negotiation: the experience of Sistema Hidráulico Yacambú – Quicor CA in Venezuela. A World Commission on Dams (WCD) regional consultation on large

chapTer 1 ��
dams and decision- making: conflict and negotiation. Paper prepared as an input for the World Commission on Dams, Cape Town. www.dams.org
Ornamental Fish International (OFI) Journal. 2002. Decade of project Piaba: reflections and prospects. Off ic ia l publ icat ion of Ornamental Fish International. Issue 39. May 2002.
Orlove, B. 1990. Local control of aquatic resources: community and ecology in Lake Titicaca, Peru. American Anthropologist 9(2):362-382.
Orlove, B. 1989. Some doubts about trout: fisheries development projects in Lake Titicaca, p. 211-246. In B.S Orlove, M.W. Foley and T. F. Love (eds.) State, capital and rural society: anthropological perspectives on political economy in Mexico and the Andes. Westview Press, Boulder, Colorado.
Orlove, B. 1986. Barter and cash sale on Lake Titicaca: a test of compet ing approaches. Current Anthropology 27:85-106.
Paiva, M.P. 1997. Recursos pesquiros estuarinos e marinhos do Brasil. Fortaleza, EUFC. Cited in Directoria de Fauna e Recursos Pesquieros, Coordenação-General de Gestão de Recursos Pesqueiros – CGREP, Capítulo 2, Tema, Recursos Pesqueiros, Pesca Extractiva e Aqüicultura.
Paiva, M.P. 1983. Peixes e Pescas de Aguas Interirores do Brasil. Editerra, Brasília (DF). Cited in Directoria de Fauna e Recursos Pesquieros, Coordenação-General de Gestão de Recursos Pesqueiros – CGREP, Capítulo 2, Tema, Recursos Pesqueiros, Pesca Extractiva e Aqüicultura.
Paiva, M.P. 1976. Estimativa do potencial da produção de pescado em grandes represas brasileiras. Centrais Elétricas Brasileiras, Rio de Janeiro. Directoria de Coordinação. Cited in Directoria de Fauna e Recursos Pesquieros, Coordenação-General de Gestão de Recursos Pesqueiros – CGREP, Capítulo 2, Tema, Recursos Pesqueiros, Pesca Extractiva e Aqüicultura.
Pauly, D., V. Christensen, J. Dalsgaard, R. Froese and F. Torres. 1998. Fishing down marine food webs. Science 279:860-863.
Pearce, D.W. and R.K. Turner. 1990. Economics of natural resources and the environment. Harvester/Wheatsheaf, Hemel Hempstead.
Peters, C.M., A.G. Gentry and R. Mendelsohn. 1989. Value of an Amazonia rainforest. Nature 339:655-656.
Peterson, G., C.R. Allen and C.S. Holling. 1998. Ecological resilience, diversity and scale. Ecosystems 1:6-18.
Petrere, M., E.A. Córdoba; R.B. Barthem, L.E. Muñoz Acosta, S.Z. Rodrigues Saraiva, S.A. Franco de Camargo and V. da Silva Batista. 2003. Present status of the commercial fisheries in the west Amazon bas in . Paper presented a t the Second International Symposium on the Management of Large Rivers for Fisheries, 11-14 February 2003, Phnom Penh, Cambodia.
Petrere, M. 1994. Synthesis on fisheries in large tropical reservoirs in South America. Consultancy document prepared for FAO presented at the Simposio Regional Sobre Manejo de la Pesca en Embalses en America Latina, 24-28 October 1994, Havana, Cuba. Cited in Directoria de Fauna e Recursos Pesquieros, Coordenação-General de Gestão de Recursos Pesqueiros – CGREP, Capítulo 2, Tema, Recursos Pesqueiros, Pesca Extractiva e Aqüicultura.
Petrere, M. 1983. Relationships among catches, fishing effort and river morphology for 8 rivers in Amazonas State (Brazil). Amazoniana 8:281-296.
PLANVASF. 1989. Programa para o desenvolvimento da pesca e da aqüicultura. Brasília. Plano Director para o Desenvolvimento do Vale do São Francisco. Cited in Directoria de Fauna e Recursos Pesquieros, Coordenação-General de Gestão de Recursos Pesqueiros – CGREP, Capítulo 2, Tema, Recursos Pesqueiros, Pesca Extractiva e Aqüicultura.
Projeto Piaba. 2002. Developing towards a sustainable natural resource in Amazon freshwater fisheries. www.angelfire.com/pq/piaba/ (Accessed 23 April 2003).
Rees, J. 1985. Natural resources: allocation, economics and policy, Methuen, London.
Reeves, R., S. Leatherwood, T. Jefferson, B. Curry and T. Henningsen. 1996. Amazonian manatees, Tr ichechus inunguis in Peru: distr ibut ion, exploitation and conservation status. Interciencia 21(6):246-254.
Ruffino, M.L. 2001. Strategies for managing biodiversity in Amazonian fisheries. Biodiversity in fisheries – the blue Millennium project. www.worldfish.org/bm_chapter2.html (Accessed 4 March 2003).
Samples, K., J.A. Dixon, J.A. and M.M. Gowen. 1986. Information disclosure and endangered species valuation. Land Economics 62(3):306-312.
Santos, G.M. and E.J.G. Ferreria. 1999. Peixes da Bacia Amazônica, p. 345-373. In R.H. Lowe-McConnel (ed.) Estudos Ecologicos de Comunidades de Peixes Tropicais. Editora da Universidade de São Paulo. São Paulo. Cited in Directoria de Fauna e Recursos Pesquieros, Coordenação-General de Gestão de Recursos Pesqueiros – CGREP, Capítulo 2, Tema, Recursos Pesqueiros, Pesca Extractiva e Aqüicultura.
Scoones, I., M. Melnyk and J.N. Pretty. 1992. The hidden harvest. Wild foods and agricultural systems: a literature review and annotated bibliography. International Institute for Environment and Development (IIED), London.
SIAMAZONIA. 2002. Estadisticas sobre la Amazonia Peruana. w ww.siamazonia.org.pe (Accessed 3 April 2003).
Silva, P.C.M. 1986. Uma Política Nacional de Pesca. Edição do Sindicato da Industria de Construção Naval, Rio de Janeiro, Brazil.

�� Tropical river fisheries valuaTion: background papers To a global synThesis
Tejerina-Garro, F.L., R. Fortin and M.A. Rodriguez. 1998. Fish community structure in relat ion to environmental variation in flood lakes of the Araguaia river, Amazon basin. Environmental Biology of Fishes 51(4):399-410.
Thorpe, A. and K. Robinson. 2003. US and EU differences over the labelling of food products derived from genetically modified organisms, agriculture and human values.
Turner, R.K. 1991. Environment, economics and ethics. In D. Pearce (ed.) Blueprint 2: greening the world economy. Earthscan, London.
Van Kooten, G.C. 1992. Economic effects of global warming on agriculture with some impact analyses for south-western Saskatchewan. In E.E. Wheaton, V. Wi t t rock and G .D.V. Wi l l i ams (eds . ) Saskatchewan in a warmer world: preparing for the future. Saskatchewan Research Council Publication No. E-2900-17-E-92.
Wallis, B.E. 1980. Market prospects for reptile leathers. International Trade Commission Report No: ITC/DIP/12. International Trade Commission, Geneva.
Welcomme, R. 1990. Status of fisheries in South American rivers. Interciencia 15(6):337-345.
Winpenny, J.T. 1991. Values for the environment: a guide to economic appraisal. Overseas Development Institute (ODI), London.
World Bank. 1989. Philippines: environment and natural resource management study. World Bank, Washington D.C.
World Bank. 2003. World Bank lending for large dams; a preliminary review of impacts. www.worldbank.org/OED. (Accessed 10 April 2003).
World Commission on Dams (WCD). 2000. Dams and development: a new framework for decision-making. WCD, Cape Town.
Worldpaper.com. 1999. Fishing in murky waters. May 1999. www.worldpaper.com/archivewp/1999/may99/castilho.html. (Accessed 3 April 2003).
Additional web-sources consulted
www.acuteangling.com Freshwater Dorado – the Iberá marsh (Accessed 3 March 2003).www.ecopath.org Welcome to Ecopath with Ecosim.www.gci.ch/greencrossprograms/waterres/water/pilcomayo.htmwww.gochile.cl Pumalin Park (Accessed 3 April 2003).www.ibama.gov Brazilian Environmental and Renewable Natural Resources Institute www.jeep-ika.com.ar Argentina Fishing (Accessed 3 March 2003).www.panda.org Threats and promise: a new reserve in Peru’s Amazon. w ww.panda.org/about_wwf/where_we_work/latin_america_and_caribbean/where/peru/JTHF_profile2a.cfm (Accessed
11 April 2003).www.rainforest-alliance.org About the Rainforest Alliance (Accessed 14 April 2003).www.unep-wcmc.org A global overview of wetland and marine protected areas on the World Heritage List (Accessed
23 April 2003).www.unido.org Artisanal gold mining without mercury pollution (Accessed 11 April 2003).

chapTer 1 ��
APPENDIX 1: MAJOR RIVER BASINS AND THEIR TRIBUTARIES IN SOUTH AMERICA
River Basin Characteristics
AmazonBrazil
Amazon: Has up to 1,000 tributaries, including 7 more than 1,000 miles long
Total length: 6,516 km 7,180,000 km sq drainage Western-most reaches refered as the SolimõesNegro: Venezuela and BrazilTocatins: Brazil, flows into Para Length: 2,699 kmPara: Madeira: Confluence of Beni and Maumore rivers, forms
Bolivia-Brazil boundary Length: 3,238 km Purus: Length: 3,590 km
Nordeste BasinBrazil362 000 km sq drainage
Parnaiba Total length: 1,485 kmMearimDas BalsasPindare
Tocantins-AraguaiaBrazil
Tocantins (See Amazon Basin)AraguaiaDas mortes
ParaguayBrazil
Paraguay: Brazil-Paraguay, Argentina, flowing into Parana River
Total length: 2,549 km Parana: Confluence of Paranaiba and Grande, flowing into
Plate River Total length: 4,498 kmParana-Paraguay system flows through Brazil, Bolivia,
Paraguay, Argentina and Uruguay
Leste Brazil
Paraiba do Sul
Tiete-ParanaBrazil
GrandeParana (See Paraguay Basin)ParanapanemaIvaiParanaiba Tiete
Do SulBrazil
IbicuiCanal de Sao GoncaloJacuiLagoa MirimLagoa dos PatosTaquariUruguai
Rio de la Plata Brazil
Pilcomayo: Headwaters in Bolivian Andes, flowing into Paraguay River
Total length: 1,999 km Flows into Atlantic 4,700 km long 2,650,000 km sq drainage
Sao Francisco Brazil
Sao Francisco: Headwaters in southwest Minas Gerais, Brazil, flowing into Atlantic
Total Length: 3,198 km CorrenteGrande
�� Tropical river fisheries valuaTion: background papers To a global synThesis
Orinoco Brazil
Headwaters in Serra Parima Moutains, VZLA, flowing into the Atlantic
Total length: 2,062 km 1,086,000 km sq drainage
PilcomayoArgentinaBoliviaParaguay
Headwaters in BoliviaFlows into Atlantic in Argentina Total Length: 2,500 272,000 km sq drainage, 92% in Bolivia
Bio-Bio Chile
Headwaters on Chile/Argentina borderFlows into Pacific Total Length: 380 km 24,260 km sq drainage
ColoradoArgentina
Headwaters in Chilean/Argentinean Cordillera, flowing into Atlantic
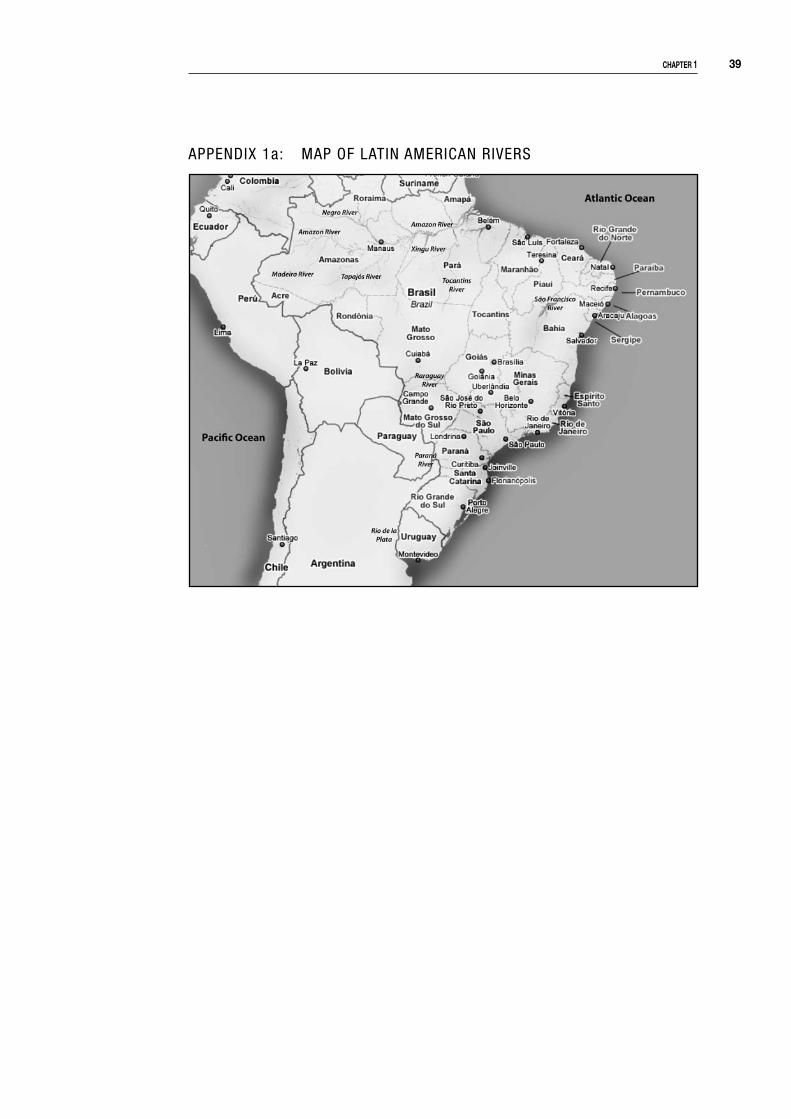
chapTer 1 ��
APPENDIX 1a: MAP OF LATIN AMERICAN RIVERS
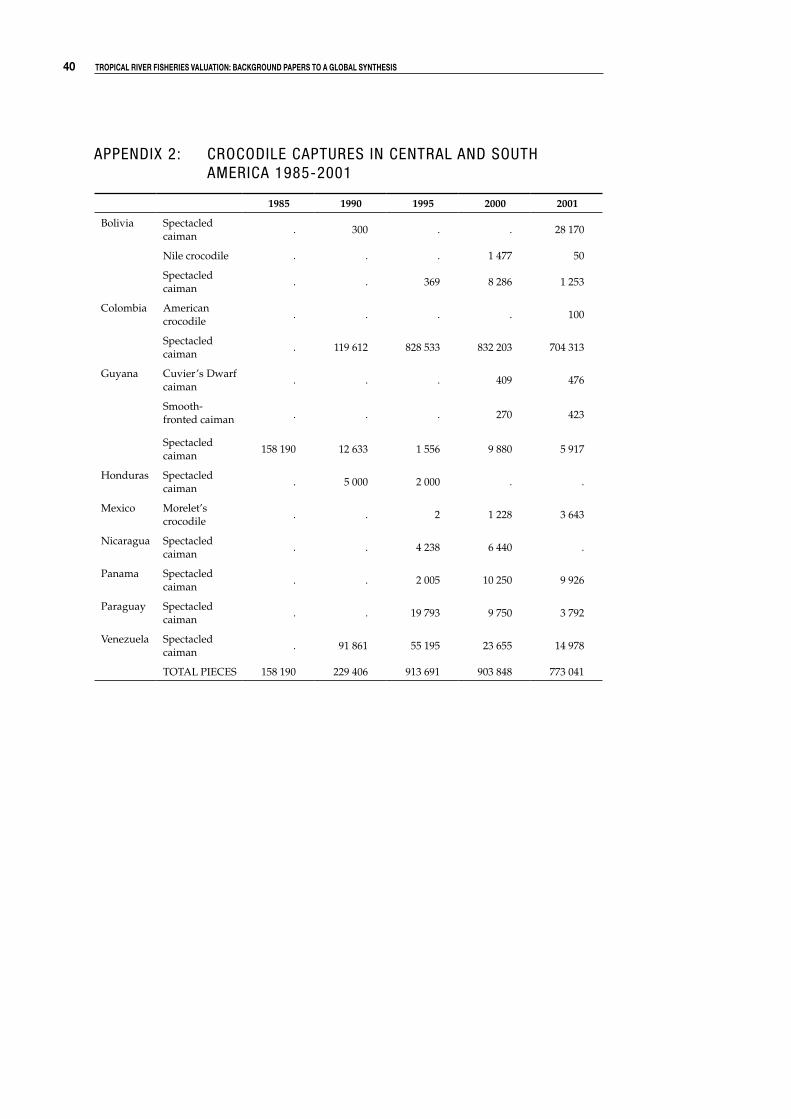
�0 Tropical river fisheries valuaTion: background papers To a global synThesis
APPENDIX 2: CROCODILE CAPTURES IN CENTRAL AND SOUTH AMERICA 1985-2001
1985 1990 1995 2000 2001
Bolivia Spectacled caiman
. 300 . . 28 170
Nile crocodile . . . 1 477 50
Spectacled caiman
. . 369 8 286 1 253
Colombia American crocodile
. . . . 100
Spectacled caiman
. 119 612 828 533 832 203 704 313
Guyana Cuvier’s Dwarf caiman
. . . 409 476
Smooth-fronted caiman . . . 270 423
Spectacled caiman
158 190 12 633 1 556 9 880 5 917
Honduras Spectacled caiman
. 5 000 2 000 . .
Mexico Morelet’s crocodile
. . 2 1 228 3 643
Nicaragua Spectacled caiman
. . 4 238 6 440 .
Panama Spectacled caiman
. . 2 005 10 250 9 926
Paraguay Spectacled caiman
. . 19 793 9 750 3 792
Venezuela Spectacled caiman
. 91 861 55 195 23 655 14 978
TOTAL PIECES 158 190 229 406 913 691 903 848 773 041
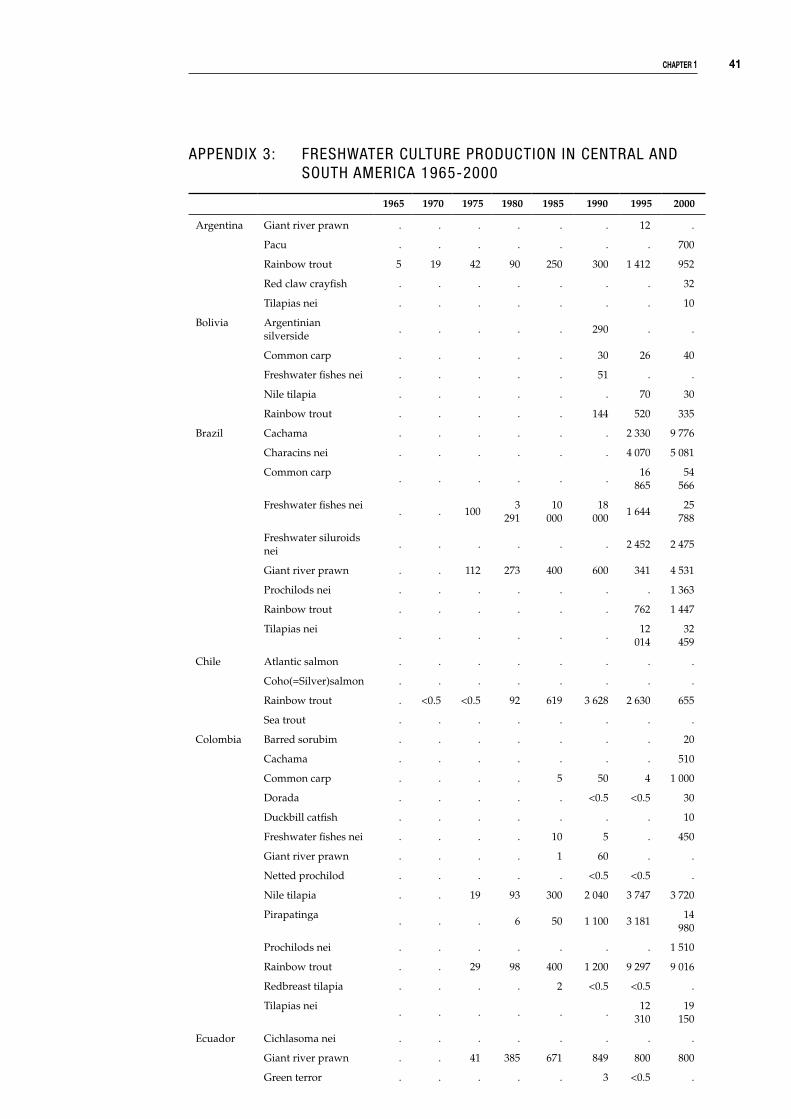
chapTer 1 �1
APPENDIX 3: FRESHWATER CULTURE PRODUCTION IN CENTRAL AND SOUTH AMERICA 1965-2000
1965 1970 1975 1980 1985 1990 1995 2000
Argentina Giant river prawn . . . . . . 12 .
Pacu . . . . . . . 700
Rainbow trout 5 19 42 90 250 300 1 412 952
Red claw crayfish . . . . . . . 32
Tilapias nei . . . . . . . 10
Bolivia Argentinian silverside
. . . . . 290 . .
Common carp . . . . . 30 26 40
Freshwater fishes nei . . . . . 51 . .
Nile tilapia . . . . . . 70 30
Rainbow trout . . . . . 144 520 335
Brazil Cachama . . . . . . 2 330 9 776
Characins nei . . . . . . 4 070 5 081
Common carp. . . . . .
16 865
54 566
Freshwater fishes nei. . 100
3 291
10 000
18 000
1 64425
788
Freshwater siluroids nei
. . . . . . 2 452 2 475
Giant river prawn . . 112 273 400 600 341 4 531
Prochilods nei . . . . . . . 1 363
Rainbow trout . . . . . . 762 1 447
Tilapias nei. . . . . .
12 014
32 459
Chile Atlantic salmon . . . . . . . .
Coho(=Silver)salmon . . . . . . . .
Rainbow trout . <0.5 <0.5 92 619 3 628 2 630 655
Sea trout . . . . . . . .
Colombia Barred sorubim . . . . . . . 20
Cachama . . . . . . . 510
Common carp . . . . 5 50 4 1 000
Dorada . . . . . <0.5 <0.5 30
Duckbill catfish . . . . . . . 10
Freshwater fishes nei . . . . 10 5 . 450
Giant river prawn . . . . 1 60 . .
Netted prochilod . . . . . <0.5 <0.5 .
Nile tilapia . . 19 93 300 2 040 3 747 3 720
Pirapatinga. . . 6 50 1 100 3 181
14 980
Prochilods nei . . . . . . . 1 510
Rainbow trout . . 29 98 400 1 200 9 297 9 016
Redbreast tilapia . . . . 2 <0.5 <0.5 .
Tilapias nei. . . . . .
12 310
19 150
Ecuador Cichlasoma nei . . . . . . . .
Giant river prawn . . 41 385 671 849 800 800
Green terror . . . . . 3 <0.5 .

�� Tropical river fisheries valuaTion: background papers To a global synThesis
1965 1970 1975 1980 1985 1990 1995 2000
Ichthyoelephas humeralis
. . . . . 1 . .
Nile tilapia . . . . . 18 . 9 201
Pacific fat sleeper . . . . . 25 . 43
Rainbow trout . . . . . 414 . 33
Red claw crayfish . . . . . . . 30
El Salvador Common carp . . . . . . 5 .
Freshwater fishes nei . . . . . . <0.5 <0.5
Giant river prawn . . . . . 4 10 9
Jaguar guapote . . . . . 1 <0.5 <0.5
Nile tilapia . . . . 15 3 196 56
French Guiana
Atipa . . . . . . . .
Common carp . . . . . . . .
Freshwater fishes nei . . . . . . . 6
Giant river prawn . . . . 15 83 . 25
Grass carp (=White amur)
. . . . . . . .
Guatemala Blackbelt cichlid . . . . . 6 140 30
Blue tilapia . . . . . . . 143
Channel catfish . . . . . . 3 8
Cichlasoma nei . . . . . . 1 11
Common carp . . . . <0.5 6 28 14
Freshwater crustaceans nei
. . . . . . . .
Freshwater fishes nei . . . . . . . 7
Freshwater molluscs nei
. . . . . . 7 10
Freshwater prawns, shrimps nei
. . . . . . 9 3
Giant river prawn . . . . 5 10 99 46
Jaguar guapote . . . . . 5 40 40
Mozambique tilapia . . . . . . . 104
Nile tilapia . . . . . . . 1 035
Red claw crayfish . . . . . . . 15
Tilapias nei . . . . 70 150 593 606
Guyana Atipa . . . . . <0.5 <0.5 <0.5
Giant river prawn . . . . . . . .
Mozambique tilapia . . . . . . . 1
Nile tilapia . . . . . . . 1
Tilapias nei . . . . . . . 1
Honduras Cachama . . . . . 3 20 .
Freshwater fishes nei . . . . 136 5 10 .
Giant river prawn . . . 7 18 <0.5 <0.5 <0.5
Nile tilapia . . . 6 35 120 172 927
Silver carp . . . . . 4 10 .
Nicaragua Blue tilapia . . . . 2 3 5 .
Common carp . . . . . 1 . .
Nile tilapia . . . . . . . 18
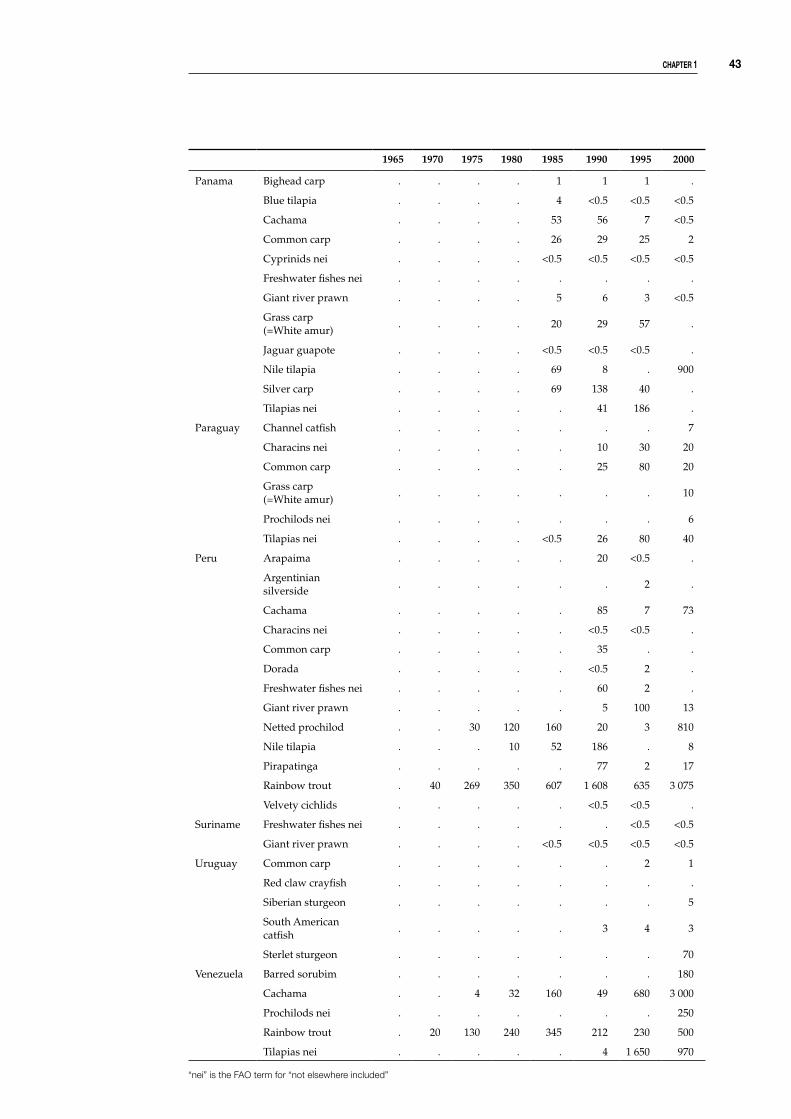
chapTer 1 ��
1965 1970 1975 1980 1985 1990 1995 2000
Panama Bighead carp . . . . 1 1 1 .
Blue tilapia . . . . 4 <0.5 <0.5 <0.5
Cachama . . . . 53 56 7 <0.5
Common carp . . . . 26 29 25 2
Cyprinids nei . . . . <0.5 <0.5 <0.5 <0.5
Freshwater fishes nei . . . . . . . .
Giant river prawn . . . . 5 6 3 <0.5
Grass carp (=White amur)
. . . . 20 29 57 .
Jaguar guapote . . . . <0.5 <0.5 <0.5 .
Nile tilapia . . . . 69 8 . 900
Silver carp . . . . 69 138 40 .
Tilapias nei . . . . . 41 186 .
Paraguay Channel catfish . . . . . . . 7
Characins nei . . . . . 10 30 20
Common carp . . . . . 25 80 20
Grass carp (=White amur)
. . . . . . . 10
Prochilods nei . . . . . . . 6
Tilapias nei . . . . <0.5 26 80 40
Peru Arapaima . . . . . 20 <0.5 .
Argentinian silverside
. . . . . . 2 .
Cachama . . . . . 85 7 73
Characins nei . . . . . <0.5 <0.5 .
Common carp . . . . . 35 . .
Dorada . . . . . <0.5 2 .
Freshwater fishes nei . . . . . 60 2 .
Giant river prawn . . . . . 5 100 13
Netted prochilod . . 30 120 160 20 3 810
Nile tilapia . . . 10 52 186 . 8
Pirapatinga . . . . . 77 2 17
Rainbow trout . 40 269 350 607 1 608 635 3 075
Velvety cichlids . . . . . <0.5 <0.5 .
Suriname Freshwater fishes nei . . . . . . <0.5 <0.5
Giant river prawn . . . . <0.5 <0.5 <0.5 <0.5
Uruguay Common carp . . . . . . 2 1
Red claw crayfish . . . . . . . .
Siberian sturgeon . . . . . . . 5
South American catfish
. . . . . 3 4 3
Sterlet sturgeon . . . . . . . 70
Venezuela Barred sorubim . . . . . . . 180
Cachama . . 4 32 160 49 680 3 000
Prochilods nei . . . . . . . 250
Rainbow trout . 20 130 240 345 212 230 500
Tilapias nei . . . . . 4 1 650 970
“nei” is the FAO term for “not elsewhere included”

�� Tropical river fisheries valuaTion: background papers To a global synThesis
APP
END
IX 4
: FR
ESH
WAT
ER C
APT
UR
E PR
OD
UC
TIO
N F
OR
CEN
TRA
L A
ND
SO
UTH
AM
ERIC
A 1
950-
2000
1950
1955
1960
1965
1970
1975
1980
1985
1990
1995
2000
Arg
enti
naC
hara
cins
nei
9 30
04
700
7 70
09
100
1 70
010
551
4 68
56
937
6 73
411
700
3 00
0
Fres
hwat
er fi
shes
nei
3 60
02
300
6 00
01
500
1 70
02
125
886
344
308
2 90
86
098
Fres
hwat
er s
iluro
ids
nei
800
900
1 00
02
300
2 00
02
369
2 75
62
284
3 08
92
500
3 50
0
Proc
hilo
ds
nei
..
..
..
..
..
17 7
00
Rai
nbow
trou
t.
..
..
..
150
150
3.
Bel
ize
Fres
hwat
er fi
shes
nei
..
..
<0.
525
251
1<
0.5
<0.
5
Bol
ivia
Com
mon
car
p.
..
..
..
..
..
Fres
hwat
er fi
shes
nei
500
600
700
1 60
01
000
1 00
04
129
3 72
02
987
4 72
64
911
Rai
nbow
trou
t.
..
200
100
5050
5023
611
634
5
Bra
zil
Cac
ham
a.
..
..
..
..
11 3
794
965
Cha
raci
ns n
ei12
600
16 8
0021
800
40 0
0038
500
80 7
2672
155
97 7
8795
400
81 4
3367
297
Cic
hlid
s ne
i1
200
1 60
02
100
2 80
04
200
8 35
97
784
11 2
3314
700
12 0
458
145
Cyp
rini
ds
nei
..
.<
0.5
<0.
510
6521
410
011
935
5
Fres
hwat
er c
rust
acea
ns n
ei50
01
000
1 80
070
01
100
2 38
5.
.9
<0.
5<
0.5
Fres
hwat
er fi
shes
nei
7 20
09
600
12 4
0022
200
5 60
020
473
33 6
5921
505
20 3
9740
372
49 5
93
Fres
hwat
er s
iluro
ids
nei
9 00
012
000
15 5
0025
500
35 4
0052
630
51 3
1450
165
42 8
0040
048
58 4
74
Rai
nbow
trou
t.
..
..
..
915
<0.
5<
0.5
Riv
er p
raw
ns n
ei10
020
040
02
800
8 40
06
719
9 85
49
751
6 60
01
412
2 43
7
Tila
pias
nei
..
..
100
2 02
59
442
9 87
511
100
6 23
47
893
Com
mon
car
p.
..
..
..
..
..
Chi
leFr
eshw
ater
pra
wns
, shr
imps
nei
..
..
..
.1
32.
.
Col
ombi
aC
hara
cins
nei
9 50
011
000
7 00
017
700
18 2
0026
158
28 6
3024
978
19 5
075
698
6 60
0
Fres
hwat
er fi
shes
nei
1 00
01
500
3 00
04
900
7 60
08
751
10 4
7316
300
10 2
029
108
7 80
0

chapTer 1 ��
1950
1955
1960
1965
1970
1975
1980
1985
1990
1995
2000
Fres
hwat
er s
iluro
ids
nei
4 00
04
500
1 40
03
300
7 40
07
118
7 60
36
430
4 23
18
718
10 4
54
Gia
nt r
iver
pra
wn
..
..
..
..
..
.
Cos
ta R
ica
Fres
hwat
er fi
shes
nei
<0.
5<
0.5
<0.
5<
0.5
<0.
548
323
300
300
900
1 00
0
Ecu
ador
Fres
hwat
er fi
shes
nei
<0.
5<
0.5
<0.
5<
0.5
<0.
5<
0.5
206
867
600
300
400
El S
alva
dor
Cat
fishe
s ne
i.
..
..
..
..
250
142
Fres
hwat
er c
rust
acea
ns n
ei.
..
..
..
<0.
54
59
Fres
hwat
er fi
shes
nei
800
900
1 40
01
600
800
869
1 81
81
232
865
967
1 17
7
Fres
hwat
er m
ollu
scs
nei
..
..
..
..
..
8
Jagu
ar g
uapo
te.
..
..
..
..
608
324
Nile
tila
pia
..
..
..
.1
559
2 77
22
494
1 17
1
Fren
ch G
uian
aFr
eshw
ater
fish
es n
ei<
0.5
<0.
5<
0.5
<0.
5<
0.5
<0.
5<
0.5
<0.
5<
0.5
<0.
5<
0.5
Gua
tem
ala
Cic
hlid
s ne
i.
..
..
..
..
519
2
Fres
hwat
er fi
shes
nei
<0.
510
020
020
040
055
040
047
2 59
94
020
7 10
9
Guy
ana
Fres
hwat
er fi
shes
nei
<0.
5<
0.5
<0.
5<
0.5
<0.
5<
0.5
681
800
800
700
800
Hon
dur
asFr
eshw
ater
fish
es n
ei.
..
<0.
510
017
041
.45
127
61
Gia
nt r
iver
pra
wn
..
..
..
3532
..
.
Nic
arag
uaFr
eshw
ater
fish
es n
ei10
020
060
01
100
1 30
035
979
8415
053
839
6
Riv
er p
raw
ns n
ei.
..
..
..
..
.<
0.5
Tila
pias
nei
..
..
..
..
..
680
Pana
ma
Peac
ock
cich
lid.
..
..
..
.15
120
4
Tila
pias
nei
<0.
5<
0.5
<0.
5<
0.5
..
.50
.10
16
Para
guay
Cha
raci
ns n
ei.
..
..
..
2 00
03
990
7 70
09
000
Fres
hwat
er fi
shes
nei
400
500
600
700
1 80
02
800
3 30
02
500
2 50
03
800
4 00
0
Fres
hwat
er s
iluro
ids
nei
..
..
..
.3
000
6 00
09
500
12 0
00

�� Tropical river fisheries valuaTion: background papers To a global synThesis
1950
1955
1960
1965
1970
1975
1980
1985
1990
1995
2000
Peru
Ara
paim
a.
..
..
..
..
420
273
Cac
ham
a.
..
..
..
..
.96
3
Fres
hwat
er fi
shes
nei
<0.
51
000
1 00
03
000
2 00
06
671
12 5
3827
791
28 3
2144
452
19 3
87
Net
ted
pro
chilo
d.
..
..
..
..
5 08
810
942
Pira
pati
nga
..
..
..
..
..
324
Rai
nbow
trou
t.
..
..
..
..
509
220
Vel
vety
cic
hlid
s.
..
..
..
..
320
188
Suri
nam
eFr
eshw
ater
fish
es n
ei.
300
300
500
300
295
7122
835
014
020
0
Uru
guay
Cha
raci
ns n
ei.
..
.<
0.5
163
238
576
128
763
1 69
0
Fres
hwat
er fi
shes
nei
<0.
5<
0.5
<0.
5<
0.5
.12
1443
3245
312
Fres
hwat
er s
iluro
ids
nei
..
..
.70
6041
5836
293
Ven
ezue
laC
hara
cins
nei
9 00
05
200
5 00
02
200
1 30
02
668
5 05
94
388
3 67
28
778
5 77
3
Com
mon
car
p.
..
..
..
.20
544
1 39
0
Fres
hwat
er fi
shes
nei
..
..
<0.
549
15
452
6 80
41
297
4 52
445
0
Fres
hwat
er s
iluro
ids
nei
2 00
02
100
2 90
06
300
2 50
04
498
5 42
24
978
9 19
419
497
6 22
6
Proc
hilo
ds
nei
..
..
..
..
4 36
420
430
9 61
3
Rai
nbow
trou
t.
..
..
..
..
57.

47
Arthur Neiland (1) and Christophe Béné (2)
(1) IDDRA (Institute for Sustainable Developmentand Aquatic Resources)Portsmouth TechnopoleKingston CrescentPortsmouth PO2 8FAHampshireUnited KingdomTel: +44 2392 658232E-mail: [email protected]
(2) The WorldFish Center, Regional Office for Africa and West Asia3 Abu El Feda Street, 6th floor, Zamalek Cairo, EgyptE-mail: [email protected]
Review of River Fisheries Valuation in West and Central Africa
C H A P T E R 2

�� Tropical river fisheries valuaTion: background papers To a global synThesis
Contents - Chapter 2
Abstract 491. Introduction 502. Methodology 51 2.1 Geographical Focus 51 2.2 Economic Valuation Study Approaches in Fisheries 52
2.2.1 Conventional Economic Valuation 522.2.2 Economic Impact Analysis (EcIA) 542.2.3 Socioeconomic Analysis 542.2.4 Livelihood Analysis 54
2.3 Information Sources, Collation and Synthesis 56
3. TheEconomicValueofRiverFisheriesinWestandCentralAfrica 57 3.1 Overview 57 3.2 Conventional Economic Valuation 57 3.3 Economic Impact Analysis 60 3.4 Socioeconomic and Livelihood Analysis Information 62
3.4.1 The Experience of the Traditional Management of Artisanal Fisheries Project (TMAF) 623.4.2 Lake Chad Basin Fishery Project 633.4.3 The Sustainable Fisheries Livelihood Program 64
4. EconomicImpactonFisheriesofChangesinRiverBasinManagement 65 4.1 Conventional Economic Valuation (CEV) 65
4.1.1 Economic valuation of the wetlands benefits: The Hadejia-Jam’are Floodplain, Nigeria; and the impact of the Kano River Project (Barbier et al. 1991; 1993) 65
4.1.2 Economic Impact of Changes in River Basin Management on Fisheries in NE Nigeria 66
4.2 Economic Impact Assessment (EcIA) 694.2.1. The Maga Reservoir and the Yaere Floodplain (Cameroon) 694.2.2. The Niger River Mali 70
4.3 Socioeconomic and Livelihood Analysis (SE-LA) 70
5. AssessmentofValuationMethodologies 70
6. ConclusionsandRecommendations 72
References 73
Appendix 1: Major River Basins of West and Central Africa 76Appendix 2: Potential Economic Value of Western and Central African Basins 80Appendix 3: Country Fisheries Profiles 82
chapTer � ��
AbSTRACT
This paper provides a review of the valuation of river fisheries in West and Central Africa. It
is the general perception that, compared to the biological and ecological aspects of river
fisheries, this particular subject area has received relatively little attention. Economic valuation
is concerned with finding expression for what is important in life for human society. It should,
therefore, be a central and integral part of government decision-making and policy. The review
started with concepts and methods for valuation. Three main types of valuation techniques
were identified: conventional economic valuations, economic impact assessments and
socioeconomic investigations, and livelihood analysis. On the basis of a literature review,
valuation information was then synthesized for the major regional river basins and large lakes,
and also used to develop a series of national fisheries profiles. To supplement this broad
perspective, a series of case studies are also presented, which focus in particular on the
impact of changes in water management regime. Finally, the paper presents an assessment of
the three main types of valuation methodology and a set of conclusions and recommendations
for future valuation studies.
keywords:
River fisheries review; Valuation; Economic valuation; West Africa; Central Africa; Future
research

�0 Tropical river fisheries valuaTion: background papers To a global synThesis
�. INTRODUCTION
The role of inland fisheries in providing a wide range of economic and social benefits for developing countries throughout the world is increasingly recognized by governments and international development agencies. In particular, river and floodplain fisheries have been observed to underpin the livelihoods of many millions of people in major river basins such as the Amazon, Congo, Ganges, Mekong, Niger and others.
However, it is also widely acknowledged that, apart from fisheries, there is increasing demand on the use of inland water resources for a wide range of other activities including hydroelectric power, irrigation, navigation and industrial uses. The problems for fisheries management, which this multi-sectoral context creates, are often very serious and difficult to resolve. The UN FAO Technical Guidelines for Responsible Fisheries (Inland Fisheries) (1997; p.3) provides some guidance for the development of an appropriate response, stating that,
”Management should be conducted in a climate of compromise with other users and depends as much on regulations governing their activities as those governing the fishery itself. in other words, inland fishery managers are rarely in contro l of the resource they manage. because of this the code (code of conduct for responsible fisheries) must be interpreted to inform and involve sectors other than fisheries.”
The development of policies for the world’s
river basins requires decisions to be taken
concerning the alternative usage of water
resources. For example, should a river system
and associated floodplains be conserved for
wildlife and tourism uses, or should they be
managed and drained for industrial and urban
uses? Under ideal circumstances, these types
of decisions should be based on a sound
methodological approach that incorporates
the views and desires of all stakeholders
involved, and should also be underpinned
by a wide range of information (hydrological,
biological, ecological, economic, social and
institutional dimensions).
Unfortunately, in most developing countries,
the circumstances for decision-making are
far from the ideal described above. The basis
for sound decision-making is constrained by
a range of factors, particularly the nature of
weak state and weak governance (that limits
stakeholder participation and cooperation)
and limited institutional capacity (that limits
information flows).
In the following review, we will examine one
important dimension of the information base
required for effective decision-making in
inland fisheries – economic value. It is the
general perception that this particular subject
area has received relatively little attention,
compared with the biological and ecological
aspects of river fisheries. A review of the status
of knowledge is an important starting point to
address this deficiency. The paper will focus
exclusively on West and Central Africa, with
the primary objective of producing a review of
river fisheries valuation in the region.
The paper is arranged into six sections starting
with this Introduction. Section 2 provides a
description of the methodology used for the
review. Section 3 identifies and examines
the economic value of river fisheries in West
and Central Africa. Section 4 identifies and
describes the economic impact on fisheries
of changes in river basin management.
Section 5 provides an assessment of the
methodologies used for economic valuation in
West and Central Africa. Section 6 presents a
series of conclusions and recommendations
for future valuation studies.

chapTer � �1
2. METHODOLOGY
�.1 geographical focus
For the purposes of this review, West and
Central Africa is assumed to include the entire
Sub-Saharan region stretching from Senegal
in the West to Congo and Gabon in the East.
This region covers seven major river basins
(Figure 1), namely:
1. Senegal-Gambia river basin
2. Volta river basin
3. Niger-Benue river basin
4. Lake Chad basin
5. Congo-Zaire river basin
6. Atlantic coastal basin (I)
7. Atlantic coastal basin (II)
figure 1: The major river basins in africa (The numbers indicate the seven basins included in this review)
�� Tropical river fisheries valuaTion: background papers To a global synThesis
�.� economic valuation study approaches in fisheries
It is important to recognize that economic
valuation in fisheries can be approached in a
number of different and yet complementary
ways.
In general terms, values can be defined as
“beliefs, either individual or social, about
what is important in life and thus about the
ends or objectives which should govern or
shape public policies” (Royal Commission on
Environmental Pollution 1998).
Economic valuation tends to have a particular
meaning to economists, as explained below,
but it is appropriate to consider how this
also relates to other approaches. Three
broad categories of economic valuation
study approaches can be identified as
follows: (1) Conventional Economic Valuation,
(2) Economic Impact Analysis, and (3)
Socioeconomic Analysis.
�.�.1 conventional economic valuation
In economics, the conventional approach
to environmental valuation is to look for
some way of measuring human preferences
for or against changes in the state of the
environment (improvement or deterioration).
Where such preferences are expressed as
willingness to pay (for example, to raise water
quality on a certain stretch of river), value
will be expressed in monetary terms. This
can then provide a rational basis for policy
decision-making over the use or management
of environmental assets.
2.2.1.1 Economicvaluesassocial
values.
It can also be argued that economic values
are social values, because the concept of
value is anthropocentric: it is the people who
value the environment, and, accordingly, the
estimated value resides in the individuals
themselves rather than in the objects of their
assessment. The arithmetic of conventional
economic valuation is underpinned by
economic efficiency analysis (EEA, which has
the maximization of social welfare (defined in
terms of the optimal allocation of resources)
as its goal. There are two ways in which EEA is
commonly applied, that is cost-effectiveness
analysis and cost benefit analysis. With cost-
effectiveness analysis, there is a presumption
in favor of the least-cost option for achieving
a given objective; with cost-benefit analysis,
the presumption is in favor of the option
which produces the highest ratio of monetary
benefits to costs. In short, there is an implicit
value judgment underlying efficiency analysis
(i.e., that improvements in economic efficiency
are desirable). In a policy-planning context,
this presumption in favor of efficiency is the
basis of a number of decision criteria that
can be used to select and prioritize project
options (or other interventions) in terms of
their economic value to society (Whitmarsh
and Premachandra pers. comm., Oct. 2003).
2.2.1.2 Totaleconomicvalue
It is nowadays recognized that a natural
resource may provide a range of benefits
according to the particular use or function
it fulfills, and this forms the basis of the
concept of total economic value (TEV).
The components of TEV in respect of an
aquatic resource, such as a river system
and its adjacent floodplains, are shown in
Figure 2. The obvious and tangible benefits
would be those derived from direct use of
the resource, and these may materialize in
the form of commodities (e.g., fish, aquatic
plants, fuel wood) or services (e.g., recreation
and amenity). The aquatic resource may also
have additional indirect benefits, such as
providing coastal protection and serving as
habitat for juvenile fish. Individuals may also

chapTer � ��
derive a benefit from being able to postpone
their personal use of the resource to a later
date; they attach an option value to using the
resource. There is also another distinct type
of benefit, called non-use value or passive
value. This might include the value associated
with the desire to maintain a river fishery
intact for future descendents (bequest value)
or simply the satisfaction from knowing that a
particular aquatic habitat has been preserved
in perpetuity (existence value).
2.2.1.3 Valuationinpractice
Valuation is always a comparative exercise,
and it is appropriate to consider how such
comparisons might be undertaken. At its
crudest, this might involve comparing the
economic benefits provided by a natural
resource in its current state with the absence
of benefits if the resource were to be removed
or completely destroyed. However, in reality,
policy decisions tend to involve incremental
(or marginal) changes from current conditions.
For example, in the case of fisheries policy,
we might wish to know how economic benefit
might change if harvesting activity on a certain
river were regulated using a different set of
management measures; the comparison
would thus be between the existing policy
(i.e., the base case) and proposed regime.
Within the framework of cost-benefit analysis,
the comparative estimates of economic value
could then be used to decide whether the
proposed policy change was worthwhile or
whether it would be preferable to keep the
status quo. Another way in which economic
values may be compared is over time,
an exercise that may prove necessary in
situations where, in particular, there is concern
about environmental degradation and the
aim is to measure the social cost of this
change. An especially important application
of this type of retrospective comparison is
natural resource damage assessment, an
ex-post form of cost-benefit analysis used to
assess the social cost of particular incidents
(e.g., oil spills) or interventions (e.g., major
infrastructure projects).
2.2.1.4 Valuationtechniques
There are two broad classes of valuation
techniques, direct and indirect. Direct
techniques involve descriptions of situations to
individuals and assessment of their valuations
through direct questions. Contingent valuation
method (CVM) and stated preference are
examples of direct techniques. CVM has the
advantage of being able to measure use and
non-use (passive) values. Stated preference
analysis, or the experimental analysis of
choice, has its roots in conjoint analysis (CA).
CA is a form of analysis used to represent
individual judgments of multi-attribute stimuli.
Indirect techniques (also known as revealed
figure �: The components of Tev in respect of an aquatic resource
AQUATIC RESOURCE
Use Value
e.g. Harvesting
opportunitieson a lateroccasion
Indirect Use Value
Direct UseValue
OptionValue
e.g.Ecological
supportfunction of inundated
forest for fisheries
e.g.Harvesting of fish, aquatic resource and
timber
Non-Use Value
e.g. Knowledgeof continued
existence of the aquatic resource
ExistenceValue
BequestValue
e.g.Harvesting
opportunitiesby future
generations
�� Tropical river fisheries valuaTion: background papers To a global synThesis
preference techniques) use information on
actual behavior to build economic models
of choice. These models are then used to
determine the value of environmental change.
Indirect techniques are based on traditional
economic theory, which provides several
decades of experience in empirical modeling.
Examples of revealed preference techniques
include travel cost models and hedonic price
models.
�.�.� economic impact analysis (ecia)
In contrast to the EEA described above,
economic impact analysis (EcIA) does not set
out to determine whether a particular policy
intervention or project is either beneficial or
detrimental in terms of economic worth to
society. While EcIA will consider the level of
benefits generated by an intervention, it does
not consider costs of implementation (i.e.,
there is no benefit-cost framework). Instead,
EcIA aims to establish what effect a particular
policy intervention or project has on specific
variables. This might involve using revenue
analysis to see whether a new fisheries
management system is likely to raise fishers’
gross earnings or revenue. The analysis would
typically require the estimation of a demand
function for the harvested product in order to
determine the impact of changes in supply on
market price (and hence total sales revenue).
More ambitiously, EcIA might involve the
application of multiplier analysis to measure
the total economic activity generated by a new
fisheries management system (e.g., on output,
income or employment) as a consequence
of the interdependence between fishing
and other sectors comprising the regional
economy. The total economic impact will be
made up of direct and secondary (i.e., indirect
and induced) effects.
�.�.� socioeconomic analysis
Finally, it is important to reiterate the point
made above that conventional economic
valuation is concerned with the analysis of
whether a particular intervention or project
improves the net wealth of society. It might
be the case that this outcome also involves
the creation of winners and losers in society.
For example, the building of a dam across a
river for hydroelectric power involves a wide
diversity of effects including major changes
in environmental quality and aquatic resource
use. Conventional cost-benefit analysis
sidesteps the issue by invoking the principle
of potential compensation (i.e., that the
intervention represents a net gain to society if
the winners could compensate the losers and
still be better off), but because this principle
does not insist that compensation actually be
paid, it starts to become rather unsatisfactory
where the losers also happen to be the
poorest of the society/community.
In summary, the arithmetic of economic
valuation may well adjudge a project such as
dam construction to be worth undertaking
insofar as it improves the net wealth of society,
but it is unclear whether the social impact of
the project is unlikely to be neutral. In such
situations (especially where there is poor
governance within the weak state context),
something more than economic valuation is
warranted, specifically a distributional analysis
to examine how the net costs and benefits are
apportioned across different groups affected
by the change. Socioeconomic analyses that
uses participatory rural appraisal techniques
(PRA) such as group discussions and wealth-
ranking can often provide an important
starting point in identifying and characterizing
the socioeconomic strata in a community
or region. Once the social strata are known,
further in-depth economic studies (e.g.,
income-expenditure surveys) can provide
a better understanding of benefit flows (or
the lack of them) in relation to specific policy
interventions.
�.�.� livelihood analysis
In recent years, socioeconomic analysis has
been further extended with the development
of techniques for livelihood analysis (LA).
chapTer � ��
When underpinned by frameworks such
as the sustainable livelihoods approach
(SLA) (After Scoones 1995), they can help
to provide a better understanding of the
relationship between human society and
natural resources. In this respect, LA can be
used to complement economic valuation and
socioeconomic analysis.
But why do we need to employ an additional
set of LA techniques? Well, it can be argued
that the objective of the economic valuation of
the natural environment is to attach economic
values to environmental resources or natural
assets, and that by definition these economic
valuations represent resource-centered
approaches. It can also be argued that
adequate policies and effective management
of natural resources require information
about the people involved, and the ways
in which people use natural resources
to sustain livelihoods. In other words, to
make an appropriate decision regarding
the management of a natural resource, one
not only needs the economic value (albeit
through the most comprehensive evaluation
framework possible, such as the TEV), one
also needs to know the contribution that this
resource makes to livelihoods: Who uses the
resources? When? How?
More fundamentally, economic valuation
techniques do not permit the identification of
the factors that influence or affect people’s
access to these resources. However, very
often the key issue is not the availability of the
resource (or symmetrically its scarcity to which
its economic or even social value is related)
but the access to this resource. In extending
Sen’s main conclusion initially framed in the
specific context of famine (Sen 1981) to the
wider domain of natural resources, it should
be recalled that poor people are usually
those who lack access to these resources.
In this context, determining the value of the
resource is irrelevant if people cannot access
it. Therefore, a key question is: what are the
factors that influence people’s access to, and
control over, natural resources?
The Sustainable Livelihoods Approach (SLA)
is a holistic and people-centred approach
that attempts to capture and provide a
means of understanding people’s livelihoods,
and in particular the factors and processes
that affect these livelihoods. The framework
(Figure 3) consists of five components: (1) the
vulnerability context of the environment in
which the communities under consideration
operate; (2) the livelihood assets of these
communities; (3) the policies, institutions
and processes (PIPs) which affect their lives
and in particular their access to livelihood
assets; (4) the livelihood strategies which the
communities adopt; and (5) the outcomes
they achieve or aspire to. An important aspect
of the SLA is its use in helping to understand
the role of institutions (e.g., rules that affect
resource access).
figure �: The sustainable livelihood approach sla framework
Policies, Institutions and
Processes
livelihood asseTs
• More income• Increased well-being• Reduced vulnerability• Improved food
security• More sustainable use
of natural resource base
STRUCTURES• Level of government• Private Sector
• Laws• Policies• Culture
• InstitutionsPROCESSES
VulnerabilityContext
• Shocks• Trends• Seasonality
LivelihoodOutcomesin o
rder to achieve
livelihoodsTraTegies
H
S N
P F
influence& access
Legend: H: human; N: natural; F: financial P: physical; S: social
�� Tropical river fisheries valuaTion: background papers To a global synThesis
When combined with more conventional
economic and socioeconomic techniques
(e.g., economic valuation and household
income-expenditure surveys), LA is a powerful
tool that can provide the following benefits:
- an analysis of the causes of vulnerability
– shocks and stresses in the economic,
social and political context, trends,
seasonality, fragility of natural resources,
etc. – which affect the communities;
- an assessment of the assets, at the
individual, household or community levels,
comprising human, social, economic,
physical and natural resource assets;
- a description of the context within which
livelihoods evolve – policies at both
micro- and macro-levels; civil, economic
and cultural institutions, both formal and
informal; the nature of governance and its
processes at all levels in society;
- an identification of people’s livelihood
strategies, including, but not restricted to,
consumption, production and exchange
activities; and
- an evaluation of the resulting livelihood
outcome, assessed multi-dimensionally
in terms of food and other basic needs –
security, greater sustainability of the natural
resource base, reduced vulnerability and
increased income.
The value of such a framework is to encourage
analysts to take a broader and systematic
view of the factors that affect people’s
livelihoods – whether these are shocks and
adverse trends, poorly functioning institutions
and policies, or a lack of assets – and to
investigate the relations between them. It does
not take a sectoral view, but tries to recognize
the contribution made by all the sectors to
building up the stocks of assets upon which
people draw to sustain their livelihoods.
�.� information sources, collation and synthesis
In order to establish an appropriate basis for
the Review of River Fisheries Valuation in West
and Central Africa, an extensive literature
search was undertaken, mainly through on-
line searches of the international literature and
information databases. Other gray literature
was provided by current regional programs
(e.g., DFID/FAO Sustainable Fisheries Liveli-
hoods Programme [SFLP]) or in the case of
past regional programs or projects, literature
was accessed through various libraries and
collections (e.g., CEMARE Library, University
of Portsmouth).
The review process consisted of four steps:
Step 1: the literature search aimed to
undertake an inventory of all the valuation
studies that had been undertaken in West
Africa in recent times (since 1980). Initially, the
outputs were collated according to the three
broad methodological approaches:
- Conventional economic valuations (CEV)
- Economic Impact Assessments (EcIA)
- Socioeconomic investigations and liveli-
hood analysis (SE-LA)
Step 2: the resultant information was also
synthesized (Appendix 1 and Appendix 2)
according to the seven major regional river
basins and the three largest lakes/reservoirs
(Lake Volta, Lake Chad, and Lake Kainji) to
highlight the following characteristics:
- Identification of all riparian countries
- Identification of major rivers and flood-
plains
- Length of river and floodplain area
- Number of fishers by river/floodplain
chapTer � ��
- Total annual catch by river/floodplain/river
basin
- Identification of economic impact or value
of fisheries
Step 3: a number of important and well-
studied case studies of economic valuation
in West and Central Africa were identified
(including the Chad Basin, the Hadejia-Nguru-
Gashua Wetlands and the Central Delta of the
River Niger in Mali). The important elements
that were highlighted for each included:
- Key methodologies employed and resul-
tant values
- Impact of changes in water management
regime (where available)
- Contribution to understanding the role of
fisheries in livelihoods
Step 4: Finally, a series of National Fisheries
Profiles for countries in West/Central Africa
were developed, based on the following
criteria for inclusion: (a) the share of inland
fisheries production is >10 per cent of the
total domestic catch and (b) the potential
annual catch is estimated in the literature to
be >5000 tonnes (Appendix 3).
3. THE ECONOMIC VALUE OF RIVER FISHERIES IN WEST AND CENTRAL AFRICA
�.1. overview
The results of the literature review have
confirmed that information and statistics
on the economic value of river fisheries in
West and Central Africa are very sparse and
limited, compared to information on other
subjects (e.g., fisheries biology and ecology).
This will not come as a major revelation for
most fisheries administrators and scientists
connected with African inland fisheries. It
is well known that the majority of countries
concerned do not have effective statistical
collection or reporting systems, mainly due
to a lack of institutional capacity. While most
countries provide an annual estimation of
fisheries production to the UN FAO Statistical
System, economic data on fisheries are not
regularly reported. Despite all of this, however,
it may come as a surprise to many that
there is sufficient contemporary information
and data to say something interesting and
significant about the value of river fisheries in
the region. Furthermore, the limited amount of
economic valuation work that has so far been
carried out successfully points the way to
the potential for more work of this kind in the
future. Using the three broad methodological
approaches (above), the following results can
be reported.
�.�. conventional economic valuation
There have been very few studies of West and
Central African fisheries that have attempted
to apply a conventional economic valuation
approach. Only two sets of studies appear in
the formal literature. These are summarized
below.
(a) Economic valuation of the wetland
benefits: The Hadejia-Jam’are Floodplain,
Nigeria (Barbier et al. 1991; 1993)
This study assessed the economic
importance of the Hadejia-Jam’are
wetlands, and thus the opportunity cost
to Nigeria of its loss, by estimating some
of the key economic benefits it provides
to local populations (over 2 million people)
through crop production, fuel wood
and fishing. However, the wetlands are
threatened by drought and upstream
water developments that are taking place
without consideration of their impacts
downstream.

�� Tropical river fisheries valuaTion: background papers To a global synThesis
Based on a series of field surveys, the
net benefits from the direct use of the
floodplain for agriculture, fuel wood and
fishing were calculated by Barbier and his
co-authors, as shown in Table 1. Where
appropriate, actual prices were adjusted
to economic values using shadow prices.
The terms “financial” and “economic” were
used to express the values of commodities
based on actual or market prices, and the
values of commodities based on adjusted
or shadow prices, respectively.
Fishing was shown to yield the annual net
economic benefits of N18 million (US$ 9
million) or N179 (US$ 90) per hectare in the
Hadejia-Jam’are wetlands. This exceeded
the economic contribution from fuelwood,
but was less than the contribution from
agriculture.
The analysis of the Hadejia-Jam’are
wetlands was then extended using a
cost-benefit analysis of the net economic
benefits over time from agriculture, fishing
and fuel wood. The analysis assumed that
the benefits provided by the floodplain
do not arise just in a single year but
that the wetlands, if properly managed,
are capable of yielding a continuous
stream of such benefits over a number of
years. The sum of the stream of benefits
discounted into present values indicated
the present value of the wetlands in terms
of agriculture, fishing and fuel wood (Table
2). This represented the present worth of
the wetlands and was the benchmark for
comparing the returns to development
projects that might have threatened the
floodplain system. The results of this
analysis will be examined in Section 4
when we examine the economic impact
of changes in river basin management.
(b) Fishing Income, Poverty and Fisheries
Management in N.E. Nigeria (Neiland et
al. 1998)
As part of a DFID-funded research project
“Traditional Management of Artisanal
Fisheries in N.E. Nigeria”, Neiland et al.
(1998) undertook an investigation of the
profitability of fishing operations in three
major fisheries: the Upper River Benue, the
western shores of the Lake Chad, and the
Nguru-Gashua Wetlands. The objective
was to evaluate whether the fisheries were
generating net economic benefits, or, in
other words, to see whether the resource
exploitation and management systems
were achieving a positive level of economic
efficiency. It was assumed that economic
efficiency and wealth generation from the
fisheries were desirable from a societal
point of view, and that this could have a
positive effect on fisheries incomes and
poverty alleviation (assuming that fishing
communities could access the benefits).
Clearly, if the fisheries were efficient and
generating net economic benefits, society
would probably chose to maintain their
operation as a valuable contribution to
the economy. If not, then steps would
Table 1: hadejia-Jam’are Wetlands, nigeria: summary of annual net economic benefits/ha 1���-�0 (barbier et al. 1��1)
SectorTotal output
(tonnes)Net economic
benefits (N’000)Total area exploited
(ha)Net economic
benefits/ha (N/ha)
Agriculture 281 955 54 970 230 000 239
Fishing 6 264 17 877 100 000 179
Fuelwood 115 100 8 265 400 000 21
Total . 81 112 . 439

chapTer � ��
Table �: hadejia-Jam’are Wetlands: present value of net economic benefits (i) per hectare, (ii) per river inflow, (iii) per controlled water release
(i) Present value of net economic benefits per hectare (N/ha) a/
Base case (8%, 50 years) (8%, 30 years) (12%, 50 years) (12%, 30 years)
Agriculture 921 848 625 607
Fishing 300 276 203 197
Fuelwood 139 127 94 91
Total 1 359 1 251 923 895
Adjusted agriculture b/ 838 773 574 558
Adjusted total 1 276 1 176 872 846
Notes: a/ economic benefits averaged over the total production area of 730,000 ha (400,000 ha for fuel wood, 230,000 ha for cropland and 100,000 ha for fishing); b/ NPV of agriculture adjusted for unsustainability of wheat production, with approx. 56% of wheat hectarage assumed unsustainable
(ii) Present value of net economic benefits per river inflow (N/’000 m3) c/
Agriculture 264 243 179 174
Fishing 86 79 58 57
Fuelwood 40 37 27 26
Total 389 358 264 256
Adjusted agriculture d/ 240 221 164 160
Adjusted total 366 337 250 242
Notes: c/ based on the average annual river flow into Hadejia-Jam’are floodplain of 2,549 m3 over 1985-87; d/ NPV of agriculture adjusted for unsustainability of wheat production, with approx. 56% of current wheat hectarage assumed unsustainable
(iii) Present value of net economic benefits per controlled water release (N/’000 m3) e/
Agriculture 408 375 277 269
Fishing 133 122 90 87
Fuelwood 61 56 42 40
Total 602 554 409 396
Adjusted agriculture f/ 371 342 254 247
Adjusted total 565 521 386 375
Notes: e/ assumes a total controlled water release of 1,648 m3 per annum from upstream water development projects on the Hadejia and Jam’are rivers; f/ NPV of agriculture adjusted for unsustainability of wheat production, with approx. 56% of current wheat hectarage assumed unsustainable
Exchange rate: N7.5 = US$ 1 in 1989/90
Source: Barbier et al. 1991
have to be taken to improve economic
performance (e.g., through better fisheries
management), or to switch the inputs
(labour, capital, technology) to other more
productive uses.
Data for the study were obtained by a
large-scale stratified sample survey of
over 700 fishing households in the region,
in order to obtain information on the
costs and returns of fishing operations
(both financial and economic values).
An earlier survey (Neiland et al. 1998)
provided additional essential socio-
economic information on the fishing
households themselves. The results of
the surveys are summarized in Table 3.

�0 Tropical river fisheries valuaTion: background papers To a global synThesis
Table �: fisheries of the major river basins and lakes in West africa: economic indicators
Employment (fishers)
Fisheries production
(t/yr)
Value of production
(million $/yr)
Potential fisheries production
(t/yr)
Value of potential
production (million $/yr)
River basins
Senegal-Gambia 25 500 30 500 16.78 112 000 61.60
Volta (rivers) 7 000 13 700 7.12 16 000 8.32
Niger-Benue 64 700 236 500 94.60 205 610 82.24
Chad (rivers) 6 800 32 200 17.71 130 250 71.64
Congo-Zaire 62 000 119 500 47.80 520 000 208.00
Atlantic coastal 6 000 30 700 46.66 118 000 179.30
Major lakes
Volta 20 000 40 000 28.40 62 000 44.02
Chad 15 000 60 000 33.00 165 000 90.75
Kainji 20 000 6 000 3.30 6 000 3.30
TOTAL 227 000 569 100 295.17 1 334 860 749.17
The results indicated that all three
fisheries were yielding substantial net
economic benefits (N415 million or US$ 6
million), albeit at varying levels. Therefore,
the contribution of fisheries to the local
economy of NE Nigeria, and especially in
the Chad Basin, is important and needs
to be taken into account in decisions
that might affect the benefit stream. In
the worse-case scenario, whereby the
fisheries were mismanaged or impacted
by environmental changes (either natural
or man-made), the opportunity cost to
Nigeria would be N 415 million (US$ 6
million). Interestingly, the majority of the
fisheries within NE Nigeria are operated
under traditional management systems.
�.�. economic impact analysis
Economic impact analysis can be
disaggregated into two categories:
(a) The seven major river basins in West and
Central Africa (Table 4 and Appendix
2) provide economic indicators for
employment (number of fishers), total
annual fisheries production (tonnes),
potential annual fisheries production
(tonnes), financial value of total annual
fisheries production, and financial value of
potential total annual fisheries production.
The fisheries of the river basins in West
and Central Africa provide employment
Table �: fisheries of ne nigeria: net economic benefits, 1���-�� (neiland et al. 1���)
FisheryTotal no. of households
Annual catch/household (kg)
Net economic profit/household (N)
Total net economic profit
(N’000)
Upper River Benue 5 660 877 917 5 190
Lake Chad 9 850 5 339 27 009 266 039
Nguru-Gashua Wetlands
6 026 3 077 24 002 144 636
Total 21 536 . . 415 865

chapTer � �1
Table �: West african countries with major inland fisheries: economic indicatorsFisheries
production(t/yr)
Value fish production
(US$million /yr)
Fish supply (kg/capita)
Employment (fishers &on-shore)
Fisheries % Agricultural
GDP
Benin 34 000 29.30 9.1 75 000 Low
Burkina Faso 5 000 5.80 1.4 7 000 Low
Cameroon 50 000 36.40 9.3 65 000 Low
Chad 100 000 n.a. 6.5 170 000 High
Gambia 3 500 4.40 23.7 5 000 Medium
Ghana 53 000 380 26.1 110 000 5%
Ivory Coast 36 000 50 11.1 30 000 Medium
Mali 100 000 350 8.5 73 000 0.94
Niger 16 000 n.a. 0.47 2 000 1%
Nigeria 130 000 180 5.8 70 000 <2%
Senegal 60 000 350 29.9 60 400 5% ?
Sierra Leone 10 000 30 12.3 16 000 1%?
TOTAL 597 500 1 415.9 11.09 667 560 .
for a great number of households, with the
largest numbers found in the Niger-Benue
system (64,700) and the Congo-Zaire
(62,000).
The total annual fisheries production for all
the river basins in this region was 569,100
tonnes valued at US$ 295 million (gross
financial value). The highest production
level for any single basin was found in the
Niger-Benue River Basin (236,500 tonnes)
valued at US$ 95 million (gross financial
value).
The total potential annual fisheries
production for all the river basins in West
and Central Africa is 1.34 million tonnes,
with a potential annual value of US$ 749
million (gross financial value).
(b) The twelve major countries with significant
inland fisheries in West and Central Africa
(Table 5 and Appendix 3) also provide
economic indicators on total annual catch
(tonnes), financial value of total annual
catch (US$), fish consumption per capita
(kg/capita), fisheries employment and
percentage of fisheries contribution to
GDP.
The total annual fisheries production for
the twelve countries with major inland
fisheries in West and Central Africa is
597,500 tonnes. Nigeria (130,000 t/year),
Chad (100,000t/year) and Mali (100,000t/
year) have the largest annual fisheries
production.
The total value (gross financial) of the
annual inland fisheries production in the
region is US$ 1,416 millions. The countries
with the largest values for national
production are Mali, Chad, Senegal and
Nigeria.
The average annual fish supply per capita
in West and Central Africa is 11.10 kg/
capita/year. The highest national averages
are for Senegal (29.9 kg/capita/yr), Ghana
(26.1 kg/capita/yr) and Gambia (23.7 kg/
capita/yr). The lowest national averages
for fish supply are for Burkina Faso
(1.4 kg/capita/yr) and Nigeria (5.8 kg/
capita/yr).
The total employment provided by fisheries
in the twelve leading fisheries nations in
West and Central Africa is 667,560, and
Chad has the largest number of people
working in the fisheries sector (170,000).

�� Tropical river fisheries valuaTion: background papers To a global synThesis
The contribution of fisheries to Agricultural
GDP is generally low for the leading fishing
nations in West and Central Africa. Even
fisheries in Chad, which makes the largest
contribution to the national economy of all
nations in the region, add only five per
cent to agricultural GDP.
�.�. socioeconomic and livelihood analysis information
The objective of this section is to broaden
the perspective of the term “valuation
assessment”, in contrast to the narrow
economic sense with which it has been used
so far. If we recognize that the value of an
activity/resource may go beyond the purely
quantitative economic estimation of the wealth
generated by that activity or resource, then
the term “value” should be considered and
dealt with in a much broader way, in the sense
of “contribution”, and the underlying question
becomes: What is (are) the contribution(s)
(i.e., no longer simply, values) of the activity/
resource for the households, community, or
society?
In the rest of this section, a series of projects
or programs are reviewed that have espoused
this broader definition of the concepts of
“value” and “valuation process”. The review of
some of the research carried out within these
projects reveals that this broadening uncovers
a whole set of new issues, questions and
mechanisms that had been totally missed out
or neglected by the economic approaches
presented above.
�.�.1 The experience of the Traditional Management of artisanal fisheries project (TMaf)
In this first example, the researchers again
use some of the researches undertaken
as part of the DFID-funded ”Traditional
Management of Artisanal Fisheries (TMAF)”
Project. One major element of this research
was the implementation of a poverty analysis
of the fishing communities living in the
three regions included in the project (Upper
River Benue, western shores of the lake
Chad, Nguru Gashua wetland). Because
of the methodological challenge presented
by poverty assessment in an African rural
environment (due, e.g., to the partially non-
commercialized economy and the multiple
activity portfolios adopted by the households)
a series of interrelated methods were used to
provide as wide a range of perspectives on
this issue as possible, including: estimation
of annual income by household (quanti-
tative method) and participative wealth-
ranking exercises within fishing communities
(qualitative).
Interestingly, the wealth-ranking results
showed that the fishing communities were
highly heterogeneous in terms of income and
wealth, ranging from “very rich” to “very poor”.
It was also shown that 40 per cent or more
of households in 12 case-study villages were
impoverished. This state of “impoverishment”
was defined by the communities themselves
as having insufficient food for the year,
low cash income and a reliance on other
members of the community for help in time
of need. They also tended to have no access
to the inputs or resources (good land and
fishing areas) to allow them to undertake the
most valuable occupations, defined by the
communities as farming and fishing.
A second important element of the project
was an in-depth analysis of the local
institutional arrangements (also called tra-
ditional management systems or TMS) and
their potential role in the control of access to
the resources and redistribution of the wealth
generated by the fishing activity.
The analysis of the TMS reveals interesting
results (Neiland 2000). Although TMS are
widespread in the fisheries of NE Nigeria and
appear to provide a basis for the sustainable
chapTer � ��
livelihoods of the fishers’ families, there is also
evidence that many TMS simply reinforce
the exploitative positions of the local elites
(and prevent some groups from achieving
sustainable livelihoods). The analysis,
therefore, suggests that it is important to
distinguish between the two outcomes and
the type of TMS that produce them. For
instance, in the case of the Bade system (an
example where the village-level traditional
management system still persists), it seems
that there is still a high level of equitability, with
the profits of the fishery flowing back to the
community. In contrast, in the Dumba system
(an example of a neo-traditional management
system associated with Islamic traditions),
the results suggest that the local elites are
enriching themselves at the expense of the
local fishers (a form of rent-seeking activity).
In other words, a major paradox seems to exist
with regards to the (potential) role of TMS in
promoting sustainable livelihoods and poverty
alleviation. On the one hand, TMS can be
seen as the only socially and environmentally
sound response by people in order to adapt
to the risks and threats that this severe and
unpredictable arid zone region have always
produced. In that sense, and in absence of
any tangible support by the authorities of the
state, it can be seen as a central element that
ensures the sustainability of the livelihoods
of these rural populations. On the other
hand, it is also possible to make a case that
TMS encourage impoverishment of certain
vulnerable members of fishing communities by
denying access to resources and promoting
exploitative social relationships.
Within the framework of the present section,
this conclusion illustrates the extent to which a
pure economic approach would have missed
the point. None of these issues, mechanisms
and dynamics relating to power relationships,
distribution, socioeconomic stratification, etc.
would have appeared by using a conventional
economic approach.
�.�.� lake chad basin fishery project
The research undertaken under the EU-
INCO project “Sustainable development
of African continental fisheries: a regional
study of policy options and policy formation
mechanisms for the Lake Chad Basin (1998-
2001)” is another illustration of what the term
“valuation assessment” might mean when
used in a broad, multi-sectoral and multi-
dimensional sense.
The main objective of this 3-year European
Commission-funded project was to carry
out a multidisciplinary research program to
address some of the major fisheries planning
and policy constraints faced in this part of
Sub-Saharan Africa, in particular (1) poorly
established policy-formation mechanisms,
(2) lack of relevant data and information, and
(3) limited institutional capacity (Neiland and
Béné 2002). As part of this project, a livelihood
analysis was carried out throughout the Lake
Chad Basin region. The main objective was
to expand the knowledge of the so far very
poorly understood livelihoods of the rural
communities living in the region and, in
particular, to assess the exact contribution of
the fishing activities to their livelihoods.
For this purpose, a combination of partici-
patory activity and wealth ranking exercises
were carried out in 64 villages across the
three main fishing areas of the Basin (Western
shores of the Lake, Chari delta, and Yaere
floodplain). These ranking exercises were
complemented by a series of comparative
analyses of the ethnic composition, level
of food security, and accessibility to fishing
grounds across the different socioeconomic
strata (wealth groups) of the populations.
The livelihood strategy analysis, as it was
designed, did not permit a quantification
(in terms of overall household income) of
the contribution of the different activities

�� Tropical river fisheries valuaTion: background papers To a global synThesis
undertaken by the households. But it offered
an in-depth qualitative analysis of household
livelihood strategies and in particular
permitted a significant improvement in the
understanding of the specific role of the
fisheries in the multiple activity portfolios of
the households. It showed in particular that
for the entire area, households, irrespective
of their wealth levels, still rely to a very large
extent on a subsistence-based economy
where the three major activities (fishing,
farming and herding) are closely integrated.
With respect to fishing activity, the survey
demonstrates the central role of this activity
(in terms of income, labor and food supply)
for all wealth groups.
More importantly, however, the analysis
revealed that there is not a one-to-one
relationship between the contribution of
fishing activity and the wealth (or poverty)
level of the households. In the Yaere, the role
of fishing activities increases with poverty:
the poorer the people, the more they rely on
fishing. In the Yaere, therefore, the fisheries
seem to be the “activity of last resort”. In the
Chari delta and along the Western shores
of the Lake, however, the situation is totally
different. It is the richest who derive most
of their income from the commercialization
of their catches, while the poorest are only
marginally involved the fishing activities and
must rely on alternative activities (such as
wood cutting or daily wage labor) to sustain
their livelihoods.
One of the most interesting results derived
from this l ivel ihood analysis is that the
conclusions revealed through the activity
ranking exercise were corroborated by the
comparative analysis of accessibility to the
fishing grounds. More specifically, it is the
issue of access to the resource that is the
key element conditioning the degree to which
a fishery can (or cannot) fully play its role of a
safety-net activity and act as potential entry
point for poverty reduction. This conclusion
is in line with the recent progress made in the
understanding of the complex re lation
between poverty and natural resources
(Leach et al. 1999). It could not have been
achieved if conventional economic evaluation
techniques (which do not contain any analysis
of (re-) distribution) had been used.
�.�.�. The sustainable fisheries livelihood programme
In 1999, the Sustainable Fisheries Livelihoods
Programme (SFLP) financed by the UK
Department for International Development
(DFID) and implemented by FAO was launched
in 25 West African countries with the explicit
objective of eliminating poverty in fishing
communities. Within this program, research
was carried out on how the Sustainable
Livelihood Approach (SLA) developed,
especially by Scoones (1998) at the Institute of
Development Studies (University of Sussex);
this was later adopted by DFID and may be
used as a tool for assessing and addressing
poverty in the specific context of fisheries.
(a) The Sustainable Livelihood Approach
The holistic principle of the SLA shows
that the vital policies, institutions and
processes are not only based on fisheries
but are also linked to education, health,
and administrative reforms, such as
decentralization, environment, etc., all of
which exert an impact on the livelihoods
of artisanal fisheries communities.
However, the Sustainable Livelihood
framework itself does not define what
poverty is and cannot identify all the
elements that would need to be taken into
account to eliminate poverty or reduce
vulnerability to poverty. Other tools such
as poverty profiling are, therefore, needed
to operationalize the approach.
chapTer � ��
(b) Poverty Profiling
Poverty profiles are analytical instruments
directly linked to action, and are designed
to provide information that may help in the
formulation of actions to reduce poverty.
The basic structure of information
contained in a poverty profile reflects the
factors that influence livelihoods and the
poverty situation of those being profiled.
Such factors include:
• the variety of assets controlled by the
household or to which the household
has access;
• mediating factors such as laws,
policies, and regulations directly
affecting the household, development
programs and projects operating in the
area, and local attitudes and beliefs;
• external factors, such as demographic
trends, the conditions of the natural
resource base, and macroeconomic
data; and
• the probability of shocks such as
falling commodity prices, drought,
conflict, or large-scale illnesses.
By looking at the synergies between these
factors and at the processes in which the
communities are embedded, a poverty
profile allows us to understand the poverty
context at large, describe the specific traits
that characterize poor artisanal fishers’
households, and identify the major factors
generating or aggravating their poverty.
By using census data and other sources
of quantitative or qualitative data, it also
provides information on the distribution of
poor artisanal fishers across a given space
(community, water body, or country).
Poverty profiles are currently being tested
within the Sustainable Fisheries Livelihoods
Programme (SFLP) in West and Central Africa
(Pittaluga et al. forthcoming).
4. ECONOMIC IMPACT ON FISHERIES OF CHANGES IN RIVER bASIN MANAGEMENT
In this section, we will consider the economic
impact on fisheries of changes in river basin
management from the perspective provided
by each type of valuation technique. From the
start, it must be recognized that there have
been relatively few studies of such impacts
undertaken in West and Central Africa.
However, those that have been completed,
particularly when viewed together, provide a
range of interesting and often complementary
findings.
�.1 conventional economic valuation (cev)
�.1.1 economic valuation of the Wetlands benefits: The hadejia-Jam’are floodplain, nigeria; and the impact of the kano river project (barbier et al. 1��1; 1���)
The Kano River Project lies to the south of
Kano city and along the Hadejia River. It
was begun in 1976 with the building of Tiga
Dam to store water for irrigated small-scale
(1-2 ha) farming, which was commenced
in 1981. By 1985/86, the Project was fully
operational with over 7,000 hectares of dry
season crops (wheat and tomatoes) and
12,000 hectares of wet season crops (rice,
maize, cow peas and millet). Water use is
high, estimated at 15,000 m3 per hectare
annually.
Although a complete cost-benefit analysis of
the project has not been conducted, some
information does exist on the costs and value
of production when the project became fully

�� Tropical river fisheries valuaTion: background papers To a global synThesis
operational in 1985/86. Calculations of the
current net economic benefits of the project
are shown in Table 6.
The net economic crop benefits per hectare
of the Kano River Project appear extremely
high (N 865/ha). They easily exceed the net
economic benefit per hectare of floodplain
agriculture (N 239/ha, Table 1 above), and
are virtually double the total net benefits from
floodplain agriculture, fishing and fuel wood
(N 439/ha, Table 1). However, as in the case
of most irrigation projects, the Kano River
Project also had high net operating costs.
During 1984-86, these ranged from a low
of 7.7 per cent to as much as 37 per cent
of the total value of crop production. As
shown in Table 6, when the net operating
costs are deducted from the net economic
crop benefits, the resulting net economic
project benefits are reduced to just N 19/ha.
Thus, the current returns per hectare to the
fully operational Kano River Project do not
compare favorably with those of the floodplain
agriculture, fishing and fuel wood. It was also
shown that the returns per water input were
also higher economically for the floodplain
agriculture system compared to the Kano
River Project.
Based on the current net crop and project
benefits in Table 6, a cost-benefit analysis was
conducted for the Kano River Project (Phase I).
Adjustments to the time horizon and discount
rate were included in a sensitivity analysis, as
shown in Table 7 below. In comparison with
the present value net benefits of the Hadejia-
Jam’are Floodplain (Table 2), it is clear that
the present worth of the Kano River Project
is much lower. Only the present value of net
crop benefits per hectare is substantially
higher for the Project when compared to
the floodplain. However, to exclude current
operating costs would give a misleading
indication of the net economic returns of
the Project. In addition, the present value of
net crop benefits per 1,000m3 of water used
for the Project is substantially lower than for
floodplain recession agriculture, let alone for
total net floodplain benefits.
�.1.� economic impact of changes in river basin Management on fisheries in ne nigeria
The findings of the DFID-funded “Traditional
Management of Artisanal Fisheries in NE
Nigeria Project” (Neiland et al. 1998) allow
some conclusions to be drawn about the
impact of changing hydrological patterns
on river basin fisheries. It should be pointed
out, however, that the research involved here
was not originally aimed at producing a CEV
analysis. In addition, there is the difficulty of
trying to separate out the impacts of man-
made changes (e.g., river basin modifications
Table �: net economic benefits, kano river project phase 1, northern nigeria (n�.�=us$ 1) Net economic benefits (N’000)
Tradeable Crops 4 714
Non-Tradeable Crops 11 839
Total 16 533
Net economic crop benefits per ha (N/ha) 865
Less net operating costs (N/ha) 846
Net economic project benefits per ha (N/ha) 19
Net economic crop benefits per water input (N/’000m3) 1.10
Net economic project benefits per water input (N/’000m3) 0.02
Source: Barbier et al. 1991, 1993
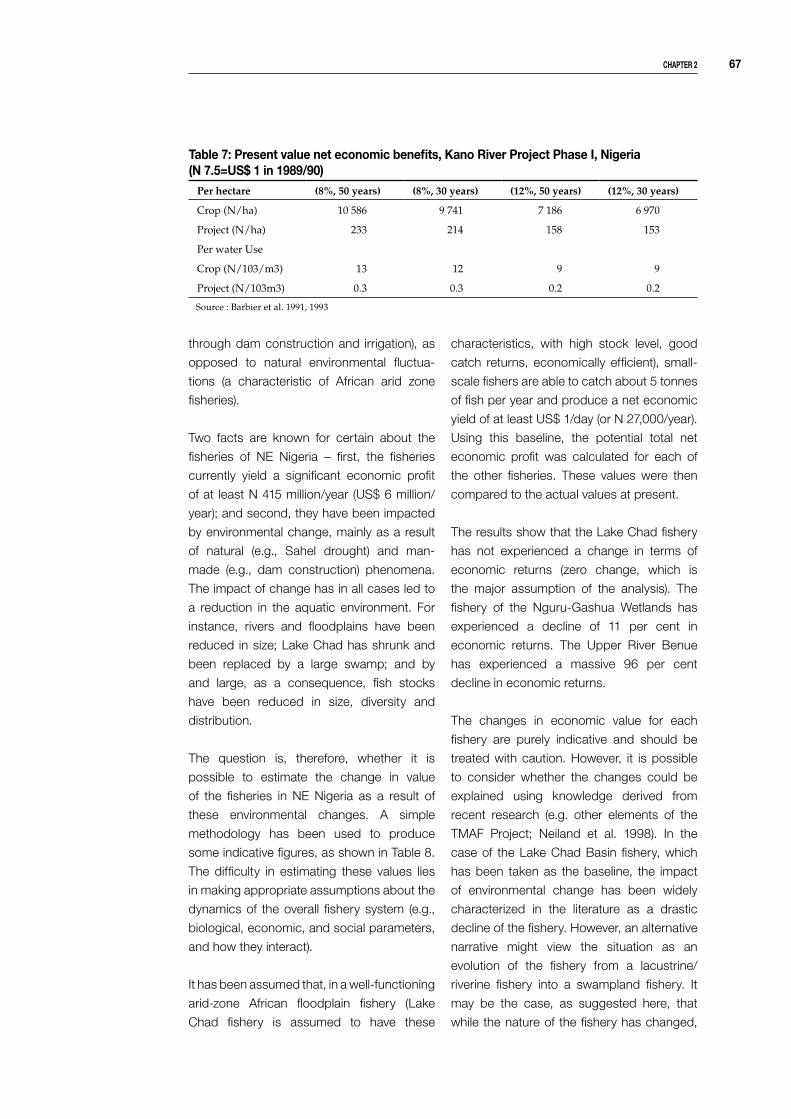
chapTer � ��
Table �: present value net economic benefits, kano river project phase i, nigeria(n �.�=us$ 1 in 1���/�0)
Per hectare (8%, 50 years) (8%, 30 years) (12%, 50 years) (12%, 30 years)
Crop (N/ha) 10 586 9 741 7 186 6 970
Project (N/ha) 233 214 158 153
Per water Use
Crop (N/103/m3) 13 12 9 9
Project (N/103m3) 0.3 0.3 0.2 0.2
Source : Barbier et al. 1991, 1993
through dam construction and irrigation), as
opposed to natural environmental fluctua-
tions (a characteristic of African arid zone
fisheries).
Two facts are known for certain about the
fisheries of NE Nigeria – first, the fisheries
currently yield a significant economic profit
of at least N 415 million/year (US$ 6 million/
year); and second, they have been impacted
by environmental change, mainly as a result
of natural (e.g., Sahel drought) and man-
made (e.g., dam construction) phenomena.
The impact of change has in all cases led to
a reduction in the aquatic environment. For
instance, rivers and floodplains have been
reduced in size; Lake Chad has shrunk and
been replaced by a large swamp; and by
and large, as a consequence, fish stocks
have been reduced in size, diversity and
distribution.
The question is, therefore, whether it is
possible to estimate the change in value
of the fisheries in NE Nigeria as a result of
these environmental changes. A simple
methodology has been used to produce
some indicative figures, as shown in Table 8.
The difficulty in estimating these values lies
in making appropriate assumptions about the
dynamics of the overall fishery system (e.g.,
biological, economic, and social parameters,
and how they interact).
It has been assumed that, in a well-functioning
arid-zone African floodplain fishery (Lake
Chad fishery is assumed to have these
characteristics, with high stock level, good
catch returns, economically efficient), small-
scale fishers are able to catch about 5 tonnes
of fish per year and produce a net economic
yield of at least US$ 1/day (or N 27,000/year).
Using this baseline, the potential total net
economic profit was calculated for each of
the other fisheries. These values were then
compared to the actual values at present.
The results show that the Lake Chad fishery
has not experienced a change in terms of
economic returns (zero change, which is
the major assumption of the analysis). The
fishery of the Nguru-Gashua Wetlands has
experienced a decline of 11 per cent in
economic returns. The Upper River Benue
has experienced a massive 96 per cent
decline in economic returns.
The changes in economic value for each
fishery are purely indicative and should be
treated with caution. However, it is possible
to consider whether the changes could be
explained using knowledge derived from
recent research (e.g. other elements of the
TMAF Project; Neiland et al. 1998). In the
case of the Lake Chad Basin fishery, which
has been taken as the baseline, the impact
of environmental change has been widely
characterized in the literature as a drastic
decline of the fishery. However, an alternative
narrative might view the situation as an
evolution of the fishery from a lacustrine/
riverine fishery into a swampland fishery. It
may be the case, as suggested here, that
while the nature of the fishery has changed,

�� Tropical river fisheries valuaTion: background papers To a global synThesis
the total economic value has remained
relatively stable. Of course, this would need
to be tested, but it is not necessarily the
case that a larger Lake Chad would produce
higher economic returns (compared to a
more inaccessible swamp system). Three
factors that have facilitated the operation
and resilience of the fishery are the existence
of alternative livelihood options (farming),
protected remote fishing areas (that act as
fish refuges), and the well-developed fish
marketing system.
In the case of the Nguru-Gashua Wetlands
fishery, it can be hypothesized that the
relatively low reduction in economic value
of the fishery (11%), in the face of drastic
reduction in the aquatic environment, is
only a temporary phase. The relatively high
household catches and economic profit are
probably due to an increased level of fishing
effort (with few income alternatives), and a
high demand for fish products (and prices)
from nearby Kano and other urban areas
(supported by a good marketing network). It
is anticipated that the fishery in the Nguru-
Gashua Wetlands will not be able to sustain
the present level of activity, and that it will
become overexploited (biologically and
economically) in the near future. The situation
Table �: economic impact on fisheries of hydrological changes in the river basins of ne nigeria (neiland et al. 1���)
River basin
fishery
Major hydrological modifications over
past 30 yearsImpacts on fishery
Current economic value
of fishery landings (Total net
economic profit, N’000s) (a)
Estimated change in
value of fishery (+/- total net
economic profit, N’000s
or % change) (b)
Upper River Benue
(i) Construction of Lagdo dam;(ii) Construction of Gongola River dam;(iii) Sahel drought (70s/80s)
Reduction of riverine discharge, size of annual flood, less inundation of floodplains, reduction of fish biodiversity and stock size; falling catch rates; prices stable; stable local demand
5 190 - 146 010(-96%)
Lake Chad Basin
(i) Construction of dams in northern Cameroon;(ii) Sahel drought (70s/80s);
Reduction of riverine discharge and floodplain; major reduction in size of Lake Chad, but creation of fringing floodplain; change in species diversity; change in fish migrations and distribution; catch rates stable; increased demand/ prices from non-local markets
266 039 266 039(0%)
Nguru-Gashua Wetlands
(i) Construction of dams on headwaters;(ii) Smaller irrigation dams elsewhere;(iii) Sahel drought (70s/80s)
Reduction of riverine discharge and floodplain; reduction of fish stock in size, abundance and diversity; falling catch rates; increased regional demand and prices
144 636 -18 066(-11%)
TOTAL 415 865 364 076
Notes: a) As shown in Table 3 above, based on research findings of TMAF project (Neiland et al. 1998); (b) It is assumed that in a well-functioning fishery such as the Lake Chad fishery (above), households will achieve a net economic profit of N 27,009/year (or US$ 1 per day); based on the number of fishing households per fishery the potential total net economic profit was calculated for Upper River Benue and Nguru-Gashua Wetlands; the current total was deducted from this value to give an indication of the change in the value of the fishery.

chapTer � ��
will be exacerbated by the inability of local
authorities to manage water releases from
the major headwater dams.
In the case of the Upper Benue River, the
impact of the reduction of the aquatic
environment on the local fisheries and their
economic value has been devastating.
The current economic value is a meager
N 5 million/year (or US$ 71,428) compared to
the Lake Chad and Nguru-Gashua Wetlands
fisheries. The reduction in the size of the
Benue River and its floodplain over 20 years
since the construction of the Lagdo Dam
upstream in Cameroon, coupled with low and
only local demand for the available fish, has
produced a fishery of low value to the local
economy overall.
�.� economic impact assessment (ecia)
�.�.1 The Maga reservoir and the yaere floodplain (cameroon)
There are many examples of economic
impact assessments available in the literature,
most of which concentrate on the impacts
of dams on the river flood. One relatively
well-documented (and classical) case is the
Maga dam on the Logone River, located in
the Far-North Province of Cameroon at the
border with Chad. In the pre-dam situation,
the Logone River used to flood the fringing
plain (called the Yaere floodplain). However, in
1979, a national irrigated rice-growing project
was carried out under the management
of the state-controlled company SEMRY
(Rice Culture Expansion and Modernization
Authority). The hydrological component of the
project consisted of 28 km of embankments
that created the Maga reservoir, plus some
80 km of dykes along the Logone River to
control the flooding of adjoining floodplains
(See Figure 4) and to allow the cultivation of
irrigated rice.
The SEMRY project has, however, never
attained its expected production level. But
more importantly, these schemes seriously
modified the floodplain regime, leading to
an acceleration of the degradation of the
environment caused by drought (including
the disappearance of many plant species).
figure �: The �� km dam and �0 km dykes along the river logone seMry project

�0 Tropical river fisheries valuaTion: background papers To a global synThesis
These modifications are also thought to have
eliminated the flooding of some 59,000 ha
of floodplain and seriously reduced another
150,000 hectares that were important
breeding and nursery areas for fish. As a
consequence, IUCN had worked with local
partners to start a rehabilitation project in
1993. The main objective was the restoration
of the flooded area back to a level close to the
pre-dam conditions. This was to be achieved
by the opening of the dyke at two different
locations close to the Maga reservoir.
Although a more comprehensive estimate
(valuation) of the total economic benefits and
costs of the SEMRY scheme is now possible
– especially based on the various detailed
economic, social and ecological studies
carried out by IUCN during the early phases of
the rehabilitation project (1993-97) – the only
type of evaluation of the economic impacts of
the SEMRY scheme on the fishery that was
possible prior to the IUCN studies consisted of
evaluating the loss of direct catches induced
by the reduction of the floodplain area. Taking
into consideration the catch losses induced
by the 590 km2 flood reduction and assum-
ing a 50 per cent reduction of productivity
for the other 1,500 km2 affected by the flood
disruption (i.e., assuming a productivity
of 2.5 t/km2/yr instead of the normal
5 t/km2/yr), the total catch reduction would
be an estimated 6,700 t/yr. At the current
average local price of US$ 0.85/kg (Jolley et
al. 2002), this represents a total direct lost
of 120 US$ million (first sale value) over the
21 years during which the flooding pattern
was significantly affected (1979-2000).
�.�.� The niger river, Mali
The production of the Central Delta was
estimated to be around 100,000 tonnes in the
1960s (Daget 1973). However, in 1973, severe
drought conditions in the entire Sahelian
region substantially affected the flooding of
the Niger River and impacted on the fisheries
activities. By 1990-91, the production of the
fisheries operating in the Central Delta had
decreased to 50,000 tonnes, a 50 per cent
decline with respect to the pre-drought period.
Adopting a similar approach to the one above,
the economic impact induced by the drought
on the Niger River can be estimated to be
US$ 20 million (first sale value) per year.
�.� socioeconomic and livelihood analysis (se-la)
The literature review has not revealed
any specific SE-LA studies that have
investigated the impact of changes in
river basin management on fisheries. The
detailed research findings of many of the
projects mentioned above certainly provide
some evidence that impacts have been felt
by fishing communities. In the case of NE
Nigeria, a survey of village heads revealed the
major changes that had affected the fisheries
over the past 30 years, as shown in Table 9.
These included deterioration of the aquatic
environment, which was undoubtedly linked
to the impact of dams, irrigation schemes,
and a series of Sahel droughts.
There is a need for both cross-sectoral and
time-series studies of this kind to examine the
changes that are taking place in the fisheries of
West and Central Africa. The newly emerging
LA approaches offer considerable potential
for further work in this area throughout the
region.
5. ASSESSMENT OF VALUATION METHODOLOGIES
The range of valuation methodologies that
have been applied to the river fisheries of
West and Central Africa, as revealed by the
literature review in this paper, have been
grouped into three categories: conventional
economic valuation (e.g., household

chapTer � �1
Table �: Major changes detected in the fisheries of ne nigeria over the last �0-�0 years by village heads (neiland et al. 1���)
Major changes
Total responses from village heads (%)
Upper River Benue Lake ChadNguru-Gashua
Wetlands
Catching less/smaller fish 18 17 3
Smaller catch, higher unit value 14 0 8
Deterioration in fishing environment 4 22 18
Deterioration in aquatic environment 4 22 23
Traditional gears now ineffective 0 0 3
New gears introduced 36 17 10
Decline of fisheries management 0 0 3
More fishers now 7 11 0
Less fishers now 7 6 5
Increased fishing costs 4 6 23
No changes 7 0 0
Village does not fish 0 0 5
Total 100 100 100
surveys as a basis for undertaken economic
cost benefit analysis), economic impact
assessment (e.g., monitoring of fish markets
to estimate output volume and value based
on financial prices), and socioeconomic and
livelihood analysis (e.g., participatory rural
appraisal techniques such as wealth-ranking
of fishing households).
In this brief section, the three types of methods
are compared to answer three simple
questions within the context of undertaking
valuation studies in West and Central Africa:
• Which methods are most easily used and
applied?
• Which methods produce information
outputs with the greatest utility?
• Which methods are most cost-effective?
In order to make the comparison and answer
the key questions, twelve assessment criteria
were used and each type of method was
scored for each criterion (1 = low or unfavor-
able, up to 3 = high or favorable). The results
are shown in Table 10 below.
As seen in Table 10, Economic Impact
Assessment methods produced the highest
score (32), followed by socioeconomic and
livelihood analysis (25) and conventional
economic methods (18). In other words, in
terms of a global assessment of the ease
of usage, utility and cost, methods such as
market monitoring are better than methods
such as PRA wealth-ranking or cost-benefit
analysis using household surveys.
This comparative analysis was undertaken
using relatively few (12) assessment criteria
and directed specifically to take account of
conditions on the ground in West and Central
Africa based on personal experience. In other
words, based on the researchers’ experience,
valuation techniques, such as market
monitoring, are most likely to be successful.
A brief examination of the criteria scored
for each of the three methods reveals why
this is the case overall. Economic impact
assessment methods do not need a large
quantity of data and formal sampling is not
a requirement. At the same time, there is
good potential for scaling-up and generating
representative statistics or indicators. The
methods have high potential for time-series
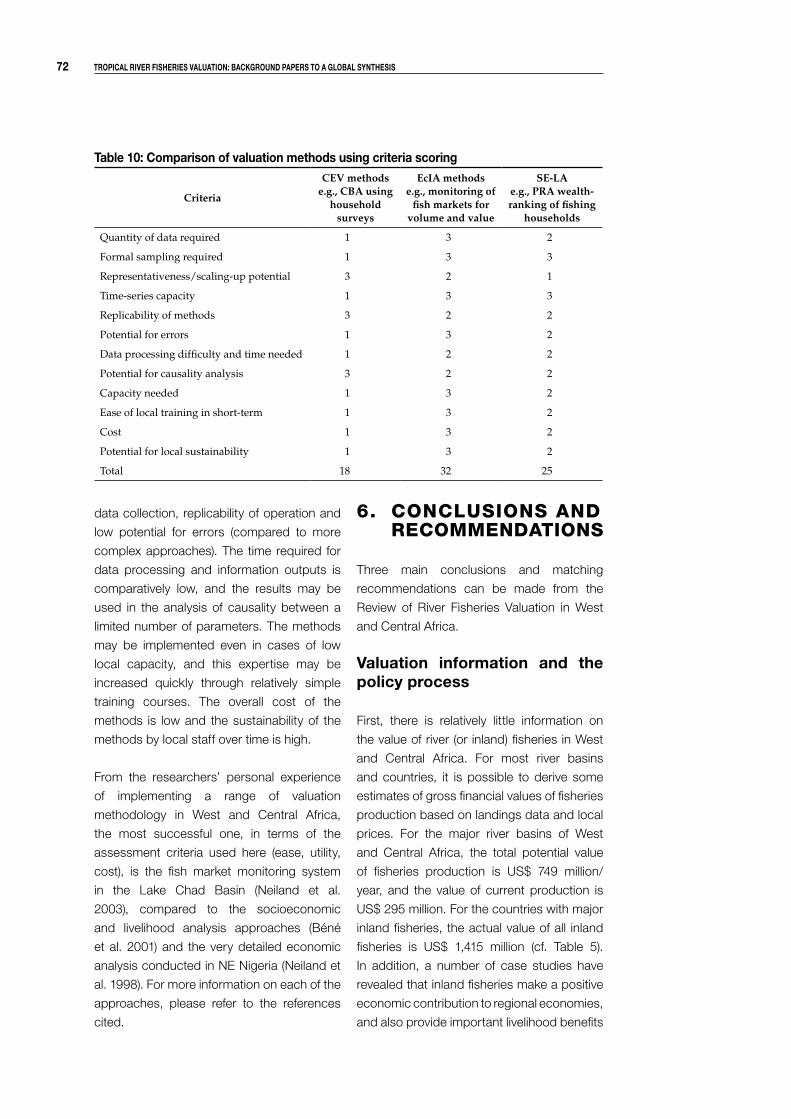
�� Tropical river fisheries valuaTion: background papers To a global synThesis
data collection, replicability of operation and
low potential for errors (compared to more
complex approaches). The time required for
data processing and information outputs is
comparatively low, and the results may be
used in the analysis of causality between a
limited number of parameters. The methods
may be implemented even in cases of low
local capacity, and this expertise may be
increased quickly through relatively simple
training courses. The overall cost of the
methods is low and the sustainability of the
methods by local staff over time is high.
From the researchers’ personal experience
of implementing a range of valuation
methodology in West and Central Africa,
the most successful one, in terms of the
assessment criteria used here (ease, utility,
cost), is the fish market monitoring system
in the Lake Chad Basin (Neiland et al.
2003), compared to the socioeconomic
and livelihood analysis approaches (Béné
et al. 2001) and the very detailed economic
analysis conducted in NE Nigeria (Neiland et
al. 1998). For more information on each of the
approaches, please refer to the references
cited.
6. CONCLUSIONS AND RECOMMENDATIONS
Three main conclusions and matching
recommendations can be made from the
Review of River Fisheries Valuation in West
and Central Africa.
valuation information and the policy process
First, there is relatively little information on
the value of river (or inland) fisheries in West
and Central Africa. For most river basins
and countries, it is possible to derive some
estimates of gross financial values of fisheries
production based on landings data and local
prices. For the major river basins of West
and Central Africa, the total potential value
of fisheries production is US$ 749 million/
year, and the value of current production is
US$ 295 million. For the countries with major
inland fisheries, the actual value of all inland
fisheries is US$ 1,415 million (cf. Table 5).
In addition, a number of case studies have
revealed that inland fisheries make a positive
economic contribution to regional economies,
and also provide important livelihood benefits
Table 10: comparison of valuation methods using criteria scoring
Criteria
CEV methodse.g., CBA using
household surveys
EcIA methodse.g., monitoring of
fish markets for volume and value
SE-LAe.g., PRA wealth-ranking of fishing
households
Quantity of data required 1 3 2
Formal sampling required 1 3 3
Representativeness/scaling-up potential 3 2 1
Time-series capacity 1 3 3
Replicability of methods 3 2 2
Potential for errors 1 3 2
Data processing difficulty and time needed 1 2 2
Potential for causality analysis 3 2 2
Capacity needed 1 3 2
Ease of local training in short-term 1 3 2
Cost 1 3 2
Potential for local sustainability 1 3 2
Total 18 32 25

chapTer � ��
including employment. At the same time,
other studies have shown that changes in
river management regimes can deleteriously
impact on this flow of benefits. As a result
of these findings, it is recommended that
valuation studies need to be undertaken
more widely in the region, in order to avoid
the situation whereby the role of river fisheries
is overlooked or underestimated within the
policy process.
Toolbox of valuation methods and opportunities for application
Second, there are a wide variety of valuation
methods that produce a range of information
types. There is important scope to combine
different methods in different situations to
provide a powerful mechanism for information
generation and analysis. In the context
provided by many countries of West and
Central Africa, the application of valuation
techniques is constrained by a variety of
factors (e.g., weak institutional capacity). At
the same time, there are also opportunities
to utilize valuation methods to develop
sustainable and robust information systems.
On the basis of past experience revealed
by this literature review, it is recommended
that investigations should be undertaken
to understand how valuation techniques
be developed and applied under particular
conditions within West and Central Africa.
It would be useful to develop “A manual
for valuing river fisheries in Africa” on this
basis. One central element to be considered
very seriously is the relationship between
policymakers (information users) and the
information generation process (involving a
range of stakeholders); the sustainability of
the system will depend upon this.
increased capacity for valuation studies
Third, one of the major constraints to the
development of information systems and
policy processes that incorporate valuation
information in West and Central Africa is
limited capacity at all levels of government
fisheries and development organizations.
There are many possibilities for increased
capacity through in-country training courses,
particularly short courses. Once again, it is
important to match the demand for such
capacity building with the need for valuation
information within the policy process of
a particular country. It is recommended,
therefore, that a generic approach to
capacity building in fisheries valuation should
be developed for West and Central Africa,
taking into account the needs of the policy
process, and the full range of opportunities
and constraints.
REFERENCESBalarin J.D. 1985. National review for aquaculture
deve lopment in Af r ica . FAO Fish. C i rc . 770/18,121 p. Food and Agriculture Organization (FAO), Rome.
Barbier, E., W. Adams and K. Kimmage. 1991. Economics valuation of wetland benefits: the Hadejia-Jama’a re f l oodp la in , N ige r i a . London Environment Economics Centre, London.
Barbier, E. 1993. Sustainable use of wetlands; valuing t rop ica l we t l ands bene f i t s : economic me thodo log ies and a pp l i ca t i ons . The Geographical Journal 159(1):22-32.
Béné C., A. Neiland, T. Jolley, B. Ladu, S. Ovie, O. Sule, M. Baba, E. Belal, K. Mindjimba, F. Tiotsop, L. Dara, A. Zakara and J. Quensiere. 2002. Inland fisheries, poverty and rural livelihoods in sub-Saharan Africa: Investigations in the Lake Chad Basin. In A.E. Neiland and C. Béné (eds.) Sustainable development of Continental African Fisheries: a regional study of policy options and policy formation mechanisms for the Lake Chad Basin. Final Report. EU-INCO IC18CT980331. C E M A R E , U n i v e r s i t y o f P o r t s m o u t h , Portsmouth.
Bobo, S . and B. Boukar. 1997. Estimation de la production pechée dans la plaine d’inondation du Logone, 157 pp. World Conservation Union (IUCN), Waza-Logone Project, Maroua.
Braimah, L. 1995. Recent developments in the fisheries of Volta Lake, p. 110-134. In R. Crul and F. Roest (eds.) Current status of fisheries and fish stocks of the four largest African reservoirs. CIFA Technical Paper 30. Food and Agriculture Organization (FAO), Rome.
Corsi, F. 1984. Développement des pêcheries dans le fleuve Zaire. FAO/DP/ZAI/80/003 Doc. de travail 3,

�� Tropical river fisheries valuaTion: background papers To a global synThesis
79 pp. Food and Agriculture Organization (FAO), Rome.
Daget J. 1973. La pêche dans le fleuve Niger. The African Journal of Tropical Biology and Fisheries. Special Issues II:107-114.
Deceuninck, V. 1985. Etudes nationals pour le developpement de l’aquaculture en Afrique. Mali. FAO Circ. Pêches 770/24, 98 pp. Food and Agriculture Organization (FAO), Rome.
Food and Agriculture Organization (FAO). 1997. Technical guidelines for responsible fisheries (inland fisheries). Food and Agriculture Organization (FAO), Rome.
Food and Agriculture Organization (FAO). 2002. World fisheries statistics – Country profile. Food and Agriculture Organization (FAO), Rome. Available at http://www.fao.org/fi/statist/statist.asp
Frenoux, M. 1988. La pêhe continentale et la pisciculture, bilan-diagnostic et développement. Dakar Min. Prot. Nat., 22 pp. (Mimeo).
Ita, E.O., E.K. Sado, J. Balogun, A. Pandogari and Ibitoye. 1984. Inventory survey of Nigeria inland waters and their fisheries resources: a preliminary checklist of inland water-bodies in Nigeria with special reference to ponds lakes, reservoirs and major rivers. Kainji Lake Research Institute Technical Report Series N.14. 27 pp. Bew Bussa, Nigeria.
Jolley, T.H., J. Quensiere, A.E. Neiland, C. Béné, S.I. Ovie, O. Sule, B. Ladu, K. Mindjimba, E. Belal, F. Tiotsop, M. Baba, L. Dara and A. Zakara. 2002. Fisheries Production and fish trade in the Lake Chad Basin. In A. Neiland and C. Béné (eds.) Sustainable development of African continental fisheries: a regional study of policy options and policy formation mechanisms for the Lake Chad Basin. University of Portsmouth and European Commission, EU-INCO Project. Final Report, Appendix 1:102-126.
Konare, A. 1984. La pêche dans les lacs Moëro, Tshangalele, N’Zilo et dans la dépression du Kamalondo. FAO/UNDP ZAI 80/003. Doc. Travail 4.
Leach, M., R. Mearns and I. Sconnes. 1999. Environmental entitlements: dynamics and institutions in community-based natural resource management. World Development 27(2):225-247.
Lévêque, C. 1987. Bassin Tchadien - Chad Basin. In M.J. Burgis and J.J. Symoens, (eds.) African Wetlands and Shallow Water Bodies (Zones humides et lacs peu profonds d’Afr ique), Directory (Répertoire). ORSTOM, Coll. Travaux et Doc. No. 211, Paris 1987, 650 pp.
Mamane, N.T. 2002. Rapport de suivi des informations sur les pecheries du lac tchad, Project “Study of the Contribution of Fish Marketing to Livelihoods in the Countries of the Lake Chad Basin: Cameroon, Chad, Central African Republic (CAR), Niger and Nigeria, 2002-2004”, Sustainable Fisheries Livelihoods Programme (SFLP), 10pp. + annex.
Matthes, H. 1980. Report on a preliminary inland and artisanal fisheries mission to Equatorial Guinea. FAO/UNDP, EQG/80/013, 40 pp. Food and Agriculture Organization (FAO), Rome.
Mindjimba K. and J.C. Njock. 2000. Country review: Cameroon. A first phase report of the project, Sustainable Development of Continental African Fisheries: a regional study of policy options and policy formation mechanisms for the Lake Chad Basin, 81 pp. + Annexes. Ministry of Livestock, Fisheries and Animal Industries, Department of Fisheries, Yaounde, Cameroon and CEMARE, University of Portsmouth, Portsmouth.
Neiland, A. 2000. Traditional management systems and poverty alleviation in Nigeria (riverine and lacustrine fisheries). FAO Seminar on Livelihoods and Fisheries Management in the Sahelian Region, Ougadougou, Burkina Faso, 3-5 July 2000. CIFA/PD/FAO, p. 93-114. Food and Agriculture Organization (FAO), Rome.
Neiland A. and C. Béné (eds.) 2002. Sustainable Development of Continental African Fisheries: a regional study of po l icy opt ions and po l icy format ion mechanisms for the Lake Chad Basin. Final Report. EU-INCO IC18CT980331. CEMARE, University of Portsmouth, Portsmouth.
Neiland A., T. Jolley and C. Béné. 2003. Manual for the establishment of a basic fisheries information monitoring system (fims) using fish markets and trade routes. Preparatory Report for the SFLP Project, Study of the contribution of fish marketing to livelihoods in the countries of the Lake Chad basin: Cameroon, Central African Republic (Car), Chad, Niger and Nigeria. dfid/fao Sustainable Fisheries Livelihoods Programme (sflp) in West Africa, 49 pp.
Neiland, A.E., S. Jaffry and K. Kudaisi. 1998. Fishing income, poverty and fisheries management in North-East Nigeria, p. 291-319. In A.E. Neiland (ed.) Traditional management of artisanal fisheries in North-East Nigeria. Final Report. DFID (Fisheries Management Science Programme) R5471. 440 pp.
Neiland, A.E., M.-T. Sarch, S.P. Madakan, B. Ladu and S. Jaffry. 1997. Characterisation of the inland fisheries of North-East Nigeria including the Upper River Benue, Lake Chad and the Nguru-Gashua wetlands, p. 291-319. In A.E. Neiland (ed.) Traditional management of artisanal fisheries in North-East Nigeria. CEMARE Report No. R43, Final Report, DFID Research project R5471.
Nerguaye-Tetteh, F.D., S.A. Larmie and S.A. Akrasi. 1984. Surface water resources of the Volta Basin. Sub-regional workshop on water resources of the Volta Basin, 10 pp. (Mimeo).
Ovie, S.I., B.M.B. Ladu and O.D. Sule. 2001. Fisheries information monitoring system (FIMS) for the Lake Chad Basin (Doro-Baga Fish Market). A fourth phase report of the project, Sustainable Development of Continental African Fisheries,
chapTer � ��
a regional study of policy options and policy formation mechanisms for the Lake Chad Basin, 20 pp. National Institute for Freshwater Fisheries Research, New Bussa, Nigeria.
Patasse A., 1982. Etude de faisabilité –CATO pêche, La centrafricano-Togolaise de pêche. Lomé, 35 pp. (Mimeo).
Pittaluga, F., E. Corcoran and J. Senahoun. 2003. Vulnerable group profiles of artisanal fishers: methods based on the SLA model. In A.E. Neiland and C. Béné (eds.) Poverty and small-scale fisheries in West Africa. Kluwer Academic Publishers and Food and Agriculture Organization, Dordrecht and Rome.
Royal Commission on Environmental Pollution. 1998. The 20th Report, «Transport and the Environment». London. Available from http://www.rcep.org.uk/
Scoones, I. 1998. Sustainable rural livelihoods: a framework for analysis. Working Paper No.72, 22 pp. University of Sussex Institute of Development Studies, Brighton.
Sen, A. 1981. Poverty and famines: an essay on entitlement and deprivation. Clarendon Press, Oxford. 257 pp.
Vallet, M. 1993. Intensification de la gestion des petits plans d’eau en Afrique francophone. CIFA Technical Paper 22, 58 pp. Food and Agriculture Organization (FAO), Rome.
Van den Bossche, J.P. and G.M. Bernacsek. 1990. Source book for the inland fishery resources of Africa, Vols. 2 and 3. CIFA Technical Paper 18/2-3. Food and Agriculture Organization (FAO), Rome.
Weigel J.-Y. and B. Stomal. 1994. Consommation, transformation et commercialisation du poisson, p. 165-189. In J. Quensière (ed.) La pêche dans le Delta Central du Niger. Approche multi-disciplinaire d’un système de production halieutique, 495 pp. IER, ORSTOM, Karhala, Paris.
Welcomme, R.L. 1972. The inland waters of Africa. CIFA Technical Paper 1, 117 pp. Food and Agriculture Organization (FAO), Rome.
Welcomme, R.L. 1979. The inland fisheries of Africa. CIFA Occasional Paper 7, 69 pp. Food and Agriculture Organization (FAO), Rome.
Welcomme, R.L. 1985. River fisheries. FAO Fisheries Technical Paper 262, 330 pp. Food and Agriculture Organization (FAO), Rome.
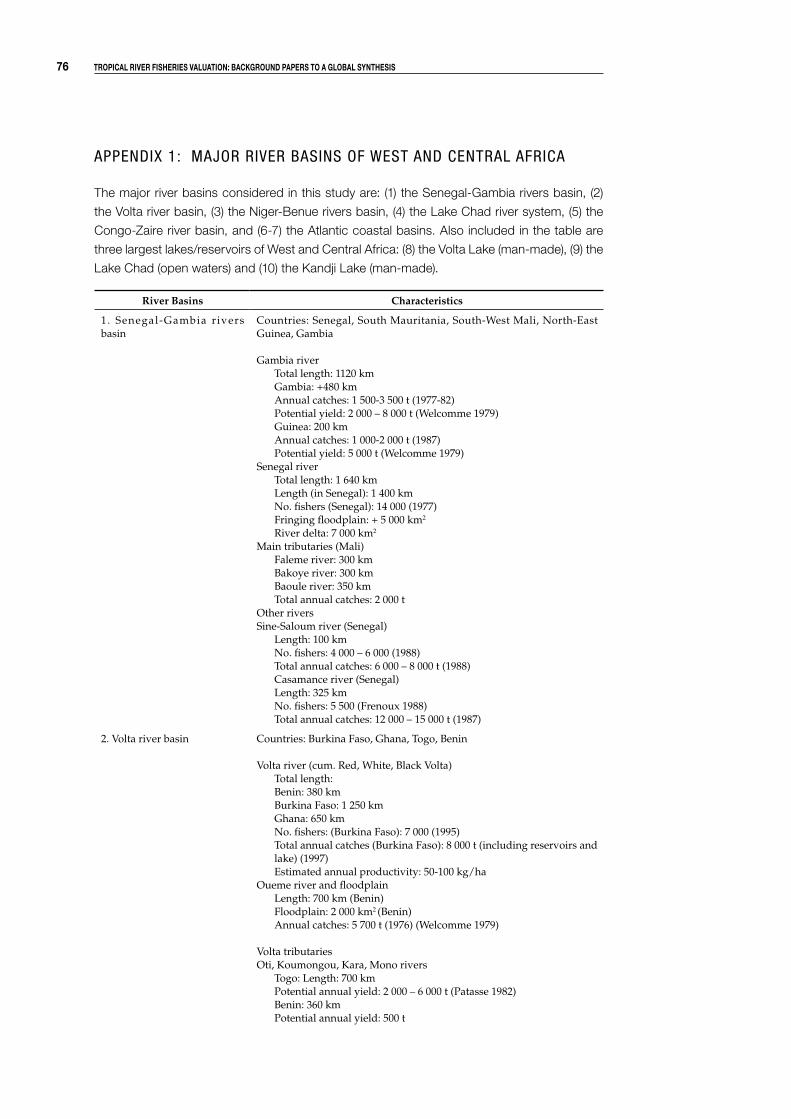
�� Tropical river fisheries valuaTion: background papers To a global synThesis
APPENDIX 1: MAJOR RIVER BASINS OF WEST AND CENTRAL AFRICA
The major river basins considered in this study are: (1) the Senegal-Gambia rivers basin, (2)
the Volta river basin, (3) the Niger-Benue rivers basin, (4) the Lake Chad river system, (5) the
Congo-Zaire river basin, and (6-7) the Atlantic coastal basins. Also included in the table are
three largest lakes/reservoirs of West and Central Africa: (8) the Volta Lake (man-made), (9) the
Lake Chad (open waters) and (10) the Kandji Lake (man-made).
River Basins Characteristics
1. Senegal-Gambia r ivers basin
Countries: Senegal, South Mauritania, South-West Mali, North-East Guinea, Gambia
Gambia riverTotal length: 1120 km Gambia: +480 kmAnnual catches: 1 500-3 500 t (1977-82)Potential yield: 2 000 – 8 000 t (Welcomme 1979)Guinea: 200 kmAnnual catches: 1 000-2 000 t (1987)Potential yield: 5 000 t (Welcomme 1979)
Senegal riverTotal length: 1 640 kmLength (in Senegal): 1 400 kmNo. fishers (Senegal): 14 000 (1977)Fringing floodplain: + 5 000 km2
River delta: 7 000 km2
Main tributaries (Mali)Faleme river: 300 kmBakoye river: 300 kmBaoule river: 350 kmTotal annual catches: 2 000 t
Other riversSine-Saloum river (Senegal)
Length: 100 kmNo. fishers: 4 000 – 6 000 (1988)Total annual catches: 6 000 – 8 000 t (1988)Casamance river (Senegal)Length: 325 kmNo. fishers: 5 500 (Frenoux 1988)Total annual catches: 12 000 – 15 000 t (1987)
2. Volta river basin
Countries: Burkina Faso, Ghana, Togo, Benin
Volta river (cum. Red, White, Black Volta) Total length: Benin: 380 kmBurkina Faso: 1 250 kmGhana: 650 kmNo. fishers: (Burkina Faso): 7 000 (1995)Total annual catches (Burkina Faso): 8 000 t (including reservoirs and lake) (1997) Estimated annual productivity: 50-100 kg/ha
Oueme river and floodplainLength: 700 km (Benin)Floodplain: 2 000 km2 (Benin)Annual catches: 5 700 t (1976) (Welcomme 1979)
Volta tributariesOti, Koumongou, Kara, Mono rivers
Togo: Length: 700 kmPotential annual yield: 2 000 – 6 000 t (Patasse 1982)Benin: 360 kmPotential annual yield: 500 t

chapTer � ��
3. Niger-Benue river basin
Countries: Guinea, Mali, Niger, Nigeria, Benin, Cameroon
Floodplain: Central delta (Mali): Surface: 16 123 km2
Annual catches Nigeria: 19 000 t (1980)Benin: 1 000 t (1971)Mali: 90 000 t
Fringing plains: Niger: 637 km2
Benin: 242 km2
Nigeria: 3 000 km2
Niger riverTotal length: 4 183 kmNigeria: 1 300 kmBenin: 120 kmNiger: 600 kmMali: 3 000 kmGuinea: 580 km (3 400 km with tributaries)
Total annual catches (excluding Niger delta): 114 000 t (1966)Niger: 4 000 – 7 000 t (Welcomme 1972)Benin: 1 000 tMali: 90 000 tNigeria: 13 000 t
No. fishers:Benin (Niger river): 3 000Mali (Niger delta and river): 40 000 – 54 000 (1975)Niger (Niger river): 2 600 (1981)
Benue riverNigeria: 1 440 kmCameroon: 550 km (including Mayo Kebi)
Annual catch: Cameroon: 3 000 t (estimation 1966)Nigeria: 6 500 t (Barbier et al. 1991)No. fishers: 5 100 (Nigeria) (Welcomme 1985)
4. Lake Chad river system
Countries: Niger, Chad, Central African Republic, Nigeria, North Cameroon
Main riversLogone (Cameroon): 280 km Chari (Chad): 1 300 km
Potential productivityLogone-Chari: 20 000 – 30 000 t/yr
FloodplainsYaéré (Cameroon-Chad)
Surface: 4 600 km2
Potential annual yield: 20 000-30 000 t/yr Annual catches: 2 272 t (Logone river only) (Bobo and Boukar 1997)No. fishers: 6 800 (1997)
Salamat river and floodplain (Chad)Salamat river: 950 kmFringing floodplain: 4 000 km2
Total annual catches: 22 000 t (Deceuninck 1985)Bahr Aouk river and floodplain (CAR)
Bahr Aouk river: 620 kmFringing floodplain: 8 000 km2
Total annual catches: 6 000 t (Deceuninck 1985)

�� Tropical river fisheries valuaTion: background papers To a global synThesis
5. Congo-Zaire river basin
Countries: Congo-Brazzaville, Democratic Republic of Congo (DRC), Central African Republic (CAR), Rwanda, Burundi, Uganda
Main rivers:Lualaba river becoming Congo-Zaire River:
Total length: 4 140 kmTributaries’ floodplains: 17000 km2
No. fishers: 40 000 – 50 000 (Corsi, 1984)Total annual catches: 70 000 – 75 000 tPotential annual yield: 150 000 t (including tributaries)
Luapula River (DRC):Total length: 560 kmFloodplains: 1 500 km2
No. fishers: 2 850 (Konare 1984)Total annual catches: 8 800 t (1983)
Ubangui and Uele (Congo, DRC, CAR): Total length: 2 270 kmTotal annual catches: 7 520 t (1984)Floodplains: 1 300 km2
Sangha (Congo): 1 000 kmFloodplains (including Likouala river floodplain): 35 000 km2
No. fishers: 7 000 –10 000 (river and floodplain)Total annual catches: 10 000 – 15 000 t (1980)Potential annual yield: 60 000 – 100 000 t
Tributaries and floodplainsCameroon: 1 400 kmDRC: 10 000 km of tributaries17 000 km2 of floodplain (not including Congo-Zaire floodplains)CAR floodplains: 15 000 km2
Congo: Annual catches: 10 000 – 15 000 t (floodplains and tributaries)
6. Atlantic coastal basin I
Countries: Gambia, Guinea Bissau, Sierra Leone, Liberia, Ivory Coast
Ivory Coast rivers:Length (cum.): 1 700 kmPotential annual yield: 20 000 tTotal annual catches: 18 500 (1997)No. fishers: 6 000 (FAO 2002)
Sierra Leone rivers:Length (cum.): 1 280 kmTotal annual catches (1998): 10 000 tPotential annual yield: 11 000 – 14 000 tFringing floodplains: 10 000 km2
7. Atlantic coastal basins II Countries: South Cameroon, Equatorial Guinea, GabonGabon:
Ogooué river: 820 kmNo. fishers: 1 485 (1977)Total annual catches: 1 800 t
Equatorial Guinea:Rio Benito: 230 km
No. fishers: 400 (Matthes 1980)Annual catches: 400 tPotential annual yield: 1 000 t (Matthes 1980)
Other rivers and tributaries:Cameroon: +500 km
Productivity: 210 – 940 kg/km
8. Volta Lake Country: Ghana
Surface: 8 270 km2
Total annual catches: 40 000 t (1979)No. fishers: 20 000 (1975)Potential annual yield: 40 000 – 50 000 t (Welcomme 1972)
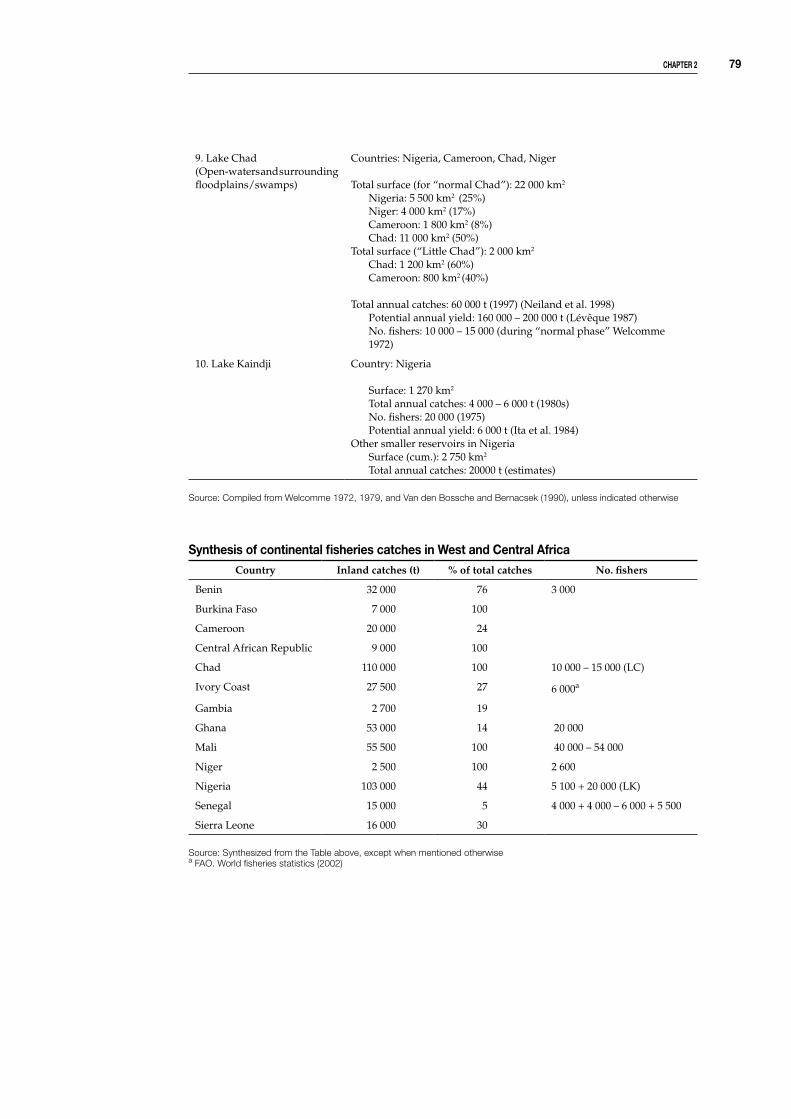
chapTer � ��
9. Lake Chad (Open-waters and surrounding floodplains/swamps)
Countries: Nigeria, Cameroon, Chad, Niger
Total surface (for “normal Chad”): 22 000 km2
Nigeria: 5 500 km2 (25%)Niger: 4 000 km2 (17%)Cameroon: 1 800 km2 (8%)Chad: 11 000 km2 (50%)
Total surface (“Little Chad”): 2 000 km2
Chad: 1 200 km2 (60%)Cameroon: 800 km2 (40%)
Total annual catches: 60 000 t (1997) (Neiland et al. 1998)Potential annual yield: 160 000 – 200 000 t (Lévêque 1987)No. fishers: 10 000 – 15 000 (during “normal phase” Welcomme 1972)
10. Lake Kaindji Country: Nigeria
Surface: 1 270 km2
Total annual catches: 4 000 – 6 000 t (1980s)No. fishers: 20 000 (1975)Potential annual yield: 6 000 t (Ita et al. 1984)
Other smaller reservoirs in NigeriaSurface (cum.): 2 750 km2
Total annual catches: 20000 t (estimates)
Source: Compiled from Welcomme 1972, 1979, and Van den Bossche and Bernacsek (1990), unless indicated otherwise
synthesis of continental fisheries catches in West and central africa Country Inland catches (t) % of total catches No. fishers
Benin 32 000 76 3 000
Burkina Faso 7 000 100
Cameroon 20 000 24
Central African Republic 9 000 100
Chad 110 000 100 10 000 – 15 000 (LC)
Ivory Coast 27 500 27 6 000a
Gambia 2 700 19
Ghana 53 000 14 20 000
Mali 55 500 100 40 000 – 54 000
Niger 2 500 100 2 600
Nigeria 103 000 44 5 100 + 20 000 (LK)
Senegal 15 000 5 4 000 + 4 000 – 6 000 + 5 500
Sierra Leone 16 000 30
Source: Synthesized from the Table above, except when mentioned otherwisea FAO. World fisheries statistics (2002)

�0 Tropical river fisheries valuaTion: background papers To a global synThesis
APPENDIX 2: POTENTIAL ECONOMIC VALUE OF WESTERN AND CENTRAL AFRICAN BASINS
Potential economic value of Western and Central African basins are estimated through the first sale values (US$/yr) of river and floodplain fisheries potential catches a. The number of fishers and total annual catches actually recorded in the literature for these basins b is also indicated in this table. These records can be considered as very conservative estimates of the real figures. (See footnotes below.)
River basins bCoefficients usedfor the calculation
Potentialeconomic value
1. Senegal-Gambia rivers basin
Recorded No. fishers: = 23 500 – 25 500 c [1977-1988] d
Recorded total annual catches: 22 500 –30 500e t/yr [1977-1988]Potential annual yield: Rivers: 52 000 t/yrFloodplains: 60 000 t/yr
Total potential: 112 000 t/yr
Potential river yield: 15 t/km/yr
Potential floodplain yield:5 t/km2/yr
Unit price (first sale value):US$ 0.55/kg (estimate)
US$ 61.6 million/yr
2. Volta river basin
Recorded No. fishers: 7 000 f [1995]Recorded total annual catches: 13 700 g t/yr [1976 -1997]Potential annual yield: Rivers: 6 000 t/yrFloodplains: 10 000 t/yr
Total potential: 16 000 t/yr
Potential river yield: 15 t/km/yr
Potential floodplain yield:5 t/km2/yr
Unit price (first sale value):US$ 0.52/kg (FAO 2002)
US$ 8.32 million / yr
3. Niger-Benue river basin
Recorded No. fishers: 50 700 – 64 700 h
[1975 – 1985]Recorded total annual catches: 236 500 t/yr [1971-1991]Potential annual yield: Rivers: 105 600 t/yrFloodplains: 100 010 t/yr
Total potential: 205 610 t/yr
Potential river yield: 15 t/km/yr
Potential floodplain yield:5 t/km2/yr
Unit price (first sale value):US$ 0.4/kg n
US$ 82.244 millions/yr
4. Lake Chad river system
Recorded No. fishers: 6 800 I [1997]Recorded total annual catches: 32 200 t/yr [1985-1997]Potential annual yield: Rivers: 47 250 t/yrFloodplains: 83 000 t/yr
Total potential: 130 250 t/yr
Potential river yield: 15 t/km/yr
Potential floodplain yield:5 t/km2/yr
Unit price (first sale value): US$ 0.55/kg o
US$ 71.637 million/yr
a Lagoons, lakes and reservoirs are not included in this estimation.b Note that the recorded total annual catches may differ from the potential annual yield. The closer the former is to the latter,
the more likely the fisheries are at their maximal exploitation level. c Not recorded: number of fishers on the Gambia river.d The periods between [ ] indicate the first and last year of estimation.e Not recorded: total annual catches of the Senegal river.f Only recorded fishermen in Burkina Faso operating on the Volta river; not recorded fishers in Ghana, Togo, and Benin.g Not recorded: total annual catches in Ghana, Togo, and Benin of the fishermen operating on the Volta river.
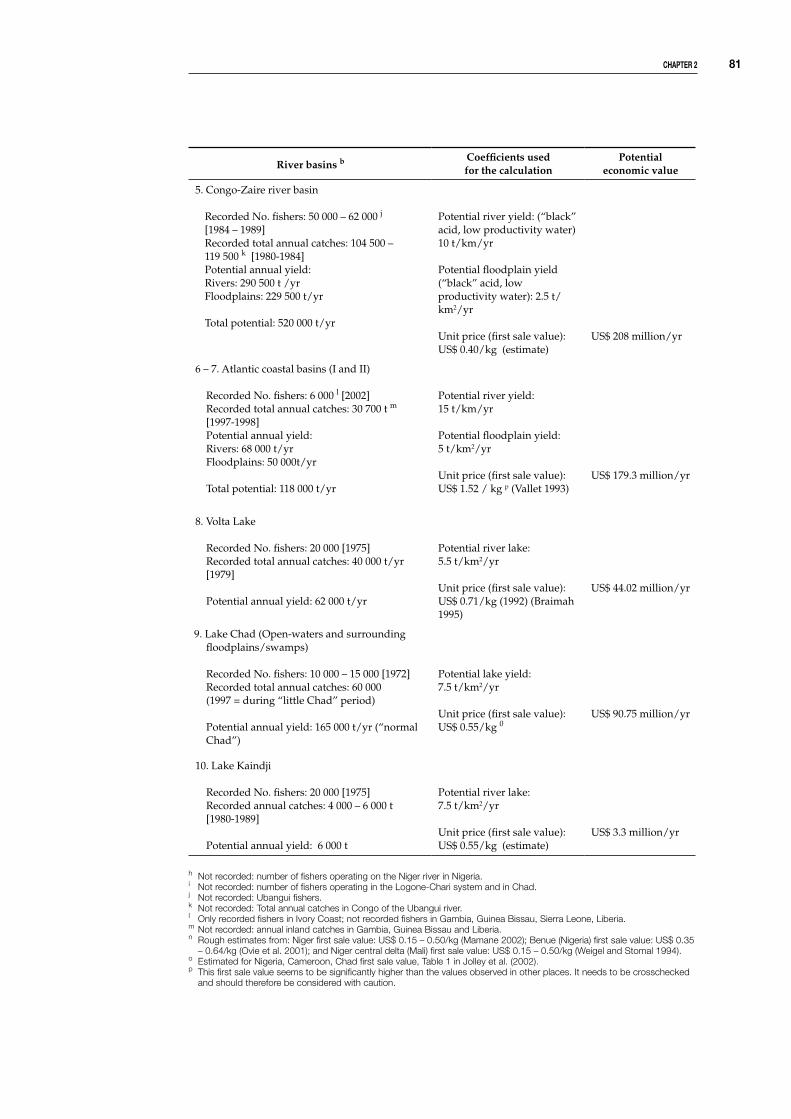
chapTer � �1
River basins bCoefficients usedfor the calculation
Potentialeconomic value
5. Congo-Zaire river basin
Recorded No. fishers: 50 000 – 62 000 j
[1984 – 1989]Recorded total annual catches: 104 500 –119 500 k [1980-1984]Potential annual yield: Rivers: 290 500 t /yrFloodplains: 229 500 t/yr
Total potential: 520 000 t/yr
Potential river yield: (“black” acid, low productivity water)10 t/km/yr
Potential floodplain yield (“black” acid, low productivity water): 2.5 t/km2/yr
Unit price (first sale value):US$ 0.40/kg (estimate)
US$ 208 million/yr
6 – 7. Atlantic coastal basins (I and II)
Recorded No. fishers: 6 000 l [2002]Recorded total annual catches: 30 700 t m [1997-1998]Potential annual yield: Rivers: 68 000 t/yrFloodplains: 50 000t/yr
Total potential: 118 000 t/yr
Potential river yield: 15 t/km/yr
Potential floodplain yield:5 t/km2/yr
Unit price (first sale value):US$ 1.52 / kg p (Vallet 1993)
US$ 179.3 million/yr
8. Volta Lake
Recorded No. fishers: 20 000 [1975]Recorded total annual catches: 40 000 t/yr [1979]
Potential annual yield: 62 000 t/yr
Potential river lake: 5.5 t/km2/yr
Unit price (first sale value): US$ 0.71/kg (1992) (Braimah 1995)
US$ 44.02 million/yr
9. Lake Chad (Open-waters and surrounding floodplains/swamps)
Recorded No. fishers: 10 000 – 15 000 [1972]Recorded total annual catches: 60 000(1997 = during “little Chad” period)
Potential annual yield: 165 000 t/yr (“normal Chad”)
Potential lake yield: 7.5 t/km2/yr
Unit price (first sale value): US$ 0.55/kg 0
US$ 90.75 million/yr
10. Lake Kaindji
Recorded No. fishers: 20 000 [1975]Recorded annual catches: 4 000 – 6 000 t[1980-1989]
Potential annual yield: 6 000 t
Potential river lake: 7.5 t/km2/yr
Unit price (first sale value):US$ 0.55/kg (estimate)
US$ 3.3 million/yr
h Not recorded: number of fishers operating on the Niger river in Nigeria.i Not recorded: number of fishers operating in the Logone-Chari system and in Chad. j Not recorded: Ubangui fishers.k Not recorded: Total annual catches in Congo of the Ubangui river.l Only recorded fishers in Ivory Coast; not recorded fishers in Gambia, Guinea Bissau, Sierra Leone, Liberia.m Not recorded: annual inland catches in Gambia, Guinea Bissau and Liberia.n Rough estimates from: Niger first sale value: US$ 0.15 – 0.50/kg (Mamane 2002); Benue (Nigeria) first sale value: US$ 0.35
– 0.64/kg (Ovie et al. 2001); and Niger central delta (Mali) first sale value: US$ 0.15 – 0.50/kg (Weigel and Stomal 1994).o Estimated for Nigeria, Cameroon, Chad first sale value, Table 1 in Jolley et al. (2002).p This first sale value seems to be significantly higher than the values observed in other places. It needs to be crosschecked
and should therefore be considered with caution.

�� Tropical river fisheries valuaTion: background papers To a global synThesis
APPENDIX 3: COUNTRY FISHERIES PROFILES
In this appendix, the fishery profiles of the West and Central African countries for which the share of inland fisheries exceeds 10 per cent of the total catches and with a potential annual catch exceeding 5 000 tonnes are presented. This includes:
Benin, Burkina Faso, Cameroon, Chad, Ivory Coast, The Gambia, Ghana, Mali, Niger, Nigeria, Senegal, and Sierra Leone. Cape Verde, Equatorial Guinea, Gabon, Guinea, and Liberia are not included in this list.

chapTer � ��
Surface area: 112 622 km²
Populations (1997): 5 720 million
GNB (1995): EURO 2.33 billion
GNB per capita (1995): EURO 430
Gross Value of Agricultural Output (estimation 1995): 36%
Employment (1996):
(i) full-time fishers (professional): 53 000
(ii) part-time and seasonal fishers: 22 000
Fisheries first sale value (1995): EURO 29.3 million
Trade (1997 estimates):
Import values: EURO 6.7 million
Export values: EURO 1.4 million
♠ Economic and demographic data from UN and World Bank sources; fisheries data from FAO. World fisheries statistics (2002)
♣ Van den Boosche and Bernacsek (1990, Vol. 2, Table 2, p. xii)♥ FAO. World fisheries statistics (2002)a Including lakes, rivers, floodplain and lagoons♦ FAO. World fisheries statistics (2002)
Benin
general information ♠
Main rivers and floodplainsNiger Basin (Niger river and main tributaries): Surface area: 758 000 km2
Length (cum.): 1 118 km Floodplains: 275 km2
Volta Length: 380 km
inland fisheries ♣
Inland catches as percentage of total catches: 76% (1987); 69% (1999)♥
Degree of exploitation (1987): inland catch range (t): 20 000 – 34 000a
inland potential catch range: 28 000 – 33 000a
fisheries data ♦
Production Imports ExportsTotal
supplySupply per
capita
‘000 t (fresh weight) kg/yr
Fish for direct human consumption 43.771 8.5 0.321 51.95 9.1
Fish for animal consumption and other uses
- - - - -

�� Tropical river fisheries valuaTion: background papers To a global synThesis
general overview
Two socioeconomic categories are in-
volved in continental fisheries activities
(50,000 fishermen and 19,000 fish-
mongers). In addition, the sector provides
employment to about 300,000 people in
various related fields, such as vessel and
fishing gears reparations, fish distribution
and marketing.
The majority of the fishers (approx. 75%)
are full-time professionals. They use
different types of fishing techniques and
gears. The remaining 25% include:
• Farmer-fishers for whom fishing is a
complementary or seasonal activity;
• The seasonal fishers who fish only
during specific period of the year;
• The occasional fishers who fish only
as a complementary subsistence
activity;
• Households involved in traditional
extensive aquaculture activities to
complement their income derived
from fisheries or farming activities.
Of the 33,000 tonnes of fish caught
annually (1977) inland, 92.3 per cent (i.e.,
30,000 tonnes) come from lagoons and
coastal lakes. Generally lagoon activity
is performed on individual basis, from a
non-motorised monoxyle pirogue. Fishing
techniques and gears are diverse: driftnets,
castnets, traps (for fish or shrimp), and
hooklines.
fish demand and catch uses
Fish constitutes the main source of animal
protein for the population in particular
in southern (coastal) regions. In 1995,
fish represented 5.5 per cent of the total
protein source and 31.9 per cent of the
total consumption in animal protein. About
three-fourths of the catches are consumed
fresh; the rest (about 120,000 t) is smoked,
salt or dried before it is sold on the inland
markets. In various fishing camps outside
the fishing port, about 2,800 women
are involved in processing and trading
activities. The national production is not
sufficient to cover the demand. Frozen
and canned fish are therefore imported.
In 1995, 14,200 tonnes of frozen fish were
imported.
inland fisheries ♦
♦ FAO. World fisheries statistics (2002)
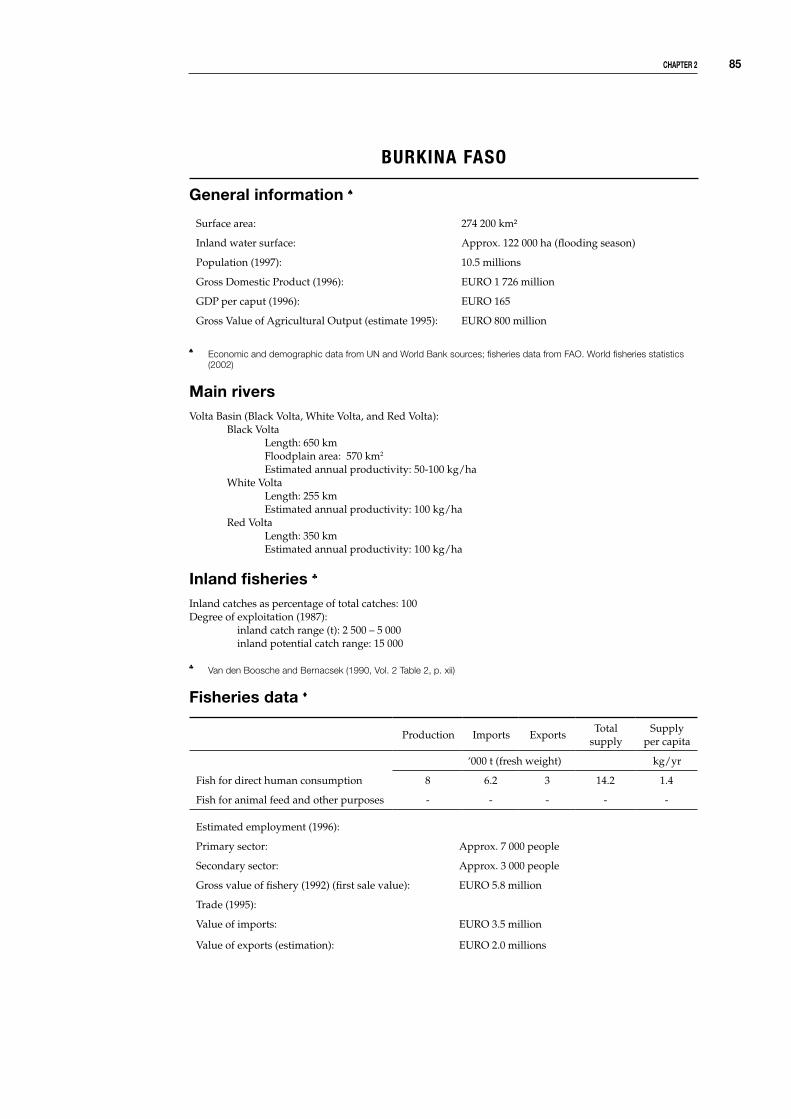
chapTer � ��
Burkina Faso
general information ♠
♠ Economic and demographic data from UN and World Bank sources; fisheries data from FAO. World fisheries statistics (2002)
Main riversVolta Basin (Black Volta, White Volta, and Red Volta): Black Volta Length: 650 km Floodplain area: 570 km2
Estimated annual productivity: 50-100 kg/ha White Volta Length: 255 km Estimated annual productivity: 100 kg/ha Red Volta Length: 350 km Estimated annual productivity: 100 kg/ha
inland fisheries ♣
Inland catches as percentage of total catches: 100Degree of exploitation (1987): inland catch range (t): 2 500 – 5 000 inland potential catch range: 15 000
♣ Van den Boosche and Bernacsek (1990, Vol. 2 Table 2, p. xii)
fisheries data ♦
Production Imports ExportsTotal
supplySupply
per capita
‘000 t (fresh weight) kg/yr
Fish for direct human consumption 8 6.2 3 14.2 1.4
Fish for animal feed and other purposes - - - - -
Surface area: 274 200 km²
Inland water surface: Approx. 122 000 ha (flooding season)
Population (1997): 10.5 millions
Gross Domestic Product (1996): EURO 1 726 million
GDP per caput (1996): EURO 165
Gross Value of Agricultural Output (estimate 1995): EURO 800 million
Estimated employment (1996):
Primary sector: Approx. 7 000 people
Secondary sector: Approx. 3 000 people
Gross value of fishery (1992) (first sale value): EURO 5.8 million
Trade (1995):
Value of imports: EURO 3.5 million
Value of exports (estimation): EURO 2.0 millions
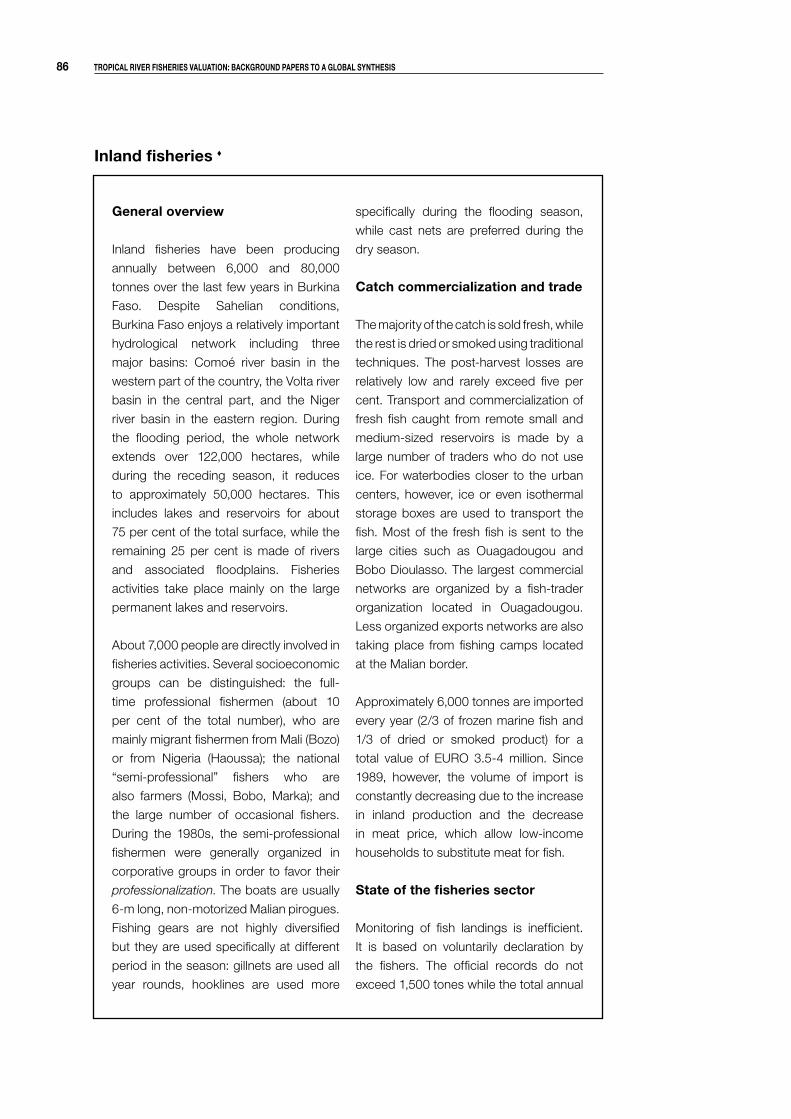
�� Tropical river fisheries valuaTion: background papers To a global synThesis
general overview
Inland fisheries have been producing
annually between 6,000 and 80,000
tonnes over the last few years in Burkina
Faso. Despite Sahelian conditions,
Burkina Faso enjoys a relatively important
hydrological network including three
major basins: Comoé river basin in the
western part of the country, the Volta river
basin in the central part, and the Niger
river basin in the eastern region. During
the flooding period, the whole network
extends over 122,000 hectares, while
during the receding season, it reduces
to approximately 50,000 hectares. This
includes lakes and reservoirs for about
75 per cent of the total surface, while the
remaining 25 per cent is made of rivers
and associated floodplains. Fisheries
activities take place mainly on the large
permanent lakes and reservoirs.
About 7,000 people are directly involved in
fisheries activities. Several socioeconomic
groups can be distinguished: the full-
time professional fishermen (about 10
per cent of the total number), who are
mainly migrant fishermen from Mali (Bozo)
or from Nigeria (Haoussa); the national
“semi-professional” fishers who are
also farmers (Mossi, Bobo, Marka); and
the large number of occasional fishers.
During the 1980s, the semi-professional
fishermen were generally organized in
corporative groups in order to favor their
professionalization. The boats are usually
6-m long, non-motorized Malian pirogues.
Fishing gears are not highly diversified
but they are used specifically at different
period in the season: gillnets are used all
year rounds, hooklines are used more
specifically during the flooding season,
while cast nets are preferred during the
dry season.
catch commercialization and trade
The majority of the catch is sold fresh, while
the rest is dried or smoked using traditional
techniques. The post-harvest losses are
relatively low and rarely exceed five per
cent. Transport and commercialization of
fresh fish caught from remote small and
medium-sized reservoirs is made by a
large number of traders who do not use
ice. For waterbodies closer to the urban
centers, however, ice or even isothermal
storage boxes are used to transport the
fish. Most of the fresh fish is sent to the
large cities such as Ouagadougou and
Bobo Dioulasso. The largest commercial
networks are organized by a fish-trader
organization located in Ouagadougou.
Less organized exports networks are also
taking place from fishing camps located
at the Malian border.
Approximately 6,000 tonnes are imported
every year (2/3 of frozen marine fish and
1/3 of dried or smoked product) for a
total value of EURO 3.5-4 million. Since
1989, however, the volume of import is
constantly decreasing due to the increase
in inland production and the decrease
in meat price, which allow low-income
households to substitute meat for fish.
state of the fisheries sector
Monitoring of fish landings is inefficient.
It is based on voluntarily declaration by
the fishers. The official records do not
exceed 1,500 tones while the total annual
inland fisheries ♦
chapTer � ��
♦ FAO. World fisheries statistics (2002)
catch is thought to vary between 7,000-
8,000 tonnes. Most of these catches
are made by migrant fishers. The fishing
performances of the national semi-
professional fishers largely depend on
their access to fishing gears and the
degree of professionalization.
economic role of fisheries sector
Fisheries activities are not playing a central
role in the economy of Burkina Faso.
However, despite a relatively marginal
contribution to the GNP and a decrease
in the fish per capita consumption
(1.4 kg/yr in 1995) fisheries appear to play a
more important role in the rural economy.
The sector employs about 10,000 people
(full-time, part-time or seasonal fishers
and jobs in related activities). It also
constitutes a complementary activity to
agriculture, especially in areas close to
small or medium-sized reservoirs.
fisheries development
The annual potential yield is estimated
around 10,000 tonnes, which suggests
some perspectives for development.
Field reports and observations seem to
indicate, however, that the fisheries,
especially those of large waterbodies,
are already close to their maximum
potential yield. The construction of the
Bagre dam (20,000 ha) may however
provide an additional development
opportunity for the sector. Moreover,
it is thought that the domestic supply
could further increase if the fish exported
informally toward neighboring countries
was sold on domestic markets.

�� Tropical river fisheries valuaTion: background papers To a global synThesis
Cameroon
general information ♠
♠ Economic and demographic data from UN and World Bank sources;fisheries data from FAO. World fisheries statistics (2002)
Main rivers and floodplainse Lake Chad Basin rivers and floodplains (Logone, Chari and main tributaries):
Length (Logone): 280 kmFloodplains (Yaéré): 250 – 7 000 km2
Potential productivity (rivers): 30 000 t/yrCongo-Zaire tributaries
Length (cum.): 1 390 kmPotential productivity: 350 t/yr
Atlantic coastal basin tributariesLength (cum.): >3 800 kmPotential productivity: 2 173 t/yr
Niger-BenueLength Benue and tributaries (cum.): +550 kmPotential productivity: 2 125 t /yr
e Compiled from Van den Boosche and Bernacsek (1990)
inland fisheries ♣
Inland catches as percentage of total catches: 24% (1987); 38% (1999)♥
Degree of exploitation (1987): inland catch range (t): 20 000 – 50 000inland potential catch range : 45 000 – 80 000
♣ FAO. World fisheries statistics (2002)♥ Van den Boosche and Bernacsek (1990, Vol. 2, Table 2, p xii)
fisheries data (1���)♦
Production Imports ExportsTotal
supplyPer caput
supply
‘000 tonnes (live weight) kg/year
Fish for direct human consumption 93 43 2 126 9.3
Fish for animal feed and other purposes
- 3.7 - 3.7 -
Surface area: 475 000 km²
Population (1996) : 13 560 000
GNP (1995): US$ 8.840 million
GNP per capita (1995): US$ 680
Gross Value of Agricultural Output (estimate 1995): US$ 2.213 million
Gross Value of Agricultural Output (estimate 1995): EURO 800 million
Estimated employment (1996):
Primary sector: 65 000
Secondary sector: 180 000
Gross Value of Fisheries Output (at ex-vessel prices 1996): US$ 36.4 million
Trade (1998 estimated):
Value of imports: US$ 14.6 million
Value of exports (shrimp): US$ 1.4 million
♦ FAO. World fisheries statistics (2002)

chapTer � ��
general overview
Cameroon has a dense drainage network
comprising rivers, floodplains, natural
lakes and reservoirs, which covers
approximately 4 million hectares. The
main traditional zones of continental
fishing activities are the Lake Chad and
the other waterbodies of the northern part
of the country. However, since the 1980s,
the production of these regions has
decreased dramatically due to recurrent
rainfall deficit. This decline is partially
compensated by the catches from the
reservoirs Bamendjin (25,000 ha), Lagdo
(60,000 ha), Maga (24,000 ha), Mbakaou
(50,000 ha), and Mayo-Oulo (80,000 ha).
catch commercialization
In general the exact volumes or values
of the catches are poorly estimated. The
majority of the inland fisheries catches is
commercialized as dried or smoked fish.
A large part of this production is exported,
notably to Nigeria. The post-harvest losses
are relatively important due to the lack
of proper commercialization and trade
infrastructures. To satisfy the increasing
demand (mainly in the southern urban
centers), Cameroon now imports about
43,000 t/yr of frozen fish.
state of the fisheries sector
For the past two decades, the development
of the fisheries sector has been impacted
negatively by various factors: (i) the drought
which affects the inland fisheries; (ii) the
overexploitation of marine resources; (iii)
high input costs and trade taxes induced
by the CFA devaluation imposed in 1994
as part of the structural adjustment
program; (iv) the sector does not benefit
from any government subsidies notably
those which used to be available for fuel
or fishing gear imports.
♦ FAO. World fisheries statistics (2002)
inland fisheries ♦

�0 Tropical river fisheries valuaTion: background papers To a global synThesis
Chad
general information ♠
♠ Economic and demographic data from UN and World Bank sources; fisheries data from FAO. World fisheries statistics (2002)
Main rivers and floodplains Lake Chad Basin rivers and floodplains Chari-Logone system: Length (cum.): 1 300 km Floodplains (Yaéré): 4 000 km2
Salamat river and floodplain (Chad) Salamat river: 950 km Fringing floodplain: 4 000 km2
Total annual catches: 22 000 t
inland fisheries ♣
Inland catches as percentage of total catches: 100Degree of exploitation (1987):
inland catch range (t): 50 000 – 100 000inland potential catch range : n.a.
♣ Source: Van den Boosche and Bernacsek (1990, Vol. 3, Table 2, p. xii)
fisheries data ♦
Production Imports ExportsTotal
supplySupply per
capita
‘000 tnnes (fresh weight) kg/yr
Fish for direct human consumption 90 0.7 n.a. . 6.5
Fish for animal feed and other uses . . . . .
Surface area: 1 284 000 km²
Population (1995): 6 515 000
GDP (1995): US$ 1.185 million
GDP per capita (1995): US$ 187
Gross Value of Agricultural Output (estimated 1995): US$ 577 million
Gross Value of Agricultural Output (estimate 1995): EURO 800 million
Employment (1996):
Fulltime professional fishers: 20 000
Seasonal fishers: 150 000
Gross Value of Fisheries Output (first sale value): n.a.
Trade (1995):
Value of imports: US$ 0.9 million (estimation)
Value of exports (estimation): n.a.

chapTer � �1
inland fisheries ♦
♦ FAO. World fisheries statistics (2002)
general overview
Until recently, fisheries were ranked
third in the national economy of Chad,
after agriculture and livestock. Chad
was then one of the five largest pro-
ducers of inland fish in Sub-Saharan
Africa with an annual production above
100,000 tonnes. However, severe
drought and political instability have
caused a relative decline in the
production. It is estimated that the
production in 1996 was probably close
to 90,000 tonnes, with 30,000 tonnes
from the Lake Chad and the remaining
60,000 tonnes from the Chari-Logone
River system.
economic contribution of fisheries activities
Nowadays the fisheries sector con-
tributes approximately 10 per cent of
the GNP. A large number of farmers and
herders are now involved in fisheries
activities and numerous migrant (foreign)
fishers are operating from the Lake
Chad and other waterbodies. The exact
number of fishers, however, is unknown.
Three categories of fishers can be
distinguished:
• full-time professional fishers;
• seasonal fishers; and
• occasional fishers.
The first category consists mainly of
foreign (from Mali, Nigeria, Ghana, Benin),
well-equipped professional fishers that
operate from the Lake and the rivers.
The second category of fishers is mainly
from Chadian households; they fish on
a seasonal basis essentially during the
receding season (Nov. - June). These
are essentially farmers and herders
who have been affected by the drought.
Occasional fishers adopt fishing as a
complementary activity for subsistence.
Trade and commercialization
Globally men are involved in the fishing
activities while women are involved in
fish processing and trading. Although
the commercialization is still relatively
poorly organized, it is recognized that
fishing can generate significant revenues
and it is often observed that fishers are
better off than farmers.
There are numerous local (rural and
urban) markets where catches are
commercialized. Demand is globally
higher than supply. The quality of the
products sold in these markets is,
however, particularly low, especially in
comparison to the products exported
to the foreign markets in Nigeria, CAR,
and Cameroon. Domestic consumers
prefer fresh product. Unfortunately,
expansion of commercialization is
largely constrained by the scarcity of
processing and transport infrastructure.
The consumption per capita is still
relatively low, at 6.5 kg/yr.

�� Tropical river fisheries valuaTion: background papers To a global synThesis
The GamBia
general information ♠
♠ Economic and demographic data from UN and World Bank sources; fisheries data from FAO. World fisheries statistics (2002)
Main riverThe Gambia RiverLength: +480 kmAnnual catches: 1 400 – 3 500 t (1977-82)Potential yield: 2 000 – 8 000 t (Welcome 1979)
inland fisheries♣
Inland catches as percentage of total catches: 19% (1987); 11% (1999)♥
Degree of exploitation (1987): inland catch range (t): 1 400 – 3 500 inland potential catch range: 2 000 – 8 000
♣ FAO. World fisheries statistics (2002)♥ Van den Boosche and Bernacsek (1990, Vol. 2, Table 2, p. xii)
fisheries data ♦
Production Imports ExportsTotal
supplyPer caput
supply
‘000 tonnes (live weight) kg/yr
Fish for direct human consumption 32.258 1.28 5.408 28.135 23.7
Fish for animal feed and other purposes . . . . .
Surface area: 10 600 km2
Population (1997): 1.189 millionGDP at purchaser’s value (1998): US$ 348 millionGross Value of Agricultural Output (1998): US$ 73 millionPCE per head (1998): US$ 252Water area (inland): 2 100 km2
Estimated employment (1998):Primary sector: 5 000Secondary sector: 25 000Gross value of fisheries output (at ex-vessel prices): US$ 4.4 millionTrade (1998):Value of imports: US$ 135 000Value of exports: US$ 2.72 million
♦ FAO. World fisheries statistics (2002)
Gambia has considerable quantities of brackishwater and freshwater fish. Some of the most abundant species are tilapia (Oreochromis niloticus), African bonytongue (Heterotis niloticus), upsidedown catfish (Synodontis gambensis), catfish (Clarias
lazera), bagrid catfish (Auchenoglanis
occidentalis), Labeo senegalensis and Chrysichthus furcayus. Artisanal fishing activities fall into three categories: marine,
lower river and upper river. The lower portion of the River Gambia has a brackishwater regime and marine fish are caught in this area, particularly bonga, catfish, threadfins, barracuda, sole and shrimps. The shrimp (Penaeus duorarum) and tonguesole (Cynoglossus senegalensis) caught along the river are purchased by industrial fishing companies for processing and export to Europe.
river fisheries ♦

chapTer � ��
Ghana
general information ♠
♠ Economic and demographic data from UN and World Bank sources; fisheries data from FAO. World fisheries statistics (2002)
Main rivers and floodplainse Volta river:
Length (Black Volta): 650 kmAnnual catches (1960): 4 000 t a
Oti river: Length: 900 kmTano river: Length: 625 kmPra river: Length: 445 km
e Compiled from Nerguaye-Tetteh et al. (1984) and Van den Boosche and Bernacsek (1990)
a total catch of the river clam Egeria radiata
inland fisheriesa
Inland catches as percentage of total catches: 14% (1987); 16% (1999) ♣
Degree of exploitation (1987): inland catch range (t): 40 000 – 53 000b
inland potential catch range : 40 000 – 65 000b
b including lakes, reservoirs, floodplain and rivers♣ FAO. World fisheries statistics (2002)a Van den Boosche and Bernacsek (1990, Vol. 2, Table 2, p. xii)
fisheries data ♦
Production Imports ExportsTotal
supplyPer caput
supply
‘000 tonnes (fresh weight) kg/yr
Fish for direct human consumption 477.2 14.6 32.2 465.6 26.1
Fish for animal feed and other purposes . 9.0 . 9.0 .
Area: 238 539 km²
Population (1997): 17 832 million
Gross Domestic Product (1996): US$ 5.42 billion
GDP per caput (1996): US$ 307
Estimated employment (1996):
Primary sector: 110 000
Secondary sector: 290 000
Gross value of fishery (1996): US$ 380 million
Trade (1996):
Value of imports: US$ 19.5 million
Value of exports: US$ 56 million
�� Tropical river fisheries valuaTion: background papers To a global synThesis
♦ FAO. World fisheries statistics (2002)
inland fisheries ♦
general overview
The inland sources of fish comprise
50 lagoons with a total area of 40,000
hectares, rivers of about 6,000 km in
length and lakes covering about one
million hectares. The Volta Lake is
the largest; it covers about 900,000
hectares with a shoreline of 8,400 km.
Fishing on the Volta Lake is done by
about 15,000 small (3-7 m) planked
canoes, mostly non-motorized, although
outboard engines are becoming more
common. The sector is wholly artisanal
and employs about 85,000 fishers
and traders. The annual production is
about 74,000 tonnes, accounting for
16 per cent of the annual total national
production. The most common fishing
gears are handlines and gillnets for
tilapia, lates and alestes.
economic role of the fishing industry
The Ghanaian fisheries sub-sector
accounts for about five per cent of
the agricultural GDP. Fish is the major
source of animal protein for Ghanaians.
Per caput consumption of fish is about
26 kg, representing 60 per cent of all
animal protein. In 1996, fish and fish
products, including shrimps, tuna loins
and canned tuna contributed US$ 56
million or about 21 per cent of the total
non-traditional exports of Ghana. In
total, the industry supports up to 1.5
million people, about 10 per cent of the
total population.

chapTer � ��
ivory CoasT
general information ♠
♠ Economic and demographic data from UN and World Bank sources; fisheries data from FAO. World fisheries statistics (2002)
Main rivers
(as part of the Atlantic coastal basin)Sassandra River: Length: 650 kmBandama River Length: 1 050 km
inland fisheries♣ Inland catches as percentage of total catches:
27% (1987); 20% (1999)a
Degree of exploitation (1987): inland catch range (t): 36 000inland potential catch range (t): 62 000
♣ Economic and demographic data from UN and World Bank sources; fisheries data from FAO. World fisheries statistics (2002)a Van den Boosche and Bernacsek (1990, Vol. 2, Table 2, p. xii)
fisheries data ♦
Production Imports Exports Total supply
Per caput supply
‘000 tonnes (live weight) kg/yr
Fish for direct human consumption 67.6 213.1 104.1 156.6 11.1
Fish for animal feed and other purposes 20.0 . 1.0 . .
Surface area: 322 455 km²
Population (1996) : 14.8 million
GNP (1996): US$ 10.753 billion
GNP per capita (1996): US$ 727.1
Gross Value of Agricultural Output (1996 estimates): US$ 3.086 billion
Estimated employment (1997):
Primary sector: 30 000
Secondary sector: Approx. 80 000
Gross Value of Fisheries Output (1995) (first sale value): US$ 50 million
Trade (1997 estimated):
Import values: US$ 167.7 million
Export values: US$ 200.4 million
♦ FAO. World fisheries statistics (2002)
inland fisheries ♦
The exact inland fisheries production
remains unknown. It is thought to be
around 18,500 tonnes per year, essentially
constituted by Tilapia nilotica (50-70%).
Fishers (estimated to be around 6,000)
employ small, usually non-motorized
boats. Fishing techniques and gears are
diverse, including driftnets, castnets,
traps and hooklines.

�� Tropical river fisheries valuaTion: background papers To a global synThesis
niGer
general information ♠
♠ Economic and demographic data from UN and World Bank sources; fisheries data from FAO. World fisheries statistics (2002)
Main river and floodplainNiger river
Length: 600 km (including 140 km of border shared with Benin)Annual catches: 5 000 – 7 000 t
Niger floodplain:Surface: 90 000 ha (of which 27 000 ha are permanent)
inland fisheries ♣
Inland catches as percentage of total catches: 100Degree of exploitation (1987):
inland catch range (t): 2 500 – 16 000inland potential catch range: 4 000 – 16 000
♣ Source: Van den Boosche and Bernacsek 1990, Vol. 3, Table 2, p. xii)
fisheries data ♦
Production Imports ExportsTotal
supplyPer caput
supply
‘000 tonnes (live weight) kg/yr
Fish for direct human consumption 4 156 175.1 6.3 4 337.4 0.47
Fish for animal feed and other purposes . 35 . . .
Surface area: 1 287 000 km²
Population (1996): 9 286 860
GDP at purchaser’s value (1996): US$ 1.533 billion
PCE per head (1996): US$ 216
Gross Value of Agricultural Output (1997): US$ 600.6 million
Estimated employment in fisheries (1996): 2 000 households (approx.)
Primary sector: 73 000
Gross Value of Fisheries Output: n.a.
Trade (1999):
Value of imports: US$ 168 427
Value of exports: -
fisheries overview
Niger is a landlocked country. Its fish
production comes from its inland
waterbodies i.e. rivers (e.g., Niger and
Komadougou Yobé rivers), lakes (Lake
Chad and Lake Madarounfa), permanent
and seasonal ponds, and artificial
reservoirs. The total area is about 70,000
hectares (1993) while it was probably
around 400,000 hectares before 1974. This
reduction is mainly due to the effects of the
drought, which has even in some cases
caused the complete disappearance of
waterbodies, as is the case with the Niger
part of the Lake Chad. This degradation,
combined with the construction of dikes
(for irrigation purposes) and the absence of
inland fisheries ♦

chapTer � ��
coherent policies and regulations of water
resources uses and fisheries management
at the national level has resulted in the
constant decline of fish production since
1981 (16,400 t in 1972; 8,000 t in 1980;
6,000 t in 1982; and between 2,000 and
4,100 t/yr since 1990).
The fishers
The professional fishers who exploit the
various waterbodies come from 2,000
households. They use gillnets, hooklines,
harpoons, castnets, traps, clapnets and
seines. The low catches and the necessity
to recover the high costs of the fishing gear
force them to use prohibited gears and to
fish during closed season with obvious
negative effects on the resources. Some
other fishers practice farming and herding
activities. They fish (for subsistence) mainly
during the period of low activity on farms.
Most of the boats are non-motorized
pirogues (the few motorized boats being
used for transportation).
Trade and commercialization
Per capita fish consumption is extremely
low. In 1996 the average consumption
of fish was 0.47 kg/person/yr while that
for meat was 14 kg/person/yr. In urban
centres, fish consumption can be slightly
higher (0.8 to 1.2 kg/person/yr). This low
consumption results from a combination
of different cultural and socioeconomic
factors: the lack of infrastructure for
the transport, commercialization and
distribution of fish, diet habits, scarcity
and high price of fish products. Imports
from Mali, Burkina Faso and Nigeria and
exports of dried fish to Nigeria or Benin
have been both modest and stable over
the last few years. Imports of marine fish
stopped just after the CFA devaluation in
1994 and have not yet resumed.
state of the sector
Since 1994, the total annual production
has not exceeded 4,500 tonnes. The
annual variation simply reflects the flood
volumes, the local rainfall levels, and the
water level of Lake Chad. Some ponds
do present significant potentials but are
usually underexploited. Most of them have
no management plan, the activity being
simply limited by the remoteness of the
waterbody and the distance from market
or urban centers.
economic role of the fisheries
The fishery sector contributes about
one per cent to the GNP (in good years).
However, it plays an important role in terms
of food security for the fishers’ households
(self-consumption estimated to be about
20 per cent) and the consumers. Fishing
activities allow the generation of constant
revenue for both fishers and traders.
Market dynamics
The (small) Niamey market is the main commercial center for fish products in Niger. Niger consumers prefer fresh fish rather than dried or smoked fish. Imports (175 tonnes in 1996) are essentially for foreign consumers. The supply of fresh fish varies depending on the fishing season. The flood recession season (February-July) is the period of greatest abundance (and low price). In contrast, during the flood season (December-February) the supply is lower and prices higher. The prices are determined by market mechanisms despite an official price regulation by the Ministry of Commerce. Globally the supply is insufficient (less than 0.5 kg/person/yr), but the demand is also low due to the low purchasing power of the consumers.
♦ FAO. World fisheries statistics (2002)

�� Tropical river fisheries valuaTion: background papers To a global synThesis
niGeria
general information ♠
♠ Economic and demographic data from UN and World Bank sources; fisheries data from FAO. World fisheries statistics (2002)
Main river and floodplains e
Niger River:Length (in Nigeria): 1 300 kmFloodplains: 3 000 km2
Annual catches: 13 450 t (1966)Niger outer delta
Annual catches: 19 000 t (1980)Benue River
Length: 1 440 kmFloodplains: 1 810 km2
Annual catches 10 000 (1966)Cross River
Annual catches 4 000 – 8 000 (1975)Other rivers and mangroves
Annual catches: 13 000 t (1980)Other floodplains: 300 km2
Oueme river floodplain (deltaic): 100 km2
Annual catches: 5 700 t (1976)
e Compiled from Ita et al. (1985) and Van den Boosche and Bernacsek (1990)
inland fisheries ♣
Inland catches as percentage of total catches: 44% (1987); 41% (1999)*
Degree of exploitation (1987): inland catch range (t): 110 000 – 130 000a
inland potential catch range : 200 000 – 250 000a
a including lakes, reservoirs, floodplain and rivers* FAO. World fisheries statistics (2002)♣ Van den Boosche and Bernacsek 1990, Vol. 2, Table 2, p. xii)
fisheries data ♦
Production Imports ExportsTotal
supplyPer caput
supply
‘000 tonnes (live weight) kg/yr
Fish for direct human consumption 383.4 227.14 9.14 602.41 5.8
Fish for animal feed and other purposes . . . . .
Population (1997): 103.9 million
GDP at 1984 factor cost (1997): US$ 1.36 billion
PCE per head (1997): US$ 248
Gross Value of Agricultural Output (1997): US$ 526 million
Estimated employment (1997):Primary sector: 70 000Secondary sector: n.a.Gross Value of Fisheries Output (at ex-vessel prices):
US$ 180 million (estimated)
Trade (1997):Import values: US$ 159 millionExport values: US$ 8.4 million

chapTer � ��
general overview
The inland capture fishery is basically
artisanal, exploiting the major rivers,
their tributaries, natural lakes and various
reservoirs. The catch is dominated by
Lates spp., Gymnarchus spp., Synodontis
spp., Clarias spp. and Chrisychthys spp.
The total surface area of freshwater bodies
in Nigeria has been estimated at almost
15 million hectare. This includes rivers,
flood plains, wetlands and lakes (natural
and artificial).
utilization of the catch
There is a huge supply-demand gap
for fish and fishery products in Nigeria:
400,000 tonnes of supply against
800,000 tonnes of demand (1997). This
is in spite of its significance in the local
diet and its favorable price compared to
its substitutes. Fish alone contributes on
average 20 - 25 per cent of per caput
animal protein intake, and could be as
high as 80 per cent in coastal and riverine
communities. The total supply from all
sources – artisanal coastal, brackishwater,
inland waters, aquaculture, industrial
coastal, and imports – is, therefore,
consumed locally, with the exception of
high quality shrimps graded for export.
The predominant species in the landings
of the coastal artisanal fishery – the
pelagic – are preferred smoked. There
is, therefore, a huge processing industry
– dominated by women – along the entire
coast. It is characterized by individual,
small-scale enterprises, mostly home-
based, but the products are aggregated
in markets by wholesalers, also women,
who take over the distribution to inland
markets, up to the northern fringes of the
country. There is an equally important and
similar trade in the opposite direction, for
processed fish from Lake Chad and some
important rivers in the north. Clarias spp.
from Lake Chad is also preferred smoked.
The processing and packaging has been
improved over the years, such that it has
the highest shelf life among the local
products and is available in the markets
of the very densely populated cities of the
southern region.
The major freshwater species – tilapia,
Chrysichthys, Gymnarchus, Lates,
Heterotis – are preferred fresh, but they
are available fresh only at high cost.
For reservoirs and lakes that are within
or close to major human settlements,
markets develop around the landing sites
and the product is usually disposed of
within hours of landing, partly to direct
consumers and partly to marketers
who may retain the fish for a few days.
Most other landing sites in the inland
water system are remote and facilities
for preservation other than smoking are
non-existent. The smoked product ends
up in roadside markets where patronage
is anything but guaranteed. The value of
such smoked products vis-à-vis the fresh
equivalent depends on the species and
the quality of processing.
state of the inland fisheries resources
The inland fisheries resources are also
highly depleted, especially the rivers where
illicit fishing practices are rife, and erosion
and siltation recur annually. The reservoirs
and lakes are in a better state, with various
management measures being applied.
Natural productivity is being enhanced
by restocking with high quality, hatchery-
produced fingerlings, and fishing effort is
under some sort of control. An example
inland fisheries ♦
100 Tropical river fisheries valuaTion: background papers To a global synThesis
here is the Nigerian-German (GTZ) Kainji
Lake Fisheries Promotion Project, which
has put in place a management plan for
the sustainable exploitation of the fisheries
resources of the lake.
economic role of the fishing industry
For the entire artisanal coastal and inland
sectors, fishing is the major source of
livelihood. A total of 500,000 coastal
and 200,000 inland fishers are recorded
as primary producers. For such a well-
integrated industry, the total employment
could well be five-fold. The industrial
sector provides employment for about
100,000 Nigerians in various fields such
as management, engineering, vessel
operation, distribution and marketing.
Output of the fishing industry is very
important economically. Although less
than 50 per cent of the total supply is
produced locally, it accounted for 1.71 per
cent of the 38.7 per cent contributed by
agriculture to GDP in 1997.
♦ FAO. World fisheries statistics (2002)

chapTer � 101
Surface area: 1 240 278 km²
Population (1999): 11 039 000
GDP at purchaser’s value (1999): US$ 2.568 billion
Fisheries GDP (1999): US$ 24.14 million
Fisheries GDP / GDP (1996): 0.94%
Surface of waterbodies 20 000 km²
mali
general information ♠
♠ Economic and demographic data from UN and World Bank sources; fisheries data from FAO. World fisheries statistics (2002)
Main river and floodplains e Niger river
Length: 3 000 kmAnnual catches: 5 000 – 7 000 t
Central delta of Niger RiverSurface area: Annual permanent equivalent: 16,000 km2
Annual catches: 55 000 – 75 000 t (1980s)Potential yield: 75 000 – 150 000 t/yr
Senegal RiverLength: 1 400 kmAnnual catches: 2 000 t (1980s)Main tributaries
Faleme River: 300 kmBakoye River: 300 kmBaoule River: 350 km
e Compiled from Van den Boosche and Bernacsek (1990)
inland fisheries ♣
Inland catches as percentage of total catches: 100Degree of exploitation (1987):
inland catch range(t): 55 000 – 100 000 inland potential catch range: 100 000 – 200 000
Number of fishers: 55 000 (in 1975); 73 000 (in 1997) §
♣ Van den Boosche and Bernacsek (1990, Vol. 2, Table 2, p. xii)♥ FAO. World fisheries statistics (2002)
fisheries data ♦
Production Imports ExportsTotal
supplyPer caput
supply
‘000 tonnes (live weight) kg/yr
Fish for direct human consumption 93 056 900 661 93 294 8.5
Fish for animal feed and other purposes 5 710 . . 1 143 .
Estimated employment (1998):Primary sector: 3 000Secondary sector: 260 000Gross value of fisheries output (1999): US$ 350 millionTrade (1999):Value of imports: US$ 566 millionValue of exports: US$ 535 million

10� Tropical river fisheries valuaTion: background papers To a global synThesis
fisheries overview
In Mali, the annual production is greatly dependent on the flooding of the two main rivers: the Niger and the Senegal. For instance, in 1969-70, when these two rivers were strongly affected by the severe Sahelian drought, the production was only 87,000 tonnes; yet in the period 1984-85 that was characterized by a large flood, the production reached 350,000 tonnes.
The Niger River (1,700 km in Mali) constitutes the main fishing zone, thanks to the central delta and the numerous lakes and ponds that are inundated during the flooding season. In good flooding years, the total flooded area may reach 30,000 km2. Three main fishing grounds can be distinguished:
• The Niger River (and its main tributary: The Bani river) characterized by important variations in their volume of discharge between the receding and flooding periods
• The delta floodplains that are inundated during the flooding seasons and dry out after the receding season
• The seasonal ponds connected to the river during the flooding period.
The fishers
The total number of fishers is probably around 73,000 (1997). Three main categories of fishers can be distinguished:
• The fishers-farmers (They allocate a large part of their labor and income to agricultural activities and use fishing products to complement their subsistence economy.)
• The non-migrant professional fishers (Bozo, Somono) (Fisheries activities
represent an important element of their income, but they are also involved in agricultural activities.)
• The migrant professional fishers who depend exclusively on fishing activities for their livelihoods.
catches commercialization and trade
Due to the lack of infrastructure, a large part (75%) of the catches is com-mercialized as smoked, burned or dried fish. The production is then transported to Mopti. In 1999, the average price in Mopti was 1,250 FCFA/kg (US$ 1.9/kg). The production was used as follows:
- 3,760 tonnes for domestic markets;
- 927 tonnes for export to Ivory Coast (808 tonnes) and Burkina Faso (119 tonnes) for the total commercial value of 1,161,278,850 FCFA (US$ 1,772,945), with the added value of about CFA 30 billion; and
- 1.143 tonnes for animal consumption.
At the same time, 1.891 tonnes of fresh fish were traded locally. In addition, 2.6 tonnes were exported to other destinations at the average price of 676 FCFA/kg (US$1/kg). The per capita consumption is still relatively low at 8.5 kg/yr.
economic role of fisheries activities
Fishing is a very important economic activity in Mali, especially in rural areas. It directly concerns 260,000 persons, or 3.6 per cent of the rural population, and it is estimated that overall more than 500,000 people are directly or indirectly dependent on this activity (including fishing gear repairers or sellers, fish traders, and fish processors).
♦ FAO. World fisheries statistics (2002)
inland fisheries ♦

chapTer � 10�
Surface area: 196 722 km²
Population (1996): 8 530 000
GDP at purchaser’s value (1996): US$ 4.795 billion
Gross Value of Agricultural Output (estimated 1996): US$ 482 million
PCE per head (1996): US$ 290
Estimated employment (1998):
Primary sector: 60 400 amongst whom 3,350 industrial fishers
Secondary sector: n.a.
Gross value of fisheries output (at ex-vessel prices): US$ 350 million
Trade (1996):
Value of imports: US$ 11.3 million
Value of exports: US$ 310.5 million
seneGal
general information ♠
♠ Economic and demographic data from UN and World Bank sources; fisheries data from FAO. World fisheries statistics (2002)
Main riversSenegal River
Total length: 1 640 kmLength (in Senegal): 1 400 km
Sine-Saloum RiverLength: 100 kmTotal annual catches: 6 000 – 8 000 t
Casamance River Length: 325 kmTotal annual catches: 12 000 – 15 000 t (1987)
inland fisheries ♣
Inland catches as percentage of total catches: 5% (1987); 23% (1999)♥
Degree of exploitation (1987): inland catch range (t): 13 000 – 60 000 inland potential catch range (t): 100 000
♣ FAO. World fisheries statistics (2002)♥ Van den Boosche and Bernacsek (1990, Vol. 2, Table 2, p. xii)
fisheries data ♦
Production Imports ExportsTotal
supplyPer caput
supply
‘000 tonnes (live weight) kg/yr
Fish for direct human consumption 383.2 17.0 145.0 252.0 29.9
Fish for animal feed and other purposes 53.0 . 53.0 . .

10� Tropical river fisheries valuaTion: background papers To a global synThesis
In the 1950s, rainfall in Senegal was abundant and river floods regular. At that time, inland fisheries provided more than 80 per cent of animal protein intake in the regions where fishery activities were taking place. During the 1970s and 1980s, however, the drought and various dams built for purposes of flood control have dramatically affected the inland fisheries production. In 1996, inland fishery catches were 47,500 tonnes.
In the inland regions far from the coast, most fish is consumed in dried and smoked form. Recently, however, Dakar has become the first region for consumption of Kethiakh (smoked fish) distributed through the two main retailer markets of Thiaroye and Castor.
♦ FAO. World fisheries statistics (2002)
inland fisheries ♦

chapTer � 10�
Surface area: 72 326 km²
Population (1998): 4.568 million
GDP at purchasers’ value (1998): US$ 699 million
GDP per caput (1998): US$ 155
Estimated employment (1994):
Primary sector: About 80,000 - 100,000 full-time, plus additional 60,000 part-time, middlemen and processors
Secondary sector: n.a.
Gross Value of Fisheries Output (at ex-vessel prices 1998): US$ 30 million
Trade (1998 estimated):
Value of imports: US$ 3.2 million
Value of exports: US$ 13.6 million
sierra leone
general information♠
♠ Economic and demographic data from UN and World Bank sources; fisheries data from FAO. World fisheries statistics (2002)
Main rivers and floodplains♣
Rivers (Sewa, Jong, Little Scarcies, Rokel, and Moa rivers)Total length (cum.): 1,280 km
River floodplains Surface area (cum.): 10,000 km2
inland fisheries♣
Inland catches as percentage of total catches: 30 (1987); 30 (1999)eDegree of exploitation: inland catch range (t): 16,000 (1987) – 10,000 (current)a
inland potential catch range (t): 11,000 – 14,000 a
a including lakes, reservoirs, floodplain and riverse FAO. World fisheries statistics (2002)♣ Compiled from Balarin 1985 and Van den Boosche and Bernacsek (1990)
fisheries data ♦
Production Imports ExportsTotal
supplyPer caput
supply
‘000 tonnes (live weight) kg/yr
Fish for direct human consumption 59 437 2 282 9 120 52 599 12.3
Fish for animal feed and other purposes . . . . .

10� Tropical river fisheries valuaTion: background papers To a global synThesis
inland fisheries ♦
♦ FAO. World fisheries statistics (2002)
general overview
Sierra Leone has a dense drainage
network comprising the main river
systems, which empty into the Atlantic
Ocean. Inland lakes also include Lake
Sonfon, Lake Mape and Lake Mabesi.
Species caught include mullets, catfish
(Clarias spp.) tilapia, oysters and clams.
None of these have been commercialized
as the fishing methods have to be
substantially improved. Everything is
done at the subsistence level. Production
estimates have not been worked out
although a conservative estimate can be
put at about 10,000 tonnes. This sector
has been severely disrupted as a result
of the civil war in the country with many
areas not under government control for
the past five years. With the return of
peace, it can be considered a priority
for development.
utilization of the catch
In the industrial sector, the catch landed
in Freetown is sold frozen, and it is
also distributed frozen to consumers
by traders. Some of the frozen fish is
later thawed, smoked and sold in local
markets for immediate consumption, or
is hard-smoked and packed into baskets
for transportation to the hinterland. The
previous, well-organized trade in frozen
fish by insulated trucks appears to be
suspended for the time being. At the
same time, the massive displacement
of inhabitants has resulted in a big drop
in the inland market for fish. The bulk of
the catch is, therefore, utilized within the
capital city Freetown and its environs.
It is hoped that, with the signing of the
Lome peace accord and eventually the
maintenance of stability and security,
the inland market will reappear and kick-
start fish trade once again.
state of the industry
The artisanal or small-scale fisheries
sector, notwithstanding the various
constraints, continues to contribute
significantly to the protein intake of the
population. From the limited figures
available, there seems to have been a
continuous drop in the gross value of
the industrial fishery (export and locally-
landed fish) from 1991 to 1996. Much
as the artisanal fishery contributes
significantly to feeding the people,
the industrial fishery could contribute
significantly to foreign exchange
earnings.

�07
Jane K. TurpiePercy FitzPatrick InstituteUniversity of Cape TownRondebosch 7701, South AfricaTel: 650 3302 Fax: 650 [email protected]
The Valuation of Riparian Fisheriesin Southern and Eastern Africa
C H A P T E R 3
10� Tropical river fisheries valuaTion: background papers To a global synThesis
Contents - Chapter 3
Summary 109
1. Introduction 110
2. RiparianFisheriesinSouthernandEasternAfrica:ContextforValuation 111 2.1 The Scale and Importance of Freshwater and Riparian Fisheries 111 2.2 Contribution to Livelihoods 112 2.3 The Dynamic Nature of Fisheries 112 2.4 Control and Sustainability of Fishery Values 113
3. RiparianFisheriesValuationStudies 113 3.1 Rufiji Floodplain and Delta 114 3.2 Kilombero Floodplain 117 3.3 Lower Shire River 117 3.4 Zambezi-Barotse Floodplain 119 3.5 Zambezi-Chobe Floodplain System 120 3.6 Chobe-Lake Liambezi System 121 3.7 Okavango River, Namibia 122 3.8 Zambezi Delta 123 3.9 Mutshindudi River 124 3.10 Crocodile River 124
4. ValuationofPotentialChangesDuetoWaterDevelopmentProjects 125 4.1 Tana River 126 4.2 The Lesotho Highlands 127
5. Discussion:MethodsforValuationofRiparianFisheries 129 5.1 An Appraisal Framework for Valuation 129 5.2 Economic Valuation Techniques 130 5.3 The Market Value Approach 130
5.3.1 The Quantification of Catch 1315.3.2 Measurement of Price 1315.3.3 Measurement of Production Costs 132
5.4 Survey Methods 1325.4.1 Focus Group Discussions and Key Informant Interviews 1325.4.2 Household Surveys 134
5.5 Analysing and Interpreting Values 1365.5.1 Issues of Time, Scale and Sustainability in Value Calculation 1375.5.2 Considering Potential Value 139
5.6 Estimating Impacts on Value Due to Environmental Change 139
5.7 Should Valuation Be Carried out More Efficiently or Rapidly? 140
References 143
chapTer � 10�
SUMMARY
This paper was commissioned by the
WorldFish Center as part of a global survey.
It reviews the published and gray literature
concerning economic valuations of river
fisheries in eastern and southern Africa,
extracting the best available information
on their direct economic values and on the
impacts of changes in water management
on this value. It then assesses the methods
used and makes recommendations regarding
approaches to be used in future. The review
concentrates on rivers with their associated
floodplains and major deltas. The values and
issues associated with estuaries and lakes
are not considered.
Riparian fisheries in eastern and southern
Africa tend to be small-scale, labor intensive,
artisanal fisheries. They have received
relatively little attention because they have
limited commercial value compared to marine
and lacustrine fisheries. However, they make
an important contribution to subsistence
income. Because they are highly seasonal,
they tend to form part of a risk-spreading
strategy, as one of several activities that
households engage in. Fishing can provide
a fallback source of food and income in years
when local rainfall events lead to crop failure.
There is a concern that the capacity for
fisheries, which forms part of a risk-spreading
strategy, is being adversely affected by
development processes, which will lead
to overexploitation. Fisheries in the region
consist of three types: primarily subsistence
fisheries; semi-commercialized fisheries; and
primarily commercial fisheries in which, if
controls are weak, can become overexploited
with a predominance of outsiders. This
tendency is exacerbated by a general trend
in weakening of traditional leadership and
control of natural resources. The stage of
development and status of a fishery should
be taken into consideration in the execution
and interpretation of valuation studies.
There have been relatively few attempts at the
comprehensive valuation of riparian fisheries
in the region, and almost none of these
studies are published. Fisheries have been
valued in about 15 large river, floodplain or
delta systems: the Tana River, Rufiji floodplain
and delta, Kilombero floodplain, Lower Shire
wetlands, Barotse floodplain, Okavango
River, Zambezi-Chobe floodplain system,
Lake Liambezi, Zambezi delta, Orange River,
Komati River, Muthsindudi River, Lesotho
Highlands rivers and Crocodile River, and
results are summarized.
The valuation methods employed have all
involved fairly straightforward conventional
economic valuation based on market-based
methods. Many also included a degree of
livelihood analysis in which the contribution
of the fisheries to household livelihoods was
examined. Only two included economic
impact assessments.
Valuation of natural resource impacts has not
been a common practice in EIAs. However,
two of the above studies, the Lesotho
Highlands and Tana River studies, addressed
losses in downstream fishery values as a
result of proposed dam construction. Both
studies relied on the estimated changes in fish
supply made by biologists, before converting
these changes in supply into changes in
value. Although the Lesotho Highlands study
was based on relatively crude estimates of
the expected changes in fishery production,
it included sensitivity analysis relating to
demand elasticity, and risk assessment.
In market valuation, the quantification of
catches poses the largest challenge because
reliable statistics are often not available. This
requires comprehensive household surveys,
repeated at appropriate intervals. Most of the
studies reviewed had a similar approach to
data gathering in that they used a combination
of complementary methods, including focus
group discussions, key informant interviews
and household surveys. Subtle aspects of
110 Tropical river fisheries valuaTion: background papers To a global synThesis
the design of these instruments were crucial
to their success.
Values are calculated and presented in
a number of ways, and it is important to
consider the values in context. This requires
a much broader study than of fisheries alone.
A major problem with the existing studies is
the fact that they are based on a maximum
of one year’s data without taking interannual
variability into account, and so none of them
accurately assess the status of the fishery in
terms of its sustainability. Values could thus
be overestimated or underestimated when
considered over a longer term. The relationship
between catches and flows is very poorly
understood, and this hampers the estimation
of economic impact assessments.
Most of the studies reviewed were fairly
substantial undertakings. It has been
proposed that future studies ought to be
more rapid if more systems are to be
understood and valued. Various short-cut
methods have been attempted, but these
invariably compromise the quality of results,
as none of the studies was considered to yield
highly reliable results. In fact, baseline studies
in future should be more comprehensive
attempting to better understand the dynamics
of these fisheries, and rapid evaluations should
be designed for monitoring purposes.
�. INTRODUCTION
Fisheries represent one of the most important
benefits to society that aquatic systems
provide, often sustaining the livelihoods of
poor rural communities. There is a growing
concern that the manipulation of aquatic
systems to provide water for external uses,
such as urban consumption and irrigated
agriculture, threatens the production of
fishery resources, and thus the livelihoods
of many users. However, decisions about
water allocation need to be well informed if
the right tradeoffs are to be made. It is thus
important to understand the contribution
that aquatic ecosystem goods and services
make to food security, local livelihoods and
local and national economies, if these are
to be taken into account in water allocation,
policies, institutions and governance, and
also in schemes to maximize such values.
It is also important in other cases where
compensation for a loss of fishery production
is required.
However, valuation of natural resources has
only taken off relatively recently, and there
are still vast gaps in our knowledge as to
how freshwater fisheries contribute to local
livelihoods and economies. This is especially
true in eastern and southern Africa, where the
lack of knowledge can be largely ascribed to
a general lack of capacity not only in terms
of trained professionals but also in terms
of appropriate tools and methodologies
for developing world situations. Several
studies have taken place within the last
decade, however, which have started to
explore different approaches and adapt
various methods to the problem of valuing
fisheries, and these have yielded a number
of estimates of varying quality. Enough work
has now been generated to get an idea of
the types of values involved, to evaluate the
methodologies used, to address the way
in which future valuation studies should be
carried out, and particularly, to consider
how valuation can best be applied in project
analyses. This study was thus undertaken,
with the following purposes:
• To review published and gray literature
concerning economic valuations of river
fisheries in southern and eastern Africa.
• To extract the best available information
on the direct economic value of these
fisheries, as well as information on the
wider social value accrued through
processing and marketing activities.
chapTer � 111
• To extract the best available information on
the economic impact of any decreases in
fisheries catches due to dam construction,
water abstraction, or other changes in
water management.
• To assess the methodologies used in these
studies and provide recommendations
on the most suitable for future use, with
modifications as appropriate for different
sites and circumstances.
Not only does the review concentrate on
rivers, but it also covers their floodplains,
floodplain lakes and major deltas, all of which
are integral parts of the flowing system and
affected by water allocation decisions. These
will be collectively referred to as riparian
fisheries. Estuaries should also fall into this
grouping, but they have not been included
here because they introduce another level of
complexity (See, for example, Lamberth and
Turpie 2003). The fisheries associated with
large lakes (e.g., Lake Victoria, Lake Malawi)
and reservoirs or dams (e.g., Lake Kariba)
are not considered here. The review begins
by giving a brief background to southern
and eastern African river fisheries, and their
socioeconomic context. It then describes
existing case studies on the value of fisheries
and the impact of dams on fishery values,
before discussing methodological issues and
making recommendations for future studies.
2. RIPARIAN FISHERIES IN SOUTHERN AND EASTERN AFRICA: CONTEXT FOR VALUATION
�.1 The scale and importance of freshwater and riparian fisheries
With the exception of semi-industrial fisheries
in the great lakes, most freshwater fisheries
in Africa are small-scale and labor-intensive
artisanal fisheries. An estimated 2 million
fishers are believed to be active in the artisanal
sector, of which about 840,000 are in inland
fisheries. For each inland fisher, five people
are believed to be active in support functions
such as processing, transport, marketing and
production and maintenance of boats and
gear. Thus, about 2.5 million people derive
subsistence income from inland fisheries
(Tvedten et al. 1994). In addition to this is the
recreational fishing sector, which is especially
of growing importance in South Africa, where
it creates substantial economic activity in
areas that offer trout and bass fishing.
Despite the huge numbers of people that
depend on them, freshwater fisheries have
received little attention from governments
and international aid organizations, perhaps
because their commercial importance is
normally less than marine fisheries (Tvedten
et al. 1994). In most cases, much of the value
of freshwater fisheries is subsistence value
that has not been quantified because it does
not contribute to national income statistics.
For Africa as a whole, the estimated value
of inland fisheries is only 22 per cent that
of marine fisheries (Bonzon 1993). This
discrepancy is much larger in South Africa,
Angola and Namibia, which have highly
productive marine fisheries and lack any
major inland waters. Indeed, inland fisheries
are given very little attention in Namibia’s
Ministry of Fisheries, and in Botswana and
Angola all fisheries are relegated to the
Ministry of Agriculture (Tvedten et al. 1994).
In eastern Africa, riparian fisheries are small
in terms of their total output when compared
to lake fisheries. Another factor that seems to
discourage attention is the fact that riparian
fisheries tend to be more complex than other
fisheries because of their integral connection
to rainfall, catchment functioning and other
economic sectors (Tvedten et al. 1994).
11� Tropical river fisheries valuaTion: background papers To a global synThesis
�.� contribution to livelihoods
Inland fisheries are considered important
mainly as a source of subsistence income
and employment, rather than because they
provide a signif icant contribution to the
national economy. They are labor intensive,
and involve women and children (generally to
a greater extent than marine or lake fisheries).
Women are often involved in processing and
trade, though men are reputed to get more
involved with increasing commercialization
(Tvedten et al. 1994).
Riverine fisheries are usually seasonally
variable; this affects the way in which people
fish. Usually, people fish opportunistically,
and there are few full-time fishers in the
community. Indeed, fishing is usually part
of a risk-spreading strategy. This means
that rather than aiming to maximize income
by specializing in one activity at the risk of
starvation in bad years, households aim to
minimize risk, which means maintaining a
relatively steady (but possibly lower) income
or level of subsistence in spite of environ-
mental variability. Risk spreading is common
in poor households that lack the buffer of
sufficient cash in the bank or its equivalent,
cattle. Thus, most households involved in
freshwater fishing in the region engage in
numerous other activities, many of which
may usually take precedence, such as
farming, livestock and salt production. Fishing
is particularly important to poor households
in that it provides a food supply that is not
entirely dependent on local rainfall events
(LaFranchi 1996).
As long as fisheries form part of a risk
spreading strategy, they are likely to have
positive implications for management and
conservation of fish resources (Tvedten et
al. 1994). However, as fisheries in the region
become more developed, as described
below, their capacity to be utilized in this way
is diminishing.
�.� The dynamic nature of fisheries
Freshwater fisheries in the region can be
classified into different stages of development.
Scudder and Conelly (1985) described the
evolution of fisheries from a traditional to a
commercial state as follows:
Stage 1: Primarily subsistence. There are no
significant markets, and the fishery
is geared towards consumption or
local exchange. These are typical
in isolated areas with low population
density. They employ simple fishing
techniques (handlines, traps,
baskets, small weirs, cast or dip
nets), are seasonal, and usually
involve men, women and children.
Stage 2: Semi-commercialization. As po-
pulations increase, expanded
marketing leads to intensification,
new gear, and a higher catch per
unit effort (CPUE). Gill and seine nets
are commonly adopted in addition
to traditional methods. Trade starts
to take place via middlemen, and
women tend to be excluded from
commercialized fishing, remaining
mostly in the subsistence fishery.
Stage 3: Primarily commercialization. Further
development leads to intensive
exploitation for local and regional
markets. Outsiders move into the
fishery seeking profits, and the
fishery becomes dominated by gill
and seine nets, such that traditional
methods are rare. Total catch
increases, but CPUE drops as more
people enter the fishery. Marketing
is dominated by middlemen.
Stage 4: Overexploitation. In situations of
weak or inappropriate management,
the traditional fishery becomes
totally marginalized and the fishery

chapTer � 11�
becomes overexploited, such that
there are low returns to all and the
resource declines. There is also
a widening socioeconomic gap
between a large number of small-
scale fishers and a few successful
entrepreneurial fishers. Women
become excluded from the sector.
The last situation arises due to a
complex set of factors such as
water tenure, credit policies and
management strategies (Scudder
and Conelly 1985).
In the interpretation of valuation results, it is
critical to recognize the fact that fisheries are,
more often than not, undergoing dynamic
change. This means that total values and
their distribution do not remain constant over
time.
�.� control and sustainability of fishery values
Management has a strong influence on
value and the distribution of income. Due
to a range of social and political pressures,
there is a tendency in eastern and southern
Africa for a weakening or breakdown in
traditional leadership and control, and hence
in the effective control of natural resource
use on communal lands. Even where there
is relatively good control over the use of
other natural resources, access to fisheries
is often much less controlled, resulting in a
tendency toward overexploitation. Thus, it
is not surprising that most fisheries, which
are often the most difficult to control due to
spatial and temporal variability, have become
open access. It is, therefore, important to
be aware of both the state of management
and the stage of exploitation of a fishery in
any valuation assessment, as measurement
of current values yielded by fisheries would
be overestimates if the current levels of
harvesting were not sustainable.
3. RIPARIAN FISHERIES VALUATION STUDIES
Many of the riparian fisheries of eastern
and southern Africa, especially in the larger
floodplain systems, have been described
in some way, and several are well studied.
However, very few of these have involved
valuation of these fisheries, and almost
none have been published. For example,
extensive work has been carried out on the
Phongolo floodplain (See reports edited by
Walmsley and Roberts 1989 and Merron
and Weldrick 1995) and much of which was
done in response to impending development,
but no valuation study was carried out. In
another case, Tvedten et al. 1994 produced
a comprehensive overview of Namibian
freshwater fisheries, but although various
prices were reported, they did not attempt
valuation, and this was at least partly due to
their philosophy on its usefulness.
Valuation studies that were identified in this
review are listed in Table 1. However, it must
be emphasized that the search was not
exhaustive due to time constraints, and it may
not have unearthed all existing gray literature
reports.
These studies were carried out for a variety
of purposes – for the development of natural
resource management plans, environmental
impact assessments, policy formulation,
development programs and the determination
of instream flow requirements. They serve to
articulate the local value of fishery resources
to managers, traditional leaders, local
government officials, decision makers and
policy makers. The methods and findings of
these studies are summarized below.

11� Tropical river fisheries valuaTion: background papers To a global synThesis
�.1 rufiji floodplain and delta
Turpie (2000) conducted a study on the use
and value of natural resources of the lower
Rufiji River floodplain and delta as an input
into the development of a management plan
for the area. The 720,000-hectare study area
encompassed the lower stretch of the Rufiji
River from the boundary of the Selous Game
Reserve to the coast. The area was divided
into three ecoregions for the study: the
floodplain area (containing 8,700 households),
the delta area (with 5,093 households), and
a transition area between the two, in which
2,300 households had close access to both
floodplain and delta resources.
A survey was carried out in nine villages
across the three ecoregions in order to
estimate the direct consumptive use value
of all natural resources exploited by the
households, including woodland resources,
and the production value of agricultural and
other activities. General information (e.g. on
prices, seasonality, equipment durability) was
collected in focus groups and key informant
interviews for each resource type in each of
the nine villages, and quantitative data on rates
of resource use, sales etc. were collected at
a household level (n = 128). Estimates were
made of the numbers of users and quantities
of different resources used, input costs and
gross and net income. Income was estimated
at the household level and for the study area
as a whole, and values were assigned to
habitats using GIS data.
Nearly all households in the area consider
farming as their primary economic activity.
At least 24 types of crops are grown in the
area, with rice, maize, sweet potatoes, millet,
vegetables and fruit being the principal
subsistence crops. Additional crops such
as cashew nuts are grown for cash income.
Little livestock is kept in this area. In addition,
Table 1: summary of fishery assessments involving some level of valuation in southern and eastern africa (note: this list may not be exhaustive.)
System Location Authors
Tana River Kenya Emerton 1994
Rufiji floodplain and delta Rufiji district, Tanzania Turpie 2000
Kilombero floodplain Morogoro, Tanzania Mapunda 1981
Lower Shire Southern Malawi Turpie et al. 1999
Zambezi & Barotse Floodplain Western Zambia Turpie et al. 1999
Okavango River Namibia LaFranchi 1996, based on Tvedten et al. 1994
Zambezi-Chobe floodplain system
Eastern Caprivi, Namibia Van der Waal 1991; LaFranchi 1996, based on Tvedten et al. 1994; Turpie et al. 1999
Chobe R & Lake Liambezi Southeastern Caprivi, Namibia Turpie and Egoh 2002
Zambezi Delta Mozambique Turpie et al. 1999
Orange River Namibia/South Africa Tvedten et al. 1994
Komati River Swaziland Turpie 1998
Mutshindudi River Northern Province, South Africa Van der Waal 2000
Lesotho Highlands (several rivers)
Lesotho highlands Majoro 2000
Crocodile River South Africa Cox et al. 2001
South African estuaries (all) South Africa Lamberth and Turpie 2003

chapTer � 11�
Table �: average numbers of different types of fishing equipment owned by fishing households in three areas of the rufiji floodplain and delta, based on household survey data (Turpie �000)
Type of equipment Floodplain Transition Delta
Canoes 0.5 0.5 0.7
Hooks 16.5 16.7 3.9
Nets (50 yard pieces) 4.1 3.9 1.8
Nyando/Wando (V-shaped trap from reeds or sticks) 0.4 0.1 0.7
Kifaba/Vifaba (cones) 0.4 0.1 0.0
Kutanda (shrimp net with poles) 0.0 0.0 0.4
numerous types of natural resources are
harvested by households in the area,
including salt, grass, reeds, palm leaves,
firewood, timber, mammals, birds and honey.
Nevertheless, fishing is considered to be one
of the most important activities, and is carried
out by 57 per cent of the households (Turpie
2000). This proportion is relatively constant
throughout the floodplain and delta areas,
and is far more than the 19 per cent of the
households estimated twenty years ago (FAO
1979).
Most freshwater fishing takes place in the
numerous permanent lakes of the floodplain,
which provide breeding habitat for fish and
are replenished in most years by floods. In
the delta, fishing is in the estuarine and
shallow inshore coastal waters. The majority
of fishers use nets, although traditional traps
and hooks are still commonly used. Gill
nets were introduced in the 1960s and only
became common in the 1990s (Sorensen
1998). Seine nets are also used. Women
in the delta use mosquito nets suspended
between poles for catching shrimp. About
half of the fishing households own canoes
(Table 2).
The freshwater fishery is very unselective
in terms of both species composition and
size: over 40 freshwater fishes occur in the
floodplain system (Hobson 1979), of which
more than 30 were named by fishers as being
part of their catch. The fishery is, however,
dominated by the most common species,
notably the cichlid fish Oreochromis urolepsis,
commonly referred to as tilapia, and also
catfishes (Clarias, Schilbe and Bagras) and
Alestes. At least 30 species are caught in
the delta. The most important fish reported in
catches was dagaa, a general term for small
fishes such as mullet, and mbarata, a term
for clupeid fish such as Hilsa kelee. Prawns
(mainly Peneaus indicus, Metapenaeous
monocerus and Penaeus monodon) are the
most valuable fishery production in the delta,
where they form a large proportion of catches
(Turpie 2000).
On the river and floodplain, fishing is year
round, with strong seasonal change in effort
corresponding to periods of flooding. Fishing
in the delta is also year round, but with less
of a marked seasonal change in catches, as
fishers tend to track the changes in availability
of prawns by moving up and down the coast.
Fishers from the transition area have access
to the river, floodplain lakes and the delta, but
they tend to concentrate either on freshwater
or marine and estuarine fishing. Among the
fishing households, annual effort is 86 days
per year in the floodplain, 56 days in the
transition area, and 123 days in the delta area
(Turpie 2000).
In all cases, fishing areas are close to villages,
but seasonality in fish availability necessitates
migrations of fishers. Focus group data on
seasonality revealed a clear trend for peak
catches to be later and later as one moves
downriver (April to October), while prawn
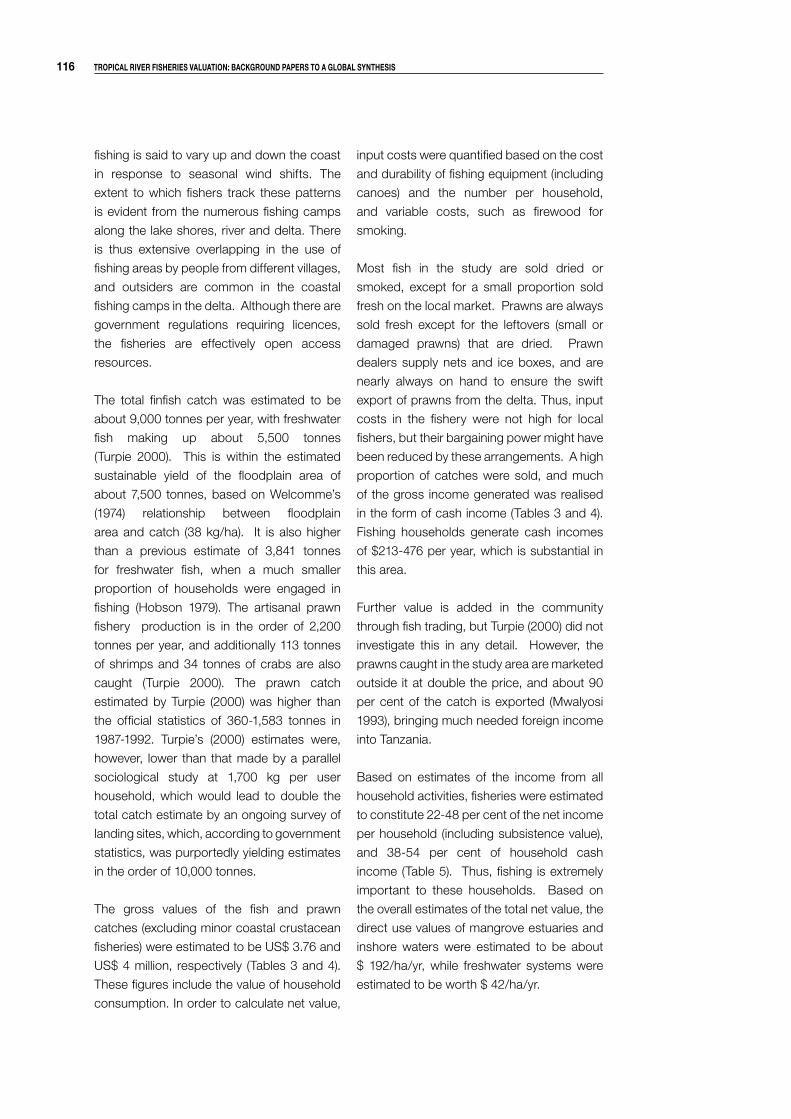
11� Tropical river fisheries valuaTion: background papers To a global synThesis
fishing is said to vary up and down the coast
in response to seasonal wind shifts. The
extent to which fishers track these patterns
is evident from the numerous fishing camps
along the lake shores, river and delta. There
is thus extensive overlapping in the use of
fishing areas by people from different villages,
and outsiders are common in the coastal
fishing camps in the delta. Although there are
government regulations requiring licences,
the fisheries are effectively open access
resources.
The total finfish catch was estimated to be
about 9,000 tonnes per year, with freshwater
fish making up about 5,500 tonnes
(Turpie 2000). This is within the estimated
sustainable yield of the floodplain area of
about 7,500 tonnes, based on Welcomme’s
(1974) relationship between floodplain
area and catch (38 kg/ha). It is also higher
than a previous estimate of 3,841 tonnes
for freshwater fish, when a much smaller
proportion of households were engaged in
fishing (Hobson 1979). The artisanal prawn
fishery production is in the order of 2,200
tonnes per year, and additionally 113 tonnes
of shrimps and 34 tonnes of crabs are also
caught (Turpie 2000). The prawn catch
estimated by Turpie (2000) was higher than
the official statistics of 360-1,583 tonnes in
1987-1992. Turpie’s (2000) estimates were,
however, lower than that made by a parallel
sociological study at 1,700 kg per user
household, which would lead to double the
total catch estimate by an ongoing survey of
landing sites, which, according to government
statistics, was purportedly yielding estimates
in the order of 10,000 tonnes.
The gross values of the fish and prawn
catches (excluding minor coastal crustacean
fisheries) were estimated to be US$ 3.76 and
US$ 4 million, respectively (Tables 3 and 4).
These figures include the value of household
consumption. In order to calculate net value,
input costs were quantified based on the cost
and durability of fishing equipment (including
canoes) and the number per household,
and variable costs, such as firewood for
smoking.
Most fish in the study are sold dried or
smoked, except for a small proportion sold
fresh on the local market. Prawns are always
sold fresh except for the leftovers (small or
damaged prawns) that are dried. Prawn
dealers supply nets and ice boxes, and are
nearly always on hand to ensure the swift
export of prawns from the delta. Thus, input
costs in the fishery were not high for local
fishers, but their bargaining power might have
been reduced by these arrangements. A high
proportion of catches were sold, and much
of the gross income generated was realised
in the form of cash income (Tables 3 and 4).
Fishing households generate cash incomes
of $213-476 per year, which is substantial in
this area.
Further value is added in the community
through fish trading, but Turpie (2000) did not
investigate this in any detail. However, the
prawns caught in the study area are marketed
outside it at double the price, and about 90
per cent of the catch is exported (Mwalyosi
1993), bringing much needed foreign income
into Tanzania.
Based on estimates of the income from all
household activities, fisheries were estimated
to constitute 22-48 per cent of the net income
per household (including subsistence value),
and 38-54 per cent of household cash
income (Table 5). Thus, fishing is extremely
important to these households. Based on
the overall estimates of the total net value, the
direct use values of mangrove estuaries and
inshore waters were estimated to be about
$ 192/ha/yr, while freshwater systems were
estimated to be worth $ 42/ha/yr.
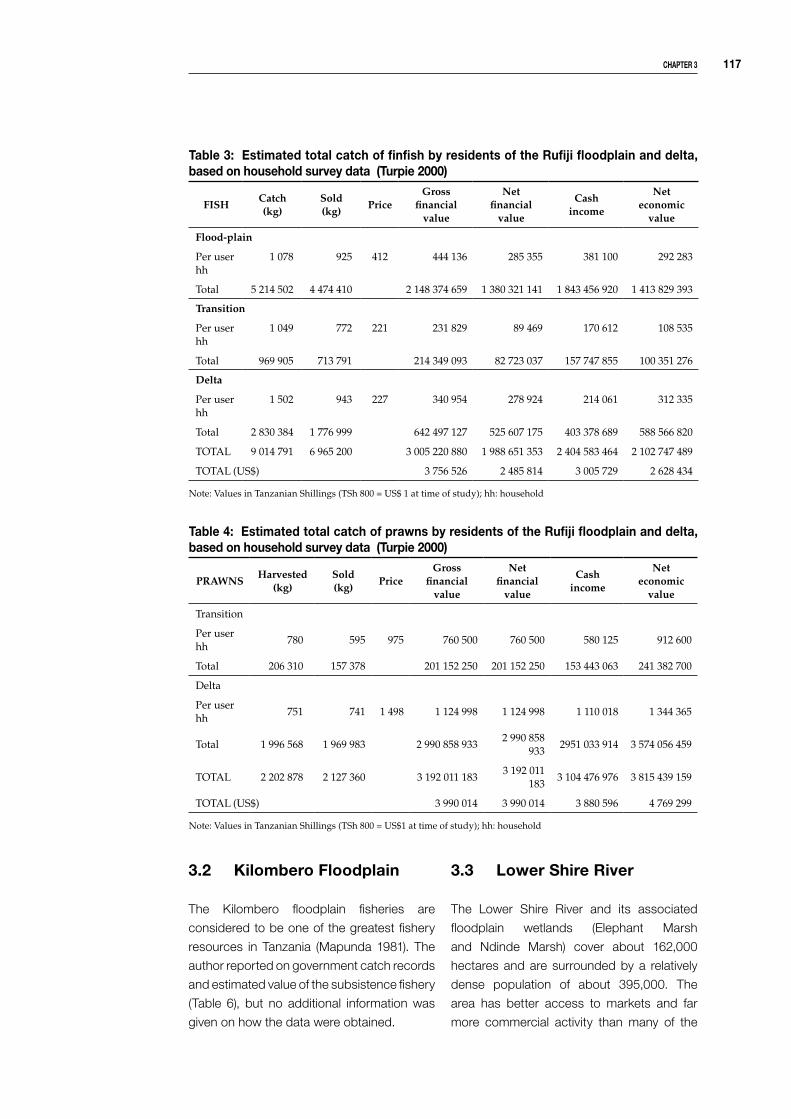
chapTer � 11�
Table �: estimated total catch of prawns by residents of the rufiji floodplain and delta, based on household survey data (Turpie �000)
PRAWNSHarvested
(kg)Sold(kg)
PriceGross
financialvalue
Netfinancial
value
Cashincome
Neteconomic
value
Transition
Per user hh
780 595 975 760 500 760 500 580 125 912 600
Total 206 310 157 378 201 152 250 201 152 250 153 443 063 241 382 700
Delta
Per user hh
751 741 1 498 1 124 998 1 124 998 1 110 018 1 344 365
Total 1 996 568 1 969 983 2 990 858 9332 990 858
9332951 033 914 3 574 056 459
TOTAL 2 202 878 2 127 360 3 192 011 1833 192 011
1833 104 476 976 3 815 439 159
TOTAL (US$) 3 990 014 3 990 014 3 880 596 4 769 299
Note: Values in Tanzanian Shillings (TSh 800 = US$1 at time of study); hh: household
Table �: estimated total catch of finfish by residents of the rufiji floodplain and delta, based on household survey data (Turpie �000)
FISHCatch(kg)
Sold(kg)
PriceGross
financialvalue
Netfinancial
value
Cashincome
Neteconomic
value
Flood-plain
Per userhh
1 078 925 412 444 136 285 355 381 100 292 283
Total 5 214 502 4 474 410 2 148 374 659 1 380 321 141 1 843 456 920 1 413 829 393
Transition
Per userhh
1 049 772 221 231 829 89 469 170 612 108 535
Total 969 905 713 791 214 349 093 82 723 037 157 747 855 100 351 276
Delta
Per userhh
1 502 943 227 340 954 278 924 214 061 312 335
Total 2 830 384 1 776 999 642 497 127 525 607 175 403 378 689 588 566 820
TOTAL 9 014 791 6 965 200 3 005 220 880 1 988 651 353 2 404 583 464 2 102 747 489
TOTAL (US$) 3 756 526 2 485 814 3 005 729 2 628 434
Note: Values in Tanzanian Shillings (TSh 800 = US$ 1 at time of study); hh: household
�.� kilombero floodplain
The Kilombero floodplain fisheries are
considered to be one of the greatest fishery
resources in Tanzania (Mapunda 1981). The
author reported on government catch records
and estimated value of the subsistence fishery
(Table 6), but no additional information was
given on how the data were obtained.
�.� lower shire river
The Lower Shire River and its associated
floodplain wetlands (Elephant Marsh
and Ndinde Marsh) cover about 162,000
hectares and are surrounded by a relatively
dense population of about 395,000. The
area has better access to markets and far
more commercial activity than many of the
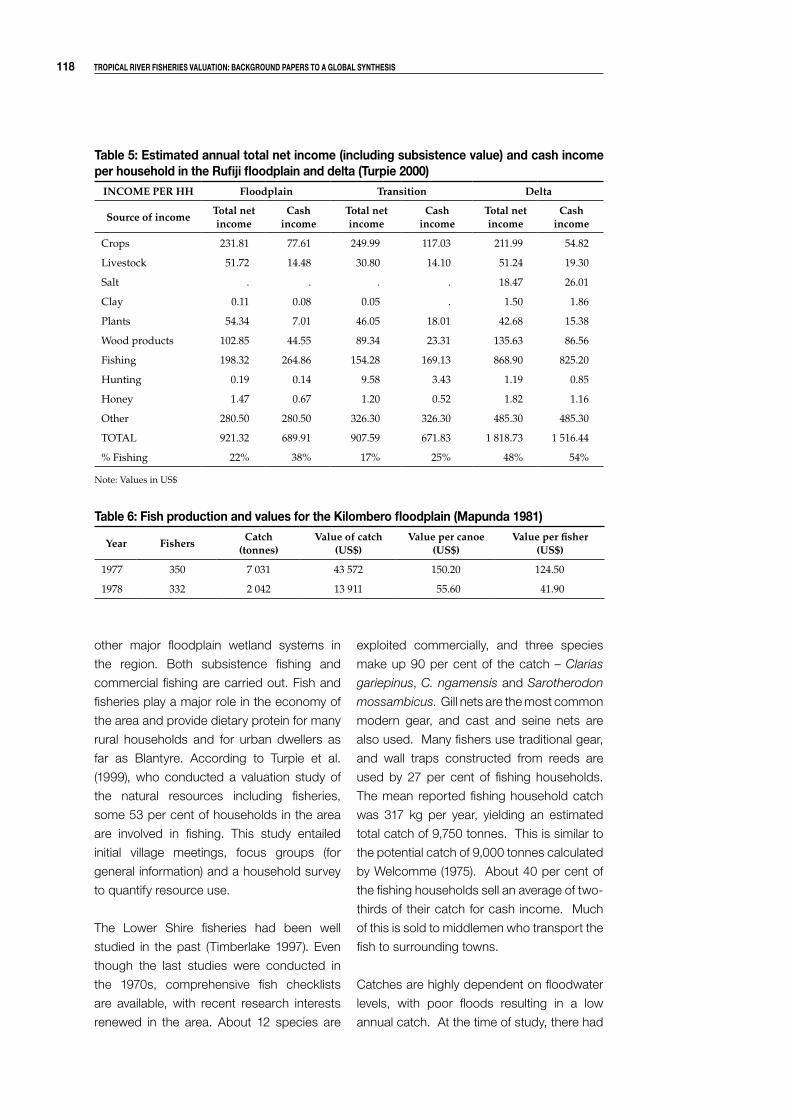
11� Tropical river fisheries valuaTion: background papers To a global synThesis
other major floodplain wetland systems in
the region. Both subsistence fishing and
commercial fishing are carried out. Fish and
fisheries play a major role in the economy of
the area and provide dietary protein for many
rural households and for urban dwellers as
far as Blantyre. According to Turpie et al.
(1999), who conducted a valuation study of
the natural resources including fisheries,
some 53 per cent of households in the area
are involved in fishing. This study entailed
initial village meetings, focus groups (for
general information) and a household survey
to quantify resource use.
The Lower Shire fisheries had been well
studied in the past (Timberlake 1997). Even
though the last studies were conducted in
the 1970s, comprehensive fish checklists
are available, with recent research interests
renewed in the area. About 12 species are
exploited commercially, and three species
make up 90 per cent of the catch – Clarias
gariepinus, C. ngamensis and Sarotherodon
mossambicus. Gill nets are the most common
modern gear, and cast and seine nets are
also used. Many fishers use traditional gear,
and wall traps constructed from reeds are
used by 27 per cent of fishing households.
The mean reported fishing household catch
was 317 kg per year, yielding an estimated
total catch of 9,750 tonnes. This is similar to
the potential catch of 9,000 tonnes calculated
by Welcomme (1975). About 40 per cent of
the fishing households sell an average of two-
thirds of their catch for cash income. Much
of this is sold to middlemen who transport the
fish to surrounding towns.
Catches are highly dependent on floodwater
levels, with poor floods resulting in a low
annual catch. At the time of study, there had
Table �: estimated annual total net income (including subsistence value) and cash income per household in the rufiji floodplain and delta (Turpie �000)
INCOME PER HH Floodplain Transition Delta
Source of incomeTotal net income
Cash income
Total netincome
Cash income
Total net income
Cash income
Crops 231.81 77.61 249.99 117.03 211.99 54.82
Livestock 51.72 14.48 30.80 14.10 51.24 19.30
Salt . . . . 18.47 26.01
Clay 0.11 0.08 0.05 . 1.50 1.86
Plants 54.34 7.01 46.05 18.01 42.68 15.38
Wood products 102.85 44.55 89.34 23.31 135.63 86.56
Fishing 198.32 264.86 154.28 169.13 868.90 825.20
Hunting 0.19 0.14 9.58 3.43 1.19 0.85
Honey 1.47 0.67 1.20 0.52 1.82 1.16
Other 280.50 280.50 326.30 326.30 485.30 485.30
TOTAL 921.32 689.91 907.59 671.83 1 818.73 1 516.44
% Fishing 22% 38% 17% 25% 48% 54%
Note: Values in US$
Table �: fish production and values for the kilombero floodplain (Mapunda 1��1)
Year FishersCatch
(tonnes)Value of catch
(US$)Value per canoe
(US$)Value per fisher
(US$)
1977 350 7 031 43 572 150.20 124.50
1978 332 2 042 13 911 55.60 41.90

chapTer � 11�
Table �: annual values (us$) of the lower shire fishery, southern Malawi (Turpie et al. 1���)Gross income Net value Cash income Net economic value
Per user household 106 56 28 33
Total study area 4 956 000 4 803 000 1 452 000 4 587 000
been a good flood, and thus good catches
for the first time in several years. Indeed,
fishery department statistics indicate major
declines in recent years, from the estimates
of 11,000 tonnes in 1989 to 1,800 tonnes in
1996. The fishery is by nature an open access
fishery with no licensing and poor extension
services. Outsiders are common and policing
non-existent. Fishing with mosquito nets is
common, and even members of the fisheries
department are using shade netting. Thus,
a combination of factors makes the current
value of the fishery lower than it could be if
well managed and sustainable.
�.� Zambezi-barotse floodplain
The area associated with the Barotse
floodplain wetlands on the upper Zambezi
is approximately 1.2 million hectares
in extent, with the main wetland area
extending over about 550,000 hectares. Its
approximate 224,000 inhabitants fall under
the dual administration of the Barotse Royal
Establishment and the Central Government.
The Lozi culture and traditions are closely
linked with the seasonal flooding of the plain,
with people moving between the uplands
and wetlands. As with many of the other
systems mentioned here, people derive their
livelihoods from a number of sources, with
agriculture being the most important activity
and livestock being of great importance
as a source of wealth. Fishing provides the
traditional staple relish of the floodplain people
(99.3 per cent of households consume fish)
and is an important source of income (Turpie
et al. 1999). Many other natural resources are
also harvested for subsistence use and cash
income. Less than five per cent of the people
are in formal employment (Simwinji 1997). The
fishery is one of the most important sectors
in the Western Province (Van Gils 1988), with
most production being consumed locally.
However, there has been very little research
on the Barotseland fishery apart from earlier
descriptive work (e.g., Kelly 1968; Bell-Cross
1971, 1974) and government catch statistics
from landing sites. Using these data, Van Gils
(1988) correlated fish catch to the length of
the flooding season.
Based on household survey data, some
54 per cent of the households engage in
fishing, reporting an effort of around 327
person-days per year (Turpie et al. 1999). A
mixture of modern and traditional gear is used,
with 75 per cent of the catch being caught in
gill nets. Traditional methods are used when
the floodplain is inundated. Women make
up a significant proportion (24%) of fishers.
The mean reported household catch was
712 kg, leading to an estimated total catch
of 10,500 tonnes. This is slightly below the
estimated production potential of 12,000 –
15,000 tonnes (Van Gils 1988), and higher
than government catch estimates of around
5,000 – 6,000 tonnes (Chitembure 1995,
1996). The fishery has a gross value of
approximately US$5 million, a large proportion
of which is subsistence value (Turpie et al.
1999).
Catches are highly variable from year to year,
but villagers agreed that their catches had
declined markedly over the past four decades.
This is blamed on the introduction of modern
gear and population increases (Turpie et al.
1999). The fishery is regulated by government
and traditional laws, and has the advantage of
a fairly strong traditional structure controlling
access. However, rules such as mesh size
are flouted (many fishers use mosquito nets),
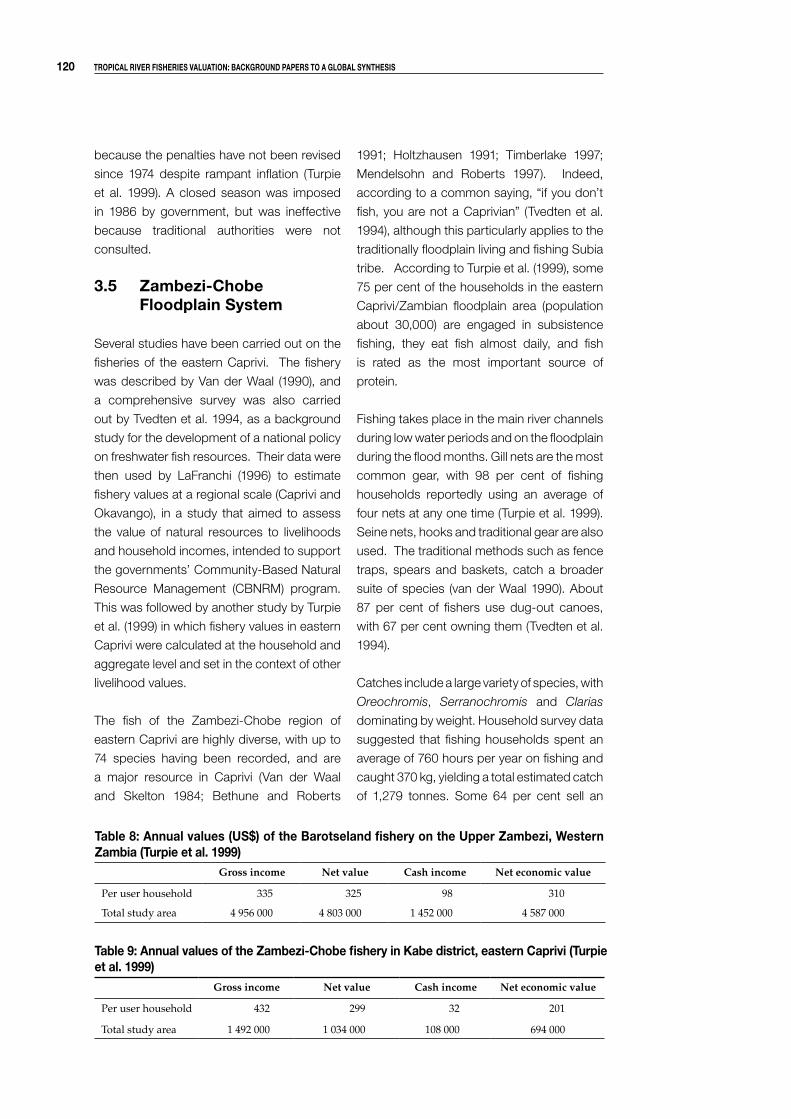
1�0 Tropical river fisheries valuaTion: background papers To a global synThesis
because the penalties have not been revised
since 1974 despite rampant inflation (Turpie
et al. 1999). A closed season was imposed
in 1986 by government, but was ineffective
because traditional authorities were not
consulted.
�.� Zambezi-chobe floodplain system
Several studies have been carried out on the
fisheries of the eastern Caprivi. The fishery
was described by Van der Waal (1990), and
a comprehensive survey was also carried
out by Tvedten et al. 1994, as a background
study for the development of a national policy
on freshwater fish resources. Their data were
then used by LaFranchi (1996) to estimate
fishery values at a regional scale (Caprivi and
Okavango), in a study that aimed to assess
the value of natural resources to livelihoods
and household incomes, intended to support
the governments’ Community-Based Natural
Resource Management (CBNRM) program.
This was followed by another study by Turpie
et al. (1999) in which fishery values in eastern
Caprivi were calculated at the household and
aggregate level and set in the context of other
livelihood values.
The fish of the Zambezi-Chobe region of
eastern Caprivi are highly diverse, with up to
74 species having been recorded, and are
a major resource in Caprivi (Van der Waal
and Skelton 1984; Bethune and Roberts
1991; Holtzhausen 1991; Timberlake 1997;
Mendelsohn and Roberts 1997). Indeed,
according to a common saying, “if you don’t
fish, you are not a Caprivian” (Tvedten et al.
1994), although this particularly applies to the
traditionally floodplain living and fishing Subia
tribe. According to Turpie et al. (1999), some
75 per cent of the households in the eastern
Caprivi/Zambian floodplain area (population
about 30,000) are engaged in subsistence
fishing, they eat fish almost daily, and fish
is rated as the most important source of
protein.
Fishing takes place in the main river channels
during low water periods and on the floodplain
during the flood months. Gill nets are the most
common gear, with 98 per cent of fishing
households reportedly using an average of
four nets at any one time (Turpie et al. 1999).
Seine nets, hooks and traditional gear are also
used. The traditional methods such as fence
traps, spears and baskets, catch a broader
suite of species (van der Waal 1990). About
87 per cent of fishers use dug-out canoes,
with 67 per cent owning them (Tvedten et al.
1994).
Catches include a large variety of species, with
Oreochromis, Serranochromis and Clarias
dominating by weight. Household survey data
suggested that fishing households spent an
average of 760 hours per year on fishing and
caught 370 kg, yielding a total estimated catch
of 1,279 tonnes. Some 64 per cent sell an
Table �: annual values (us$) of the barotseland fishery on the upper Zambezi, Western Zambia (Turpie et al. 1���)
Gross income Net value Cash income Net economic value
Per user household 335 325 98 310
Total study area 4 956 000 4 803 000 1 452 000 4 587 000
Table �: annual values of the Zambezi-chobe fishery in kabe district, eastern caprivi (Turpie et al. 1���)
Gross income Net value Cash income Net economic value
Per user household 432 299 32 201
Total study area 1 492 000 1 034 000 108 000 694 000
chapTer � 1�1
average of 10 per cent of their catch. Prices
fluctuated seasonally and varied among
species, as well as between dried and fresh
fish. The gross value of the fishery is estimated
to be almost $1.5 million, yielding substantial
subsistence value to households. The cash
income was small, however, and this can be
at least partly attributed to the lack of access
to markets. These values do not include the
recreational fishing, which also takes place in
the area but does not compete much with the
artisanal fishery.
At a broader level, the total catch of the Caprivi
region, which includes the rest of the Chobe
and the Kwando-Linyanti systems, has been
estimated at 1,500 tonnes (Tvedten et al.
1994). This was valued by multiplying the
weight by a price range to obtain an estimated
total value of N$6.75 – 9.75 million (LaFranchi
1996), or roughly US$1.35-1.95 million.
Thus, the two studies generated fairly similar
estimates of gross income. LaFranchi (1996)
emphasized the importance of recognizing
the subsistence value of the catch.
There is some doubt that the current catch is
sustainable. The estimated catch is above the
government estimates of MSY (400 tonnes
for the eastern floodplains and 300 tonnes for
the Zambezi), but below the estimate of 1,800
tonnes one would obtain using Welcomme’s
figure (1974) of roughly 40 kg per hectare
of floodplain area. However, much of this
floodplain is inundated only very rarely. Van
der Waal (1990) showed a decreasing trend in
CPUE between 1975 and 1980, and villagers
described decreasing availability of fish over
the past four decades (Turpie et al. 1999).
This is in spite of the fact that villagers do
perceive a greater level of access control in
the fishery than in other areas (Tvedten et al.
1994; Turpie et al. 1999).
�.� chobe-lake liambezi system
Lake Liambezi is particularly interesting from a
fishery valuation perspective. The lake, which
falls within the Chobe floodplain and is also fed
by the Zambezi via the Bhukalo channel, is
a large floodplain wetland of some 10,000
hectares that may be alternatively dry or
inundated for periods of several years. It is
inundated during high flooding events, and
once full, the lake may remain inundated for
several years. Several long dry periods have
been recorded, the most recent of which was
from 1985/6 to 2001, when the lake started
to fill up again. When the lake is inundated,
it becomes a highly utilized fishing area by
the surrounding inhabitants. When dry, a few
fishing households continue to fish by traveling
to the Zambezi and Chobe rivers, but there
is a significant decrease in fishing activity by
households in the area. Studies were carried
out on the Lake Liambezi fisheries during
the 1970s and 80s, and it is estimated that
catches amounted to about 600-800 tonnes
per year (Van der Waal 1990). The fishery
was not given a value at the time. While dry
or partially filled, most of the Liambezi flood
area is vegetated with floodplain grassland,
and much of this is cultivated. This was
the situation when Turpie and Egoh (2002)
carried out a valuation study as part of an
impact assessment for a proposed sugar
estate within the Liambezi floodplain area.
The situation at the time is described below.
Households in the study area were divided
into two groups: those living within easy reach
of both the Chobe River and Lake Liambezi
(Zone CL), and those within reach of Lake
Liambezi only (Zone L). Focus groups were
used to collect general information, and an
extensive survey was carried out of over 80 per
cent of the households to collect quantitative
information. According to the household
survey data, 22 per cent of CL households
and seven per cent of L households had
been fishing in the past year (Turpie and Egoh
2002), which is a much lower proportion than
one would expect when the lake is inundated.
Fishing households were well equipped, with
86 per cent in Zone CL and 59 per cent in

1�� Tropical river fisheries valuaTion: background papers To a global synThesis
Zone L having canoes, and an average of 5.5
and 1.5 nets per household in the two zones,
respectively (Table 10). Traditional fishing
methods are considered old fashioned and
mainly used by old people (Turpie and Egoh
2002).
Interestingly, some 14 per cent of non-fishing
households in Zone CL and 6 per cent in
Zone L also owned fishing gear, and 11 per
cent and 20 per cent of them, respectively,
had canoes. This gives some idea of the
latent fishing effort that might come into play
when the lake is fully inundated.
Fishing households reported high catches,
with an average of 1,740 and 740 kg per
household in the two zones, respectively.
This adds up to a total estimated catch of
some 154 tonnes, which is far less than the
full potential of the lake. About 73 per cent
of the catch is sold, most being transported
to the town of Katima Mulilo or other small
towns in the area. Fish is sold fresh as far
as possible, transported in wet sacks or
cool boxes, and the remainder is dried and
transported in boxes. The fishery generates
healthy incomes to fishing households
(Table 11).
Table 11: annual values of the liambezi-chobe fishery in eastern caprivi (Turpie and egoh �00�)*
Gross income Net value Cash income Net economic value
Per user household in zone CL 440 139 322 36
Per user household in zone L 187 50 137 15
Total study area 38 924 11 687 28 442 2 880
* Values have been recalculated at N$ 8.70 to the US$ as the original estimates were made during a temporary sharp drop in the exchange rate.
Table 10: fishing gear owned by households around lake liambezi (Turpie and egoh �00�)Average number per fishing household: Zone CL Zone L
Canoes 1.05 0.78
Gillnets 5.50 1.52
Seine nets 0.14 0.04
Lines with hooks 1.14 0.70
Fish funnels & fences 0.23 0.26
�.� okavango river, namibia
The fishery of the Okavango River is among
the most traditional fisheries in Namibia
(Tvedten et al. 1994). It is interesting to com-
pare this fishery with the Caprivi fisheries.
There is greater use of traditional gear in
the former case than in the latter one (100%
versus 82% of fishing households), and on
the contrary much lower use of modern gear
(43% versus 98%). Indeed, fishers there
claim to prefer traditional gear. Along with
this are a much larger number of women
fishers in the former than in the latter (55%
versus 15%), and even less marketing of fish
in the former (Tvedten et al. 1994). According
to the authors, most fishers describe the
resource as open access. Richness of high-
valued species is recorded, and cichlids
dominate catches. Estimates of catches vary,
though. Van der Waal (1991) estimated that
35,000 residents fished 40 days per year
and caught 840 tonnes, while Tvedten et al.
(1994) estimated that 56,000 residents fished
60 days per year, yielding 1,045 tonnes.
Estimates of the MSY range from 840 to
3,000 tonnes. Van der Waal (1981) estimated
the total economic value of the Okavango
fishery to be R1.8 million annually. The fishery

chapTer � 1��
makes an important contribution to house-
hold food security, both as a food source
and as cash income. The protein and
micronutrients are also especially important
as a contribution to household nutrition and
health. The fishery also reportedly helps
sustain the social and cultural fabric of
communities along the river. Most fishing
is for home consumption, and agricultural
food production rarely fulfils household food
requirements. Agricultural productivity is also
declining, so fish is becoming relatively more
important (Tvedten et al. 1994). Residents
recalled that people relied on fish during the
1978 drought to see them through. Fishing
is also important during the famine season,
before crops are harvested.
Cash earned from the sale of fish is usually
small – about N$ 45/month on average.
However, it needs to be stressed that “this
income is integrated into a risk-averse strategy
of diverse income source, contributing to
household income security and indirectly
to the village economy” (Tvedten et al.
1994). Agriculture is the mainstay of daily
subsistence, but household security depends
on availability of cash income for food,
household goods, clothing and school fees,
etc. Selling fish is seen as a quick, low-risk
source of cash (Tvedten et al. 1994). Even
wealthier households with wage earners
participate in fishing to diversify their income
sources. Sometimes fish is bartered directly
for maize meal.
Using the catches reported in Tvedten et al.
(1994), LaFranchi (1996) estimated the total
value of the catches to be N$ 2.6-5.2 million,
or roughly US$ 0.5-1 million (LaFranchi 1996).
Household-level income was not estimated.
�.� Zambezi delta
The Zambezi Delta in Mozambique extends
in a large triangle from Mopeia to the coast,
some 120 km downstream. It covers an area
of 1.4 million hectares and has a population
of about 250,000, a f te r hav ing been
somewhat depopulated during the civil war.
The area is extremely isolated, with very poor
road access from centers such as Beira and
Quelimane. Most households are involved in
subsistence activities, with 95 per cent
depending on agriculture (Turpie et al. 1999).
The fish and fisheries of the lower Zambezi
have been described (Jubb 1967; Willoughby
and Tweddle 1977; Sweco 1982; DNFFB
1998) but had not been valued prior to Turpie
et al. (1999). Turpie and colleagues used
focus groups to obtain general information
and conducted a household study in three
parts of the delta to obtain quantitative
information.
According to Turpie et al. (1999), artisanal
fishers use canoes (67%), gill nets (44%), seine
nets (2%), hooks (35%), and circle and basket
traps (6%). At the coast, seine nets are also
used for prawn fishing. Fishers concentrate in
small fishing camps along the river banks and
coast. Because of the scale of the delta and
the variety of habitats involved, the fishery is
quite diverse. In the outer delta (towards the
coast), about 37 per cent of the catch comes
from the marine environment (Turpie et al.
1999). This figure was not included in the
valuation.
About 78 per cent of the inner delta
households and 66 per cent of the outer delta
households were engaged in finfish fishing,
and an additional 27 per cent of the latter
house-holds were prawn fishers. Catches
of freshwater and estuarine fishes were
267 kg and 450 kg in the inner and outer
delta, respectively, yielding an overall esti-
mated catch of 15,610 tonnes. With a flooded
area of about 500,000 hectares, the delta
could yield about 19,000 tonnes per year
(Welcomme 1978). Based on the fact that
much of the delta is inaccessible, Sweco
estimated that the catch would be about
10,000 tonnes (Sweco 1982). Government
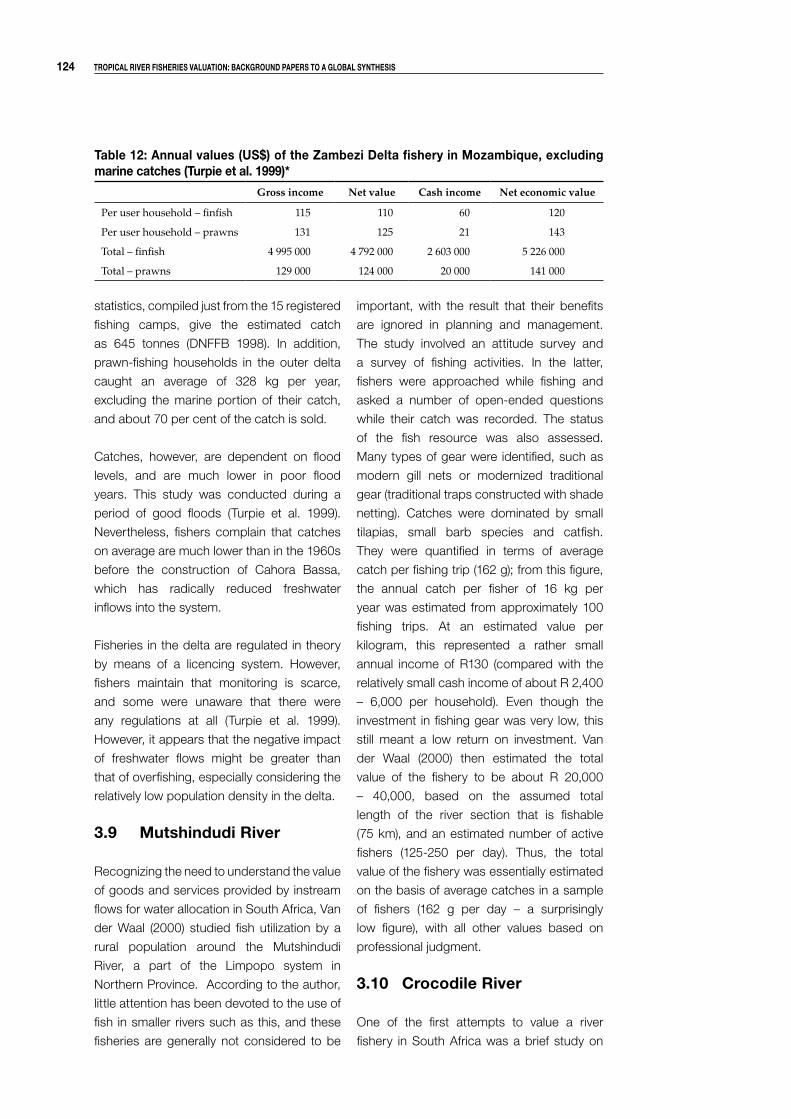
1�� Tropical river fisheries valuaTion: background papers To a global synThesis
statistics, compiled just from the 15 registered
fishing camps, give the estimated catch
as 645 tonnes (DNFFB 1998). In addition,
prawn-fishing households in the outer delta
caught an average of 328 kg per year,
excluding the marine portion of their catch,
and about 70 per cent of the catch is sold.
Catches, however, are dependent on flood
levels, and are much lower in poor flood
years. This study was conducted during a
period of good floods (Turpie et al. 1999).
Nevertheless, fishers complain that catches
on average are much lower than in the 1960s
before the construction of Cahora Bassa,
which has radically reduced freshwater
inflows into the system.
Fisheries in the delta are regulated in theory
by means of a licencing system. However,
fishers maintain that monitoring is scarce,
and some were unaware that there were
any regulations at all (Turpie et al. 1999).
However, it appears that the negative impact
of freshwater flows might be greater than
that of overfishing, especially considering the
relatively low population density in the delta.
�.� Mutshindudi river
Recognizing the need to understand the value
of goods and services provided by instream
flows for water allocation in South Africa, Van
der Waal (2000) studied fish utilization by a
rural population around the Mutshindudi
River, a part of the Limpopo system in
Northern Province. According to the author,
little attention has been devoted to the use of
fish in smaller rivers such as this, and these
fisheries are generally not considered to be
important, with the result that their benefits
are ignored in planning and management.
The study involved an attitude survey and
a survey of fishing activities. In the latter,
fishers were approached while fishing and
asked a number of open-ended questions
while their catch was recorded. The status
of the fish resource was also assessed.
Many types of gear were identified, such as
modern gill nets or modernized traditional
gear (traditional traps constructed with shade
netting). Catches were dominated by small
tilapias, small barb species and catfish.
They were quantified in terms of average
catch per fishing trip (162 g); from this figure,
the annual catch per fisher of 16 kg per
year was estimated from approximately 100
fishing trips. At an estimated value per
kilogram, this represented a rather small
annual income of R130 (compared with the
relatively small cash income of about R 2,400
– 6,000 per household). Even though the
investment in fishing gear was very low, this
still meant a low return on investment. Van
der Waal (2000) then estimated the total
value of the fishery to be about R 20,000
– 40,000, based on the assumed total
length of the river section that is fishable
(75 km), and an estimated number of active
fishers (125-250 per day). Thus, the total
value of the fishery was essentially estimated
on the basis of average catches in a sample
of fishers (162 g per day – a surprisingly
low figure), with all other values based on
professional judgment.
�.10 crocodile river
One of the first attempts to value a river
fishery in South Africa was a brief study on
Table 1�: annual values (us$) of the Zambezi delta fishery in Mozambique, excluding marine catches (Turpie et al. 1���)*
Gross income Net value Cash income Net economic value
Per user household – finfish 115 110 60 120
Per user household – prawns 131 125 21 143
Total – finfish 4 995 000 4 792 000 2 603 000 5 226 000
Total – prawns 129 000 124 000 20 000 141 000

chapTer � 1��
the Crocodile River in Mpumalanga Province
(Cox et al. 2001), which aimed to demonstrate
the way in which valuation might be carried
out in the determination of the environmental
reserve for a river system. The river flows
through private lands of a fairly affluent region
for most of its course, but also borders part
of a former homeland area in which tenure
is communal and inhabitants have a largely
subsistence economy. There are thus both
recreational fisheries (for exotic trout and
indigenous yellow fish) and subsistence
fisheries on the river. Cox and colleagues
surveyed 10 known fishing households in
the communal area on the use of a variety of
river resources. No background information
on the fishery was obtained, e.g., from focus
groups. Respondents were asked about
the number of each type of fish caught per
day and the number of days and months
fished. These data were used to estimate
average quantity of fish caught per household
per year. Fishing was reported mainly in
summer. The data for the six types of
fish named were eventually lumped in the
analysis, and valued according to size
alone. An average price was assigned
to all fish, and a gross value per fishing
household was calculated as average catch
per month x 3 months x average price. In
a rather back-of-the-envelope estimation,
it was assumed (without any basis) that
15 per cent of the 11,000 households in the
communal area were close to the river and
that 30 per cent, or 3,400, of these would
be fishing households. These figures
led to a gross value estimate of about
US$ 1.17 million per year (Cox et al. 2001).
The estimate is not reliable, however, due to
the sample size and survey design; it was
apparently intended only to demonstrate the
possible order of magnitude of the value.
Cox et al. (2001) also tackled the recreational
fishery. A questionaire was distributed to all
fly fishing clubs, generating 28 acceptable
responses from the estimated total of 1,600
fishers (1.75%). The questionnaire aimed to
establish the value of equipment used, its
durability, number of fishing expeditions per
year, costs per trip, time spent fishing, and
fees paid. From the information obtained,
it was estimated that fishers spent a total
of about US$ 2.5 million per year on this
activity (Cox et al. 2001). Again, the estimate
cannot be considered reliable because of
the small sample size, questionnaire design
and probably avidity bias. The questionnaire,
which lacked an explanation of purpose and
whose questions had no time frame, was
difficult to follow and generated data that
made results hard to defend statistically.
Thus, it is not surprising that the responses
it generated required several follow-up calls
(Cox et al. 2001).
4. VALUATION OF POTENTIAL CHANGES DUE TO WATER DEVELOPMENT PROjECTS
Losses in downstream fishery production
as a result of dam construction are a well-
known phenomenon around the world (WCD
2002; Jackson and Marmulla 2001). Major
losses have been reported for downstream
communities in Africa due to dam
construction, some of the most well-known
examples being on the Senegal and Niger
rivers in West Africa. Examples from southern
Africa include the Phongolo floodplain and
the Zambezi River. Very few estimates of
the economic impact of these losses can be
found, however. For example, while much
work has been carried out on the Phongolo
fishery (e.g., Buchan et al. 1988; Coke and
Pott 1970; Heeg and Breen 1982, Merron et
al. 1993), there is very little done in the way of
quantification and no apparent attempts are
made at valuation of these impacts. Several
studies have been carried out on the fisheries
of the Kafue floodplain, including estimated
impacts of the dam on catches (Chipungu
1981), but these impacts were not valued.

1�� Tropical river fisheries valuaTion: background papers To a global synThesis
The creation of Lake Kariba on the Zambezi
River is also known to have had major
ecological impacts downstream (Masundire
1996), but no studies could be located that
have attempted to quantify these impacts.
Yet, further downstream, the impact of altered
river flow by the Cahorra Bassa on the prawn
fishery of the Sofala Bank, offshore from the
Zambezi delta, has been quantified. Prawns
are dependent on freshwater flows for nutrient
supply and sediments. Gammelsrod (1996)
obtained catch data from one of the fishing
fleets for the period 1974 to 1988, which
coincided with the first 15 years of operation
of the Cahora Bassa dam, and showed a
clear relationship between river runoff in
October to March, and catch per unit effort.
His straightforward model was then applied
to simulated natural runoff conditions, and
it showed that catch rates were some 1,500
tonnes lower than they could be. A simple
calculation of the gross value of this loss was
US$ 10 million, based on an assumed price
of US$ 7 per kg. An interesting deduction
was that, given the small proportion of the
dam capacity actually being used, it would
be possible to increase wet season flows
to restore shrimp production levels without
interfering with the economic outputs of the
hydropower plant (Gammelsrod 1996). This
information has never been acted upon,
however.
In general, the environmental impact
assessments for dam construction have
not included the valuation of environmental
impacts until relatively recently. Thus, the
impact assessment for major developments
such as the proposed Stieglers Gorge HEP
dam on the Rufiji River led to estimations of
total catches and the impact on them (Hobson
1979), but the value was not considered.
While the notion of valuing environmental
impacts has been promoted for several
years now, it has not yet been successfully
integrated into the EIA procedure. Even in
South Africa, which is certainly the leader in
the region in terms of the application of EIA,
and which has guidelines for the incorporation
of environmental values, valuation has not yet
been incorporated into the legal requirements
of EIA. Thus, such valuations have rarely been
applied at all (Crookes and de Wit 2002).
One of the first such valuation studies in the
region was by Emerton (1994, 1996) for the
Tana River in Kenya. Afridev was one of the
first groups to attempt this in southern Africa,
with the impact assessment for the Maguga
dam on the Komati River in Swaziland.
However, the study was only allowed to
assess the impacts within the inundation
area, and not downstream, although a much
bigger impact would be expected to occur
downstream. This was followed by a far more
comprehensive study by Southern Waters for
the Lesotho Highlands Development Project
(LHDP). The Tana River and LHDP studies are
described in more detail below.
�.1 Tana river
The Tana River is the only permanent river in an
extremely arid region of Kenya. Emerton (1994,
1996) provided estimates of the economic
impact of changes in some of the production
systems relying on the river that would occur
as a result of further dam construction.
Estimates had to be extrapolated from
existing data that had been generated before
the construction of any dams (i.e. outdated,
as there were five reservoirs on the river at
time of study), to a future set of scenarios. The
estimation involved a number of assumptions
and the figures were largely conjectural
(Emerton 1994). Dam construction had
already had a major impact on downstream
populations through reduction in the biannual
flooding of the floodplain and delta area. The
proposed additional dams would further
reduce flow by up to 70 per cent, effectively
cutting the water supply to the floodplain.
An estimated 54,400 people of the overall
180,000 living adjacent to the river and delta
are dependent on the fisheries, with 50,000
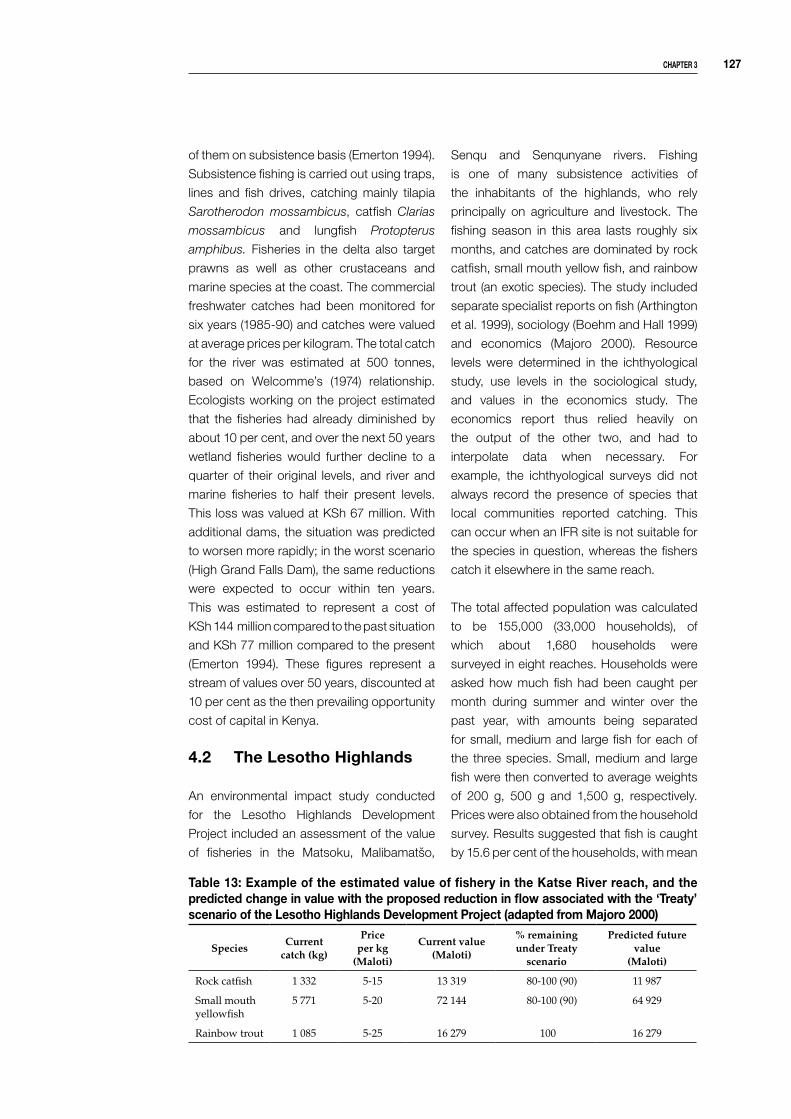
chapTer � 1��
Table 1�: example of the estimated value of fishery in the katse river reach, and the predicted change in value with the proposed reduction in flow associated with the ‘Treaty’ scenario of the lesotho highlands development project (adapted from Majoro �000)
SpeciesCurrent
catch (kg)
Price per kg
(Maloti)
Current value (Maloti)
% remaining under Treaty
scenario
Predicted future value
(Maloti)
Rock catfish 1 332 5-15 13 319 80-100 (90) 11 987
Small mouth yellowfish
5 771 5-20 72 144 80-100 (90) 64 929
Rainbow trout 1 085 5-25 16 279 100 16 279
of them on subsistence basis (Emerton 1994).
Subsistence fishing is carried out using traps,
lines and fish drives, catching mainly tilapia
Sarotherodon mossambicus, catfish Clarias
mossambicus and lungfish Protopterus
amphibus. Fisheries in the delta also target
prawns as well as other crustaceans and
marine species at the coast. The commercial
freshwater catches had been monitored for
six years (1985-90) and catches were valued
at average prices per kilogram. The total catch
for the river was estimated at 500 tonnes,
based on Welcomme’s (1974) relationship.
Ecologists working on the project estimated
that the fisheries had already diminished by
about 10 per cent, and over the next 50 years
wetland fisheries would further decline to a
quarter of their original levels, and river and
marine fisheries to half their present levels.
This loss was valued at KSh 67 million. With
additional dams, the situation was predicted
to worsen more rapidly; in the worst scenario
(High Grand Falls Dam), the same reductions
were expected to occur within ten years.
This was estimated to represent a cost of
KSh 144 million compared to the past situation
and KSh 77 million compared to the present
(Emerton 1994). These figures represent a
stream of values over 50 years, discounted at
10 per cent as the then prevailing opportunity
cost of capital in Kenya.
�.� The lesotho highlands
An environmental impact study conducted
for the Lesotho Highlands Development
Project included an assessment of the value
of fisheries in the Matsoku, Malibamatšo,
Senqu and Senqunyane rivers. Fishing
is one of many subsistence activities of
the inhabitants of the highlands, who rely
principally on agriculture and livestock. The
fishing season in this area lasts roughly six
months, and catches are dominated by rock
catfish, small mouth yellow fish, and rainbow
trout (an exotic species). The study included
separate specialist reports on fish (Arthington
et al. 1999), sociology (Boehm and Hall 1999)
and economics (Majoro 2000). Resource
levels were determined in the ichthyological
study, use levels in the sociological study,
and values in the economics study. The
economics report thus relied heavily on
the output of the other two, and had to
interpolate data when necessary. For
example, the ichthyological surveys did not
always record the presence of species that
local communities reported catching. This
can occur when an IFR site is not suitable for
the species in question, whereas the fishers
catch it elsewhere in the same reach.
The total affected population was calculated
to be 155,000 (33,000 households), of
which about 1,680 households were
surveyed in eight reaches. Households were
asked how much fish had been caught per
month during summer and winter over the
past year, with amounts being separated
for small, medium and large fish for each of
the three species. Small, medium and large
fish were then converted to average weights
of 200 g, 500 g and 1,500 g, respectively.
Prices were also obtained from the household
survey. Results suggested that fish is caught
by 15.6 per cent of the households, with mean

1�� Tropical river fisheries valuaTion: background papers To a global synThesis
catches of 17.5 kg of small-mouth yellow fish,
2.2 kg of rock catfish and 3 kg of rainbow trout
(Boehm and Hall 1999). Data were provided
separately for each reach. Of those who sold
fish, 71.5 per cent did so in their own villages,
the remainder going further afield (Boehm
and Hall 1999).
Resource values were derived by multiplying
resource use by prices, and monetary impacts
were then isolated by weighting resource
value using the magnitude and direction of
the predicted biophysical change. Prices for
fish of different sizes (given in lengths) were
obtained in the sociological study and these
were transformed into their weight equivalent
to arrive at the data used in the economic
study (Majoro 2000). Prices per kilogram
varied four- or fivefold.
It was assumed that the supply of resources
was limited, and more would be used if
available. This assumption was necessary
to translate changes in resource supply into
losses at the household level (Majoro 2000),
and it was supported by the sociological
study (Boehm and Hall 1999). It was also
assumed that the percentage loss in fish
supply as estimated by the ichthyological
study translated directly into a similar
percentage loss to the households. Although
fish is not considered abundant in the
system, this is one of the few resources
whose use is not controlled by local
authorities. Of the biophysical components
of the entire study, only vegetation and fish
were used in the estimation of costs for flow-
related changes (Majoro 2000). Estimated
percentage changes were given for each
reach in the study, and each reach (or
riparian area) was assumed to be accessed
by a defined set of households living within 5
km on either side of the river.
Average catch rates were computed from a
total of 1,600 households (200 per reach) in
the sociological study, and were extrapolated
to the total population. Potential problems of
recollection identified during the pilot survey
led to the use of different recall periods in
the main survey. Respondents were asked
to give their mean monthly catch in kilograms
over the 6 months of the past fishing season.
If fish resources were to be seriously depleted,
then use should stop before the resource was
completely extirpated, because the cost of
fishing effort would rise to the point where the
benefits no longer justified the cost (Conrad
and Clark 1987; Majoro 2000). Indeed, fishers
in reach 2 indicated that since the construc-
tion of Katse Dam it was already barely worth
their while fishing (Boehm and Hall 1999).
Thus, if fish abundance was predicted to
decline by more than 50 per cent, then the
economic study treated it as if the fishery had
ceased altogether.
The analysis carried out like the one above
assumes that a drop in the supply of resources
has no effect on price. However, scarcity
affects value, and actual market prices would
be expected to increase, especially in the
absence of substitute resources. Majoro
(2000) carried out sensitivity analyses on
the basis of three levels of price elasticity
(responsiveness of price to a change in
quantity supplied). In a situation where prices
are highly elastic (prices rise steeply), the loss
of value is greater than the straight one-for-
one percentage reduction shown in Table
13 above. A further element of the sensitivity
analysis assumed that the fish lost is valued at
the substitute price of US$ 2 per kg for hake
available in Maseru shops (Majoro 2000).
It is important to emphasize, however, that
the estimates of change in value are based
on rather uncertain, educated guesstimates
of the ichthyologists, and somewhat
uncertain findings of the sociological study.
Thus, Majoro (2000) also incorporated the
full range of estimates of change given by
the biologists, and the range of prices for

chapTer � 1��
fish, into risk analysis software (@RISK for
Excel Version 3.5.1) to calculate a probability
distribution for the total change in value. From
this information, a mean, minimum, maximum
and standard deviation of the expected losses
are generated for each reach and for each
water development scenario (Majoro 2000).
Coefficients of variation were relatively low,
probably because of the relatively small range
of possible change predicted in the case of
fish.
5. DISCUSSION: METHODS FOR VALUATION OF RIPARIAN FISHERIES
�.1 an appraisal framework for valuation
Barbier (1994) introduced a useful framework
to valuation studies as follows:
1. Choose an appropriate general assess-
ment approach within which to apply
valuation methods.
2. Define the scope and limits of the valuation
and information needs:
- indicate geographic and analytical
boundaries;
- draw time frame;
- identify the basic characteristics of the
area in terms of structural components
and functions, and also attributes, e.g.,
biodiversity, cultural uniqueness;
- determine the type of value associated
with each, e.g., direct consumptive
use value;
- rank the major characteristics and
values, e.g., in terms of relevance to
the study, or contribution to overall
value; and
- tackle the most important values
first, and the least important only if it
becomes necessary.
3. Define data collection methods and
valuation techniques.
In the case of riparian fisheries, it is important
to recognize that the value is determined via
the user population, a portion of which often
resides away from the resource for at least part
of the year. Thus, the definition of geographic
Table 1�: commonly-used natural resource valuation methods and the types of value that they are generally used to measure
Direct use valuesIndirect
use values
Option andnon-use
valueConsumptive Non-consumptive
Market Value Approaches
Simple Valuation P x Q 33 3
Production Function 33 3
Replacement Costs, etc. 3 3 33
Surrogate Market Approaches
Travel Cost Method 3 33
Hedonic Pricing 3 33 33
Simulated Market Approaches
Contingent Valuation Methods 33 33 3 33
Conjoint Valuation 3 3 3 3
1�0 Tropical river fisheries valuaTion: background papers To a global synThesis
scope is important when estimating total
value and investigating its distribution and
contribution to livelihoods. Furthermore, an
area may be heterogeneous in ecological
or socioeconomic characteristics. Valuation
studies should take this into account. For
example, Turpie (2000) divided the study area
into ecoregions on the basis of access to
different fish communities.
It is also important to make an upfront
decision as to whether the valuation study
needs to generate an overall value in terms of
gross contribution to the national economy,
for example, or the contribution that the
resource makes to individual households, and
the extent of its influence. Other boundaries
that need to be identified up front include the
level at which knock-on effects, such as value
added by processing and trade, are taken
into account.
Valuation techniques and data collection
methods are discussed in more detail below.
�.� economic valuation Techniques
A variety of methods is used to value
economic goods and services provided
by natural systems, each being variously
suited to different types of values that are
being measured (Table 14). This discussion
is primarily concerned with the direct use
values of fisheries, as opposed to other types
of value that ecosystems generate, such as
indirect use value and existence value. Direct
use value is the value that is most obvious at
the local level and often of less concern at the
global level. Other values, such as existence
and option values, are usually relatively
irrelevant at the local level, but they may be
significant at the global level. The number
of possible methods that can be used to
measure the different types of values also
decreases from left to right along the columns
in Table 14. Option value is seldom measured
explicitly and is also fairly difficult to separate
in practice from existence value.
In the case of fisheries, valuation usually
involves market value and surrogate market
approaches. Market value approaches are
appropriate for subsistence and commercial
fisheries, whereas the value of recreational
fisheries is better estimated using the travel
cost approach.
�.� The Market value approach
In the case of most fisheries, even remote
ones, there are usually market prices for fish
even if very few are traded. Thus, market
prices can be used as a proxy for the total
value of fish production even if much of
it is consumed by the fishing households
or bartered or shared. In well-functioning,
competitive markets, consumers express
values through their willingness to pay (WTP)
the prices asked for in markets. In such
markets, WTP is thus an indicator of positive
value attached to any item, and prices function
as expressions of value for units of goods and
services. Total economic value can simply be
calculated by price times quantity. Difficulties
arise where markets are not functioning well.
Where market prices are distorted (e.g., by
subsidization of inputs), adjustments are
usually made to correct for these distortions,
and the corrected prices are referred to as
shadow prices.
Before temporal and other dynamic effects
are taken into account, the current annual use
value of a river reach in terms of harvested
fish can simply be calculated as follows:
Annual use value = Q x (P-C),
where Q is the total catch, P is the market
price and C is the cost of harvesting the
resource. This measure of value is equivalent
to consumer expenditure, and may not
chapTer � 1�1
include consumer surplus. This method relies
on the measurements of price, harvest costs
(which include the cost of capital) and the
quantities harvested annually. However, the
measurement of Q, P and C is not always
straightforward, as discussed below.
�.�.1 The Quantification of catch
Output levels, i.e., catch, or fishing days in the
case of a recreational fishery, can be estimated
in a number of ways depending on the
accuracy required. Although much attention
is given in the literature to the measurement of
value in valuation studies, comparatively little
is said about the measurement of quantity. In
fact, as is clear from the results summarized
in the previous section, the estimation of
catches is the most difficult part of a fishery
valuation study, and it is unlikely that any two
studies will yield the same estimate for the
same fishery.
Quantities of outputs can be measured by
direct observation, such as the monitoring of
fish landings. Such data are often available
although it sometimes requires searching
through piles of paper in government offices.
However, these statistics often pertain to
only a portion of the fishery, such as the
commercial fishers, or catches from selected
landing sites. Nevertheless, this is useful for
measuring trends. Such data, while useful for
calibrating trends and estimates of total catch,
do not provide much information about the
value of fisheries at the household level.
The valuation of artisanal fisheries usually
requires an understanding of fishing activities
at the household level, as well as the context
of the household economy. To obtain this
level of information, primary data gathering
has usually been in the form of surveys of
households in the area, in order to obtain the
proportion of households fishing, and then
effort and catches of fishing households.
This is further discussed below under survey
methods.
�.�.� Measurement of price
Where market prices for harvested resources
are available, these should serve adequately
as measures of value (Barbier et al. 1997),
unless price distortions are expected.
The type of price used should be stated
explicitly in valuation studies. Prices used
are usually those accepted by the harvester
before any value is added to the resource by
marketing or processing. However, it may be
more appropriate to consider the full value
generated by a fishery, right up to the final
consumer or export. Thus, the value of a
commercial fishery should also include the
value added by processing and export, and
that of a recreational fishery should consider
knock-on effects. Market prices do usually
exist for most fisheries in southern and
eastern Africa. Indeed, many studies that
describe fisheries report a few market prices
although they do not go as far as using these
to compute values for the fishery.
Under certain conditions, market prices may
not reflect the true value of a resource. Prices
may be distorted by conditions of imperfect
competition, for example when local markets
are relatively isolated, or through government
intervention. If distortions are suspected, the
use of shadow prices is usually advocated
(Barbier et al. 1997), but only if they can be
adequately estimated (James 1991). Shadow
prices are corrected prices that account for
the distortions and aim to reflect the full value
of a commodity to society. They thus reflect
economic value rather than financial value.
However, the proper correction of distorted
prices relies on accurate diagnosis of the
direction and magnitude of the distortion,
which is often difficult.
If no market prices are available for a resource,
as is sometimes the case in subsistence
economies, then surrogate prices can be
used. There are several possible ways of
doing this (Barbier et al. 1997):
1�� Tropical river fisheries valuaTion: background papers To a global synThesis
(a) Barter or trade value: If the resource is
bartered or traded, e.g. fish for rice, then it
may be possible to estimate its value based
on the market value of a commodity for
which it is traded. This method requires
information about the rate of exchange
between two goods. If such trade is
not observed, the information can be
obtained using properly designed survey
instruments, e.g., ranking techniques in a
focus-group discussion.
(b) Substitute price: If a close substitute that
can be identified has a market value, then it
is possible to assign the value as the price
of the substitute. This requires information
about the degree of substitution between
different goods. For example, Majoro
(2000) used the market price of hake as a
substitute price for freshwater fish caught
in the Lesotho Highlands.
(c) Opportunity cost: Alternatively, it is
possible to derive a minimum value for a
commodity by estimating the opportunity
cost of inputs required for its harvest or
production.
(d) Indirect substitute price: In the absence of
all the above possibilities, and when the
substitute is also unpriced, then it may be
necessary to use the opportunity cost of
the substitute as a proxy for the value of
the commodity in question.
�.�.� Measurement of production costs
The costs of inputs such as fishing nets can
be estimated directly using market prices.
The costs of labor time are usually taken
as some proportion of the wage rate, or the
shadow price of labor. Where opportunities
for formal and informal employment are very
low, the shadow price of labour time to collect
natural resources approaches zero. This is a
complex issue, however, as all time could be
said to have an opportunity cost in terms of
other tasks or recreational activities that could
be carried out.
�.� survey Methods
Data are invariably scarce when it comes
to conducting valuation studies of artisanal
fisheries in eastern and southern Africa. Most
of the fisheries valuation studies described
in this review thus had a similar approach
to data gathering in that they entailed fairly
labor intensive household surveys for the
collection of primary data. In addition,
focus group discussions and key informant
interviews are also frequently employed, in
which complementary data and sometimes
supplementary data are obtained by means
of Rapid Rural Appraisal (RRA) techniques
(commonly misstated as Participatory
Rural Appraisal methods) borrowed from
sociology methods. Although questionnaire
surveys theoretically provide the most
statistically rigorous quantitative data, there
are many problems with such surveys that
are better addressed by the various RRA
techniques available. Turpie (1998); Turpie
et al. (1999); Boehm and Hall (1999); Turpie
(2000) and Turpie and Egoh (2002) used a
combination of household surveys, focus
groups and key informant interviews in their
studies. In addition, all of these studies
were preceded with a reconnaissance visit
to the study area to observe circumstances
and meet with villagers and leaders, after
which survey instruments were designed.
The initial reconnaissance-stage meetings
are always vital to obtain the cooperation
of the community being surveyed, as well
as to provide enough information for the
appropriate design of survey instruments.
�.�.1 focus group discussions and key informant interviews
These techniques are common in social
studies, and are useful in fisheries valuation
studies for the provision of general data
that do not need to be quantified at the

chapTer � 1��
household level. Focus group discussions
are usually held with groups of 5-10 people,
and while following a semi-structured line
of questioning, the discussions are allowed
to deviate from the questionnaire, or to
concentrate on a particular aspect when
appropriate. These discussions are used to
collect information of a generally applicable
nature, for example on seasonality of catches
and effort, descriptions of fishing methods
and their inputs, on markets and prices,
processing methods and transport. They are
also useful for obtaining information on the
control of the fishery and on perceptions of
its status or sustainability.
A typical focus group discussion is outlined in
Box 1. In the case of some resources such
as salt and palm leaves, enough information
can be obtained from focus groups to make
box 1 general structure of focus group discussions (Turpie �000)
FOCUS GROUP DISCUSSIONS
A. IntroductionsThe purpose of the discussion was explained, and members of the group were encouraged to be as open as possible about the issues to be discussed.
B. Resource descriptionAll species of natural resources were named and described in detail, indicating where they occur or are grown. Their treatment and uses were also described.
C. Rules of accessThe group was asked to describe how households gain access to resources, and what limitations exist on use.
D. Individuals involvedPeople were asked about the role of men, women and children in the production or harvesting of the resource.
E. EquipmentThe group was asked about the type of equipment used, its price, durability, and whether it is shared among households.
F. SeasonalityThe group was usually asked to describe seasonality in the availability and harvesting of certain resources. Some groups were also asked about seasonality of different agricultural activities (e.g., cultivating, harvesting).
G. Returns to effortThe group was asked how much could be harvested in a day or week during different times of year.
H. Prices and inputsSelling prices were obtained for each resource and for products made from these resources. Natural resource inputs into crafts and other products were also quantified.
I. Changes in availabilityMembers of the group were asked to describe and explain changes in availability over time.

1�� Tropical river fisheries valuaTion: background papers To a global synThesis
estimates of total production and value that
are comparable to those obtained by using
more detailed survey data (Turpie 2000),
but this method has not been successful for
fisheries because of their relative complexity.
In addition to, and sometimes instead of,
formal focus group discussions, informal
discussions can be held with members of the
fishing community. This is often particularly
useful, especially when the interviewee has
recently returned from fishing, as it allows the
researcher to observe fishing equipment and
catches, and to adapt questioning in a more
natural manner. This makes respondents
far more relaxed than in the rather formal
setting of the focus group. It allows gathering
information that cannot be anticipated in the
formal surveys, and is better for obtaining
information on things that people are fairly
reluctant to disclose when in groups. Women
tend to be particularly responsive to this type
of walking and talking tactic. Furthermore, in
all cases where such an informal discussion
was initiated by Turpie (2000), the initial
one-on-one interaction ended up with other
people voluntarily joining in to provide more
information, which was a better way of
assembling a group than the more formal
nature of the focus group method. The use
of a female interviewer and interpreter is
essential for interviewing women.
Seasonality can be described qualitatively,
but patterns produced cannot be translated
to real variation. In other words, it is not
possible to take catch in the current month and
extrapolate it to the rest of the year based on
these data, no matter how appealing. Prices
are problematic too. Fish prices are highly
variable and do not go according to weight.
The researcher is left with the problem of
converting prices per fish (measured relative
to the size of a hand), often of dried fish, into
price per kilogram. Using an average price
per fish (Cox et al. 2001) does not produce a
reliable valuation of catches.
�.�.� household surveys
Most fishery valuation studies have relied on
household survey data to provide quantitative
data on fish catches. These are then used
to estimate total annual catches at the
household level and for the area as a whole.
Although catches can be estimated in other
ways, household surveys are usually the
only reliable way of estimating the number or
proportion of fishing households in a study
area.
The structure of household questionnaire
surveys varies between studies, but it may
typically follow the basic structure outlined in
Box 2. A fisheries valuation study may or may
not include other natural resources, depending
on the purpose and context of the study (see
discussion below). In the example given, the
questionnaire includes questions about the
harvesting of all major categories of natural
resources, as well as value added through
processing and income generated; and it
also investigates agricultural production. The
most difficult questions are posed early in the
questionnaire, with agricultural production
at the end to counter the effects of survey
fatigue. Questions on fishing would thus be
close to the beginning of the questionnaire.
A questionnaire such as this takes about an
hour to complete when questioning is about
all resources.
Most of the studies described above
involved a single household survey in which
households were questioned just once about
their harvesting of resources. In a couple of
cases, the surveys were repeated during the
dry season and wet season. Where there is
significant temporal variation in any of the
resource use activities in the study, or where
the use of resources is irregular or erratic,
it is preferable to survey households more
than once, or as often as possible. This is
especially important for fishery resources.
Most fishers cannot reasonably be expected
to recall their catches with accuracy over a

chapTer � 1��
box � general structure of household surveys used in Turpie et al. (1���), Turpie (�000) and Turpie and egoh (�00�)
HOUSEHOLD SURVEYS
A. Household informationHousehold size and composition
B. Relative value of household productionRespondents are asked to apportion a pile of beans among eight different sources of income (crops, fishing, hunting, wood products, plant products, salt making, livestock, and other cash income from trade etc.) to indicate their relative contribution to household income in an average year.
C. Natural resourcesRespondents are asked about fishing, wood products (forest or mangrove), honey, hunting, reeds, papyrus, grasses, palms, food and medicinal plants, clay and salt production. For each resource, they are asked about the following topics, as applicable:
• whether they harvest the resource, and in the case of fishing, household fishing effort and equipment
• amount harvested over a specified period • amount sold and price per unit • amount of products produced from natural resources • amount sold and prices obtained
D. LivestockQuestions are asked on the following topics:
• numbers of small and large stock • production and sales over a specified period, and prices obtained • livestock losses to wild animals
E. CropsQuestions are asked on the following topics:
• total area cultivated, and crops grown • amount produced over a specified period for each crop • amount sold or exchanged, and price obtained • crop losses to wild animals • household reaction to poor crop years
F. Cash incomeRespondents are asked about cash income from wages, pensions, and absent family members.
period longer than a few days or a couple
of weeks. Yet, fishers are often asked to
recall catches over periods of months, or to
integrate their remembered catches into an
average per month. Nearly all of the studies
reviewed here can be heavily criticized in this
respect. Either fishers were expected to recall
catches over too long a period, or surveys
were not repeated enough times to yield
reliable variation in catches over the year.
Another particularly difficult issue is the choice
of units for quantification. Again, while this is
an issue for most resources, it is a particularly
1�� Tropical river fisheries valuaTion: background papers To a global synThesis
problematic issue in the case of fisheries.
Fishers transport and sell their catches in
a variety of ways, such as in baskets of
different sizes, tied bundles, buckets etc.
This makes the enumeration of catches and
sales extremely difficult to reduce to a total
catch weight, unless thorough research is
done beforehand to assess the capacity of
these different units and the weights of the
typical species and sizes caught. Thus,
focus group discussions, key informant
interviews and direct observation are very
important as precursors to survey design.
Furthermore, since fish are sold in different
forms, such as fresh, dried or smoked, the
enumeration of selling quantities has to be
equally meticulous.
No matter how carefully designed surveys are
for the quantification of household catches,
the presence of outsiders in the fishery will
always confound estimates of total catch,
and thus total value, made in this way. Yet,
extending the survey to the temporary
households in fishing camps may not be
helpful in this regard because of the statistical
difficulties involved. None of the surveys
reviewed here have attempted to carry out
quantitative interviews of fishers in fishing
camps, although focus group discussions
are routinely held in such camps.
As important as the design of the
questionnaire is the way in which it is
worded and administered. The potential
for communication errors is great, and may
occur in translation or due to the use of
inappropriate terminology. It is thus very
important that, after translation into the local
vernacular, the final wording is checked by
someone who has an understanding of the
purpose of the questionnaire as well as the
local terms. Wording should not be so formal
as to intimidate simple households. There are
many other subtleties about survey design
that are discussed in the literature but will
not be delved into here. It is important to
note, however, that these aspects are seldom
given much attention in the write-up of
valuation studies. In particular, details of pre-
testing and the way in which survey designs
were changed after such testing are never
given, which means that new researchers do
not benefit from the lessons learned before
by others. Even the final questionnaires
developed for studies are seldom published
with the studies. There is a danger in copying
questionnaires from other studies, though, as
their shortcomings may not be apparent to
new users, and not all aspects are necessarily
appropriate to the next situation. On the
whole, however, basic design is transferable
to a large variety of fisheries as long as the
habitat and way of life are relatively similar.
�.� analyzing and interpreting values
Value can be expressed in a number of ways,
with different values being appropriate in
different contexts. In the studies reviewed
above, values were expressed as both
financial and economic values. The financial
values include gross income (the total market
value of production), net income (the total
subsistence plus cash value to households net
of input costs but not labor costs), and cash
income. Economic values are calculated as
gross and net values, on the basis of financial
values, but using shadow prices. Turpie et al.
1999 expressed net income after labor costs,
but there has been some debate suggesting
that the latter calculation should also exclude
labor costs (K. Goran-Maler, pers. comm.).
While economic values are used to articulate
the contribution of fisheries to the national
economy, in most cases the financial values
are the most useful ones as they reflect
the direct values of fisheries to users and
surrounding communities. Gross values
are the most commonly reported, but it is
important to recognize that these values are
generated at a cost to the household, apart
from the labor inputs involved. There has
chapTer � 1��
been insufficient emphasis on the opportunity
cost of labor and returns to fisheries as part
of a mixed household strategy. The value
of fisheries in terms of cash income is also
an important consideration, because even
households that can meet all of their own
subsistence needs have to generate cash
income for goods and services such as health
and schooling.
Calculation of net incomes or returns to
capital or labor requires far more data than
simple estimates of gross value. It requires
identification of capital inputs, estimates of
depreciation, of variable costs, and of labor
costs. These are not always easy to estimate
since equipment is often shared and fishing
equipment such as fence traps is sometimes
difficult to value. Nevertheless, the collection
of such data is not particularly difficult.
Turpie et al. 1999, Turpie 2000 and Turpie
and Egoh 2002 developed a spreadsheet
model to calculate the various types of value
outlined above; this was based on the model
developed by the Namibian Directorate of
Environment Affairs (e.g., Ashley et al. 1994;
Barnes and de Jager 1995, 1996; Ashley
and Barnes 1996; Barnes 1996). The multi-
page spreadsheet includes a page for each
resource as well as the front page for entering
general data, such as the characteristics of
each ecoregions of the study area, equipment
used in each enterprise, and the price and
durability of equipment. The development of
the model was particularly useful in identifying
exact data needs in survey design.
The values generated in valuation studies
can be fairly meaningless to decision-
makers and policymakers if they are not
given a context. Thus, it is vital to show
what fisheries values mean to households
in terms of their contribution to households’
total annual income, to a study area in terms
of their contribution to the total economic
activity, or to the national economy in
terms of their contribution to the regional or
national income. Many valuation studies fall
short of doing this. The most common way
of expressing value in the studies reviewed
here was in the context of total household
income. This is the most costly in that it
involves the valuation of all resources in the
study, not just fisheries. However, the value
of fisheries is much clearer when seen in the
context of agricultural incomes, for example,
which is traditionally of great concern to
policymakers.
Nevertheless, it is important to bear in mind
that percentage contribution to household
income is not the only facet to fishery values
that should be considered. The value of
fisheries in terms of risk spreading needs to
be evaluated. Even if households only rely on
fish once in six or seven years, during drought,
for example, the fishery can still be of critical
importance to the population. None of the
studies have articulated this in a quantitative
way.
�.�.1 issues of Time, scale and sustainability in value calculation
There are no limits to the spatial extent to
which some costs and benefits associated
with fishing areas could be felt, and it is thus
important to be explicit about the scale at
which benefits and costs are being
considered and compared in order to
answer the question: value to whom? Costs
and benefits can be considered at a local,
national, regional and global scale. Local-
scale benefits may incur regional-scale costs,
and vice versa. Local communities have to
be defined on the basis of explicitly stated
criteria.
In most cases, the valuation studies
concentrate on estimating the annual values
of fisheries. However, the value of a fishery
should strictly include some consideration

1�� Tropical river fisheries valuaTion: background papers To a global synThesis
of future values. The net present value of
a fishery would be the present value of the
flow of income from the present until some
specified time in the future. The calculation
involves setting a time frame for the analysis
and the relative weighting of future and
present values, through the choice of
discount rate. Economic analyses are usually
conducted using a time frame of 10 to 50
years. While longer time frames are of more
interest to ecologists, shorter time frames are
more commonly used because the lifespan of
policy is usually relatively short, and because
of the effect of discounting on future values.
Under most circumstances, values accruing
beyond 20 years into the future are rendered
negligible in present terms by discounting,
and so 20 or 30 years is a common time frame
for analysis. The discount rate can be based
on the prevailing opportunity cost of capital,
but it should be lower if long-term social
and environmental benefits are considered
paramount.
Without mentioning future values, most
valuation studies implicitly assume that
the resources are used both sustainably
and optimally. Both the current value and
its expected path over time affect the net
present value of a fishery (Figure 1). With a
zero discount rate, the present values of the
benefit streams in Figure 1 would be ranked
as follows: NPV (a) > NPV (b) > NPV (c) > NPV
(d). In other words, the most optimal and
sustainable use path (a) yields the highest
value. If resources are underutilized (path b)
or have been mined to low output levels by
past overutilization (path d), then the valuation
exercise is in danger of underestimating
the value of the area. If on the other hand,
resource use is assessed at a time when
fisheries are being overutilized at levels above
the maximum sustainable yield (path c), then
the exercise will result in an overestimation
of the value. To some extent, the effects of
over- or underutilization may also be reflected
in relatively high and low prices and input
costs respectively. It is interesting to note
that, even if the future path of the net benefits
of resource use were known, a high discount
rate would tend to favor the overutilization of
resources. Thus, beyond a certain discount
rate, the present value of path (c) will be higher
than the present value of the sustainable path
(a), because future benefits in path (a) will be
worth very little to the present generation.
Thus, in fisheries valuation studies, it is
imperative that the level of use in relation to
optimal sustainable yields is investigated
in order to produce a valid interpretation of
the results of the valuation methods applied,
(c)
(b)
(a)
(d)
Time (years) 50
Bene
fits
0
figure 1: hypothetical, undiscounted benefit stream from a flow of consumptive use of natural resources under base-year conditions of (a) optimal sustainable use, (b) sustained underutilization, (c) early-stage overexploitation and (d) long-term overexploitation
chapTer � 1��
and a realistic estimate of net present
value. The determination of optimal yields
requires detailed biological information on the
dynamics of resource availability as well as
use. None of the studies reviewed here has
had sufficient biological data to estimate the
sustainability of the fisheries involved.
Ideally, such studies should be preceded
by a biological understanding of the fishery
resource and its status. These elements
are important in order to put current values
into a longer time frame. However, fisheries
biologists are often reticent to estimate how
sustainable a fishery is due to the need to
gather large quantities of data to perform
such an assessment properly. The use
of techniques such as Rapfish, which is
essentially an assessment of characteristics
such as the above, might provide a short cut
to assessing the sustainability of catches.
�.�.� considering potential value
Interesting situations also arise where
fisheries potential exists but is not exploited.
For example, capture and consumption of
freshwater fish has never been part of the
traditional culture of the Xhosa people, who
reside in the Eastern Cape, South Africa. The
government, however, recognizes that the
existing resources have the potential to be
exploited as small-scale fisheries for the relief
of poverty in the region. This has led to a
brief investigation of the potential value that
they could generate (Andrew et al. 2000), but
the study only went as far as estimating what
a small group of fishers could earn, and not
what the resource could support in total.
�.� estimating impacts on value due to environmental change
Estimation of a change in value due to a
proposed environmental change, such
as alteration of river hydrology by dam
construction, is carried out using the Change
in Production approach (e.g., Ellis and
Fisher 1987; Barbier 1994). This approach is
relatively straightforward in theory, but it can
be more complicated in practice because it
would involve the estimation of a production
function.
Riparian fisheries production is dependent
on the qualities of the area, such as river flow
and water quality, as well as the inputs, such
as labor involved, as displayed in the following
production function:
Q = f (S, Xi…Xn)
where Q is the catch produced for a given set
of inputs, including flow S, and other inputs
Xi…Xn (after Barbier 1994). The quality of the
result is largely dependent on the amount and
quality of data that is entered into the model,
as well as the quality of the model itself. The
production function approach is considered
to be a particularly promising approach
to valuing certain environmental functions
(Barbier 1994). However, it is important that
the relationship between the environmental
attributes and the economic activity they
contribute to is well understood. Ideally, this
approach demands an understanding of the
relationship between the output and the state
of the environment, or the physical effects
on production of changes in a resource, and
should be modeled by taking dynamic functions
into account. This is usually achieved through
time series or cross-sectional analysis, and
thus usually requires data spanning a number
of years or comparable data from a number
of areas. The production function approach
makes it possible to examine the effects of
marginal changes in the environment such
as incremental changes in water allocation to
other uses.
Estimation in reality is done over a relatively
short time period, thus requiring some level
of innovation in shortcutting the theoretical
1�0 Tropical river fisheries valuaTion: background papers To a global synThesis
methods outlined above. The main problem
lies in predicting future supplies of fish (a
biological problem), although predicting future
prices is also problematic. In the Lesotho
Highlands Development Project, biologists
were required to estimate the percentage
change in fish resulting from a change in flow.
Thus, in essence they applied a “gut-feel”
production function but did not attempt to
describe it explicitly. Majoro (2000) provides
an exemplary valuation of these impacts,
taking price elasticity and uncertainty into
account. Emerton (1994) was more fortunate
in that she was able to consider the predicted
gradual change in fishery production over time
as a result in changed hydrology, and used
this to compute a present value. The value
was crudely and rapidly estimated, but it was
based on an apparently detailed ecological
assessment (Emerton 1994). In comparison,
Majoro (2000) produced a comparatively
sophisticated analysis of impacts complete
with risk and sensitivity analyses, but these
were based on a fairly crude assessment of
change, treated as an instantaneous change
from one level of production to another.
�.� should valuation be carried out More efficiently or rapidly?
The way in which valuation studies are
currently carried out is considered to be quite
intensive (Dugan 2002). Indeed, most of the
studies cited above were fairly substantial
undertakings, with each one taking at least
two months (not necessarily contiguous), or
usually much longer, to complete. Studies
involve a reconnaissance visit by the lead
researchers, in which time is taken to
understand the fishery, its heterogeneity,
and the fishers, as well as to hold essential
meetings with the local community and
representatives. This is followed by a series
of focus groups and key informant interviews,
and then a survey design phase. Enumerators
are then selected and trained, questionnaires
and enumerators are tested in the field and
the necessary refinements are made before
the proper survey is carried out. The actual
household survey can be carried out relatively
quickly, especially if several enumerators are
used, but this also depends on the difficulty
of traveling around the study area. Most
of the study areas described above do not
have conventional road access to villages
and fishing areas, and boats other than local
canoes are sometimes hard to come by or
to launch. Following field surveys, data have
to be entered, checked, and finally analyzed
for report writing. The final phases can be
immensely time consuming if surveys were
badly designed, such as when fish catches
are enumerated in a variety of ways that need
conversion to common units, or if questions
have obviously been badly designed and
good answers have to be sorted from
possible misunderstandings. How well a
valuation study is designed has a tremendous
impact on the efficiency with which it can be
carried out, as well as on the reliability of
the estimates produced. This obviously has
important implications for research costs.
Valuation estimates can be made more
roughly and for lower budgets, but there are
probably some tradeoffs involved, particularly
in the certainty of such estimates. Several
means of rapid assessment exist, including
the following:
(a) Simple estimates of aggregate value
based on existing catch statistics;
(b) Reduced sample sizes for household
surveys;
(c) “Benefits transfer”;
(d) Using data from focus group discussions
and key informant interviews; and
(e) “Bean games”.
chapTer � 1�1
The aggregate gross annual value of a fishery
is simply the catch multiplied by average
price. Thus the most rapid valuation of a
fishery can be obtained using government
statistics on catches, and current price
data that are fairly easily obtained. Two
main problems with this method, as alluded
to above, are that catch data are often
unreliable, and that a single aggregate value
does not give sufficient information on which
to make either management or development
decisions. In particular, there is a danger of
underestimation of the size of the fishery and
very little indication of its importance to the
local population.
Recognizing the heterogeneity of fisheries
along river systems is a very important
part of determining their value, both at the
aggregate and the household levels. This
division of an overall area into ecoregions or
river reaches (see Majoro 2000; Turpie 2000;
Turpie and Egoh 2002), allowing some form of
stratified random sampling, provides a better
description of the way in which resources are
used in conditions of differing fish availability
and population characteristics. In this way,
the values are better understood and impacts
of environmental change are not incorrectly
generalized across all households and areas.
In general, within areas that are relatively
homogenous, e.g., within an ecoregion,
sample sizes can be relatively small. However,
as the variability in fisheries data supplied by
households is generally greater than for other
resources, larger sample sizes are needed for
fisheries valuation than for valuing woodland
resources, for example. With the exception of
the study by Turpie and Egoh (2002) in which
nearly all households were surveyed, none
of the studies reviewed here had involved
particularly large sample sizes, and in most
cases decreasing costs by decreasing
households sampled would not have been
justifiable.
Interestingly, at a broader scale, there
appears to be remarkably little variation in the
household livelihood strategies and fishery
values among communities surrounding
different floodplain wetland systems in
southern and eastern Africa. This suggests
that benefits transfer could be applied to some
extent. Benefits transfer is the ultimate in rapid
valuation, being application of results of other
studies to similar areas under consideration
(Georgiou et al. 1997; Barbier et al. 1997).
However, its use implies a number of inherent
assumptions about the preferences and
socio-economic characteristics of the study
area (OECD 1994) and is not something that
should be done lightly. As an example at the
other end of the extreme, no generalizations
or benefits transfer could be validly applied
across different estuaries in South Africa
because each estuary is unique in terms
of its size and biophysical characteristics,
population density, accessibility, and
uses (e.g., recreational, commercial and
subsistence fisheries).
Turpie (2000) used two methods for valuing
several different resources in the Rufiji
floodplain area in order to double check
estimates. For example, focus groups gave
information on the proportion of households
engaged in an activity, seasonal patterns in
harvesting, average harvests per time period
in high and low seasons, proportions sold,
selling prices and input prices. Similar data
are yielded from household surveys. Turpie
found that the results generated from the
two sources of data were remarkably similar
in many cases (e.g., salt production, timber
harvesting), but she did not attempt this for
fisheries as the data yielded in discussions
were often highly variable. Furthermore, the
estimates obtained from household survey
data are regarded as statistically valid,
whereas the former are not.
In order to assess the importance of fisheries
to local livelihoods, Turpie et al. 1999, Turpie
2000, and Turpie and Egoh 2002 asked
households to describe the contribution that
fisheries and other sources of income made

1�� Tropical river fisheries valuaTion: background papers To a global synThesis
to household income (including subsistence
value). This was done by apportioning a
pile of beans or stones among six or so
categories of income (fish, agriculture,
livestock, pensions, woodland resources,
etc.). The purpose was to check household
perceptions against actual incomes estimated
on the basis of quantitative data, as well as to
evaluate this as a potential future short cut to
estimating values. Used in the latter sense,
it was suggested that overall values could be
calculated for all different sources of income
on the basis of the relative values given if the
value of just one or two of these was known.
The anchor values would be chosen on the
basis of the component that was easiest to
value. The results of using these bean games,
which have been applied both in focus groups
and in household surveys, have been variable
(Turpie et al. 1999; Turpie 2000). In most
cases, household perception of the relative
value of resources is remarkably close to that
estimated on the basis of quantitative survey
data. However, when there is a discrepancy
it is difficult to say whether villagers’
perceptions or household calculations are
more accurate.
Dugan (2002) suggests that simpler
methodologies need to be developed which
can provide information more directly to
communities and to other key stakeholders on
an ongoing basis. The latter would of course
require ongoing monitoring of key parameters,
and possibly also the establishment of
research networks. In addition, they suggest
that existing valuation techniques could be
made more readily applicable in developing
countries with limited institutional research
capacity. In other words, it is necessary to
determine what critical information is required
in order to manage riparian fisheries optimally,
and how this information can be generated
on a regular basis (Dugan 2002).
Such a program could easily be developed,
but it should not replace the detailed study
of riparian fisheries. First, much of the
work that has been carried out so far has
concentrated on obtaining average values,
and more, not less, detailed research is
needed to understand production functions
and the marginal values in the fisheries and
household coping systems. This would
require large-scale surveys and econometric
modeling to produce dynamic ecological
economic models. It is only when this level
of understanding is achieved that impact
studies can hope to improve their (currently
rather low) confidence in the prediction
of impacts of changes in flow on fishery
values. Second, detailed studies provide the
important baseline against which to monitor
fisheries, and form the basis for choosing the
key parameters that need to be monitored
over time. Thus, it is recommended that
detailed studies of systems continue, and
that monitoring programs be set up in areas
in which fisheries and their values are well
described. Such monitoring programs should
aim to track changes in demand and supply
and should collect data on prices for standard
units (species, size), household and aggregate
fishing effort, catches and management.
Although monitoring programs involving local
fishers have been implemented successfully
(Ticheler et al. 1998), these programs are
sometimes set back by poor data collection
performed by local field enumerators (pers.
obs.; REMP, pers. comm.), possibly due
to lack of direct and regular supervision by
those with an interest in the outcome.
As a result, baseline fishery valuation studies
should probably become more intensive in
future, and rapid evaluations should only be
carried out after these studies for monitoring
purposes. It is probably true to say that
the use of more rapid techniques in fishery
valuation studies would be accompanied
by a loss of accuracy and resolution, and
increasing uncertainty. Ultimately, the rapidity
with which a study is carried out should be
determined on the basis of its purpose, and
with its potential future application in mind.

chapTer � 1��
REFERENCES
Andrew, T.G., Q.A. Rouhani and S.J. Seti. 2000. Can
small-scale fisheries contribute to poverty
a l lev ia t ion in t rad i t iona l ly non-f ish ing
communities in South Africa? African Journal
of Aquatic Science 25:49-55.
Arthington, A.H., J.L. Rall and M.J. Kennard. 1999. Fish
specialist report. Consulting services for the
establishment and monitoring of the instream
flow requirements for river courses downstream
of LHWP dams. Unpublished report to Southern
Waters Ecological Research and Consulting.
Ashley, C. and J. Barnes. 1996. Wildlife use for economic
gain: the potential for wildlife to contribute to
development in Nambia, 23 pp. DEAResearch
Discussion Paper No. 12.
Ashley, C., J. Barnes and T. Healy. 1994. Profits, equity,
growth and sustainability: the potential role of
wildlife enterprises in Caprivi and other
communal areas in Namibia, 40 pp. DEA
Research Discussion Paper No. 2.
Barbier, E.B. 1994. Valuing environmental functions: tropical
wetlands. Land Economics 70:155-173.
Barbier, E.B., M. Acreman and D. Knowler. 1997. Economic
valuation of wetlands: a guide for policy makers
and planners. Ramsar Convention Bureau, Gland,
Switzerland.
Barnes, J.I. 1996. Economic characteristics of the demand
for wildlife-viewing tourism in Botswana.
Development Southern Africa 13:377-397.
Barnes, J.I. and J.L.V. de Jager. 1995. Economic and
financial incentives for wildlife use of private
land in Namibia and the implications for policy,
21 pp. DEA Research Discussion Paper No. 8.
Barnes, J.I. and J.J.V. de Jager. 1996. Economic and
financial incentives for wildlife use of private
land in Namibia and the implications for policy.
South African Journal of Wildlife Research
26:37-46.
Bell-Cross, G. 1971. Weir fishing on the Barotse flood plain.
Fisheries Research Bulletin, Zambia 5:331-
340.
Bell-Cross, G. 1974. A fisheries survey of the Upper Zambezi
river system. Occasional Papers of the National
Museums and Monuments of Rhodesia 5:279-
338.
Bethune, S. and K. Roberts. 1991. Checklist of the fishes
of Namibia for each wetland region. Madoqua
17:193-199.
Boehm, C. and D. Hall. 1999. Sociology specialist report.
Consulting services for the establishment and
monitoring of the instream flow requirements
for river courses downstream of LHWP dams.
Unpubl ished report to Southern Waters
Ecological Research and Consulting.
Buchan, A.J.C., A.B. Cunningham and P. la Hausse de
Lalouviere. 1988. Patterns of resource use on
the Pongolo River floodplain. Unpublished
report.
Chipungu, P.M. 1981. The impact of the Kafue Gorge Dam
on the Kafue floodplain fishery, p. 121-129. In
J.M. Kapetsky (ed.) Seminar on river basin
management and development. CIFA Technical
Paper No. 8. Food and Agriculture Organization
(FAO), Rome.
Chitembure, R.M. 1995. 1994 fisheries statistical report.
Department of Fisheries, Zambia.
Chitembure, R.M. 1996. 1995 fisheries statistical report.
Department of Fisheries, Zambia.
Coke, M. and R. Pott. 1970. The Pongolo Floodplain Pans:
a plan for conservation. Unpublished Report,
Natal Parks Board, Pietermritzburg. 34pp.
Conrad, J. M. and C. W. Clark. 1987. Natural resource
economics: notes and problems, Cambridge
University Press, Cambridge.
Cox, D., M. Mander, D. Stipcich, B. Wiseman, F. Lewis and
S. Ngubane. 2001. Incorporating economic
considerations into the determination of the
environmental reserve: methodology used and
estimates made for the value of selected
ecosystem services supplied by the Crocodile
River Catchment. Unpublished report, Institute
of Natural Resources.
Crookes, D. and M. de Wit. 2002. Environmental economic
valuation and its application in environmental
assessment: an evaluation of the status quo
with reference to South Africa.
Direcção National de Florestas e Fauna Bravia (DNFFB).
1998. Avaliação dos recursos florestais,
faunísticos e pesqueiros no delta do Zambeze.
Direcção National de Florestas e Fauna Bravia,
Ministério da Agricultura.

1�� Tropical river fisheries valuaTion: background papers To a global synThesis
Dugan, P.J. 2002. Sustaining productivity of aquatic
ecosystems. Challenge Programme: Water and
Food Background Paper No. 3.
Ellis, G.M. and A.C. Fisher. 1987. Valuing the environment
as input. Journal of Environmental Management
25:149-56.
Emerton, L. 1994. An economic valuation of the costs and
benefits in the lower Tana catchment resulting
from dam construction, 42 pp. Report prepared
for Acropol is Kenya Limited. Centre for
Biodiversity, National Museums of Kenya.
Emerton, L. 1996. Valuing the environment: case studies
from Kenya. African Wildlife Foundation,
Nairobi.
Food and Agriculture Organization (FAO). 1979. Summary
report on the evaluation of the probable impact
of the Stiegler’s Gorge Dam on the fish and
prawn fisheries of the Rufiji River and delta.
Project Technical Paper No. 3.
Gammelsrod, T. 1996. Effect of Zambezi River management
on the prawn fishery of the Sofala Bank, p.
119-123. In M.C. Acreman and G.E. Hollis (eds.)
Water management and wetlands in sub-
Saharan Africa. World Conservation Union
(formerly IUCN).
Georgiou, S., D. Whittington, D. Pearce and D. Moran. 1997.
Economic values and the environment in the
developing world.
Heeg, J. and C.M. Breen. 1982. Man and the Pongolo
floodplain. South African National Scientific
Programmes Report, No. 56. A report of the
committee for Inland Water Ecosystems, National
Programme for Environmental Sciences.
Hobson, A.J. 1979. The freshwater fisheries in the Lower
Rufiji River with particular reference to possible
changes resulting from modifications to the
environment by the proposed dam at Stiegler’s
Gorge, p. 61. Unpublished report. FAO Fisheries
Department, Rome.
Holtzhausen, J.A. 1991. Freshwater fisheries of Namibian
wetlands – a review. Madoqua 17:191-198.
Jackson, D.C. and G. Marmulla. 2001. The influence of
dams on river fisheries, p. 1-44. In G. Marmulla
(ed.) Dams, fish and fisheries, opportunities,
challenges and conflict resolution. FAO Fisheries
Technical Paper No. 419. FAO, Rome.
James, R.F. 1991. Wetland valuation: guidelines and
t e c h n i q u e s . A s i a n We t l a n d B u r e a u –
Indonesia.
Jubb, R.A. 1967. Freshwater fishes of Southern Africa. A.A.
Balkema, Cape Town.
Kelly, D.W. 1968. Fishery development in the central Barotse
floodplain. FAO/UNDP Report, 83 pp.
LaFranchi, C. 1996. Small-scale fisheries and subsistence
use of natural resources in Namibian communal
areas, 81 pp. The World Wildlife Fund (USA)
L iv ing in a Fini te Environment (“LIFE”)
Programme.
Lamberth, S.J. and J.K. Turpie. 2003. The role of estuaries
in South African fisheries: economic importance
and economic implications. African Journal of
Marine Science 25:131-157.
Majoro, M. 2000. Economics specialist report. Consulting
services for the establishment and monitoring
of the instream flow requirements for river
cou r ses do wns t r eam o f LHWP dams .
Unpublished report for Southern Waters
Ecological Research and Consulting.
Mapunda, X.E. 1981. The economic impact of the fisheries
of the Kilombero River Basin on the Morogoro
region of Tanzania, p. 90-95. In J.M. Kapetsky
(ed.) Seminar on river basin management and
development. CIFA Technical Paper No. 8. FAO,
Rome.
Marmulla, G. 2001. Dams, Fish and Fisheries. Fisheries
and Agriculture Organization (FAO), Rome.
166 pp.
Masundire H. 1996. The effects of Kariba Dam and its
management on the people and ecology of the
Zambezi River, p. 107-118. In M.C. Acreman
and G.E. Hollis (eds.) Water management and
wet lands in sub-Saharan Afr ica. Wor ld
Conservation Union (formerly IUCN).
Mendelsohn, J. and C. Roberts. 1997. An environmental
profile and atlas of Caprivi. Directorate of
Environmental Affairs, Ministry of Environment
and Tourism.
Merron, G.S. and S.K. Weldrick. 1995. Fisheries Management
of the Phongolo Floodplain. J.L.B. Smith Institute
of Ichthyology, 130 pp.
Merron, G.S., M.N. Bruton and P. la Hausse de Lalouviere.
1993. Implications of water release from the
Pongolapoort Dam for the fish and fishery of
the Phongolo floodplain, Zululand. Southern
�45
African Journal of Aquatic Sciences 19:34-
49.
Mwalyosi, R.B.B. 1993. Management of the Rufiji Delta as
a wetland. In G.L. Kamukala and S.A. Crafter
(eds) Wetlands of Tanzania. IUCN Wetlands
Programme.
Organization for Economic Cooperation and Development
(OECD). 1994. The economic appraisal of
environmental projects and policies: a practical
guide. OECD, Paris.
Scudder, T. and T. Conelly. 1985. Management systems for
riverine fisheries. FAO Fisheries Technical Paper
No. 263. FAO, Rome.
Bonzon, S. 1993. Selected aspects of African fisheries: a
continental overview. FAO Fisheries Circular No.
810, Revision 1. FAO, Rome.
Simwinji, N. 1997. Summary of existing relevant socio-
economic and ecological information. Report
to IUCN on Zambia’s Western Province and
Barotseland.
Sørensen, C. 1998. Fisher, farmer, forester: smallholder
management in the Rufiji Delta of Tanzania. A
field report presented to the Danish Council for
Development Research.
Sweco/SwedPower. 1982. Preinvestment Report, Part 5.
Ecology. 177 pp. Stockholm, Sweden.
Ticheler, H., J. Kolding and B. Chanda. 1998. Participation
of local fishermen in scientific fisheries data
collection, a case study from the Bangweulu
Swamps, Zambia. Fisheries Management and
Ecology 5:81-92.
Timberlake, J. 1997. Biodiversity of the Zambezi Wetlands:
review and preliminary assessment of available
information. Phase 1 - Final Report. Consultancy
Report for IUCN - Regional Office for South
Africa. 232 pp.
Turpie, J.K. 1998. Impact of the proposed Maguga Dam,
Swaziland: resource economics specialist study.
Unpublished report to Afridev.
Turpie, J.K. 2000. The use and value of natural resources
of the Rufjiji floodplain and delta, Tanzania.
Unpublished report to IUCN (EARO). 108 pp.
Turpie, J.K. and B. Egoh 2002. Contribution of the natural
environment to rural livelihoods around Lake
Liambezi, eastern Caprivi. Unpublished report
for Afridev’s Environmental assessment study
for the Caprivi Sugar Sector project. 68 pp.
Turpie, J.K., B. Smith, L. Emerton and J.I. Barnes. 1999.
Economic value of the Zambezi Basin wetlands.
Unpublished report to IUCN (ROSA). 346 pp.
Tvedten, I., L. Girvan, M. Masdoorp, A. Pomuti, and G. van
Rooy. 1994. Freshwater fisheries and fish
management in Namibia: a socio-economic
background study. Unpublished report, University
of Namibia. 153pp.
Van der Waal, B.C.W. 2000. Fish as a resource in a rural
river catchment in the Northern Province, South
Africa. African Journal of Aquatic Science
25:56-70.
Van der Waal, B.C.W. 1991. A survey of the fisheries in
Kavango, Namibia. Madoqua 17:113-122.
Van der Waal, B.C.W. 1990. Aspects of the fishery of the
eastern Caprivi, Namibia. Madoqua 17:1-16.
Van der Waal, B. and P.H. Skelton. 1984. Checklist of fishes
of Caprivi. Madoqua 13:303-320.
Van Gils, H. 1988. Environmental profile of Western Province,
Zambia. ITC report to Provincial Planning Unit,
Mongu, Zambia.
Walmsley, R.D. and C.P.R.E. Roberts. 1989. Changing
patterns of resource use on the Pongolo River
Floodplain. Proceeding of a symposium.
Ecosystems Programmes Occasional Report
No. 36. Foundation for Research Development
and the Institute for Natural Resources.
145 pp.
Welcomme, R.L. 1974. A brief review of the floodplain
fisheries of Africa. African Journal of Tropical
Hydrobiology and Fisheries. Special Issue No.
1:67-76.
Welcomme, R.L. 1975. The fisheries ecology of African
floodplains. CIFA Technical Papers 3, 51 pp.
Welcomme, R.L. 1978. Some factors affecting the catch
of tropical river fisheries, p. 266-277. In
Symposium on river and floodplain fisheries in
Africa, FAO, 21-23 November 1977, Bujumbura,
Burundi.
Willoughby, N.G. and D. Tweddle. 1977 The ecology of the
commercially important species in the Shire
Valley fishery, Malawi, p. 137-152. In Symposium
on river and floodplain fisheries in Africa, FAO,
21-23 November 1977, Bujumbura, Burundi.
World Commission on Dams (WCD). 2002. Dams and
development: a new framework for decision-
making. Earthscan, London. 404 pp.

�46

�47
Ana Norman-Lpez and James P. Innes CEMARE (Centre for the Economics & Management of Aquatic Resources)University of PortsmouthLocksway RoadPortsmouth PO4 8JFHampshireUnited KingdomE-mails: [email protected] [email protected]
Review of River Fisheries Valuationin Tropical Asia
C H A P T E R 4
1�� Tropical river fisheries valuaTion: background papers To a global synThesis
Contents - Chapter 4
Abstract 150
Acknowledgements 150
1. Introduction 151
2. ConceptualandMeasurementIssues 151 2.1 Economic Value 151 2.2 Economic Valuation of the Natural Environment 152 2.2.1 Reasons for the Economic Valuation of Natural Resources 152 2.2.2 Reasoning against the Economic Valuation of Natural Resources 153
2.3 Total Economic Value (TEV) 154 2.4 Applications of Resource Valuation 155 2.5 Methods of Economic Evaluation 155 2.5.1 Stated Preference Methods – estimation of people’s preferences based on
direct questioning 155 (i) Contingent Valuation Methodology (CVM) 155 (ii) Discrete Choice Modeling (Conjoint Analysis (CA)) 156
2.5.2 Revealed Preference Methods – estimation of people’s preferences based on observed market behaviour 156
(i) Travel Cost Method (TCM) 156 (ii) Hedonic Pricing Method 156 (iii) Production Function Analysis 156 (iv) Sustainable Livelihood Analysis (SLA) 157
2.6 Data and Sources of Information 158
3. InlandFisheriesProduction 159
4. EconomicValuationCaseStudies 160 4.1 The Mekong River system 160 4.1.1 Water Use in the Mekong River Basin 160 4.1.2 Economic Valuation of Mangroves in the Mekong Delta 162
4.2 Bangladesh 163 4.2.1 Net Economic Benefits from Riverine Fisheries in Bangladesh 163 4.2.2 Stocking Seasonal Floodplains in Bangladesh for Capture Fisheries 164
4.3 India 165 Social and Economic Aspects of Fisheries Enhancement in Kerala Reservoirs, India
4.4 Indonesia 167 Management Options for the Inland Fisheries Resource in South Sumatra,Indonesia:
Bioeconomic Model
4.5 Malaysia 169 Fisheries Evaluation of the Chenderoh Reservoir Using the Rapid Rural Appraisal (RRA)
Technique (Livelihood Analysis) and Fishers Survey
4.6 Sri Lanka 170 4.6.1 Valuing Water in a Multiple-use System 170 4.6.2 Assessment of the Economic Value of Muthurajawela Wetlands 171
�49
5. TheImpactofChangingRiverFisheryManagementand WaterManagement 172 5.1 The Mekong River System 172
5.1.1 Changes in Fisheries Production and Prices before and after a Change in Fisheries Legislation 172
5.1.2 Changes in Water Use Value Due to Variation in Water Flow, Wetland Value and Fisheries Exploitation Cost 173
5.2 Bangladesh 174 Performance-response of the Inland Fishery under Different Simulated Changes in Cost
of Harvest and Changes in Aggregate Demand for Fish
5.2.1 Changes in the Cost of Harvest 174 5.2.2 Changes in Aggregate Demand 176
5.3 Sri Lanka 176 5.3.1 Valuing Water in a Multiple-use System 176 5.3.2 Adaptive, Participatory and Integrated Assessment(APIA) of the Impact of
Irrigation on Fisheries 178 5.3.3 Impact of Dams 179
6. Discussion 180
7. Conclusion 182
References 183
Appendix 1: Capture Riverine (and Floodplain) Production 187Appendix 2: Capture Riverine (and Floodplain) Prices 190Appendix 3: Capture Riverine (and Floodplain) Values 192Appendix 4: Country Data 194

1�0 Tropical river fisheries valuaTion: background papers To a global synThesis
AbSTRACT
This study attempts to estimate the economic value of riverine fisheries in tropical Asia and
quantify the economic impacts of any changes to the environment that affects rivers and
hence fisheries. The value of riverine fisheries has been considered in the following two ways:
firstly, through a compilation and summary of the results of existing studies on this topic;
secondly, by estimating the direct use value of riverine and floodplain fishing by country using
quantities and freshwater fish prices derived from various sources. Furthermore, a review
of the characteristics of the fisheries is presented. These fisheries have been shown to be
valuable (i.e., economically or socially important) in at least two specific ways: as a generator
of commercially marketable output, and as a source of income and employment in relatively
impoverished communities.
ACkNOWLEDGEMENTS
The authors would like to thank Professor David J. Whitmarsh and Dr. Premachandra Wattage,
both of the Department of Economics at the University of Portsmouth, for their help with the
development of this paper and useful comments on earlier drafts. Any remaining errors or
omissions are the responsibility of the authors alone.

chapTer � 1�1
�. INTRODUCTION
The aim of this report is to provide a review of the best available information on the direct value of tropical river fisheries in Asia as well as a valuation of environmental impacts, which affect rivers and hence fisheries.
In tropical Asia, a large part of the population is heavily dependent upon fishing within inland waters for their livelihoods. Catches in inland waters are profoundly affected by monsoons and have been observed to vary directly with water flow. In the dry season, predictable periods of drought occur resulting in lower catches, this is followed by increased water discharge during the wet season when the floodplains are inundated resulting in higher catches. One example is given in the study by Baran et al. (2001) who modeled the flow-catch relationship for the Dai (commercial fishery in Cambodia) in the Tonle Sap lake/floodplain system of the Mekong. The study identified a positive correlation between the water level and the annual Dai catches. However, it is not only natural water flow that affects catches. Increasing competition for water resources and high population growth in riparian countries of major river basins, such as the Mekong, Ganges and Irrawaddy systems have elevated pressures on the distribution of water flow and depleted fisheries stocks as a result. Furthermore, there is competition for the usage of the river flow not only between countries but also for different activities, such as captures fisheries, aquaculture, agriculture (irrigation), tourism, forestry, and electricity generation.
Estimating the value of these fisheries is essential if the livelihoods of the communities dependent on them are to be protected. If the true value of the resource is not established, the resulting costs or benefits of any alteration to its present state cannot be quantified. As such, governments and international agencies that develop policies regarding the use, preservation, or degradation of natural resources will be unequipped to
fully appreciate the impact on communities dependent upon fisheries.
For the purpose of this review, the geographical areas of tropical Asia will be defined as those watersheds that fall below or adjacent to the latitude denoted by the Tropic of Cancer (23o 30’). Figure 1 illustrates the watersheds considered. This assessment includes the following countries: Bangladesh, Cambodia, India, Indonesia, the Lao PDR, Malaysia, Myanmar, the Philippines, Sri Lanka, Thailand and Vietnam. China was omitted from this report because the majority of the country falls within the temperate region. Bhutan and Singapore were also excluded due to their low inland fisheries production and lack of available data.
The paper is broken down into seven sections. Following the abstract is Section 1: introduction. Section 2 then provides a description of the methodology used in this review. Section 3 briefly describes inland fisheries and riverine production in tropical Asia. Section 4 examines several economic valuation studies undertaken in tropical Asia. Section 5 highlights changes to the resource. Section 6 and 7 present the discussion and conclusion. Following the references are four useful appendices with statistical data.
2. CONCEPTUAL AND MEASUREMENT ISSUES
�.1 economic value
In this section, recent developments of methodology in natural resource evaluation are described. As shall be seen, the absence of market prices for most environmental assets (especially those with public goods
characteristics) makes it particularly difficult to measure economic value in straightforward monetary terms.
The OECD (Winpenny 1995) explains the concept of economic value thus:
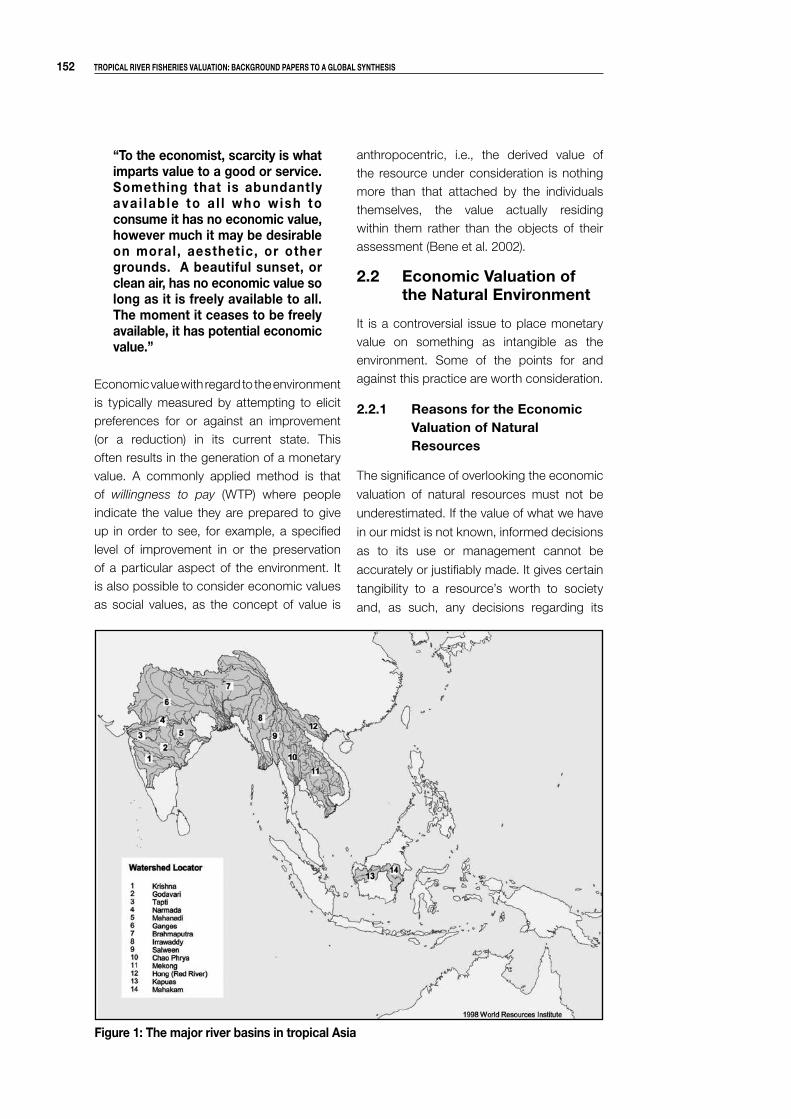
1�� Tropical river fisheries valuaTion: background papers To a global synThesis
“To the economist, scarcity is what imparts value to a good or service. something that is abundantly ava i lab le to a l l who wish to consume it has no economic value, however much it may be desirable on moral , aesthetic, or other grounds. a beautiful sunset, or clean air, has no economic value so long as it is freely available to all. The moment it ceases to be freely available, it has potential economic value.”
Economic value with regard to the environment is typically measured by attempting to elicit preferences for or against an improvement (or a reduction) in its current state. This often results in the generation of a monetary value. A commonly applied method is that of willingness to pay (WTP) where people indicate the value they are prepared to give up in order to see, for example, a specified level of improvement in or the preservation of a particular aspect of the environment. It is also possible to consider economic values as social values, as the concept of value is
anthropocentric, i.e., the derived value of the resource under consideration is nothing more than that attached by the individuals themselves, the value actually residing within them rather than the objects of their assessment (Bene et al. 2002).
�.� economic valuation of the natural environment
It is a controversial issue to place monetary value on something as intangible as the environment. Some of the points for and against this practice are worth consideration.
�.�.1 reasons for the economic valuation of natural resources
The significance of overlooking the economic
valuation of natural resources must not be
underestimated. If the value of what we have
in our midst is not known, informed decisions
as to its use or management cannot be
accurately or justifiably made. It gives certain
tangibility to a resource’s worth to society
and, as such, any decisions regarding its
figure 1: The major river basins in tropical asia
chapTer � 1��
preservation, use or degradation can be more
easily made. If the initial value of a resource
cannot be determined, the resulting costs or
benefits of any alteration to its present state
cannot be quantified.
Winpenny (1991) explains the importance of
assigning economic value to environmental
assets as follows:
• It allows measurement of the rate at
which environmental resources are being
consumed.
• Where environmental impacts can be
quantified in monetary terms (i.e., valued)
they will carry more weight with decision-
makers, who can then set these data
alongside other quantitative information.
In such circumstances, better decisions
will be made.
• By assigning a tangible, comparable,
value to a resource, it reduces the number
of occasions where decisions have to
be made, based solely on the decision-
maker’s judgment.
• It can provide the basis for appropriate
management or policy development,
assuming the derived economic value is
correct.
The use of expressions such as “invaluable”
to describe anything must be considered
dubious in nature. As Whitmarsh (1993)
points out, the claim that a particular site or
resource is “priceless”, in the sense that we
cannot possibly attach a monetary value to
it, is simply not acceptable if it implies that it
must be preserved at all costs. It is a fact
that in a world of finite resources, nothing is
of infinite value. However, accepting this still
raises problems regarding the way a “value”
is derived and is the matter of some debate.
�.�.� reasons against the economic valuation of natural resources
Although there have been substantial
improvements in the techniques used to
value the environment over the last two
decades, a number of criticisms can be
leveled against both the principle and the
practice of valuation. First, it has been
argued that placing a monetary value on
things as intangible as the importance of
species diversity or the value of life ultimately
degrades the debate. Second, the potential
for manipulation is present. An accusation
often raised against Cost Benefit Analysis
(CBA) is that if the requirements of objectivity
are not met, the valuation process can simply
end up being used to justify the desired
outcome (Bowers 1990). Third, the accurate
derivation of economic value requires precise
economic, scientific and technical data. All
of these can be notoriously scarce or costly
and time consuming to obtain in developing
countries.
Last of all, and with particular relevance in the
present context, valuation techniques derived
in the developed world are not always directly
applicable to the developing world. For a start,
there are likely to be important differences in
respect to both social attitudes towards the
environment and the functioning of ecological
systems. Barbier (1993) discusses this issue
from the social perspective, raising the point
that the use and non-use values of areas
such as wetlands tend to differ significantly
between tropical and temperate areas. As
a general rule, tropical wetlands occur in
the developing world, whereas temperate
ones exist more in the developed. The direct
result of this is that many tropical wetlands
are directly exploited, through informal,
non-market economic activity to support
human livelihoods, e.g., fishing, hunting,
and fire wood collection. Formal economic
activity, such as tourism or recreational use,
1�� Tropical river fisheries valuaTion: background papers To a global synThesis
is often absent or relatively insignificant. In
contrast, temperate wetlands will, with the
occasional exception of commercial fisheries
or forestry, be exploited more for recreation
or tourism, the significance of direct
exploitation being much reduced. As a result
rigorous valuation and inclusion of informal,
non-market, economic activity is essential if
an accurate value of tropical wetlands is to
be derived. Failure to do this is cited as a
significant factor in policy decisions that
result in the overexploitation or excessive
degradation of tropical wetlands.
From the pros and cons of economic
evaluation, it can be concluded that capturing
the full monetary value of natural resources is
a difficult task. One view is that:
“economic appraisal should attempt to monetize only what can be monetized, making it clear what environmental impacts have been excluded from the arith-metic and providing as much quantitative detail (even in non-monetary units) about these effects as possible.” (Whitmarsh 1���)
�.� Total economic value (Tev)
The value of a resource can be defined as
its total economic value. The concept of
TEV is based on the recognition that natural
resources are multifaceted and their absolute
value is derived from the sum of both their
use and non-use values. As demonstrated in
Figure 2, TEV is divided into use and non-use
values. Use values can be further divided
into: direct use value, indirect use value and
option value. These terms are defined below.
Direct use value is the most obvious benefit
derived where individuals exploit the resource
for commercial, livelihood or recreational
purposes.
Indirect use value refers to a scenario where
society does not profit directly or immediately
from the exploitation of the resource. An
example can be seen in the case where
inundated forests provide habitat for the
juveniles of fish stocks located elsewhere
(indirect value), implying that changes to the
forest (e.g., through logging) would destroy
the breeding/nursery grounds and reduce
catches in the future (direct value).
Option value refers to a situation where
individuals are prepared to maintain a
resource for possible use at a later date.
Non-use values are broken down into:
existence value and bequest value.
Existence value exists where individuals are
prepared to preserve something simply for
the satisfaction of knowing that its existence
is assured.
Bequest value exists where individuals
derive value by maintaining something (e.g.,
a productive fishery) for the use of future
generations.
The informational requirements and metho-
dologies applied in order to derive the above
values become more demanding as one
moves from left to right across the bottom of
Figure 2 (Laplante 2005). Direct use values
are relatively straightforward to obtain; where
a market exists for the derived good (e.g., fish)
or service (e.g., recreation), a price is often
available. As soon as one moves to the right
of the direct use value box, quantification in
monetary terms becomes more problematic
and controversial. As such, a number of
differing valuation methodologies have arisen
in an attempt to tackle the issue.
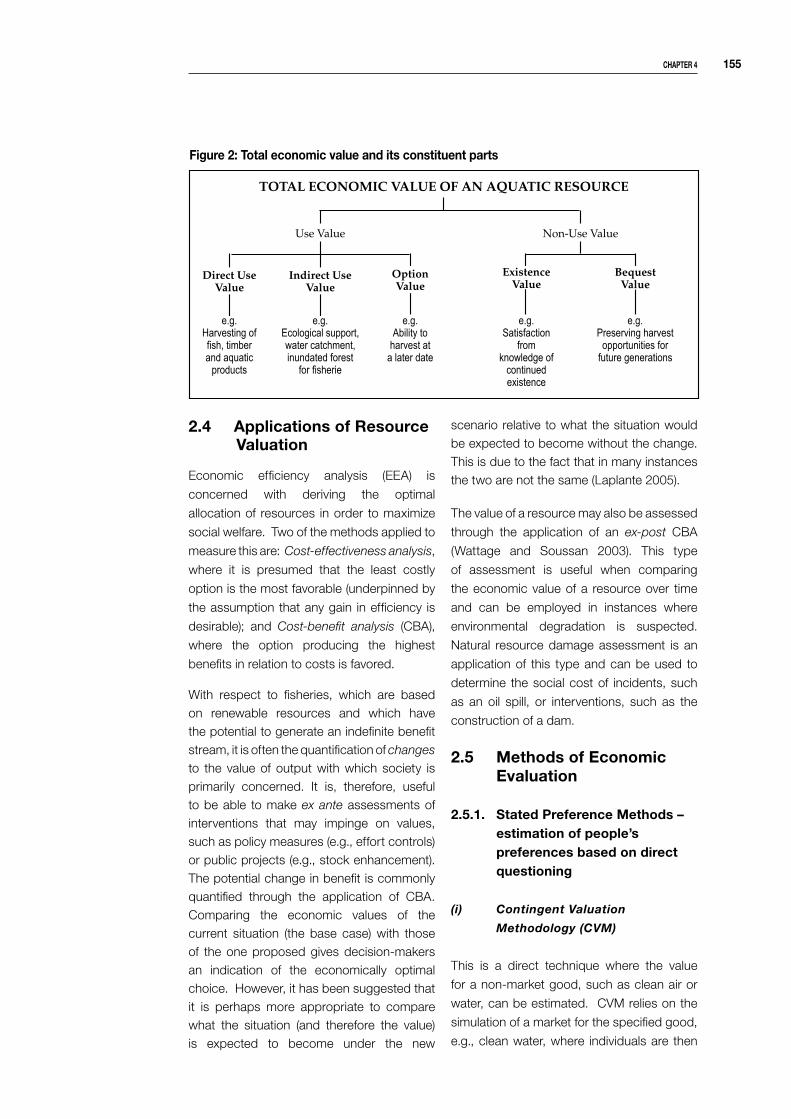
chapTer � 1��
�.� applications of resource valuation
Economic efficiency analysis (EEA) is
concerned with deriving the optimal
allocation of resources in order to maximize
social welfare. Two of the methods applied to
measure this are: Cost-effectiveness analysis,
where it is presumed that the least costly
option is the most favorable (underpinned by
the assumption that any gain in efficiency is
desirable); and Cost-benefit analysis (CBA),
where the option producing the highest
benefits in relation to costs is favored.
With respect to fisheries, which are based on renewable resources and which have the potential to generate an indefinite benefit stream, it is often the quantification of changes to the value of output with which society is primarily concerned. It is, therefore, useful to be able to make ex ante assessments of interventions that may impinge on values, such as policy measures (e.g., effort controls) or public projects (e.g., stock enhancement). The potential change in benefit is commonly quantified through the application of CBA. Comparing the economic values of the current situation (the base case) with those of the one proposed gives decision-makers an indication of the economically optimal choice. However, it has been suggested that it is perhaps more appropriate to compare what the situation (and therefore the value) is expected to become under the new
figure �: Total economic value and its constituent parts
TOTAL ECONOMIC VALUE OF AN AQUATIC RESOURCE
Use Value
e.g. Ability to
harvest ata later date
Indirect Use Value
Direct UseValue
OptionValue
e.g.Ecological support, water catchment, inundated forest
for fisherie
e.g.Harvesting of fish, timber and aquatic
products
Non-Use Value
e.g. Preserving harvest
opportunities for future generations
BequestValue
Existence Value
e.g.Satisfaction
fromknowledge of
continued existence
scenario relative to what the situation would be expected to become without the change. This is due to the fact that in many instances the two are not the same (Laplante 2005).
The value of a resource may also be assessed
through the application of an ex-post CBA
(Wattage and Soussan 2003). This type
of assessment is useful when comparing
the economic value of a resource over time
and can be employed in instances where
environmental degradation is suspected.
Natural resource damage assessment is an
application of this type and can be used to
determine the social cost of incidents, such
as an oil spill, or interventions, such as the
construction of a dam.
�.� Methods of economic evaluation
�.�.1. stated preference Methods – estimation of people’s preferences based on direct questioning
(i) ContingentValuation
Methodology(CVM)
This is a direct technique where the value
for a non-market good, such as clean air or
water, can be estimated. CVM relies on the
simulation of a market for the specified good,
e.g., clean water, where individuals are then
1�� Tropical river fisheries valuaTion: background papers To a global synThesis
asked, through survey, what they would be
willing to pay for the good or what they would
be willing to accept in compensation if this
good were to become unavailable or to be
lost. An advantage of this technique is that
it can be used to estimate both use and non-
use benefits. It can also be used to directly
elicit payments (open-ended forms) or to
obtain yes/no answers to a predetermined
WTP value (closed-ended).
(ii) DiscreteChoiceModeling
(ConjointAnalysis(CA))
This is another direct technique. Data
collection occurs via survey and is used to
represent individual judgments of multi-
attribute stimuli. Individuals’ preferences
are estimated by determining the relative
importance of attributes for goods, services,
objectives and/or alternatives. The technique
is based on the assumption that any good or
service can be described by its attributes and
that the extent to which an individual values
a good or service depends on the levels of
these attributes.
The four primary uses of discrete choice
modelling, as indicated by Ryan and Farrar
(2000), are to:
• Show how people are willing to trade
between characteristics; this is useful when
deciding on the optimal way to undertake
a project with limited resources.
• Produce overall benefit scores for
alternative ways of providing a good or
service; this allows the ranking of goods
or services against one another when
setting priorities.
• Estimate the relative importance of different
characteristics of a good objective; this
allows the policymaker to observe the
individual impact of each characteristic on
the overall benefit.
• Estimate whether an attribute is considered
important.
�.�.�. revealed preference Methods – estimation of people’s preferences based on observed market behavior
(i) TravelCostMethod(TCM)
This indirect method is essentially based on an
extension of the theory of consumer demand
and considers the value of time. It originated
from the desire to value areas used for public
recreation, with a central assumption that the
time (opportunity cost) and monetary costs
individuals are prepared to incur in order to
visit a specific location can be used to derive
the unpriced value of a location. The required
data are commonly gathered by surveying
site visitors.
(ii) HedonicPricingMethod
This is another indirect method; it assumes
that the price of a commodity and its
characteristics are related. Where one
of these characteristics relates to the
condition of the environment, e.g., water
quality, the relationship between price and
the characteristic can be used to derive a
monetary value for clean water. This technique
has often been applied in the housing market.
Price differences that reflect the value of local
environmental attributes are used to estimate
the values (positive or negative) associated
with changes in environmental quality (e.g.,
water/air quality) or amenities (e.g., aesthetic
views). This methodology relies on the
availability of data pertaining to house prices,
quality of the environmental factor under
scrutiny, and a set of attributes that influence
property prices.
(iii) ProductionFunctionAnalysis
This methodology is predicated on the idea
that there is a physical relationship between
chapTer � 1��
the output of an economic activity (e.g.,
fishing) and the various factor inputs (human,
man-made and natural) that are used in its
production. Changes in any of the inputs will,
therefore, be expected to have an affect on
the level of output, the precise relationship
between input and output being determined
inter alia by the technological and biological
characteristics of the system. The production
function approach to economic valuation has
a very wide potential application to fisheries.
If outputs can be measured in monetary
terms (using market or shadow prices) then
it becomes possible to indirectly estimate a
monetary value for the natural inputs (i.e., fish
population and/or critical habitat) that generate
it. Several studies into habitat-fishery linkages
have adopted this analytical framework;
those of particular note are by Hodgson and
Dixon (1988) on coral reefs in the Philippines
and Barbier and Strand (1998) on mangroves
and shrimp fisheries in Mexico. Despite its
potential, the production function approach
has a number of limitations. First, it requires
data on the prices of the outputs, which largely
restricts its application to situations where a
marketed commodity is being considered.
For this reason, it is unable to account for the
non-use value of fisheries resources, which
ipso facto is unpriced. Second, it requires a
relatively robust understanding of the physical
(i.e., causal) relationships between input and
output. Without such information, it is clearly
not possible to make predictions about how
the value of a fishery will alter as a result of
environmental impacts brought about by
policy intervention (e.g., vessel licensing) or
anthropogenic disturbance (e.g., pollution).
(iv) SustainableLivelihood
Analysis(SLA)
Livelihood analysis is an attempt to go further
than conventional economic analysis, such
as CBA, where consideration is only given to
whether there will be a net gain to society as
a whole, neglecting the issue of how this gain
is apportioned within society. The principal
of potential compensation, where there is a
net gain to society if the winners can afford to
compensate the losers and still be better off, is
an acknowledgement of this issue. However,
the fact that this compensation rarely makes
the transition from potential to actual is where
the problem lies.
In the developing world, the question of who
gains and, often more importantly, who loses
is something that should be given careful
consideration, especially when the losers
are often the poorest members of society.
Participatory methodologies are a holistic,
people-centered approach, developed to
help understand and analyse the livelihoods
of the poor. The main aim of these techniques
is usually to empower people. As DFID (2000)
describes “participatory methods are not
a fixed set of methods but rather a way of
thinking, behaving and acting”. Some of the
techniques used in these studies are: semi-
structured interviews, focus group discussion,
preference ranking, mapping, and modeling.
Outputs such as identification of the social
hierarchy can then be followed up allowing
the path of any potential benefit flows to be
mapped.
DFID (2000) lists the six core objectives of
SLA; they are as follows:
• Improved access to high-quality
education, information, technologies and
training and better nutrition and health;
• A more supportive and cohesive social
environment;
• More secure access to, and better
management of, natural resources;
• Better access to basic and facilitating
infrastructure;
• More secure access to financial resources;
and
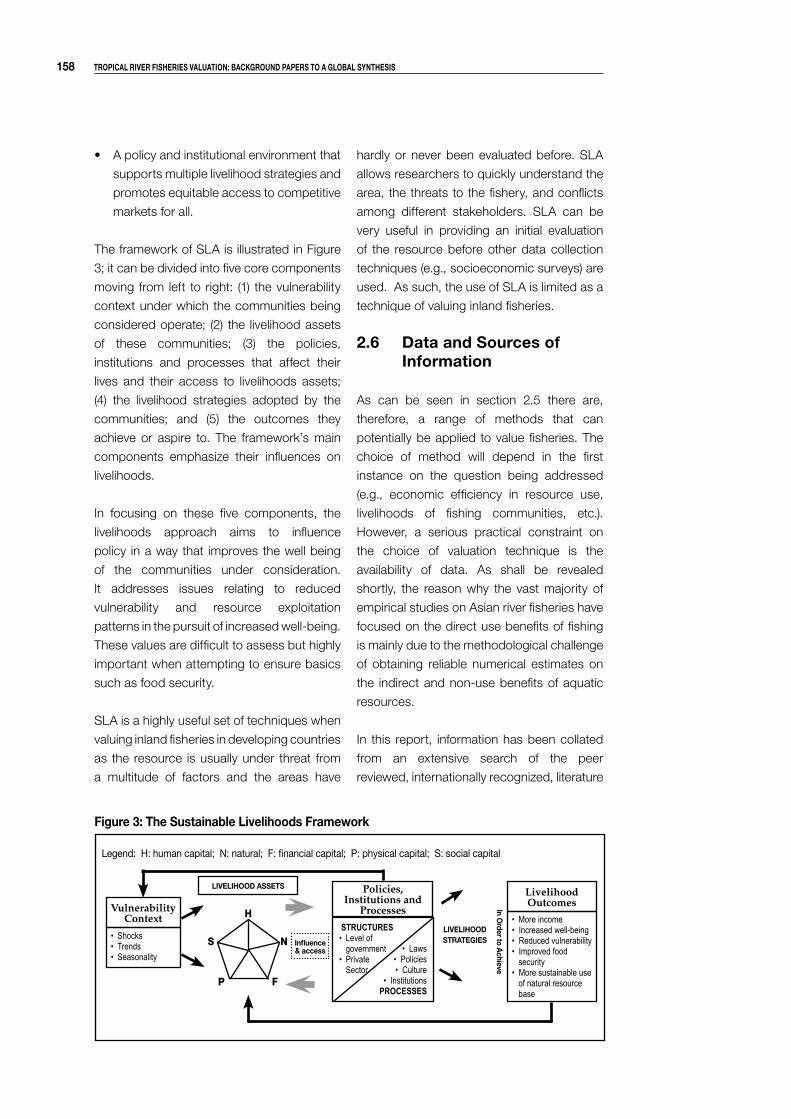
1�� Tropical river fisheries valuaTion: background papers To a global synThesis
• A policy and institutional environment that
supports multiple livelihood strategies and
promotes equitable access to competitive
markets for all.
The framework of SLA is illustrated in Figure
3; it can be divided into five core components
moving from left to right: (1) the vulnerability
context under which the communities being
considered operate; (2) the livelihood assets
of these communities; (3) the policies,
institutions and processes that affect their
lives and their access to livelihoods assets;
(4) the livelihood strategies adopted by the
communities; and (5) the outcomes they
achieve or aspire to. The framework’s main
components emphasize their influences on
livelihoods.
In focusing on these five components, the
livelihoods approach aims to influence
policy in a way that improves the well being
of the communities under consideration.
It addresses issues relating to reduced
vulnerability and resource exploitation
patterns in the pursuit of increased well-being.
These values are difficult to assess but highly
important when attempting to ensure basics
such as food security.
SLA is a highly useful set of techniques when
valuing inland fisheries in developing countries
as the resource is usually under threat from
a multitude of factors and the areas have
hardly or never been evaluated before. SLA
allows researchers to quickly understand the
area, the threats to the fishery, and conflicts
among different stakeholders. SLA can be
very useful in providing an initial evaluation
of the resource before other data collection
techniques (e.g., socioeconomic surveys) are
used. As such, the use of SLA is limited as a
technique of valuing inland fisheries.
�.� data and sources of information
As can be seen in section 2.5 there are,
therefore, a range of methods that can
potentially be applied to value fisheries. The
choice of method will depend in the first
instance on the question being addressed
(e.g., economic efficiency in resource use,
livelihoods of fishing communities, etc.).
However, a serious practical constraint on
the choice of valuation technique is the
availability of data. As shall be revealed
shortly, the reason why the vast majority of
empirical studies on Asian river fisheries have
focused on the direct use benefits of fishing
is mainly due to the methodological challenge
of obtaining reliable numerical estimates on
the indirect and non-use benefits of aquatic
resources.
In this report, information has been collated
from an extensive search of the peer
reviewed, internationally recognized, literature
figure �: The sustainable livelihoods framework
Policies, Institutions and
Processes
livelihood asseTs
• More income• Increased well-being• Reduced vulnerability• Improved food
security• More sustainable use
of natural resource base
STRUCTURES• Level of government• Private Sector
• Laws• Policies• Culture
• InstitutionsPROCESSES
VulnerabilityContext
• Shocks• Trends• Seasonality
LivelihoodOutcomesin o
rder to achieve
livelihoodsTraTegies
H
S N
P F
influence& access
Legend: H: human capital; N: natural; F: financial capital; P: physical capital; S: social capital

chapTer � 1��
and major databases. Owing to nature of the
subject, there was also significant reliance
on the so-called “gray literature”, such as
reports produced by the OECD, DFID and the
FAO. To put these studies in context, some
basic factual data are presented in Section
3 on the absolute and relative importance
of Asian fisheries. In Section 4, examples
are provided of empirical investigations that
attempt to value riverine and other connected
inland capture fisheries. The studies have
been chosen based on their economic
methodology and ability to generate an overall
value for the fishery under review. In particular,
studies were selected so as to provide some
comparison of values created by fisheries
with those of other activities exploiting rivers.
The ability to compare different activities in
this way is especially useful since it provides a
more complete picture of the issues affecting
the livelihoods of people within the area.
3. INLAND FISHERIES PRODUCTION
FAO figures for inland capture fisheries,
aquaculture and total fisheries production for
tropical Asia in the year 2002 are presented,
by country, in Table 1. The percentage
contribution of inland capture fisheries to total
production for each of the countries evaluated
is also shown.
The values in Table 1 indicate that Bangladesh
is the country with the highest level of inland
capture fisheries production. Floodplains
followed by rivers and estuaries are the most
productive fishing resources in Bangladesh
(Liaquat and Zahirul 1997). Nevertheless,
catches have declined over the years due
to a major loss of habitats. This has been
caused by: large-scale water abstraction for
irrigation, construction of embankments for
flood controls, siltation and soil erosion due
to deforestation in the catchments. Excessive
fishing pressure and destructive fishing
practices have also contributed to declining
catches (FAO 1994). When considering the
contribution of inland capture fisheries to
total production, Cambodia has the highest
ratio (excluding Bhutan which only has inland
fisheries production). Nevertheless, if we
examine Cambodian production, no marine
fisheries are reported in the FAO statistics.
Table 1: inland capture fisheries, aquaculture and total production in tropical asia in the year �00�
CountryInland capture
fisheries (t)
Aquaculture (t) Total production
(t)
Marine production
% inland to total
productionFreshwater Brackishwater
Bangladesh 688 435 696 997 32 026 1 890 459 473 001 36.4
Bhutan 300 0 0 300 0 100
Cambodia 411 150 14 133 0 425 283 0 96.9
India 425 283 2 076 734 0 6 061 366 3 559 349 7.0
Indonesia 316 030 429 166 313 531 5 679 391 4 620 664 5.6
Lao PDR 33 440 59 716 0 93 156 0 35.9
Malaysia 3 572 44 370 310 1 463 625 1 415 373 0.2
Myanmar 304 529 114 716 0 1 433 908 1 014 663 21.2
Philippines 131 111 147 362 216 686 3 371 874 2 876 715 3.9
Singapore 1 058 616 0 7 796 6 122 13.6
Sri Lanka 28 130 3 670 0 306 896 275 096 9.2
Thailand 205 500 327 795 98 3 566 106 3 032 713 5.8
Vietnam 149 200 390 000 28 000 2 042 500 1 475 300 7.3
Source: FAO FISHSTAT (2005)

1�0 Tropical river fisheries valuaTion: background papers To a global synThesis
Cambodian marine production is very small
in comparison to inland fisheries production,
but it does exist. The Cambodian government
reported 36,000 tonnes of marine production
in the year 2000 and 245,600 tonnes inland
capture fisheries production for the same
year (Planning and Accounting Office 2001).
Nevertheless, the inland capture figure
provided by the Cambodian government is
very low compared to FAO’s values and other
expert values for this fishery. For example,
Van Zalinge and Thuok (1999) estimated
Cambodian inland capture fisheries to be in
the range of 279,000 – 441,000 tonnes per
year. The substantial discrepancies between
sources for Cambodia is by no means an
isolated case. This issue is highlighted in
Appendix 1, which presents a compilation
of the most recent estimates for riverine and
floodplain fisheries production by country.
This section provides some insight into the
productivity of rivers and their floodplains
within tropical Asia. However, this table
also demonstrates the wide range in catch
estimates derived from separate studies,
demonstrating the need for more rigorous
statistical evaluation of the resource.
4. ECONOMIC VALUATION CASE STUDIES
�.1 The Mekong river system
The Mekong River, now a dominant
hydrological feature of Southeast Asia,
originates in China and flows through
Myanmar, Laos, Thailand, Cambodia and
Vietnam. When compared with other river
systems of the world, the Mekong ranks 8th
in terms of discharge (15,000 m3/second).
It is the 12th longest river in the world
(4,800 km) and has the 21st largest catchment
area (795,000 km2).
To the authors’ knowledge, no non-market
valuation studies have yet been conducted
to value the environmental attributes of the
Mekong River Basin. Rapid agricultural
and economic development in the basin is
resulting in increasing competition among
the riparian countries for Mekong waters and
means the need for such studies is increasing.
Furthermore, there is competition for use of
the river flow not only among countries but
also within different activities, such as capture
fisheries, aquaculture, agriculture (irrigation),
tourism, forestry and electricity generation.
Several models have been proposed in
the literature in an effort to understand the
interactions of different groups and different
areas along the Mekong. The study by Ringle
and Cai (2003) is especially noteworthy as
it estimates the economic value of different
activities along the entire Mekong River
system. The results are reported below.
Following this, we present the economic
valuation of wetlands in the Mekong Delta.
�.1.1 Water use in the Mekong river basin (ringle and cai �00�)
The authors analyze alternative water-use
strategies and their implications on riparian
countries. The Mekong Basin is divided into
seven sites: one in China, one in Laos, two
in Thailand, one in Cambodia, and two in
Vietnam. The baseline year is 1995. The data
have been collected from several national and
international databases. The model contains
three components:
• Hydrological components, including the
water balance in reservoirs, river reaches
and crop fields.
• Economic components, including the
calculation of economic benefits from
water use by sector (irrigated agriculture,
domestic-industrial areas, wetlands,
fisheries and hydropower).
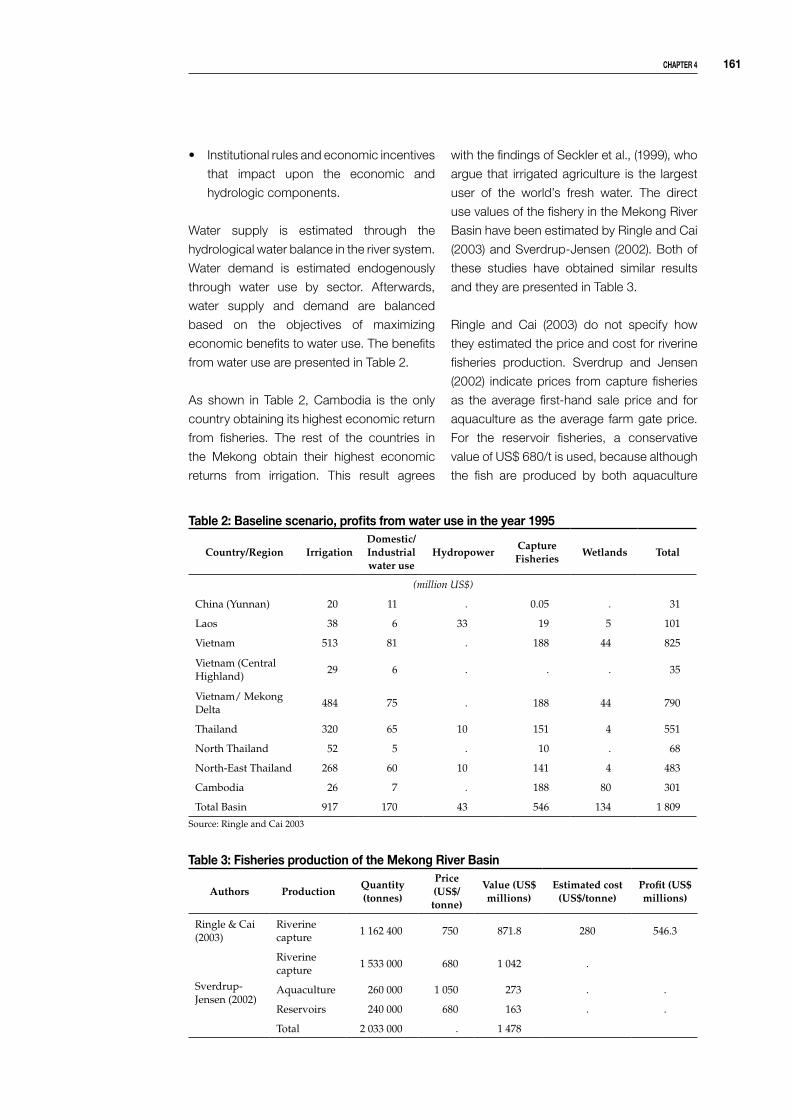
chapTer � 1�1
• Institutional rules and economic incentives
that impact upon the economic and
hydrologic components.
Water supply is estimated through the
hydrological water balance in the river system.
Water demand is estimated endogenously
through water use by sector. Afterwards,
water supply and demand are balanced
based on the objectives of maximizing
economic benefits to water use. The benefits
from water use are presented in Table 2.
As shown in Table 2, Cambodia is the only
country obtaining its highest economic return
from fisheries. The rest of the countries in
the Mekong obtain their highest economic
returns from irrigation. This result agrees
with the findings of Seckler et al., (1999), who
argue that irrigated agriculture is the largest
user of the world’s fresh water. The direct
use values of the fishery in the Mekong River
Basin have been estimated by Ringle and Cai
(2003) and Sverdrup-Jensen (2002). Both of
these studies have obtained similar results
and they are presented in Table 3.
Ringle and Cai (2003) do not specify how
they estimated the price and cost for riverine
fisheries production. Sverdrup and Jensen
(2002) indicate prices from capture fisheries
as the average first-hand sale price and for
aquaculture as the average farm gate price.
For the reservoir fisheries, a conservative
value of US$ 680/t is used, because although
the fish are produced by both aquaculture
Table �: fisheries production of the Mekong river basin
Authors ProductionQuantity (tonnes)
Price (US$/tonne)
Value (US$ millions)
Estimated cost (US$/tonne)
Profit (US$ millions)
Ringle & Cai (2003)
Riverine capture
1 162 400 750 871.8 280 546.3
Sverdrup-Jensen (2002)
Riverine capture
1 533 000 680 1 042 .
Aquaculture 260 000 1 050 273 . .
Reservoirs 240 000 680 163 . .
Total 2 033 000 . 1 478
Table �: baseline scenario, profits from water use in the year 1���
Country/Region IrrigationDomestic/ Industrial water use
HydropowerCapture Fisheries
Wetlands Total
(million US$)
China (Yunnan) 20 11 . 0.05 . 31
Laos 38 6 33 19 5 101
Vietnam 513 81 . 188 44 825
Vietnam (Central Highland)
29 6 . . . 35
Vietnam/ Mekong Delta
484 75 . 188 44 790
Thailand 320 65 10 151 4 551
North Thailand 52 5 . 10 . 68
North-East Thailand 268 60 10 141 4 483
Cambodia 26 7 . 188 80 301
Total Basin 917 170 43 546 134 1 809
Source: Ringle and Cai 2003
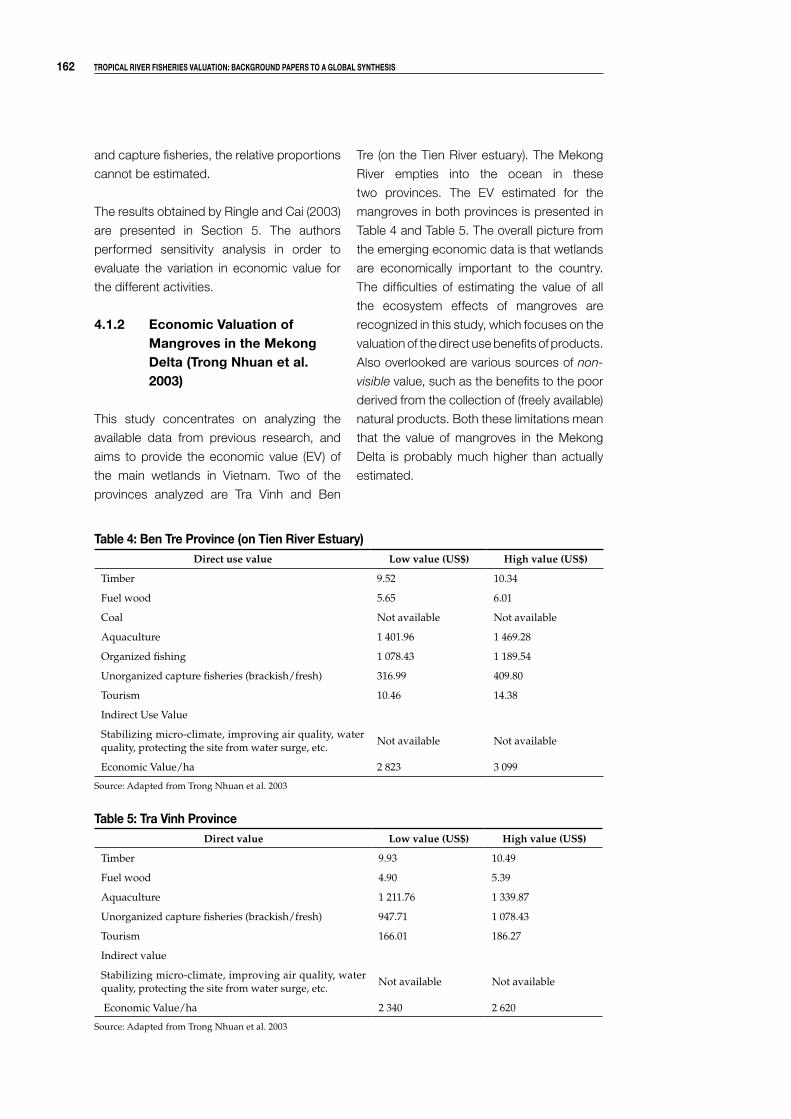
1�� Tropical river fisheries valuaTion: background papers To a global synThesis
Table �: ben Tre province (on Tien river estuary)Direct use value Low value (US$) High value (US$)
Timber 9.52 10.34
Fuel wood 5.65 6.01
Coal Not available Not available
Aquaculture 1 401.96 1 469.28
Organized fishing 1 078.43 1 189.54
Unorganized capture fisheries (brackish/fresh) 316.99 409.80
Tourism 10.46 14.38
Indirect Use Value
Stabilizing micro-climate, improving air quality, water quality, protecting the site from water surge, etc.
Not available Not available
Economic Value/ha 2 823 3 099
Source: Adapted from Trong Nhuan et al. 2003
Table �: Tra vinh provinceDirect value Low value (US$) High value (US$)
Timber 9.93 10.49
Fuel wood 4.90 5.39
Aquaculture 1 211.76 1 339.87
Unorganized capture fisheries (brackish/fresh) 947.71 1 078.43
Tourism 166.01 186.27
Indirect value
Stabilizing micro-climate, improving air quality, water quality, protecting the site from water surge, etc.
Not available Not available
Economic Value/ha 2 340 2 620
Source: Adapted from Trong Nhuan et al. 2003
and capture fisheries, the relative proportions
cannot be estimated.
The results obtained by Ringle and Cai (2003)
are presented in Section 5. The authors
performed sensitivity analysis in order to
evaluate the variation in economic value for
the different activities.
�.1.� economic valuation of Mangroves in the Mekong delta (Trong nhuan et al. �00�)
This study concentrates on analyzing the
available data from previous research, and
aims to provide the economic value (EV) of
the main wetlands in Vietnam. Two of the
provinces analyzed are Tra Vinh and Ben
Tre (on the Tien River estuary). The Mekong
River empties into the ocean in these
two provinces. The EV estimated for the
mangroves in both provinces is presented in
Table 4 and Table 5. The overall picture from
the emerging economic data is that wetlands
are economically important to the country.
The difficulties of estimating the value of all
the ecosystem effects of mangroves are
recognized in this study, which focuses on the
valuation of the direct use benefits of products.
Also overlooked are various sources of non-
visible value, such as the benefits to the poor
derived from the collection of (freely available)
natural products. Both these limitations mean
that the value of mangroves in the Mekong
Delta is probably much higher than actually
estimated.

chapTer � 1��
�.� bangladesh
�.�.1 net economic benefits from riverine fisheries in bangladesh (ahmed 1���, 1���)
In these two studies, the author determines
the total benefits obtainable from various
riverine fisheries in Bangladesh (Ganges,
Jamuna-Brahmaputra, Meghna and others)
under an optimal management regime. Both
studies use a non-linear programing model.
The use of a mathematical optimization
approach enables incorporation into the
model of non-linear catch-effort and cost
functions, as well as price-responsive
demand functions. This model allowed the
author to estimate the performance-response
of the fishery under different simulated
changes in cost of harvest and changes in
aggregate demand for fish. The data used in
the analysis were the actual average annual
catch from 1983-84 to 1989-90. Activity sets
and constraints of the model were grouped
into three blocks: harvesting, post-harvest
handling (processing, transporting, storing,
and marketing), and selling (retail demand).
These blocks represented biological, tech-
nological, and market characteristics and
interdependencies across species, space
(region), time period of fishing (season), and
the environment (different fishing grounds
and/or rivers). The results presented in Tables
6 and 7 are for the whole fishery. Table 6
presents the actual and estimated catches
and effort for the different river groups. A
summary of the results of the base model for
all the riverine fisheries of Bangladesh is given
in Table 7.
As presented above, the optimal level of
harvest is 173,163 tonnes. Of the total harvest,
a significant portion comes as bycatch. In
relation to fishing effort, the current actual
annual level of effort is roughly 430,304 million
gear (square meters) hour, which is about
118 per cent higher than the estimated level of
effort. In relation to individual rivers, the size
of current effort is higher by 136 per cent in
the Meghna River, 247 per cent in the Padma-
Table �: distribution of catch (t) and level of effort (gear hr x 10�) in the base model for riverine fisheries of bangladesh by river group
MeghnaPadma-Ganges
Jamuna-Brahmaputra
Other Rivers Total
Total actual catch 73 533 5 238 3 879 104 437 189 087
Total estimated catch 63 942 5 870 6 323 97 028 173 163
Estimated direct catch 56 950 4 630 5 021 73 256 139 857
Estimated bycatch 6 992 1 240 1 302 23 772 33 306
Total actual efforta 221 320 26 555 16 062 166 367 430 304
Total estimated effortb 93 793 7 637 6 684 88 940 197 054
a Approximate levels based on sample survey by the author, and survey of fishing units by DOF (unpublished data)
b Actual average annual catch from 1983-84 to 1989-90 (DOF unpublished data)
Source: Ahmed (1996)
Table �: summary of results of the base model for riverine fisheries of bangladesh
Benefit-cost(Bangladesh Taka x 106)
Net benefit 1 383
Gross benefit 5 634
Producer surplus 1 289
Consumer surplus 94
Total revenue 5 540
Total cost 4 251
- Harvest cost 2 435
- Post-harvest cost 1 816
Total Effort (gear hour x 106) 197 054
Catch per Unit of Effort (kg) 879
Source: Ahmed (1996)
1�� Tropical river fisheries valuaTion: background papers To a global synThesis
Ganges River, 140 per cent in the Jamuna-
Brahmaputra River and 87 per cent for other
rivers. This shows that the principal rivers,
especially the Padma-Ganges River, have a
relatively higher level of excess capacity as
compared to (other) small rivers.
The author believes that the reason for the
high level of fishing effort in the Padma River
is due to a 70 per cent reduction in annual
fishery harvest in the Padma River from
1983-84 to 1989-90. The decline in fish
catches was due to severe environmental
degradation, such as loss of water flows
and siltation due to the effect of the dam
constructed in the Indian territory. There was
no commensurate reduction in fishing effort.
The results of the base model are presented
in Table 7. The total net benefit yielded by
the various riverine fisheries is 1,383 million
Bangladesh Taka (US$ 43 million) of which
1,289 million Bangladesh Taka (96%)
constitutes the producer surplus and the
remaining 94 million Bangladesh Taka
constitutes the consumer surplus (4%).
Because all costs are considered to be in
terms of opportunity costs, the value for
producer surplus can be treated as the total
factor surplus.
The total cost of harvest and post-harvest
activities is 4,251 million Bangladesh Taka,
which is 77 per cent of the gross revenue. Of
the total cost, 57 per cent represents the cost
of fishing or effort (2,435 million Bangladesh
Taka). The remaining 43 per cent (1,816 million
Bangladesh Taka) represents the market
margin or the cost of post-harvest handling,
processing, and transporting of fish and fish
products, equivalent to 33 per cent of the
aggregate gross revenue.
The changes to the baseline model due to
changes in fishing effort and demand will be
presented in Section 5.
�.�.� stocking seasonal floodplains in bangladesh for capture fisheries (ali and islam 1���)
The contribution of inland open waters to
the country’s fish production has declined
to about 50 per cent at present. This is due
to the natural reproduction of fish being
disturbed by Overfishing and other causes.
Under a project named the Third Fisheries
Project (TFP) carp fingerlings were directly
stocked into mainly seasonal floodplains in
western Bangladesh. Stockings took place
in six growing seasons over a period of six
years (1991-96).
Stocking of carp fingerlings in floodplains is
done by the Department of Fisheries in order
to:
• Increase fish production by making use of
underutilized resources
• Enhance the income for fishers
• Create employment opportunity
The economic analysis was done for eight
floodplains out of the 26 floodplains that have
actually been stocked. The author used the
statistical data in catches and costs collected
to estimate the average net benefits of
stocking beels (deep floodplains) over the six
years of stocking and thereafter. The results
are presented in Table 8.
The analysis shows losses up to the third year,
after which floodplain stocking generates
net economic benefit. From 1997 onward,
the study estimates net benefits to be
52,848,000 Tk every year.
The author also carried out a socio-economic survey on the local fishers fishing within the studied floodplains.The impact of flood-plain

chapTer � 1��
Table �: economic analysis of selected beels floodplain stocking (actual to 1���; constant after)
Parameter 1991 1992 1993 1994 1995 1996 1997
Stocking area (ha) 3 700 13 200 14 700 22 200 22 200 22 200 22 200
Stocking quantity (kg) 73 049 253 874 249 094 428 606 265 658 325 539 358 591
Stocking density (kg/ha) 20 19 17 19 19 15 16
Stocking price(Tk/kg)
66 88 119 99 89 84 87
Catch (kg) 0 694 716 511 271 2 180 637 4 372 701 3 338 782 3 707 679
Catch/ha (kg) 53 35 98 308 150 167
Mean catch price (Tk/kg) 26 30 34 34 32 35
Costs (Tk’000)
Stocking cost 4 855 22 419 29 559 42 284 23 624 27 313 31 148
Fishers’ labor costs 634 5 696 8 645 10 991 9 922 11 591 11 591
Fishers’ equipment costs 912 8 731 13 458 18 167 14 688 20 026 20 026
DOF admin costs 2 065 9 165 13 987 17 735 7 998 10 195 10 195
NGO supervision 0 392 276 260 3 690 7 124 7 124
Other supervision 0 0 0 17 111 111 111
Total financial costs 8 666 46 403 65 927 89 466 59 936 76 360 80 195
Total econ. costs 7 366 39 442 56 036 76 046 50 947 64 906 68 166
Benefits (Tk’000)
Incremental catch 0 18 086 15 576 73 659 150 338 107 970 128 931
Total financial benefit 0 18 086 15 576 73 659 150 338 107 970 128 931
Total econ. benefit 0 15 373 13 239 62 610 127 787 91 775 109 591
Net benefits (Tk’000) (7 366) (24 069) (13 436) 76 840 26 868 41 426 52 848
Net econ. benefits 42 020
NPV @ 12% 29.70%
Source: Ali and Islam 1997
stocking on local fishers is summarized in
Table 9.
The socioeconomic evaluation indicates a better status of local fishers resulting from the fingerling-stocking program.
�.� india
social and economic aspects of fisheries enhancement in kerala reservoirs, india (peters and feustel 1���)
Reservoir culture-based capture fisheries are relatively new in Kerala, India. Overfishing and pollution have deeply affected the lives of many people. From 1992, the Indo-German Reservoir Fisheries Development Project (IGFP) has stocked several reservoirs. In
1996, ten reservoirs were managed under a culture based fishery and harvested by members of fisheries cooperatives and independent fishers. The aims of the project are as follows:
• Involve fishers in developing appropriate reservoir management strategies
• Provide fishery related income from the reservoir to the fishers
• Involve the community in planning and decision making
• Provide cooperative action planning and technical training to the target group
The authors undertook a socioeconomic
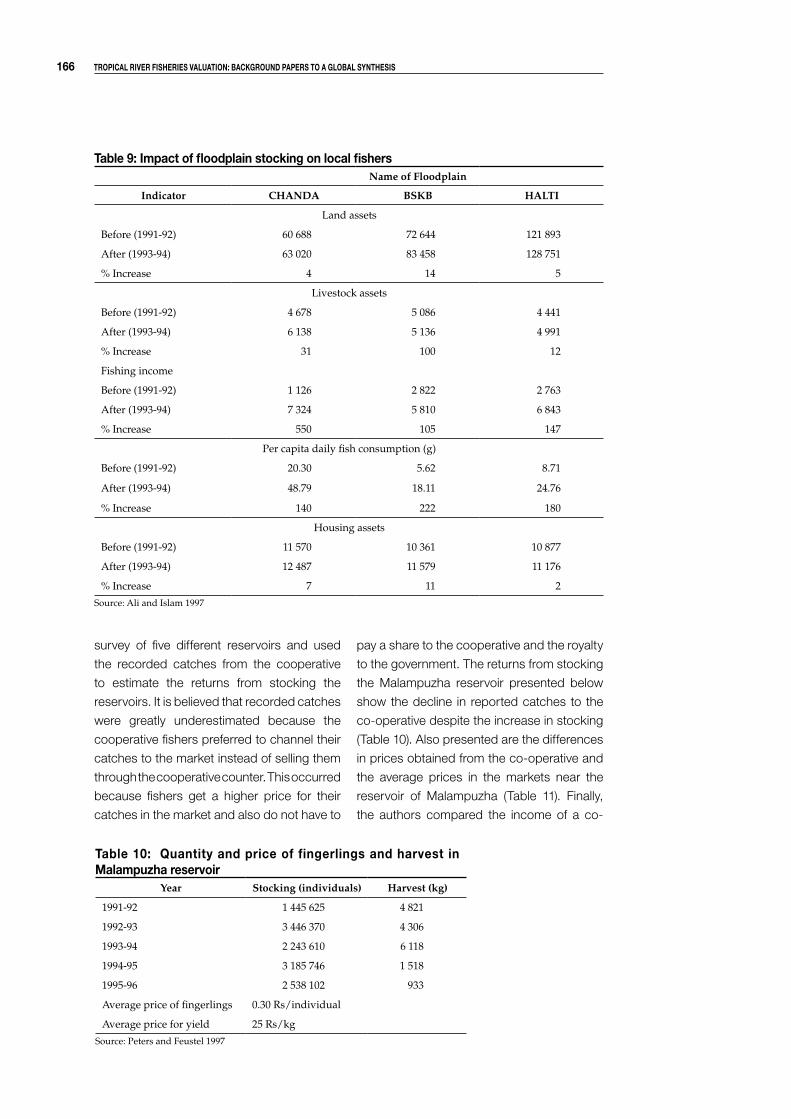
1�� Tropical river fisheries valuaTion: background papers To a global synThesis
Table �: impact of floodplain stocking on local fishersName of Floodplain
Indicator CHANDA BSKB HALTI
Land assets
Before (1991-92) 60 688 72 644 121 893
After (1993-94) 63 020 83 458 128 751
% Increase 4 14 5
Livestock assets
Before (1991-92) 4 678 5 086 4 441
After (1993-94) 6 138 5 136 4 991
% Increase 31 100 12
Fishing income
Before (1991-92) 1 126 2 822 2 763
After (1993-94) 7 324 5 810 6 843
% Increase 550 105 147
Per capita daily fish consumption (g)
Before (1991-92) 20.30 5.62 8.71
After (1993-94) 48.79 18.11 24.76
% Increase 140 222 180
Housing assets
Before (1991-92) 11 570 10 361 10 877
After (1993-94) 12 487 11 579 11 176
% Increase 7 11 2
Source: Ali and Islam 1997
survey of five different reservoirs and used
the recorded catches from the cooperative
to estimate the returns from stocking the
reservoirs. It is believed that recorded catches
were greatly underestimated because the
cooperative fishers preferred to channel their
catches to the market instead of selling them
through the cooperative counter. This occurred
because fishers get a higher price for their
catches in the market and also do not have to
pay a share to the cooperative and the royalty
to the government. The returns from stocking
the Malampuzha reservoir presented below
show the decline in reported catches to the
co-operative despite the increase in stocking
(Table 10). Also presented are the differences
in prices obtained from the co-operative and
the average prices in the markets near the
reservoir of Malampuzha (Table 11). Finally,
the authors compared the income of a co-
Table 10: Quantity and price of fingerlings and harvest in Malampuzha reservoir
Year Stocking (individuals) Harvest (kg)
1991-92 1 445 625 4 821
1992-93 3 446 370 4 306
1993-94 2 243 610 6 118
1994-95 3 185 746 1 518
1995-96 2 538 102 933
Average price of fingerlings 0.30 Rs/individual
Average price for yield 25 Rs/kg
Source: Peters and Feustel 1997

chapTer � 1��
Table 11: comparison of fish prices in the market near the Malampuzha reservoir and cooperative society prices
Co-operative Society Prices (in Rs) Average Market Prices (in Rs)
Species Co-op Market I Market II Market III
Stocked carps 25 35 35 30
Other indigenous spp. 15 30 30 25
Source: Peters and Feustel 1997
Table 1�: calculation of cooperative fisher’s income from a �-kg average catch per day and average incomes per day in other professions
Catch (kg)
Fish Sales Price (Rs)
Total Value (Rs) Coop 25% ShareGovt. Share
(Royalty) 25%Daily Income
(Rs)
5 20 100 25 25 50
Other Professions:
Agriculture Labor (Seasonal Men) 70-100
Agriculture Labor (Seasonal Women) 45-70
Firewood Collection (Women) 60
Toddy Tapping (Men) 100
Wood Cutting 125
Minor Forest Produce Collection 50-60
Source: Peters and Feustel 1997
operative fisher from a 5 kg average catch per
day with average incomes per day in other
professions (Table 12). As can be observed,
the income of a fisher whose catch is less
than 5 kg per day is far below the amount
that can be earned from daily wages in most
other sectors.
�.� indonesia
Management options for the inland fisheries resource in south sumatra, indonesia: bioeconomic Model (koeshendrajana and cacho �001)
Fishing is an important occupation for a
large number of rural people living in the
floodplains of the Musi River and its major
tributaries in South Sumatra, Indonesia. In
this study, an evaluation of the status of the
existing fish stock was undertaken, and an
analytical model for identifying efficient levels
of exploitation of the fishery was developed.
The fishery is divided into two different types:
the riverine and swamp fisheries. The swamp
fishery refers to the total of lake and swamp
fishery data. Primary data are used to describe
the current costs of fishing effort. Secondary
data (catch data from 1979-94), combined
with results of analysis of primary data, are
then used to derive a supply function of the
fishery. Primary data was obtained through
a cross-sectional survey in 1994 undertaken
by the authors. Information was obtained
about costs and landing prices in rivers and
swamps. The total costs of fishing effort
(TC) for the standard fishing unit in South
Sumatra were Rp 2,974 and Rp 2,631 in
river and swamp fisheries, respectively. The
average actual prices of freshwater fish at the
producer level were 1,215 Rp/kg (riverine) and
1,125 Rp/kg (swamp). The difference in prices
between resources may indicate that the
quality of harvested fish from the river is better
than from the swamp. The authors chose two
different models for identifying efficient levels
of exploitation of the fishery: the Gordon-Fox
model and the Gordon-Schaefer model. The
various critical points for both models and the
average actual capture during the period of
study for both fisheries are presented in the
Table 13.

1�� Tropical river fisheries valuaTion: background papers To a global synThesis
Results indicate that, from both biological and
economic perspectives, the inland capture
fishery in South Sumatra has been over-
fished during the period of the study because
the actual effort is beyond both MEY and
MSY levels. Even though MEY produces the
highest resource rent, the required reduction
in fishing effort implies that some fishers may
be forced out of fishing, a result that would
be socially unacceptable if applied to the
small-scale fisheries in Indonesia. Therefore,
the authors suggest that policy actions in
the small-scale fishery should be directed
to maximizing social yield (MScY) instead.
Under social optimization (MScY), the fishing
effort would also have to decrease relative
to the actual simulation, but not by as much
as with MEY. The optimal solutions derived
from the Schaefer and Fox models are similar.
However, the fishing effort in the Schaefer
model is higher than in the Fox model. In
the riverine fishery, the Schaefer model yield
Table 1�: calculated effort, catch, costs, revenues and profits of the inland fishery in south sumatra, indonesia based on the empirical model
Model/Resource
Harvest condition
MSY MEY MScY BE BEScActual (mean)
Schaefer/River
Effort (1 000 trips) 6 711 4 696 5 374 10 748 9 392 7 217
Catch (tonnes) 27 350 24 884 26 264 17 458 22 986 22 833
Cost (M Rp) 19 957 13 964 15 979 21 459 27 928 21 459
Revenue (M Rp) 33 231 30 234 31 911 21 459 27 928 27 743
Profit (or resource rent) (M Rp)
13 274 16 270 15 931 0 0 6 283
Schaefer/Swamp
Effort (1 000 trips) 4 407 4 281 4 329 7 246 6 285 5 415
Catch (tonnes) 17 960 17 945 17 955 10 508 14 701 14 830
Cost (M Rp) 11 597 11 265 11 391 11 822 16 538 14 249
Revenue (M Rp) 20 205 20 189 20 199 11 822 16 538 16 684
Profit (or resource rent) (M Rp)
8 608 8 924 8 808 0 0 2 435
Fox/River
Effort (1 000 trips) 6 472 3 763 4 468 12 053 9 400 7 217
Catch (tonnes) 24 900 22 002 23 427 19 578 23 005 22 833
Cost (M Rp) 19 246 11 190 13 285 23 788 27 951 21 459
Revenue (M Rp) 30 253 26 733 28 464 23 788 27 951 27 743
Profit (or resource rent) (M Rp)
11 007 15 543 15 180 0 0 6 283
Fox/Swamp
Effort (1 000 trips) 4 120 2 450 2 951 8 140 6 170 5 415
Catch (tonnes) 15 851 14 137 15 078 11 805 14 433 14 830
Cost (M Rp) 10 843 6 447 7 765 13 280 16 237 14 249
Revenue (M Rp) 17 832 15 904 16 963 13 280 13 237 16 684
Profit (or resource rent) (M Rp)
6 990 9 457 9 197 0 0 2 435
MSY=Max. Sustainable Yield; MEY=Max. Economic Yield; MScY=Max. Social Yield; BE=Bionomic Equilibrium; BESc= Bionomic Social Equilibrium;
Source: Koeshendrajana and Cacho 2001
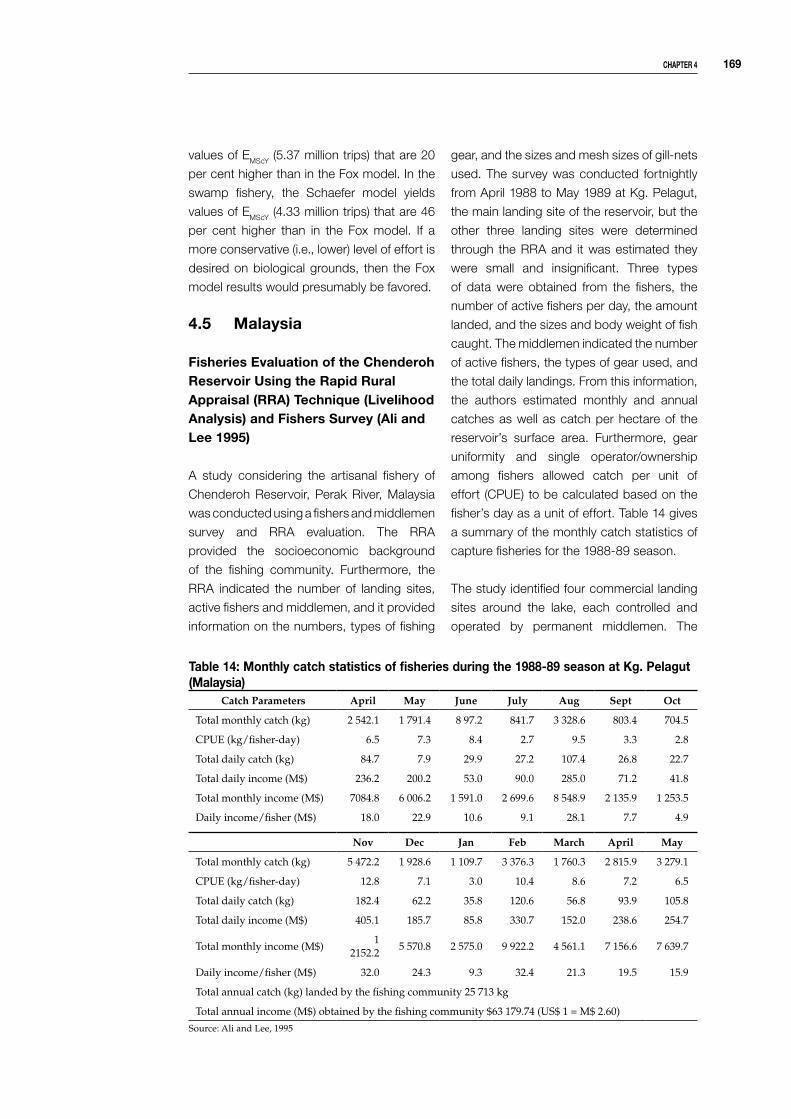
chapTer � 1��
values of EMScY (5.37 million trips) that are 20
per cent higher than in the Fox model. In the
swamp fishery, the Schaefer model yields
values of EMScY (4.33 million trips) that are 46
per cent higher than in the Fox model. If a
more conservative (i.e., lower) level of effort is
desired on biological grounds, then the Fox
model results would presumably be favored.
�.� Malaysia
fisheries evaluation of the chenderoh reservoir using the rapid rural appraisal (rra) Technique (livelihood analysis) and fishers survey (ali and lee 1���)
A study considering the artisanal fishery of
Chenderoh Reservoir, Perak River, Malaysia
was conducted using a fishers and middlemen
survey and RRA evaluation. The RRA
provided the socioeconomic background
of the fishing community. Furthermore, the
RRA indicated the number of landing sites,
active fishers and middlemen, and it provided
information on the numbers, types of fishing
gear, and the sizes and mesh sizes of gill-nets
used. The survey was conducted fortnightly
from April 1988 to May 1989 at Kg. Pelagut,
the main landing site of the reservoir, but the
other three landing sites were determined
through the RRA and it was estimated they
were small and insignificant. Three types
of data were obtained from the fishers, the
number of active fishers per day, the amount
landed, and the sizes and body weight of fish
caught. The middlemen indicated the number
of active fishers, the types of gear used, and
the total daily landings. From this information,
the authors estimated monthly and annual
catches as well as catch per hectare of the
reservoir’s surface area. Furthermore, gear
uniformity and single operator/ownership
among fishers allowed catch per unit of
effort (CPUE) to be calculated based on the
fisher’s day as a unit of effort. Table 14 gives
a summary of the monthly catch statistics of
capture fisheries for the 1988-89 season.
The study identified four commercial landing
sites around the lake, each controlled and
operated by permanent middlemen. The
Table 1�: Monthly catch statistics of fisheries during the 1���-�� season at kg. pelagut (Malaysia)
Catch Parameters April May June July Aug Sept Oct
Total monthly catch (kg) 2 542.1 1 791.4 8 97.2 841.7 3 328.6 803.4 704.5
CPUE (kg/fisher-day) 6.5 7.3 8.4 2.7 9.5 3.3 2.8
Total daily catch (kg) 84.7 7.9 29.9 27.2 107.4 26.8 22.7
Total daily income (M$) 236.2 200.2 53.0 90.0 285.0 71.2 41.8
Total monthly income (M$) 7084.8 6 006.2 1 591.0 2 699.6 8 548.9 2 135.9 1 253.5
Daily income/fisher (M$) 18.0 22.9 10.6 9.1 28.1 7.7 4.9
Nov Dec Jan Feb March April May
Total monthly catch (kg) 5 472.2 1 928.6 1 109.7 3 376.3 1 760.3 2 815.9 3 279.1
CPUE (kg/fisher-day) 12.8 7.1 3.0 10.4 8.6 7.2 6.5
Total daily catch (kg) 182.4 62.2 35.8 120.6 56.8 93.9 105.8
Total daily income (M$) 405.1 185.7 85.8 330.7 152.0 238.6 254.7
Total monthly income (M$)1
2152.25 570.8 2 575.0 9 922.2 4 561.1 7 156.6 7 639.7
Daily income/fisher (M$) 32.0 24.3 9.3 32.4 21.3 19.5 15.9
Total annual catch (kg) landed by the fishing community 25 713 kg
Total annual income (M$) obtained by the fishing community $63 179.74 (US$ 1 = M$ 2.60)
Source: Ali and Lee, 1995
1�0 Tropical river fisheries valuaTion: background papers To a global synThesis
total annual catch and income generated by
the fishery was 25,713 kg and M$ 63,179.74,
respectively.
�.� sri lanka
�.�.1 valuing Water in a Multiple-use system (renwick �001)
The inland capture fisheries of Sri Lanka
are almost entirely restricted to its perennial
reservoirs. It is reported that there is a lack of
any riverine fishery worth mentioning and that
the main share of inland production originates
from the reservoirs (Sugunan 1997). This
situation is reflected in the available literature.
However, one noteworthy study is by
Renwick (2001), who examines the economic
contribution of multiple uses (agriculture, a
consumptive use, and reservoir fisheries, a
non-consumptive use) within the Kirindi Oya
Irrigation and Settlement Project (KOISP) in
southeastern Sri Lanka. The economic value
of water in irrigated paddy and fisheries are
estimated for the KOISP as a whole and on a
per-cubic-meter basis.
Initial failure of the KOISP project to deliver
an expected two crops a year on all the
9,600 hectares of land has led to alternative
management strategies being considered.
The derived values are used to examine the
economic implications of alternative water
management practices. It was assumed
that improvements in allocative efficiency
may be achieved if decision makers account
for fishery requirements in management
decisions. Agriculture plays a substantial
role in the local economy of the Kirindi Oya
area, accounting for about 55 per cent of
the household income in the KOISP. Paddy
cultivation is the largest single source of
agricultural income, averaging 30 per cent
for the area. However, approximately half the
households surveyed relied on fishing as the
sole source of household income. Surveys
were conducted on 12 per cent (20 boats)
of the estimated 157 fisher boats operating
in three reservoirs. Detailed information was
obtained on: monthly catch, amount of catch
sold and consumed at home, prices received
in wholesale and retail markets, type of boat
and nets, and specific costs. The economic
contribution of inland fisheries in the KOISP
area was calculated by using the estimated
economic returns to fishery operators and the
value of water in fisheries. Data were collected
for three of the five waterbodies in the area
where commercial inland fisheries exist,
namely, Lunugamwehera Reservoir, Wirawila
Tank, and Yoda Wewa. In combination, these
account for about 81 per cent (4,100 ha) of
the total reservoir surface area in the project.
See Table 15 for information on catch, value
of production, costs of production and
economic returns for the three waterbodies
surveyed. The value of production was
estimated based on the actual monthly
catch per unit of effort (CPUE) data, number
of trips per month, home consumption,
amount sold by each fisher to wholesale
and retail markets, and actual prices
received. Average annual costs were
estimated to be 23 per cent of the total value
of production in each reservoir. Economic
returns were also estimated in order to provide
a measure of the economic value of water
in the reservoir fisheries. This calculation
included the value of both marketed fish and
those consumed at home, as well as the
costs of non-cash inputs such as labor and
depreciation of fixed assets. The economic
return per boat was estimated to be roughly
US$ 2,789 and the average economic return
per fisher (usually two per vessel) to be
approximately US$ 1,395.
Annual returns for all five commercially
important fisheries were estimated based
on actual monthly returns to fishers for
the surveyed reservoirs. The total annual
economic returns to the five reservoirs from
inland fishing were calculated to be about
US$ 544,000-566,000 per year. The value
of water use in fisheries is roughly estimated

chapTer � 1�1
Table 1�: catch, value of production, costs and economic returns for the three waterbodies surveyed (1���)
Lunugamwehera Wirawila Yoda Wewa Total
Catch per unit of effort (CPUE) (kg)
50.0 20.6 33.8 34.8
Annual yield (tonnes) 1 354.5 225.3 421.8 2 001.6
-------------------- Rupees --------------------
Per boat
Value of production 370 164 207 900 293 220 290 424
Costs of production 124 116 62 148 99 240 95 148
Economic returns 246 048 145 752 193 980 16 632 132
Per reservoir
Value of production 32 204 268 6 237 000 11 728 800 50 170 068
Costs of production 10 798 092 1 864 440 3 969 600 16 632 132
Economic returns
Total by reservoir 21 406 176 4 372 560 7 759 200 33 537 936
$ 305 803 $ 62 265 $ 110 845 $ 479 113
Per m3 of water delivered (storage level)
0.16 0.46 2.38 0.23
Source: Taken from Renwick (2001)
at 18 per cent of that required for irrigated
paddy production.
The use value of water in reservoirs was
estimated based on the reservoir storage
levels (Table 15). The per-unit value of water
use in fisheries was determined to average
25 per cent (0.0033 US$/m3) of that for
water delivered to irrigate paddy fields
(0.0133 US$/m3). Nevertheless it must be
considered that as a large proportion of the
water that supports fisheries ultimately ends
up irrigating crops giving it extra value.
Fisheries are not currently recognized in
management and water allocation plans
for the KOISP region. This reflects the fact
that the development of inland fisheries is a
secondary use of most reservoirs. This study
demonstrates the economic value of the
fisheries and indicates that integrated water
management plans, considering irrigation
and non-irrigation uses, would be preferable.
A number of assumptions were made in the
estimation of the value of water in paddy
production and a full list can be found in
Appendix B of the original report. One
assumption perhaps worthy of note is that
yield figures used to estimate the value of
water in paddy production were assumed
to be upwardly biased and, as such, were
reduced by a factor of 25 per cent.
�.�.� assessment of the economic value of Muthurajawela Wetlands (emerton and kekulandala �00�)
This report was based primarily on published
literature and involved a limited collection of
original field data. The authors concede that
few data exist on the economic value of the
Muthurajawela wetlands and this study is
a first attempt at estimating the economic
value of these resources. The assessment
of fisheries was limited to its direct use
economic value by calculating the market
prices of output. Data were insufficient to
assess the value of fish breeding and nursery
for downstream fisheries. About 13-14 per
cent of the 1,200 local households are
involved in fishing activities in the marsh area
(including both freshwater and brackish-water
parts). Fishing in the marsh is primarily for
household consumption. The marshland also
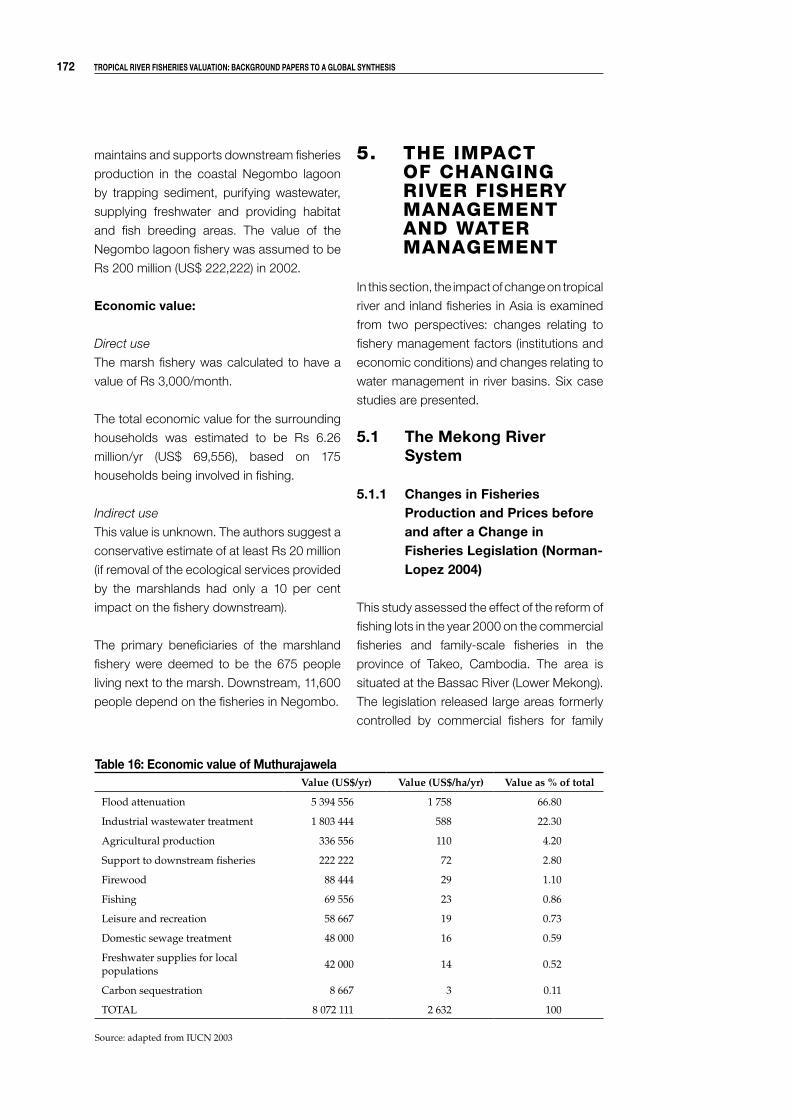
1�� Tropical river fisheries valuaTion: background papers To a global synThesis
maintains and supports downstream fisheries
production in the coastal Negombo lagoon
by trapping sediment, purifying wastewater,
supplying freshwater and providing habitat
and fish breeding areas. The value of the
Negombo lagoon fishery was assumed to be
Rs 200 million (US$ 222,222) in 2002.
economic value:
Direct use
The marsh fishery was calculated to have a
value of Rs 3,000/month.
The total economic value for the surrounding
households was estimated to be Rs 6.26
million/yr (US$ 69,556), based on 175
households being involved in fishing.
Indirect use
This value is unknown. The authors suggest a
conservative estimate of at least Rs 20 million
(if removal of the ecological services provided
by the marshlands had only a 10 per cent
impact on the fishery downstream).
The primary beneficiaries of the marshland
fishery were deemed to be the 675 people
living next to the marsh. Downstream, 11,600
people depend on the fisheries in Negombo.
5. THE IMPACT OF CHANGING RIVER FISHERY MANAGEMENT AND WATER MANAGEMENT
In this section, the impact of change on tropical
river and inland fisheries in Asia is examined
from two perspectives: changes relating to
fishery management factors (institutions and
economic conditions) and changes relating to
water management in river basins. Six case
studies are presented.
�.1 The Mekong river system
�.1.1 changes in fisheries production and prices before and after a change in fisheries legislation (norman-lopez �00�)
This study assessed the effect of the reform of
fishing lots in the year 2000 on the commercial
fisheries and family-scale fisheries in the
province of Takeo, Cambodia. The area is
situated at the Bassac River (Lower Mekong).
The legislation released large areas formerly
controlled by commercial fishers for family
Table 1�: economic value of MuthurajawelaValue (US$/yr) Value (US$/ha/yr) Value as % of total
Flood attenuation 5 394 556 1 758 66.80
Industrial wastewater treatment 1 803 444 588 22.30
Agricultural production 336 556 110 4.20
Support to downstream fisheries 222 222 72 2.80
Firewood 88 444 29 1.10
Fishing 69 556 23 0.86
Leisure and recreation 58 667 19 0.73
Domestic sewage treatment 48 000 16 0.59
Freshwater supplies for local populations
42 000 14 0.52
Carbon sequestration 8 667 3 0.11
TOTAL 8 072 111 2 632 100
Source: adapted from IUCN 2003
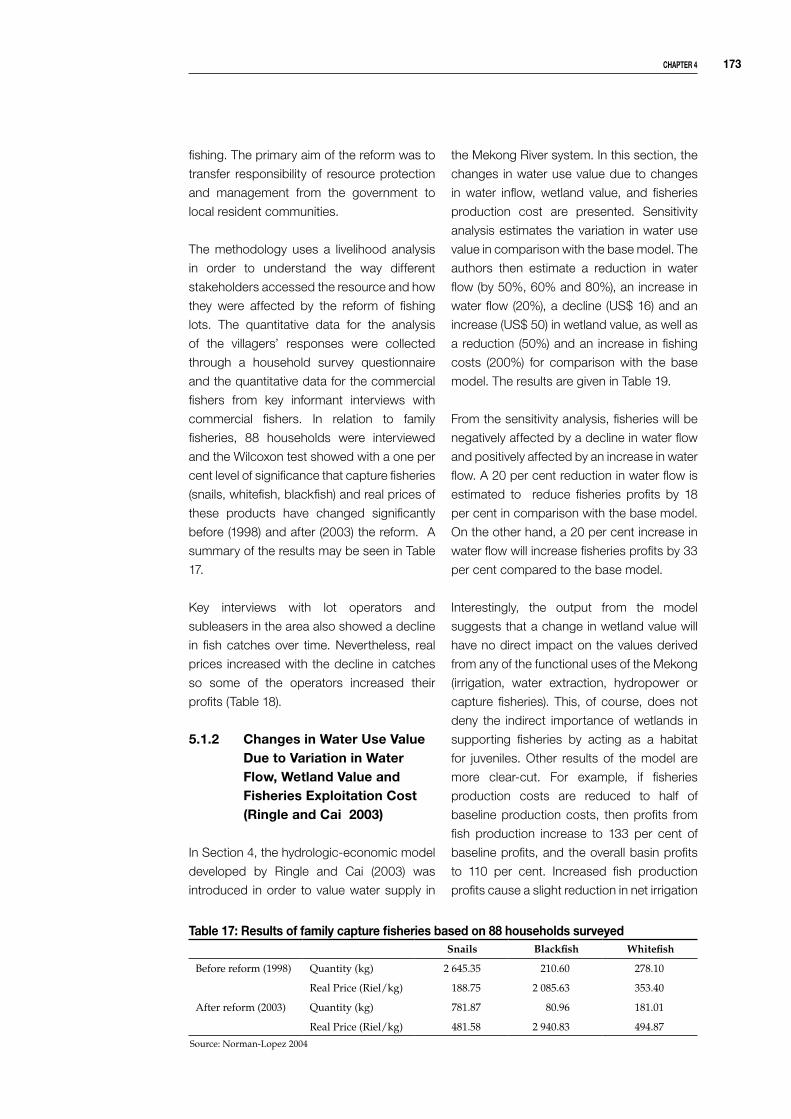
chapTer � 1��
fishing. The primary aim of the reform was to
transfer responsibility of resource protection
and management from the government to
local resident communities.
The methodology uses a livelihood analysis
in order to understand the way different
stakeholders accessed the resource and how
they were affected by the reform of fishing
lots. The quantitative data for the analysis
of the villagers’ responses were collected
through a household survey questionnaire
and the quantitative data for the commercial
fishers from key informant interviews with
commercial fishers. In relation to family
fisheries, 88 households were interviewed
and the Wilcoxon test showed with a one per
cent level of significance that capture fisheries
(snails, whitefish, blackfish) and real prices of
these products have changed significantly
before (1998) and after (2003) the reform. A
summary of the results may be seen in Table
17.
Key interviews with lot operators and
subleasers in the area also showed a decline
in fish catches over time. Nevertheless, real
prices increased with the decline in catches
so some of the operators increased their
profits (Table 18).
�.1.� changes in Water use value due to variation in Water flow, Wetland value and fisheries exploitation cost (ringle and cai �00�)
In Section 4, the hydrologic-economic model
developed by Ringle and Cai (2003) was
introduced in order to value water supply in
the Mekong River system. In this section, the
changes in water use value due to changes
in water inflow, wetland value, and fisheries
production cost are presented. Sensitivity
analysis estimates the variation in water use
value in comparison with the base model. The
authors then estimate a reduction in water
flow (by 50%, 60% and 80%), an increase in
water flow (20%), a decline (US$ 16) and an
increase (US$ 50) in wetland value, as well as
a reduction (50%) and an increase in fishing
costs (200%) for comparison with the base
model. The results are given in Table 19.
From the sensitivity analysis, fisheries will be
negatively affected by a decline in water flow
and positively affected by an increase in water
flow. A 20 per cent reduction in water flow is
estimated to reduce fisheries profits by 18
per cent in comparison with the base model.
On the other hand, a 20 per cent increase in
water flow will increase fisheries profits by 33
per cent compared to the base model.
Interestingly, the output from the model
suggests that a change in wetland value will
have no direct impact on the values derived
from any of the functional uses of the Mekong
(irrigation, water extraction, hydropower or
capture fisheries). This, of course, does not
deny the indirect importance of wetlands in
supporting fisheries by acting as a habitat
for juveniles. Other results of the model are
more clear-cut. For example, if fisheries
production costs are reduced to half of
baseline production costs, then profits from
fish production increase to 133 per cent of
baseline profits, and the overall basin profits
to 110 per cent. Increased fish production
profits cause a slight reduction in net irrigation
Table 1�: results of family capture fisheries based on �� households surveyedSnails Blackfish Whitefish
Before reform (1998) Quantity (kg) 2 645.35 210.60 278.10
Real Price (Riel/kg) 188.75 2 085.63 353.40
After reform (2003) Quantity (kg) 781.87 80.96 181.01
Real Price (Riel/kg) 481.58 2 940.83 494.87
Source: Norman-Lopez 2004

1�� Tropical river fisheries valuaTion: background papers To a global synThesis
profits, and an improvement in hydropower
profits to 102 per cent of the baseline values.
�.� bangladesh
performance-response of the inland fishery under different simulated changes in the cost of harvest and changes in aggregate demand for fish (ahmed1���, 1���)
�.�.1 changes in the cost of harvest
The model used in the analysis has been
previously discussed in Section 4. In the
analysis, the author studied the case where
effort is fishery specific but flexible to operate
in different fishing grounds. Table 20 shows
the aggregate results in percentage terms
under several alternative cost conditions from
the base model.
Overall, a decline in costs by 25 and 50 per
cent will increase fishing effort and catches.
This result implies that potential catches of
the fishery could be much higher than actual
catches. If the fishery were exploited at its
full potential, a decline in fishing costs could
increase fishing effort, however catches
would hardly change or even decline due
to the excessive exploitation. On the other
Table 1�: cash flow for several commercial fishersLOT
OPERATORSCATCH & PRICE 1998-99 1999-2000 2000-2001 2001-2002 2002-2003 2003-2004
Lot operator #1
catch blackfish (kg) 35 000 35 000 33 300 26 000 17 200 13 600
real price blackfish (R) 2 759.25 2 651.00 2 670.75 2 685.75 3 960.36 3 914.00
catch whitefish (kg) 23 000 23 000 18 600 18 400 31 700 27 200
real price whitefish (R) 772.59 742.28 747.81 752.01 1 250.64 1 236.00
Subleaser 1 lot#1
catch blackfish (kg) 5 250 3 480 2 940 2 450
real price blackfish (R) 2 759.25 2 846.90 3 699.81 3 811.00
catch whitefish (kg) 10 000 11 200 9 400 9 400
real price whitefish (R) 596.00 580.12 896.29 885.80
Subleaser 2 lot#1
catch blackfish (kg)
NOT SUBLEASING
2 675
real price blackfish (R) 6 180.00
catch whitefish (kg) 1 300
real price whitefish (R) 2 163.00
Subleaser from KREG
catch blackfish (kg)
NOT SUBLEASING
2 810 2 810
real price blackfish (R) 13 896.00 13 733.33
catch whitefish (kg) 3 100 3 100
real price whitefish (R) 2 188.62 2 163.00
Lot operator #2
catch blackfish (kg) 9 300
NOTSUB-
LEASINGLOT RELEASED TO COMMUNITY MANAGEMENT
real price blackfish (R) 1 655.55
catch whitefish (kg) 19 800
real price whitefish (R) 331.11
Lot operator #3
catch blackfish (kg) 12 000
LOT RELEASED TO COMMUNITY MANAGEMENTreal price blackfish (R) 2 759.25
catch whitefish (kg) 17 000
real price whitefish (R) 772.59
Lot operator #5
catch blackfish (kg) 77 400 77 400 77 400 73 700 58 200 45 000
real price blackfish (R) 2 759.25 2 651.00 2 670.75 2 685.75 3 647.70 3 914.00
catch whitefish (kg) 32 600 32 600 32 600 21 400 25 000 23 000
real price whitefish (R) 772.59 742.28 747.81 752.01 1 250.64 1 236.00
Source: Norman-Lopez 2004

chapTer � 1��
Table 1�: sensitivity analysis: profits from water use (values and percentage)
ParametersLevels/values
IrrigationDomestic/ industrial water use
Hydro-power
Capture fisheries
Wetlands Total
(million US$)
BASE MODEL
917 170 43 546 134 1,809
Inflow
50%586.9
(64%)161.5
(95%)24.1
(56%)174.7
(32%)109.9
(82%)1 049.2(58%)
60%632.7
(69%)168.3
(99%)28.0
(65%)245.7
(45%)116.6
(87%)1 193.9(66%)
80%871.2
(95%)168.3
(99%)32.7
(76%)447.7
(82%)127.3
(95%)1 646.2(91%)
120%944.5
(103%)170
(100%)43.9
102%)726.2
(133%)128.6
(96%) 2 008.0 (111%)
Wetland value a
US$ 16917
(100%)170
(100%)43
(100%)546
(100%)107.2
(80%)1 790.9(99%)
US$ 50917
(100%)170
(100%)43
(100%)546
(100%)335
(250%)2 008.0(111%)
Fisheries production cost b
50%916.1
(99.9%)170
(100%)43.9
(102%)726.2
(133%)133.9
(99.9%)1 989.9(110%)
200%917
(100%)170
(100%)43
(100%)218.4
(40%)134
(100%)1 483.4(82%)
a Baseline value is US$ 20
b Baseline value is US$ 280
Source: Ringle and Cai 2003
Table �0: behavior of the riverine fisheries of bangladesh under alternative cost conditions (changes in the cost of harvesting from the base model)
Items Condition of cost
50% decrease
25% decrease
Base Model
25% increase
50% increase
100% increase
Benefit-costa
Net benefit 2 808 2 258 1 383 929 642 330
Gross benefit 10 712 8 099 5 634 4 153 3 041 1 661
Producer surplus 2 163 1 653 1 289 873 616 321
Total revenue 10 066 7 494 5 540 4 097 3 016 1 652
Total cost 7 904 5 841 4 251 3 224 2 399 1,331
- harvest cost 3 186 2 918 2 435 1 929 1 456 819
- post-harvest cost 4 718 2 922 1 816 1 295 943 512
Catch-Effort
Total catch (t) 305 650 230 060 173 160 130 230 96 580 54 130
- direct catch 245 870 184 260 139 860 104 670 77 360 44 300
- bycatch 59 770 45800 33 310 25560 19 220 9 830
Total effortb 483 363 303 101 197 054 131 493 84 671 38 787
CPUE (kg)c 632 759 879 990 1 141 1 396a In million Bangladesh Taka (US$1 = BDT32)
b In gear hours x 106
c CPUE = catch per unit of effort
Source: Ahmed 1996
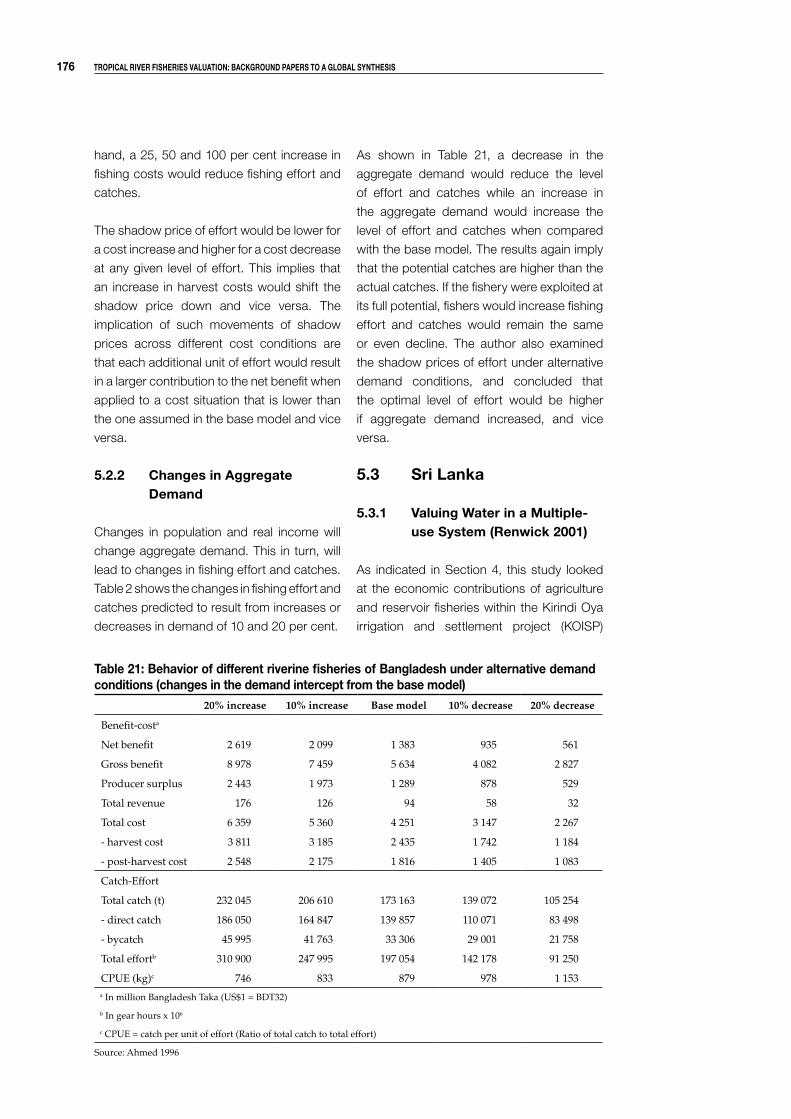
1�� Tropical river fisheries valuaTion: background papers To a global synThesis
hand, a 25, 50 and 100 per cent increase in
fishing costs would reduce fishing effort and
catches.
The shadow price of effort would be lower for
a cost increase and higher for a cost decrease
at any given level of effort. This implies that
an increase in harvest costs would shift the
shadow price down and vice versa. The
implication of such movements of shadow
prices across different cost conditions are
that each additional unit of effort would result
in a larger contribution to the net benefit when
applied to a cost situation that is lower than
the one assumed in the base model and vice
versa.
�.�.� changes in aggregate demand
Changes in population and real income will
change aggregate demand. This in turn, will
lead to changes in fishing effort and catches.
Table 2 shows the changes in fishing effort and
catches predicted to result from increases or
decreases in demand of 10 and 20 per cent.
As shown in Table 21, a decrease in the
aggregate demand would reduce the level
of effort and catches while an increase in
the aggregate demand would increase the
level of effort and catches when compared
with the base model. The results again imply
that the potential catches are higher than the
actual catches. If the fishery were exploited at
its full potential, fishers would increase fishing
effort and catches would remain the same
or even decline. The author also examined
the shadow prices of effort under alternative
demand conditions, and concluded that
the optimal level of effort would be higher
if aggregate demand increased, and vice
versa.
�.� sri lanka
�.�.1 valuing Water in a Multiple-use system (renwick �001)
As indicated in Section 4, this study looked
at the economic contributions of agriculture
and reservoir fisheries within the Kirindi Oya
irrigation and settlement project (KOISP)
Table �1: behavior of different riverine fisheries of bangladesh under alternative demand conditions (changes in the demand intercept from the base model)
20% increase 10% increase Base model 10% decrease 20% decrease
Benefit-costa
Net benefit 2 619 2 099 1 383 935 561
Gross benefit 8 978 7 459 5 634 4 082 2 827
Producer surplus 2 443 1 973 1 289 878 529
Total revenue 176 126 94 58 32
Total cost 6 359 5 360 4 251 3 147 2 267
- harvest cost 3 811 3 185 2 435 1 742 1 184
- post-harvest cost 2 548 2 175 1 816 1 405 1 083
Catch-Effort
Total catch (t) 232 045 206 610 173 163 139 072 105 254
- direct catch 186 050 164 847 139 857 110 071 83 498
- bycatch 45 995 41 763 33 306 29 001 21 758
Total effortb 310 900 247 995 197 054 142 178 91 250
CPUE (kg)c 746 833 879 978 1 153a In million Bangladesh Taka (US$1 = BDT32)
b In gear hours x 106
c CPUE = catch per unit of effort (Ratio of total catch to total effort)
Source: Ahmed 1996

chapTer � 1��
in southeastern Sri Lanka. Following this,
the study went on to model the potential
outcomes of three alternative water manage-
ment schemes. In KOISP, the reservoirs
provide storage for irrigation water and
habitats for fish. Therefore, allocation and
management decisions for the purposes of
irrigation directly affect reservoir fisheries by
changing water levels.
Based on the assumption that there is an
optimal range of water volume stored within
a reservoir in terms of fishery productivity,
a simplified econometric model of fishing
yield was specified and estimated to better
identify the relationship between CPUE and
reservoir levels. The average monthly CPUE
by reservoir was regressed on a constant,
the mean monthly storage levels for each
reservoir and reservoir dummy variables
for each reservoir to determine capture
differences among them.
The model was deemed to perform well with
an adjusted R2 of 0.62 indicating a good
fit. A strong correlation was seen between
declining water levels and CPUE for the
observed range of levels in 1999. The
estimated elasticity of CPUE with respect to
water levels is -0.21 indicating that a 10 per
cent decrease in storage is associated with
a 2.1 per cent increase in CPUE. However,
this elasticity is only valid over the range of
storage levels observed in 1999 and for
marginal changes in storage levels. The result
is important, as a substantial negative change
in the volume of water would ultimately have a
negative impact on the fisheries.
After estimating the main model, three
scenarios were investigated. Scenario 1,
evaluates the economic gain of proportionally
allocating an increasing amount of water for
irrigation and a decreasing amount for fishers.
The effect of more efficient management of
this increased volume, for the purposes of
irrigation, was then looked at (Scenarios 2
and 3).
Primarily, the model indicated that marginal
reductions in the amount of water allocated
to fisheries reservoirs actually generated
individual economic gains for both the fishery
and farming activities, resulting in overall
economic gains for the area.
Scenario 1, which reduced reservoir levels by
14.47 MCM (million cubic meters) would lead to
higher fishery yields and an economic gain of
42,000 kg of fish or approximately
Table ��: economic value of water in irrigated paddy and reservoir fisheries under alternative water management schemes
Water management scheme
Status quo Scenario 1 Scenario 2 Scenario 3
Irrigation conservation per hectare reductions
0 0 5% 10%
-------------------- 1 000s --------------------
Paddy (16 730 Rs/ha) 251 352 264 878 278 816 294 303
$ 3 591 $ 3 784 $ 3 983 $ 4 204
Fisheries (16.76 Rs/kg) 33 547 34 251 34 251 34 251
$ 479 $ 489 $ 489 $ 489
Total 284 898 299 129 313 068 328 555
$ 4 070 $ 4 273 $ 4 472 $ 4 694
Economic gain 14 231 28 169 43 656
$ 203 $ 402 $ 624
Source: Taken from Renwick 2001

1�� Tropical river fisheries valuaTion: background papers To a global synThesis
US$ 10,000 per year- over the status
quo scenario. The optimal, estimated
economic gain for paddy farming from
this increased allocation of water was
US$ 613,000 per year- (under Scenario 3).
The model demonstrated that the status
quo per-unit value of water was, on average,
higher for paddy irrigation (0.0133 US$/m3),
and that, with more efficient management,
the value might be further increased
(0.0148 US$/m3). The average per-unit value
for fisheries is significant (0.0033 US$/m3)
and would be higher if the gains could be
made to both simultaneously.
�.�.� adaptive, participatory and integrated assessment (apia) of the impacts of irrigation on fisheries – evaluation of the approach in sri lanka (nguyen-khoa, smith and lorenzen �00�)
A later, ex-post APIA study of the Sri Lankan
KOISP project assessed the economic
impacts of its implementation on fisheries in
the areas previously evaluated. Impacts were
assessed through a series of workshops,
field studies, interviews with key informants
and the compilation of a knowledge base
from primary and secondary data sources
and technical assessments.
Five critical issues were identified for
investigation:
• Reduced river flow and floodplain
habitats
• Excessive drawdown of water levels for
reservoir fisheries
• Impacts of drainage inflow to the lagoons
• Conflict of interest between fishers and
farmers
• A lack of institutional coordination between
irrigation and fisheries agencies
The first three were considered as impacts
of the project and/or management, and
the last two as contributing factors. These
issues were used to define the scope of the
projects.
As shown in Table 23, the KOISP project
had a modest positive impact on preexisting
fisheries in terms of aggregate production
and value.
The reduction of river flow downstream was
thought to have had little impact, in terms
of fisheries, as neither subsistence nor
commercial fisheries had ever developed
in the floodplain. On the other hand, the
Table ��: koisp fisheries balance in terms of production and valueBefore KOISP After KOISP
Water bodyCatchment
area (ha)Production
t/yearValue Rs
1,000Catchment
area (ha)Production
t/yearValue Rs
1,000
Floodplain 6 200 124 50 0 0 0
Lagoons 15 000 150 225 1 500 150 60
Lunuganwehera 0 0 0 3 200 1 344 538
Tanks 1 608 1 013 405 1 608 1 013 405
Small Tanks 300 189 76 200 126 50
River* -117 800 35 14 0 0
Total* 9 608 1 511 14 6 508 2 633 1 053
Change -3 100 1 122 284
* The river does not contribute to catchment area but it contributes to fisheries production and value.
Source: Taken from Nguyen-Kho et al. 2005

chapTer � 1��
creation of a large reservoir upstream
led to a substantial increase in aggregate
fish production. This compensated for
downstream losses. However, negative
impacts of scheme operation and water
management on the actual production of
the preexisting reservoirs and lagoons were
valued at Rs 225,000. Overall the combined
effects of the KOISP project, overfishing
and a recent drought were held responsible
for degrading fish stocks and driving fishing
towards being little more than a livelihood of
last resort.
The authors conclude that if savings could be
made in the water needs of farming and the
minimum water levels needed to conserve
fish stocks were better accounted for, gains
could be made in the national fish output,
employment, and improved nutrition for poor
households.
�.�.� impact of dams
According to Marmulla (2003), the con-
struction of dams and weirs for irrigation,
hydropower generation or flow management
has a long tradition in many parts of the world;
in the past 50 years, many thousands of dams
of different sizes have been constructed.
The construction of such barriers has a
negative impact on natural fish populations
and, together with other factors, greatly
contributes to the reduction, disappearance
and even extinction of some species.
Marmulla (2003) highlights that LARS2
(The Second International Symposium on the
Management of Large Rivers for Fisheries)
identified dams and the disruption of
ecological flows in rivers and floodplains as a
major factor in the decline of inland fisheries.
It should be noted that dams are a significant
feature of developing countries, compared
to developed ones, and their number is
expected to increase at a much faster pace.
This is because of demands for water (and
electricity) from industry, agriculture and
expanding populations of consumers.
In Asia, dam construction has had a major
impact on many rivers and their fisheries.
Dams remain a component of many national
development plans to control flooding,
regulate and store water for agriculture and
electricity generation. For example, 160 dams
are currently proposed for the Mekong River
Basin alone.
While the impact of dams on river fisheries
has been recognized, and assessed to some
degree in terms of environmental, ecological
and biological impacts, there have been
relatively few valuation studies undertaken
(or at least published in the literature). Some
of the impacts and issues involved can be
illustrated with reference to cases studies
from the Lao PDR, Thailand and India/
Bangladesh.
In the case of the Nam Theun 2 Hydroelectric
Project in the Lao PDR, the environmental
assessment plan showed that the dam would
destroy 45,000 hectares of land, supporting
4,500 people and natural habitats (Wegner
1997). The social and environmental costs
were estimated at US$ 60-130 million, with
half of this represented by the opportunity
cost of the land. The mitigation budget for
the project was set at US$ 60-75 million, with
a sum of up to US$ 50 million for additional
unforeseen costs. Wegner (1997) commented
that, overall, the costs of the project had
been underestimated and the benefits
overestimated.
In Thailand, the World Bank (2000) highlighted
to the World Commission on Dams (WCD)
that the proposal for the Pak Mun Dam,
similar to other such projects, did not include
detailed baseline studies on fisheries. There
were also additional problems in determining
the appropriate level of compensation for the
impact of the dam, as well as the application
of the cost-benefit analysis with particular
reference to the loss estimates. The issue of
the impact on biodiversity was particularly
difficult to assess, and it was as difficult to

1�0 Tropical river fisheries valuaTion: background papers To a global synThesis
Table ��: economic evaluation of asian riverine fisheries: a summary of the evidenceCountry/Region Author Method Key Results
Mekong river system (Lao PDR, Cambodia, Thailand, Vietnam)
Ringle and Cai (2003)
Production function and sensitivity analysis
Value of the fishery US$ 546.3 million. Negative correlation between water flow and fishery value
Mekong delta (Vietnam)
Mai et al. (2003) Estimated economic value (EV) using secondary data
Range value of the fishery in Ben Tre Province (US$ 2 832 – 3 099) and Tra Vinh Province (US$ 2 340 – 2 620)
Bangladesh Ahmed (1992, 1996)
Supply-demand model; cost-benefit and sensitivity analysis
Net benefit yielded by the various riverine fisheries (US$ 43 million)
Ali and Islam (1997)
Cost-benefit analysis Net benefit from stocking seasonal floodplains for capture fisheries (Tk 42 848 000)
India Peters and Feustel (1997)
Socioeconomic survey
Failures of coop. system leading to undervaluation of fishery in official figures
Indonesia Koeshendrajana and Cacho (2001)
Production function (bioeconomic analysis)
Estimation of various optimal management solutions for Musi River fishery
Malaysia Ali and Lee (1995)
Livelihood analysis Total annual income for fishing community in the Chenderoh Reservoir (US$ 63 180)
Sri Lanka Renwick (2001) Cost-benefit analysis; Regression analysis to est. CPUE and reservoir levels relationship; and scenario analysis
Estimated total annual economic returns for five reservoirs in KOISP project region (US$ 544 000 – 566 000)
Emerton and Kekulandala (2003)
Estimated economic value (EV) using secondary data
Estimated direct use value for Muthurajawela wetland marsh fishery (US$ 69 556)
Nguyen-Khoa et al. (2005)
Livelihood Analysis Increase in aggregate economic value of fisheries after implementing the KOISP project (Rs 284 000)
Cambodia Norman-Lopez (2004)
Livelihood analysis and socioeconomic survey
Overall decline in catches and increase in prices for commercial and subsistence fishers due to legislative reform
distinguish the impacts attributable to the
dam as opposed to other impacts such as
overfishing.
In India, there are two major dams on
the tributaries of the Ganges at Hardwar
and Farakka; both have produced major
environmental changes and caused political
problems between India and Bangladesh
(Mukerjee 1998). The dams have negatively
impacted on fish migration and production
although the associated reservoirs have
yielded good production. There are no
valuation studies on the overall impact of the
dams on the fisheries in the Ganges.
6. DISCUSSION
The aim of this study was to estimate the
economic value of riverine fisheries in tropical
Asia. It is widely accepted that this resource
is significant in the maintenance of many
people’s livelihoods (Coates 2002); Van
Zalinge et al. (2000). Nevertheless, examples
of studies that have attempted to quantify
this value are limited and often incomplete in
chapTer � 1�1
nature (evaluation of direct use value but not
indirect use value). This report examines the
value of Asian riverine fisheries in the following
two ways: firstly, through a compilation and
summary of the results of existing studies
on this topic; secondly, through estimating
the direct use value of riverine and floodplain
fishing by country using quantities and
freshwater fish prices derived from various
sources.
The review of several case studies not only
provided fishery values in specific areas
but also allowed us to put into perspective
the values of riverine fisheries, compared to
other riverine resource uses such as forestry,
agriculture (irrigation), electricity generation,
etc. A summary of the empirical studies
that have been considered in this report is
provided in Table 24. Presented in the table
are the country/region where the study was
undertaken, the author(s), main economic
methodology used, and key fishery results.
The main point to be highlighted is that all
the studies under review estimated direct use
values but none obtained indirect use values.
Non-use attributes are just as important
as use values. Nevertheless, estimating
non-use values is usually so complicated
in developing countries that only a few of
these studies exist for tropical Asia. One
such study is by Wattage (2002), who used
the contingent valuation (CV) technique to
measure the conservation value of water,
fish and mangrove of a wetland in Sri Lanka.
This report pointed out that the conservation
value of coastal wetlands in Muthurajawela
Marsh and Negombo Lagoon (MMNL) area is
equally important in developing countries in
addition to the formal direct values. This study
was, however, not included in this review for
the simple reason that it does not separate
the value of the fishery from the entire value
of the resource. Finally, some of the studies
reviewed, such as Ahmed (1996), and Ringle
and Cai (2003), not only provide the present
value of the fishery but also include the
change in value under different situations.
This is absolutely necessary to understand
the effect to the resource and society under
different management regimes.
The estimation of a direct economic value
by country provides a rough estimate of
the importance of riverine and floodplain
fisheries (Appendix 3). This value provides
a first glimpse of the significance of these
fisheries to the countries reviewed. The main
problems encountered were accuracy and
availability of data on quantity and price. It is
generally accepted that quantities are often
underreported and studies usually differ in
data collection methods as well as accuracy.
This problem is highlighted in Appendix 1.
For those countries where several reports
present fisheries production, high variations
in values exist. This discrepancy can be seen,
for example, in the case with the Lao PDR.
In the year 2000, the capture production in
the Mekong river system was reported at
27,000 tonnes; nevertheless, Van Zalinge et
al. (2003) estimated from consumption values
that the capture fisheries production in the
Mekong for that year was 182,700 tonnes.
In relation to prices, a large variation in the
quoted figures is apparent (see Appendix 2).
The main problem is due to unit values being
derived from estimates based on different
freshwater species in different areas of the
country. A range of values for the riverine
fisheries of each country reviewed is provided
in Appendix 3. This not only provides an
insight into how valuable the fishery is within
the area but also emphasizes the problem of
data availability.
A major outcome of this study is the realization
that we still have some way to go before truly
reliable estimates of the total economic value
riverine fisheries provide to the countries and
communities of tropical Asia are available.
Only when more rigorous investigations are
conducted that capture all the values derived
from these resources, can we be confident

1�� Tropical river fisheries valuaTion: background papers To a global synThesis
enough to consider the figures as actual
representations of the fisheries value to
society.
7. CONCLUSION
Studies have demonstrated the social and
economic importance of Asian riverine
fisheries using various different indicators,
and in the broadest sense, this makes them
valuable. These fisheries have been shown
to be valuable (i.e., important) in at least two
specific ways: as a generator of commercially
marketable output, and as a source of income
and employment in relatively impoverished
communities. We could also make the obvious
point that these fisheries are important to
consumers, and indeed make a necessary
contribution to nutrition and food security.
These fisheries in their present state are
valuable on a number of different definitions
and measures, but it is necessary to know
how that value will change under different
circumstances. Some of the studies
discussed in this report have addressed this
issue, but there is a need for more research in
this area. With a few exceptions, most of the
valuation studies have undertaken snapshot
reviews of fisheries in order to gauge their
current actual value. What is important,
however, is to be able to see how that value
compares with the maximum value that could
potentially be achieved under alternative
fisheries management regimes. The fact
that many Asian river fisheries are open-
access and thus have a tendency to become
overexploited suggests that economic surplus
in the form of resource rent is being at least
partially dissipated. Assessing the magnitude
of this lost value and finding ways in which
it can be reappropriated should, therefore,
be a priority. While this will require economic
research that can only be undertaken at a cost,
policymakers will be rewarded with improved
knowledge of how to manage these fisheries
for the benefit of Asian communities.

chapTer � 1��
REFERENCESAhmed, M. 1992. Determination of fisheries benefits from
floodplain riverine systems in Bangladesh: a ma themat ica l p rogramming research . Aquaculture and Fisheries Management (23):599-622.
Ahmed, M. 1996. Bioeconomic assessment of Bangladesh riverine fisheries: a programming model, p. 401-417. In R.M. Meyer, C. Zhang, M.L. Windsor, B.J. McCay, L.J. Hushak and R.M. Muth (eds.) Fisheries resource util ization and policy. Proceedings of the World Fisheries Congress, Theme 2. Oxford and IBH Publishing Co. Prt. Ltd., New Delhi.
Ahmed, M., T.S. Tana, and N. Thuok. 1996. Sustaining the gift of the Mekong: the future of the freshwater capture fisheries of Cambodia. Watershed 1(3): March-June 1996.
Ali, A.B. and K.Y. Lee. 1995. Chenderoh Reservoir, Malaysia: a characterization of a small-scale, multigear and multispecies artisanal fishery in the tropics. Fisheries Research (23):267-281.
Ali, L. and Z. Islam. 1997. An assessment of the economic benefits from stocking season floodplains in Bangladesh, p. 289-308. In T. Petr (ed.) Inland fishery enhancements. Papers presented at the FAO/DFID Expert Consultation on Inland Fishery Enhancements. Dhaka, Bangladesh, 7-11 April 1997. FAO Fisheries Technical Paper No. 374. Rome, FAO. 1998. 463 pp.
ASEAN. 2005. Database of inland waters. Philippines inland capture fisheries.
http://inland.seafdec.org/ASEANDatabaseCD/index_x768.html (Accessed 25 August 2005).
Asia-Pacific Fishery Commission (APFC). 2005. Contributions of fisheries and aquaculture in the Asia-Pacific region.http://www.apfic.org/modules/xfsection/article.php?articleid=5 (Accessed 25 August 2005).
Bangladesh Bureau of Statistics. 1994. 1993 Statistical Yearbook of Bangladesh. (Fourteenth Edition). Bangladesh Bureau of Statistics, Dhaka.
Baran, E. 2005. Cambodia inland fisheries: facts, figures and context. The WorldFish Center, Penang.
Baran, E., N. Van Zalinge., P.B. Ngor, I. G, Baird. and D. Coates. 2001. Fish resource and hydrobiological modelling approaches in the Mekong Basin. ICLARM, Penang, Malaysia and the Mekong River Commission Secretariat, Phnom Penh, Cambodia, 62pp.
Barbier, E.B. and I. Strand. 1998. Valuing mangrove-fishery linkages: a case study of Campeche, Mexico. Environmental and Resource Economics 12(2):151-166.
Barbier E.B. 1993. Sustainable use of wetlands. Valuing t r o p i c a l w e t l a n d b e n e f i t s : e c o n o m i c me thodo log ies and a pp l i ca t i ons . The Geographical Journal 159(1):22-32.
Bene, C., T. Bostock, T. Jolley, R. Lewins, A.E. Neiland, P. Wattage and D. Whitmarsh. 2002. Scoping study: design of a research programme for the social and economic valuation of the aquatic resources of the lower Mekong basin. Report prepared for DFID by the Centre for the Economics and Management of Aquatic Resources (CEMARE), University of Portsmouth and Support unit for International Fisheries and Aquatic Research (SIFAR), Department of Fisheries, 89 pp. Food and Agriculture Organization (FAO), Rome.
Bowers, J. 1990. Economics of the environment: the conservationists’ response to the Pearce report. British Association of Nature Conservation, London.
BPS Statistics Indonesia. 2000. Fishery statistics. http://www.bps.go.id/sector/agri/ikan/table6.shtml (Accessed 20 August 2005).
Bureau of Fisheries and Aquatic Resources (BFAR). 2004. Current information on inland capture fisheries in the Philippines. http://www.bfar.da.gov.ph/aquaculture/information/%20info.htm (Accessed 22 August 2005).
Coates, D. 2002. Inland capture fishery statistics of South-East Asia: current status and information needs. Asia-Pacific Fishery Commission. FAO Regional Office for Asia and the Pacific, Bangkok, Thailand. RAP Publication 2002/11. Food and Agr i cu l tu re O rgan i za t i on ( FAO) RAPA , Bangkok.
Das, M.K. 2002. Social and economic impacts of disease in inland open-water and culture-based fisheries in India, p. 333-344. In J.R. Arthur, M.J. Phillips, R.P. Subasinghe, M.B. Reantaso and I.H. MacRae (eds.) Primary Aquatic Animal Health Care in Rural, Small-scale, Aquaculture Development. FAO Fisheries Technical Paper No. 406. Food and Agriculture Organization (FAO), Rome. http://www.fao.org//DOCREP/005/Y3610E/y3610E30.htm (Accessed August 2005).
De Graaf, G.J. and N.D. Chinh. 2002. Floodplain fisheries in the Southern Provinces of Vietnam. Institute of Fisheries Economics and Planning. http://www.nefisco.org/downloads/Vietnam.PDF (Accessed 10 August 2005).
De la Cruz, C.R. 1997. Social, economic and cultural aspects in implementing inland fishery enhancements in the Philippines, p. 323-336. In T. Petr (ed.) Inland fishery enhancements. Papers presented at the FAO/DFID Expert Consultation on Inland Fishery Enhancements. Dhaka, Bangladesh, 7-11 April 1997. FAO Fisheries Technical Paper No. 374. Rome, FAO. 1998. 463pp.
De Silva, S.S. 1988. Reservoirs of Sri Lanka and their fisheries. FAO Fisheries Technical Paper No. 298. Rome, FAO. 128pp.
Dey, M.M., U.-P. Rodriguez, R.M. Briones, C.O. Li, M.S. Haque, L. Li, P. Kumar, S. Koeshendrajana, S.T. Yew, A. Senaratne, A. Nissapa, N.T. Khiem and M. Ahmed. 2004. Disaggregating projections on supply, demand, and trade for developing

1�� Tropical river fisheries valuaTion: background papers To a global synThesis
Asia: preliminary results from the Asiafish model. IIFET 2004 Japan Proceedings, 21-30 July 21-30 2004.
DFID. 2000. Sustainable livelihoods guidance sheets. http://www.livelihoods.org/info/info_guidancesheets.html (Accessed 19 August 2005).
Department of Fisheries (DOF), Bangladesh. (1998) Fish catch statistics of Bangladesh (1990-91). Department of Fisheries, Government of Bangladesh, Dhaka.
Dewan, S. 1994. 2: Productivity and exploitation of inland open water fisheries, p. 1-50. In Productivity, exploitation and fishing technology of inland open-water fisheries, Bangladesh. Consultancy Report. Assistance to the fisheries research institute Mymensingh. Rome, FAO. http://www.fao.org/docrep/field/373989/37398900.htm#Contents (Accessed 20 August 2005).
Earth Trends. 2003. Water resources and freshwater ecosystems - Malaysia. http://earthtrends.wri.org/pdf_library/country_profiles/wat_cou_458.pdf (Accessed 10 August 2005).
Emerton, L.L. and L.D.B.C. Kekulandala. 2003. Assessment of the economic value of Muthurajawela Wetland. Occasional Papers of the IUCN Sri Lanka. No. 4, January 2003. World Conservation Union.
Food and Agriculture Organization (FAO). 2005. Fish-Stat Plus Database. http://www.fao.org/fi/statist/FISOFT/FISHPLUS.asp (Accessed 12 August 2005).
Food and Agriculture Organization (FAO). 2003. Myanmar aquaculture and inland fisheries. FAO Regional Office for Asia and the Pacific, Bangkok. RAP Publication 2003/18. Food and Agriculture Organization (FAO) RAPA, Bangkok.
Food and Agriculture Organization (FAO). Various dates, 1999-2005. FAO World fisheries statistics – country profile. http://www.fao.org/fi/fcp/fcp.asp(Accessed 10 August 2005).
Hodgson, G. and J.A. Dixon. 1988. Logging versus fisheries and tourism in Palawan. Occasional Paper No. 7. East-West Environment and Policy Institute, Honolulu, USA.
ICLARM The World Fish Center. 2002. ADB-RETA 5945 Inception Report (April
2002). Strategies and options for increasing and sustaining fisheries and aquaculture production to benefit poor househo lds in As ia . h t tp : / /www.worldfishcenter.org/demandsupply/index.htm
World Conservation Union (formerly IUCN). 2003. Muthurajawela Marsh, Sri Lanka: safeguarding wetlands protected areas in cities. IUCN Case Studies in Wetland Valuation No. 1: May 2003. World Conservation Union.
Jackson, D.C. and G. Marmulla. 2001. The influence of dams on river fisheries, p.1-44. In G. Marmulla (ed.) Dams, fish and fisheries. Opportunities, challenges and conflict resolution. FAO Fisheries
Technical Paper No. 419, 166 pp. Food and Agriculture Organization (FAO), Rome.
Jensen, J.G. 2000. MRC Fisheries programme: living aquatic resources management and conservation. A short presentation. Mekong River Commission (MRC), Phnom Penh.
Johari, I., M.M. Isa and O. Muda. 2003. Project 1 - Biodiversity, limnology and fishery of Pahang River, Malaysia. Pilot Project in Peninsular Malaysia under the Information Gathering for Inland Capture Fisheries in ASEAN countries program. http://inland.seafdec.org/ (Accessed 25 August 2005).
Khoo, K.H., S.R.M.S. Amir and A.B. Ali. 2003. Fisheries of inland water bodies in Malaysia. Annex 4 - Report of the ASEAN-SEAFDEC Regional Technical Consultation on Information Gathering for Inland Capture Fisheries in Asian Countries, 4-6 August 2003, Kuala Lumpur, Malaysia. http://inland.seafdec.org/ (Accessed 25 August 2005).
Khoo, K.H., T.S. Leong, F.L. Soon, S.P. Tan and S.Y. Wong. 1987. Riverine fisheries in Malaysia. Archiv feur Hydrobiologie. Beiheft 28:261-268.
Koeshendrajana, S. and O. Cacho. 2001. Management options for the inland fisheries resource in South Sumatra, Indonesia: I. Bioeconomic Model, No. 2001-2. Working Paper Series in Agricultural and Resource Economics, University of New England Graduate School of Agricultural and Resource Economics and School of Economics. ISSN 1442 1909. http://www.une.edu.au/febl/EconStud/wps.htm (Accessed 23 August 2005).
Laplante, B. 2005. Economic analysis of the environmental and social impacts of the Nam Theun 2 Hydroelectricity Power Project. World Bank, Washington D.C. ht tp: / /s i teresources.worldbank.org/INTLAOPRD/147273-1092045101973/20377067/e-s_economic_analysis.pdf (Accessed 26 August 2005).
Liaquat, M., and M, Zahirul. 1997. An assessment of the economic benefits from stocking seasonal floodplains in Bangladesh, p.289-308. In T. Petr (ed.) Inland fishery enhancements. Papers presented at the FAO/DFID Expert Consultation on Inland Fishery Enhancements. Dhaka, Bangladesh, 7–11 April 1997. FAO Fisheries Technical Paper no. 374. Rome, FAO. 1998. 463 pp.
Mai, T.N., H.N. Nguyen, Q.H. Luong, D.S. Do, H.N. Tran, C.T. Ngo, K.O. Bui, T.N. Dang, N.S. Nguyen and Q.D. Ngo. 2003. Economic valuat ion of demonstration wetland sites in Vietnam. Vietnam Wetland Component. UNEP/GEF South China Sea Project. Hanoi. http://www.unepscs.org/Documents/RTF-E2/Nat%20Rep-W/Vietnam%20economic%20evaluation%20of%20Wetland%20sites%206-5-2003.pdf (Accessed 26 August 2005).

chapTer � 1��
Marmulla, G. 2003. Dams and fisheries, p. 28-36. In FAO review of the state of world fishery resources: inland fisheries. FAO Fisheries Circular No. 942, rev.1. Food and Agriculture Organization (FAO), Rome.
Ministry of Fisheries and Aquatic Resources (Sri Lanka). 2005. Fish catch. http://www.fisheries.gov.lk/fishCatch/fishCatch.html (Accessed 25 August 2005).
Ministry of Irrigation and Water Management of Sri Lanka. 2002. http://www.priu.gov.lk/index.html (Accessed 20 August 2005).
Moo, W. 2002. Inland fisheries of the Union of Myanmar, p. 71-78. In Cold water fisheries in the trans-Himalayan countries. Section 2. Country Reviews. FAO Fisheries Technical Paper No. 431. Food and Agriculture Organization (FAO), Rome.
Mukerjee, A. 1998. The Ganga Basin. http://www.cs.albany.edu/~amit/ganges.html (Accessed 24 August 2005).
Nam, S. and N. Thuok. 1999. Aquaculture sector review (1984-1999) and outl ine of aquaculture development plan (2000-2020) in Cambodia. Ministry of Agriculture, Forestry and Fisheries, Department of Fisheries, Phnom Penh.
Nguyen-Khoa, S., L. Smith and K. Lorenzen. 2005. Adaptive, participatory and integrated assessment (APIA) of the impacts of irrigation on fisheries: evaluation of the approach in Sri Lanka. Working Paper No. 89. International Water Management Institute, Colombo.
Nissanka, C., U.S. Amaransinghe and S.S. De Silva. 2000. Yield predictive models for Sri Lankan reservoir fisheries. Fisheries Management and Ecology 7:425-436.
Norman-L pez, A. 2004. Effect of the reform of fishing lots in the year 2000 to the commercial fisheries and family scale fisheries in the province of Takeo. University of Portsmouth, Department of Economics, Portsmouth. Masters Thesis.
Payne, I., H.R. Sinha and S.S. Huq. 2003. A review of the Ganges Basin: its fish and fisheries, p.229-251. In R.L. Welcomme and L. Petr (eds.) Proceedings of the Second International Symposium on the Management of Large Rivers for Fisheries, Volume 1. RAP Publication 2004/16. Food and Agr icu l tu re Organ iza t ion (FAO) , RAPA, Bangkok.
Peters, D.M. and C. Feustel. 1997. Social and economic aspects of fisheries enhancement in Kerala Reservoirs, p.309-322. Petr, T. (ed.) Inland fishery enhancements. FAO Fisheries Technical Paper No. 374. Food and Agriculture Organization (FAO), Rome.
Planning and Accounting Office. 2001. Kingdom of Cambodia: Second Five-Year Fisheries Sector Development Plan (2001-2005). Department of Fisheries, Cambodia, Phnom Penh.
Renwick, M.E. 2001. Valuing water in a multiple-use system. Irrigated agriculture and reservoir fisheries. Irrigation and Drainage Systems 15:149-171.
Ringle, C. X. Cai. 2003. Addressing environmental water values in an integrated economic-hydrologic river basin modelling framework. Paper prepared for workshop on: Integrating Environmental Impacts into Water Allocation Models of the Mekong River Basin, 15 December, 2003, Ho Chi Minh City. http://apseg.anu.edu.au/pdf/jbennett/intimprr03.pdf. (Accessed on 20 August 2005).
Ryan, M. and S. Farrar. 2000. Education and ebate: using conjoint analysis to elicit preferences for health care. British Medical Journal 320:1530-1533.
Seckler, D., R. Barker and U. Amarasinghe. 1999. Water scarcity in the twenty-first century. International Journal of Water Resources Development 15(1):29-42.
Singhanouvong, D. and K. Phouthavong. 2002. Fisheries baseline survey in Champasack Province, Lao PDR. Poster Presentations. 5 th Technical Symposium on Mekong Fisheries, 11-13 December 2002, Phnom Penh.
Sugunan, V.V. 1997. Fisheries management of small water bodies in seven countries in Africa, Asia and Latin America. Central Inland Capture Fisheries Research Institute. Barrackpore, West Bengal, India. FAO Fisheries Circular No. 933. Food and Agriculture Organization (FAO), Rome.
Sverdrup-Jensen, S. 2002. Fisheries in the Lower Mekong Basin: status and perspectives. MRC Technical Paper No. 6, 103 pp. Mekong River Commission (MRC), Phnom Penh.
Trong, N.M., H.N. Nguyen, Q.H. Luong, D.S. Do, H.N. Tran, C.T. Ngo, K.O. Bui, T.N. Dang, N.S. Nguyen, Q.D . Ngo . 2003 . Economic va lua t i on o f demonstration wetland sites in Vietnam, Vietnam Wetland Component Report, UNEP/GEF South China Sea project, Hanoi, 63 pp.
United Nations Environmental Programme (UNEP). 1998. National report of Viet Nam on the formulation of a transboundary diagnostic analysis and preliminary framework of a Strategic Action Programme for the South China Sea. http://www.unepscs.org/Publication/PDF-B/vietnamreport.pdf (Accessed on 21 August 2005).
Van Zalinge N., N. Thuok, T.S. Tana and D. Loeung. 2000. Where there is water, there is fish? Cambodian fisheries issues in a Mekong River Basin perspective, p. 76-108. In M. Ahmed and P. Hirsch (eds.) Common property in the Mekong: issues of sustainability and subsistence. ICLARM Studies and Reviews 26. ICLARM, Manila.
Van Zalinge, N. and N. Thuok. 1999. Summary of project f indings: present sta tus of Cambodia’s freshwater capture fisheries and management implications. Presented at Annual Meeting of the Department of Fisheries, Ministry of
1�� Tropical river fisheries valuaTion: background papers To a global synThesis
Agriculture, Forestry and Fisheries, 19-21 January 1999, Phnom Penh.
Van Zalinge, N., P. Degen, C. Pongsri, S. Nuov, J.G. Jensen, V.H. Nguyen and X. Choulamany. 2003. The Mekong River System, p. 355-357. In R. Welcomme, R. and T. Petr (eds.) Proceedings of the Second International Symposium on the Management of Large River for Fisheries. Sustaining Livelihoods and Biodiversity in the New Millennium, Volume 1. FAO Regional Office for Asia and the Pacific, Bangkok, Thailand. RAP Publication 2004/16. Food and Agriculture Organization (FAO), RAPA, Bangkok.
Wattage, P. and J. Soussan, J. 2003. Incorporating environmental value and externality in project evaluation as a sustainability indicator to evaluate Bangladesh water development. Water Resources Management 17:429-446.
Wattage, P. 2002. Effective Management for Biodiversity Conservation in Sri Lankan Coastal Wetlands CVM Report II. An estimation of total economic value for conservation of wetlands. December 2002, Final Reoprt A-II. CEMARE, University of Portsmouth. 98 pp.
Wegener, D.L. 1997. Review comments on Nam Theun 2 Hydroelectric Project Environmental Assessment and Management Plan (EAMP). http://www.irn.org
Whitmarsh, D. 1999. Putting a price on the marine environment. Marine Pollution Bulletin 38(2):65-66.
Whitmarsh, D. 1993. Economics and the marine environment. Marine Pollution Bulletin 26(11):588-589.
Winpenny, J. 1995. The economic appraisal of environmental projects and policies. Organization for Economic Cooperation and Development (OECD), Paris.
Winpenny, J. 1991. Values for the environment. A guide to economic appraisal. HMSO, London.
World Bank. 2004. Sri Lanka at a glance. http://devdata.worldbank.org/AAG/lka_aag.pdf (Accessed 19 August 2005).
World Bank. 2003a. Indonesia at a glance. http://devdata.worldbank.org/AAG/idn_aag.pdf (Accessed 19 August 2005).
World Bank. 2003b. Malaysia at a glance. http://devdata.worldbank.org/AAG/mys_aag.pdf (Accessed 19 August 2005).
World Bank. 2000. WCD (World Commission on Dams) Case Study. The Pak Mun Dam in the Mekong River Basin, Thailand. Comments by the World Bank, Washington, D.C.
http://www.worldbank.thYusoff, F.M., M.Z. Zaidi and M.A. Ambak. 1995. Fisheries
and environmental management of Lake Kenyir, Malaysia, p. 112-128. In T. Petr and M. Morris (eds.) Regional Symposium on Sustainable Development of In land Fisher ies Under Environmental Constraints. FAO Fisheries Report No. 512. FAO, Rome.
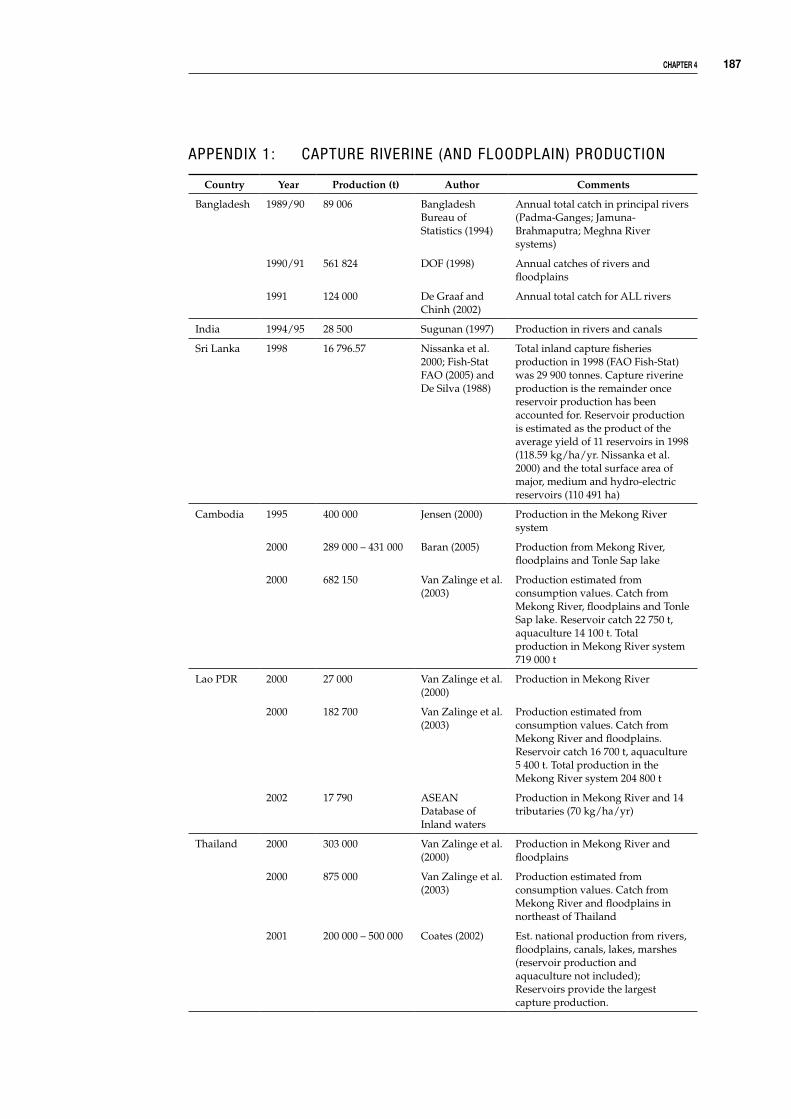
chapTer � 1��
APPENDIX 1: CAPTURE RIVERINE (AND FLOODPLAIN) PRODUCTION
Country Year Production (t) Author Comments
Bangladesh 1989/90 89 006 Bangladesh Bureau of Statistics (1994)
Annual total catch in principal rivers (Padma-Ganges; Jamuna-Brahmaputra; Meghna River systems)
1990/91 561 824 DOF (1998) Annual catches of rivers and floodplains
1991 124 000 De Graaf and Chinh (2002)
Annual total catch for ALL rivers
India 1994/95 28 500 Sugunan (1997) Production in rivers and canals
Sri Lanka 1998 16 796.57 Nissanka et al. 2000; Fish-Stat FAO (2005) and De Silva (1988)
Total inland capture fisheries production in 1998 (FAO Fish-Stat) was 29 900 tonnes. Capture riverine production is the remainder once reservoir production has been accounted for. Reservoir production is estimated as the product of the average yield of 11 reservoirs in 1998 (118.59 kg/ha/yr. Nissanka et al. 2000) and the total surface area of major, medium and hydro-electric reservoirs (110 491 ha)
Cambodia 1995 400 000 Jensen (2000) Production in the Mekong River system
2000 289 000 – 431 000 Baran (2005) Production from Mekong River, floodplains and Tonle Sap lake
2000 682 150 Van Zalinge et al. (2003)
Production estimated from consumption values. Catch from Mekong River, floodplains and Tonle Sap lake. Reservoir catch 22 750 t, aquaculture 14 100 t. Total production in Mekong River system 719 000 t
Lao PDR 2000 27 000 Van Zalinge et al. (2000)
Production in Mekong River
2000 182 700 Van Zalinge et al. (2003)
Production estimated from consumption values. Catch from Mekong River and floodplains. Reservoir catch 16 700 t, aquaculture 5 400 t. Total production in the Mekong River system 204 800 t
2002 17 790 ASEAN Database of Inland waters
Production in Mekong River and 14 tributaries (70 kg/ha/yr)
Thailand 2000 303 000 Van Zalinge et al. (2000)
Production in Mekong River and floodplains
2000 875 000 Van Zalinge et al. (2003)
Production estimated from consumption values. Catch from Mekong River and floodplains in northeast of Thailand
2001 200 000 – 500 000 Coates (2002) Est. national production from rivers, floodplains, canals, lakes, marshes (reservoir production and aquaculture not included); Reservoirs provide the largest capture production.
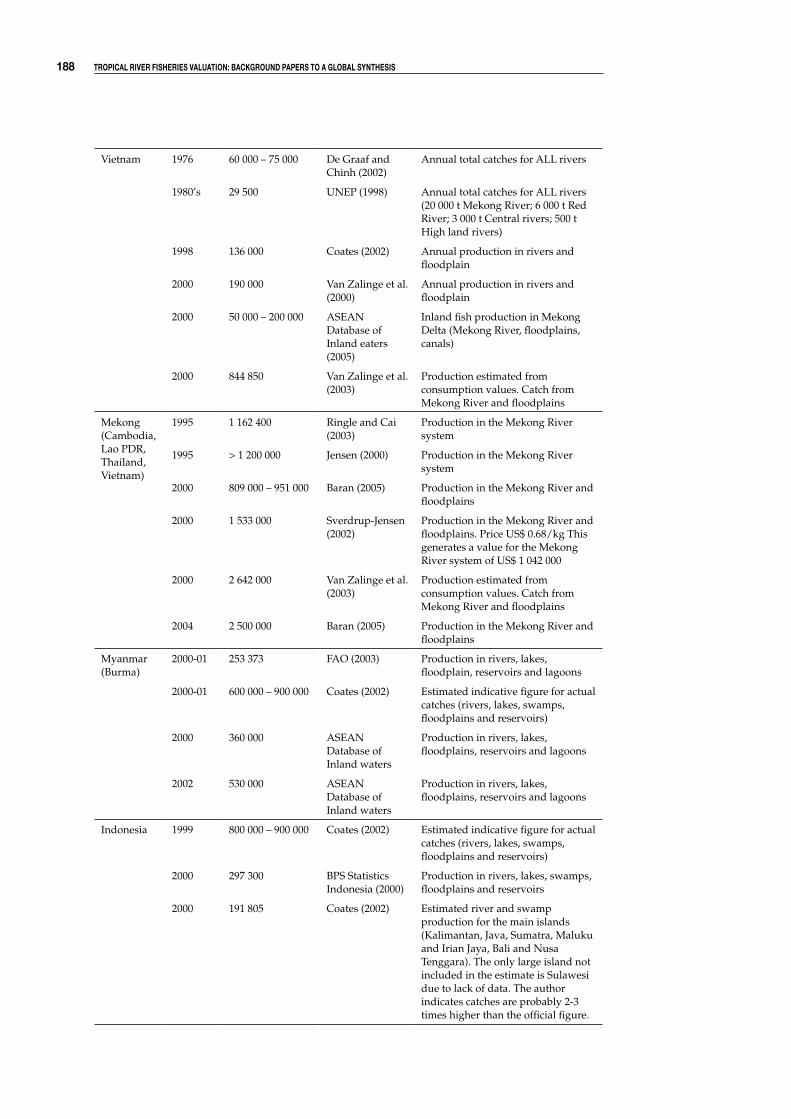
1�� Tropical river fisheries valuaTion: background papers To a global synThesis
Vietnam 1976 60 000 – 75 000 De Graaf and Chinh (2002)
Annual total catches for ALL rivers
1980’s 29 500 UNEP (1998) Annual total catches for ALL rivers (20 000 t Mekong River; 6 000 t Red River; 3 000 t Central rivers; 500 t High land rivers)
1998 136 000 Coates (2002) Annual production in rivers and floodplain
2000 190 000 Van Zalinge et al. (2000)
Annual production in rivers and floodplain
2000 50 000 – 200 000 ASEAN Database of Inland eaters (2005)
Inland fish production in Mekong Delta (Mekong River, floodplains, canals)
2000 844 850 Van Zalinge et al. (2003)
Production estimated from consumption values. Catch from Mekong River and floodplains
Mekong (Cambodia, Lao PDR, Thailand, Vietnam)
1995 1 162 400 Ringle and Cai (2003)
Production in the Mekong River system
1995 > 1 200 000 Jensen (2000) Production in the Mekong River system
2000 809 000 – 951 000 Baran (2005) Production in the Mekong River and floodplains
2000 1 533 000 Sverdrup-Jensen (2002)
Production in the Mekong River and floodplains. Price US$ 0.68/kg This generates a value for the Mekong River system of US$ 1 042 000
2000 2 642 000 Van Zalinge et al. (2003)
Production estimated from consumption values. Catch from Mekong River and floodplains
2004 2 500 000 Baran (2005) Production in the Mekong River and floodplains
Myanmar (Burma)
2000-01 253 373 FAO (2003) Production in rivers, lakes, floodplain, reservoirs and lagoons
2000-01 600 000 – 900 000 Coates (2002) Estimated indicative figure for actual catches (rivers, lakes, swamps, floodplains and reservoirs)
2000 360 000 ASEAN Database of Inland waters
Production in rivers, lakes, floodplains, reservoirs and lagoons
2002 530 000 ASEAN Database of Inland waters
Production in rivers, lakes, floodplains, reservoirs and lagoons
Indonesia 1999 800 000 – 900 000 Coates (2002) Estimated indicative figure for actual catches (rivers, lakes, swamps, floodplains and reservoirs)
2000 297 300 BPS Statistics Indonesia (2000)
Production in rivers, lakes, swamps, floodplains and reservoirs
2000 191 805 Coates (2002) Estimated river and swamp production for the main islands (Kalimantan, Java, Sumatra, Maluku and Irian Jaya, Bali and Nusa Tenggara). The only large island not included in the estimate is Sulawesi due to lack of data. The author indicates catches are probably 2-3 times higher than the official figure.

chapTer � 1��
Philippines 2002 131 644 Bureau of Fisheries and Aquatic Resources (2004)
Production includes lakes, reservoirs, rivers, and marshes
Malaysia 1999 10 008 Coates (2002) Estimated indicative figure for actual catches (rivers, lakes, swamps, floodplains and reservoirs)
2001 3 368.51 ASEAN Database of Inland waters
Production includes lakes, reservoirs, rivers, floodplains and marshes
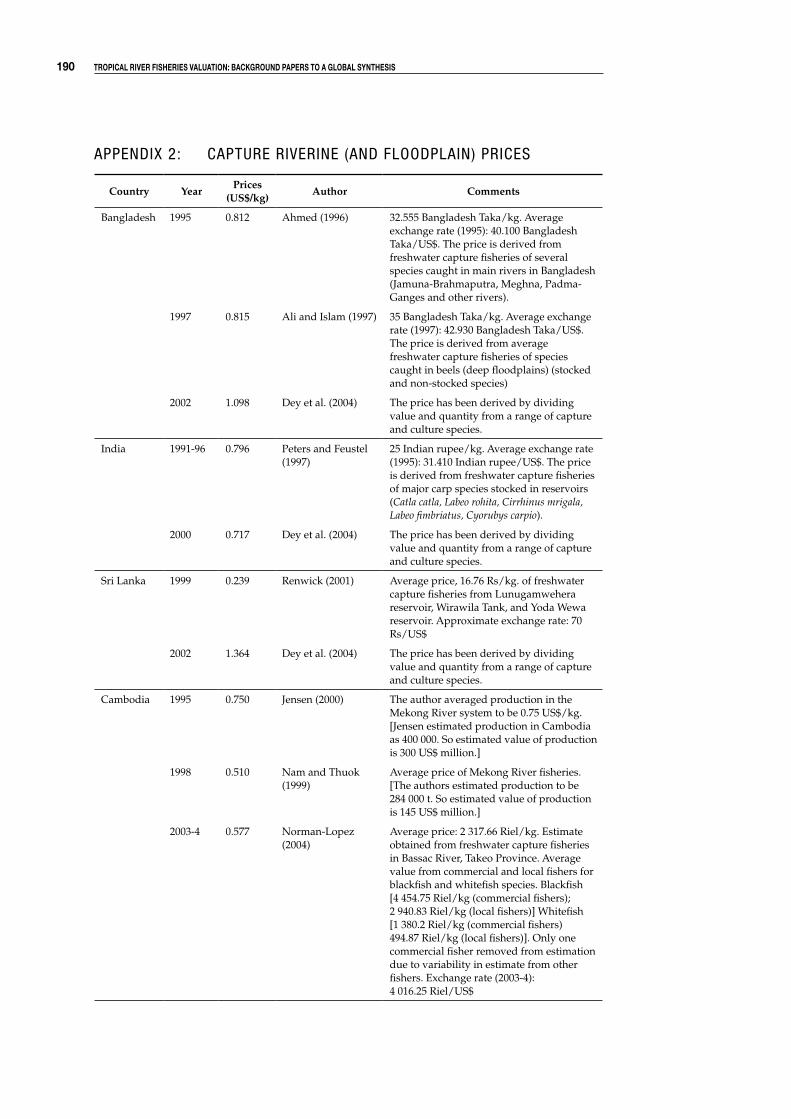
1�0 Tropical river fisheries valuaTion: background papers To a global synThesis
APPENDIX 2: CAPTURE RIVERINE (AND FLOODPLAIN) PRICES
Country YearPrices
(US$/kg)Author Comments
Bangladesh 1995 0.812 Ahmed (1996) 32.555 Bangladesh Taka/kg. Average exchange rate (1995): 40.100 Bangladesh Taka/US$. The price is derived from freshwater capture fisheries of several species caught in main rivers in Bangladesh (Jamuna-Brahmaputra, Meghna, Padma-Ganges and other rivers).
1997 0.815 Ali and Islam (1997) 35 Bangladesh Taka/kg. Average exchange rate (1997): 42.930 Bangladesh Taka/US$. The price is derived from average freshwater capture fisheries of species caught in beels (deep floodplains) (stocked and non-stocked species)
2002 1.098 Dey et al. (2004) The price has been derived by dividing value and quantity from a range of capture and culture species.
India 1991-96 0.796 Peters and Feustel (1997)
25 Indian rupee/kg. Average exchange rate (1995): 31.410 Indian rupee/US$. The price is derived from freshwater capture fisheries of major carp species stocked in reservoirs (Catla catla, Labeo rohita, Cirrhinus mrigala, Labeo fimbriatus, Cyorubys carpio).
2000 0.717 Dey et al. (2004) The price has been derived by dividing value and quantity from a range of capture and culture species.
Sri Lanka 1999 0.239 Renwick (2001) Average price, 16.76 Rs/kg. of freshwater capture fisheries from Lunugamwehera reservoir, Wirawila Tank, and Yoda Wewa reservoir. Approximate exchange rate: 70 Rs/US$
2002 1.364 Dey et al. (2004) The price has been derived by dividing value and quantity from a range of capture and culture species.
Cambodia 1995 0.750 Jensen (2000) The author averaged production in the Mekong River system to be 0.75 US$/kg. [Jensen estimated production in Cambodia as 400 000. So estimated value of production is 300 US$ million.]
1998 0.510 Nam and Thuok (1999)
Average price of Mekong River fisheries. [The authors estimated production to be 284 000 t. So estimated value of production is 145 US$ million.]
2003-4 0.577 Norman-Lopez (2004)
Average price: 2 317.66 Riel/kg. Estimate obtained from freshwater capture fisheries in Bassac River, Takeo Province. Average value from commercial and local fishers for blackfish and whitefish species. Blackfish [4 454.75 Riel/kg (commercial fishers); 2 940.83 Riel/kg (local fishers)] Whitefish [1 380.2 Riel/kg (commercial fishers) 494.87 Riel/kg (local fishers)]. Only one commercial fisher removed from estimation due to variability in estimate from other fishers. Exchange rate (2003-4): 4 016.25 Riel/US$

chapTer � 1�1
Lao PDR 2002 0.55 Singhanouvong and Phouthavong (2002)
Average price: 5 562.5 kip/kg. Estimate obtained from small and large catfish and scaled fish. Exchange rate (2002): 10 056.3 kip/US$
Thailand 2000 1.30 Dey et al. (2004) The price has been derived by dividing value and quantity from a range of capture and culture species.
Vietnam 2000 1.33 Dey et al. (2004) The price has been derived by dividing value and quantity from a range of capture and culture species.
2000 0.36 Mai et al. (2003) Price obtained from inland fisheries in Mekong River estuary (Ben Tre Province). Exchange rate (2000): 14,020 VND/US$
Mekong (Cambodia, Lao PDR, Thailand, Vietnam)
1995 0.75 Ringle and Cai (2003); Jensen (2000)
Prices from freshwater capture fisheries. Value at retail market price. [Jensen (2000) estimated production to be > 1.2 million tonnes. So production estimated 900 – 1 000 US$ million]
2000 0.68 Sverdrup-Jensen (2002)
Prices from freshwater capture fisheries. Average first-hand sale price
Myanmar (Burma)
1999 0.15 Coates (2002) Price derived by dividing value of lease fishery (commercial fishery) (621.89 million Kyat) by estimated landings (70 000 tonnes). Exchange rate (1999): 6.286 Kyat/US$
1999 1.41 Coates (2002) Price derived by dividing value of tender open fishery (83.519 million Kyat) by estimated landings (90 000 tonnes). Exchange rate (1999): 6.286 Kyat/US$
2003 1.6 FAO (2003) Price derived by dividing value (US$ 16) by quantity (10 kg) of fish sold at market. Fish sold were mainly snakehead, relatively high value.
Indonesia 1994 0.56 Koeshendrajana and Cacho (2001)
Price obtained from Musi River. Average actual price of riverine freshwater fish at the producer level was 1 215 Rp/kg. Average exchange rate (1994): 2 160 Rp/ US$
2000 0.51 Dey et al. (2004) The price has been derived by dividing value and quantity from a range of capture and culture species
Philippines 2000 0.80 Dey et al. (2004) The price has been derived by dividing value and quantity from a range of capture and culture species.
2002 0.03 ASEAN Database of Inland waters (2005)
Freshwater capture production from lakes, rivers, reservoirs and marshes. Exchange rate:1 PHP/US$
Malaysia 1988-89 2.46 Ali and Lee (1995) Capture fisheries production in Chenderoh Reservoir, Perak River, Malaysia. Exchange rate from authors: 2.6 M$/US$
2000 1.83 Dey et al. (2003) The price has been derived by dividing value and quantity from a range of capture and culture species
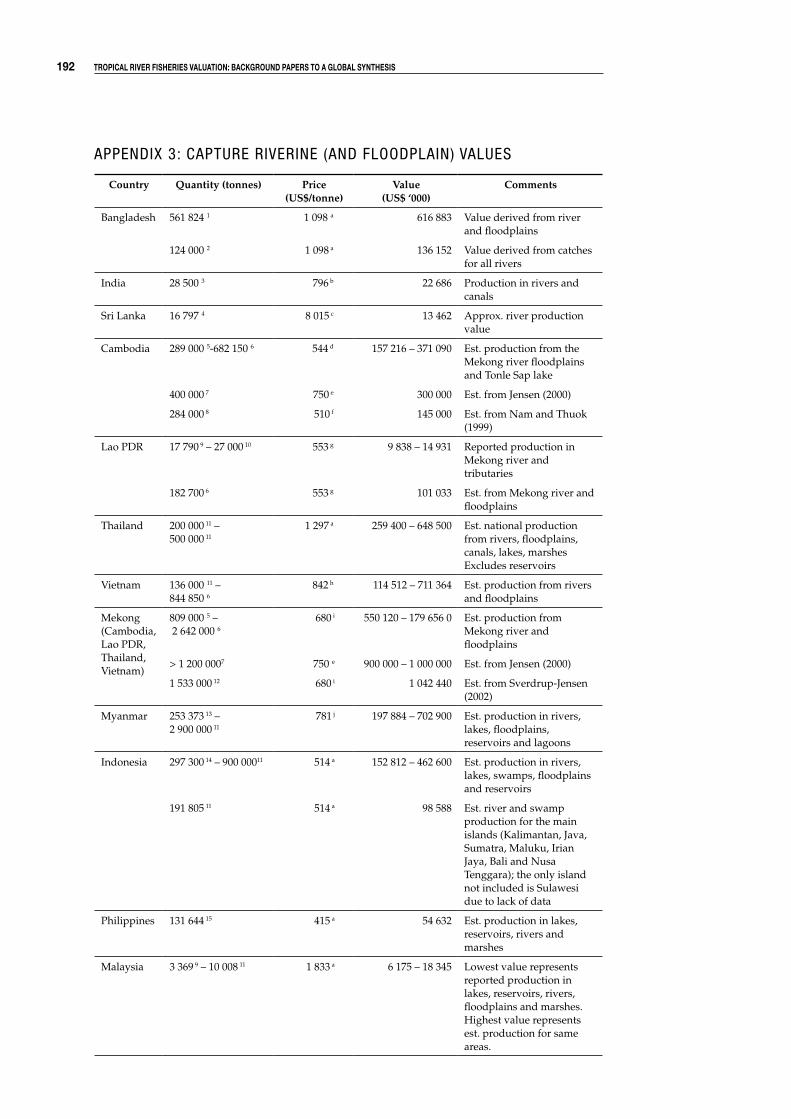
1�� Tropical river fisheries valuaTion: background papers To a global synThesis
APPENDIX 3: CAPTURE RIVERINE (AND FLOODPLAIN) VALUES
Country Quantity (tonnes) Price(US$/tonne)
Value(US$ ‘000)
Comments
Bangladesh 561 824 1 1 098 a 616 883 Value derived from river and floodplains
124 000 2 1 098 a 136 152 Value derived from catches for all rivers
India 28 500 3 796 b 22 686 Production in rivers and canals
Sri Lanka 16 797 4 8 015 c 13 462 Approx. river production value
Cambodia 289 000 5-682 150 6 544 d 157 216 – 371 090 Est. production from the Mekong river floodplains and Tonle Sap lake
400 000 7 750 e 300 000 Est. from Jensen (2000)
284 000 8 510 f 145 000 Est. from Nam and Thuok (1999)
Lao PDR 17 790 9 – 27 000 10 553 g 9 838 – 14 931 Reported production in Mekong river and tributaries
182 700 6 553 g 101 033 Est. from Mekong river and floodplains
Thailand 200 000 11 – 500 000 11
1 297 a 259 400 – 648 500 Est. national production from rivers, floodplains, canals, lakes, marshes Excludes reservoirs
Vietnam 136 000 11 – 844 850 6
842 h 114 512 – 711 364 Est. production from rivers and floodplains
Mekong (Cambodia, Lao PDR, Thailand, Vietnam)
809 000 5 – 2 642 000 6
680 i 550 120 – 179 656 0 Est. production from Mekong river and floodplains
> 1 200 0007 750 e 900 000 – 1 000 000 Est. from Jensen (2000)
1 533 000 12 680 i 1 042 440 Est. from Sverdrup-Jensen (2002)
Myanmar 253 373 13 – 2 900 000 11
781 j 197 884 – 702 900 Est. production in rivers, lakes, floodplains, reservoirs and lagoons
Indonesia 297 300 14 – 900 00011 514 a 152 812 – 462 600 Est. production in rivers, lakes, swamps, floodplains and reservoirs
191 805 11 514 a 98 588 Est. river and swamp production for the main islands (Kalimantan, Java, Sumatra, Maluku, Irian Jaya, Bali and Nusa Tenggara); the only island not included is Sulawesi due to lack of data
Philippines 131 644 15 415 a 54 632 Est. production in lakes, reservoirs, rivers and marshes
Malaysia 3 369 9 – 10 008 11 1 833 a 6 175 – 18 345 Lowest value represents reported production in lakes, reservoirs, rivers, floodplains and marshes. Highest value represents est. production for same areas.
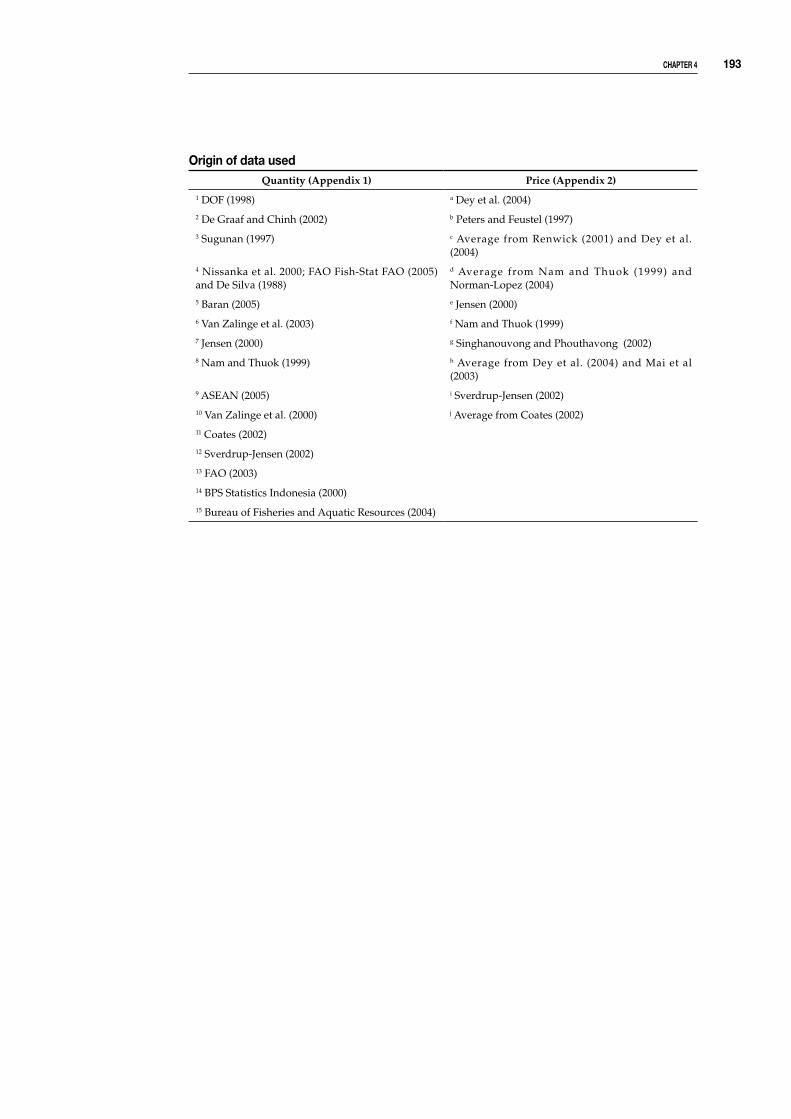
chapTer � 1��
origin of data usedQuantity (Appendix 1) Price (Appendix 2)
1 DOF (1998) a Dey et al. (2004)2 De Graaf and Chinh (2002) b Peters and Feustel (1997)3 Sugunan (1997) c Average from Renwick (2001) and Dey et al.
(2004)4 Nissanka et al. 2000; FAO Fish-Stat FAO (2005) and De Silva (1988)
d Average from Nam and Thuok (1999) and Norman-Lopez (2004)
5 Baran (2005) e Jensen (2000)6 Van Zalinge et al. (2003) f Nam and Thuok (1999)7 Jensen (2000) g Singhanouvong and Phouthavong (2002)8 Nam and Thuok (1999) h Average from Dey et al. (2004) and Mai et al
(2003)9 ASEAN (2005) i Sverdrup-Jensen (2002)10 Van Zalinge et al. (2000) j Average from Coates (2002)11 Coates (2002)12 Sverdrup-Jensen (2002)13 FAO (2003)14 BPS Statistics Indonesia (2000)15 Bureau of Fisheries and Aquatic Resources (2004)
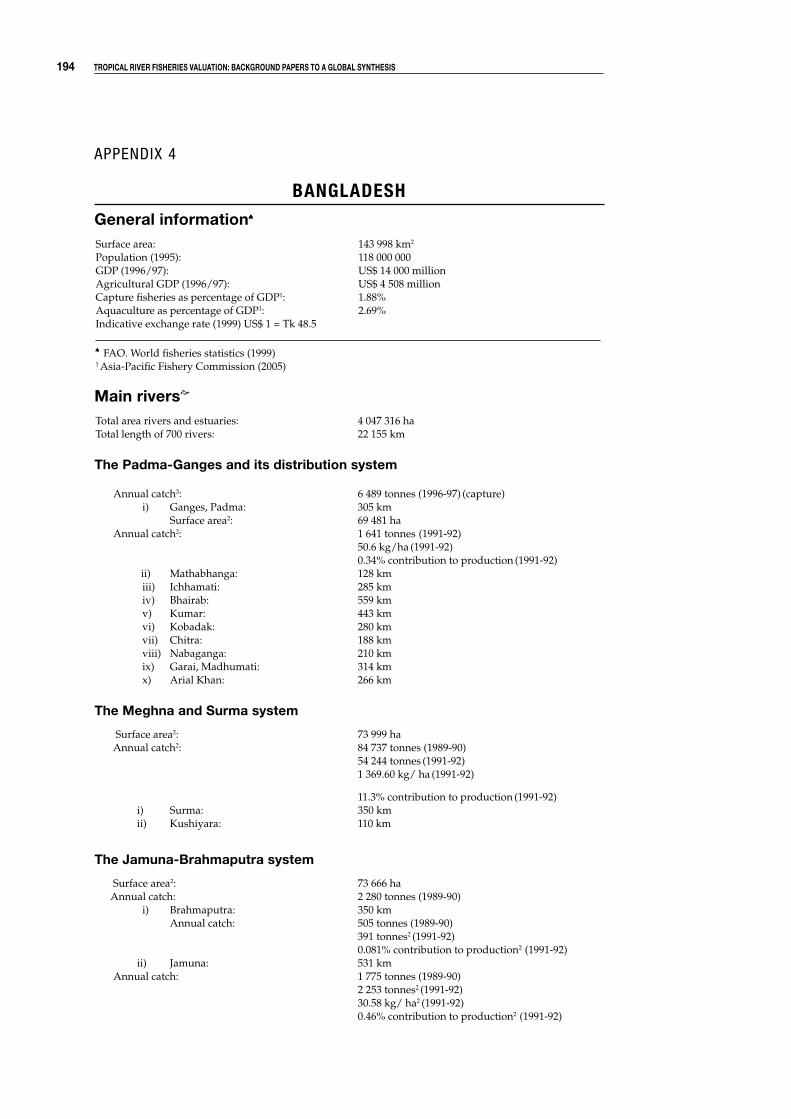
1�� Tropical river fisheries valuaTion: background papers To a global synThesis
APPENDIX 4
BanGladesh
general information♠
Surface area: 143 998 km2 Population (1995): 118 000 000GDP (1996/97): US$ 14 000 millionAgricultural GDP (1996/97): US$ 4 508 millionCapture fisheries as percentage of GDP1: 1.88%Aquaculture as percentage of GDP1: 2.69%Indicative exchange rate (1999) US$ 1 = Tk 48.5
♠ FAO. World fisheries statistics (1999)1 Asia-Pacific Fishery Commission (2005)
Main riverse
Total area rivers and estuaries: 4 047 316 haTotal length of 700 rivers: 22 155 km
The padma-ganges and its distribution system
Annual catch3: 6 489 tonnes (1996-97) (capture)i) Ganges, Padma: 305 km Surface area2: 69 481 ha
Annual catch2: 1 641 tonnes (1991-92) 50.6 kg/ha (1991-92) 0.34% contribution to production (1991-92) ii) Mathabhanga: 128 km
iii) Ichhamati: 285 kmiv) Bhairab: 559 kmv) Kumar: 443 kmvi) Kobadak: 280 kmvii) Chitra: 188 kmviii) Nabaganga: 210 kmix) Garai, Madhumati: 314 kmx) Arial Khan: 266 km
The Meghna and surma system
Surface area2: 73 999 ha Annual catch2: 84 737 tonnes (1989-90) 54 244 tonnes (1991-92) 1 369.60 kg/ ha (1991-92)
11.3% contribution to production (1991-92) i) Surma: 350 km ii) Kushiyara: 110 km
The Jamuna-brahmaputra system
Surface area2: 73 666 ha
Annual catch: 2 280 tonnes (1989-90)i) Brahmaputra: 350 km Annual catch: 505 tonnes (1989-90) 391 tonnes2 (1991-92)
0.081% contribution to production2 (1991-92) ii) Jamuna: 531 km Annual catch: 1 775 tonnes (1989-90) 2 253 tonnes2 (1991-92) 30.58 kg/ ha2 (1991-92) 0.46% contribution to production2 (1991-92)

chapTer � 1��
other rivers in Western region
i) Nagar: 238 kmii) Tangan: 119 kmiii) Purnabhaba: 133 kmiv) Mahananda: 90 kmv) Baral: 20 kmvi) Karatoya Atrai, Hurasagar Gum, Gumani: 841 kmvii) Dharla: 62 km
rivers in chittagong region
i) Karnaphuli: 180 km ii) Sangu: 287 km iii) Matamuhari: 161 km e
Bangladesh Bureau of Statistics (1994)2 FAO (1994) 2: Productivity and Exploitation of Inland Open Water Fisheries3 Payne et al. (2003) A Review of the Ganges Basin: Its Fish and Fisheries
inland fisheries ♣
Inland fisheries surface area1: 4 047 316 haInland fishers2: 768 632 fishermen (1988-89)Inland catches as percentage of total catches: 90% (1960s) 77.9 % (1995-96) total production 1 264 435 t total inland production 985 265 t
Year1995-96
Inland open water (capture) 2 Inland close water (culture)
Inland water
River and estuaries
SundarbanDepression
(beels & haors)
Kaptai Lake
Flood Land
PondsOxbow
lake (baors)
Shrimp farms
Production (tonnes)
146 744 7 857 63 014 7 449 370 105 310 130 3 018 76 948
♣ Liaquat and Zahirul (1997) An Assessment of the Economic Benefits from Stocking Seasonal Floodplains in Bangladesh. 1 FAO (1994) Productivity, Exploitation and Fishing Technology of Inland Open-Water Fisheries, Bangladesh2 Bangladesh Bureau of Statistics (1994)
fisheries data ♦
Production Imports ExportsTotal
supplyPer capita
supply
‘000 tonnes (live weight) Kg/year
Fish for direct human consumption 1 170 0.3 38 1 128 9.5
Fish for animal feed & other purposes 5 - - -
Estimated employment (2002)
(i) Primary sector (including aquaculture):
Full-time fishers: 570 000
Part-time: 1 196 000
(ii) Secondary sector: NA
Gross value of fisheries output (1997):(at ex-vessel prices, estimate)
US$ 1 000 million (=3.12% of GDP)
Trade (1994-95)
Value of fisheries imports (estimate): US$ 590 000 (Average 1994-95)
Value of fisheries exports: US$ 325.11 million (9.38% of total export)
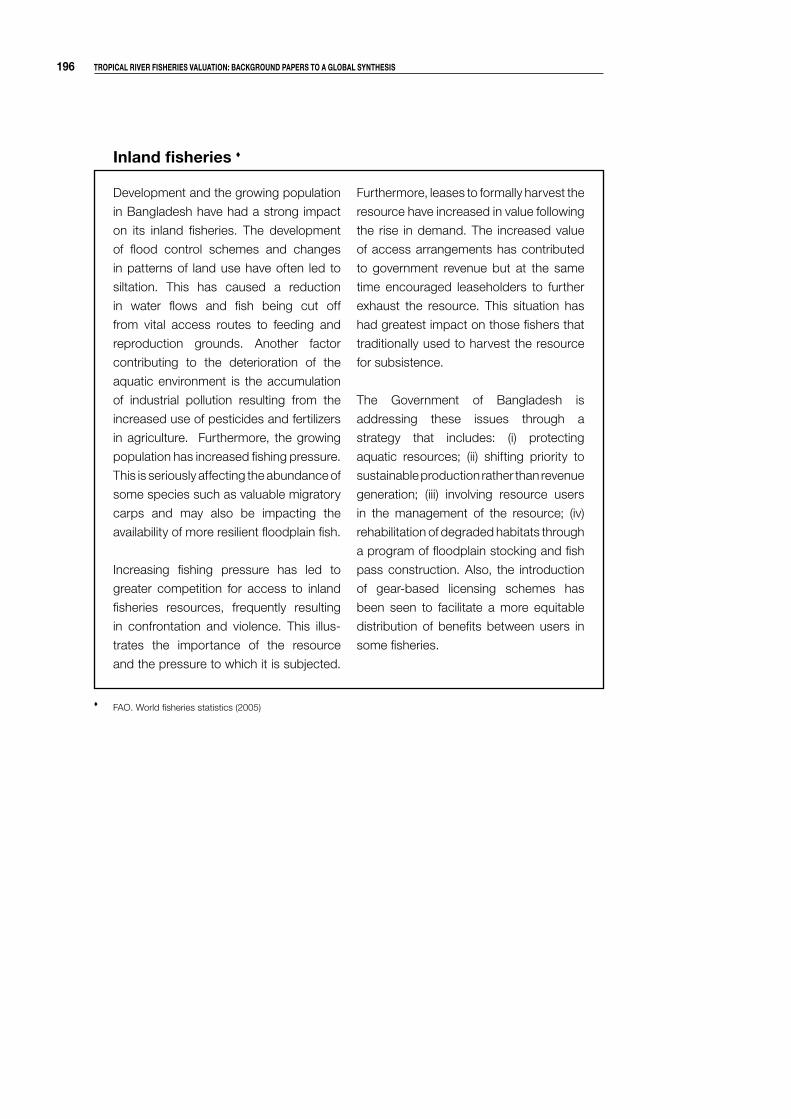
1�� Tropical river fisheries valuaTion: background papers To a global synThesis
inland fisheries ♦
♦ FAO. World fisheries statistics (2005)
Development and the growing population
in Bangladesh have had a strong impact
on its inland fisheries. The development
of flood control schemes and changes
in patterns of land use have often led to
siltation. This has caused a reduction
in water flows and fish being cut off
from vital access routes to feeding and
reproduction grounds. Another factor
contributing to the deterioration of the
aquatic environment is the accumulation
of industrial pollution resulting from the
increased use of pesticides and fertilizers
in agriculture. Furthermore, the growing
population has increased fishing pressure.
This is seriously affecting the abundance of
some species such as valuable migratory
carps and may also be impacting the
availability of more resilient floodplain fish.
Increasing fishing pressure has led to
greater competition for access to inland
fisheries resources, frequently resulting
in confrontation and violence. This illus-
trates the importance of the resource
and the pressure to which it is subjected.
Furthermore, leases to formally harvest the
resource have increased in value following
the rise in demand. The increased value
of access arrangements has contributed
to government revenue but at the same
time encouraged leaseholders to further
exhaust the resource. This situation has
had greatest impact on those fishers that
traditionally used to harvest the resource
for subsistence.
The Government of Bangladesh is
addressing these issues through a
strategy that includes: (i) protecting
aquatic resources; (ii) shifting priority to
sustainable production rather than revenue
generation; (iii) involving resource users
in the management of the resource; (iv)
rehabilitation of degraded habitats through
a program of floodplain stocking and fish
pass construction. Also, the introduction
of gear-based licensing schemes has
been seen to facilitate a more equitable
distribution of benefits between users in
some fisheries.

chapTer � 1��
CamBodia
general information ♠
Surface area: 181 040 km2 Water area: 4 520 km2
Population (2004): Est. 13 363 421Population growth (2004): 1.8%GDP at purchaser’s value (2003): US$ 25.02 billionAgricultural, fisheries and forestry percentage of GDP (2002): 8.6%Fisheries GDP (2003): US$ 442 million (12%)Capture fisheries as % of GDP1: 10.03%Aquaculture as % of GDP1: 0.89%
♠ FAO. World fisheries statistics (2005)1 Asia-Pacific Fishery Commission (2005)
Main riversMekong River (originates in China and passes through Myanmar, Laos, Thailand, Cambodia and Vietnam) Total length: 4 225 km Length (in Cambodia): 500 km Total annual catch1: 279 000-441 000 tonnes (1999) (excludes aquaculture)The Mekong River in Cambodia flows into 4 main branches:- Great Lake Surface area: Dry season: 2 000-3 000 km2
Wet season: 10 000-12 000 km2 Annual catch2: 235 000 tonnes (1995-96) - Tonle Sap River- Lower Cambodian Mekong River Length: 90 km- Bassac River Length: 100 km
1 Van Zalinge and Thuok (1999) Summary of Project Findings: Present Status of Cambodia’s Freshwater Capture Fisheries
and Management Implications2 Sverdrup-Jensen (2002). Fisheries in the Lower Mekong Basin: Status and Perspectives
inland fisheries ♣
Inland fisheries include rivers, lakes, ponds, floodplains, ricefields and swamps. The types of land and water resources in Cambodia are presented below.
areas of various types of land and water resources that support cambodia’s freshwater capture fisheries 1
Types of land and water resources in Cambodia Areas (ha) 1992-93
Permanent water (river, lake, ponds, etc.) 411 100
Flooded forests 370 700
Flooded secondary forests 259 800
Flooded grassland 84 900
Receding and floating ricefields 29 300
Seasonally flooded crop fields 529 900
Swamp 1 400
Total 1 687 000

1�� Tropical river fisheries valuaTion: background papers To a global synThesis
Inland catches as % of total catches: 89.6% (1999)
Inland fisheries production by different scale of fisheries
Rice-field production: 45 000-110 000 tonnes
Small-scale fisheries: 115 000-140 000 tonnes
Middle-scale fisheries: 85 000-100 000 tonnes
Large-scale fisheries: 34,000-91 000 tonnes
Total 279 000-441 000 tonnes ♣ Van Zalinge and Thuok (1999) Summary of Project Findings: Present Status of Cambodia’s Freshwater Capture Fisheries
and Management Implications1 Ahmed et al. (1996) Sustaining the gift of the Mekong: the future of the freshwater capture fisheries of Cambodia
fisheries data ♦
Production Imports ExportsTotal
supplyPer capita
supply
‘000 tonnes (live weight) Kg/year
Fish for direct human consumption 412.7 1.6 31.6 382.7 28.4
Fish for animal feed & other purposes - - - -
Estimated employment (2002)
(i) Primary sector (including aquaculture): 812 500
(ii) Secondary sector: > 2 000 000
Trade (2003)
Value of fisheries imports: US$ 5.4 million
Value of fisheries exports: US$ 34.5 million
inland fisheries ♦
Cambodia’s inland fisheries are some of
the richest in the Mekong, and the world.
This is due to the Mekong’s natural flood
regime and its ecological diversity. The
Cambodian section of the Mekong River
flows into four main branches, the Great
Lake, the Tonle Sap River, the Lower
Cambodian Mekong River and the Bassac
River. The direction of flow in the Tonle Sap
River changes twice a year. In the rainy
season, water flows back towards the
Great Lake and vice versa during the dry
season. This allows the annual inundation
of large floodplains around the Great Lake
and northeast and south of Phnom Penh,
where important fish habitats such as
flooded forests are found leading to rich
fish productivity.
According to the fisheries Fiat Law from
1987; the inland capture fishery is divided
into three categories: small-scale fisheries,
medium-scale fisheries and large-scale
fisheries or fishing lots.
Small-scale fisheries are open-access
non-licensed with certain restrictions
on gear size and use. These fishers are
allowed to fish anywhere at anytime,
except within fishing lots during open
seasons and in protected areas. This
scale of fisheries is intended for
“subsistence” but this term is open to
interpretation as to whether it refers only
to fishing for food or fishing to derive a
small income from the sale of the catch.
Some of the gears used in small-scale
fisheries include, short gillnets, cast nets,
scoop nets, shrimp scoop nets, hand-
push nets, small bamboo traps, short
hook lines, single hook lines, spears

chapTer � 1��
and harpoons. Rice-field fishing is also
considered small-scale fishery.
The level of production within small-scale
fisheries is usually underestimated as the
national census only records the main
occupations. Therefore secondary and
tertiary occupations in fisheries are not
revealed.
Middle-scale fisheries indicate the use of
medium-size fishing gear under a system
of licensing. Nevertheless, this system
cannot be considered as a tool to manage
the resources as there are no set limits to
the number of licenses that are issued.
Middle-scale gears are medium mobile
and fixed fishing gears, such as giant cast
nets, seine nets, surrounding nets, long
gillnets, giant push nets, long lines, arrow-
shaped traps, and short-barrage bamboo
traps. The quality of the fish caught within
this method is not as good as within
fishing lots because the fish is normally
killed or damaged during capture. As a
result middle scale fishers tend to sell the
fish to processors and markets within the
immediate area.
Large scale fishers or fishing lots are
licensed fisheries that operate for
commercial purposes. Fishing lots are
typically found in a geographically defined
river location (dai lots) such as a stretch of
river, a river beach or temporarily flooded
land which may or may not include flooded
forest areas. Fishing lots are operated
under a strict two-year contract acquired
via a public auction to the highest bidder.
This is one of the government’s main
instruments for extracting a resource rent
from fisheries. The auction grants private
lot owners exclusive rights over a par-
ticular fishing ground or anchor position
for large-scale fishing gear. Nevertheless,
these lots are often sub-leased both as a
means to recoup the money paid and also
because they are too large to be fished
effectively by one operator.
The areas covered by fishing lots are so
large that villages are often located within
or in close proximity to fishing lots. As a
result the interaction between fishing lot
operators and these villages has proved
to be a source of conflict.
♦ FAO. World fisheries statistics (2005)

�00 Tropical river fisheries valuaTion: background papers To a global synThesis
india
general information ♠
Surface area: 3.3 million km2
Population (1999): approximately 1 000 millionPopulation growth (2004): 1.8%GDP (1997-98): US$ 319 733 millionAgricultural GDP (1997-98): US$ 89 479 millionCurrency: rupee. Indicative exchange rate (1999) US$ 1 = Rs 43.3
♠ FAO. World fisheries statistics (2000)
Main riverse
The catch from rivers does not contribute significantly to the total inland fish production in terms of volume. On the other hand, reservoirs are considered the prime resource as regards capture fisheries and extensive aquaculture.
Total riverine fisheries production Number of fishers: 190 000 Riverine production: 150 kg/fisher/year
flowing into the bay of bengal
Indus Total length: 1 114 km Catchment area: 312 289 km2
Ganges River (Starts in the Himalayas and passes through China, India, Nepal & Bangladesh) Total length: 2 525 km. Length (India): 2 071 km Number riverine fishers1: 7.8 fishers/km Potential river production2: 198.3 kg/ha/year Actual river production2: 30 kg/ha/yearRiver production (1993-94) 1: 49.4 mt/year (from Patna Market Centre)Ganges River basin (Catchments area): India 80.1%, Nepal 19.3%, and Bangladesh 0.6%) Surface area: 1 060 000 km2 Main tributary: Yamuna River (main tributary from the Ganges) Tributaries: Ramgange Gomati Ghagra Gandak Saptkosi Mahananda Length: 1 300 km River production: 128 – 174 tonnes/year (from Allahabad Market Centre)1
(1979-80) Brahmaputra River Total length: 2 580 km Length (India): 885 km River production: No data available
Brahmaputra River Basin Surface area: 1 000 km2
Mahanadi River Length: 857 kmSabarmati River Length: 371 km Catchment area: 21 674 km2
Mahi River Length: 583 km

chapTer � �01
Catchment area: 34 842 km2
Godavari River Length: 1 465 km Catchment area: 312 812 km2
Krishna River Length: 1 401 km Catchment area: 258 948 km2 Pennar Length: 597 km Catchment area: 55 213 km2
Cauvery Length: 800 km Catchment area: 81 155 km2
Brahmani Length: 799 km Catchment area: 39 033 km2
Mahanadi Length: 851 km Catchment area: 141 589 km2
flowing into the arabian seaNarmada River Length: 1 312 km Catchment area: 98 796 km2
Tapti River Length: 724 km Catchment area: 65 145 km2
e Sugunan (1997) India. In: Fisheries management of small water bodies in seven countries in Africa, Asian and Latin
America1 Payne et al. (2003) A Review of the Ganges Basin: Its Fish and Fisheries2 Das (2002) Social and economic impacts of disease in inland open-water and culture-based fisheries in India
inland fisheries♣
Inland fisheries include rivers, floodplains, estuaries, mangroves, estuarine impoundments, lagoons, upland lakes, reservoirs and ponds.
inland fisheries resources of indiaResource Size
Rivers and canals 173 287 km
Swamps and other wetlands 1 097 787 ha
Floodplain lakes 202 213 ha
Upland lakes 72 000 ha
Mangroves 356 500 ha
Estuaries 285 000 ha
Lagoons 190 500 ha
Reservoirs 3 153 366 ha
Freshwater ponds 2 254 000 ha
Brackishwater ponds 1 235 000 ha
Inland catches as percentage of total catches:
43.03% (1994-95) 52.10% (1998-1999)total production: 4 950 000 t total production: 6 158 000 t
Inland catches: description year 1994-95; total inland catches: 2 130 000 t
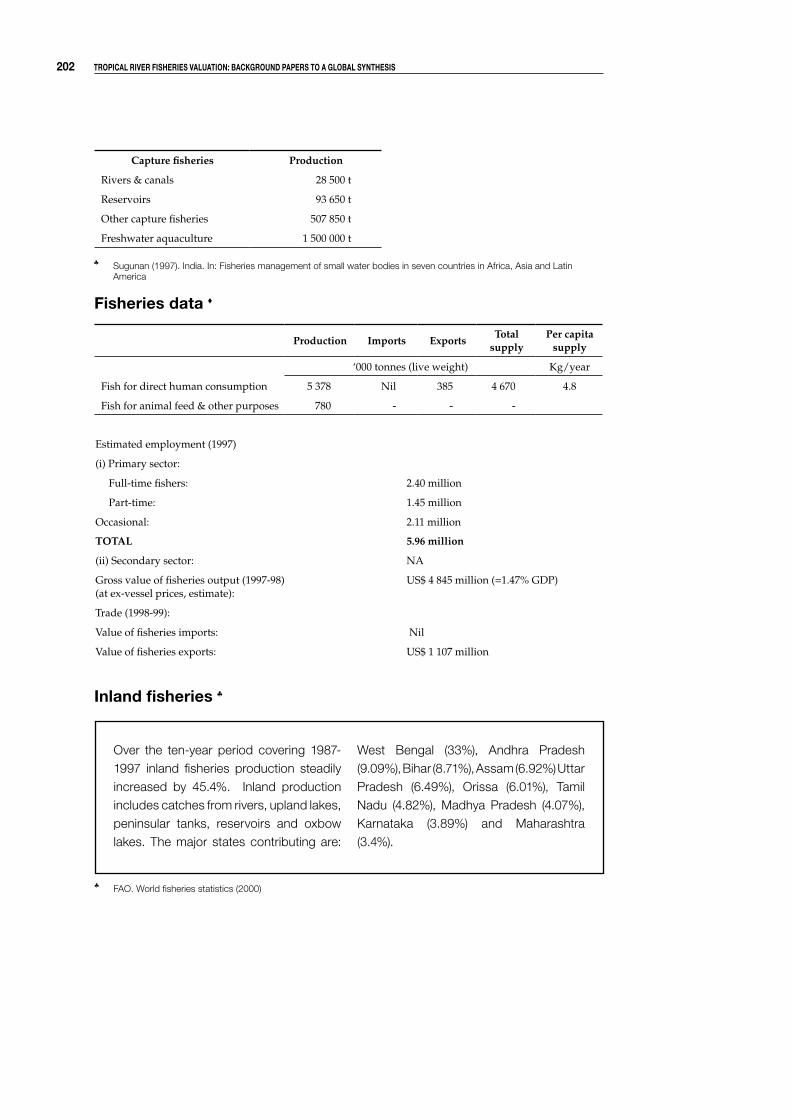
�0� Tropical river fisheries valuaTion: background papers To a global synThesis
Capture fisheries Production
Rivers & canals 28 500 t
Reservoirs 93 650 t
Other capture fisheries 507 850 t
Freshwater aquaculture 1 500 000 t
♣ Sugunan (1997). India. In: Fisheries management of small water bodies in seven countries in Africa, Asia and Latin America
fisheries data ♦
Production Imports ExportsTotal
supplyPer capita
supply
‘000 tonnes (live weight) Kg/year
Fish for direct human consumption 5 378 Nil 385 4 670 4.8
Fish for animal feed & other purposes 780 - - -
Estimated employment (1997)
(i) Primary sector:
Full-time fishers: 2.40 million
Part-time: 1.45 million
Occasional: 2.11 million
TOTAL 5.96 million
(ii) Secondary sector: NA
Gross value of fisheries output (1997-98)(at ex-vessel prices, estimate):
US$ 4 845 million (=1.47% GDP)
Trade (1998-99):
Value of fisheries imports: Nil
Value of fisheries exports: US$ 1 107 million
inland fisheries ♣
Over the ten-year period covering 1987-1997 inland fisheries production steadily increased by 45.4%. Inland production includes catches from rivers, upland lakes, peninsular tanks, reservoirs and oxbow lakes. The major states contributing are:
West Bengal (33%), Andhra Pradesh (9.09%), Bihar (8.71%), Assam (6.92%) Uttar Pradesh (6.49%), Orissa (6.01%), Tamil Nadu (4.82%), Madhya Pradesh (4.07%), Karnataka (3.89%) and Maharashtra (3.4%).
♣ FAO. World fisheries statistics (2000)
chapTer � �0�
indonesia
general information♠
Surface area: 1 900 000 km2
Population (2003): 214 500 000Population growth (1998-2003): 1.3 %GDP (2003): US$ 208.3 billionAgricultural GDP (2003): US$ 34.6 billion (16.6 %)Capture fisheries as % of GDP1: 2.35 %Aquaculture as a % of GDP1: 1.66 %
♠ World Bank (2003) Indonesia at a Glance1 Asia-Pacific Fishery Commission (2005)
Main riversfive main islands
Kalimantan Island (539 460 km2) Sungai Kapuas River (longest river in Indonesia) Length: 1 400 km Makakam River Length: 920 km Catchment area: 77 700 km2
Barito River (largest river in Indonesia, 3 km wide and 10-30 m deep in places) Tributaries Martapura River Length: 600 km Kupas River
Sumatra (473 606 km2) Lempuing River (one of the most productive inland fisheries in Indonesia)1
Fishermen density: 3-4/km2 (1997) Fishing activity: 4 hours/day (1997)
Catch/fisherman: 2.2 – 3.3 tonnes/year (1997)
Catch/area: 72 – 118 kg/ha/yr (1997)
Siak River Asahan River Hari River Musi River
Length: 2 000 kmCatchment area: 60 000 km2
Annual catches1: 22 833 kg (average river catches 1979-94) Indragiri River Batanghari RiverKampar River
Sulawesi (189 216 km2) Jeneberang River Length: 75 km Surface area: 760 km2
Walanae River (feeds Lake Tempe) Irian Jaya (Papua) (421 981 km2)Mamberamo River system (largest river on the island) Length: 1 300 kmBaliem River Length: 400 kmJava (132 187 km2)Bengawan Solo River basin (largest river on the island) Length: 600 km+ Surface area: 16 100 km2
Brantas River (second largest river on the island) Tributaries Konto River Widas River Ngrowo River

�0� Tropical river fisheries valuaTion: background papers To a global synThesis
Length: 320 km Catchment area: 11 800 km2
Wawar River Catchment area: 780 km2
Flooded area (annual): 15 000 hectaresTarum RiverManuk RiverSerang River
Catchment area: 281 km2
Serayu River
Main lakes
KalimantanJempang
Surface area: 10 875 ha Melintang
Surface area: 7 062.5 ha Potential fish production: 55 kg/ha/yr
Semayang Surface area: 8 937 ha Potential fish production: 54 kg/ha/yr
LuarSentarum Siawan
SumatraToba (largest lake of Indonesia and largest lake in Southeast Asia)
Surface area: 1 145 km2
Tempe (important for fisheries)Maniinjau Kerinci Singkarak
SulawesiTowuti Sidenreng Poso Tondano Matan
Irian JayaPania Sentani
1 Koeshendrajana and Cacho (2001) Management Options for the Inland Fisheries Resource in South Sumatra, Indonesia: I Bioeconomic Model
inland fisheries♣
Indonesia has a huge area of inland
open water covering 55 million hectares;
– natural lakes, man-made lakes, rivers
and swamps.
In 1991, it was estimated that Kalimantan
and Sumatra produced 50 per cent and
30 per cent of all the open, freshwater
fish production in Indonesia, respectively.
It was also estimated that at this time 43
per cent of Indonesian freshwater ponds
were located in Western Java.
chapTer � �0�
Inland catches as a % of total catch (2000)1: 5.8 % Brackish/freshwater aquaculture as a % of total catch (2000)1: 14.54 % Inland fisheries production (2000): 297 300 tonnes Brackishwater pond cultured (2000): 360 800 tonnes
Freshwater pond cultured (2000): 185 200 tonnesCage cultured (2000): 97 300 tonnesPaddy field cultured (2000): 100 800 tonnes
Inland fisheries potential and actual (1998) yield per island2:
potential capture inland fisheries yield per island1
Island Area (ha) Potential yield (T) Actual yield (T) (1998)a
Java 96 400 ha 30 000 – 35 000 ?
Sumatra 4 053 850 300 000 – 330 000 86 365
Kalimantan 9 029 000 400 000 – 450 000 118 227
Sulawesi 492 200 50 000 – 55 000 34 438
Maluku & Irian Jaya 63 300 13 000 – 20 000 2 582
Bali & Nusa Tenggara 17 500 7 000 – 10 000 ?a The author estimated the actual catches were two to three times the official figure.♣ BPS Statistics Indonesia (2000)1 Inland/aquaculture catch percentage generated using year 2000 figures from BPS Statistics Indonesia2 Coates (2002) Inland capture fishery statistics of South-East Asia:C current status and information needs
fisheries data ♦
Production Imports ExportsTotal
supplyPer capita
supply
‘000 tonnes (live weight) kg/yr
Fish for direct human consumption 4 066 630 19 169 715 498 3 370 301 16.3
Fish for animal feed & other purposes 329 100 197 935 95 029 432 006
Estimate employment (1997)
(i) Primary sector: 4 600 000
(ii) Secondary sector: NA
Trade (1999)
Value of fisheries imports: US$ 49 million
Value of fisheries exports: US$ 1 640 million
inland fisheries and aquaculture ♦
In 1997 the open water fisheries are thought to have employed 154,302 vessels. The majority (approximately 93 per cent) were engineless with outboard engines being used on 85 per cent of the remaining vessels. Fish were primarily landed fresh with some being salted/dried, frozen or smoked. The fishery employed 508,626 primarily part-time (64 per cent)
fishers, 35 per cent from Sumatra, 29 per cent from Kalimantan, 25 per cent from Java and 5 per cent from Sulawesi.
Multiple gears were exploited in the open water capture fisheries and included, in order of importance; set gillnets (21 per cent), traps (16 per cent), handlines (11 per cent), guiding barriers (10 per cent) and
�0� Tropical river fisheries valuaTion: background papers To a global synThesis
long lines (5 per cent). River fisheries were most important contributing slightly less than 62 per cent of open water landings. Swamps (21 per cent), lakes (12 per cent) and reservoirs (5 per cent) accounted for the remaining 38 per cent. Just under 95 per cent of the open water capture landings were finfish and originated from Kalimantan (55 per cent), Sumatra (19 per cent), Java (13 per cent) and Sulawesi (11 per cent).
Aquaculture was growing in 1997, at which point there was thought to be 2,052,725 fish farmers, primarily in Java (68 per cent). Freshwater pond aquaculture was the predominant form of culture (68 per cent) followed by paddy-field, brackishwater and then cage aquaculture.
However, brackishwater aquaculture produced the highest volumes of fish generating 307,259 tonnes and occupying 306,740.9 ha of land. The majority of brackishwater finfish production was milkfish (73 per cent), Mozambique tilapia (12 per cent) and mullets (6 per cent). The main areas of brackishwater aquaculture were Java (36 per cent), Sulawesi (31 per cent), and Sumatra (26 per cent). Pond aquaculture occupied 60,647.8 ha and generated 171,768 tonnes of fish. It primarily produced common carp (31 per cent), catfish (14 per cent), Nile tilapia (10 per cent), Mozambique tilapia (10 per cent), Java carp (9 per cent) and more. This form of culture was most prevalent in Sumatra (48 per cent), then Java (37 per cent) and Sulawesi (9 per cent).

chapTer � �0�
lao Pdr
general information ♠
Surface area: 236 725 km2 Population (1995): 5 032 000GDP at purchaser’s price (1995): US$ 1 500 millionAgricultural GDP (1995): US$ 362Fisheries GDP (1995): US$ 900 million Capture fisheries as % of GDP1: 1.43%Aquaculture as % of GDP1: 5.78%
♠ FAO. World fisheries statistics (1999)1 Asia-Pacific Fishery Commission (2005)
Main riverse
Mekong River (originates in China and passes through Myanmar, Laos, Thailand, Cambodia and Vietnam.)
Total length: 4 220 kmLength (Laos): 886 kmSurface area: 202 000 km2 (97% of total country area)Annual catch: 182 700 tonnes (2000) (capture fisheries)(The capture fisheries figure is five times the officially reported figure.) 16 700 tonnes (2000) (reservoir) 5 400 tonnes (2000) (aquaculture)
e Sverdrup-Jensen (2002). Fisheries in the Lower Mekong Basin: Status and Perspectives
inland fisheries
Inland catches as percentage of total catches: 100%
fisheries data ♦
Production Imports Exports Total supply
Per capita supply
‘000 tonnes (live weight) Kg/year
Fish for direct human consumption 40.0 3 0.01 42.99 8.54
Estimated employment (2002)
(i) Primary sector (including aquaculture): 200 000
(ii) Secondary sector: 25 000
Gross value of fisheries output (ex-vessel prices): US$ 48 million
Trade (2003)
Value of fisheries imports: US$ 4 million
Value of fisheries exports: NA
�0� Tropical river fisheries valuaTion: background papers To a global synThesis
inland fisheries♦
♦ FAO. World fisheries statistics (2002)
Inland fisheries represent its entire fisheries production as Lao PDR is landlocked. The majority of landings come from the Mekong River and its tributaries (60%). Rice fields are another important source followed by catches from hydropower reservoirs; although productivity from the latter is usually low.
In the Mekong River and tributaries, the main fishing gears are beach seines and drifting gillnets. Other gears include long-lines and traps. Fishers commonly use flat-bottom boats similar to riverine canoes, although boats equipped with long-tail engines are becoming very popular. Most
of the catches from the Mekong River and tributaries are thought to be landed in Thailand due to higher market prices.
Rice fields mostly provide a variety of small species with a short life span and rapid growth. Some of the species include crabs, shrimps, fish, snails, frogs, and insects. All these aquatic species are consumed entirely within Lao PDR. It is thought the fisheries statistics data could be under accounting for total household consumption of aquatic species as the data collection may be concentrating on fish.
chapTer � �0�
malaysia
general information♠
Surface area: 329 758 km2
Population (2003): 24 800 000Population growth (1998-2003): 2.2 %GDP (2003): US$ 103.7 billionAgricultural GDP (2003): US$ 10.0 billion (9.7 %)Capture fisheries as % of GDP 1: 1.13 %Aquaculture as a % of GDP 1: 0.37 %
♠ World Bank (2003): Malaysia at a Glance1 Asia-Pacific Fishery Commission (2005)
Malaysia consists of the Malay Peninsular, West Malaysia, (154,680 km2) and the northwestern part of Borneo Island, East Malaysia, (202,020 km2)
Main riverse
east Malaysia
Rajang River Length: 565 km Est. productivity: 100 kg/ha/yrKinabatangan River
Length: 565 km Catchment: +17 000 km2
Batak Lupar Length: 228 km
Baram River Length: 402 km
Est. productivity: 142-169 kg/ha/yrLimbang River
Length: 196 kmSarawak
Length: 115 km
West Malaysia
Pahang River system Length: 459 km Annual catch (2000-02 average)2: 131 tonnes
Kelantan River Length: 400 km
Perak River Length: 522 km Est. productivity: 11.64 kg/ha/yr
Gombak River Length: Est. productivity: 180 kg/ha/yr
Klang River Length: 120 km Catchment: 1 200 km2
Langat River Length: 160 km
Catchment: 1 240 km2
�10 Tropical river fisheries valuaTion: background papers To a global synThesis
Main lakesWest Malaysia
Lake Kenyir (largest reservoir in Malaysia and sustaining a small-scale commercial fishery) Area: 360 km2
Mean depth: 37 m Annual catch1: 720 tonnesLake Temengor Area: 152 km2
Est. annual catch2: 100 tonnesLake Bera (largest natural lake) Area: 61.5 km2
Annual catch: No data availableBukit Merah Storage: 75 million m3
Annual catch: 100 tonnesChenderoh (oldest reservoir in Malaysia) Annual catch (late 80s): 2.57 tonnesValue of landings: 63 179 RM (US$ 24 300)
e Jackson & Marmulla (2001)
1 This figure has been synthesized and is based on a yield figure of 20 kg/ha/year derived by Yusoff et al. (1995)2 Khoo et al. (2003)
inland fisheries♣
Freshwater fish catch (2000): 22 636 tonnesFreshwater aquaculture production (1997): 20 303 tonnes
♣ Earthtrends Water Resources and Freshwater Ecosystems (2003) Malaysia
fisheries data ♦
Production Imports ExportsTotal
supplyPer capita
supply
‘000 (tonnes (live weight) kg/yr
Fish for direct human consumption 1 252 343 94 1 003 45.9
Fish for animal feed & other purposes 210 47 58 221 -
♦ FAO. World fisheries statistics (2000)
Estimate employment (1997)
(i) Primary sector (excluding FW fisheries sector): 79 000
(ii) Secondary sector: NA
Trade (1999)
Value of fisheries imports: US$ 258.7 million
Value of fisheries exports: US$ 181.2 million
chapTer � �11
♦ FAO. World fisheries statistics (2003b)1 Khoo et al. (1987)
Cyprinids and silurids are the species dominating the inland capture fisheries within Malaysia’s major rivers (Khoo et al. 1987). Nevertheless, Malaysia has no large river systems compared to other countries. Man-made lakes dominate the Malaysian lentic environment. The estimated surface area of these lakes is
1 000 km2. Furthermore, there are several large reservoirs that have been developed for inland fisheries. In particular, the Perak and Terengganu dams located in Peninsular Malaysia have been successfully converted for recreational fisheries.
inland fisheries ♦
�1� Tropical river fisheries valuaTion: background papers To a global synThesis
myanmar (Burma)
general information ♠
Surface area: 676 577 km2 Population (2001-02): 47 114 millionGDP at purchaser’s price (1999-2000): 2 190 301 million kyatAgricultural GDP: 29 151 million kyat Aquaculture as % of GDP1: 0.17%
♠ FAO. World fisheries statistics (2001) 1 Asia-Pacific Fishery commission (2005)
Main riverse
The Mekong River system and the Irrawaddy system have great similarities in terms of their fisheries. Therefore, the fisheries of Myanmar and Cambodia are usually compared. Even though the Mekong River runs along Myanmar, it only covers a very small area of the country.
Total aquatic resource area of the river systems1: 8.2 million ha
irrawaddy system
Ayeyarwaddy River (or Irrawaddy River) Length: 2 150 km Catchment: 424 000 km2
Annual catch2: No data available
Chindwin River (tributary of the Ayeyarwaddy River) Length: 844 km Annual catch2: No data availableSittaung River Length: 563 km Annual catch2: No data availableSalween (Thanlwin) River Length: 2 400 km Annual catch2: No data available
** FAO (2003) Myanmar Aquaculture and Inland Fisheries1 Coates (2002) Inland capture fishery statistics of Southeast Asia: Current status and information needs2 No data available for specific permanent water bodies and seasonal floodplains
inland fisheries♣
Inland fisheries production comes mainly from floodplains, the water surface of which covers six million hectares during 4-5 months of the year1.
Inland catches as percentage of total catches: 25% (Total fisheries production 1 300 648 tonnes (2000-01))
Degree of exploitation:Inland freshwater fishers2: 1 398 410 fishers
Inland capture fishery potential3: 600 000-900 000 tonnesInland capture fisheries (2000-01)4: 253 373 tonnes
Inland culture fisheries (2000-01)4: 109 188 tonnes Inland prawn farming (2000-01)4: 6 603 tonnes
♣ FAO (2003) Myanmar Aquaculture and Inland Fisheries1 Moo (2002) Inland Fisheries of the Union of Myanmar 2 Coates (2002) Inland capture fishery statistics of Southeast Asia: Current status and information needs3 Estimate based on revised valuation of the Mekong River system capture fishery potential4 Including lakes, rivers, floodplains, reservoirs and lagoons
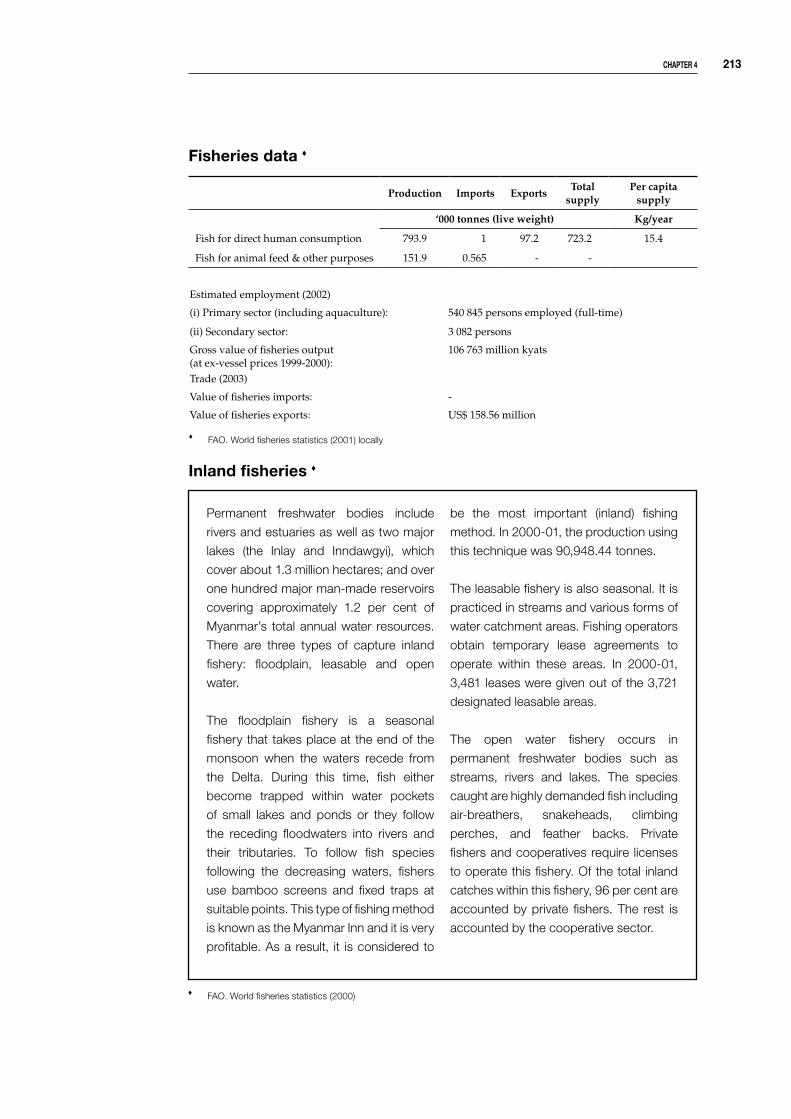
chapTer � �1�
♦ FAO. World fisheries statistics (2001) locally
fisheries data ♦
Production Imports ExportsTotal
supplyPer capita
supply
‘000 tonnes (live weight) Kg/year
Fish for direct human consumption 793.9 1 97.2 723.2 15.4
Fish for animal feed & other purposes 151.9 0.565 - -
Estimated employment (2002)
(i) Primary sector (including aquaculture): 540 845 persons employed (full-time)
(ii) Secondary sector: 3 082 persons
Gross value of fisheries output(at ex-vessel prices 1999-2000):
106 763 million kyats
Trade (2003)
Value of fisheries imports: -
Value of fisheries exports: US$ 158.56 million
inland fisheries ♦
Permanent freshwater bodies include
rivers and estuaries as well as two major
lakes (the Inlay and Inndawgyi), which
cover about 1.3 million hectares; and over
one hundred major man-made reservoirs
covering approximately 1.2 per cent of
Myanmar’s total annual water resources.
There are three types of capture inland
fishery: floodplain, leasable and open
water.
The floodplain fishery is a seasonal
fishery that takes place at the end of the
monsoon when the waters recede from
the Delta. During this time, fish either
become trapped within water pockets
of small lakes and ponds or they follow
the receding floodwaters into rivers and
their tributaries. To follow fish species
following the decreasing waters, fishers
use bamboo screens and fixed traps at
suitable points. This type of fishing method
is known as the Myanmar Inn and it is very
profitable. As a result, it is considered to
be the most important (inland) fishing
method. In 2000-01, the production using
this technique was 90,948.44 tonnes.
The leasable fishery is also seasonal. It is
practiced in streams and various forms of
water catchment areas. Fishing operators
obtain temporary lease agreements to
operate within these areas. In 2000-01,
3,481 leases were given out of the 3,721
designated leasable areas.
The open water fishery occurs in
permanent freshwater bodies such as
streams, rivers and lakes. The species
caught are highly demanded fish including
air-breathers, snakeheads, climbing
perches, and feather backs. Private
fishers and cooperatives require licenses
to operate this fishery. Of the total inland
catches within this fishery, 96 per cent are
accounted by private fishers. The rest is
accounted by the cooperative sector.
♦ FAO. World fisheries statistics (2000)
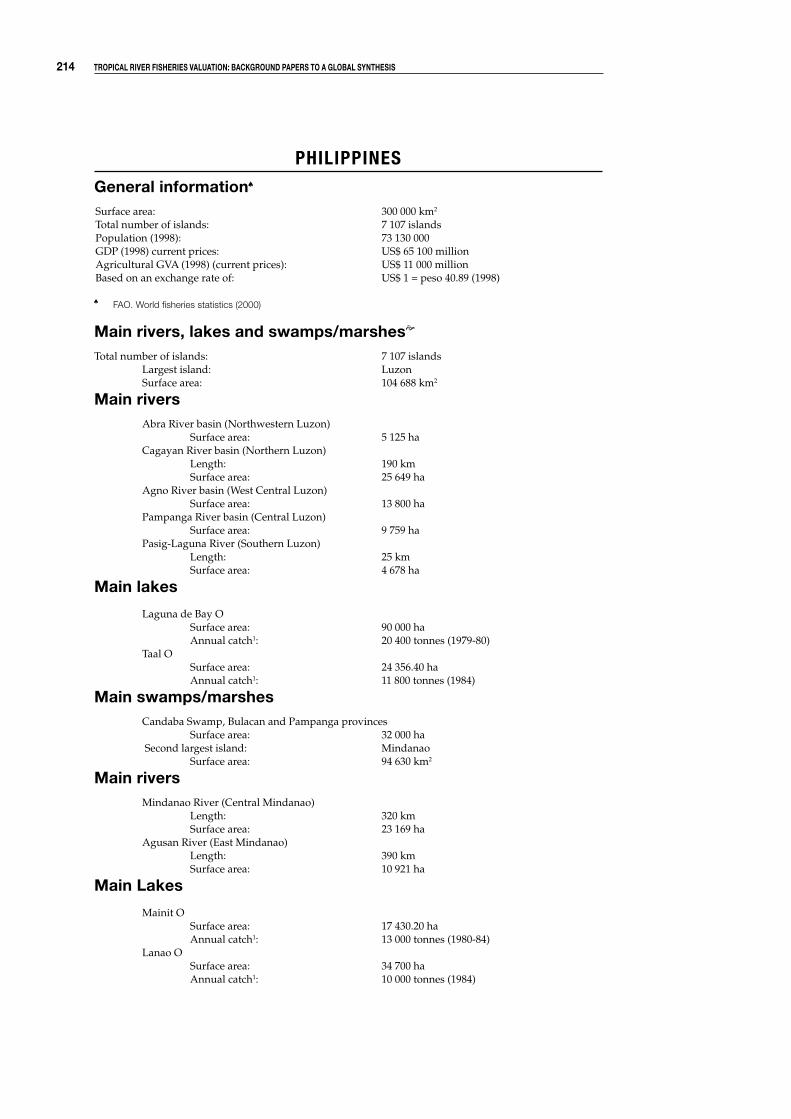
�1� Tropical river fisheries valuaTion: background papers To a global synThesis
PhiliPPines
general information♠
Surface area: 300 000 km2 Total number of islands: 7 107 islandsPopulation (1998): 73 130 000GDP (1998) current prices: US$ 65 100 millionAgricultural GVA (1998) (current prices): US$ 11 000 millionBased on an exchange rate of: US$ 1 = peso 40.89 (1998)
♠ FAO. World fisheries statistics (2000)
Main rivers, lakes and swamps/marshese
Total number of islands: 7 107 islands Largest island: Luzon Surface area: 104 688 km2
Main rivers Abra River basin (Northwestern Luzon) Surface area: 5 125 ha Cagayan River basin (Northern Luzon) Length: 190 km Surface area: 25 649 ha Agno River basin (West Central Luzon) Surface area: 13 800 ha Pampanga River basin (Central Luzon) Surface area: 9 759 ha Pasig-Laguna River (Southern Luzon) Length: 25 km Surface area: 4 678 ha
Main lakes
Laguna de Bay O Surface area: 90 000 ha Annual catch1: 20 400 tonnes (1979-80) Taal O Surface area: 24 356.40 ha Annual catch1: 11 800 tonnes (1984)
Main swamps/marshes Candaba Swamp, Bulacan and Pampanga provinces Surface area: 32 000 ha Second largest island: Mindanao
Surface area: 94 630 km2
Main rivers Mindanao River (Central Mindanao) Length: 320 km Surface area: 23 169 ha Agusan River (East Mindanao) Length: 390 km Surface area: 10 921 ha
Main lakes
Mainit O Surface area: 17 430.20 ha Annual catch1: 13 000 tonnes (1980-84) Lanao O Surface area: 34 700 ha Annual catch1: 10 000 tonnes (1984)
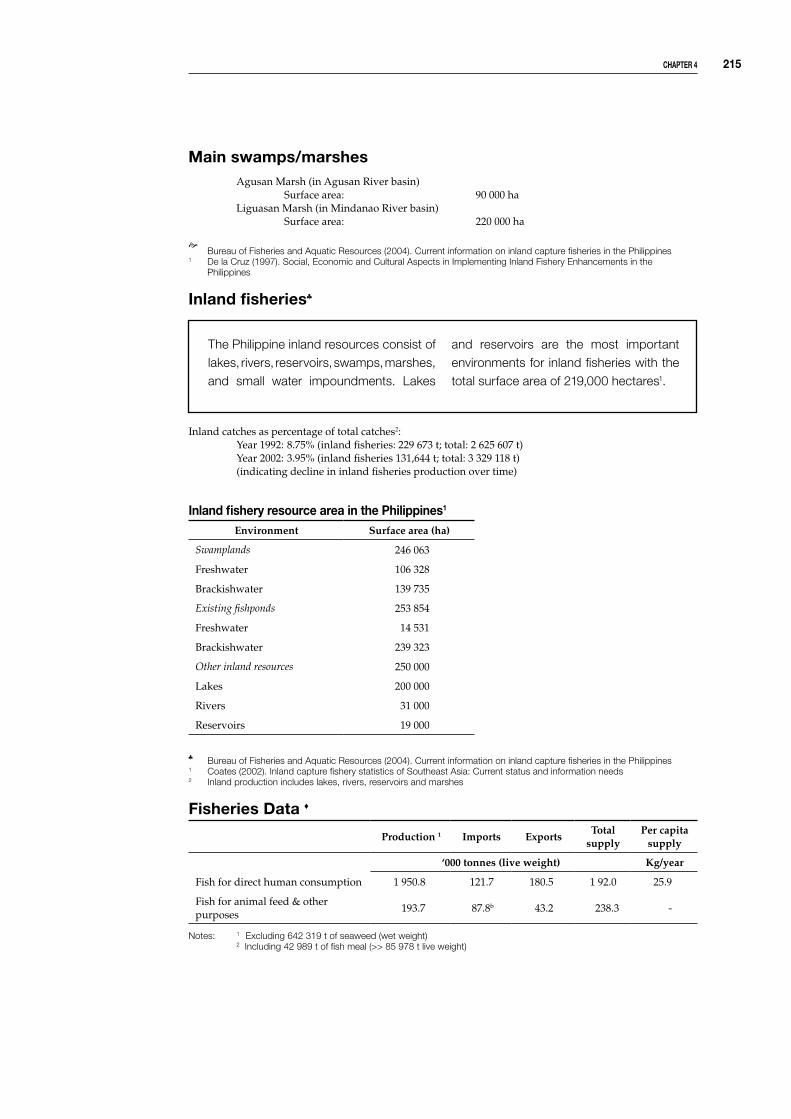
chapTer � �1�
Main swamps/marshes Agusan Marsh (in Agusan River basin) Surface area: 90 000 ha Liguasan Marsh (in Mindanao River basin) Surface area: 220 000 ha
e Bureau of Fisheries and Aquatic Resources (2004). Current information on inland capture fisheries in the Philippines
1 De la Cruz (1997). Social, Economic and Cultural Aspects in Implementing Inland Fishery Enhancements in the Philippines
inland fisheries♣
The Philippine inland resources consist of lakes, rivers, reservoirs, swamps, marshes, and small water impoundments. Lakes
and reservoirs are the most important environments for inland fisheries with the total surface area of 219,000 hectares1.
Inland catches as percentage of total catches2: Year 1992: 8.75% (inland fisheries: 229 673 t; total: 2 625 607 t)Year 2002: 3.95% (inland fisheries 131,644 t; total: 3 329 118 t)
(indicating decline in inland fisheries production over time)
inland fishery resource area in the philippines1
Environment Surface area (ha)
Swamplands 246 063
Freshwater 106 328
Brackishwater 139 735
Existing fishponds 253 854
Freshwater 14 531
Brackishwater 239 323
Other inland resources 250 000
Lakes 200 000
Rivers 31 000
Reservoirs 19 000
♣ Bureau of Fisheries and Aquatic Resources (2004). Current information on inland capture fisheries in the Philippines1 Coates (2002). Inland capture fishery statistics of Southeast Asia: Current status and information needs2 Inland production includes lakes, rivers, reservoirs and marshes
fisheries data ♦
Production 1 Imports ExportsTotal
supplyPer capita
supply
‘000 tonnes (live weight) Kg/year
Fish for direct human consumption 1 950.8 121.7 180.5 1 92.0 25.9
Fish for animal feed & other purposes
193.7 87.8b 43.2 238.3 -
Notes: 1 Excluding 642 319 t of seaweed (wet weight) 2 Including 42 989 t of fish meal (>> 85 978 t live weight)

�1� Tropical river fisheries valuaTion: background papers To a global synThesis
Estimated employment (2002)
(i) Primary sector (including aquaculture): Approximately 1 million persons of which 57,000 were employed on large vessels, 259,000 in fish culture activities, and the remainder in municipal fisheries
(ii) Secondary sector: Approximately 35,000 persons operating shore facilities and involved in fish drying and other post-harvest activities
Gross value of fisheries output:(at ex-vessel prices, 1998)
US$ 1.8 billion
Trade (1998)
Value of fisheries imports: US$ 83.3 million
Value of fisheries exports: US$ 530 million
inland fisheries ♦
♦ FAO. World fisheries statistics (2004)
Total inland water production has declined steadily over time, from 237,000 tonnes in 1990 to 146,471 tonnes in 1998. The decline is attributed to widespread overfishing; pollution and siltation from the
discharge of urban and industrial effluents; as well as the use of the resource for activities conflicting with inland fisheries (e.g., the extensive development of fish pens).

chapTer � �1�
sri lanka
general information ♠
Surface area: 65 610 km2
Population (2004): 19 400 000Population growth (1998-04): 1.3%GDP (2004): US$ 18.2 billionAgricultural GDP (2004): US$ 3.24 billion (17.8%)Capture fisheries as % of GDP1: 1.428 %Aquaculture as a % of GDP1: 0.468 %
♠ World Bank (2004). Sri Lanka at a Glance1 Asia-Pacific Commission (2005)
Main rivers e
There are 103 distinct river basins covering over 4,500 km in length. The four main rivers all originate in the central hills and pass through the lower plains to the sea; they include the following:
Mahaweli Length: 335 km Catchment area: 2 442 km2
Kelani Length: 145 km Catchment area: 2 292 km2
Kalu Length: 129 km Catchment area: 2 719 km2
Walawe Length: 138 km Catchment area: 2 471 km2
e Ministry of Irrigation and Water Management of Sri Lanka (2002)
perennial reservoirs♣
The inland capture fishery of Sri Lanka is confined to its perennial reservoirs (1,550 km2 in total)1.
The culture fishery tends to be confined to the seasonal tanks (1,000 km2) 1.
Main reservoirs: Senanayake Samudra (largest reservoir) Area: 76.8 km2
Catchment area: 983 km2
Maduru Oya Area: 63.9 km2
Catchment area: 433 km2
Moragahakanda Area: 40.5 km2
Catchment area: 782 km2
Udawalawe Reservoir Area: 34.2 km2
Lunugamwehera Area: 30.2 km2
Catchment area: 904 km2
Randenigala Area: 23.5 km2
Catchment area: 2 333 km2

�1� Tropical river fisheries valuaTion: background papers To a global synThesis
The overwhelming majority of the reservoirs in the country can be classified as small waterbodies2.
estimated surface area of inland lentic waterbodies in sri lanka including the recently constructed Manhaweli reservoirs�
Type Number Area (ha)
Major irrigation reservoirs (ancient) 73 70 850
Medium scale reservoirs (ancient) 160 17 004
Minor irrigation reservoirs (ancient) 10 000 39 271
Floodplain lakes - 4 049
Upland hydroelectric reservoirs (recent) 7 8 097
Mahaweli reservoirs 5 22 000
Maduru Oya - 6 280
Victoria - 2 270
Kotmale - 970
Randengala - 2 750
Ulhiyia-Ratkinda - 2 270
Total 10 245 175 811
♣ Individual reservoir details from De Silva (1988)1 Ministry of Fisheries and Aquatic Resources (2005)2 Sugunan (1997). Fisheries management of small water bodies in seven countries in Africa, Asia and Latin America
inland fisheries♣
Inland catches as a percentage of total catch (2003)2: 10.6 % Freshwater aquaculture as a percentage of total catch3 : 3 %
Inland fisheries production, including aquaculture (2003)4: 30 280 tonnes
♣ Individual reservoir details from De Silva (1988)1 Sugunan (1997). Fisheries management of small water bodies in seven countries in Africa, Asia and Latin America2 Inland catch percentage generated from 2003 figures obtained from the Ministry of Fisheries and Aquatic Resources3 Freshwater aquaculture percentage from ICLARM The WorldFish Center (2002) 4 Catch figures from Ministry of Fisheries and Aquatic Resources (2005)
fisheries data ♦
Production Imports Exports Totalsupply
Per capita supply
‘000 tonnes (live weight) kg/yr
Fish for direct human consumption 286 370 67 284 13 680 339 974 17.4
Fish for animal feed & other purposes
- N/A - - -
♦ FAO. World fisheries statistics (2000)
It is reported that while the floodplains are a productive ecosystem in Sri Lanka, there is no riverine fishery worth mentioning. The main share of inland production is from the reservoirs1. Most of the large
reservoirs are constructed storages for hydroelectric power generation, and the medium ones are ancient (for capture fisheries). Small reservoirs and seasonal tanks are for culture fisheries.

chapTer � �1�
Estimate employment (2004)
(i) Primary sector: 250 000
(ii) Secondary sector: 100 000
Trade (2004)
Value of fisheries imports: US$ 59 million
Value of fisheries exports: US$ 94 million
inland fisheries and aquaculture ♦
♦ FAO. World fisheries statistics (2004)
Inland fisheries experienced steady growth, from 23,000 tonnes in 1995 to 30,280 tonnes in 2003 (including aquaculture). This growth is attributed to a development program that has stocked waterbodies with fingerlings; raised fish in ponds, cages and pens; and provided subsidies to fishers to purchase canoes and fishing gear. Furthermore,
the Aquaculture Development Division of the Ministry of Fisheries and Aquatic Resources Development are providing support to rehabilitate two fish breeding stations at Dambulla and Udawalave. These institutions are also encouraging farmers, fishers and NGOs to increase fish feed production.

��0 Tropical river fisheries valuaTion: background papers To a global synThesis
Main rivers Thailand has 47 major riversEstimated total riverine production1: 200 000 – 500 000 tonnes/year
Mekong River (originating in China and passing through Myanmar, Laos, Thailand, Cambodia and Vietnam)
Total length: 4 225 kmLength along the Thai-Laos border: 850 km (approx.)Total annual catches2: 875 000 tonnes (2000) (capture fisheries)
68 100 tonnes (2000) (aquaculture) 187 500 tonnes (2000) (reservoirs)
Tributary Mun River Length: 673 km Pak River Songkhram River (the only river without a main stream dam)
Salween (Originating in the Tibetan plateau, it flows southward through China, down through the East of Myanmaralong the Thai-Myanmar border, before continuing through Myanmar and emptying into the Andaman Sea. It is the last free-flowing international river in Asia)
Total length: 2 800 kmTotal length along the Thai- Myanmar border: 120 kmTotal floodplain: 320 000 km2
Floodplain within Thailand: 16 000 km2 (5%)
Chao Phraya (Forming in Pak Nam Pho from four upstream tributaries, the river connects with three tributaries, Sakaekrung and Tachin from the southwest and Pasak from the northeastern Petchabun Range, before running off into the Gulf of Thailand.)
Thailand
general information ♠
Surface area: 514 000 km2 Population (2004): 62 400 000Population growth (1998-2004): 0.7%GDP (2004): US$ 163.5 billionAgricultural GDP (1996): US$ 12 695.8 millionCapture fisheries as % of GDP1: 2.04%Aquaculture as % of GDP1: 2.07%
♠ FAO. World fisheries statistics (2000)1 Asia-Pacific Fishery Commission (2005)
Length: 230 km Floodplain: 21 521 km2
(overall Chao Phraya system: 160 000 km2) Tributaries Ping (major tributary) Length: 480 km Catchment area: 35 535 km2
Yom Catchment area: 19 516 km2
Nan Length: 800 km Catchment area: 32 854 km2
Wang Floodplain: 11 084 km2
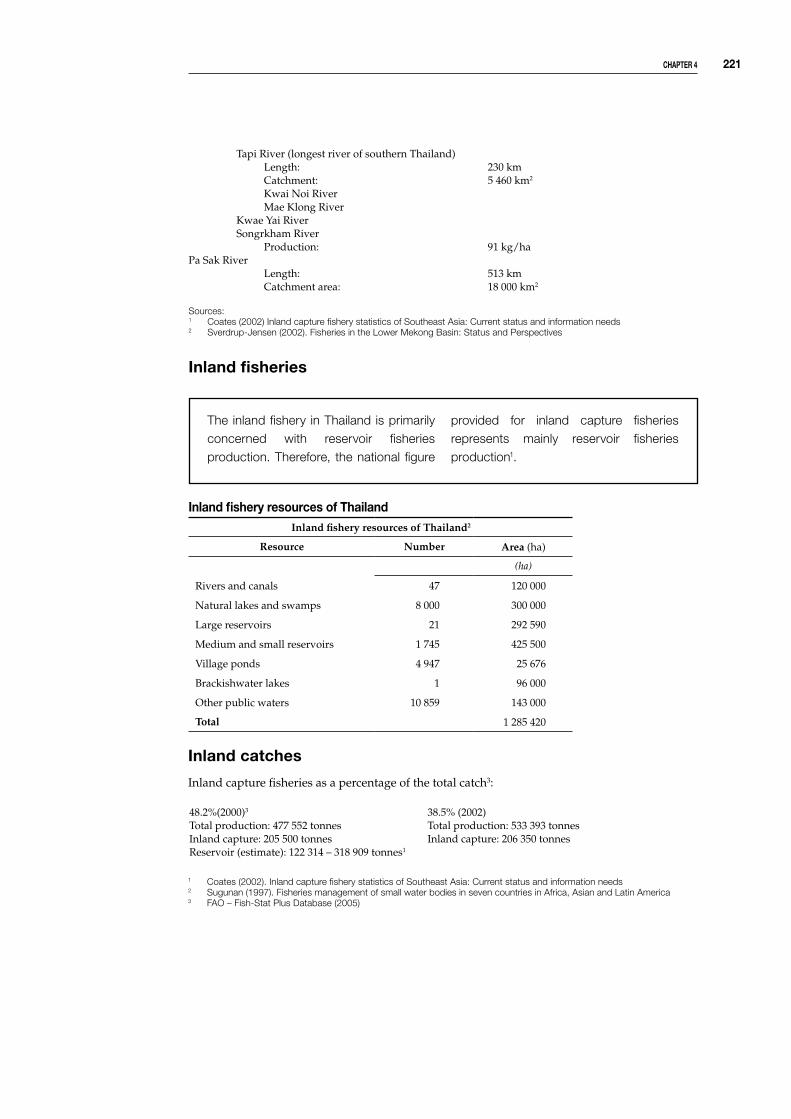
chapTer � ��1
Tapi River (longest river of southern Thailand) Length: 230 km Catchment: 5 460 km2
Kwai Noi River Mae Klong River Kwae Yai River Songrkham River Production: 91 kg/haPa Sak River Length: 513 km Catchment area: 18 000 km2
Sources: 1 Coates (2002) Inland capture fishery statistics of Southeast Asia: Current status and information needs2 Sverdrup-Jensen (2002). Fisheries in the Lower Mekong Basin: Status and Perspectives
inland fisheries
The inland fishery in Thailand is primarily concerned with reservoir fisheries production. Therefore, the national figure
provided for inland capture fisheries represents mainly reservoir fisheries production1.
inland fishery resources of ThailandInland fishery resources of Thailand2
Resource Number Area (ha)
(ha)
Rivers and canals 47 120 000
Natural lakes and swamps 8 000 300 000
Large reservoirs 21 292 590
Medium and small reservoirs 1 745 425 500
Village ponds 4 947 25 676
Brackishwater lakes 1 96 000
Other public waters 10 859 143 000
Total 1 285 420
inland catches
Inland capture fisheries as a percentage of the total catch3:
48.2%(2000)3 38.5% (2002)Total production: 477 552 tonnes Total production: 533 393 tonnesInland capture: 205 500 tonnes Inland capture: 206 350 tonnesReservoir (estimate): 122 314 – 318 909 tonnes1
1 Coates (2002). Inland capture fishery statistics of Southeast Asia: Current status and information needs2 Sugunan (1997). Fisheries management of small water bodies in seven countries in Africa, Asian and Latin America3 FAO – Fish-Stat Plus Database (2005)
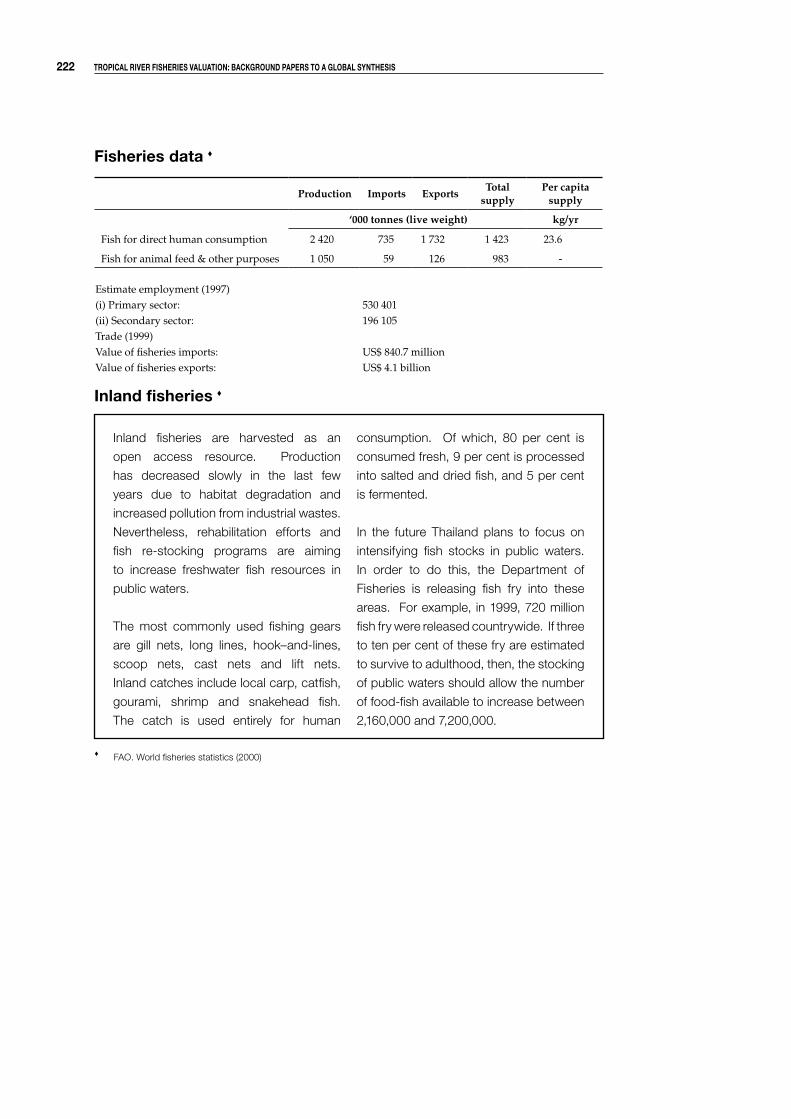
��� Tropical river fisheries valuaTion: background papers To a global synThesis
Estimate employment (1997)(i) Primary sector: 530 401(ii) Secondary sector: 196 105Trade (1999)Value of fisheries imports: US$ 840.7 millionValue of fisheries exports: US$ 4.1 billion
inland fisheries ♦
Inland fisheries are harvested as an
open access resource. Production
has decreased slowly in the last few
years due to habitat degradation and
increased pollution from industrial wastes.
Nevertheless, rehabilitation efforts and
fish re-stocking programs are aiming
to increase freshwater fish resources in
public waters.
The most commonly used fishing gears
are gill nets, long lines, hook–and-lines,
scoop nets, cast nets and lift nets.
Inland catches include local carp, catfish,
gourami, shrimp and snakehead fish.
The catch is used entirely for human
consumption. Of which, 80 per cent is
consumed fresh, 9 per cent is processed
into salted and dried fish, and 5 per cent
is fermented.
In the future Thailand plans to focus on
intensifying fish stocks in public waters.
In order to do this, the Department of
Fisheries is releasing fish fry into these
areas. For example, in 1999, 720 million
fish fry were released countrywide. If three
to ten per cent of these fry are estimated
to survive to adulthood, then, the stocking
of public waters should allow the number
of food-fish available to increase between
2,160,000 and 7,200,000.
♦ FAO. World fisheries statistics (2000)
fisheries data ♦
Production Imports ExportsTotal
supplyPer capita
supply
‘000 tonnes (live weight) kg/yr
Fish for direct human consumption 2 420 735 1 732 1 423 23.6
Fish for animal feed & other purposes 1 050 59 126 983 -

chapTer � ���
vieTnam
general information ♠
Water area (inland): 329 560 km2
Population (2004): Est. 82 689 518Population growth (2004): 1.3%GDP at purchaser’s value (2003): US$ 203.7 billionAgricultural percentage of GDP (2003): 21%Fisheries GDP (2003): 4%Capture fisheries as percentage of GDP1: 3.7%Aquaculture as percentage of GDP1: 3.5%
♠ FAO. World fisheries statistics (2005)1 Asia-Pacific Fishery Commission (2005)
Main riverse
Total number of rivers 2 500 riversRed River system Annual catches: 6 000 tonnes (1980’s) (Capture fisheries) Thao Length: 902 km Catchment area: 51 750 km2
Da Length: 1 013 km Catchment area: 52 610 km2
Lo Length: 469 km Catchment area: 38 970 km2
Hong Length: 1 126 km Catchment area: 154 720 km2
Red River delta Surface area: 19 000 km2
Annual catches: 136 000 tonnes (Capture fisheries)
Thai Binh system Cau Length: 288 km Catchment area: 6 064 km2
Thuong Length: 164 km Catchment area: 3 580 km2
Luc Nam Length: 175 km Catchment area: 3 066 km2
Thai Binh Length: 385 km Catchment area: 15 520 km2
Kycung-BacGiang system Bang Giang Length: 108 km Catchment area: 4 565 km2
Kycung Length: 243 km Catchment area: 6 663 km2
Ma system Ma Length: 538 km Catchment area: 28 370 km2
Chu Length: 325 km Catchment area: 7 552 km2
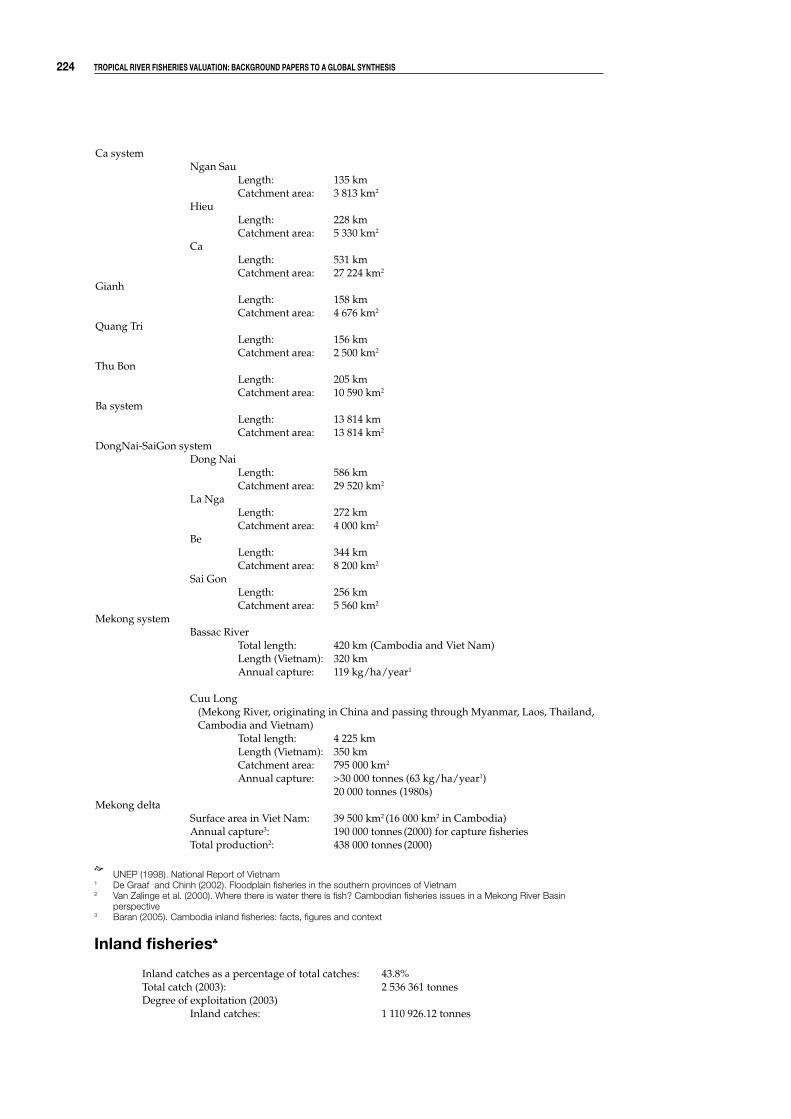
��� Tropical river fisheries valuaTion: background papers To a global synThesis
Ca system Ngan Sau Length: 135 km Catchment area: 3 813 km2
Hieu Length: 228 km Catchment area: 5 330 km2
Ca Length: 531 km Catchment area: 27 224 km2
Gianh Length: 158 km Catchment area: 4 676 km2
Quang Tri Length: 156 km Catchment area: 2 500 km2
Thu Bon Length: 205 km Catchment area: 10 590 km2
Ba system Length: 13 814 km Catchment area: 13 814 km2
DongNai-SaiGon system Dong Nai Length: 586 km Catchment area: 29 520 km2
La Nga Length: 272 km Catchment area: 4 000 km2
Be Length: 344 km Catchment area: 8 200 km2
Sai Gon Length: 256 km Catchment area: 5 560 km2
Mekong system Bassac River Total length: 420 km (Cambodia and Viet Nam) Length (Vietnam): 320 km Annual capture: 119 kg/ha/year1
Cuu Long (Mekong River, originating in China and passing through Myanmar, Laos, Thailand, Cambodia and Vietnam) Total length: 4 225 km Length (Vietnam): 350 km Catchment area: 795 000 km2
Annual capture: >30 000 tonnes (63 kg/ha/year1) 20 000 tonnes (1980s)Mekong delta Surface area in Viet Nam: 39 500 km2 (16 000 km2 in Cambodia) Annual capture3: 190 000 tonnes (2000) for capture fisheries Total production2: 438 000 tonnes (2000)
e UNEP (1998). National Report of Vietnam
1 De Graaf and Chinh (2002). Floodplain fisheries in the southern provinces of Vietnam2 Van Zalinge et al. (2000). Where there is water there is fish? Cambodian fisheries issues in a Mekong River Basin
perspective3 Baran (2005). Cambodia inland fisheries: facts, figures and context
inland fisheries♣
Inland catches as a percentage of total catches: 43.8% Total catch (2003): 2 536 361 tonnes Degree of exploitation (2003) Inland catches: 1 110 926.12 tonnes

chapTer � ���
estimated amount of captured freshwater fish in different types of waterbodies and socioeconomic regions in vietnam in the 1��0s (tonnes)
Aquaculture Lakes Reservoirs Rice fields Rivers Total
North 120 000 5 000 5 000 6 000 136 000
South 90 000 4 000 30 000 20 000 144 000
Center 5 000 3 000 900 3 000 11 900
High lands 5 000 1 000 100 500 6 600
Total 220 000 13 000 36 000 29 500 298 500
♣ UNEP (1998). National Report of Vietnam
fisheries data ♦
Production Imports ExportsTotal
supplyPer capita
supply
‘000 tonnes (live weight) kg/year
Fish for direct human consumption
1 434 (2002) 21 482 973 19.4 (2001)
Fish for animal feed & other purposes
990 (MOFI, 25% of total = 634)
54 8 1 036
Estimated employment (2002)
(i) Primary sector (including aquaculture): 553 900
(ii) Secondary sector: 3.4 million
Gross value of fisheries output (2003): US$ 1.7 billion
Trade (2003)
Value of fisheries imports: US$ 52.1 million
Value of fisheries exports: US$ 2.24 billion(2.35 billion in 2004, estimated in January 2005)
inland fisheries ♦
fishing production means
In recent years, the number of fishing boats has increased considerably in Vietnam. The Vietnamese capture fishing industry had a total of 81,000 motorized fishing vessels with a total capacity of 4,038,000 hp (2003).
inshore fisheries
The continuing construction of dams and
reservoirs means the total size of its water
bodies is still increasing. However, in 2005
natural lakes and rivers were thought to
occupy approximately 4,200 km2 with
ponds and seasonal flood plains adding a
further 6,000 km2.
Freshwater capture fisheries, once of
economic importance in certain regions,
have been in decline. Overexploitation has
resulted in diminished productivity and
led to many fishers pursuing alternative
activities and cooperatives ceasing to
operate. Furthermore, management
policies relating to flood control have led
to once highly productive rivers such as
the Red River Delta becoming significantly
less so.

��� Tropical river fisheries valuaTion: background papers To a global synThesis
♦ FAO. World fisheries statistics (2005)
The inland fisheries that occur in rivers,
lakes, dams and rice fields remain
important to people living in rural areas.
These fisheries are thought to have peaked
in 2001 at 244,00 tonnes before falling
to 209,000 tonnes in 2003. The figures
include culture-based capture of species
such as carp and tilapia but are still
believed to underestimate true production
(a common problem of fisheries statistics
in the Mekong region). The Mekong itself
is thought to support 48,000 Vietnamese
fishers in 250 communities and produce
30,000 tonnes of fish each year.
227
Eric Baran1, Teemu Jantunen2 and Chiew Kieok Chong3
1 The WorldFish Center,Regional Office for the Greater Mekong#35, Street 71 (Corner of Mao Tse Tong Blvd.)Sangkat Beng Keng Kang I,Phnom Penh, Cambodia.Email: [email protected]
2 Environmental ConsultantPhnom Penh, Cambodia.E-mail: [email protected]
3 MEECON Research Sdn. Bhd. 49-1A, Jalan Bandar 1, Pusat Bandar Puchong, 47100 Puchong, Selangor, Malaysia. Email: [email protected]
Values of Inland Fisheriesin the Mekong River basin
C H A P T E R 5

��� Tropical river fisheries valuaTion: background papers To a global synThesis
Contents - Chapter 5
Acknowledgements 230
Acronyms 230
1. Introduction 231
2. BasinwideAnalyses 231 2.1 Basin Overview 231 2.2 Economic Valuation Analyses 234 2.2.1 Direct Use Values 234 2.2.1.1 Catch values 234 2.2.1.2 Market values 235 2.2.1.3 Consumption values 236 2.2.2 Indirect Use Values 237 2.2.2.1 Biodiversity values 237 2.2.2.2 Cultural values 238 2.3 Economic Impact Analyses 241 2.4 Livelihood Analyses 242 2.5 Impact of Changes on Fisheries Basinwide 244 2.5.1 Changes in Flow Regime 244 2.5.2 Changes in Fishing Patterns 246 2.5.3 Changes in Political Agendas 247
3. YunnanProvince,People’sRepublicofChina 247
4. LaoPeople’sDemocraticRepublic 249 4.1 Country Overview 249 4.2 Economic Valuation Analyses 250 4.2.1 Direct Use Values 250 4.2.1.1 Catch values 250 4.2.1.2 Market values 251 4.2.1.3 Consumption values 252 4.3 Socioeconomic Analyses 254 4.4 Livelihood Analyses 255 4.5 Impact of Changes on Fisheries in Laos 256 4.5.1 Example of Nam Ngum Dam 256 4.5.2 Example of Nam Theun 2 Dam 256
5. KingdomofThailand 257 5.1 Country Overview 257 5.2 Economic Valuation Analyses 258 5.2.1 Direct Use Values 258 5.2.1.1 Catch values 258 5.2.1.2 Market values 258 5.2.1.3 Consumption values 260 5.3 Socioeconomic Analyses 260 5.4 Impact of Changes on Fisheries in Thailand 260 5.4.1 Example of Pak Mun Dam 260
229
6. KingdomofCambodia 261 6.1 Country Overview 261 6.2 Economic Valuation Analyses 262 6.2.1 Direct Use Values 262
6.2.1.1 Catch values 262
6.2.1.2 Market values 263
6.2.1.3 Consumption values 266 6.3 Socioeconomic Analyses 268 6.4 Livelihood Analyses 269 6.5 Impact of Changes on Fisheries in Cambodia 270 6.5.1 Changes in Flow Regime 270 6.5.2 Habitat Quality Loss 271 6.5.3 Changes in Fishing Patterns 271
7. SocialistRepublicofVietnam 272 7.1 Country Overview 272 7.2 Economic Valuation Analyses 273 7.2.1 Direct Use Value 273 7.2.1.1 Catch values 273 7.2.1.2 Consumption values 274 7.3 Socioeconomic Analyses 274 7.4 Livelihood Analyses 275 7.5 Impact of Changes on Fisheries in Vietnam 276
8. Conclusions 276
References 278

��0 Tropical river fisheries valuaTion: background papers To a global synThesis
ACkNOWLEDGEMENTS
The authors would like to sincerely thank the following persons who reviewed the draft document and significantly assisted with their contributions and comments in improving it:
Chris Barlow (Mekong River Commission); Christophe Béné (The WorldFish Center); Simon Bush (University of Sidney); Peter Degen; Richard Friend (IUCN); Simon Funge-Smith (FAO); Kent Hortle (Mekong River Commission); Marko Keskinen (Helsinki University of Technology); Kai Lorenzen (Imperial College); Niklas Mattson (Mekong River Commission); Magnus Torell (SEAFDEC); Danilo Israel (The WorldFish Center); and Yeo Bee Hong (The WorldFish Center).
Thanks are also given to Rowena Andrea Valmonte-Santos and Hari Balasubramanian, who contributed to the initial information gathering, to Greg Cans for assistance in data handling, and to Chris Myschowoda for stylistic betterment. Chong Chiew Kieok produced a preliminary draft of this review in 2003.
ACRONYMS
ADB = Asian Development BankAMFC = Assessment of Mekong Fisheries project (MRC)DOF = Department of Fisheries (Cambodia)GDP = Gross Domestic ProductIUCN = World Conservation UnionLARReC = Living Aquatic Resources Research CenterLMB = Lower Mekong BasinMRC = Mekong River Commission

chapTer � ��1
�. INTRODUCTION
Asia has the most productive inland fisheries in the world. The fishery sector contributes significantly to the national economies of the region (Revenga et al. 2000). Inland fisheries also improve food security by providing a source of protein and a livelihood for millions of people in this part of the world, especially the rural poor. However, increasing competition for water resources, unregulated fishing and high population growth in riparian countries of major river basins have put mounted pressure on these resources and contributed to increasing threats to fisheries production.
The values of river fisheries are numerous (details in Cowx et al. 2004). The purpose of this report is to provide information on the biological, economic, social and cultural values of river fisheries in the Lower Mekong Basin, and to identify the main impacts of environmental changes on these values. A review of fisheries-related literature, including project reports and gray literature, was undertaken. More than 800 documents were reviewed, and original information was extracted from 270 of them. The analysis identified a large number of localized studies leading to generic conclusions.
The report addresses the basinwide issues and studies. It is then organized by nation, namely, the Chinese province of Yunnan, then Laos, Thailand, Cambodia and Vietnam. It first gives an overview of each country’s economic, fisheries and social situation, then details the values documented for river fisheries in each country.
Available information is classified as much as possible according to a theoretical framework synthesized from Emerton and Bos (2004) and Neiland and Béné (2006):
a) resource-centered approaches, including
i) conventional economic analyses, with the total economic value consisting of
- use values (direct use value, indirect use value, option values) and
- non-use values (bequest value, existence value)
ii) economic efficiency analyses
iii) economic impact analyses
b) people-centred approaches, including
i) socio-economic analyses, and
ii) livelihood analyses
The valuation studies at the regional level as well as in each riparian country did not always match or fill in this framework. For this analysis, the Emerton and Bos framework was modified as follows:
Economic valuation analysesDirect use values
Catch valuesConsumption valuesMarket values
Indirect use valuesEconomic impact analysesSocioeconomic analyses (whenever
existing)Livelihood analyses
This review of the values of fisheries and aquatic products in the Mekong Basin is supplemented by a brief analysis of the impact of changes in river flows and floodplain land use on the fisheries of each country.
2. bASINWIDE ANALYSES
�.1 basin overview
The Mekong River is the 12th longest river in the world (MRCS 1992) and the lifeline of Southeast Asia. The river flows through the riparian states of China, Myanmar, Laos, Thailand, Cambodia and Vietnam (see Figures 1 and 2).

��� Tropical river fisheries valuaTion: background papers To a global synThesis
In 2003, the population in the Lower Mekong
Basin amounted to 53 million (MRC 2003a).
Fifty per cent of this population was under 15
years of age, and it is projected to increase to
as much as 90 million by the year 2025 (MRC
2003b). The basin covers nearly 795,000 km2,
giving a population density of 92 person/km2.
In comparison with other Asian river basins,
the Mekong Basin is not densely populated at
present, and land and water resources are still
relatively plentiful, as only a part of its potential
has so far been developed (Kristensen 2000;
ADB/UNEP 2004).
However, industrial development, particularly in upstream countries, is problematic as the rural economies of the downstream countries, Cambodia and Vietnam, are especially vulnerable to upstream changes. For instance, 60 per cent of Vietnam’s agricultural production comes from the Mekong Delta (Jones 1997) and 60 per cent of Cambodia’s fish catch comes from the Tonle Sap Lake (Ojendal and Torell 1998).
The Mekong River has one flood pulse a
year followed by a dry season. During the
monsoon season (May to November), the
river’s discharge is the third largest in the
world after the Amazon and the Brahmaputra,
and can reach 54 times the minimum mean
discharge (Welcomme 1985). The floods
annually inundate some 84,000 km2 of
floodplains (Scott 1989), which creates huge
breeding and spawning grounds for fish.
Many Mekong fish species are migratory,
crossing national boundaries during their
lifecycle driven by hydrological pulses, and
the fisheries are crucially dependent on the
annual flooding pattern. Thus the Mekong
floods and the extensive sediment, nutrient
and energy transfers they generate between
sub-basins and countries play a crucial role in
the productivity of the system.
Compared to most international river
basins, the Mekong River has a unique
cooperation organization: the Mekong River
Commission (MRC). The MRC is a successor
of the Mekong Committee and the Interim
Mekong Committee, which were in operation
during the periods 1957-75 and 1978-95,
respectively. The UN played an important
role in achieving the cooperation in the early
1950s and the United Nations Development
Programme (UNDP) provided important
negotiation assistance for the drafting of the
1995 Agreement (Ringler 2001).
The mandate of the MRC 1995 Agreement signed by Laos, Thailand, Cambodia and Vietnam is “to cooperate in all fields
of sustainable development, utilization,
management and conservation of the water
and related resources of the Mekong River
Basin, including, but not limited to irrigation,
hydro-power, navigation, flood control,
fisheries, timber floating, recreation and
tourism, in a manner to optimize the multiple-
use and mutual benefits of all riparians and
to minimize the harmful effects that might
result from natural and man-made activities”.
figure 1: Map of the Mekong river basin, from Tibet to the south china sea

chapTer � ���
Recently, the MRC has been involved in the
development of several policy, hydrological
and management models, which in the near
future will provide planning tools for economic
valuation and management of water resources
in the region. Research in the fisheries sector
is also underway by the Mekong River
Commission Secretariat (MRCS), including
catch and market monitoring, fishery and
fish larvae monitoring, consumption studies,
and surveys of deep pools in the mainstream
(MRC 2004a). Environmental flows, economic
valuation and hydrological modeling are also
high on the MRC’s agenda. However, this
institution is faced with the conflicting views
of the riparian countries about the value and
potential of the river. Simply put, China sees
it as a source of hydropower and as a trade
route; Myanmar is the country with the least
share and interest in the Mekong; Thailand
is primarily interested in water for irrigation;
Cambodia relies heavily on wild fisheries;
and Vietnam values the Mekong waters for
irrigation of rice fields and as a way to oppose
the saline intrusion (Ratner 2003; Campbell
2005).
Marine fisheries and the aquaculture sector
have been generally regarded in the Mekong
Basin as important for revenue generation,
figure �: Map of the lower Mekong basin showing major tributaries, large reservoirs and flooded areas (after van Zalinge and Thouk 1���)

��� Tropical river fisheries valuaTion: background papers To a global synThesis
export earnings and formal economic
benefits, whereas traditionally inland fisheries
have only been seen as important for rural
livelihoods. Consequently, official data
collection efforts have concentrated on other
fisheries than inland fisheries (Coates 2002,
2003). Limited valuation studies have been
conducted, and most of the values reported
are direct extractive values of fisheries.
Under estimation of the inland capture
fisheries benefits other sectors, such as
hydroelectricity, irrigation and flood control,
which in turn adversely affect inland capture
fisheries.
�.� economic valuation analyses
�.�.1 direct use values
The Mekong contributes directly to food
security in terms of fisheries production and
irrigation of rice fields. Other direct use values
are transportation, domestic and industrial
uses as well as tourism activities. The fisheries
provide not just a livelihood for fishers and
their families but also an income for all those
who are engaged in repairing boats, selling
fishing gears, processing aquatic products,
and ultimately selling these things.
2.2.1.1 Catchvalues
Estimates of the total fisheries production in
the Lower Mekong Basin have been evolving
upwards as new studies, household surveys,
and improvements in data collection and
analysis have been achieved. Interestingly,
at the same time, reports of declining fish
catches have also been reported. Baran et
al. (2001a) demonstrated, however, that in
Cambodia what has decreased is the catch
per fisher, as the population has tripled while
the fish harvest has only doubled between
the 1940s and the 1990s.
Another recurrent issue has been the
discrepancy between official statistics and
those based on scientific surveys, as illustrated
in Table 1, where national capture production
figures are lower than those resulting from
scientific studies. Coates (2002, 2003) has
explained this discrepancy by the partial or
total absence of a field-based monitoring
system in most riparian countries. This even
leads to the conclusion that “unless detailed
investigations indicate otherwise, with few
exceptions, policies for river fisheries should
not be based upon current national statistics”
(Coates et al. 2004). In this review, we focus
rather on scientific estimates.
Starting in 1991-92, reports estimated
the catch at 357,000 tonnes, including
aquaculture. This figure was increased a few
years later to 620,000 tonnes (Jensen 1996),
then close to one million tonnes (Jensen 2000),
then to 1.53 million tonnes (Sverdrup-Jensen
2002). At that time, Jensen (2001a) noticed
that the floodplains of the Lower Mekong
Basin (LMB) were producing some four times
as much fish per square kilometer as the
North Sea in Europe. In 2004, the estimates
for the LMB rose to 2.64 million tonnes from
capture fisheries in rivers alone, with an
Table 1: estimated inland capture fisheries production in the Mekong basin in �000, in tonnes
CountryAnnual catch based on scientific
assessments1
Annual catch according to official country statistics 2
Cambodia 289 000 – 431 000 245 600
Lao PDR 27 000 29 250
Thailand 303 000 209 404
Vietnam 190 000 161 000
Total 809 000 – 951 000 645 254
1 Van Zalinge et al. 2000; 2 FAO data
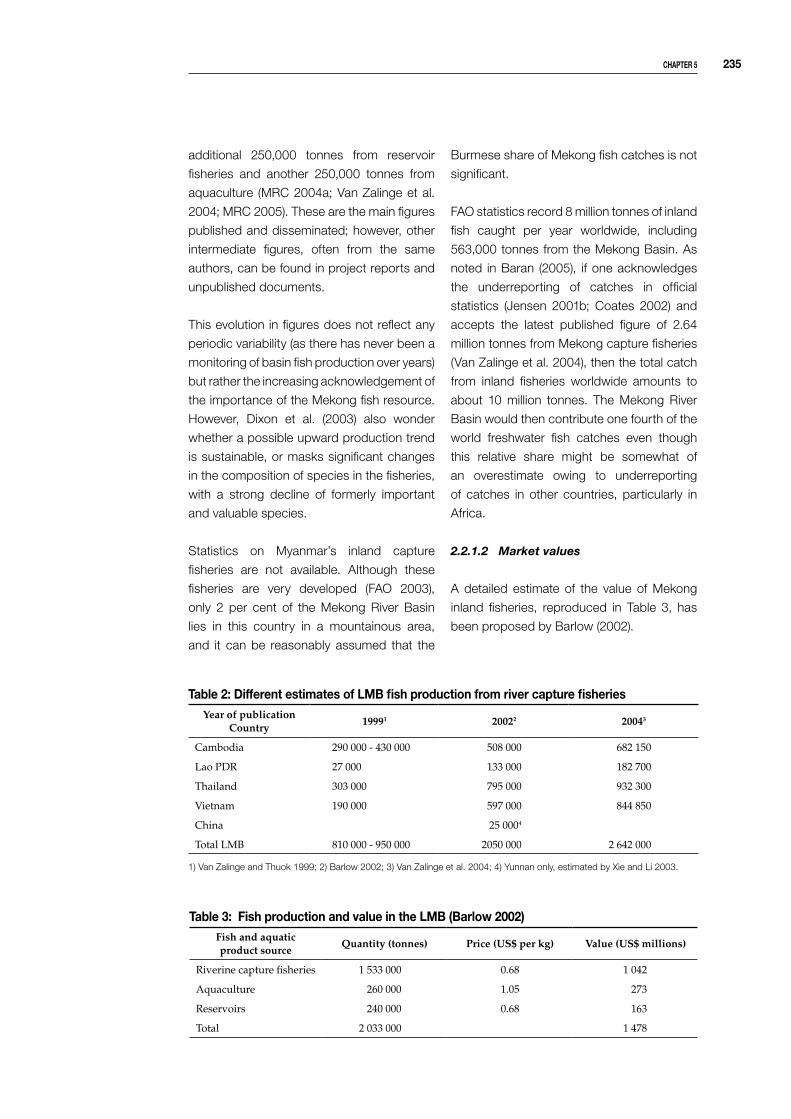
chapTer � ���
Table �: different estimates of lMb fish production from river capture fisheries Year of publication
Country19991 20022 20043
Cambodia 290 000 - 430 000 508 000 682 150
Lao PDR 27 000 133 000 182 700
Thailand 303 000 795 000 932 300
Vietnam 190 000 597 000 844 850
China 25 0004
Total LMB 810 000 - 950 000 2050 000 2 642 000
1) Van Zalinge and Thuok 1999; 2) Barlow 2002; 3) Van Zalinge et al. 2004; 4) Yunnan only, estimated by Xie and Li 2003.
additional 250,000 tonnes from reservoir
fisheries and another 250,000 tonnes from
aquaculture (MRC 2004a; Van Zalinge et al.
2004; MRC 2005). These are the main figures
published and disseminated; however, other
intermediate figures, often from the same
authors, can be found in project reports and
unpublished documents.
This evolution in figures does not reflect any
periodic variability (as there has never been a
monitoring of basin fish production over years)
but rather the increasing acknowledgement of
the importance of the Mekong fish resource.
However, Dixon et al. (2003) also wonder
whether a possible upward production trend
is sustainable, or masks significant changes
in the composition of species in the fisheries,
with a strong decline of formerly important
and valuable species.
Statistics on Myanmar’s inland capture
fisheries are not available. Although these
fisheries are very developed (FAO 2003),
only 2 per cent of the Mekong River Basin
lies in this country in a mountainous area,
and it can be reasonably assumed that the
Burmese share of Mekong fish catches is not
significant.
FAO statistics record 8 million tonnes of inland
fish caught per year worldwide, including
563,000 tonnes from the Mekong Basin. As
noted in Baran (2005), if one acknowledges
the underreporting of catches in official
statistics (Jensen 2001b; Coates 2002) and
accepts the latest published figure of 2.64
million tonnes from Mekong capture fisheries
(Van Zalinge et al. 2004), then the total catch
from inland fisheries worldwide amounts to
about 10 million tonnes. The Mekong River
Basin would then contribute one fourth of the
world freshwater fish catches even though
this relative share might be somewhat of
an overestimate owing to underreporting
of catches in other countries, particularly in
Africa.
2.2.1.2 Marketvalues
A detailed estimate of the value of Mekong
inland fisheries, reproduced in Table 3, has
been proposed by Barlow (2002).
Table �: fish production and value in the lMb (barlow �00�)Fish and aquatic product source
Quantity (tonnes) Price (US$ per kg) Value (US$ millions)
Riverine capture fisheries 1 533 000 0.68 1 042
Aquaculture 260 000 1.05 273
Reservoirs 240 000 0.68 163
Total 2 033 000 1 478

��� Tropical river fisheries valuaTion: background papers To a global synThesis
In 2004, Van Zalinge et al., citing Jensen (1996), Sjorslev (2001a), Sverdrup-Jensen (2002) and Hortle and Bush (2003), valued the total inland Mekong fish production at more than US$ 1,700 million1, and the MRC (2005) valued it at about US$ 2,000 million. From these assessments, it is clear that riverine capture fisheries are by far the most important contributors with more than two thirds of the total value, followed by aquaculture and fish production from man-made reservoirs (around 10%). Yet, despite the remarkable importance and economic value of fish catches in the Mekong riparian countries, the inland capture fisheries sector is poorly represented in the national plans and priorities of the Lao PDR and Vietnam.
Aquaculture in the LMB also deserves a section in this review given its close links with capture fisheries. Inland aquaculture production in the basin shows a steady recorded growth from around 60,000 tonnes in 1990 to around 260,000 tonnes in 1999-2000, which is equal to 12-13 per cent of the total LMB freshwater aquatic animal production (Sverdrup-Jensen 2002; Phillips 2002). This figure does not include considerable production of fish and shrimp in the brackish waters of the Mekong Delta.
However, both shrimp and fish aquaculture industries depend heavily on larvae and fry supplied by capture fisheries. In Cambodia in particular, aquaculture consists mainly of captured fish grown in cages (e.g., Ngor 1999), and the food that valuable carnivorous cultured species are given consists of other wild species of lesser value (Phillips 2002). Without the supply of wild fish, Cambodia, for instance, would be left with only 15,000 tonnes of aquaculture fishes whose cycle has been mastered, or just 4 per cent of its total fish harvest (Baran 2005).
The aquaculture industry is complemented
by a growing trade in ornamental fish and aquatic plants, particularly in Thailand (NACA 2000), but its value has not been documented. Recreational sport fishing is of limited scale in the LMB, even though weekend reservoir fishing is gaining popularity in Thailand and Vietnam (Van Zalinge et al. 2004). The value of this aspect of fisheries, however, has never been assessed so far.
2.2.1.3 Consumptionvalues
Sverdrup-Jensen (2002) estimated the total
fish consumption in the LMB at 2.03 million
tonnes per year with a per capita estimate
of 36 kg/person/year (ranging from 10 to
89 kg/person/year). Baran and Baird (2003),
in a work presented in 2001, gave a range of
per capita consumption between 26.2 and
38.4 kg/person/year and show that this is one
of the highest rates of fish consumption at the
national level in the world2. Hortle and Bush
(2003) estimated the fish consumption at over
3 million tonnes per year, or 56 kg/person/
year. This jump in the consumption figure is
mainly due to the inclusion of processed fish
and other aquatic animals (shrimps, crabs,
frogs, etc.) that remain neglected in classical
fish-centered valuation studies. Van Zalinge et
al. (2004), compiling fish consumption figures
from different sources, estimate it at 2.6 million
tons annually for the Lower Mekong Basin
(Table 4). However, conservative estimates
still put the consumption of basin dwellers at
just “over one and a half million tonnes of fish
per year” (MRC 2004b).
It is impossible to overemphasize the
importance of fish for food security in the
Mekong Basin. According to Jensen (2001b),
small fish and fish products provide necessary
calcium to the diet of Mekong region people
in the same way that milk does in Western
countries, because rice does not contain
calcium and milk is not part of the traditional
1 However, the authors do not detail the estimate of the average price per kilogram basinwide.2 The record consumption of aquatic products being in Iceland with an average of 90 kg/person/year (FAO statistics) Some
local communities also have very high consumption rates, reaching 200 kg/person/year, for instance, in the Amazon Basin (Batista et al. 1998).
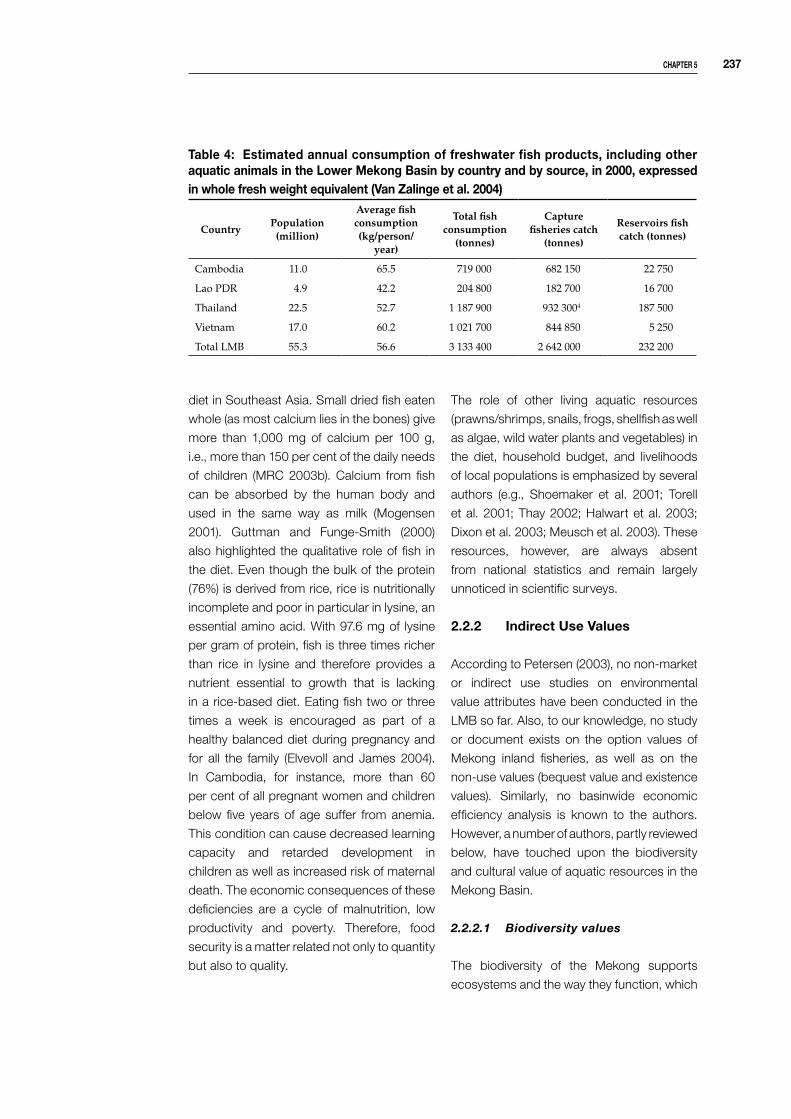
chapTer � ���
Table �: estimated annual consumption of freshwater fish products, including other aquatic animals in the lower Mekong basin by country and by source, in �000, expressed in whole fresh weight equivalent (van Zalinge et al. �00�)
CountryPopulation
(million)
Average fish consumption (kg/person/
year)
Total fish consumption
(tonnes)
Capture fisheries catch
(tonnes)
Reservoirs fish catch (tonnes)
Cambodia 11.0 65.5 719 000 682 150 22 750
Lao PDR 4.9 42.2 204 800 182 700 16 700
Thailand 22.5 52.7 1 187 900 932 3004 187 500
Vietnam 17.0 60.2 1 021 700 844 850 5 250
Total LMB 55.3 56.6 3 133 400 2 642 000 232 200
diet in Southeast Asia. Small dried fish eaten
whole (as most calcium lies in the bones) give
more than 1,000 mg of calcium per 100 g,
i.e., more than 150 per cent of the daily needs
of children (MRC 2003b). Calcium from fish
can be absorbed by the human body and
used in the same way as milk (Mogensen
2001). Guttman and Funge-Smith (2000)
also highlighted the qualitative role of fish in
the diet. Even though the bulk of the protein
(76%) is derived from rice, rice is nutritionally
incomplete and poor in particular in lysine, an
essential amino acid. With 97.6 mg of lysine
per gram of protein, fish is three times richer
than rice in lysine and therefore provides a
nutrient essential to growth that is lacking
in a rice-based diet. Eating fish two or three
times a week is encouraged as part of a
healthy balanced diet during pregnancy and
for all the family (Elvevoll and James 2004).
In Cambodia, for instance, more than 60
per cent of all pregnant women and children
below five years of age suffer from anemia.
This condition can cause decreased learning
capacity and retarded development in
children as well as increased risk of maternal
death. The economic consequences of these
deficiencies are a cycle of malnutrition, low
productivity and poverty. Therefore, food
security is a matter related not only to quantity
but also to quality.
The role of other living aquatic resources
(prawns/shrimps, snails, frogs, shellfish as well
as algae, wild water plants and vegetables) in
the diet, household budget, and livelihoods
of local populations is emphasized by several
authors (e.g., Shoemaker et al. 2001; Torell
et al. 2001; Thay 2002; Halwart et al. 2003;
Dixon et al. 2003; Meusch et al. 2003). These
resources, however, are always absent
from national statistics and remain largely
unnoticed in scientific surveys.
�.�.� indirect use values
According to Petersen (2003), no non-market
or indirect use studies on environmental
value attributes have been conducted in the
LMB so far. Also, to our knowledge, no study
or document exists on the option values of
Mekong inland fisheries, as well as on the
non-use values (bequest value and existence
values). Similarly, no basinwide economic
efficiency analysis is known to the authors.
However, a number of authors, partly reviewed
below, have touched upon the biodiversity
and cultural value of aquatic resources in the
Mekong Basin.
2.2.2.1 Biodiversityvalues
The biodiversity of the Mekong supports
ecosystems and the way they function, which

��� Tropical river fisheries valuaTion: background papers To a global synThesis
in turn supports the people that depend upon
these ecosystems. These services can be
regarded as ‘free’ in that they are not traded in
markets3, and Poulsen et al. (2002) highlighted
the importance of these alternative values.
The Mekong system demonstrates a high
level of overall biodiversity, the third worldwide
after the Amazon and the Zaire (Dudgeon
2000). Estimates of inland fish biodiversity
(Baran 2005) range from 758 freshwater
species according to FishBase 20044 (Froese
and Pauly 2000) to 1,500 species (MRC
2004a), with a high rate of endemic species
and more fish families than any other river
system (64 according to FishBase 2004 and
91 according to the MFD 2003). This aquatic
biodiversity includes particular endemic and
iconic species such as the Giant catfish
(Pangasionodon gigas), the largest freshwater
fish, which can reach 300 kg (Hogan et al.
2004), the giant Mekong carp (Catlocarpio
siamensis), the seven-line barb (Probarbus
jullieni), Mekongina erythrospila, an icon in
northern Cambodia, and three freshwater
dolphin species (Orcaella brevirostris, Sotalia
chinensis, Neophocaena phocanoïdes), with
O. brevirostris being a significant tourist
attraction in southern Laos and northern
Cambodia, although its number has drastically
declined to about 40 individuals (Baird and
Beasley 2005).
The fish biodiversity is presented in the table below.
Dudgeon (2003) showed that the Mekong freshwater biodiversity is scientifically undervalued, with less than 0.1 per cent of freshwater biology papers published in international journals dealing with the conservation of biodiversity in tropical Asian inland waters. More holistically, the WWF has recently undertaken a valuation of the positive aspects of flooding (Hardner et al. 2002; Mollot et al. 2003) while a joint IUCN/MRC/UNDP project focusing on wetlands management puts the local cultural dimension of aquatic resources at the heart of conservation efforts5. In Vietnam, Hashimoto (2001) also detailed in an extensive review the multiple ecosystem values of flooding.
2.2.2.2Culturalvalues
The cultural value of fish in Southeast Asia was
comprehensively analyzed in Ivanoff (2003).
Southeast Asia in particular is symbolized by
the nutritional trilogy of rice, fish and salt (the
latter two being united through brine, i.e., fish
Table � freshwater fish species richness in the Mekong riparian countries
LocationNumber of
freshwater fish speciesSource Comment
Yunnan province, China
130 species Yang 1996 See section 3.
8 species MFD 2003 Unrealistically low
Lao PDR 587 species FishBase 2004
Thailand 482 speciesCalculated from FishBase; no other assessment known for the Thai Mekong Basin
Cambodia477 species FishBase 2004
440 species MFD 2003
Vietnam
273 species MFD 2003Vietnamese Mekong only; also 222 brackish and marine species
145 fish taxa Vo et al. 2003Freshwater areas of the Mekong Delta. Also 14 shrimp taxa
3 As noted by Maris (2005), free ecosystem services such as clean drinking water remain unaccounted for in official statistics, whereas an increased demand for bottled water due to scarcity or pollution in streams appears as an increase in production, trade and GDP figures, in short as a progress.
4 See www.fishbase.org5 See www.mekongwetlands.org

chapTer � ���
6 Currently P. gigas, although extremely rare and critically endangered, is still traded from Cambodia to Thailand, where it has a high value for its supposed virilizing properties.
sauce). The importance and omnipresence
of fish is illustrated by a number of proverbs
known by all: for instance, “In water there is
fish; in rice fields there is rice” in Thai; “Where
there is water, there is fish” in Khmer, and
“Nothing is better than rice eaten with fish;
nothing is better than the love of a mother”
in Vietnamese. This daily contribution to life
and meals paradoxically gives little value to
fish and a low status in the hierarchy of values
attached to foods (Levy-Ward 1993). Despite
the everyday nature of fish, men have not
developed a strong emotional, symbolical or
mythical relationship with fish (Ivanoff 2003),
which might be reflected in the recurrent
claim for a better valuation of fish and aquatic
resources.
In terms of religion, fish play a very limited
role. Some ceremonies can be mentioned;
for instance, in Thailand where snakehead
fish were sacrificed in the river to call for rain,
or in Laos where large catfishes including
Pangasius gigas and Pangasius sanitwongsei
were consumed after rituals were performed
(Davidson 1975; Ivanoff 2003) 6. Overall, fish is
considered a very common food and as such
does not enter much into the symbolic and
ritual realms (buffaloes, oxen and chickens
being preferred as offerings). In traditional
medicine, fish is considered a cold meal of
feminine nature.
Traditionally, freshwater fish have always
been preferred to marine fish, whether in
Europe or Southeast Asia. On the culinary
side, freshwater fish are considered in the
peninsula to be soft, sweet and subtle, in
contrast to marine fish. In Cambodia, for
instance, freshwater fish are said to “mien
khlanh tchngang” (have tasty fat) whereas
marine fish are considered “ch’ap” (not
attractive) (Giteau and Martin 1995).
On the psychological side, traditional rice
farmers who master irrigation have regarded
the sea as being wild, unmanageable,
unpredictable and somehow devilish; thus,
marine fishes are not positively connoted. On
the contrary, freshwater (“sweetwater” as it is
often translated from regional languages) is
close to man and bears culture (cf. the role
of irrigation in the Angkor kingdom; Kummu
2003); freshwater fishes are thus seen much
more positively. In fact, fish are part of a scale
of values based on geographical proximity,
decreasing from the vicinity of the house
(rice fields) to further surroundings (streams
and lakes) and ultimately far away (the sea
and then foreign countries). This decreasing
value, from highly valued black floodplain fish
(snakehead, climbing perch, etc., generically
“cá song” in Vietnamese) found in nearby rice
fields and ponds to somehow less valuable
long-distance migrants from the Mekong (“cá
dong” in Vietnamese) and then to marine
species, can be seen as paralleled to the
gradient from domesticated to wild, from
the water control essential to a civilization of
farmers to nature, unpredictability and danger.
This symbolic gradient in values could also
help to explain the strong undervaluation of
Mekong River fishes, whereas aquaculture is
mentioned by all even though it is quantitatively
and economically much less significant.
Cambodia is probably the country where the
historical and cultural importance of fish is
best illustrated. The famous Chinese traveler
Chou Ta Kuan noted in the 13th century the
exceptional importance of fish in the life of
the Angkor people, as depicted in multiple
bas-reliefs particularly in Angkor Wat and
Bayon temples (Voeun 2004). More recently,
the notion of indirect use values underlies the
1997 declaration of the Tonle Sap area as a
UNESCO biosphere reserve. These values,
detailed by Bonheur (2001), and Bonheur and
Lane (2002), include Khmer cultural identity
and the values of biodiversity conservation.

��0 Tropical river fisheries valuaTion: background papers To a global synThesis
Touch and Todd (2003), and Torell et al. (2004)
have also highlighted the non-use values of
aquatic and wetland resources. Even among
Cambodians who have immigrated to Brittany
(France) and been exposed to abundant
marine fish, freshwater fish remain much
preferred, although they are in short supply
and more expensive (Simon-Barouh 1993).
These immigrants even continue fishing
for wild fish stranded in drying peri-urban
wetlands in summer, just like in Cambodia in
the dry season, as detailed by Khin (1993).
Southern Laos provides another example of
how aquatic biodiversity and livelihoods can
intertwine in the basin, and the activities of
fishing communities driven by seasonal and
ecological changes have been described
in particular by Roberts and Baird (1995),
Claridge et al. (1997) and Daconto (2001).
A lot can be said about the conversion
of fish into fish paste (pha-ak in Thailand,
prahok in Cambodia), and fish sauce (nam
pla in Thailand, pa dek in Laos, teuk trey in
Cambodia, nuoc mam in Vietnam). However,
this would go beyond the scope of this
review. Nevertheless, it can be noted that
the stronger the consumer’s feeling about
these foods, the closer he/she is to his/her
countryside roots. (Conversely, fish sauce is
not favored among those preferring a modern
lifestyle.) In this sense, these fish-based foods
are elements of cultural identity. Another
cultural fact is that the taste for nuoc mam
in Vietnam is a trait anterior to the extension
of the Chinese culture in this country, as the
Chinese influence is traced by soy sauce,
never by fish sauce (Gourou 1984). Thus, fish
is an important element in the economy as it
allows food self-sufficiency and then becomes
a vector of trade and cultural exchange.
Although women are largely involved in
fishing, aquaculture, processing and fish
trade all over the Basin, the gender issues
in Mekong fisheries have surprisingly almost
never been addressed. This fact is highlighted
by Nandeesha (2001) and Matics (2001), and
further documented by Suntornratana and
Visser (2003), who quantitatively show that
experience in fishing for men and women is
not much different, but that the knowledge of
the latter is sought after in only two per cent of
questionnaires at most. They also show that,
unlike men, women often catch and collect
fish and other aquatic animals all year round
owing to their responsibilities for the food
security of the family; they could thus provide
a more complete and accurate picture of the
inland fisheries.
Despite the paradox of high importance and
low cultural recognition, the value of river
fish for Mekong people is expressed by a
number of monuments erected to fish or
more specifically emblematic fish species.
Thus, having large statues of fish in the
middle of public squares is not uncommon in
Cambodia; for instance, with “Trey kolriang”,
the giant barb, (Catlocarpio siamensis)
honored in Kampong Chhnang or “Trey pase
ee” (Mekongina erythrospila) iconized in
Stung Treng. However, the largest monument
praising a fish species in the Mekong Basin,
and probably one of the biggest in the world,
is certainly the fourteen-meter high stainless
steel and granite monument erected in Chau
Doc (Vietnam Delta), which displays eleven
catfishes (two large “Ca basa”, Pangasius
bocourti), and nine “Ca tra” Pangasius
figure �: Mekong catfish monument, chau doc, vietnam.
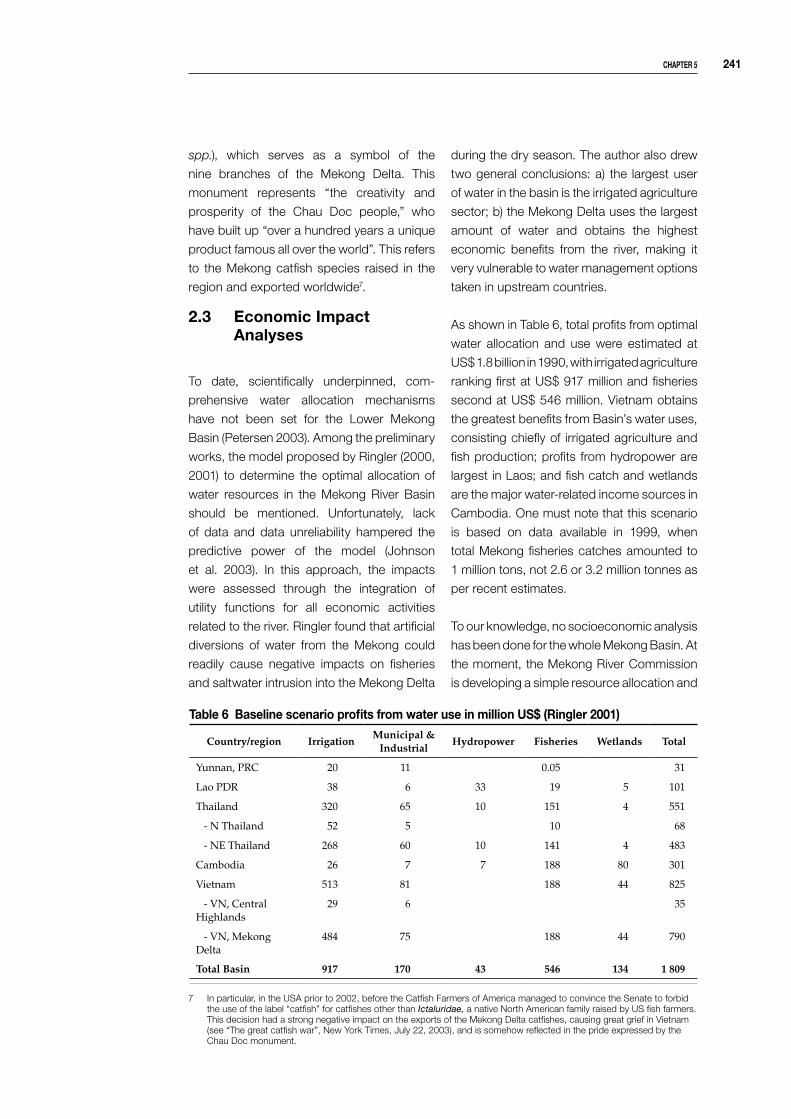
chapTer � ��1
7 In particular, in the USA prior to 2002, before the Catfish Farmers of America managed to convince the Senate to forbid the use of the label “catfish” for catfishes other than Ictaluridae, a native North American family raised by US fish farmers. This decision had a strong negative impact on the exports of the Mekong Delta catfishes, causing great grief in Vietnam (see “The great catfish war”, New York Times, July 22, 2003), and is somehow reflected in the pride expressed by the Chau Doc monument.
Table � baseline scenario profits from water use in million us$ (ringler �001)
Country/region IrrigationMunicipal &
Industrial Hydropower Fisheries Wetlands Total
Yunnan, PRC 20 11 0.05 31
Lao PDR 38 6 33 19 5 101
Thailand 320 65 10 151 4 551
- N Thailand 52 5 10 68
- NE Thailand 268 60 10 141 4 483
Cambodia 26 7 7 188 80 301
Vietnam 513 81 188 44 825
- VN, Central Highlands
29 6 35
- VN, Mekong Delta
484 75 188 44 790
Total Basin 917 170 43 546 134 1 809
spp.), which serves as a symbol of the
nine branches of the Mekong Delta. This
monument represents “the creativity and
prosperity of the Chau Doc people,” who
have built up “over a hundred years a unique
product famous all over the world”. This refers
to the Mekong catfish species raised in the
region and exported worldwide7.
�.� economic impact analyses
To date, scientifically underpinned, com-
prehensive water allocation mechanisms
have not been set for the Lower Mekong
Basin (Petersen 2003). Among the preliminary
works, the model proposed by Ringler (2000,
2001) to determine the optimal allocation of
water resources in the Mekong River Basin
should be mentioned. Unfortunately, lack
of data and data unreliability hampered the
predictive power of the model (Johnson
et al. 2003). In this approach, the impacts
were assessed through the integration of
utility functions for all economic activities
related to the river. Ringler found that artificial
diversions of water from the Mekong could
readily cause negative impacts on fisheries
and saltwater intrusion into the Mekong Delta
during the dry season. The author also drew
two general conclusions: a) the largest user
of water in the basin is the irrigated agriculture
sector; b) the Mekong Delta uses the largest
amount of water and obtains the highest
economic benefits from the river, making it
very vulnerable to water management options
taken in upstream countries.
As shown in Table 6, total profits from optimal
water allocation and use were estimated at
US$ 1.8 billion in 1990, with irrigated agriculture
ranking first at US$ 917 million and fisheries
second at US$ 546 million. Vietnam obtains
the greatest benefits from Basin’s water uses,
consisting chiefly of irrigated agriculture and
fish production; profits from hydropower are
largest in Laos; and fish catch and wetlands
are the major water-related income sources in
Cambodia. One must note that this scenario
is based on data available in 1999, when
total Mekong fisheries catches amounted to
1 million tons, not 2.6 or 3.2 million tonnes as
per recent estimates.
To our knowledge, no socioeconomic analysis
has been done for the whole Mekong Basin. At
the moment, the Mekong River Commission
is developing a simple resource allocation and
��� Tropical river fisheries valuaTion: background papers To a global synThesis
optimization model (RAOM) similar to Ringler’s
model, but is drawing on recent hydrological
information to examine how water resources
in the LMB can be allocated among various
water-consuming activities and functions. The
values used to run the model are simply unit
estimates, and integration of environmental
flow requirements is in principle possible,
depending upon the progress that is made
with current valuation initiatives by partners
(Johnston et al. 2003).
The MRC and Halcrow Ltd. have also set
up a Decision Support Framework (DSF)
that consists of a suite of data analysis
software and models intended to assess
the magnitude and impact of changes in
the water-resource system (Halcrow 2004a).
This suite is based on a Knowledge Base,
which consists of interacting databases and
GIS layers and includes environmental and
socioeconomic impact analysis tools. These
tools allow macro-level sustainability analyses
and potentially impacted population analyses.
However, the nature and contents of these
tools are not detailed in the sixteen volumes
of documentation about the DSF, and the
“meaningful socioeconomic assessment of
future development scenarios will require a
more detailed set of data” than the current
MRC social Atlas, and “significant efforts
remain to assemble data sets to support
socioeconomic assessments” (Halcrow
2004b and c).
In terms of policy, Feng et al. (2004) analyzed
the conflicting needs of the riparian countries
and the current problems hampering the
development of a basinwide water allocation
model that would include China. Fox (2004)
highlighted the fact that the terms of the 1995
Mekong Agreement8, in line with international
laws governing transboundary watercourses,
actually refer to a watercourse rather than a
watershed despite the frequency of the word
“basin” and the catchment management
approach promoted by the MRC (Kristensen
2001). Thus, the watercourse definition would
rely solely on the aquatic element without
addressing the interdependencies between
riverine and terrestrial systems, whose
conservation is yet essential to sustainable
production (cf. flood pulse concept) and thus
sustained value.
However, the danger of focusing efforts on
controlling and redirecting water, overlooking
ecological processes, is that “local
communities will experience common pool
resource dilemmas around provision issues
long before states experience conflict over
appropriation of water” (Fox 2003). These
concerns are echoed by NSF (1998) and Smith
et al. (2005), who found that the diversity of
fisheries-related livelihood strategies is poorly
represented in practice by socioeconomic
analyses and policies, and called for a more
diverse and flexible range of measures that
secure both the benefits of aquatic resources
for poor people and conservation objectives.
Last, Bush and Hirsch (2005) show, from the
example of Laos, that diverse actors provide
statements of status and change in the
values of fisheries “that are both socially and
politically constructed as well as contingent
on the epistemological construction of their
knowledge of the fishery itself”.
�.� livelihood analyses
“Livelihood analysis” is understood here as
complementary to socioeconomic analysis,
with a focus on people-centered, dynamic
and adaptive approaches, with particular
attention paid to a range of capitals including
social capital and knowledge, and to non-
marketed aspects.
“Understanding livelihoods dependent on
inland fisheries” is the objective of a project
led by the WorldFish Center in three Mekong
8 Agreement on the Cooperation for the Sustainable Development of the Mekong River Basin signed by Cambodia, Laos, Thailand and Vietnam.
chapTer � ���
countries and in Bangladesh (Dixon et al.
2003). The purpose of this project (Sultana
et al. 2003a) was to characterize the primary
stakeholders and their livelihood strategies,
identify their dependence upon aquatic
resources, describe the nature and status
of those resources, and emphasize the
vulnerabilities of the poor in relation to loss or
mismanagement.
The analyses revealed that fisheries as a
common pool resource play a vital role in
rural livelihoods, particularly as contributors
to expenditure-saving and survival livelihood
strategies of the poor. More specifically,
Smith et al. (2005) think that in developing
countries, fishing can either be (i) a primary
livelihood of last resort, (ii) part of a diversified
semi-subsistence livelihood, (iii) a specialist
occupation, or (iv) part of a diversified
accumulation strategy.
In the Mekong Basin, the bulk of the catch
originates from part-time and subsistence
fishers rather than from those classified as
full-time fishers (Dixon et al. 2003). According
to the WorldFish study, in the three Lower
Mekong countries studied, the majority of
full-time fishers view themselves as very poor
and highly dependent on others for financing.
However, they are considered relatively less
vulnerable than the agriculture-based poor
who are more subject to seasonal scarcity
periods. The majority of part-time fishers also
consider themselves poor or very poor. The
third group of subsistence fishers includes
landless laborers, women, children and small
farmers. They include both the very poor
and the rich and in most cases are not fully
dependent upon the fisheries for income-
generation or subsistence. As such, they
are less likely to be deeply impacted by a
degradation of the wild resource. The fact
that inland fisheries are often regarded as an
activity for the poor but can also be regarded
as an activity for the more wealthy was noted
by Béné and Neiland (2003); this led Coates
et al. (2004) to call for a better understanding
of how fisheries and their management
contribute to, or are affected by, wealth
differentiation.
Consultations with local communities
allowed the identification of two main threats
to fisheries common to the three Mekong
countries: unsustainably high fishing pressure,
and degradation or loss of wetlands and
floodplain habitat. The latter was specified
as resulting from i) increased agricultural
activities (including deforestation and agro-
chemical pollution), and ii) modification of river
flows by flood control, drainage and irrigation
structures or hydropower schemes. Among
ongoing conflicts mentioned are competition
for fish and privatization of common property
resources for aquaculture development.
The threats to fisheries take place in a context
of limited knowledge, if not ignorance, about
the extent and importance of natural resources
in terms of overall household livelihood
strategies. The lack of detailed information
about the role of fisheries in livelihoods is
an immense disadvantage to poor people
as what is recorded is what is produced,
consumed and sold by the rich or less poor
people while the unrecorded products and
uses are those on which poor people depend.
Consequently, the resources of the poor are
not included in impact assessments (be they
environmental, economic or social) or taken
into account when making development
decisions (M. Torell, pers comm.). The usual
census approach, which consists of thinking in
terms of primary and secondary occupations,
further conceals the importance of diversified
activities, particularly of inland capture
fisheries to the livelihoods of the Mekong rural
poor (Dixon et al. 2003; Keskinen 2003).
In this regard, the most important initiatives in
the Basin are those that 1) integrate aquatic
resource values with livelihood values and
aquatic resources management in the policy

��� Tropical river fisheries valuaTion: background papers To a global synThesis
development process; 2) assess the role of
markets and market forces, including the
impact of international trade on fisheries
livelihoods; and 3) provide further in-depth
analysis of livelihood outcomes and impacts
related to planned and ongoing natural
resource management projects.
Participatory rural appraisal results also
showed that all of the above challenges
and threats to inland fisheries have already
reduced the livelihood base of poor people
and made them more vulnerable to hazards
from drought and flooding, natural declines of
the fish population, inadequate market access
and high population growth. However, the
study also concluded that in terms of pressing
issues, access to fisheries and threats to
aquatic resources come after personal and
communal poverty issues such as lack of rural
infrastructure (roads, clean water sources,
sanitation facilities, schools), lack of land for
farming rice, and crop pests. Normal flooding
is not a problem; only exceptional floods are.
�.� impact of changes on fisheries basinwide
Several factors make the future of Mekong
fisheries uncertain. These include preliminary
calculations suggesting a 20 per cent
increase in demand for fish in the LMB over
the next 10 years (Sverdrup-Jensen 2002),
combined with a major threat that fisheries
habitats will be reduced due to barriers to
migration, conversion of floodplains into
agricultural and urban areas, and changes
in natural flow regimes due to dams and
irrigation. Detailed below are some of the
major changes whose impacts have been at
least partly documented.
�.�.1 changes in flow regime
The degree of inundation in the Mekong
depends on the strength of the annual
monsoon, as 85-90 per cent of the discharge
is generated during the wet season. However,
the average wet season discharge in the last
twenty years (1979-98) appears to be at least
10 per cent lower than during 1924-56, while
the interannual variations have become more
extreme (Nam 2000). The downward trend
seems to be independent of fluctuations in
rainfall and therefore has been linked to dam
building activities that started in the late fifties
in the Basin (Van Zalinge et al. 2003). White
(2000) also identified dams as the projects
that pose the highest degree of systematic
risk to the region, under criteria that include
displacement of vulnerable people, impact
irreversibility, environmental impacts on
the mainstream river flow and quality, and
economic impacts. In addition, although
no literature was researched on this topic,
climate change and possible changes in
rainfall patterns could adversely affect the
flow regime of the Mekong.
According to the MRC (2003b), in the Mekong
Basin, thirteen hydropower dams of a capacity
higher than 10 megawatts existed in 2003: two
in China on the mainstream, five in Laos, four
in Thailand and two in Vietnam, the latter being
on tributaries, for a total production of 4,400
megawatts (15% of the Basin’s hydropower
potential estimated at 30,000 megawatts).
Many more are under construction or being
planned, including at least six in China and
“a number” in Laos, and there is “a positive
attitude towards hydropower development”
in Vietnam (MRC 2001), as attested by the
recent plans of Electricity of Vietnam to build
173 new hydroelectric power stations with a
total capacity of 2,296 MW to supplement
the existing 500 small and medium-sized
hydroelectric power stations9. No new major
dams are planned at the moment in Thailand
and Cambodia.
This assessment only refers to hydropower
dams of medium or large size that do not
9 Vietnam Economic Times, 4 August 2005
chapTer � ���
consume water but only alter the flow regime
and fragment aquatic habitats. However,
these dams are supplemented by thousands
of small irrigation reservoirs and weirs that
aim at extracting water from the river and thus
reduce flow, among other impacts. These
small schemes are not individually identified,
although they are quite visible on remote-
sensing maps, particularly in northeastern
Thailand (see for instance MRC 2003b). In
addition to existing ones, multiple smaller
schemes are being considered (including
15 dams for irrigation purposes, mainly in
Thailand and Vietnam). Overall, more than 130
potential sites for dams have been identified.
The impacts of dams on Mekong aquatic
resources have been highly debated (e.g.,
Roberts 1995; Siebert 2001; TERRA 2003;
FEER 2004). Hill and Hill (1994) first attempted
a thorough assessment of the consequences
of dams on Mekong fish and fisheries.
They highlighted the exceptional ecological
importance of the Khone Falls area, the
devastating consequences that a dam
across the Tonle Sap River would have, the
need to consider true run-of-the river dams
rather than blocking dams, and overall the
absence of appropriate information. In fact,
their review itself is hampered by a systematic
lack of data.
Ten years later, specific information on the
impacts of dams on fisheries is still lacking
and/or is of poor quality. In his review of the
Economic Impact Assessment of the Nam
Theun 2 dam in Laos, Wegner (1997) takes
note of the high value of indigenous fish
species and expresses concern that these
have not been considered adequately in the
impact assessment. Similarly, the World Bank
(in Amornsakchai et al. 2000) acknowledges
the fact that, for the Pak Mun dam in
Thailand, the lack of detailed baseline studies
on fisheries has made it difficult to estimate
fishery losses in the cost-benefit analysis of
the dam (see section 5.4). Bernacsek (1997a)
notes that aquatic impact assessments were
carried out before impoundment in only seven
cases out of 40 dams or reservoirs surveyed
in the basin.
In a scenario analysis prepared for the MRC,
Halcrow (2004d) estimated that the impact
of five additional large dams in the Lower
Mekong Basin would reduce the maximum
longitudinal fish migration network by only
1.6 per cent. However, among other flaws
and biases, the distances computed include
twice the length of large streams, with the
argument that “fishes migrate most commonly
along either river bank”! (op. cit., Appendix A).
Of course, this bias minimizes the calculated
impact of upstream dams on the whole river
network open to migrations.
A recent study (Podger et al. 2004) assessed
the impact of different water management
scenarios on flows and on a number of
indices, including a fish habitat availability
index (HAI). The study concluded that the
expected loss to the HAI ranges from 1 to
13 per cent for the area downstream from
Kratie in northern Cambodia. However, going
beyond benign relative values, Barlow (pers.
comm.) highlighted the fact that this is a
fraction of a huge resource amounting to 2.6
million tonnes (cf. Table II) and showed by a
pro-rata calculation that this limited relative
reduction would correspond, in Cambodia
and Vietnam alone, to a loss of 15,000-
199,000 tonnes with a monetary value of
US$ 10-135 million a year. The livelihood value
of this fraction is not detailed.
The negative effects of dams on inland fisheries
have been extensively described (WCD 2000)
and alternatives or mitigation measures such
as fish ladders have been proposed. Warren
and Mattson (2000) expressed reservations
about the efficiency of such mitigation
measures in the Mekong context; Roberts
(2001a) confirmed the inefficiency of the Pak
Mun dam fish ladder and Baran et al. (2001b)
��� Tropical river fisheries valuaTion: background papers To a global synThesis
showed that the intensity of migrations (e.g.,
30 tonnes of fish caught per hour in the Tonle
Sap River during the migration peak) makes
fish ways unrealistic in most main channels
(Jensen 2001c).
One of the issues that has recently surfaced
is the trapping of sediments and the reduced
flow speed that results from dams, particularly
those across the mainstream (Sarkkula et al.
2003; Kummu et al. 2005). Analyses detailed
in Plinston and He (2000) showed that about
half the sediment reaching the Mekong Delta
derives from the Upper Mekong in China.
A scenario analysis showed, particularly
through mapping of sediment concentrations
and sedimentation rates, that flow reduction
and sediment trapping by the Chinese dams
on the Mekong would have a dramatic impact
on the net sedimentation and productivity of
the Tonle Sap Lake (Sarkkula et al. 2003).
Following additional studies, the impact
of Mekong dams on sedimentation and
productivity basinwide will be better quantified
by 2006 (Sarkkula et al. 2005).
On the positive side of dam building, additional
water reservoirs increase fish production
locally (Lagler 1976, Bernacsek 1997b). The
latter author gives an equation predicting the
catch of a new reservoir as follows:
Catch in tonnes.year-1 = 1.877x(Reservoir area in km2) – 12x(mean depth in m) + 0.03835x(Affluent inflow volume in mcm.y-1)
It should be noted, however, that i) this
equation does not integrate the loss in
wild fish production down the reservoir (as
demonstrated in southern Laos by Lorenzen
et al. 2000), and ii) the biological productivity
generated by this environmental modification
is often concomitant with significant social
changes in fisheries, particularly in terms of
access rights, wealth distribution and equity
(WCD 2000; Hirji and Panella 2003).
Among the beneficial impacts of damming
are the increased dry season flows that
would oppose the annual saline intrusion
hampering rice culture in the delta (Feng et
al. 2004). However, the saline intrusion is also
highly beneficial to fish production (abundant
coastal fishes entering the delta) and shrimp
aquaculture (one kilogram of shrimp being
worth about 50 kg of rice), and the trade-offs
between these different commodities and
their underlying socioeconomic implications
remain to be assessed (Baran et al. 2006).
The impact of Chinese dams is also feared in
the Mekong Delta; yet, according to Nguyen
(2003), the hydrologic impacts of the Manwan
dam observed in northern Laos are not
perceptible in the Mekong Delta. However, the
impact of reduced flows and sediment input
on the productivity of Vietnamese coastal
fisheries is surprisingly never mentioned,
although it was already highlighted by Chevey
(1933) seventy years ago. The impacts of
dams on coastal fisheries have proven very
significant in a number of countries, and
assessing them in the case of new damming
plans is a recurrent recommendation (Vidy
et al. 2000; Blaber 2002; Dugan et al. 2002;
Arthington et al. 2004).
�.�.� changes in fishing patterns
Disruptive fishing methods, such as explosives,
mosquito nets, electric fishing and poisoning,
as well as overfishing are commonly reported
in the region, and their actual impact is heavily
debated. Bao et al. (2001) claimed that most
Mekong fish species reach sexual maturity
early, lay a great amount of rapidly developing
eggs, and are more sensitive to environmental
change than to overfishing. In Cambodia,
however, the dominance of these low-value
opportunists is thought to be increasing as
a result of overexploitation (Srun Lim Song
pers. comm.).

chapTer � ���
It should also be noted that the evolution of
the size of fish caught is a parameter that
should be integrated into valuation studies
(Van Zalinge and Nao 1999). Year after
year, total catches seem to contain a higher
proportion of less valuable small fish and a
lower proportion of medium- and large-sized
fish of high economic value. This evolution
is similar to that of other freshwater fisheries
(Welcomme 1995), but the economic impact
of this evolution, invisible in global statistics,
has never been assessed. The positive
consequences for food security of a larger
share of small fish of high nutritional value (as
detailed in section 2.2.1.3) have likewise never
been assessed.
Fishing patterns are also driven by the
demand for fish, which is itself partly driven
by aquaculture, whose activities are net
consumers of fish (fry and feed of carnivores
coming from the wild; Phillips 2002).
Small-scale aquaculture can contribute to
environmental improvement; for example,
aquaculture ponds contribute to dry season
water storage and recycling of agricultural
wastes. However, under dual environmental
and exploitation constraints, the Basin
capture fisheries are likely to decline much
faster than aquaculture can expand. This
would obliterate gains made by expanding
fish farming (Coates et al. 2003). It should
also be noted that small scale aquaculture
is generally not an activity taken up by the
poorest because of fundamental limits of
capital (Bush 2003a; Keskinen 2003; Vo et
al. 2003)
�.�.� changes in political agendas
Inland capture fisheries are characterized by
diversity not only in the range of gears and
target species but also in social and cultural
environments. This complexity is reflected
in the nature of the data collected and then
analyzed in view of management.
According to Coates (2002, 2003), most
published figures for inland capture fisheries
in Southeast Asia do not actually qualify as
statistics because they are not based upon
data. Inland capture fisheries are clearly
seriously underreported by 250 to 360 per
cent in all countries in the Mekong Basin.
Major sources of bias in official statistics
include underestimates of the importance of
small-scale fishing activities and misreporting
by government officials. Other biases
include inadequacies in recording the level
of participation in capture fisheries and lack
of attention to biodiversity considerations
and livelihood aspects. In addition, there
is a general disinterest in accuracy. More
generally, Hirsch (2004) highlighted the
different and often conflicting values inherent
to the environmental, biological, economic,
social or political approach to fisheries, and
similarly the opposing values conveyed by
governments, institutions, the private sector
or NGOs.
Bush (2004a) studied three fisheries pro-
duction meta-statistics from the Association
of Southeast Asian Nations, the MRC and
the Lao government. He concluded that the
three examples of fishery production meta-
statistics highlighted the differences in the
political agendas of the different organizations
with a stake in the management of the
resource. The estimates were not sensitive to
the causes of deficit or surplus and, therefore,
promoted policy responses that were
inappropriate and potentially damaging.
3. YUNNAN PROVINCE, PEOPLE’S REPUbLIC OF CHINA
Yunnan Province has a surface area of
397,000 km2 and a population of about
42 million, 81.7 per cent of it being rural
(population density: 107 persons/km2). The
10 Other socioeconomic indicators provided by the ADB and UNEP are not Yunnan-specific but refer to the entire country.

��� Tropical river fisheries valuaTion: background papers To a global synThesis
province remains poorly developed, with
a per capita GDP of US$ 565 in 2000 (but
only US$ 180/year for rural dwellers). The
population growth reaches 1.2 per cent per
year (2000 data in ADB/UNEP 200410). With
10 per cent of the total Lancang River Basin
population living below or just above the
poverty line, this region is one of the poorest
areas in Yunnan and in China (ADB 2000). In
fact, the productivity and standard of living
in the seven prefectures of Yunnan along
the Mekong River are below the provincial
average, itself below the national average
(Makkonen 2005).
This mountainous province (from 6,740 meters down to 76 meters in altitude (MRC 1997) is considered the biodiversity-rich garden of China, with 18,000 plant species (more than half China’s total), extensive forest cover (32.4% of the land area) and a large number of protected areas as well (6.9% of the province surface). One can note, however, that these protected areas are terrestrial and that the Mekong mainstream and its banks are systematically excluded from these areas11.
Statistics and figures for Yunnan and the Upper Mekong are difficult to find (NSF 1998; Chapman and He 2000; Buncha Apai 2003), as confirmed by the brief description above. There is not enough information available in English about the Chinese section of the
Mekong River (named Lancang or Lancang Jiang in Mandarin) to develop a full chapter similar to those on the other riparian countries. Most of the information about the hydrological characteristics of the river, its biodiversity, fisheries and development plans are supposedly in Chinese languages, and apart from a number of articles originating from conservation NGOs, very few scientific documents could be found12.
Twenty-one per cent of the Mekong Basin area lies in China (Feng et al. 2004), and the Chinese section of the Mekong River contributes 45 per cent of the dry season flow in Cambodia (Goh 2004). But for Yunnan alone, the Mekong Basin covers 165,000 km2 or 38 per cent of the province, and this section of the river contributes 16 per cent of the average annual flow of the whole Mekong volume (MRC 2003b).
He and Hsiang (1997) gave a geographical and hydrological description of the Lancang River. In its most upper part, the river is small and often flows through deep valleys. Development targets are mainly animal husbandry, forestry and, to a certain extent, tourism, whereas the development targets for the middle and upper reaches of the river are hydropower generation and mining, supplemented by irrigation and tourism. Fishing is not a dominant activity in this region (personal obs.; Heinonen and Vainio-Mattila 1999). The overall fish production in Yunnan has been estimated at approximately to 25,000 tonnes (Xie and Li 2003) and capture fishery labor in this province involves about 15,000 persons (ibid.).
Four hundred and thirty-two fish species are
recorded in Yunnan, and 130 species are
found in the Chinese section of the Mekong
River (Yang 1996). These species are
characteristic of headwaters, rapids and high
streams. Most of them are short-distance
migrants. A strong decline in fish biodiversity
is noted; 280 species have become rare or
figure �: Map of theyunnan province, in china
11 Map of existing and proposed nature reserves in Yunnan by the Nature Conservancy and the Yunnan Provincial Government; brochure of the project “Yunnan great rivers action plan”; Yunnan eco-network, Kunming, China (2001).
12 See, however, the Asian International Rivers Center: http://www.lancang-mekong.org).

chapTer � ���
Table �: selected economic indicators for the lao pdr from �000 to �00� (World bank web site)
Economic indicator 2000 2001 2002 2003
Agriculture (% of GDP) 52.81 50.89
Industry (% of GDP) 23.01 23.44
Services (% of GDP) 24.17 25.67
GDP (billion US$) 1.71 1.75 1.83 2.04
GDP growth (%) 5.81 5.68 5.00 5.00
Aid per capita (US$) 53.38 45.38 50.32
Population growth (%) 2.32 2.32 2.32 2.32
Population total (millions) 5.28 5.40 5.53 5.66
have not been found in the past five years
(ibid.). This region is also characterized by
massive introduction programs, of 34 species
overall, that have had a strong negative impact
on native species, particularly in lakes.
The Mekong River Commission (2003b)
detailed the hydropower development plans
in the Lancang River Basin, which consist
of a cascade of eight dams totaling 15,550
megawatts (dam characteristics in Plinston
and He 2000). The possible consequences
of these dams on fishery production have
been mentioned in the above section.
Other environmental impacts were reviewed
in Roberts (1995), NSF (1998), Roberts
(2001b), He and Chen (2002), and Osborne
(2004). However, it is also argued that the
development of the Lancang mainstream
cascade dams would have a much higher
economic benefit and lower impact on
ecosystems than a (hypothetical) series of
dams on the lower Mekong (He and Hsiang
1997; He and Chen 2002).
In addition to the dams, China has initiated a
navigation improvement project in the Upper
Mekong River that includes dredging and
blasting rapids of the Upper Mekong River
(21 reefs and rapids to be blasted in phase 1
along a 360 km stretch to provide access to
100-tonne ships, and 90 to 100 additional
reefs and rapids to be blasted in phase 2 for
300-tonne ships). The project has been heavily
criticized in particular for incomplete and
biased assessment of the potential impacts
on the river’s fisheries (McDowall 2002) and
its biodiversity (Campbell 2003). Regarding
fisheries, the first concrete evidence of
changes consists of a drastic increase in
water fluctuation in northern Thailand. These
large daily fluctuations prevent fishers from
operating their gears normally, alter migration
patterns, and have reportedly reduced the fish
catch in the area by 50 per cent (Sretthachau
and Deetes 2004).
4. LAO PEOPLE’S DEMOCRATIC REPUbLIC
�.1 country overview
The Lao PDR has a population of about 5.1
million. Approximately 77 per cent of this
population lives in rural areas, and 40 per
cent lives below the World Bank poverty line.
Annual per capita GDP was estimated at US$
280 in 1999. The main economic sector in the
Lao PDR is agriculture, accounting for 52.6
per cent of the national GDP. However, the
overall importance of agriculture is declining
as industry and services increase. Selected
economic indicators for the Lao PDR are
summarized in Table 7.
Wood products contributed 34 per cent and
manufactures 23 per cent to the total exports
of US$ 337 million in 1998. By contrast, the
agricultural sector contributed only 2.4 per cent
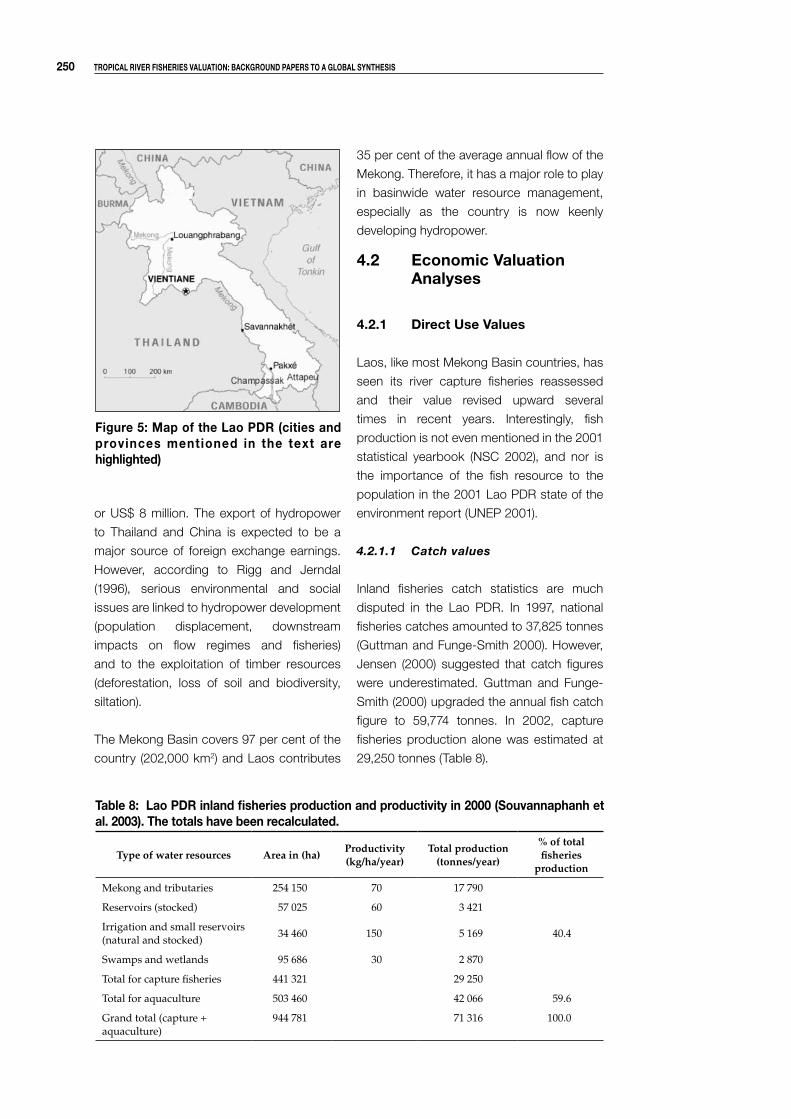
��0 Tropical river fisheries valuaTion: background papers To a global synThesis
or US$ 8 million. The export of hydropower
to Thailand and China is expected to be a
major source of foreign exchange earnings.
However, according to Rigg and Jerndal
(1996), serious environmental and social
issues are linked to hydropower development
(population displacement, downstream
impacts on flow regimes and fisheries)
and to the exploitation of timber resources
(deforestation, loss of soil and biodiversity,
siltation).
The Mekong Basin covers 97 per cent of the
country (202,000 km2) and Laos contributes
35 per cent of the average annual flow of the
Mekong. Therefore, it has a major role to play
in basinwide water resource management,
especially as the country is now keenly
developing hydropower.
�.� economic valuation analyses
�.�.1 direct use values
Laos, like most Mekong Basin countries, has
seen its river capture fisheries reassessed
and their value revised upward several
times in recent years. Interestingly, fish
production is not even mentioned in the 2001
statistical yearbook (NSC 2002), and nor is
the importance of the fish resource to the
population in the 2001 Lao PDR state of the
environment report (UNEP 2001).
4.2.1.1 Catchvalues
Inland fisheries catch statistics are much
disputed in the Lao PDR. In 1997, national
fisheries catches amounted to 37,825 tonnes
(Guttman and Funge-Smith 2000). However,
Jensen (2000) suggested that catch figures
were underestimated. Guttman and Funge-
Smith (2000) upgraded the annual fish catch
figure to 59,774 tonnes. In 2002, capture
fisheries production alone was estimated at
29,250 tonnes (Table 8).
figure �: Map of the lao pdr (cities and provinces mentioned in the text are highlighted)
Table �: lao pdr inland fisheries production and productivity in �000 (souvannaphanh et al. �00�). The totals have been recalculated.
Type of water resources Area in (ha)Productivity (kg/ha/year)
Total production (tonnes/year)
% of total fisheries
production
Mekong and tributaries 254 150 70 17 790
40.4
Reservoirs (stocked) 57 025 60 3 421
Irrigation and small reservoirs(natural and stocked)
34 460 150 5 169
Swamps and wetlands 95 686 30 2 870
Total for capture fisheries 441 321 29 250
Total for aquaculture 503 460 42 066 59.6
Grand total (capture + aquaculture)
944 781 71 316 100.0

chapTer � ��1
13 The 1998/99 Lao Agricultural Census estimated that 8.3 per cent of agricultural holdings were engaged in aquaculture (ACO 2000). However, according to Lorenzen et al. (2003b), “Household surveys in different rural areas of Lao PDR have yielded a consistent estimate of about 2% of households engaging in private aquaculture, with an average pond size of 0.12 ha. Scaled up to about 1 million households, this gives a pond area estimate of just 2,400 ha that, with a realistic average production estimate of 650 kg/ha/year, gives a total production of no more than 1,560 tonnes.”
Table �: estimates of capture fisheries and aquaculture production in the lao pdr (lorenzen et al. �00�b)
Type of water resources Area in (ha)Productivity (kg/ha/year)
Total production (tonnes/year)
% of total fisheries
production
Mekong and tributaries 254 150 70 17 790
78
Reservoirs (stocked) 57 025 60 3 421
Irrigation and small reservoir(natural and stocked)
34 460 150 5 169
Swamps and wetlands 95 686 150 14 352
Rice paddies and floodplain 477 176 50 23 858
Total for capture fisheries 441 321 64 593
Total for aquaculture 503 460 17 911 22
Grand total (Capture + aquaculture)
944 781 82 504 100
The latest estimates, integrating rice paddies,
amount to 82,500 tonnes, including 64,600
tonnes from capture fisheries (Lorenzen et
al. 2003b), which accounts for 78 per cent
of the country’s fish production (Table 9).
The authors believe the share of aquaculture
remains grossly overestimated13.
The highest estimate of fish production is
given by Sjorslev (2001a), who concluded
that fish consumption alone (excluding
trade with neighboring countries) amounts to
204,800 tonnes annually. This figure, based
on raw consumption studies, is much higher
than that of other authors.
4.2.1.2 Marketvalues
The gross value of fisheries output is estimated
at around US$ 48 million, commercial capture
fisheries contributing approximately four
per cent of GDP and subsistence fisheries
another two per cent (Lorenzen et al. 2003a
and 2003b). Souvannaphanh et al. (2003)
consider that fisheries account for about
eight per cent of national GDP. According
to Emerton and Bos (2004) quoting STEA
(2003), fish and other aquatic animals are
worth US$ 100 million a year. The LARReC
Medium Term Plan 2000-2005 estimates the
value of total annual aquatic production to
be approximately US$ 66 million, excluding
aquatic plants.
This estimate is based on the average market value of fish/frog/turtle (wet weight) at US$ 0.66 per kg. According to Lorenzen et al. (2000), fish in local markets costs between US$ 0.5 per kg for small trash fish and US$ 1.5-2.5 per kg for larger fish. As household catches consist of about one third small and two-thirds of large fish, the average value reaches US$ 1.5 per kg. More recently, Bush (2003b) gave a value for the overall average price of capture species in three lowland districts at US$ 1.14 per kg, which was superior to the average value of aquaculture species (US$ 0.98 per kg).
An alternative value of the fish consumed in Laos is detailed in Table 10.
The fish trade analysis was pioneered in Laos
by Baird (1994), who monitored the local
and seasonal trade of Probarbus julleni and
Probarbus labeamajor (two highly migratory
protected species) between southern Laos

��� Tropical river fisheries valuaTion: background papers To a global synThesis
(Champassak), northern Cambodia and
Thailand. Baird estimated the value of fish
traded in the district at US$1 million per
year. However, Phonvisay and Bush (2001)
deepened the study and concluded that
435 tonnes of fish are traded annually from
Siphandone district to the main markets in
Pakse and Thailand. At an average value
of 9,500 kip/kg, they valued this trade at
around US$ 440,000. The study also led to
the conclusion that about 87 tonnes of fish is
imported every year from northern Cambodia
to southern Laos.
In a study of five Vientiane markets, Phonvisay
(2001) found that nearly 6 tonnes of fresh
fish are traded daily. Out of this, nearly 1.8
tonnes come from Thailand, for a value of up
to 5.188 billion kip or US$ 576,700 per year.
At least 405 kg of fermented or processed
fish is also traded daily and supplemented
by about 146 kg of dry fish. Still in Vientiane,
Gerrard (2004) showed in her analysis of the
values of an urban wetland that the capture
fisheries component of this wetland alone is
worth US$ 1.1 million a year (more than half of
its use value). The value of these resources in
more urban villages also tends to be greater
in both relative and absolute terms.
4.2.1.3 Consumptionvalues
The fish catch is important for consumption,
particularly in the southern Lao provinces, and
fermented fish (pa dek) is a significant staple
diet in all villages, particularly during periods
of low fish abundance or peak agricultural
labor requirements.
The consumption of aquatic products in Laos
has been addressed in a number of studies.
Available figures are summarized in the
following Table 11.
A quick analysis of the data in Table 11 shows
that i) figures related to consumption of living
aquatic resources in Laos have increased
considerably over the years, reflecting an
increasing knowledge illustrated by a growing
number of studies; ii) official figures are
much lower than those based on scientific
studies14; and iii) that fish consumption seems
to be highest in Champassak Province,
characterized by extensive wetlands, although
other central and northern provinces also
exhibit relatively high consumption figures.
In Khong District (Champasack Province),
Baird et al. (1998) estimated the average
14 Bush and Hirsch (2005) pointed out a certain confusion in statistics or assessments by the Department of Livestock and Fisheries, which are not based on field surveys and hard data.
Table 10: value of the fish consumed in laos (1���-��), cited in souvannaphanh et al. �00�) (The figures have been recalculated because currently us$ 1 is worth approximately 10,000 kip, but early in 1��� us$ 1 was worth approximately 1,�00 kip.)
Consumption value,in million kip
Consumption value,in US$ (2005 change rate)
Fresh fish 30 750 3 075 000
Canned fish 1 237 124 000
Frozen fish 1 351 135 000
Dried fish 2 183 218 000
Prawns, crabs etc. 1 853 185 000
Fermented fish 2 934 293 000
Preserved fish 755 76 000
Others 4 995 500 000
Total (rounded up) 46 000 4 600 000

chapTer � ���
Table 11: per capita consumption of fish and other aquatic resourcesFigure Source Comment
7 kg of fish/person/year Phonvisay 1994, cited in Bush 2002
Early government estimate originating from a figure provided by USAID in 1972
4.7 kg of fish/person/year in urban areas
Household surveys (1992-93 and 1997) National Statistics Center 1998; cited in Souvannaphanh et al. 2003
Figures based on a sampling of 2,940 households from 147 villages. Three facts make these figures very unlikely: i) in countries with rich natural resources and limited communication networks, consumption of aquatic resources is usually higher in rural areas than in urban areas; ii) these figures are extremely low compared to all other estimates; and iii) fish is usually much more abundant than other aquatic animals such as shrimps, frog, etc.
4.4 kg of aquatic animals/person/year in urban areas
2.5 kg of fish /person/year in rural areas
2.8 kg of aquatic animals/person/year in rural areas
17.1 kg of aquatic products/person/year
FAO PADP 1998 cited in Guttman and Funge-Smith 2000
Oudomxay Province (northern hilly province bordering the Mekong)
24.2 kg of aquatic products/person/year
Savannakhet Province (southern province bordering the Mekong)
15.1 kg of aquatic products/person/year
Sayaboury Province (central province bordering the Mekong)
21.2 kg of aquatic products/person/year
Sekong Province (southern province away from the Mekong mainstream)
25.6 kg of aquatic products/person/year
Xieng Khouang Province (central hilly province away from the Mekong mainstream)
42 kg of fish/person/year Baird et al. 1998 Khong District, Champassak Province (in the Khone Falls area)
8.5 kg of fish/person/year FAO 1999 Based on national statistics
17.5 kg of fish/person/year Garaway 1999 Savannakhet Province (southern province bordering the Mekong)
29 kg of fish and other aquatic animals/person/year
Sjorslev 2000 Luangprabang Province (northern hilly area)
61.1 kg of fresh fish/person/year Mattson et al. 2001 Around the Nam Ngum dam reservoir
50 kg/person/year of living aquatic resources
Singhanouvong and Phoutavong 2002.
Champassak Province (southern area including extensive wetlands)
19.9 kg of aquatic resources/person/year
Bush 2003b Figure based on a brief survey in Savannakhet Province. Annual figure inferred from the average daily consumption of 54.7g/day/person during the survey. Fresh fish makes 75 per cent of these aquatic resources, other aquatic organisms 23 per cent and processed fish 2 per cent.
11.8 kg of fish/person/year Calculated from Garaway 2005
Based on a one-year survey (103 households) in Savannakhet province in 1997-98
annual catch for a family at about 355 kg, of
which 249 kg was consumed. Mollot et al.
(2003) found an average household collection
of fish amounting to 704 kg per year in Attapeu
and Savannakhet Provinces.
The role of fish and other aquatic resources
in the diet of the Lao rural population was
detailed in Guttman and Funge-Smith (2000)
and Meusch et al. (2003) also highlighted the
deplorable nutritional status of the people in
Attapeu Province, as well as the importance

��� Tropical river fisheries valuaTion: background papers To a global synThesis
of aquatic resources in supplementing a
nutrient-poor diet. A table summarizing
available studies is provided in Table 12.
�.� socioeconomic analyses
In Laos, 2.7 million people live along a river
(MRC 2003b). The Agricultural Census
indicated that more than half the population of
the Lao PDR was engaged in capture fisheries
in one way or another15. In a detailed study,
Lorenzen et al. (2000) reported that wild fish
were more highly priced for their taste than
cultured species, and that participation in
fishing was predominant in rural households,
with more than 80 per cent of the households
in southern Lao PDR being involved (Lorenzen
et al. 2003). The same author (2000) showed
that in an average household, the use of
aquatic resources (with an estimated value
of US$ 90) accounted for about 20 per cent
of gross income (Lorenzen et al. 2003). On
average, 70 per cent of household fish supply
is caught by households themselves; less
than 20 per cent is purchased; and 10 per
cent is received as gifts, reciprocal exchange,
Table 1�: contribution of fish and aquatic resources to diet in the lao pdrPercentage in the diet Source Note
Fish accounts for approximately 78 per cent of the animal protein consumed.
Baird et al. 1998 Khong District, Champassak Province
Fish contributes 42.5 per cent of the animal proteins consumed.
FAO 1999 I.e., 8.5 kg of fish out of 20 kg of proteins. Average figure based on national statistics; however, this proportion can vary between 10 per cent among hill tribes and 90 per cent among the Lower Lao population.
Fish contributes 17 per cent of the agricultural production intended for home use.
LECS 2 (1999) cited in Guttman and Funge-Smith (2000)
Aquatic products contribute from 26.6 to 57.1 per cent of the total protein.
Guttman and Funge Smith 2000
Range over 6 rural provinces; average: 40.6 per cent
Fish and other aquatic animals account for 43 per cent of the total animal product consumption.
Sjorslev 2000 The study specifies that aquatic resources actually account for 55-59 per cent of the total animal intake if differences in the protein contents of various foods are integrated.
Fish is present in 52-95 per cent of all meals.
Baird 2001; Baird and Flaherty 2000
In Khong District, Champassak Province. Fish is also the largest source of cash income.
Fresh and processed fish contribute 56.3 per cent of the total animal protein intake.
Mattson et al. 2001 Around the Nam Ngum reservoir
Fish and other aquatic animals are present in 85 per cent of all meals.
Bush 2003b Savannakhet Province; figure based on a brief survey
Fish and other aquatic animals comprise between one-third and one-half of the total protein consumption at the national level.
Emerton and Bos (2004), quoting STEA (2003)
Fish contributes 18 per cent of food supply.
Mollot et al. 2003 Attapeu and Savannakhet Provinces
15 This figure is probably an underestimate as most rural people in the Lao PDR primarily consider themselves to be rice farmers, and this leaves fishing unnoticed although it is widely practiced by all. The fact that the importance of fisheries remains unnoticed by rural people themselves while it is objectively their major source of protein deserves greater attention (Bush, pers. comm.).
chapTer � ���
or payment in kind for labor (Lorenzen et al.
2003b; Garaway 2005).
Nguyen Khoa et al. (2003) showed that
the average household fishing effort was
consistent at about five hours per week,
but household catches were lower in weirs
(0.77 kg/week) than in dams (2.07 kg/week).
The authors indicated that the difference in
catches was likely to reflect differences in
the hydrology of weirs and dams depending
upon their location within watersheds.
On the trade side, the FAO (1999) reported
that almost the entire aquatic resource
production in the Lao PDR is consumed
within the country, with little or no fish
exports. However, Baird and Flaherty (2000)
and Bush (2002, 2004b) highlighted the fact
that the fisheries, until recently practiced by
remote, isolated and subsistence-oriented
people, are in fact becoming embedded in a
regional trade network that increasingly drives
local fishing pressure. In fact, a considerable
amount of catch from the Mekong River may
be landed in Thailand, where market prices
are higher (Lorenzen et al. 2003).
�.� livelihood analyses
The livelihood dimension of fisheries in central
and southern Laos has been highlighted by
several authors, particularly Roberts and Baird
(1995), Shoemaker et al. (2001), Friend (2001)
and Bush (2003a and web site16). Shoemaker
et al. (2001) showed how important the
contribution of the river to livelihoods was,
thanks to fishing, riverbank gardening, edible
and medicinal plants from river wetlands
and flooded areas, transportation in the
wet season, and drinking water in the dry
season.
Emerton and Bos (2004) highlighted the fact
that ecosystem goods have high levels of
substitution or complementarity with other
goods, and can be used when other products
are unavailable or unaffordable. Fish can also
provide a small amount of cash at a crucial
time to buy rice seeds at the end of a long
dry season, for instance (Béné, pers. comm.),
thus securing both the food and the livelihood
of the following year. In view of this diversity
and seasonality, Friend (2001) highlighted the
flaws and “limited value of socioeconomic
surveys”, as they assume a level of uniformity
or regularity and cannot reveal the dynamic
aspect of relative values of natural resources
in rural livelihoods. Bush and Hirsch (2005)
showed that, following environmental
changes, local fishing communities might
experience higher fluctuations in catches
without economists noticing a variation in
the value of the fish, while fishers might
experience fishing constraints and changes
in the species composition without biologists
noticing a change in the value of the fish
biomass.
Laos is a very poor country, as illustrated by
the fact that agriculture accounts for more
than half of the GDP, while only around
three per cent of the country’s land area is
cultivated, partly because much of the country
is mountainous. In this context, natural
resources are of considerable importance to
a major proportion of the population; hunting,
fishing, and gathering play an important role
in the household economy. In fact, aquatic
resources also constitute the main coping
strategy for periods of rice deficit, but there
are no coping strategies for periods of aquatic
resource deficit (Meusch et al. 2003).
Fishing ranks as the second or third most
important activity after rice farming and
animal husbandry, and contributes on
average about 20 per cent to rural household
income (Lorenzen et al. 2003b). Full-time
fishers account for only a few percent of
the Lao population, but fishing is central to
livelihoods in the southern provinces of the
country (e.g., Roberts and Baird 1995; Baird
1996; MRAG 2002), and reliance on fishing is
16 See www.mekong.es.usyd.edu.au/case_studies/fisheries/index.html
��� Tropical river fisheries valuaTion: background papers To a global synThesis
a common characteristic of all wealth groups
within villages (Garaway 2005).
Guttman and Funge-Smith (2000) detailed the
time spent by Lao people in rural occupations.
Fishing takes up around 10 per cent of the
time spent on income generating activities
in rural areas that are dominated by rice
cultivation, followed by fishing and tending
animals. They also showed, like Garaway
(2005), that the poor spend more time fishing
than the other categories of the population.
Fishing as an activity is not gender specific
(Lorenzen et al. 2003b).
In an urban context (a wetland in Vientiane),
Gerrard (2004) showed that incidence
of fishing and its total value increases
as household income status declines,
underlining the importance of incorporating
capture fisheries into local poverty reduction
strategies.
�.� impact of changes on fisheries in laos
The main issue regarding river changes and
fisheries in Laos is hydropower development.
The impact of Lao hydropower dams on the
environment and poor communities has been
addressed for a number of years by multiple
NGOs, but few scientists have undertaken
detailed impact studies. An overview of
the issues inherent to each major dam is
provided, with a pro-poor, pro-conservation
perspective in IRN (1999).
We review below some fisheries-related
issues in the case of Nam Ngum and Nam
Theun 2 dams.
�.�.1 example of nam ngum dam
The Nam Ngum reservoir, covering an area of
477 km2, was created by a hydropower dam
located 90 km from the capital, Vientiane.
Several studies have been conducted to
estimate the fisheries production in the
reservoir, but none has been done on the
environmental impacts of the dam. A study
done in 1982 by the MRC estimated the
total fish production at 1,470 tonnes while
another study found it to be 6,833 tonnes
(Mattson et al. 2001). According to Mattson
et al. (2001), the increase could be the result
of reduced predation pressure, the initial
high-value predator species having been
fished out. Other studies on reservoir
fisheries in the dam indicated that the initial
catch was low due to problems in water
quality; but since the flooded trees in the
reservoir were cut, the water quality has
improved. The fisheries landings are said to
have increased by a factor of four between
1982 and 1998 (cited in Mattson et al. 2002a),
in correlation with an increase in fishing
effort, particularly gillnets. The total estimated
landings (6,833 tonnes) correspond to a
143kg/ha/year yield. Annualregistered yield
amounted to US$ 800,000 in 1997 (Ringler
2000). However, Roberts (2004) pointed out
that during 1971-79 the reservoir was largely
anoxic with very low fish catch, and after
a peak in fisheries production in 1985-90,
the catch declined. Careful management of
the reservoir fishery is obviously essential.
Lorenzen et al. (2000) found in their study that
dam schemes in Laos are associated with
declines of about 60 per cent in fishing effort
and catch for rural households. However,
no literature was found on the impact of
the dam on migratory species or the effect
on downstream fisheries except that of
Schouten (1998), who showed that the water
released from the Nam Ngum reservoir has a
much lower dissolved oxygen level than that
in natural rivers and is unfavorable for aquatic
life most of the year, especially during the wet
season.
�.�.� example of nam Theun � dam
Nam Theun 2 is the largest and most
controversial hydropower project being
planned in the Lao PDR (IRN 1999). The

chapTer � ���
Table 1�: selected economic indicators for Thailand from �000 to �00� (World bank web site)
Economic indicator 2000 2001 2002 2003
Agriculture (% of GDP) 9.02 9.12 9.37 8.77
Industry (% of GDP) 41.97 42.12 42.67 41.44
Services (% of GDP) 49.01 48.76 47.96 49.79
GDP (billion US$) 123 116 127 143
GDP growth (%) 4.76 2.14 5.41 6.74
Aid per capita (US$) 11.50 4.59 4.80
Population growth (%) 0.80 0.75 0.70 0.65
Population total (millions) 60.70 61.20 61.60 62.00
project, planned for central Laos, consists of
a 50-meter-high dam on the Theun River, the
fourth largest tributary of the Mekong. The
river provides habitat for 85 species of fish
16 of which are endemic (Roberts 2004), and
33-55 per cent of these species are strongly
migratory. Out of the 85 species, only 27 are
likely to become established in the reservoir,
and 14 of these are small species with little
or no commercial value (Roberts 2004).
Several environmental impact assessments
have highlighted the fact that the dam would
have a serious negative impact on fisheries
by disturbing migration, creating a large body
of still water to which most of the species
could not adapt and degrading water quality
downstream (IRN 1999). Cumulative impacts
have also been envisioned, and a significant
negative impact on fisheries and aquatic
biodiversity has been foreseen, although
not detailed (NORPLAN 2004). The reservoir
fishery can be expected to increase during
the first 5-10 years, but then it will decline
(Roberts 2004).
5. kINGDOM OF THAILAND
�.1 country overview
Thailand is the richest country in the region,
with a GDP of US$ 7,400 per inhabitant for a
population of 64.8 million. About 10 per cent
of the population lives below the poverty line.
However, there is a great disparity between
regions, and the northeastern provinces
bordering the Mekong River are among the
driest and poorest in the country.
Agriculture contributes less than 10 per cent
to the national economy while industry and
services contribute 40 and 50 per cent,
respectively (Table 13). Out of all the LMB
countries, Thailand is least economically
dependent on the Mekong River. However,
fisheries have huge importance for rural food
security and employment in the northeastern
provinces. The population growth of the
country is low compared to its neighbors and
very similar to that of developed countries.
Water resources are managed intensely in
Thailand for hydropower, irrigation, industrial
and domestic uses. However, problems of
availability and adequacy of water resources
are created by inefficient use of water in
various sectors, deteriorating water quality
due to urban sewage and industrial waste,
and excessive use of fertilizers and pesticides.
The present water demand for irrigable areas
and other uses is estimated to be 68,000 mcm
(million cubic meters) per year for the whole
country. This figure is expected to increase
to 86,000 mcm/year in 2006, or 43 per cent
of the total annual runoff. Within Thailand,
1,872 reservoirs are located in the Mekong
River Basin, with a total surface area of
2,120 km2 and an estimated total fish catch of
25,428 tonnes per year (Virapat and Mattson
2001).

��� Tropical river fisheries valuaTion: background papers To a global synThesis
Inland capture fisheries in Thailand usually
operate in major rivers and their floodplains,
canals, swamps, wetlands, paddy fields,
lakes and reservoirs. Pawaputanon (2003)
reported a total area of 4.9 million hectares
for inland fish habitat. This area consists
of 4.5 million hectares of wetlands and 47
rivers and 400,000 hectares in the form of
21 large reservoirs. The fisheries are mainly
subsistence-based, but commercial fishing,
especially aquaculture, is increasing rapidly.
Inland freshwater and brackishwater ponds
and tanks constitute 320,000 hectares of
production area in the country. However,
most of the freshwater ponds are operated
for various purposes (e.g., school and village
ponds are operated for food and income for
poor families).
�.� economic valuation analyses
The review indicates that Thailand is the
LMB country for which published literature in
English on fisheries is least available. Possible
explanations for this situation are i) the high
priority given by the Thai Department of
Fisheries to aquaculture, with some studies
on reservoirs following up fish stockings; ii)
the fact that most reports and publications
are written in Thai, and iii) the relatively low
level of research done in Thailand by the
MRC. Therefore, some gaps in the economic
valuation of river fisheries in Thailand remain
in this section.
�.�.1 direct use values
5.2.1.1 Catchvalues
Inland fisheries contribute approximately six
per cent (about 200,000 tonnes) to the total
fisheries production in Thailand (Pawaputanon
2003). Indeed, in 1996, the Department of
Fisheries reported this contribution at 5.8 per
cent, with the northeastern region that lies
in the Mekong Basin contributing 122,000
tonnes (cited in Prapertchob 1999). Marine
and aquaculture production seem to outweigh
inland fisheries production considerably (Table
14), with marine production of over 3 million
tonnes dominating the fisheries sector.
This assessment of freshwater fish catches
for the 1997-99 period is 2.6 times higher than
that available for the year 1996 (Table 15).
5.2.1.2 Marketvalues
Surprisingly, it was possible to find
only one study in English that details
the value of inland capture fisheries
production in Thailand, as shown in
Table 16.
Should the 1996-price-per-kilogram figure
(US$ 0.77/kg) be applied to the 1997-99
assessment detailed in Table 14, it would
result in a total value of US$ 157.5 million for
Thailand’s inland fisheries production. As
a comparison, the value of all fish and fish
Table 1�: capture fisheries production in 1���-�� in Thailand (tonnes; adjusted from pawaputanon �00�)
Year Capture fisheries production (t)
Freshwater Marine Others Total
1997 205 000 2 679 500 499 900 3 384 400
1998 202 300 2 709 000 594 600 3 505 900
1999 206 900 3 166 400 252 600 3 625 900

chapTer � ���
Table 1�: inland fish production per water-body type in Thailand in 1��� (cited in virapat and Mattson �001)
Category Area (ha)Production
(kg/ha)Total (t)
Reservoirs 432 176 83 35 818
Public waters
185 527 199 36 843
Fish ponds
22 163 273 6 050
Total 63 ,866 78 711
products in Thailand is estimated at US$ 3.6
billion in 1995 (NACA 2000).
Given the problems in small-scale fisheries
data collection in Thailand (Coates 2002),
it can be assumed that the figure for
open waters is seriously underestimated.
According to Coates (2002), “It is widely held
that dams have significantly reduced fisheries
in major rivers in Thailand. This is probably
true and has certainly been used as a major
reason to devote most attention to reservoir
fisheries and aquaculture”. An analysis by
Pawaputanon (2003) revealed that inland
capture fisheries production reported by the
Department of Statistics reflected only the
production in reservoirs and large wetland
water bodies, covering up to 2.7 million
hectares. Virapat et al. (1999) supported
the view that statistics reported by the DOF
referred almost exclusively to reservoirs and
noted, “… this confirms that the perception
of inland capture fisheries in Thailand is one
of reservoirs. Whilst reservoirs are obviously
important … Thailand in fact does still have
considerable river and swamp fisheries, plus
figure �: Map of northeast part of Thailand, bordered by the Mekong
Table 1�: inland fish value per water-body type in Thailand in 1��� (cited in virapat and Mattson �001).
Category Total (t) Value (USD)
Reservoirs 35 818 27 469 000
Public waters 36 843 28 255 000
Fish ponds 6 050 4 640 000
Total 78 711 60 364 000

��0 Tropical river fisheries valuaTion: background papers To a global synThesis
some production from rice-fields” (cited in
Coates, 2002).
5.2.1.3 Consumptionvalues
The main source of information about fish
consumption in Thailand is the review
by Prapertchob (1999). According to this
review, based on a 500-household survey
by Prapertchob et al. (1989), the author cited
the amount of freshwater fish consumption
in northeastern Thailand as 21.3 kg/person/
year on average, with a variability between
13.3 kg/person/year in dry areas and 36.4 kg/
person/year in areas rich in water resources.
The annual consumption of freshwater fish
in northeastern Thailand was subsequently
estimated at 395,000 tonnes (i.e., almost
twice the 207,000 tonnes estimated in Table
14). Fish was by far the dominant food item
in the diet of the people surveyed, followed
by chicken and pork (half and one-third
of the consumption of fish, respectively).
Seventy-one per cent of the fish consumed
was captured from the wild. Little et al. (1996)
also showed that poor people and those
living far from water resources tended to
rely more on other aquatic animals, such as
crabs and frogs, than on fish. In 1995, the fish
consumption was estimated at 27 kg/person/
year by the Department of Fisheries, with the
central and northern regions importing fish
from other provinces due to insufficient local
supply.
�.� socioeconomic analyses
Inland fisheries play a significant role in
Thailand in terms of providing food security
and employment to fishing communities
and rural populations. According to Virapat
and Mattson (2001), about 825,000 labor
households earned their living from both
agriculture and inland fisheries, and an
additional 47,000 households earned their
living from inland fisheries alone. More than
80 per cent of the total households that rely
on agriculture and/or inland fisheries live in
the Mekong River Basin.
�.� impact of changes on fisheries in Thailand
A large body of journalistic literature addresses
the impact of dams on aquatic resources and
the people who depend on them; however,
there are few scientific studies to back up
these journalistic articles. Presented below is
an example of the famous and controversial
Pak Mun dam, which has generated more
scientific studies than any other case of river
modification in Thailand.
�.�.1 example of pak Mun dam
This analysis of the impacts of Pak Mun dam
is mainly based on a report of the World
Commission on Dams by Amornsakchai et
al. (2000).
The Pak Mun dam is a run-of-the-river dam
built on the Mun River, 5.5 km upstream from its
confluence with the Mekong, in northeastern
Thailand. The dam has a maximum height of
17 m, and a total length of 300 m. The budget
for the project was 3.88 billion Baht, but the
unanticipated cost of compensation for the
loss of fisheries increased the total cost.
The environmental impact assessment done
in 1981 predicted that fish production from
the reservoir would increase considerably,
although some fish species would be affected
by the blockage of river flows by the dam.
The fish yield expected was 100 kg/ha/year
without fish stocking and 220 kg/ha/year with
a fish-stocking program. However, in Thailand,
even storage reservoirs that perform better
under fish-stocking programs have a fish yield
of only about 19 to 38 kg/ha/year. There has
been no evidence that the fish productivity of
the Pak Mun reservoir has reached anywhere
near the anticipated 100 kg/ha/year, and the
value of the total annual headpond fishing

chapTer � ��1
yield has been estimated at 0.9 million Baht,
instead of the expected 19.7 million Baht
(US$ 69,000).
Regarding biodiversity, Roberts (1993)
reported that the number of fish species in
the Mun River declined from 121 species in
1967 to 66 species in 1981, and 31 in 1990.
After the completion of Pak Mun dam, the
lower Mun River experienced a decline in
fishing yields with an estimated value of
US$ 1.4 million per annum at 20 Baht/kg. In
addition, the decline in fish species upstream
led to the closure of 70 Tum Pla Yon traps. At
the end of the 1980s, the value of the annual
catch from this single fishery amounted
to US$ 212,000 per annum (at a rate of 38
Baht per US$ 1), and the reservoir fisheries
created did not match the losses generated
by the dam construction.
In the post Pak Mun dam period, fishing
communities located upstream and down-
stream of the dam reported a 50-100 per cent
decline in fish catch and the disappearance of
many fish species. The number of households
that were dependent on fisheries in the
upstream region declined from 95.6 per cent
to 66.7 per cent, and the villagers who were
dependent on fisheries for income found no
viable, alternative means of livelihood. These
conclusions have been largely confirmed by
the Thai Baan research initiative (SEARIN
2004), which provides additional insights
on the consequences of the dam on the
livelihoods of the local population. By March
2000, 488.5 million Baht (US$ 19.5 million)
had been paid to 6,202 households as
compensation by the Thai government for the
loss of fisheries and livelihoods.
Because of its location, this dam is a greater
barrier to fish migrations than reservoirs and
dams built on low order tributaries further up
in the catchment areas. Out of the 265 fish
species recorded in the Mun-Chi watershed
before 1994, 77 species were migratory and 35
species were dependent on habitat associated
with rapids. Out of 169 species found in the
present catch, 51 species were significantly
less abundant since the completion of the
project, while at least another 50 species
of fish that were dependent on upstream
rapids had disappeared. Nowadays, only 50
migratory species are left. The decline has
been higher in the region upstream from the
dam where the catch has declined by 60-80
per cent since the completion of the run-of-
the-river hydropower project. Amornsakchai
et al. (2000) conclude that the difference in
the number of species in fish surveys before
and after dam construction may well be
exacerbated by the cumulative impact of many
different developments in the watershed.
Therefore, the Pak Mun dam cannot be solely
blamed for the apparent decline of some of
the fish species.
As the fish ladder built on Pak Mun to mitigate
the impact of the dam on migrating fish has
proven inefficient (too steep, dry six months
a year, not used by fish; Roberts 2004),
changes following a lengthy conflict were
ultimately made to the operation of the dam
in order to reduce its impact on fisheries and
livelihoods. In January 2003, it was agreed
that the sluice gates would remain open four
months a year.
6. kINGDOM OF CAMbODIA
�.1 country overview
Cambodia is the poorest country in Southeast
Asia with a GDP per capita of US$ 297
(UNDP 2004). The population of Cambodia

��� Tropical river fisheries valuaTion: background papers To a global synThesis
has tripled over the past couple of decades
from approximately 4 million people in 1979
to about 13.8 million in 2003. It is estimated
that the population will further increase to
16.6 million by 2010 and to over 20 million
by 2020. With an annual population growth
rate of 1.6 per cent, about 300,000 jobs
need to be created each year (Degen et al.
2000) in the future, considerably straining the
country’s already weak economy (see Table
17 for details).
The rural population comprises about 90 per
cent of the nation’s poor, 43 per cent of whom
live below the poverty line (cited in Zurbrügg
2004). According to Keskinen (2003), while
the role of agriculture has great significance
to employment because it provides jobs
for almost 80 per cent of the population,
the economic importance of the whole
agricultural sector is decreasing, accounting
for only 34 per cent of the national economy
in 2000, compared with more than 50 per
cent in 1990. However, the author noted
that the proportion of the agricultural and
fishery sectors’ contribution to GDP might be
considerably underestimated, partly because
of their subsistence nature (Keskinen 2003).
�.� economic valuation analyses
�.�.1 direct use values
On his way to Angkor Wat in 1858, Henri
Mouhot noted, “the Great Lake is in itself a
source of wealth for a whole nation; it is so
full of fish that at the time of low waters they
are crushed under boats; and rowing is often
hampered by their number” (Mouhot 1868).
Today, inland fisheries contribute 90 per cent
of Cambodia’s total fish catch (Sam et al.
2003) of which the Tonle Sap Lake provides
about 60 per cent, or 179,500-246,000 tonnes
annual harvest over the 1995-2000 period
(Ahmed et al. 1998; Lieng and Van Zalinge
2001). In 1998, according to the DOF (2001a),
35 per cent of the Cambodian population was
living in fishing dependent communities.
6.2.1.1 Catchvalues
Similar to fish consumption figures in the Lao
PDR, fish catch figures in Cambodia have
been evolving a lot over the past 10 years,
with a strong initial mismatch between official
statistics and scientific assessments. Although
multiple project reports mention various
figures, estimates all rely on only three basic
sources: i) official national statistics; ii) catch
statistics of the MRC project “Management
of the Freshwater Capture Fisheries of
Cambodia,” partly based on field sampling;
and iii) estimates based on consumption
studies led by the MRC in particular in 1995-
96. Both official and MRC statistics have
themselves been reconsidered over time, with
several confusing recalculations tentatively
reviewed in Baran et al. (2001b) and Baran
(2005). The resulting production figures
originating from these three main sources are
reviewed in Table 18.
Table 1�: selected economic indicators for cambodia from �000 to �00� (World bank web site)
Economic indicator 2000 2001 2002 2003
Agriculture (% of GDP) 39.65 37.56 35.58
Industry (% of GDP) 23.27 25.62 27.98
Services (% of GDP) 37.08 36.82 36.44
GDP (billion US$) 3.60 3.71 4.00 4.30
GDP growth (%) 7.03 5.67 5.48 7.64
Aid per capita (US$) 31.38 32.46 36.96
Population growth (%) 2.22 2.01 1.79 1.58
Population total (millions) 12.70 12.90 13.20 13.40
chapTer � ���
17 The only fishery scientifically monitored in the basin is the bagnet (“dai”) fishery, which accounts for 15,000 tonnes/year, or approximately 4% of the total catch in Cambodia and 0.6% of the catch basinwide.
In fact, these figures result from an aggregation
of various localized studies (e.g., bagnet
fishery, rice-field fisheries, consumption
studies, etc.) but not from a comprehensive
assessment. The major fisheries remain too
profitable for scientific monitoring to be allowed
by operators (case of the lot fishery; CNMC/
Nedeco 1998; Degen and Nao Thuok 2000)
or too dispersed to be efficiently monitored
(case of the mobile gear fisheries). Similarly,
the evolution of the production figure over
time reflects the progressive integration of
previously neglected catches (e.g., from rice
fields, subsistence fisheries, etc.) but does
not result from long-term scientific monitoring,
which still does not exist in Cambodia despite
the efforts of the MRC over the past ten years
(Coates 2002; Baran 2005)17.
Assuming an annual production of 300,000-
400,000 tonnes, Cambodia’s freshwater
capture fisheries rank fourth worldwide after
China, India and Bangladesh. Furthermore,
as shown by Baran (2005), when the catch
is divided by the population (i.e., the number
of people who can realize the harvest),
Cambodia’s inland fishery is the most intense
in the world, with 20 kg of fish caught per
inhabitant per year (Figure 7).
Baran et al. (2001b), and Lieng and Van
Zalinge (2001) provide estimates of the fish
yield of the Cambodian floodplains, which
amount to between 139 and 230 kg/ha/year.
This is the highest amount when compared
with figures from the other tropical floodplains
(i.e., Thailand, Laos, Indonesia, Bangladesh,
Amazon), which range from 24 to 173 kg/ha/
year (the latter figure being in Laos, within the
Mekong Basin). At a specific site of the Tonle
Sap Basin, the fish yield amounted to 243-
532 kg/ha/year (Dubeau et al. 2001) and the
average catch to 2.4 kg/fisher/day (Ouch and
Dubeau 2004). The exceptional productivity
of the Cambodian floodplains is explained by
three interconnected factors: high biodiversity,
accessibility of the floodplains and a very high
exploitation rate over decades (Baran 2005).
6.2.1.2 Marketvalues
In a recent large-scale study conducted on
540 households in three provinces (Stung
Treng, Siem Reap and Takeo), Israel et
al. (2005) calculated that the annual net
economic value (NEV) of aquatic resource-
based activities is US$ 190,000 for an
average village community, less the cost
of labor that is generally not accounted for.
This NEV, however, varies from US$ 6,106
to 440,895 per village per year depending
upon the degree of dependence on
aquatic resources and market access. The
annual return to labor (i.e., the amount the
communities earn from aquatic activities)
reaches US$ 108,614 per village per year on
average.
On the macroeconomic side, the perception
of this resource’s importance has evolved
dramatically. Before 2000, the total revenue
generated from the fisheries sector was
estimated at US$ 2.4 million per year (Gum
2000). However, the evolution in the catch
assessment led to radical revisions. Van
Zalinge et al. (2000) estimated the monetary
value of the catch at the landing site to range
from US$ 100 to 200 million, and to increase
in the marketing chain up to US$ 250 to
500 million. Nowadays, official statements
estimate the fishery at 300,000-450,000
tonnes per year, with a value of US$ 150-225
million18. Hortle et al. (2004a) valued the total
catch at US$ 300 million. Nao and Ly (1998)
estimated that the value of fisheries in 1995
made up 3.2 to 7.4 per cent of GDP. However,
the contribution of fisheries to the GDP has
recently been estimated at 11.7 per cent
(Starr 2003) and 16 per cent (Van Zalinge et
al. 2004). This represents more than half the
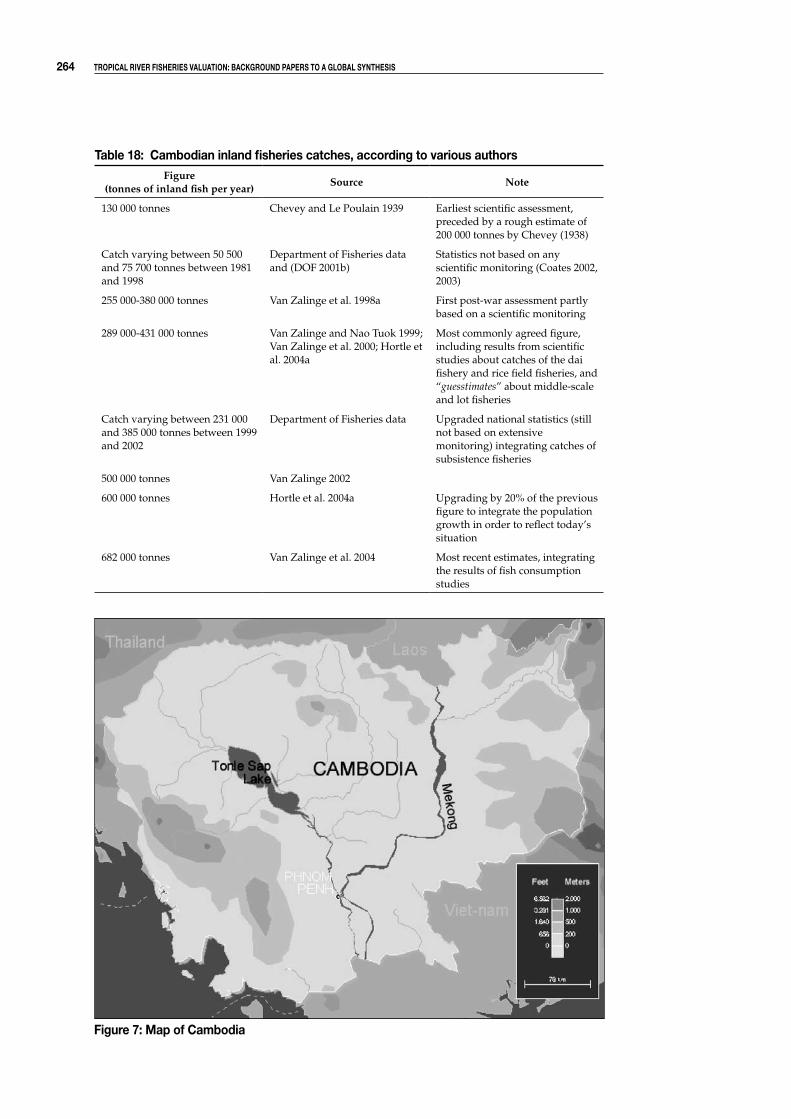
��� Tropical river fisheries valuaTion: background papers To a global synThesis
Table 1�: cambodian inland fisheries catches, according to various authorsFigure
(tonnes of inland fish per year)Source Note
130 000 tonnes Chevey and Le Poulain 1939 Earliest scientific assessment, preceded by a rough estimate of 200 000 tonnes by Chevey (1938)
Catch varying between 50 500 and 75 700 tonnes between 1981 and 1998
Department of Fisheries data and (DOF 2001b)
Statistics not based on any scientific monitoring (Coates 2002, 2003)
255 000-380 000 tonnes Van Zalinge et al. 1998a First post-war assessment partly based on a scientific monitoring
289 000-431 000 tonnes Van Zalinge and Nao Tuok 1999; Van Zalinge et al. 2000; Hortle et al. 2004a
Most commonly agreed figure, including results from scientific studies about catches of the dai fishery and rice field fisheries, and “guesstimates” about middle-scale and lot fisheries
Catch varying between 231 000 and 385 000 tonnes between 1999 and 2002
Department of Fisheries data Upgraded national statistics (still not based on extensive monitoring) integrating catches of subsistence fisheries
500 000 tonnes Van Zalinge 2002
600 000 tonnes Hortle et al. 2004a Upgrading by 20% of the previous figure to integrate the population growth in order to reflect today’s situation
682 000 tonnes Van Zalinge et al. 2004 Most recent estimates, integrating the results of fish consumption studies
figure �: Map of cambodia

chapTer � ���
share of the whole country’s industry (21.9%
in 2001).
Inferring value from catch is highly dependent
upon the average price-per-kg factor used,
and very few studies detail this factor. Rab et
al. (2004a) detailed the evolution of the price
along the trade chain (Table 19) and showed
that the price at the landing site can be five
times that received by the fisher.
Table 1�: average price of a kilo of fish at each level of the trade chain (rab et al. �00�a)
US$/kg
Price received by fishers 0.39
Price paid by the households 0.60
Retail market price 1.84
Landing site price 2.16
Export house price 4.26
Border price 5.28
In a similar study, Yim and McKenny (2003a)
found that the marketing margin (profit share
in the retail price) varies from 65 to 75 per cent
(i.e., a price multiplied by 2.8 to 4.2 between
the fisher and the local consumer), depending
on species. The geographic variability of prices
in retail markets as well as the variability by
meat quality were also highlighted by Rab et al.
(2004b, 2005; table 20), while Ker et al. (2001)
outlined their temporal variability (fish prices
being generally highest from June to August
and lowest from December to February).
Ker et al. (2001) also showed that the mean
price of other animal protein is generally higher
than that of cultured and wild fish, making the
latter a more affordable staple for the poor.
Touch and Todd (2003) estimated the total
value of processed and exported inland fish
commodities, such as fish sauce, dried fish,
smoked fish, etc. at US$ 23.7 to 29.4 million.
The export market is particularly informal,
difficult to monitor and undervalued. As
noted by the DOF (2001c) “the trade statistics
published by the Ministry of Commerce
reported only 517 tonnes of exports in 1998
at a value of US$ 4.34 million. On the other
hand, statistics prepared by the Department
of Fisheries (DOF) under the Ministry of
Agriculture, Forestry and Fisheries indicated
40,240 tonnes of exports of fishery products
in that year, which seems more realistic”.
Officially, Cambodia exported 23,700 tonnes
of inland fish in 2001 (Nao et al. 2001, cited in
Hortle et al. 2004a)19. By comparison, in the
1940s, under a strong colonial administration
backed by extensive studies of the fisheries
sector, the fish export was estimated at
28,000 tonnes per year (Le Poulain 1942), for
a total population three times smaller than
nowadays (Baran et al. 2001a).
Yim and McKenney (2003a, 2003b and
2003c) found that fish exports registered by
18 Minister of Agriculture, Forestry and Fisheries, National Fish Day 2004.19 Out of a total of 38,100 tonnes of fish exported for a total value of US$ 31.14 million, according to DOF statistics.
figure �: fish catch per inhabitant in the four countries having the biggest inland fish catch (baran �00�)
Cat
ch/
inha
bita
nt (k
g/ca
pit
a/ye
ar)
China India Bangladesh Cambodia
25
20
15
10
5
0
Table �0: average price per kilogram of fish (us$) per quality (“grade”) at various retail markets during the closed season (rab et al. �00�)
Average price (US$/kg)
Phnom Penh
Kampong Chhnang
Siem Reap
Grade 1 3.48 5.83 0.74
Grade 2 2.50 3.20 0.51
Grade 3 1.92 1.81 0.48
��� Tropical river fisheries valuaTion: background papers To a global synThesis
the Department of Fisheries were often one
third or even one tenth of their real weight.
Yim and McKenney (2003b) also showed that
official and above all informal fees add more
than 50 per cent to the cost of exporting a
tonne of fish to Thailand. For example, a
shipment of fish sent by road from the Tonle
Sap Lake to Thailand is subject to 27 different
fees by 15 institutions, 19 per cent of which
are unofficial fees. Overall, the value of fees
represents more than twice the profit margin
of the trader, and thus fish resources benefit
a number of institutions that have in theory
nothing to do with fisheries. The authors do
not view investment and business growth as
possible in the current situation.
Taxes and fines from the fisheries system are
primarily supposed to benefit the Department
of Fisheries in charge of monitoring and
management of the resource. However, the
corresponding government revenue in the
year 2000 was less than US$ 3 million (FACT
2001). Thus, the official revenue collection
from an estimated US$ 300 million worth
resources amounts to taxation of only one per
cent. This can be compared to the taxation
rate under the French Protectorate, which
ranged from 1 to 10 per cent depending
on the gear (average: 5.6% among 6 gears,
calculated from Chevey and Le Poulain 1939).
In fact, the supposedly very low current
taxation rate rather highlights a governance
and reallocation issue (Ratner et al. 2004) and
does not necessarily leave the Department of
Fisheries with sufficient resources to efficiently
face the challenge of properly monitoring and
managing the fish resource.
In the informal sector, bribery in relation to
the fishing lot licenses has been estimated at
US$ 3-4 million (Touch and Todd 2003).
6.2.1.3 Consumptionvalues
Fresh fish consumption is important among
people living close to fish production areas
and markets, but in rural areas far from natural
water bodies or markets, processed fish is
more important (Deap 1999). At peak periods
when catches are very large, most fish is
processed into fish paste (prahoc), fermented
fish (phaok), sweet fish (mum), smoked fish and
fish sauce. Surplus fish is dried for pig feed or
fertilizer. McKenney and Tola (2004) estimated
the average consumption of processed fish
paste (prahoc) at 62 kg/household in 2002, or
10.1 kg/person. For 2003, surveyed farmers
consumed, on average, 95 kg/household
(15.7 kg/person). The cost of prahoc was
US$ 0.09 per kg, whereas low quality pork cost
US$ 1-2 per kg. The cost of prahoc rose
by 60 per cent between 2001 and 2003
due to low fish catch. If similar rises follow,
food security for many Cambodians could
be severely threatened as no substitute for
prahoc exists.
Rab et al. (2004a, 2006), in an extensive study
of 410 households in 3 provinces bordering
the Tonle Sap Lake and River, detailed the
use of fishery resources; they showed that in
the area surveyed, three quarters of the fish
caught was sold for cash, while a quarter was
used locally for consumption or aquaculture
(Table 22). This is to be related to the per
capita consumption in Table 21: can 75 kg/
person/year really represent only one fourth
of the overall catch?
The consumption of fisheries products is
extremely high in Cambodia, as illustrated in
Table 21.
Hap et al. (2006) have dedicated a specific
study to the values of Tonle Sap fisheries. In
2003, there were approximately 1.25 million
people living by the Tonle Sap Lake. The
majority of these people were involved in
small-scale, non-commercial fishing. Although
fishing is central to the lives of Tonle Sap
people, it is important to recognise that their
livelihood strategies are pluralistic in nature,
and that the whole aquatic ecosystem and its

chapTer � ���
Table �1: fish consumption and contribution of aquatic resources to diet in cambodiaFigure Source Comment
13.5-40 kg of fish are consumed per person per year
Kim and Hav 2004
Consumption estimated before the study by Ahmed et al. (1998)
75.6 kg of fish are consumed per person per year
Ahmed et al. 1998
Large-scale study of in the provinces bordering the Tonle Sap Lake. Detailed consumption figures are:- 43.5 kg of fresh fish/person/year, - 14 kg of processed fish paste (= 27.5 kg of fresh fish), - fish sauce, fish oil and transformed products (= 4.6 kg of fresh fish/person/year). - 8 kg/person/year of other animal proteins (chicken, pork, beef, duck, etc.)
Small-scale fisheries provide 65-75% of the animal protein requirements of households.
Ahmed et al. 1998
79% of the animal protein consumed originates from fish.
Israel et al. 2005
Large-scale study (540 households in a northern, a western and a southern province)
On average, 53% of the vegetables consumed are sourced from aquatic plants; the figure reaches 61% among the lower wealth groups.
Israel et al. 2005
5.2 kg of other aquatic organisms (non-fish) are consumed per person per year.
Hortle et al. 2004a
Other aquatic animals include shrimps, crabs, mollusks, frogs, etc.
4.5 kg of other aquatic organisms (non fish) are consumed per person and per year.
Mogensen 2001
diversity of resources contribute to them. The
gross annual income for these communities
is estimated at US$ 233 million. Of this, home
consumption of fisheries products is worth
US$ 13 million and the collection of aquatic
plants and animals is worth US$ 5 million.
Yet, there is a stark contrast in income levels
among households around the lake. The
poorest households, with an annual income
of less than US$ 1,000 make up 72 per cent
of all households but capture only about one-
third of this total wealth. These households are
engaged mainly in small-scale, subsistence
fishing, and they are particularly dependent
on the Tonle Sap Lake for their livelihoods.
Also, it must be remembered that estimates
of direct “consumption” use value focus
exclusively on the economic value of the
system and ignore the ecological and social
values of these resources, as well as the
total wetlands ecosystem of the area, which
is comprised of lakes, rivers, streams, rice
fields, and inundated areas.
Table ��: average catch and utilization of fish in Tonle sap villages (rab et al. �00�)Average among all villages
Open season 2002 Closed season 2003
Total catch (kg) 3 501.0 488.0
Consumption (%) 5.0 12.5
Sold (%) 74.9 73.9
Processed (%) 9.3 1.2
Fish feed (%) 10.8 12.3
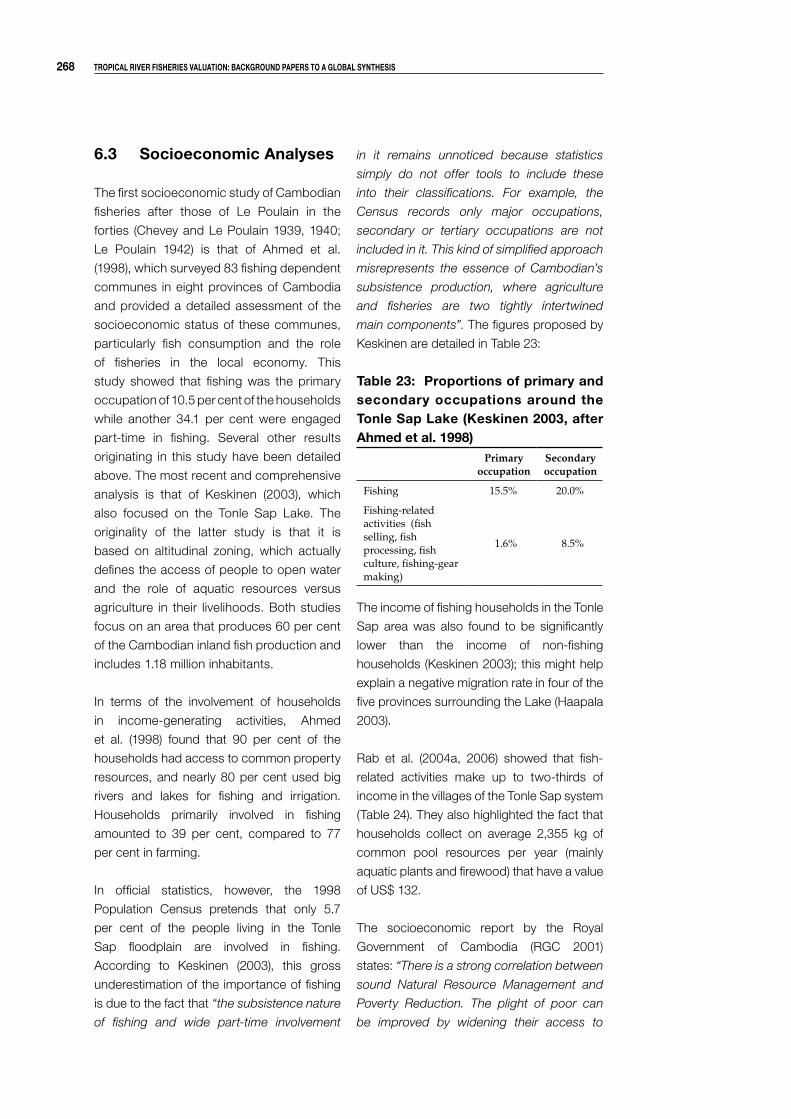
��� Tropical river fisheries valuaTion: background papers To a global synThesis
�.� socioeconomic analyses
The first socioeconomic study of Cambodian
fisheries after those of Le Poulain in the
forties (Chevey and Le Poulain 1939, 1940;
Le Poulain 1942) is that of Ahmed et al.
(1998), which surveyed 83 fishing dependent
communes in eight provinces of Cambodia
and provided a detailed assessment of the
socioeconomic status of these communes,
particularly fish consumption and the role
of fisheries in the local economy. This
study showed that fishing was the primary
occupation of 10.5 per cent of the households
while another 34.1 per cent were engaged
part-time in fishing. Several other results
originating in this study have been detailed
above. The most recent and comprehensive
analysis is that of Keskinen (2003), which
also focused on the Tonle Sap Lake. The
originality of the latter study is that it is
based on altitudinal zoning, which actually
defines the access of people to open water
and the role of aquatic resources versus
agriculture in their livelihoods. Both studies
focus on an area that produces 60 per cent
of the Cambodian inland fish production and
includes 1.18 million inhabitants.
In terms of the involvement of households
in income-generating activities, Ahmed
et al. (1998) found that 90 per cent of the
households had access to common property
resources, and nearly 80 per cent used big
rivers and lakes for fishing and irrigation.
Households primarily involved in fishing
amounted to 39 per cent, compared to 77
per cent in farming.
In official statistics, however, the 1998
Population Census pretends that only 5.7
per cent of the people living in the Tonle
Sap floodplain are involved in fishing.
According to Keskinen (2003), this gross
underestimation of the importance of fishing
is due to the fact that “the subsistence nature
of fishing and wide part-time involvement
in it remains unnoticed because statistics
simply do not offer tools to include these
into their classifications. For example, the
Census records only major occupations,
secondary or tertiary occupations are not
included in it. This kind of simplified approach
misrepresents the essence of Cambodian’s
subsistence production, where agriculture
and fisheries are two tightly intertwined
main components”. The figures proposed by
Keskinen are detailed in Table 23:
Table ��: proportions of primary and secondary occupations around the Tonle sap lake (keskinen �00�, after ahmed et al. 1���)
Primary occupation
Secondary occupation
Fishing 15.5% 20.0%
Fishing-related activities (fish selling, fish processing, fish culture, fishing-gear making)
1.6% 8.5%
The income of fishing households in the Tonle
Sap area was also found to be significantly
lower than the income of non-fishing
households (Keskinen 2003); this might help
explain a negative migration rate in four of the
five provinces surrounding the Lake (Haapala
2003).
Rab et al. (2004a, 2006) showed that fish-
related activities make up to two-thirds of
income in the villages of the Tonle Sap system
(Table 24). They also highlighted the fact that
households collect on average 2,355 kg of
common pool resources per year (mainly
aquatic plants and firewood) that have a value
of US$ 132.
The socioeconomic report by the Royal
Government of Cambodia (RGC 2001)
states: “There is a strong correlation between
sound Natural Resource Management and
Poverty Reduction. The plight of poor can
be improved by widening their access to
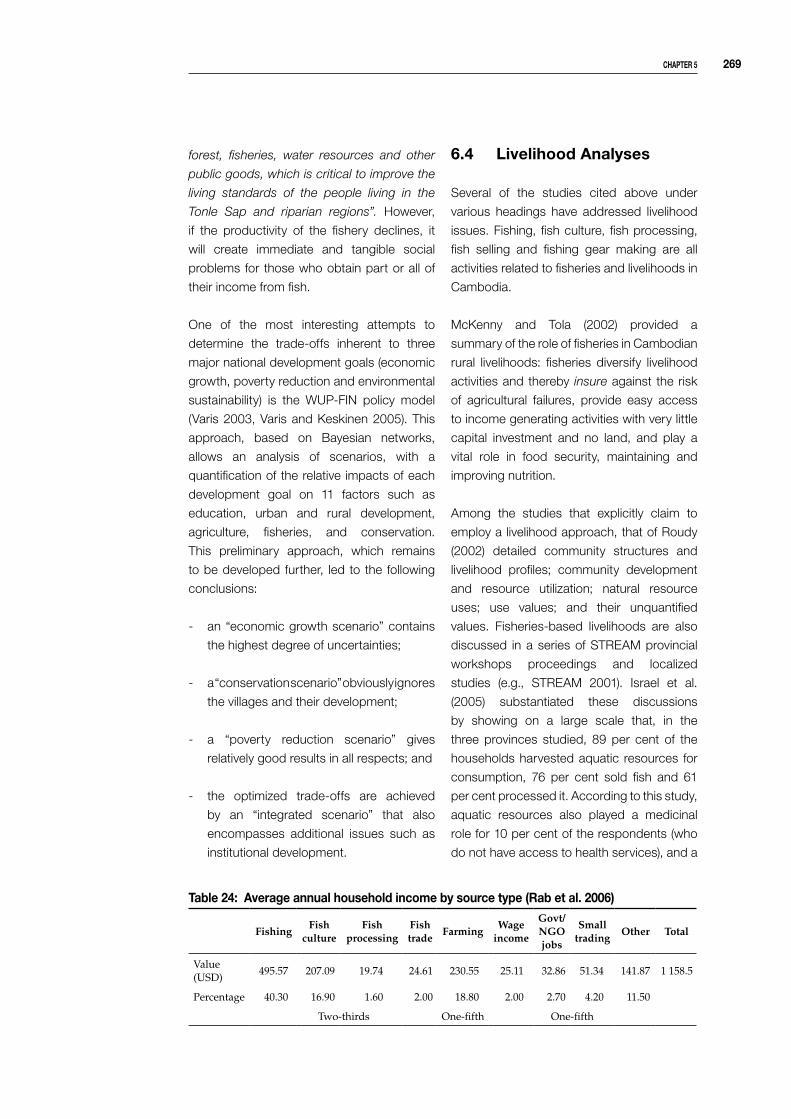
chapTer � ���
forest, fisheries, water resources and other
public goods, which is critical to improve the
living standards of the people living in the
Tonle Sap and riparian regions”. However,
if the productivity of the fishery declines, it
will create immediate and tangible social
problems for those who obtain part or all of
their income from fish.
One of the most interesting attempts to
determine the trade-offs inherent to three
major national development goals (economic
growth, poverty reduction and environmental
sustainability) is the WUP-FIN policy model
(Varis 2003, Varis and Keskinen 2005). This
approach, based on Bayesian networks,
allows an analysis of scenarios, with a
quantification of the relative impacts of each
development goal on 11 factors such as
education, urban and rural development,
agriculture, fisheries, and conservation.
This preliminary approach, which remains
to be developed further, led to the following
conclusions:
- an “economic growth scenario” contains
the highest degree of uncertainties;
- a “conservation scenario” obviously ignores
the villages and their development;
- a “poverty reduction scenario” gives
relatively good results in all respects; and
- the optimized trade-offs are achieved
by an “integrated scenario” that also
encompasses additional issues such as
institutional development.
�.� livelihood analyses
Several of the studies cited above under
various headings have addressed livelihood
issues. Fishing, fish culture, fish processing,
fish selling and fishing gear making are all
activities related to fisheries and livelihoods in
Cambodia.
McKenny and Tola (2002) provided a
summary of the role of fisheries in Cambodian
rural livelihoods: fisheries diversify livelihood
activities and thereby insure against the risk
of agricultural failures, provide easy access
to income generating activities with very little
capital investment and no land, and play a
vital role in food security, maintaining and
improving nutrition.
Among the studies that explicitly claim to
employ a livelihood approach, that of Roudy
(2002) detailed community structures and
livelihood profiles; community development
and resource utilization; natural resource
uses; use values; and their unquantified
values. Fisheries-based livelihoods are also
discussed in a series of STREAM provincial
workshops proceedings and localized
studies (e.g., STREAM 2001). Israel et al.
(2005) substantiated these discussions
by showing on a large scale that, in the
three provinces studied, 89 per cent of the
households harvested aquatic resources for
consumption, 76 per cent sold fish and 61
per cent processed it. According to this study,
aquatic resources also played a medicinal
role for 10 per cent of the respondents (who
do not have access to health services), and a
Table ��: average annual household income by source type (rab et al. �00�)
FishingFish
cultureFish
processingFish trade
FarmingWage
income
Govt/NGO jobs
Small trading
Other Total
Value (USD)
495.57 207.09 19.74 24.61 230.55 25.11 32.86 51.34 141.87 1 158.5
Percentage 40.30 16.90 1.60 2.00 18.80 2.00 2.70 4.20 11.50
Two-thirds One-fifth One-fifth

��0 Tropical river fisheries valuaTion: background papers To a global synThesis
social and recreational role for 74 per cent of
the households (festivals, ceremonies, etc.).
Another project focusing on fisheries-
dependent livelihoods (Kaing et al. 2003)
demonstrated that Cambodia’s fishing-
dependent population falls into two distinct
groups: those who combine fishing and
farming or depend on fishing in the seasonally
flooded areas, and those who can afford
to buy fishing rights in the fishing lots and
employ poor people as workers in industrial-
style fishing operations.
The livelihood approach is at the heart of a
portfolio of projects funded by the Asian
Development Bank (ADB), focusing on the Tonle
Sap system20. In a detailed study focusing on
policy options for the Tonle Sap communities
(Agrisystems/CamConsult/MRAG 2004), ADB
consultants demonstrated that priorities were
different among communities, with those of
the flooded areas being most concerned with
renewable natural assets, while those in the
transition zone focus more on agriculture,
irrigation and income diversification. In a
similarly complex fashion, fishing lot operators
are disliked by all villagers although they
offer many employment opportunities, and
some villagers desire control over access
to resources. The study underlines the fact
that, in this floodplain environment, it is not
possible to address problems by focusing
only on either land-based or fishery-based
livelihood assets. Going one step further,
Israel et al. (2005) conclude that the success
or failure of efforts at improving resource
management is dependent on addressing all
the dimensions of vulnerability faced by rural
households, in particular the lack of basic
health services consistently cited as reasons
turning families to illegal fishing or destructive
resource harvesting.
�.� impact of changes on fisheries in cambodia
�.�.1 changes in flow regime
Habitat and flow variability are widely
accepted as major determining factors in the
biodiversity of a system, and fish populations
may require years to recover from a single
extreme habitat event (Hickey and Diaz
1999). According to Starr (2004), very low
water levels in 2003 caused the fish catch
to decrease by as much as 50 per cent and
caused fish prices to double around the Tonle
Sap Lake. Observations on the Dai fishery
for migrating fish in the Tonle Sap River
during 1995-2002 indicate that year-to-year
variations in maximum Mekong river flood
levels strongly affect the yield of this fishery
(Van Zalinge et al. 2003; Hortle et al. 2004b),
which is dominated by about 40 per cent of
short-lived opportunistic species (Baran et
al. 2001c; van Zalinge et al. 2004). Regional
developments utilizing the Mekong water,
such as irrigation schemes, may lead to lower
downstream flood levels and thereby have a
negative effect on the fertility of the Tonle Sap
system, which appears to depend on high
flood levels.
The dramatic impact of dams on fisheries in
Cambodia has been illustrated by the Yali dam
located in Vietnam on a river flowing down
to Cambodia. McKenney (2001) estimated
that the erratic flow release of this dam in
1999 resulted in over US$ 2.5 million in lost
income for 3,434 households. On average,
livelihood income per household decreased
from about US$ 109 to US$ 46 per month
(-57%). Non-quantified impacts of this dam
include deaths and illnesses, livestock losses
due to suspected water quality problems,
and rarefaction of some natural resources.
The Fisheries Office of Ratanakiri Province
20 See http://www.adb.org/Projects/Tonle_Sap/
chapTer � ��1
(Fisheries Office 2000) as well as Baird et
al. (2002) confirmed these impacts while
emphasizing the losses in fish catches and
water quality, and the total disruption of local
livelihoods.
�.�.� habitat Quality loss
Although fish stocks are possibly overexploited,
a degree of protection is provided by
keeping poachers out and preventing large-
scale destruction of the flooded forest. The
designated fish sanctuaries around the
Tonle Sap Lake might provide protection
for the fish, even though monitoring of the
sanctuaries is inadequate and the location
of these sanctuaries probably suboptimal. In
non-guarded areas outside the fishing lots,
flooded forest coverage is continuously being
reduced by cutting, burning, and conversion
into rice fields and other crop lands (Jantunen
2004). This causes a loss in biodiversity and a
decline in the economic value of these lands
that are thought to be of marginal value for
agriculture and crucially important for fish
production (Van Zalinge 1998a).
Among the threats to fisheries are chemicals
that are widely used in and around the Tonle
Sap Lake. Sixty-seven per cent of the farmers
surveyed used pesticides in 2000 (EJF 2002),
with volumes as high as 72 l/ha/year for
vegetables, and 1.3 million liters of pesticides
were used in the Tonle Sap catchment area
(Yang et al. 2001). Many of them are highly
hazardous chemicals (including DDT and
methyl-parathion) imported from neighboring
countries and used indiscriminately, for
instance, to harvest fish or to preserve dry fish
(FACT 2001; Touch and Todd 2003). Although
one study of organochlorine residue levels
based on 48 freshwater fishes concluded
that Cambodian fishes are among the less
contaminated in the region (In et al. 1999), the
possible consequences of chemical pollution
for the population’s health, as well as on the
environment, have never been quantified on
a large scale in Cambodia. These possible
consequences were detailed in EJF (2002).
Considering the ongoing large-scale
development of irrigation around the lake, this
issue needs to be urgently addressed.
Finally, the concentration of suspended solids
has been recently highlighted as important to
the productivity of the Mekong waters (Van
Zalinge et al. 2003; Sarkkula et al. 2004;
Kummu et al. 2005). This often-neglected fact
may have a huge impact on the Tonle Sap’s
fisheries. As more than half of the Mekong’s
suspended solid load comes from China, this
proportion will thus decrease significantly
when China has finished building its dams on
the Mekong mainstream.
�.�.� changes in fishing patterns
Several commentators on the fisheries in the
Tonle Sap believe that the amount of fish in
the lake is dramatically decreasing (e.g., Mak
2000; FACT 2001). But there is also strong
evidence that fish stocks have not declined;
on the contrary, the overall catches at the
moment are higher than any time in the
past (Baran et al. 2001a; Van Zalinge et al.
2001). According to these researchers, the
population has increased much faster than
the harvest; as a result, the catch per unit of
effort or per fisher is falling, and medium- and
large-size species are becoming rare while
small opportunistic species (of low market
price but high nutritional value) are becoming
more abundant.
The causes of the perceived decline are
believed to be widespread illegal fishing and
overfishing caused by an increasing number
of fishers, together with ineffective fishing
management by the government. Fishers
themselves also state that illegal fishing and
overexploitation are the main reasons for the
decrease (e.g., Keskinen et al. 2002).

��� Tropical river fisheries valuaTion: background papers To a global synThesis
Fishing lots provide an example of changes
in fishing patterns and conflicting interests.
Fishing lots that are auctioned for exclusive
exploitation of fish resources (Van Zalinge et
al. 1998b) represent large-scale commercial
fishing. In 1996, these fishing lots covered 80
per cent of the Tonle Sap’s shoreline (Gum
2000). Following social pressure, 56 per
cent of the total area of the private fishing
lots was converted in 2000 into open access
areas to allow the poor to benefit from the
fisheries (Royal Government of Cambodia
cited in Keskinen 2003). However, fishing
lots are regarded by biologists as a good
way to combine exploitation, environmental
protection (Chheng 1999), and even
biodiversity conservation (Coates et al. 2003).
Hence, there is a dilemma between a “socially
unjust” management system (as the fruits of
the resource are captured by a few operators)
that somehow contributes to conservation
and a “socially fairer” open access system that
is likely to result in unrestricted exploitation
levels and thus jeopardize the resource.
7. SOCIALIST REPUbLIC OF VIETNAM
�.1 country overview
Vietnam is among the most densely
populated countries in Southeast Asia, with
the highest densities in the Mekong Delta,
which is also the country’s most important
agricultural area. The Mekong Delta covers
369 million hectares, i.e., about 12 per cent of
the whole country.
Vietnam still has a high percentage of its
population (32 per cent of the total) living
below the national poverty level according
to World Bank estimates in 2002. The
percentage of child malnutrition is 34 per cent
of all children under five years old. Although
many are living close to water resources,
only 56 per cent of the total population has
access to an improved domestic water
system. The illiteracy rate is 6 per cent. The
percentages of rural population with access
to clean water and electricity are as low as
17 per cent and 48 per cent, respectively
(Vo et al. 2003).
Agriculture contributed 23.6 per cent to
Vietnam’s GDP (US$ 32.7 billion) in 2001.
From 1994 to 1997, the fisheries sector
contributed about three per cent to the
national GDP (Vo et al. 2003). However, Thai
(2003) commented that the fisheries sector
has developed rapidly and now contributes
seven per cent to national GDP. Almost all
freshwater body areas are heavily exploited
for fisheries. Thus, the number of fishers in
the Mekong Delta has increased by 5.3 per
cent per year, i.e., faster than in the rest of
the country and four times faster than the
population growth (Table 26).
Table ��: selected economic indicators for vietnam from �000 to �00� (World bank web site)
Economic indicator 2000 2001 2002 2003
Agriculture (% of GDP) 24.53 23.24 22.99
Industry (% of GDP) 36.73 38.13 38.55
Services (% of GDP) 38.73 38.63 38.46
GDP (billion US$) 31.20 32.70 35.10 39.20
GDP growth (%) 6.79 6.89 7.04 7.24
Aid per capita (US$) 21.42 18.25 15.88
Population growth (%) 1.29 1.23 1.16 1.10
Population total (millions) 78.5 79.50 80.40 81.30
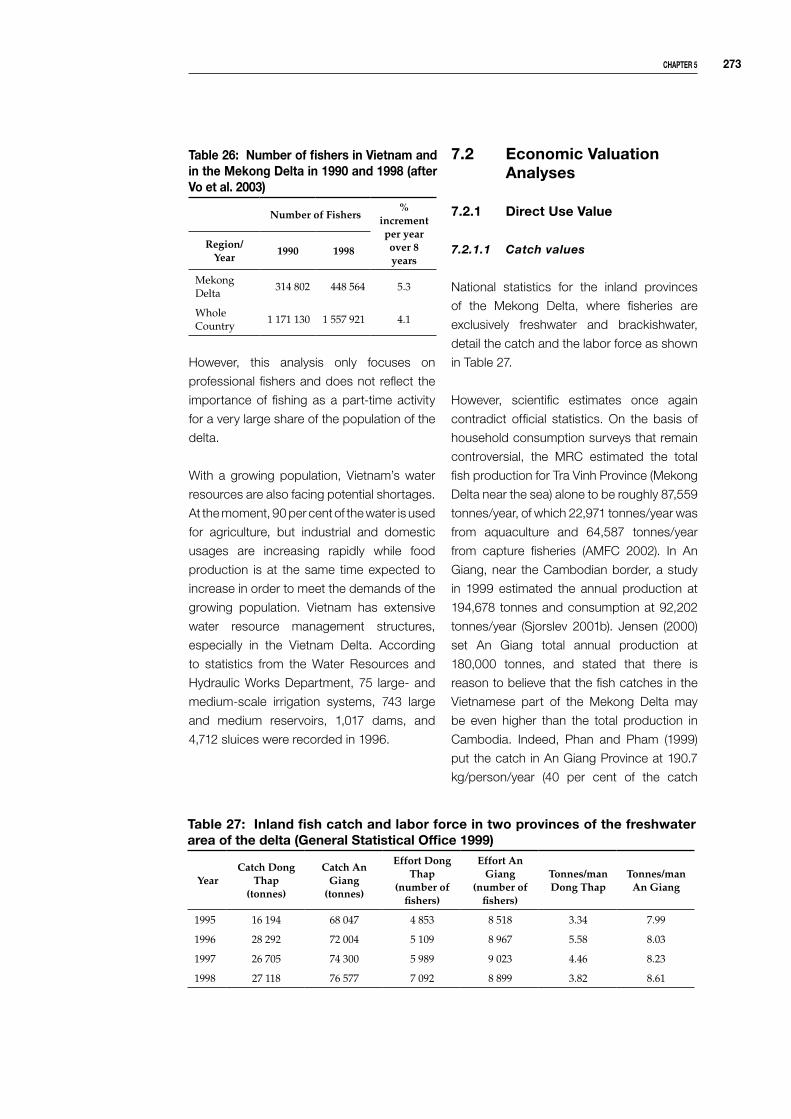
chapTer � ���
Table ��: number of fishers in vietnam and in the Mekong delta in 1��0 and 1��� (after vo et al. �00�)
Number of Fishers%
increment per year over 8 years
Region/Year
1990 1998
Mekong Delta
314 802 448 564 5.3
Whole Country
1 171 130 1 557 921 4.1
However, this analysis only focuses on
professional fishers and does not reflect the
importance of fishing as a part-time activity
for a very large share of the population of the
delta.
With a growing population, Vietnam’s water
resources are also facing potential shortages.
At the moment, 90 per cent of the water is used
for agriculture, but industrial and domestic
usages are increasing rapidly while food
production is at the same time expected to
increase in order to meet the demands of the
growing population. Vietnam has extensive
water resource management structures,
especially in the Vietnam Delta. According
to statistics from the Water Resources and
Hydraulic Works Department, 75 large- and
medium-scale irrigation systems, 743 large
and medium reservoirs, 1,017 dams, and
4,712 sluices were recorded in 1996.
�.� economic valuation analyses
�.�.1 direct use value
7.2.1.1 Catchvalues
National statistics for the inland provinces
of the Mekong Delta, where fisheries are
exclusively freshwater and brackishwater,
detail the catch and the labor force as shown
in Table 27.
However, scientific estimates once again
contradict official statistics. On the basis of
household consumption surveys that remain
controversial, the MRC estimated the total
fish production for Tra Vinh Province (Mekong
Delta near the sea) alone to be roughly 87,559
tonnes/year, of which 22,971 tonnes/year was
from aquaculture and 64,587 tonnes/year
from capture fisheries (AMFC 2002). In An
Giang, near the Cambodian border, a study
in 1999 estimated the annual production at
194,678 tonnes and consumption at 92,202
tonnes/year (Sjorslev 2001b). Jensen (2000)
set An Giang total annual production at
180,000 tonnes, and stated that there is
reason to believe that the fish catches in the
Vietnamese part of the Mekong Delta may
be even higher than the total production in
Cambodia. Indeed, Phan and Pham (1999)
put the catch in An Giang Province at 190.7
kg/person/year (40 per cent of the catch
Table ��: inland fish catch and labor force in two provinces of the freshwater area of the delta (general statistical office 1���)
YearCatch Dong
Thap (tonnes)
Catch AnGiang
(tonnes)
Effort Dong Thap
(number of fishers)
Effort An Giang
(number of fishers)
Tonnes/manDong Thap
Tonnes/manAn Giang
1995 16 194 68 047 4 853 8 518 3.34 7.99
1996 28 292 72 004 5 109 8 967 5.58 8.03
1997 26 705 74 300 5 989 9 023 4.46 8.23
1998 27 118 76 577 7 092 8 899 3.82 8.61

��� Tropical river fisheries valuaTion: background papers To a global synThesis
coming from rice fields and 53 per cent
from rivers and canals, with high variability
depending upon profession and distance
from waterways).
The productivity of Vietnamese inland
waters is supplemented by that of reservoirs,
acknowledging that most species originate
from wild stocks. According to a study done
in 1995 and cited in Vo et al. 2003), the
average fish productivity of the reservoirs
amounts to 24.5 kg/ha/yr. The fish yields of
reservoirs depend on nutrients, biomass, and
the quality and quantity of stocked fingerlings.
In Vietnam, the lowest yield (11.1 kg/ha)
is found in large-size reservoirs (over
10,000 ha), middle yield (34.8-48.1 kg/ha)
from medium reservoirs (about 10,000 to
1,000 ha) and the highest yield (83.0 kg/ha)
from small reservoirs (Ngo and Le 2001).
Inland freshwater and brackishwater
aquaculture ponds and tanks have
392,000 hectares of production area in
Vietnam. However, most of the area is in the
form of brackishwater ponds. Van Zalinge
et al. (2004) estimated the total production
of Mekong Delta aquaculture at 171,600
tonnes in 1999.
7.2.1.2 Consumptionvalues
On the official side, wild and cultured fish
account for about 40 per cent of the total
animal protein intake of the population, and
the per capita availability of fish has increased
from 11.8 kg in 1993 to 15.0 kg in 2000. During
1994-97, the contribution of the fisheries
sector to national GDP was about three per
cent (Vo et al. 2003)
As mentioned above, scientific assessments
at a more local level contradict the estimate of
the overall fish consumption in the Vietnamese
part of the Lower Mekong Basin, cited at
1,021,700 tonnes annually (Sjorslev 2001a).
The average annual consumption of fish in
Tra Vinh Province is 58.35 kg/person/year,
of which fresh fish accounts for 41.86 kg/
person, and fisheries products such as fish
paste, dried fish and fermented fish account
for 16.49 kg/person. An Giang Province has
a very similar consumption figure, 58 kg/
person/year, and Long An Province shows
a slightly higher figure, 64 kg/person/year.
In comparison, the average consumption of
other animal products, such as pork, chicken
and wildlife, is 35.58 kg/person/year in Tra
Vinh.
�.� socioeconomic analyses
As is the case with Cambodia, fisheries play
a much more important role in food security
than in income generation in the Mekong
Delta in Vietnam. This is evident in a fisheries
household survey (AMFC 2002) that found
that, in Tra Vinh Province in 2000, capture
fisheries contributed 28 per cent to food
supply but only 4.5 per cent to income, after
rice farming, gardening and aquaculture.
Similarly, in An Giang, rice farming was ranked
as the most important activity by 52 per cent
of the households while fishing was ranked
as most important by 29 per cent, and as
second most important by 32 per cent.
Capture fisheries are of particular importance
in the livelihoods of poorer people. The
Vietnam Living Standard Study indicates
Table ��: consumption of rice, fish and meat in the Mekong delta in �000 (after vo Tong anh et al. �00�)
Mekong Delta
Per capita rice consumption(kg/month)
13.37
Per capita fish consumption(kg/month)
2.44
Per capita meat consumption(kg/month)
0.98
Malnutrition rate (%) 42.19

chapTer � ���
that the poor spend more time on capture
fisheries (in rivers, lakes and coastal areas)
than on aquaculture in all regions of Vietnam
except the South Central Coast (Vo et al.
2003). However, fish production in this region
has fallen by 10-15 per cent compared to 20
years ago (Sinh 1995, cited in Vo et al. 2003).
Poor knowledge of fishery technology and
the use of harmful gears (electric fishing,
chemicals, small mesh-size nets, harvesting
of breeders, etc.) were among the reasons
given for this decline.
�.� livelihood analyses
Aquaculture is very developed in Vietnam,
with 407,000 tonnes reported as the national
production in 1999. However, there is some
indication that intensive aquaculture systems
such as coastal shrimp farming have caused
inequity (DFID 2000). Capture fisheries
remain of considerable importance for both
poor and rich rural people in the Mekong
Delta, and not only for full-time fishers but
also for households in which fishing is a
component of wider livelihood strategies.
More specifically, Phan and Pham (1999)
found that while only three per cent of the
1,002 persons interviewed in An Giang
Province were professional fishers, 37 per
cent of the people were involved in fish-related
activities. According to Sjorslev (2001b),
however, in the same province, 7 per cent of
the households were involved in professional
fishing, 66 per cent in part-time fishing, and
a further 5.7 per cent in fish processing and
trading. Carl Bro (1996) concluded from a
survey of three regions (northern, central
and southern) that the majority of surveyed
households were involved in some form of
fisheries or aquacultural activities. At the
national level, Vo et al. (2003) concluded that
capture fisheries form an important livelihood
strategy for both poor and rich rural people in
many parts of Vietnam.
Nho and Guttman (1999) reported from Tay
Ninh Province that most households are
involved in some form of capture fisheries,
but that the importance decreases from poor
to rich households. Their study showed that
84 per cent of low-income households and
88 per cent of very low-income households
were involved in fishing, as compared with
only 58 and 44 per cent of medium-income
and high-income households, respectively.
The livelihood analysis conducted by the
WorldFish project “Understanding Livelihoods
Dependent on Fisheries” (Sultana et al.
2003b) identified, through Participatory Rural
Appraisals, four categories of people who
depend on fish for their livelihoods: full-time
fishers, part-time fishers, landless subsistence
fishers, and fish traders. These groups and
their respective dependency upon fisheries
resources were detailed, as well as their
vulnerabilities, and capital assets. The study
showed that inland capture fisheries remain of
considerable importance to rural livelihoods
in the Mekong Delta. The government actively
supports aquaculture development but has
tended to ignore inland capture fisheries. In
terms of poverty, the wild inland fishery is
of greater importance than aquaculture and
poor people have tended to become more
reliant on wild aquatic resources as a result
of growing indebtedness, landlessness and
displacement. The study also highlighted
the fact that the use of aquatic resources
is unsustainable at the current exploitation
rate. Capture fish production is declining
due to overfishing and use of damaging
fishing methods; natural fish habitats and
niches in the area have been reduced due
to rice farming expansion and intensification;
and there is great concern about the direct
discharge of effluents and pathogens from
factories, hospitals and farms directly into
canals and rivers.
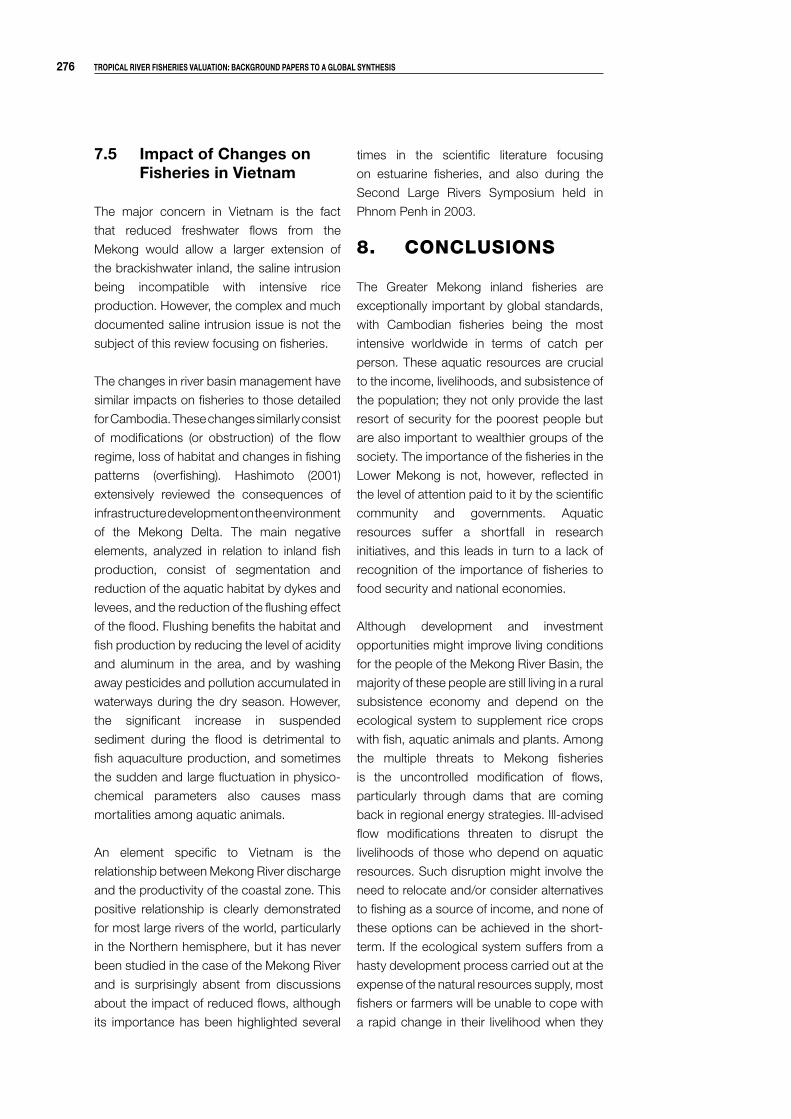
��� Tropical river fisheries valuaTion: background papers To a global synThesis
�.� impact of changes on fisheries in vietnam
The major concern in Vietnam is the fact
that reduced freshwater flows from the
Mekong would allow a larger extension of
the brackishwater inland, the saline intrusion
being incompatible with intensive rice
production. However, the complex and much
documented saline intrusion issue is not the
subject of this review focusing on fisheries.
The changes in river basin management have
similar impacts on fisheries to those detailed
for Cambodia. These changes similarly consist
of modifications (or obstruction) of the flow
regime, loss of habitat and changes in fishing
patterns (overfishing). Hashimoto (2001)
extensively reviewed the consequences of
infrastructure development on the environment
of the Mekong Delta. The main negative
elements, analyzed in relation to inland fish
production, consist of segmentation and
reduction of the aquatic habitat by dykes and
levees, and the reduction of the flushing effect
of the flood. Flushing benefits the habitat and
fish production by reducing the level of acidity
and aluminum in the area, and by washing
away pesticides and pollution accumulated in
waterways during the dry season. However,
the significant increase in suspended
sediment during the flood is detrimental to
fish aquaculture production, and sometimes
the sudden and large fluctuation in physico-
chemical parameters also causes mass
mortalities among aquatic animals.
An element specific to Vietnam is the
relationship between Mekong River discharge
and the productivity of the coastal zone. This
positive relationship is clearly demonstrated
for most large rivers of the world, particularly
in the Northern hemisphere, but it has never
been studied in the case of the Mekong River
and is surprisingly absent from discussions
about the impact of reduced flows, although
its importance has been highlighted several
times in the scientific literature focusing
on estuarine fisheries, and also during the
Second Large Rivers Symposium held in
Phnom Penh in 2003.
8. CONCLUSIONS
The Greater Mekong inland fisheries are
exceptionally important by global standards,
with Cambodian fisheries being the most
intensive worldwide in terms of catch per
person. These aquatic resources are crucial
to the income, livelihoods, and subsistence of
the population; they not only provide the last
resort of security for the poorest people but
are also important to wealthier groups of the
society. The importance of the fisheries in the
Lower Mekong is not, however, reflected in
the level of attention paid to it by the scientific
community and governments. Aquatic
resources suffer a shortfall in research
initiatives, and this leads in turn to a lack of
recognition of the importance of fisheries to
food security and national economies.
Although development and investment
opportunities might improve living conditions
for the people of the Mekong River Basin, the
majority of these people are still living in a rural
subsistence economy and depend on the
ecological system to supplement rice crops
with fish, aquatic animals and plants. Among
the multiple threats to Mekong fisheries
is the uncontrolled modification of flows,
particularly through dams that are coming
back in regional energy strategies. Ill-advised
flow modifications threaten to disrupt the
livelihoods of those who depend on aquatic
resources. Such disruption might involve the
need to relocate and/or consider alternatives
to fishing as a source of income, and none of
these options can be achieved in the short-
term. If the ecological system suffers from a
hasty development process carried out at the
expense of the natural resources supply, most
fishers or farmers will be unable to cope with
a rapid change in their livelihood when they
chapTer � ���
have neither the education nor the capital to
shift to non-rural resource generating options.
The most vulnerable would then be left worse
off than they are now, with no other choice
than migration to urban centers.
Although the value of inland capture fisheries
is probably much better documented in
the Mekong Basin than in Africa or South
America, the accuracy of the data and lack of
up-to-date data remain a major gap that must
be addressed in order to provide more reliable
information and contribute to policymaking
processes. Acknowledging the efforts and
success of the MRC and other fisheries
partners in increasing both knowledge and
the political recognition of the importance
of fisheries in the Mekong system, much
remains to be done to i) accurately value the
fisheries and ii) better communicate scientific
and monitoring results so that fisheries are
properly placed in regional planning and in
weighting of development options.
In the face of these various threats to
natural resources, what opportunity does
aquaculture present to improve security of fish
supply? As aquaculture fish represents only
12 per cent of the fish resources basinwide
and cannot grow quickly without extensive
use of wild fish fry or the introduction of alien
species, the priority for the region should be
to protect and optimize the exploitation of
a huge natural capital rather than counting
on the development of an aquaculture
sector dependent on capture fisheries. In
Cambodia, for instance, without the supply
of wild fish, aquaculture would produce only
15,000 tonnes – just four percent of the fish
that people consume.
That is not to say that aquaculture will not
have a significant role in the future, but during
the coming decade the emphasis should be
on protecting the existing wild fish supply:
slowing down rarefaction is crucial in order to
avoid disruption of the natural food supply to
the poor. More generally, sound management
of aquatic resources requires a balanced four-
fold strategy: improved valuation of natural
resources, protection and management
of wild resources, aquaculture improvement,
and better policies and governance. Without
the development and effective implementation
of such a strategy, the future of the most
intense inland fisheries in the world will be
uncertain.

��� Tropical river fisheries valuaTion: background papers To a global synThesis
REFERENCESACO (Agricultural Census Office). 2000. Lao agricultural
census, 1998/1999 highlights. Steering Committee for the Agricultural Census. Agricultural Census Office, Vientiane, Lao PDR. 62 pp.
ADB (Asian Development Bank). 2000. Policies and strategies for sustainable development of the Lancang River Basin. Sector studies, TA No. 3139-PRC. Asian Development Bank, Manila, Philippines. (Prepared by Landcare Research New Zealand Limited).
ADB/UNEP (Asian Development Bank / United Nations Environment Programme). 2004. Greater Mekong Subregion atlas of the environment. Asian Development Bank, Manila, Philippines, and United Nations Environment Programme, Pathumthani, Thailand. 216 pp.
Agrisystems/CamConsult/MRAG. 2004. Final Report of the Tonle Sap Sustainable Livelihoods Project (Phase 1). Asian Development Bank, Manila, Philippines. 64 pp.
Ahmed M., N. Hap, V. Ly and M. Tiongco. 1998 Socioeconomic assessment of freshwater capture fisheries in Cambodia: report on a household survey. Mekong River Commission, Phnom Penh, Cambodia. 186 pp.
AMFC (Assessment of Mekong Fisheries Component). 2002. Tra Vinh fisheries survey. Report for the Component Assessment of Mekong Fisheries; AMFC / RIA2 / DOF Tra Vinh / Department of Statistics, Tra Vinh. Mekong River Commission, Phnom Penh, Cambodia. 69 pp.
Amornsakchai S., P. Annez, S. Vongvisessomjai, S. Choowaew, P. Kunurat, J. Nippanon, R. Schouten, P. Sripapatrprasite, C. Vaddhanaphuti, C. Vidthayanon, W. Wirojanagud and E. Watana. 2000. Pak Mun Dam, Mekong River Basin, Thailand. A World Commission on Dams (WCD) Case Study prepared as an input to the World Commission on Dams, Cape Town, South Africa. [Online: www.dams.org]
Arthington A.H., K. Lorenzen, B.J. Pusey, R. Abell, A.S. Halls, K.O. Winemiller , D.A. Arrington and E. Baran. 2004. River fisheries: ecological basis for management and conservation, p. 21-60. In R.L. Welcomme and T. Petr (eds.) Proceedings of the Second International Symposium on the Management of Large Rivers for Fisheries, Volume 1. FAO Regional Office for Asia and the Pacific, Bangkok, Thailand. 356 pp.
Baird, I.G. 1994. Freshwater fisheries, with special reference to Probarbus jullieni and Probarbus labeamajor in southern Lao PDR and northeastern Cambodia, and the fish trade between northeastern Cambodia, southern Lao PDR , and Thailand. Lao Community Fisheries and Dolphin Protection Project Report, Pakse, Lao PDR. 30 pp.
Baird, I.G. 1996. Inland community fisheries in Southern Laos. Naga, ICLARM Q. 1(19) January 1996: 13-15.
Baird, I.G. 2001. Aquatic biodiversity in the Siphandone Wetlands, p. 61-74. In G. Daconto (ed.) Siphandone Wetlands. Cooperazione e sviluppo (CESVI), Bergamo, Italy. 192 pp.
Baird, I.G. and I.L. Beasley. 2005. Irrawaddy dolphin Orcaella brevirostris in the Cambodian Mekong River: an initial survey. Oryx 39(3): 301-310.
Baird, I .G. and M.S. Flaherty. 2000. Local waters, in terna t iona l markets : a rev iew of the sustainability of a Mekong River Probarbus fishery in southern Laos. Technical Report of the CESVI Project for Environmental Protection and Community Development in the Siphandone Wetland, Champassak Province, Lao PDR. Cooperazione e sviluppo (CESVI), Bergamo, Italy. 25 pp.
Baird, I.G., M. Baird, M.C. Chum, S. Kim, M. Nuon, S. Phat, B.N. Phouy, S. Prom, S. Ros, H. Rushton and P. Sia. 2002. A community-based study of the downstream impacts of the Yali Falls dam along the Se San, Sre Pok and Sekong rivers in Stung Treng province, Northeast Cambodia. Report for the Se San Protection Network Project, Oxfam America, Phnom Penh, Cambodia. 78 pp.
Bai rd , I .G . , V. In thaphays i , B . Phy la ivanh and P. Kisouvannalath. 1998. A rapid fishery survey in Khong District, Champasak Province, Southern Lao PDR. Technical Report of the CESVI Project for Environmental Protection and Community Development in the Siphandone Wetland, Champassak Province, Lao PDR. Cooperazione e sviluppo (CESVI), Bergamo, Italy. 31 pp.
Bao, T.Q., K. Bouakhamvongsa, S. Chan, K.C. Chhuon, T. Phommavong, A.F. Poulsen, P. Rukawoma, U. Suntornratana, D.V. Tien, T.T. Tuan, N.T. Tung, J. Valbo-Jorgensen, S. Viravong and N. Yoorong. 2001. Local knowledge in the study of river fish biology: experiences from the Mekong. Mekong Development Series No. 1. Mekong River Commission, Phnom Penh, Cambodia.
Baran E., T. Jantunen and P. Chheng. 2006. Developing a consultative Bayesian model for integrated management of aquatic resources: an inland coastal zone case study, p. 206-218 (chap. 16). In C.T. Hoanh, T. P. Tuong, J. W. Gowing and B. Hardy (eds.) Environment and livelihoods in tropical coastal zones. Managing agriculture – f ishery – aquaculture conf l icts. CABI Publishing, Wallingford, UK. 336 pp.
Baran, E. 2005. Cambodian inland fisheries: facts, figures and context. The WorldFish Center and Inland Fisheries Research and Development Institute (IFReDI), Phnom Penh, Cambodia. 49 pp.
Baran, E. and I.G. Baird. 2003. Approaches and tools for sustainable management of fish resources in the Mekong River Basin, p. 78-87. In M. Cao, K. Woods, H. Hu and L. Li (eds.) Biodiversity
chapTer � ���
management and sustainable development – Lancang-Mekong River in the new millennium. China Forestry Publishing House, Kunming, China. 246 pp.
Baran, E., N. Van Zalinge and P.B. Ngor. 2001a. Floods, floodplains and fish production in the Mekong Basin: present and past trends, p. 920-932. In A. Ahyaudin, M.R. Salmah, M. Mashhor, R. Nakamura, S. Ramakrishna, T. Mundkur (eds.) Proceedings of the Second Asian Wetlands Symposium, 27-30 August 2001, Penang, Malaysia. Penerbit Universiti Sains Malaysia, Penang, Malaysia. 1116 pp.
Baran, E., N. Van Zalinge, P. B. Ngor, I.G. Baird and D. Coates. 2001b. Fish resource and hydrobiological modelling approaches in the Mekong Basin. ICLARM, Penang, Malaysia and the Mekong River Commission Secretariat, Phnom Penh, Cambodia. 62 pp.
Baran, E., N. Van Zalinge and P.B. Ngor. 2001c. Analysis of the Cambodian Bagnet (dai) fishery data. ICLARM, Penang, Malaysia, Mekong River Commission Secretariat and Department of Fisheries, Phnom Penh, Cambodia. 62 pp.
Barlow, C. 2002. Size and value of the fishery in the Lower Mekong Basin (LMB). Textbox, p. 13-14. In S. Sverdrup-Jensen (ed.) Fisheries in the Lower Mekong Basin: status and perspectives. MRC Techn ica l Paper No . 6 . Mekong R ive r Commiss ion , Phnom Penh, Cambod ia . 103 pp.
Batista, V.S., A.J.F.C. Inhamuns and D. Freire-Brasil. 1998. Character izat ion of the f ishery in r iver communities in the low-Solim es/high-Amazon region. Fisheries Management and Ecology 5: 419-435.
Béné, C. and A.E. Neiland. 2003. Contribution of inland fisheries to rural livelihoods in Africa: an overview from the Lake Chad Basin areas, p. 67-77. In R.L. Welcomme and T. Petr (eds.) Proceedings of the Second International Symposium on the Management of Large Rivers for Fisheries, Volume 2. FAO Regional Office for Asia and the Pacific, Bangkok, Thailand. 310 pp.
Bernacsek, G. 1997a. Reservoirs: a boon or a curse to fisheries? Mekong Fish Catch and Culture 2(3): 1-3.
Bernacsek, G.M. 1997b. Large dam fisheries of the Lower Mekong countries: review and assessment; main report. Project on Management of Fisheries Reservoirs in the Mekong Basin. Mekong River Commission, Phnom Penh, Cambodia. Vol. I. 118 pp.
Blaber, S.J. 2002. Fish in hot water: the challenges facing fish and fisheries research in tropical estuaries. Journal of fish biology 61(1-A): 1-20.
Bonheur, N. 2001. Tonle Sap ecosystem and value. Technical Coordination Unit for the Tonle Sap, Ministry of Environment, Phnom Penh, Cambodia. 46 pp.
Bonheur, N. and B.D. Lane. 2002. Natural resources management for human security in Cambodia’s Tonle Sap Biosphere Reserve. Environmental Science and Policy 5: 33-41.
Buncha, A. 2003. Reconsidering creating a body of knowledge for sustainable socio-economic development in the Upper Mekong Basin, p. 160-167. In M. Cao, K. Woods, H. Hu and L. L i (eds. ) Biodiversi ty management and sustainable development – Lancang-Mekong River in the new millennium. China Forestry Publishing House, Kunming, China. 246 pp.
Bush, S. 2002. Comparative advantage: changing market structures and food security in the Siphandone f i sher y, Lao PDR. P resenta t ion a t the International Symposium on Sustaining Food Security and Managing Natural Resources in Southeast Asia, 8-11 January 2002, Chiang Mai, Thailand.
Bush, S. 2003a. “Give a man a fish…”; contextualising living aquatic resources development in the Lower Mekong Basin. Australian Mekong Resource Centre, Working Paper No. 8. University of Sydney, Australia. 38 pp.
Bush, S. 2003b. Comparing what matters with what is done: fisheries and aquaculture in the Lao PDR. Contribution to the Second International Symposium on the Management of Large Rivers for Fisheries, 11-14 February 2003, Phnom Penh, Cambodia.
Bush, S. 2004a. Needing the supply, or supplying the need? A political ecology of Mekong fishery statistics at different scales. Presentation at the Institute of Australian Geographers Conference, April 2004, Glenelg, Australia. 32 pp.
Bush, S. 2004b. Scales and sales: changing spatial and social fish trading networks in the Siiphandone fishery, Lao PDR. Singapore Journal of Tropical Geography 25(1): 32-50.
Bush, S.R. and P. Hirsch. 2005. Framing fishery decline. Aquatic Resources, Culture and Development 1(2): 79-90.
Campbell, I.C. 2003. Invertebrates, biodiversity and the Upper Lancang-Mekong navigation project p. 97-105. In M. Cao, K. Woods, H. Hu and L. Li (eds.) Biodiversity management and sustainable development – Lancang-Mekong River in the new millennium. China Forestry Publishing House, Kunming, China. 246 pp.
Campbell, I.C. 2005. Integrated water management for the Mekong River Basin, p. 250-266. In A.K. Biswas, O. Varis and C. Tortajada (eds.) Integrated water resources management in South and Southeast Asia. Water Resources Management Series, Oxford India Paperbacks. Oxford University Press, New Dehli, India. 353 pp.
Carl Bro Management. 1996. Geographical, social and socioeconomic assessment of the fishery industry in Vietnam: Fisheries Master Plan Sub-Project II. Final Report Ministry of Fisheries,

��0 Tropical river fisheries valuaTion: background papers To a global synThesis
Hanoi, Vietnam, and Danida, Copenhagen, Denmark.
Chapman, E.C. and D. He. 2000. Downstream implications of China’s dams on the Lancang Jiang (Upper Mekong) and their potential significance for greater regional cooperation basin-wide. 8 pp. Web-based article [Online: http://asia.anu/mekong/dams.html]
Chevey, P. 1933. The Great Lake of Cambodia: the underlying causes of its richness in fish, p. 3809-3816. In Proceedings of the Fifth Pacific Science Congress, Vancouver, Canada.
Chevey, P. 1938. La pêche au Cambodge. Bulletin de la Société Centrale d’Aquiculture et de Pêche. Tome 45 (4-6): 35-44.
Chevey, P. and F. Le Poulain. 1939. Rapport préliminaire s u r l a p ê c h e d a n s l e s e a u x d o u c e s cambodgiennes. Etudes scientifique, technique et économique. Extrait du Bulletin Economique de l’Indochine, fascicules 1 et 2. 124 pp.
Chevey, P. and F. Le Poulain. 1940. La pêche dans les eaux douces du Cambodge. Travaux de l’Institut Océanographique de l’Indochine. 5e mémoire. 195 pp.
Chheng, V. 1999. Case study of fishing lot nº 3 in Siem Reap Province, Cambodia, p. 111-114. In N. Van Zal inge, N. Thuok and D. Loeung (eds.) Proceedings of the Annual Meeting of the Department of Fisheries of the Ministry of Agriculture, Forestry and Fisheries, 19-21 January 1999, Phnom Penh, Cambodia. DOF/MRC/Danida project for Management of the Freshwater Capture Fisheries of Cambodia, Phnom Penh, Cambodia. 150 pp.
Claridge, G.F., T. Sorangkhoun and I.G. Baird. 1997. Community fisheries in the Lao PDR: a survey of techniques and issues. IUCN, the World Conservation Union, Vientiane, Lao PDR. 69 pp.
CNMC/Nedeco, 1998. Sectoral studies: environment in the Tonle Sap area. Natural resources-based development strategy for the Tonle Sap area, Cambodia. Final report, Vol. 2, part A. Cambodian National Mekong Committee (CNMC), Mekong River Commission (MRC) and United Nations Development Programme (UNDP), Phnom Penh, Cambodia.
Coates, D. 2002. Inland capture fishery statistics of Southeast Asia: Current status and information needs. Asia-Pacific Fishery Commission, Bangkok, Thailand. FAO-RAP Publication No. 2002/11. FAO Regional Office for Asia and the Pacific, Bangkok, Thailand. 114 pp.
Coates, D. 2003. An overview of inland capture fishery statistics of Southeast Asia, p. 40-44. In FAO Regional Office for Asia and the Pacific (ed.) New approaches for the improvement of inland capture fishery statistics in the Mekong Basin. FAO-RAP publication 2003/1. FAO-RAPA, Bangkok, Thailand. 145 pp.
Coates, D., P. Ouch, U. Suntornratana, N.T. Tung and S. Viravong. 2003. Biodiversity and fisheries in the Lower Mekong Basin. Mekong Development Series No. 2. Mekong River Commission, Phnom Penh. 30 pp.
Coates, D., T. Boivin, W.R.T. Darwall, R. Friend, P. Hirsch, A.F. Poulsen, R. Quirós, T.A.M. Visser and M. Wallace. 2004. Information, knowledge and policy, p. 93-118. In R.L. Welcomme and T. Petr (eds.) Proceedings of the Second International Symposium on the Management of Large Rivers for Fisheries, Vol. 1. FAO Regional Office for Asia and the Pacific, Bangkok, Thailand. 356 pp.
Cowx, I., O. Almeida, C. Béné, R. Brummett, S. Bush, W. Darwall, J. Pittock and M. van Brakel. 2004. Value of river fisheries, p. 1-20. In R.L. Welcomme and T. Petr (eds.) Proceedings of the Second International Symposium on the Management of Large Rivers for Fisheries, Vol. 2. FAO Regional Office for Asia and the Pacific, Bangkok, Thailand.
Daconto, G. (ed.). 2001. Siphandone wetlands. Cooperazione e sviluppo (CESVI), Bergamo, Italy. 192 pp.
Davidson, A. 1975. Fish and fish dishes of Laos. Imprimerie Nationale, Vientiane, Lao PDR. 202 pp.
Deap, L. 1999. The bagnet (Dai) fishery in the Tonle Sap River, p. 141-150. In N. Van Zalinge, N. Thuok and L. Deap (eds.) Proceedings of the Annual Meeting of the Department of Fisheries of the Ministry of Agriculture, Forestry and Fisheries, 19-21 January 1999, Phnom Penh, Cambodia. DOF/MRC/Danida project for Management of the Freshwater Capture Fisheries of Cambodia, Phnom Penh, Cambodia. 150 pp.
Degen, P. and N. Thuok. 2000. Historical, cultural and legal perspectives on the fishing lot system in Cambodia, p. 49-60. In M. Ahmed and P. Hirsch (eds.) Common property in the Mekong: issues of sustainability and subsistence. ICLARM Studies and Reviews No. 26. 67 pp.
Degen, P., F. Van Acker, N. Van Zalinge, N. Thuok and V. Ly. 2000. Taken for granted: confl icts over Cambodia’s f reshwater f ish resources. Presentation at the 8th International Association for the Study of Common Property (IASCP) Conference, 31 May-4 June 2000, Bloomington, Indiana, USA. 30 pp.
DFID (Department for International Development). 2000. Poverty and aquatic resources in Vietnam: an assessment of the role and potential of aquatic resource management in poor people’s livelihoods. UK Department for International Development, Bangkok, Thailand. 36 pp.
Dixon, P.-J., P. Sultana, P. Thompson, M. Ahmed, K. Lorenzen and A.S. Halls. 2003. Understanding livelihoods dependent on inland fisheries in Bangladesh and Southeast Asia. Synthesis report. The WorldFish Center, Penang, Malaysia.
DOF (Department of Fisheries). 2001a. Social and economic framework review. Agriculture productivity improvement project, Technical paper No. 8.
chapTer � ��1
Department of Fisheries, Ministry of Agriculture, Forestry and Fisheries, Phnom Penh, Cambodia. 22 pp.
DOF (Department of Fisheries). 2001b. Inland fisheries review. Agriculture productivity improvement project, Technical paper No. 2. Department of Fisheries, Ministry of Agriculture, Forestry and Fisheries, Phnom Penh, Cambodia. 42 pp.
DOF (Department of Fisheries). 2001c. Trade, marketing and processing of fisheries and fisheries product review. Agriculture productivity improvement project, Technical paper No. 6. Department of Fisheries, Ministry of Agriculture, Forestry and Fisheries, Phnom Penh, Cambodia. 22 pp.
Dubeau, P., P. Ouch and S.G. Sjorslev. 2001. Estimating fish and aquatic animal productivity/yield per area in Kampong Tralach: an integrated approach, p. 143-164. In Cambodia Fisheries Technical Paper Series, Vol. III, Inland Fisheries Research and Development Inst i tute of Cambodia (IFReDI), Phnom Penh, Cambodia. 233 pp.
Dudgeon, D. 2000. Large-scale hydrological changes in tropical Asia: prospects for riverine biodiversity. BioScience 50(9): 793-806.
Dudgeon, D. 2003. The contribution of scientific information to the conservation and management of freshwater biodiversity in tropical Asia. Hydrobiologia 500(1-3): 295-314.
Dugan, P.J., E. Baran, R. Tharme, M. Prein, R. Ahmed, P. Amerasinghe, P. Bueno, C. Brown, M. Dey, G. Jayasinghe, M. Niasse, A. Nieland, V. Smakhtin, N. Tinh, K. Viswanathan and R. Welcomme. 2002. The contribution of aquatic ecosystems and fisheries to food security and livelihoods: a research agenda. Challenge Programme on Water and Food, Background Paper No. 3. 28 pp.
EJF (Environmental Justice Foundation). 2002. Death in small doses: Cambodia’s pesticides problems and solutions. Environmental Justice Foundation, London, U.K. 37 pp.
Elvevoll, E.O. and D.G. James. 2004. Potential benefits of fish for maternal, foetal and neonatal nutrition: a review of the literature. Food, nutrition and agriculture, Vol. 27. [Online: www.fao.org/docrep/003/X8576M/x8576m05.htm]
Emerton, L. and E. Bos. 2004. Values: counting ecosystem as an economic part of water. IUCN, World Conservation Union, Gland, Switzerland and Cambridge, U.K. 88 pp.
FACT (Fisheries Action Coalition Team). 2001. Feast or famine? Solutions to Cambodia’s fisheries conflicts. Fisheries Action Coalition Team in collaboration with Environmental Justice Foundation (EJF), U.K.. 41 pp. [Online: www.ejfoundation.org/pdfs/feast_or_famine.pdf]
FAO (Food and Agriculture Organization). 1999. Fishery country profile: the Lao People’s Democratic Republic. FAO Fisheries Department, Rome, Italy.
FAO (Food and Agriculture Organization). 2003. Myanmar aquaculture and inland fisheries mission report. RAP publication 2003/18. FAO Regional Office for Asia and the Pacific, Bangkok, Thailand. 60 pp.
FAO/PADP (Food and Agriculture Organization / Provincial Aquaculture Development Project). 1998. Small-scale rural aquaculture in the Lao PDR. Field document No. 11, Provincial Aquaculture Development Project LAO/97/007, FAO/UNDP, Vientiane, 16 pp.
FEER (Far Eastern Economic Review), 2004. The Mekong dammed-a great river at risk. Far Eastern Economic Review, 26 August 2004.
Feng, Y., D. He and H. Bao. 2004 Analysis on equitable and reasonable allocation models of water resources in the Lancang-Mekong River Basin. Water International 29(1): 114–118.
Fisheries Office. 2000. A study of the downstream impacts of the Yali Falls Dam in the Se San River Basin in Ratanakiri Province, northeastern Cambodia. Fisheries Office, Ratanakiri Province and the Non-Timber Forest Products (NGO). 43 pp.
Fox, C. 2004. Flood pulses, international watercourse law and common property resources: a case study of the Mekong Lowlands. Presentation at the Conference Unlocking human potential: linking the informal and formal sectors. World Institute for Development Economics Research, 17-18 September 2004, Helsinki, Finland. 21 pp.
Friend, R. 2001. A people-centred fishery: socio-economic perspectives, p. 75-88. In G. Daconto (ed.) Siphandone wetlands. Cooperazione e sviluppo (CESVI), Bergamo, Italy. 192 p.
Froese, R. and D. Pauly (eds). 2000. FishBase. World Wide Web electronic publication. www.fishbase.org.
Garaway, C.J. 1999. Small water body fisheries and the potential for community-led enhancement: case studies in the Lao PDR. Ph.D. dissertation. Imperial College of Science Technology and Medicine, London, U.K. 414 pp.
Garaway, C.J. 2005. Fish, fishing and the rural poor. A case study of the household importance of small-scale f isheries in the Lao PDR. Aquatic Resources, Culture and Development 1(2): 131-144.
General Statistical Office, 1999. Statistical data of agriculture, forestry and fisheries 1990-1998 and forecast for year 2000. General Statistical Office, Department of Agriculture, Forestry and Fisheries. Statistical Publishing House, Hanoi, Vietnam. 380 pp.
Gerrard, P. 2004. Integrating wetland ecosystem values into urban planning: the case of That Luang Marsh, Vientiane, Lao PDR. IUCN − The World Conservation Union, Asia Regional Environmental Economics Programme and World Wildlife Fund (WWF) Lao Country Office, Vientiane, the Lao PDR. 35 pp.
��� Tropical river fisheries valuaTion: background papers To a global synThesis
Giteau, M. and M. Martin. 1995. Saveurs et cuisine à travers les âges au Cambodge, p. 205-235. In F. Blanchon (ed.) Asie - savourer, goûter. CREOPS, Presses de l’Université de la Sorbonne, Paris, France. 401 pp.
Goh, E. 2004. China in the Mekong River Basin: the regional security implications of resources development in the Lancang Jiang. Working Paper No. 69. Institute of Defense and Strategic Studies, Singapore. 17 pp.
Gourou, P. 1984. Riz et civilisation. Fayard, Paris, France. 299 pp.
Gum, W. 2000. Inland aquatic resources and livelihoods in Cambodia: a guide to the literature, legislation, institutional framework and recommendations. Consultancy report for Oxfam U.K. and NGO Forum on Cambodia. Oxfam, Phnom Penh, Cambodia. 122 pp.
Guttman, H. and S. Funge-Smith. 2000. The role of aquaculture in rural subsistence livelihoods in the Lao PDR Provincial Aquaculture Development Project (LAO/97/007). STS Field Document No. 9. FAO Regional Office for Asia and the Pacific, Bangkok, Thailand.29 pp.
Haapala, U. 2003. Where do you go? Migration and urbanisation in Cambodia. Water Utilisation Project (WUP)-FIN socio-economic studies on Tonle Sap No. 9. MRCS/WUP-FIN, Phnom Penh, Cambodia. 43 pp.
Halcrow Ltd. 2004a. Decision Support Framework (DSF) user guides. Vol. 2 of the Final Report of the Water Utilisation Project Component A: Decision Support Framework. Halcrow Ltd. and Mekong River Commission, Phnom Penh, Cambodia. 15 pp.
Halcrow Ltd. 2004b. Impact analysis tools. Vol. 13 of the Final Report of the Water Utilisation Project Component A: Decision Support Framework. Halcrow Ltd. and Mekong River Commission, Phnom Penh, Cambodia.
Halcrow Ltd. 2004c. Knowledge base data catalogue. Vol. 16 of the Final Report of the Water Utilisation Project Component A: Decision Support Framework. Halcrow Ltd. and Mekong River Commission, Phnom Penh, Cambodia.
Halcrow Ltd. 2004d. DSF testing and evaluation. Vol. 13 of the Final Report of the Water Utilisation Project Component A: Decision Support Framework. Halcrow Ltd. and Mekong River Commission, Phnom Penh, Cambodia.
Halwart, M., D. Bartley and H. Guttman (eds.) 2003. Traditional use and availability of aquatic biodiversity in rice-based ecosystems in Southeast Asia; a series of four studies in Cambodia, China, Laos and Vietnam. CD ROM. Food and Agriculture Organization (FAO), Rome, Italy.
Hap, N., L. Seng, R. Chuenpagdee. 2006. Socioeconomics and livelihood values of the Tonle Sap Lake fisheries. Inland Fisheries Research and
Development Institute, Phnom Penh, Cambodia. 24 pp.
Hardner, J., T. Somony and C. Heng. 2002. Living with the Mekong River flood: economic perspectives and local perceptions. World Wildlife Fund (WWF) Report prepared for the Living Mekong Initiative. World Wide Fund for Nature, Phnom Penh, Cambodia. 14 pp.
Hashimoto, T.R. 2001. Environmental issues and recent infrastructure development in the Mekong Delta: review, analysis and recommendations with particular reference to large-scale water control projects and the development of coastal areas. Working Paper Series. Working Paper No. 4. Australian Mekong Resource Centre, University of Sydney, Australia. 70 pp.
He, D. and L. Chen. 2002. The impact of hydropower cascade development in the Lancang-Mekong Basin, Yunnan. Mekong Update and Dialogue 5(3): 2-4. Australian Mekong Resource Centre, University of Sydney, Australia.
He, D. and T.K. Hsiang. 1997. Facilitating regional sustainable development through integrated multi-objective utilization, management of water resources in the Lancang- Mekong River Basin. Journal of Chinese Geography 7(4): 9-21.
Heinonen, J. and K. Vainio-Mattila. 1999. Biodiversity/ecotourism assessments in Yunnan, China. Report for the ADB project Poverty reduction and environmental management in remote Greater Mekong Subregion watersheds. Asian Development Bank, Manila, Phil ippines. 25 pp.
Hickey, J.T. and G.E. Diaz. 1999. From flow to fish to dollars: an integrated approach to water allocation. Journal of the American water resources association, Vol. 35, No. 5. American Water Resources Association.
Hill, M.T. and S.A. Hill. 1994. Fisheries ecology and hydropower in the Lower Mekong River: an evaluation of run-of-the-river projects. Don Chapman Consultants Inc. and Mekong River Commission Secretariat, Bangkok, Thailand. 106 pp.
Hirji, R. and T. Panella. 2003. Evolving policy reforms and experiences for addressing downstream impacts in World Bank water resources projects. River Research and Applications 19: 667-681.
Hirsch, P. 2004. The politics of fisheries knowledge in the Mekong R ive r Bas in , p . 91-101. I n R.L. Welcomme and T. Petr (eds.) Proceedings of the Second International Symposium on the Management of Large Rivers for Fisheries, Vol. 2. FAO Regional Office of Asia and the Pacific, Bangkok, Thailand. 310 pp.
Hogan, Z.S., P.B. Moyle, B. May, M.J. Vander Zanden and I.G. Baird. 2004. The imperiled giants of the Mekong. American Scientist 92(3): 228-237.
Hortle, K.G., P.B. Ngor, R. Hem and S. Lieng. 2004b. Trends in the Cambodian dai fishery: floods and fishing

chapTer � ���
pressure. Mekong Fish Catch and Culture 10(1): 7-9.
Hortle, K.G., S. Lieng and J. Valbo-Jorgensen. 2004a. An introduction to Cambodia’s inland fisheries. Mekong Development Series No. 4. Mekong River Commission, Vientiane, Lao PDR. 41 pp.
Hortle, K.G. and S.R. Bush. 2003. Consumption in the Lower Mekong Basin as a measure of fish yield, p. 76-82. In FAO Regional Office of Asia and the Pac i f i c ( ed . ) New approaches fo r the improvement of inland capture fishery statistics in the Mekong Basin. FAO-RAP publication 2003/1. FAO Regional Office of Asia and the Pacific, Bangkok, Thailand. 145 pp.
In, M., M.H. Nakata, S. Tanabe and S.T. Touch. 1999. Persistent organochlorine residues in marine and freshwater fish in Cambodia. Marine Pollution Bulletin 38(7): 604-612.
IRN (International Rivers Network). 1999. Power struggle: the impacts of hydro-development in Laos. Internat ional Rivers Network, Berkeley, California, U.S.A. 68 pp.
Israel, D.C., M. Ahmed, B.H. Yeo and M.C. Hong. 2005. Aquatic resources valuation and policies for poverty elimination in the Lower Mekong Basin. Department for International Development (DFID) and The WorldFish Center, Penang, Malaysia. 189 pp. + annexes.
Ivanoff, J. 2003. Le partage des eaux en Asie du Sud-Est, p. 147-171. In A. Geistdoerfer, J. Ivanoff and J. Matras-Guin (eds.) La mer dévorée. Collection Kétos, CETMA, Muséum National d’Histoire Naturelle, Paris, France. 283 pp.
Jantunen, T. 2004. Integration of hydrological, land use and water quality data to a model of the Tonle Sap fish resource. ADB/The WorldFish Center project Technical Assistance for capacity building of Inland Fisheries Research and Development Institute (IFReDI). The WorldFish Center and Inland Fisheries Research and Development Institute (IFReDI), Department of Fisheries, Phnom Penh, Cambodia. 59 pp.
Jensen, J. 1996. 1,000,000 tonnes of fish from the Mekong? Mekong Fish Catch and Culture 2(1): 1-2.
Jensen, J. 2000. Can this really be true? Rice, yes, and fish please! Mekong Fish Catch and Culture 5(3): 1-3.
Jensen, J. 2001a. Managing fish, floodplains and food security in the Lower Mekong Basin. Water Science and Technology 43(9): 157-164.
Jensen, J. 2001b. Traditional fish productions: the milk of Southeast Asia. Mekong Fish Catch and Culture 6(4): 1-4.
Jensen, J. 2001c. Fish passes in Australia – a national success; can it be copied in the Mekong? Mekong Fish Catch and Culture 6(3): 1-5.
Johnston R., P. Rowcroft, K.G. Hortle and C. McAllister. 2003. Integrating environmental values into resource allocation - MRC’s approach in the Lower Mekong Basin. Presentation at Workshop on Integrating Environmental Impacts into Water
Allocation Models of the Mekong River Basin, 15 December 2003, University of Economics, Ho Chi Minh City, Vietnam. 14 pp.
Jones, J.A.A. 1997. Global hydrology: processes, resources and environmental management. Longman, Harlow and New York, U.S.A. 364 pp.
Kaing, K., S. Thay, N. Thuok and M. Ahmed. 2003. Understanding livelihoods dependent on inland fisheries in Bangladesh and Southeast Asia. Cambodia PRA report. The WorldFish Center, Penang, Malaysia.
Ker, N., V. Sem and D. Griffiths. 2001. Fish price monitoring in Kandal, Prey Veng and Takeo Provinces of Cambodia, p. 165-175. In Inland Fisheries Research and Development Institute of Cambodia (IFReDI). Cambodia Fisheries Technical Paper Series, Volume III. Inland Fisheries Research and Development Institute of Cambodia (IFReDI), Phnom Penh, Cambodia. 233 pp.
Keskinen, M. 2003. The great diversity of livelihoods: socio-economic survey of the Tonle Sap Lake. Water Utilisation Program - Modelling of the Flow Regime and Water Quality of the Tonle Sap MRCS/WUP-F IN Pro ject . Mekong R iver Commission and Finnish Environment Institute, Phnom Penh, Cambodia. 126 pp.
Keskinen, M., S. Yim and P. Noy. 2002. Floating and fishing: field study in Kampong Preah village, Kampong Chhnang. WUP-FIN Socio-Economic Studies on Tonle Sap No. 1, Mekong River Commission and Finnish Environment Institute, Phnom Penh, Cambodia.
Khin, S. 1993. Notes sur la pêche et la cueillette des plantes spontanées des réfugiés Cambodgiens en milieu semi-urbain, p. 249-261. In N. Krowolski (ed.) Autour du r iz – le repas chez quelques populations d’Asie du Sud-Est. L’Harmattan, Paris, France. 261 pp.
Kim, S. and V. Hav. 2004. Fisheries and aquaculture in Cambodia’s wetland environment, p. 1-13. In M. Torell, A. Salamanca and B. Ratner (eds.) We t l a n d s m a n a g e m e n t i n C a m b o d i a : soc ioeconomic , eco log ica l , and po l icy perspectives. The WorldFish Center Technical Report No. 64. The WorldFish Center, Penang, Malaysia. 45 pp.
Kristensen, J. 2000. Experience in international cooperation for planning and sustainable development of the Mekong River Basin. Paper prepared for the Fourth Regional Consultation of the World Commission on Dams, 26-27 February 2000, Hanoi, Vietnam. 9 pp.
Kristensen, J. 2001. Food security and development in the Lower Mekong River Basin: a challenge for the Mekong River Commission. Presentation at the Asia and Pacific Forum on Poverty: reforming policies and institutions for poverty reduction. Asian Development Bank, 5-9 February 2001, Manila, Philippines. 25 pp.
Kummu, M. 2003. The historical water management of Angkor, Cambodia. Presentation at the World

��� Tropical river fisheries valuaTion: background papers To a global synThesis
Archaeological Congress 2003, 21-26 June 2003,Washington D.C., U.S.A. 27 pp.
Kummu, M., J. Koponen and J. Sarkkula. 2005. Assessing impacts of the Mekong development in the Tonle Sap Lake. Presentation at the Symposium Role of Water Sciences in Transboundary River Basin Management, March 2005, Ubon Ratchathani, Thailand. 10 pp.
Lagler, K.F. 1976. Fisheries and integrated Mekong River Basin development. The University of Michigan, School of Natural Resources, Ann Arbor, Michigan, U.S.A. 363 pp.
Le Poulain, F. 1942. La coopérative des pêcheries d’eau douce du Cambodge. 39e note de L’Institut Océanographique de l’Indochine, France. 20 pp.
LECS 2. 1999. The households of Lao PDR – Social and economic indicators from the Lao Expenditure and Consumption Survey 1997/98. National Statistics Center, State Planning Committee, Vientiane, Lao PDR. 67 pp.
Levy-Ward, A. 1993. Etes-vous capable de manger de la nourriture Isan? p. 17-81. In N. Krowolski (ed.) Autour du r iz – le repas chez quelques populations d’Asie du Sud-Est. L’Harmattan, Paris, France. 261 pp.
Lieng, S. and N. Van Zalinge. 2001. Fish yield estimation in the floodplains of the Tonle Sap Great Lake and River, Cambodia, p. 23-26. In Inland Fisheries Research and Development Institute of Cambodia (IFReDI). Cambodia Fisheries Technical Paper Series, Vol. III. Mekong River Commission (MRC) and Department of Fisheries, Phnom Penh, Cambodia. 233 pp.
Little, D.C., P. Surintaraseree and N. Ines-Taylor. 1996. Fish culture in rain-fed rice fields of northeast Thailand. Aquaculture 140: 295-321.
Lorenzen, K., N.S. Khoa, C. Garaway, R. Arthur, G. Kirkwood, B. Chamsingh, D. Litdamlong, N. Innes-Taylor and D. Siebert. 2000. Impacts of irrigation and aquaculture development on small-scale aquatic resources. Department of Internat ional Deve l opmen t , Env i r onmen t Resea rch Programme. Imperial College, London, U.K. 59 pp.
Lorenzen, K., X. Choulamany and P. Sultana. 2003a. Understanding livelihoods dependent on inland fisheries in Bangladesh and Southeast Asia. Lao PDR Country Status Report. The WorldFish Center, Penang, Malaysia. 28 pp.
Lorenzen, K., X. Choulamany and P. Sultana. 2003b. Understanding livelihoods dependent on inland fisheries in Bangladesh and Southeast Asia. Lao PDR Summary Report. The WorldFish Center, Penang, Malaysia. 15 pp.
Mak, S. 2000. Vulnerability of fisheries in Cambodia. Presentation at the conference Accounting for Deve lopment : Aus t ra l ia and the As ian Development Bank in the Mekong Region. 23-24 June 2000, Sydney, Australia. [Online: www.ngoforum.org.kh]
Makkonen, K. 2005. Mekong cooperation - the linkages between poverty, environment and transboundary water management in southwest China’s Yunnan Province. Presentation at the Seventh Biennial Nordic Conference on Chinese Studies, 7-9 June 2005, Helsinki, Finland. 13 pp.
Maris, B. 2005. Antimanuel d’économie. Breal, Rosny, France. 359 pp.
Matics, K.I. 2001. The role of networks in addressing research and development issues on women in fisheries: fisheries networks in the Mekong Basin, p. 45-56. I n M.J. Wi l l iams, M.C. Nandeesha., K.I. Matics, V.P. Corral, E. Tech and P.S. Choo (eds.) International Symposium on Women in Fisheries. ICLARM, the WorldFish Center, Penang, Malaysia. 156 pp.
Mattson, N., K. Buakhamvongsa, N. Sukumasavin, N. Tuan and O. Vibol. 2002b. Cambodia Mekong giant fish species: on their management and biology. MRC Technical Paper No. 3. Mekong River Commission, Phnom Penh, Cambodia. 29 pp.
Mattson, N., V. Balavong, H. Nilsson, S. Phounsavath and W. Hartmann. 2001. Changes in fisheries yield and catch composition at the Nam Ngum Reservoir, Lao PDR. In S.S. De Silva (ed.) Reservoir and culture-based fisheries: biology and mana gemen t . P roceed ings o f an International Workshop, 15 to 18 February 2000, Bangkok, Thailand. ACIAR Proceedings No. 98. 384 pp.
Mattson, N., W. Hartmann and T. Augustinus. 2002a. Reservoir fisheries information: from statistics to management, p. 83-88. In FAO Regional Office for Asia and the Pacific (ed.) New approaches for the improvement of inland capture fishery statistics in the Mekong Basin. FAO-RAP publication 2003/1. FAO Regional Office for Asia and the Pacific, Bangkok, Thailand. 145 pp.
McDowall, R.M. 2002. Evaluation of the report on environmental impact assessment of the navigation channel improvement project of the Lancang-Mekong River from China-Myanmar boundary marker 243 to Ban Houei Sai of Laos. The fisheries impacts reviewed. Report of the National Institute of Water and Atmospheric Research Ltd. for the Mekong River Commission. Mekong River Commission, Phnom Penh, Cambodia. 12 p.
McKenney, B. 2001. Economic valuation of livelihood income losses and other tangible downstream impacts from the Yali Falls dam to the Se San River Basin in Ratanakiri Province, Cambodia. Oxfam America, Phnom Penh, Cambodia. 24 p.
McKenney, B. and P. Tola. 2002. Natural resources and rural livelihoods in Cambodia: a baseline assessment. Working Paper No. 23. Cambodia Development Resource Institute, Phnom Penh, Cambodia.
McKenney, B. and P. Tola. 2004. Prahoc and food security: an assessment at the Dai fisheries. Cambodia Development Review Vol. 8(1). Cambodia

chapTer � ���
Development Resource Institute, Phnom Penh, Cambodia.
Meusch, E., J. Yhoung-Aree, R. Friend and S.J. Funge-Smith. 2003. The role and nutritional value of aquatic resources in the livelihoods of rural people – a participatory assessment in Attapeu Province, Lao PDR. FAO-RAP publication 2003/11. FAO Regional Office for Asia and the Pacific, Bangkok, Thailand. 34 pp.
MFD (Mekong Fish Database). 2003. Mekong Fish Database: a taxonomic fish database for the Mekong Basin. CD-ROM. Mekong River Commission, Phnom Penh, Cambodia.
Mogensen, M.T. 2001. The importance of fish and other aquatic animals for food and nutrition security in the Lower Mekong Basin. M.Sc. thesis. Research Department of Human Nutrition, the Royal Veterinary and Agricultural University, Denmark. 126 pp.
Mollot, R., C. Phothitay and S. Kosy. 2003. Seasonally flooded habitat and non-timber forest products: supporting biodiversity and local livelihoods in southern Lao PDR. Contr ibut ion to the Proceedings of the MRC Sixth Technical Symposium on Mekong Fisheries, 26-28 November 2003, Vientiane, the Lao PDR. World Wildlife Fund (WWF) Lao Programme and WWF Living Mekong Initiative, Vientiane, the Lao PDR. 28 p.
Mouhot, H. 1868. Voyage dans les royaumes de Siam, de Cambodge, de Laos et autres parties centrales de l’Indo-Chine. Editions Olizane, Geneve, Switzerland, 1999 (reprint). 315 p.
MRAG (Marine Resources Assessment Group). 2002. Community fisheries: lessons from southern Lao PDR. Marine Resources Assessment Group, London, U.K. 28 pp.
MRC (Mekong River Commission). 1997. Greater Mekong Subregion state-of-the-environment report. Mekong River Commission and United Nations Environment Programme. Bangkok, Thailand. 107 pp.
MRC (Mekong River Commission). 2001. MRC Hydropower development strategy. Water Resources and Hyd ro log y P rog ramme, Mekong R i ve r Commiss ion , Phnom Penh , Cambod ia . 130 pp.
MRC (Mekong River Commission). 2003a. Social atlas of the Lower Mekong Basin. Mekong River Commiss ion , Phnom Penh , Cambod ia . 153 pp.
MRC (Mekong River Commission). 2003b. State of the Basin Report: 2003. Executive summary. Mekong River Commission, Phnom Penh, Cambodia. 50 pp.
MRC (Mekong River Commission). 2004a. Annual Report o f t he MRC P rog ramme fo r F i she r i es Management and Development Cooperation, April 2003 – March 2004. Mekong River Commission, Vientiane, Lao PDR.
MRC (Mekong River Commission). 2004b. Mekong River Commission website, February 2005. [Online: www.mrcmekong.org]
MRC (Mekong River Commission). 2005. Annual Report of the MRC Programme for Fisheries Management and Development Cooperation, April 2004 – March 2005. Mekong River Commission, Vientiane, Lao PDR.
MRCS (Mekong River Commission Secretariat). 1992. Fisheries in the Lower Mekong basin; review of the fishery sector in the Lower Mekong Basin. Mekong River Commission Secretariat, Bangkok, Thailand. 92 pp + annexes.
NACA (Network of Aquaculture Centres in Asia-Pacific). 2000. State of Asian aquaculture. Aquaculture Asia 5(1): 4-24.
Ngo, S.V. and T.L. Le. 2001. Status of reservoir fisheries in Vietnam. In S.S. De Silva (ed.) Reservoir and cu l t u r e -based f i she r i e s : b i o l og y and management. Proceedings of an International Workshop, 15-18 February 2000, Bangkok, Thailand. ACIAR Proceedings No. 98. 384 pp.
Nam, S. 2000. Mekong River flow data analysis, p. 23-29. In N. Van Zalinge, N. Thuok and S. Lieng (eds.) Management aspects of Cambodia’s freshwater fisheries. Mekong River Commission and Department of Fisher ies, Phnom Penh, Cambodia. 170 pp.
Nandeesha, M.C. 2001. Help me to help myself: highlights of Phnom Penh Seminar on Women in Fisheries in Indochina Countries, p. 39-44. In M.J. Williams, M.C. Nandeesha, K.I. Matics, V.P. Corral, E. Tech and P.S. Choo (eds.) International Symposium on Women in Fisheries. ICLARM, the WorldFish Center, Penang, Malaysia. 156 pp.
Nao, T., S. Ly. 1998. Review of the fisheries and aquaculture sector in Cambodia. In CNMC/Nedeco (eds) Natural resources-based development strategy for the Tonle Sap area, Cambodia. Final project report, volume 2, part A. MRC/UNDP Phnom Penh, Cambodia.
Nao, T., N. So, and S. Thor. 2001. Cambodia’s fish processing and marketing and distribution of fish and fishery products. Paper presented at the Conference on Export Potentials for Cambodian Fishery Products, 6 February 2001, Phnom Penh, Cambodia.
Neiland, A.E. and C. Béné (eds.). 2006. Tropical river fisheries valuation: A global synthesis and critical review. Comprehensive Assessment of Water Management in Agriculture Research Report 15. International Water Management Institute, Colombo, Sri Lanka. 45 pp.
Ngo, S.V. and T.L. Le. 2001. Status of reservoir fisheries in Vietnam. In S.S. De Silva (ed.) Reservoir and cu l t u r e -based f i she r i e s : b i o l og y and management. Proceedings of an international workshop, 15-18 February 2000, Bangkok, Thailand. ACIAR Proceedings No. 98. 384 pp.

��� Tropical river fisheries valuaTion: background papers To a global synThesis
Ngor, P.B. 1999. Catfish fry collection in the Mekong River of Kandal/Phnom Penh, p. 124-134. In N. Van Zalinge, N. Thuok and D. Loeung (eds.) Present status of Cambodia’s freshwater capture fisheries and management implications. Mekong River Commission and Department of Fisheries, Phnom Penh, Cambodia. 150 pp.
Nguyen Khoa, S., K. Lorenzen, C.J. Garaway and B. Chamsingh. 2003. Impacts of i rr igat ion development on capture fisheries in rice-based farming systems of Southern Laos. Contribution to the Second International Symposium on the Management of Large Rivers for Fisheries, 1 1 - 1 4 Fe b r u a r y 2 0 0 3 , P h n o m Pe n h , Cambodia.
Nguyen, M.Q. 2003. Hydrologic impacts of China’s upper Mekong dams on the Lower Mekong River. Mekong R iver web s i te [On l ine : www.mekongriver.org/publish/qghydrochdam.htm]
Nho, P.V. and H. Guttman. 1999. Aquatic resources use assessment in Tay Ninh Province, Vietnam (results from 1997 survey). AIT Aqua Outreach Working Paper No. SV-51. Asian Institute of Technology, Pathumthani, Thailand.
NORPLAN. 2004. Cumulative impact analysis of Nam Theun II dam. Final Report. Asian Development Bank, Manila, Philippines.
NSC (National Statistical Center). 2002. Statistical yearbook 2001. National Statistical Center, Committee for Planning and Cooperation, Vientiane, Lao PDR. 99 pp.
NSF (National Science Foundation). 1998. Chinese transboundary water issues, p. 57-63. In Working Group Summaries. China Environment Series No. 2. National Science Foundation, U.S.A.
Ojendal, J. and M. Torell. 1998. National and sub-national consequences of a regional r iver basin agreement: the case of the Mekong River Agreement. Presentation at the Seventh Annual Conference of the International Association for the Study of Common Property, 10-14 June 1998, Vancouver, Canada. [Online: www.indiana.edu/~iascp/iascp98.htm]
Osborne, M. 2004. River at risk - the Mekong and the water politics of China and Southeast Asia. Lowy Institute Paper No. 2. Lowy Institute for International Policy. 56 pp.
Ouch, P. and P. Dubeau. 2004. Value of floodplain fisheries in Kompong Traolach District, Kompong Chhnang Province, p. 32-26. In M. Torell, A. Salamanca and B. Ratner (eds.) Wetlands management in Cambodia: socioeconomic, ecological, and policy perspectives. The WorldFish Center Technical Report No. 64. The WorldFish Center, Penang, Malaysia. 55 pp.
Pawaputanon, O. 2003. Inland fisheries information in Thailand, p. 33-35. In FAO Regional Office for Asia and the Pacific (ed.) New approaches for the improvement of inland capture fishery statistics in the Mekong Basin. FAO-RAP
publication 2003/1. FAO Regional Office for Asia and the Pacific, Bangkok, Thailand. 145 pp.
Petersen, E. 2003. Valuing environmental water demands in the Mekong River Basin. Presentation at the In terna t iona l Workshop on In tegra t ing Environmental Impacts into Water Allocation Models of the Mekong River Basin, 15 December 2003, Ho Chi Minh City, Vietnam. 27 pp.
Phan, T.L. and M.P. Pham. 1999. Preliminary results of the involvement in fisheries from the baseline survey in An Giang Province, Vietnam. AMFP Technical Report, Mekong River Commission, Ho Chi Minh City, Vietnam. 12 pp.
Phillips, M. 2002. Freshwater aquaculture in the Lower Mekong Basin, MRC Technical Paper No. 7. Mekong River Commission, Phnom Penh, Cambodia. 62 pp.
Phonvisay A. and S. Bush. 2001. Baseline study of the fish trade from the Siphandone fishery, Champasack Province. LARReC Research Report No. 4. Living Aquatic Resources Research Center, Vientiane, Lao PDR. 70 pp.
Phonvisay, S. 1994. Inland fisheries development policies and strategies in Lao PDR with special emphasis on the Mekong Basin. Department of Livestock and Fisheries, Ministry of Agriculture and Forestry, Vientiane, Lao PDR.
Phonvisay, A. 2001. Fish marketing study in Vientiane. LARReC Research Report No. 3. Living Aquatic Resources Research Center, Vientiane, Lao PDR. 89 pp.
Plinston, D. and D. He. 2000. Water resources and hydropower in the Lancang River Basin, p. 235-266 (Chapter 4). In Asian Development Bank (ADB) (ed.) Asian Development Bank (ADB) 2000: Policies and Strategies for Sustainable Development of the Lancang River Basin. (Prepared by Landcare Research, New Zealand Limited).
Podger, G., R. Beecham, D. Blackmore, C. Perry and R. Ste in . 2004 Model led observa t ions on development scenarios in the Lower Mekong Basin. Report of the Mekong Regional Water Resources Assistance Strategy. World Bank, Vientiane, Lao PDR. 122 pp.
Poulsen, A.F., P. Ouch, S. Viravong, U. Suntornratana and T.T. Nguyen. 2002. Fish migrations of the Lower Mekong R ive r Bas in : imp l i ca t i ons fo r development, planning and environmental management. MRC Technical Paper No. 8. Mekong River Commission, Phnom Penh, Camboda. 62 pp.
Prapertchob, P. 1999. A review of fish consumption in Thailand. Report for the project “Assessment of Mekong fisheries”. Mekong River Commission, Vientiane, Lao PDR. 19 pp.
Prapertchob, P., P. Kachamart, J. Wiratchakul, A. Hornak, A. Pakuthai, P. Thirangkoon, P. Kamsrakaeo. 1989. Fish consumption studies in the Northeast. A research study prepared for the Department
chapTer � ���
of Fisheries. Khon Khen University, Thailand. In Thai. (mimeo).
Rab, M.A., N. Hap and M. Ahmed. 2004a. Socioeconomics and values of aquatic resources in Cambodia: results from a sample survey of Great Lake and Mekong Bassac Rivers. Presentation at the 7th Asian Fisheries Forum, 30 November - 4 December 2004, Penang, Malaysia.
Rab, M.A., N. Hap, L. Seng, M. Ahmed and K. Viner. 2005. Marketing infrastructure, distribution channels and trade pattern of inland fisheries resources in Cambodia: an exploratory study. The WorldFish Center, Penang, Malaysia. 42 pp.
Rab, M.A., N. Hap, M. Ahmed, S. Keang, K. Viner. 2006. Socioeconomics and values of resources in Great Lake - Tonle Sap and Mekong-Bassac area: results from a sample survey in Kampong Chhnang, Siem Reap, and Kandal provinces, Cambodia. The WorldFish Center Discussion Series No. 4. 98 pp.
Rab, M.A., N. Hap, L. Seng, S. Keang and M. Ahmed. 2004b. Marketing infrastructure, distribution channels and trade pattern of inland fisheries resources in Cambodia: an exploratory study. Presentation at the 7th Asian Fisheries Forum, 30 November - 4 December 2004, Penang, Malaysia.
Ratner, B.D. 2003. The politics of regional governance in the Mekong River Basin. Global change 15(1): 59-76.
Ratner, B.D., D.T. Ha, M. Kosal, A. Nissapa and S. Chanphenxay. 2004. Under va lued and overlooked: sustaining rural livelihoods through better governance of wetlands. The WorldFish Center Studies and Reviews No. 28. 24 pp.
Revenga, C., J. Brunner, N. Henninger, K. Kassem and R. Payne. 2000. Pilot analysis of global ecosystems: freshwater systems. World Resources Institute, Washington D.C., U.S.A. 65 pp.
RGC (Royal Government of Cambodia). 2001. Socio-economic development requirements and proposals. Paper of the Royal Government of Cambodia for the 2001 Consultative Group Meeting for Cambodia, 11-13 June 2001, Tokyo, Japan.
Rigg, J. and R. Jerndal. 1996. Plenty in the context of scarcity: forest management in Laos. In M.J.G. Parnwell and R.L. Bryant (eds.) Environmental change in South-East Asia: people, politics and sustainable development. Routledge, London, U.K. 383 pp.
Ringler, C. 2000. Optimal allocation and use of water resources in the Mekong River Basin: multi-country and intersectoral analyses. Ph.D. dissertation. Rheinischen Friedrich-Wilhelms Universität, Bonn, Germany.
Ringler, C. 2001. Optimal water allocation in the Mekong River Basin. ZEF –Discussion Paper on Development Pol icy No. 38. Center for Development Research, Bonn, Germany. 50 pp.
Roberts, T.R. 1993. Just another dammed river? Negative impacts of Pak Mun Dam on fishes of the Mekong Basin. Nat. Hist. Bull. Siam Soc. 41: 105-133.
Roberts, T.R. 1995. Mekong mainstream hydropower dams: run-of-the-river or ruin-of-the-river? Nat. Hist. Bull. Siam Soc. 43(1): 9-20.
Roberts, T.R. 2001a. On the river of no returns: Thailand’s Pak Mun Dam and its fish ladder. Nat. Hist. Bull. Siam Soc. 49: 189–230.
Roberts, T.R. 2001b. Downstream ecological implications of China’s Lancang Hydropower and Mekong Navigation Project. Web-based article [Online: www.irn.org]
Roberts, T.R. 2004. Fluvicide: an independent environmental assessment of Nam Theun 2 hydropower project in Laos, with particular reference to aquatic biology and fishes. NT2 project development group report, Bangkok, Thailand. Unpublished paper.
Roberts, T.R. and I.G. Baird. 1995. Traditional fisheries and fish ecology on the Mekong River at Khone waterfalls in Southern Laos. Nat. Hist. Bull. Siam Soc. 43: 219-262.
Roudy, G. 2002. Natural resource use and livelihood trends in the Tonle Sap floodplain, Cambodia: a socio-economic analysis of direct use values in Peam Ta Our floating village. M.Sc. thesis.Imperial College of Science, Technology and Medicine, London, UK. [Online: www.mekonginfo.org]
Sam, N., S. Lieng and S. Thor. 2003. Improving inland capture fisheries statistics in Cambodia, p. 14-19. In FAO Regional Office for Asia and the Pac i f i c ( ed . ) New approaches fo r the improvement of inland capture fishery statistics in the Mekong Basin. FAO-RAP publication 2003/1. FAO Regional Office for Asia and the Pacific, Bangkok, Thailand. 145 pp.
Sarkkula, J., E. Baran, P. Chheng, M. Keskinen, J. Koponen and M. Kummu. 2004. Tonle Sap pulsing system and fisheries productivity. Presentation at the 29th International Congress of Limnology (SIL 2004), 8-14 August 2004, Lahti, Finland. 5 pp.
Sarkkula, J., J. Koponen, M. Keskinen, M. Kummu, H. Lauri, O. Varis and M. Virtanen. 2005. Hydrological, environmental and socio-economic modelling tools for the Lower Mekong Basin impact assessment. Inception Report of the Phase II of the WUP-FIN project. Mekong River Commission, Vientiane, Lao PDR.
Sarkkula, J., J. Koponen, S. Hellsten, M. Keskinen, M. Kiirikki, H. Lauri, O. Varis, M. Virtanen, T. Dubrovin, K. Eloheimo, U. Haapala, J. Jozsa, E. Järvenpää, M. Kummu, K. Chitt, P. Noy, R. Huon, R. Heng, S. Yim and S. Yin. 2003. Modelling Tonle Sap for environmental impact assessment and management support. WUP-FIN Project Modelling of the flow regime and water quality of the Tonle Sap. Draft final report. Mekong

��� Tropical river fisheries valuaTion: background papers To a global synThesis
River Commission, Phnom Penh, Cambodia. 110 pp.
Schouten, R. 1998. Effects of dams on downstream reservoir fisheries, Case of Nam Ngum. Mekong Fish Catch and Culture 4(2): 1-5.
Scott, D.A.1989. A directory of Asian wetlands. IUCN, World Conservation Union, Gland, Switzerland and Cambridge, U.K. 1181 pp.
SEARIN (Southeast Asia Rivers Network). 2004 The return of fish, river ecology and local livelihoods of the Mun River: a Thai Baan (“villagers”) research. Southeast Asia Rivers Network (SEARIN), Chiang Mai, Thailand. 32 pp.
Shoemaker, B., I.G. Baird and M. Baird. 2001. The people and their river: a survey of river-based livelihoods in the Xe Bang Fai River Basin, in Central Lao PDR. Lao/Canada Fund for Local Initiatives, Vientiane, Lao PDR. 79 pp.
Siebert, R. 2001. No chance for participation - dam building on the Mekong River. Development and Cooperation 4: 14-16.
Simon-Barouh, I. 1993. L’alimentation quotidienne des Cambodgiens de Rennes, p. 199-248. In N. Krowolski (ed.) Autour du riz – le repas chez quelques populations d’Asie du Sud-Est. L’Harmattan, Paris, France. 261 pp.
Singhanouvong, D. and K. Phoutavong. 2002. Fisheries baseline survey in Champasack Province, Southern Lao PDR I n A. Pou lsen. (ed . ) Proceedings of the Fifth Technical Symposium on Mekong Fisheries, 11-12 December 2002. MRC Conference Series No. 4. Mekong River Commiss ion , Phnom Penh , Cambod ia . 364 pp.
Sinh, L.X. 1995. The effects of aquaculture on farm household economy: a case study of Omon district, Cantho province, Vietnam. Dissertation, Asian Institute of Technology, Bangkok, Thailand. 162 pp.
Sjorslev, J.G. (ed.). 2000. Luang Prabang fisheries survey. LARReC research report No. 1 and AMFC project report, Mekong River Commission, Vientiane, Lao PDR. 34 pp. + annexes.
Sjorslev, J.G. (ed.). 2001b. An Giang fisheries survey. Report for the Component Assessment of Mekong F i she r i e s ; AMFC /R IA2 . Mekong R i ve r Commission, Phnom Penh, Cambodia.
Sjorslev, J.G. 2001a. Assessment of consumption of fish and aquatic animals in the Lower Mekong Basin. Unpublished draft report for the MRC Technical Report Series. 35 pp.
Smith, L.E.D., S. Nguyen Khoa and K. Lorenzen. 2005. Livelihood functions of inland fisheries: policy implications in developing countries. Water Policy 7: 359-383.
Souvannaphanh, B., S. Chanphendxay and X. Choulamany. 2003. Status of inland fisheries statistics in the Lao PDR, p. 27-32. In FAO Regional Office for Asia and the Pacific (ed.) New approaches for the improvement of inland capture fishery
statistics in the Mekong Basin. FAO-RAP publication 2003/1. FAO Regional Office for Asia and the Pacific, Bangkok, Thailand. 145 pp.
Sretthachau, C. and P. Deetes. 2004. Downstream impacts of hydropower and deve lopment of an international river: a case study of Lancang-Mekong. Presentation at the UN Symposium on Hydropower and Sustainable Development, Beijing, China, 27-29 October 2004. 4 pp.
Starr, P. 2003. Fisheries production in Cambodia. Mekong Fish Catch and Culture 9(1): 6.
Starr, P. 2004. Low water blues. Mekong Fish Catch and Culture 10(1): 4-6.
STEA (Science, Technology and Environment Agency). 2003. Lao PDR biodiversity: economic assessment. Science, Technology and Environment Agency, Vientiane, Lao. PDR. (mimeo)
STREAM. 2001. Proceedings of a Workshop on analysing livelihoods of fishers and farmers, 25-29 September 2001, Kompong Chhnang, Cambodia. STREAM Initiative and DFID, U.K.
Sul tana, P. , P. Thompson and M. Ahmed. 2003a. Understanding livelihoods dependent on inland fisheries in Bangladesh and Southeast Asia. Final Technical Report. The WorldFish Center, Penang, Malaysia.
Sultana, P., T.A.Vo and H.C. Nguyen. 2003b. Understanding livelihoods dependent on inland fisheries in Bangladesh and Southeast Asia. Vietnam Country Summary Report. The WorldFish Center, Penang, Malaysia.
Suntornratana, U. and T. Visser. 2003. Women as a source of information on inland fisheries,p. 45-49. In FAO Regional Office for Asia and the Pacific (ed.) New approaches for the improvement of inland capture fishery statistics in the Mekong Basin. FAO-RAP publication 2003/1. FAO Regional Office for Asia and the Pacific, Bangkok, Thailand. 145 pp.
Sverdrup-Jensen, S. 2002. Fisheries in the Lower Mekong Basin: Status and Perspectives. MRC Technical Paper No. 6. Mekong River Commission, Phnom Penh, Cambodia. 84 pp.
TERRA. 2003. Creating catastrophe: China and its dams on the Mekong. Watershed 8(2): 42-48.
Thai, T.D. 2003. Inland fisheries statistics in Vietnam, p. 36-39. In FAO Regional Office for Asia and the Pacific (ed.) New approaches for the improvement of inland capture fishery statistics in the Mekong Basin. FAO-RAP publication 2003/1. FAO Regional Office for Asia and the Pacific, Bangkok, Thailand. 145 pp.
Thay, S. 2002. The underestimated importance of freshwater shrimp fisheries and dried shrimp processing to families. A case study from Kompong Kleang commune, Siem Reap, Cambodia. CBNRM Initiative, World Wildlife Fund (WWF), Phnom Penh, Cambodia. 13 pp.
Torell, M., A. Salamanca and B. Ratner (eds.). 2004. We t l a n d s m a n a g e m e n t i n C a m b o d i a :
chapTer � ���
soc ioeconomic , eco log ica l , and po l icy perspectives. The WorldFish Center Technical Report No. 64. Penang, Malaysia. 55 pp.
Torell, M., A. Salamanca and M. Ahmed. 2001. Management of wetland resources in the Lower Mekong Basin: issues and future directions. Naga, ICLARM Q. 24(3-4): 4-10.
Touch, S.T. and B.H. Todd. 2003. The inland and marine trade of Cambodia. Oxfam America, Phnom Penh, Cambodia. 142 pp.
UNDP (United Nations Development Programme). 2004. UNDP country office pages. [Online: http://www.undp.org]
UNEP (United Nations Environment Programme). 2001. State of the environment 2001. NORAD and United Nations Environment Programme, Bangkok, Thailand. 81 pp.
Van Zalinge, N. 2002. Update on the status of the Cambodian inland capture fisheries sector with special reference to the Tonle Sap Great Lake. Mekong Fish Catch and Culture 8(2): 1-6.
Van Zalinge, N. and T. Nao. 1999. Present status of Cambodia’s freshwater capture fisheries and management implications, p. 11-20. In N. Van Zalinge, N. Thuok and D. Loeung (eds.) Present status of Cambodia’s freshwater capture fisheries and management implications. Proceedings of the Annual Meeting of the Department of Fisheries of the Ministry of Agriculture, Forestry and Fisheries, 19-21 January 1999, Phnom Penh, Cambodia. Mekong River Commission and Department of Fisheries, Phnom Penh, Cambodia. 150 pp.
Van Zalinge, N., L. Deap, P.B. Ngor, J. Sarkkula and J. Koponen. 2003. Mekong flood levels and Tonle Sap fish catches. Presentation at the Second International Symposium on the Management of Large Rivers for Fisheries, 11-14 February 2003, Phnom Penh, Cambodia. 13 pp.
Van Zalinge, N., P. Degen, C. Pongsri, N. Sam, J. Jensen, V.H. Nguyen and X. Choulamany. 2004. The Mekong River System, p. 333-355. In R.L. Welcomme and T. Petr (eds.) Proceedings of the Second International Symposium on the Management of Large Rivers for Fisheries, Vol. 1. FAO Regional Office for Asia and the Pacific, Bangkok, Thailand. 356 pp.
Van Zalinge, N., T. Nao and N. Sam. 2001. Status of the Cambodian inland capture fisheries with special reference to the Tonle Sap Great Lake, p. 10-16. In Inland Fisheries Research and Development Institute of Cambodia (IFReDI) (ed.) Cambodia Fisheries Technical Paper Series, Vol. III, Inland Fisheries Research and Development Institute o f C a m b o d i a ( I F R e D I ) , P h n o m Pe n h , Cambodia.
Van Zalinge, N., T. Nao and S.T. Touch. 1998a. Where there is water, there is fish? Fisheries issues in the Lower Mekong Basin from a Cambodian perspective. Contribution to the Seventh Common Property Conference of the International
Association for the Study of Common Property, 10-14 June 1998, Vancouver, Canada. 14 pp.
Van Zalinge, N., T. Nao, S.T. Touch and L. Deap. 2000. Where there is water, there is fish? Cambodian fisheries issues in a Mekong River Basin perspective, p. 37-48. In M. Ahmed and P. Hirsch (eds.) Common property in the Mekong: issues of sustainability and subsistence. ICLARM Studies and Reviews No. 26. 67 pp.
Van Zalinge, N., T. Nao, S.T. Touch and N. Sam. 1998b. It’s big, unique, and important: fisheries in the Lower Mekong Basin, as seen from a Cambodian perspective, Mekong Fish Catch and Culture 4(1): 1-5.
Varis, O. 2003. WUP-FIN policy model; finding ways to economic growth, poverty reduction and sustainable environment. WUP-FIN Socio-economic Studies on Tonle Sap No. 10. MRCS/WUP-FIN, Phnom Penh, Cambodia. 38 pp.
Varis, O. and M. Keskinen. 2005. A Bayesian Network model for intersectoral policy analysis in the Tonle Sap area, Cambodia. Presentation at the International Conference on Simulation and Modeling (SimMod 2005), 17-19 January 2005, Bangkok, Thailand.
Vidy, G., J.-J. Albaret and E. Baran. 2000. Status of the freshwater/coastal/marine living resources with particular emphasis on threats and options in coasta l a reas . Proceed ings o f a UNEP International Workshop, 15-18 November 1999, Montpel l ier, France. UNEP Environment Information and Assessment Meeting Report No. 3. 95 pp.
Virapat, C., U. Phimonbutra, C. Chantarawaratid. 1999. Fishery and fisheries management in Thai reservoirs: review and assessment. Report for the project “Management of the reservoir fisheries in the Mekong Basin”. Phnom Penh, Cambodia, Mekong River Commission. 45 pp.
Virapat, C. and N. Mattson. 2001. Inventory of reservoir fishery resources in Thailand. In S. De Silva (ed.) Reservoir and culture-based fisheries: biology and mana gemen t . P roceed ings o f an International Workshop, 15-18 February 2000, Bangkok, Thailand. ACIAR Proceedings No. 98. 384 pp.
Vo, T.A., H.C. Nguyen and T.D. Duong. 2003. Understanding livelihoods dependent on inland fisheries in Bangladesh and Southeast Asia. Vietnam Country Status Report. The WorldFish Center, Penang, Malaysia. 30 pp.
Voeun, V. 2004. Description of bas-relief of fish at Angkor Wat and Bayon, p. 39-56. In Bulletin of the students of the Department of Archaeology; No. 3, July 2004. Royal University of Fine Arts, Phnom Penh, Cambodia. 131 pp.
Warren, T.J. and N.S. Mattson. 2000. Can fish passes mi t iga te the impacts o f wa ter- re la ted development on fish migrations in the Mekong

��0 Tropical river fisheries valuaTion: background papers To a global synThesis
Basin? Mekong Fish Catch and Culture 6(2): 1-4.
WCD (World Commission on Dams). 2000. Dams and development: a new framework for decision-making. Report of the World Commission on Dams. Earthscan Publications, London, UK. 404 pp.
Wegner, D.L. 1997. Review Comments on Nam Theun 2 hydroelectric project: Environmental Assessment and Management Plan (EAMP). Web-based article [Online: http://www.irn.org].
Welcomme, R.L. 1985. River fisheries. FAO Fish. Tech. Pa pe r No . 262 . Food and Ag r i cu l t u re Organization, Rome, Italy. 330 pp.
Welcomme, R.L. 1995. Relationships between fisheries and the integrity of river systems. Regulated Rivers: Research and Management 11: 121-136.
White, W.C. 2000. Infrastructure development in the Mekong Basin: risks and responses. Foresight Associates for Oxfam America. 19 pp.
World Bank web site. Country statistics. [Online: www.worldbank.org].
Xie, S.Q. and Z.J. Li. 2003. Inland fisheries statistics in China, p. 20-26. In New approaches for the improvement of inland capture fishery statistics in the Mekong Basin. Ad-hoc Expert Consultation, 2-5 September 2002, Udon Thani, Thailand. FAO RAP publication 2003/01. FAO Regional
Office for Asia and the Pacific, Bangkok, Thailand. 145 pp.
Yang, J. 1996. The alien and indigenous fishes of Yunnan: a study on impact ways, degrees and relevant issues, p. 157-168. In J.A. Peter, S. Wang and Y. Xie (eds.) Conserving China’s biodiversity (II). China Environmental Science Press, Beijing, China.
Yang, S.K., M. Keam and S.H. Lang. 2001. The situation of pesticide use in the Tonle Sap catchment. CEDAC, Phnom Penh, Cambodia.
Yim, C. and B. McKenney. 2003a. Domestic fish trade: case study of fish marketing from the Great Lake to Phnom Penh. Working Paper No. 29. Cambodia Development Resource Institute, Phnom Penh, Cambodia. 24 pp.
Yim, C. and B. McKenney. 2003b. Fish exports from the Great Lake to Thailand, Working Paper 27. Cambodia Development Resource Institute (CDRI), Phnom Penh, Cambodia. 56 pp.
Yim, C. and B. McKenney. 2003c. Great Lake fish exports: an analysis of the fee system. Cambodia Development Review, Cambodia Development Resource Institute (CDRI) 7(3).
Zurbrügg, A. 2004. Where there is water, there is fish: an analysis and critical assessment of Cambodia’s Tonle Sap fisheries. ECON 5197. Project Report. University of New South Wales, Australia. 58 pp.
Tropical river fisheries valuation: background papers to a global synthesis
Tropical river fisheries valuation: background papers toa global synthesis
Prin
ted
on 1
00%
recy
cled
pap
er.
The W
orldFish C
enter
www.worldfishcenter.orgReducing poverty and hunger by improving fisheries and aquaculture
For further information on The WorldFish Center publications please contact:Business Development and Communications DivisionThe WorldFish CenterPO Box 500 GPO, 10670 Penang, MalaysiaTel : (+60-4) 626 1606Fax : (+60-4) 626 5530Email : [email protected]
This publication is also available from: www.worldfishcenter.org
This report is a compilation of five regional reviews that document the global status of tropical rivers and inland fisheries in three continents: Latin America, Africa and Asia. It explores the role of ‘valuation’ methods and their contribution to policy-making and river fishery manage-ment. From the compilation, the best estimate of the global value of inland fisheries for those three continents is US$ 5.58 billion (gross market value), which is equivalent to 19 percent of the current value of annual fish exports from developing countries (US$ 29 billion) for 2004.
The compilation shows that there is a general shortage of information on inland fisheries, especially derived from conventional economic valuation methods, though infor-mation from economic impact assessment methods and socio-economic and livelihood analysis methods is more widely available.
The status of knowledge about the impact of changes in river management on the value of tropical river fisheries is weak and patchy. Although the impacts of large dams on the hydrology, ecology and livelihood support attributes of tropical rivers are well-recognized, there have been only few valuation studies of these issues.
The document highlights the need for further valuation studies of tropical river and inland fisheries in developing countries. It underlines how vital it is for policy-makers and other stakeholders to understand the importance of these natural resources in order to make appropriate decisions concerning their role in development policy and illustrates why capacity building in valuation should become a major priority for agencies concerned with fisheries management and policy-making.
STUDIES & REVIEWS | 1836
SR1836 cover.indd 1 5/3/2008 9:50:25 AM