Oxic–anoxic conditions in the water column of a tropical freshwater reservoir (Peña-Larga dam, NW...
20
Oxic–anoxic conditions in the water column of a tropical freshwater reservoir (Pe~ na-Larga dam, NW Venezuela) Boris Bellanger a, * , Sylvain Huon a, * , Philipp Steinmann b , Franc ßois Chabaux c , Fernando Velasquez d , Vincent Vall es e , Kaspar Arn b , Norbert Clauer c , Andr e Mariotti a a UMR 7618 (UPMC-INRA-CNRS) BIOMCO, Universit e Pierre Marie Curie (UPMC), Case 120, 4 place Jussieu, Paris Cedex 05, 75252, France b Institut de G eologie, Universit e de Neuch^ atel, Case postale 2, 11 rue Emile Argand, Neuch^ atel CH-2007, Suisse c CGS (UMR 7517 CNRS-ULP), Ecole et Observatoire des Sciences de la Terre, 1, rue Blessig, Strasbourg 67084, France d Unidad PLANINDECH, Centro de Ecologia de Bocon o, Universidad de los Andes, Bocon o, Estado Trujillo, Venezuela e INRA Science du Sol Domaine St Paul, Site Agroparc, Avignon Cedex 9, 84914, France Received 7 March 2003; accepted 14 November 2003 Editorial handling by A. Herczeg Abstract A freshwater reservoir (area: 122 km 2 , volume: 2850 10 6 m 3 , maximum depth: 72 m) located at the outlet of a tropical Andean watershed (Rio Bocon o, 1620 km 2 , 08°57 0 –09°31 0 N, 70°02 0 –70°34 0 W, NW Venezuela) was studied combining: (1) high resolution monitoring of the major environmental parameters using a CTD probe; (2) dissolved (major and trace) element concentration measurements; (3) water (d 18 O, d 2 H) isotope measurements and; (4) organic carbon (C) concentration – d 13 C measurements on suspended matter and on sediments. Composed of two sub-reser- voirs with contrasted water inputs, the Pe~ na Larga dam provides the opportunity to better constrain C budgets and source – composition of suspended organic matter within two parts of a unique freshwater system with contrasted redox conditions. The redox status is reflected by drastic differences between the two parts of the reservoir, pictured by water residence time, water column ventilation, dissolved trace element concentration and suspended organic matter com- position. Seasonal renewal of water near the main inlet supports higher surface productivity, oxic water column conditions, homogenous water chemical composition and, below the thermocline, the transport of suspended organic matter mainly derived from soil erosion on the watershed. Calculated sediment and organic C storages amount to 5.6 10 6 ta 1 and 21 5 10 3 tCa 1 , respectively. Despite a markedly lower suspended sediment load, outflow waters exhibit POC-d 13 C values similar to those in inflow waters, due to a short water residence time and a rapid recycling of primary products. In the more isolated parts of the reservoir, where water discharge is thoroughly reduced, hypoxic to anoxic conditions are found immediately below the thermocline (ca. 16 m, [O 2 ]<30 lmol L 1 ). They induce a correlative increase of trace element concentrations with water depth. Suspended organic matter display 13 C-depleted composi- tions, contrasting sharply with that of photosynthetic organisms and land-derived detritus, that either reflect the * Corresponding authors. Present address: Laboratoire Chimie et Environnement, Universit e de Provence, 3 Place Victor Hugo, 13331 Marseille Cedex 3, France. Fax: +33-1-44-27-41-64 (V. Vall es). E-mail addresses: [email protected] (B. Bellanger), [email protected] (S. Huon). 0883-2927/$ - see front matter Ó 2004 Elsevier Ltd. All rights reserved. doi:10.1016/j.apgeochem.2003.11.007 Applied Geochemistry 19 (2004) 1295–1314 Applied Geochemistry www.elsevier.com/locate/apgeochem
-
Upload
independent -
Category
Documents
-
view
4 -
download
0
Transcript of Oxic–anoxic conditions in the water column of a tropical freshwater reservoir (Peña-Larga dam, NW...

Applied
Applied Geochemistry 19 (2004) 1295–1314
Geochemistry
www.elsevier.com/locate/apgeochem
Oxic–anoxic conditions in the watercolumn of a tropical freshwater reservoir
(Pe~na-Larga dam, NW Venezuela)
Boris Bellangera,*, Sylvain Huona,*, Philipp Steinmannb, Franc�ois Chabauxc,Fernando Velasquezd, Vincent Vall�ese, Kaspar Arnb, Norbert Clauerc,
Andr�e Mariottia
aUMR 7618 (UPMC-INRA-CNRS) BIOMCO, Universit�e Pierre Marie Curie (UPMC), Case 120, 4 place Jussieu,
Paris Cedex 05, 75252, FrancebInstitut de G�eologie, Universit�e de Neuchatel, Case postale 2, 11 rue Emile Argand, Neuchatel CH-2007, Suisse
cCGS (UMR 7517 CNRS-ULP), Ecole et Observatoire des Sciences de la Terre, 1, rue Blessig, Strasbourg 67084, FrancedUnidad PLANINDECH, Centro de Ecologia de Bocon�o, Universidad de los Andes, Bocon�o, Estado Trujillo, Venezuela
eINRA Science du Sol Domaine St Paul, Site Agroparc, Avignon Cedex 9, 84914, France
Received 7 March 2003; accepted 14 November 2003
Editorial handling by A. Herczeg
Abstract
A freshwater reservoir (area: 122 km2, volume: 2850� 106 m3, maximum depth: 72 m) located at the outlet of a
tropical Andean watershed (Rio Bocon�o, 1620 km2, 08�570–09�310N, 70�020–70�340W, NW Venezuela) was studied
combining: (1) high resolution monitoring of the major environmental parameters using a CTD probe; (2) dissolved
(major and trace) element concentration measurements; (3) water (d18O, d2H) isotope measurements and; (4) organic
carbon (C) concentration – d13C measurements on suspended matter and on sediments. Composed of two sub-reser-
voirs with contrasted water inputs, the Pe~na Larga dam provides the opportunity to better constrain C budgets and
source – composition of suspended organic matter within two parts of a unique freshwater system with contrasted redox
conditions. The redox status is reflected by drastic differences between the two parts of the reservoir, pictured by water
residence time, water column ventilation, dissolved trace element concentration and suspended organic matter com-
position. Seasonal renewal of water near the main inlet supports higher surface productivity, oxic water column
conditions, homogenous water chemical composition and, below the thermocline, the transport of suspended organic
matter mainly derived from soil erosion on the watershed. Calculated sediment and organic C storages amount to
5.6� 106 t a�1 and 21� 5� 103 t C a�1, respectively. Despite a markedly lower suspended sediment load, outflow waters
exhibit POC-d13C values similar to those in inflow waters, due to a short water residence time and a rapid recycling of
primary products. In the more isolated parts of the reservoir, where water discharge is thoroughly reduced, hypoxic to
anoxic conditions are found immediately below the thermocline (ca. 16 m, [O2]<30 lmol L�1). They induce a correlative
increase of trace element concentrations with water depth. Suspended organic matter display 13C-depleted composi-
tions, contrasting sharply with that of photosynthetic organisms and land-derived detritus, that either reflect the
* Corresponding authors.
Present address: Laboratoire Chimie et Environnement,
Universit�e de Provence, 3 Place Victor Hugo, 13331 Marseille
Cedex 3, France. Fax: +33-1-44-27-41-64 (V. Vall�es).E-mail addresses: [email protected] (B. Bellanger),
[email protected] (S. Huon).
0883-2927/$ - see front matter � 2004 Elsevier Ltd. All rights reserved.
doi:10.1016/j.apgeochem.2003.11.007
1296 B. Bellanger et al. / Applied Geochemistry 19 (2004) 1295–1314
contribution of microbial biomass (chemoautotrophic and/or methanotrophic bacteria) or the selective degradation of
more labile organic compounds in the water column. The hypoxic to anoxic conditions displayed in the major part of
the water column extend to the first cm of lake bottom sediments. A simplified budget based on the main redox
processes active in the hypolimnion and on average water residence times, supports drastic differences in mineralization
rate: 83–444 lmol C L�1 a�1 for the oxic reservoir and only 43 lmol C L�1 a�1 for the hypoxic to anoxic reservoir. This
study shows that, if water renewal is not sufficient, tropical freshwater lakes may be subject to severe dissolved O2
depletion conditions at shallow depths, comparable to those observed in deep sections of the water column of temperate
eutrophic lakes.
� 2004 Elsevier Ltd. All rights reserved.
1. Introduction
Eutrophication of natural and artificial lakes and
water reservoirs is a major environmental problem be-
cause of their importance to human settlement, in par-
ticular for flood control, irrigation, fishing and energy
production. Critical conditions may arise when the dis-
solved O2 concentration available to decompose organic
matter falls below a minimum level ([O2]<1 mg L�1,
equivalent to 31 lmol L�1, Chapra and Dobson, 1981).
In the absence of O2, bacterially mediated reduction
processes may lead to the degradation of water quality
through NHþ4 production, SO2�
4 /H2S conversion, dis-
solved metal release from oxide/hydroxide phases (and
possibly also clay minerals) and, control CH4 production
(e.g. Davison and Woof, 1984; De Vitre et al., 1988;
Davison, 1993; Hamilton-Taylor and Davison, 1995;
Stumm andMorgan, 1996; Hongve, 1997). Several major
processes control O2 depletion in freshwater lakes (Lik-
ens, 1972): (1) enhanced biological productivity resulting
from high input of nutrients (autochthonous organic
matter input), (2) high organic matter supply provided by
soil erosion in the drainage areas (allochthonous organic
matter input) and, (3) low water turnover (hydrological
eutrophication). Natural O2 depletion may also result
from gradual sedimentary filling over long periods of
time, but human activities accelerate this process. This is
particularly obvious in tropical regions where defores-
tation and cultivation enhance soil erosion (Lal, 1990,
1995). Important amounts of organic matter are thus
displaced to streams and; water reservoirs may constitute
ultimate receptacles for runoff when located at the outlet
of cultivated mountainous watersheds.
In sufficiently deep lakes, changes in water chemistry
are mainly driven by the temperature gradient prevailing
in the water column, and by photosynthetic/respiration
processes. In tropical regions, temperature is high and
nearly constant over the year so that persistent thermal
stratification may arise, leading to drastic chemical
differences between the epilimnion (in contact with at-
mosphere) and the hypolimnion (isolated from atmo-
sphere). Deep waters may be isolated from surface if
inlet (and outlet) flows or stirring by winds do not
support sufficient mixing and renewal of water. Hydro-
logical eutrophication may also arise from reduced
ventilation conditions in the water column. The aim of
this study was to characterize the oxic to anoxic condi-
tions prevailing in the water column of a tropical
freshwater reservoir, the Pe~na Larga water dam, set up
at the outlet of a mountainous cultivated watershed
(Bocon�o watershed, NW Venezuelan Andes) and in
which soil erosion is suspected of inducing severe eu-
trophic conditions through enhanced soil organic matter
supply (Lewis, 1984; Brock, 1985). Composed of two
sub-reservoirs with different hydrological regimes, the
Pe~na Larga dam also provides the opportunity to con-
strain geochemical budgets within two parts of a unique
freshwater system with equivalent climatic conditions
but different ventilation rates of the water column. This
study was carried out in order to: (1) better assess the
relationship between suspended matter and oxidation/
reduction processes taking place in the water column, (2)
discriminate terrigenous and autochthonous sources of
suspended organic matter and, (3) identify the main
process driving the water column to hypoxic–anoxic
conditions (i.e., reduced bottom water ventilation vs.
excess organic matter supply). The study was focussed
on the characterization of water column redox status
combining geochemical analyses carried out on water
sample aliquots collected at several depths in the water
column (water stable isotopes, dissolved element con-
centrations, particulate organic C concentration and13C/12C measurements) along with high resolution
monitoring of freshwater most relevant environmental
parameters (temperature, dissolved O2 concentration,
total chlorophyll-a concentration, pH, Eh, water elec-
trical conductivity and suspended organic matter load
using light backscattering measurements).
2. Materials and methods
2.1. Physiographic setting
The Pe~na Larga water dam, built for water and
electricity production in 1983, is located at the outlet of
the Rio Bocon�o watershed (1620 km2, NW Venezuelan
Andes, 08�570–09�310N, 70�020–70�340W; Fig. 1). The
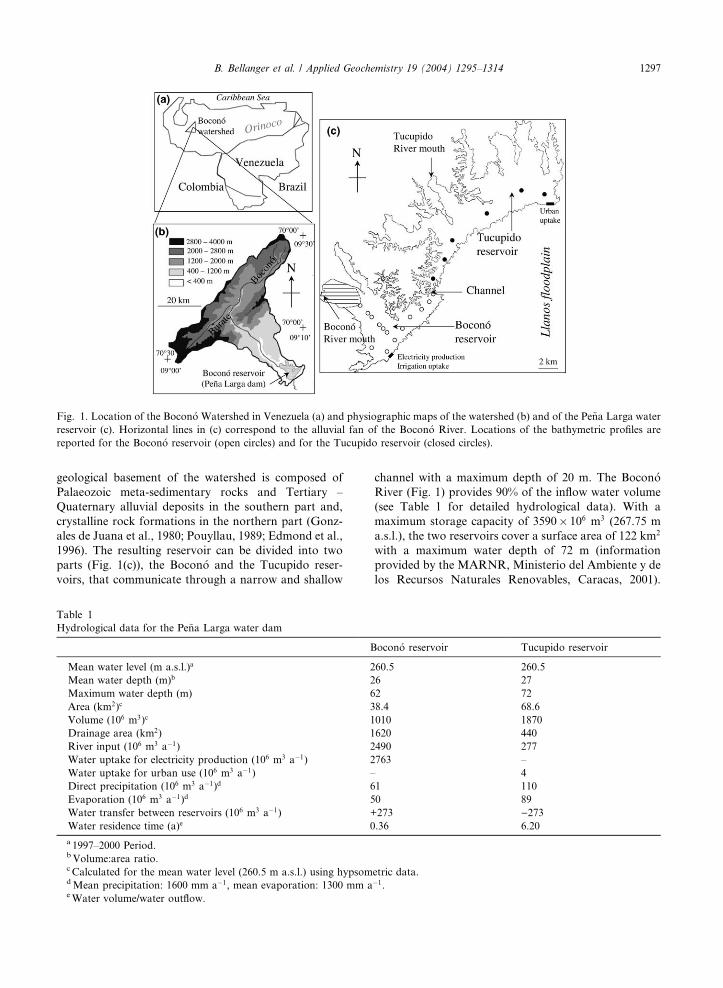
Fig. 1. Location of the Bocon�o Watershed in Venezuela (a) and physiographic maps of the watershed (b) and of the Pe~na Larga water
reservoir (c). Horizontal lines in (c) correspond to the alluvial fan of the Bocon�o River. Locations of the bathymetric profiles are
reported for the Bocon�o reservoir (open circles) and for the Tucupido reservoir (closed circles).
B. Bellanger et al. / Applied Geochemistry 19 (2004) 1295–1314 1297
geological basement of the watershed is composed of
Palaeozoic meta-sedimentary rocks and Tertiary –
Quaternary alluvial deposits in the southern part and,
crystalline rock formations in the northern part (Gonz-
ales de Juana et al., 1980; Pouyllau, 1989; Edmond et al.,
1996). The resulting reservoir can be divided into two
parts (Fig. 1(c)), the Bocon�o and the Tucupido reser-
voirs, that communicate through a narrow and shallow
Table 1
Hydrological data for the Pe~na Larga water dam
B
Mean water level (m a.s.l.)a 2
Mean water depth (m)b 2
Maximum water depth (m) 6
Area (km2)c 3
Volume (106 m3)c 1
Drainage area (km2) 1
River input (106 m3 a�1) 2
Water uptake for electricity production (106 m3 a�1) 2
Water uptake for urban use (106 m3 a�1) –
Direct precipitation (106 m3 a�1)d 6
Evaporation (106 m3 a�1)d 5
Water transfer between reservoirs (106 m3 a�1) +
Water residence time (a)e 0
a 1997–2000 Period.b Volume:area ratio.c Calculated for the mean water level (260.5 m a.s.l.) using hypsomdMean precipitation: 1600 mm a�1, mean evaporation: 1300 mm aeWater volume/water outflow.
channel with a maximum depth of 20 m. The Bocon�oRiver (Fig. 1) provides 90% of the inflow water volume
(see Table 1 for detailed hydrological data). With a
maximum storage capacity of 3590� 106 m3 (267.75 m
a.s.l.), the two reservoirs cover a surface area of 122 km2
with a maximum water depth of 72 m (information
provided by the MARNR, Ministerio del Ambiente y de
los Recursos Naturales Renovables, Caracas, 2001).
ocon�o reservoir Tucupido reservoir
60.5 260.5
6 27
2 72
8.4 68.6
010 1870
620 440
490 277
763 –
4
1 110
0 89
273 )273.36 6.20
etric data.�1.

Fig. 2. Plots of: (a) bi-monthly water level, (b) average monthly precipitation, (c) average monthly evaporation and (d) annual water
budget, for the whole lake over the 1997–2000 period. Flux unit is 106 m3 a�1, volume unit (underlined, Italic style) is 106 m3. P)E
corresponds to precipitation minus evaporation over the reservoir surfaces. s is the average water residence time (the ratio of water
volume to annual water flux) calculated for each reservoir.
1298 B. Bellanger et al. / Applied Geochemistry 19 (2004) 1295–1314
Water uptakes for electricity production, irrigation, and
urban use are performed at mid-water depth (ca. 20–40
m) in both reservoirs. The mean water level is 260.5 m
a.s.l. (1997–2000) with seasonal variations of several
meters (Fig. 2(a)). The tropical climatic conditions pre-
vailing in the study area result in a mean annual tem-
perature of 25 �C, with maximum precipitation between
April and October during the rainy season (Fig. 2(b)),
and maximum evaporation between December and
April during the dry season (Fig. 2(c)). Bathymetric
mapping of the Bocon�o reservoir in 1998 and 2001
showed that sediment delivery reduced the water storage
capacity by 4� 106 m3 a�1 (MARNR, 2001). According
to this sedimentary filling rate, the Pe~na Larga dam
should theoretically cease being useful in 47 a. Using a
bulk sediment density of 1.4 g cm�3, the sedimentation
rate (volume loss rate� sediment density) reaches
5.6� 106 t a�1, a value very close to the average 6.0� 106
t a�1 obtained by direct sediment yield monitoring of the
Bocon�o River discharge (Corniel�es, 1998). These data
imply that approximately 90% of the suspended
sediment discharge is stored in alluvial deposits in the
Bocon�o reservoir.
2.2. Analytical procedures
Environmental parameters were obtained using a
CTD (conductivity–temperature–depth) probe that
allows high resolution (every 30 cm, sensor response
time below 1 s) and simultaneous monitoring of pressure
(expressed as water depth), temperature, pH, electrical
conductivity (EC), dissolved oxygen concentration, total
chlorophyll-a concentration, turbidity and light back-
scatter. Accurate monitoring of turbidity in the water
column could only be performed in November 2000 and
the results are not displayed in this study. Sampling for
suspended matter collection, redox potential (Eh), dis-
solved organic and inorganic C (DOC, DIC, respec-
tively), major and trace element concentrations and
water stable isotope (d18O, d2H) measurements was
carried out for selected water depths in June 1998,
March 1999, September 1999 and November 2000.
Water sample aliquots for DOC and DIC analyses were
poisoned with sodium azide (1 g L�1, NaN3) and filtered
with Millipore 0.8 lm glass fiber filters the day of col-
lection. All samples were stored in dark Pyrex bottles
and kept in refrigerated places. Analyses were performed

Table 2
Analytical procedures
Parameter Method Material Precision
Water depth (pressure) In situ measurements OTS-094, Meerestechnik 0.1%
Temperature with additional sensors Backscat I-Fluorometer
1910 (Dr Haardt Optik Mi-
croelectronik)
0.01 �C
pH 0.1 pH unity
Electrical conductivity 1 lS cm�1
Dissolved oxygen 2% sat. O2
Chlorophyll-a 0.01 lg Chlorophyll-a
L�1
Light backscatter 0.01% Backscatter
Redox potential Manual probe
(Pt electrode)
Hanna instruments 20 mV
Dissolved Inorganic Carbon (DIC) CO2 with H3 PO4 Dohrmann analyser
DC-190
0.5 ppm
Dissolved Organic Carbon (DOC) Combustion and oxidation
(DOC¼TOC)DIC)
0.5 ppm
Ca, Mg, Na, K Atomic absorption Hitachi Z 8200 0.001� 10�3 mol L�1
F, Cl, SO4, NO3, NO2, PO4 Ionic chromatography Dionex 2000 I 0.001� 10�3 mol L�1
NH4, Si Colourimetry Technicon autoanalyser II 0.001� 10�3 mol L�1
Fe, Mn, Al, and trace elements ICP-AES JY 124 2–3%
Sr, Ba, U ICP-MS Fisons PQ 2 5–10%
d18O (Epstein and Mayeda, 1953) CO2–H2O equilibrium VG Fisons Optima IRMS 0.1‰ vs. SMOW
d2H (Bigeleisen et al., 1952) H2 O reduction by uranium Finnigan IRMS 1‰ vs. SMOW
Particulate Organic Carbon (POC) EA-IRMS Carlo-Erba NA-1500 NC 0.1 mg C g�1
Particulate nitrogen (PN) Elemental analyser on line 0.05 mg N g�1
POC-d13C With a Fisons Optima
IRMS
0.1‰ vs. PDB
B. Bellanger et al. / Applied Geochemistry 19 (2004) 1295–1314 1299
the following month. Separate water sample aliquots
were filtered with Millipore 0.45 lm cellulose filters for
major dissolved element analyses. Major cation and
trace element measurements were carried out on sub-
samples, acidified with 1 N HCl the day of collection.
Particulate organic C concentration (POC), particulate
N concentration (PN) and C stable isotope analyses
(d13C) were performed on sieved <50 lm size fractions
of the filtered residues from un-poisoned samples col-
lected in polyethylene bottles. Carbonate removal for
POC analyses was performed using 1 N HCl under pH
control (above 4.0) in order to reduce possible leaching
effects (e.g. Huon et al., 2002). All analytical procedures
are summarized in Table 2.
3. Results
3.1. Water budget of the Pe~na Larga water dam
An annual water budget was calculated using the
hydrological data available for the 1997–2000 period
(Fig. 2(d) and Table 1, data provided by the
MARNR). Water supply was estimated using the av-
erage discharges of the Bocon�o and Tucupido Rivers,
79 and 9 m3 s�1 (2490� 106 and 277� 106 m3 a�1),
respectively, and from local precipitation data. Calcu-
lation of water output includes intakes for electricity
production and irrigation (Bocon�o reservoir), urban
use (Tucupido reservoir) and direct evaporation. Due
to the establishment of a forested protection area
around the water reservoirs, overland runoff can be
considered as negligible with respect to river discharges.
Ground water seepage is limited to the main alluvial
deposits and directly linked to the Bocon�o river dis-
charge. The overall water movements indicate a net
annual water transfer (�273� 106 m3 a�1) from the
Tucupido reservoir to the Bocon�o reservoir. According
to the seasonal water level changes observed over the
1997–2000 period, a mean annual rise of 30 cm was
derived, corresponding to additional water storage of
30� 106 m3. Because the water volume of the reservoirs
is nearly constant year to year (the additional water
storage only represents 1% of lake volume), steady
state conditions may be assumed. The average water
residence time (ratio of volume to flow rate) is 0.36
years for the Bocon�o reservoir and 6.20 years for the
Tucupido reservoir.
O2 (µmol l-1)0 100 200 300
312
T (˚C)
-50
-40
-30
-20
-10
0
24 26 28 30 32
1
3
2
-100 100 300 500Eh (mV)
1
2
EC (µS cm-1)120 140 160 180 200
12
3
Chl-a (µg l-1)0 1 2 3 4
12
3
Backscatter (% )
0 1 2
1
2
3
pH
6 7 8 9
1
23
Wat
erde
pth
(m)
T (˚C)
-50
-40
-30
-20
-10
0
24 26 28 30 32
1 32
-100 100 300 500
Eh (mV)
1
2 3
EC (µS cm-1)120 140 160 180 200
1 2 3
Chl-a (µg l-1)0 1 2 3 4
2
31
Backscatter (% )0 1 2
3
2
1
pH6 7 8 9
3
2
1
Wat
erde
pth
(m)
a
b
c
Boconó reservoir (1: March 1999; 2: September 1999; 3: November 2000)
Tucupido reservoir (1: March 1999; 2: September 1999; 3: November 2000)
O2 (µmol l-1)0 100 200 300
1
23
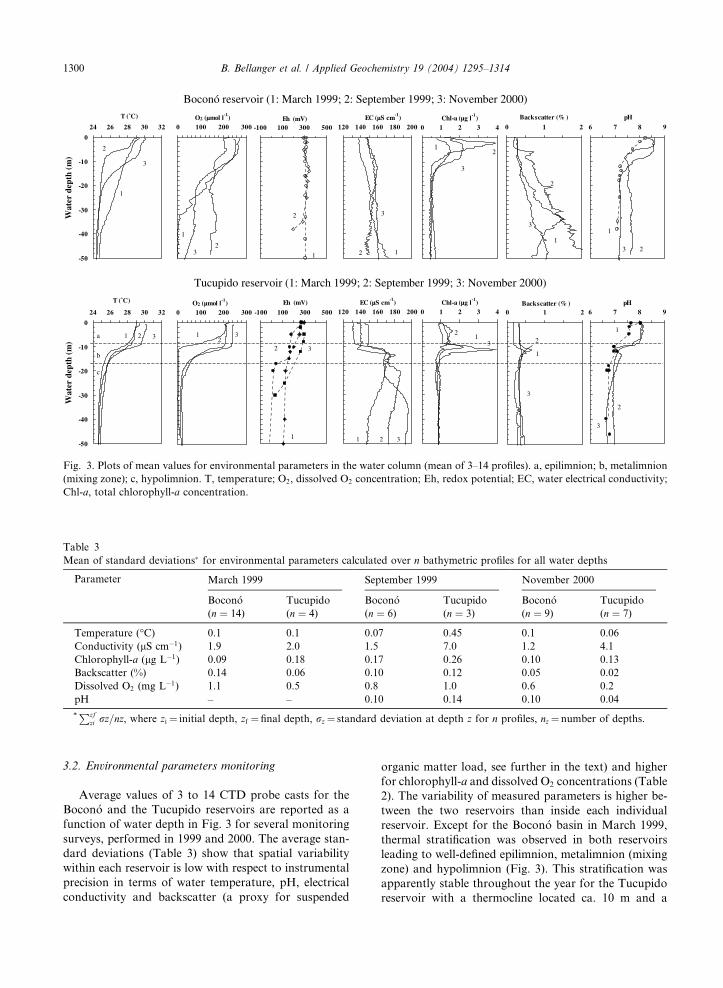
Fig. 3. Plots of mean values for environmental parameters in the water column (mean of 3–14 profiles). a, epilimnion; b, metalimnion
(mixing zone); c, hypolimnion. T, temperature; O2, dissolved O2 concentration; Eh, redox potential; EC, water electrical conductivity;
Chl-a, total chlorophyll-a concentration.
Table 3
Mean of standard deviations� for environmental parameters calculated over n bathymetric profiles for all water depths
Parameter March 1999 September 1999 November 2000
Bocon�o(n ¼ 14)
Tucupido
(n ¼ 4)
Bocon�o(n ¼ 6)
Tucupido
(n ¼ 3)
Bocon�o(n ¼ 9)
Tucupido
(n ¼ 7)
Temperature (�C) 0.1 0.1 0.07 0.45 0.1 0.06
Conductivity (lS cm�1) 1.9 2.0 1.5 7.0 1.2 4.1
Chlorophyll-a (lg L�1) 0.09 0.18 0.17 0.26 0.10 0.13
Backscatter (%) 0.14 0.06 0.10 0.12 0.05 0.02
Dissolved O2 (mg L�1) 1.1 0.5 0.8 1.0 0.6 0.2
pH – – 0.10 0.14 0.10 0.04
*Pzfzi rz=nz, where zi ¼ initial depth, zf ¼ final depth, rz ¼ standard deviation at depth z for n profiles, nz ¼ number of depths.
1300 B. Bellanger et al. / Applied Geochemistry 19 (2004) 1295–1314
3.2. Environmental parameters monitoring
Average values of 3 to 14 CTD probe casts for the
Bocon�o and the Tucupido reservoirs are reported as a
function of water depth in Fig. 3 for several monitoring
surveys, performed in 1999 and 2000. The average stan-
dard deviations (Table 3) show that spatial variability
within each reservoir is low with respect to instrumental
precision in terms of water temperature, pH, electrical
conductivity and backscatter (a proxy for suspended
organic matter load, see further in the text) and higher
for chlorophyll-a and dissolved O2 concentrations (Table
2). The variability of measured parameters is higher be-
tween the two reservoirs than inside each individual
reservoir. Except for the Bocon�o basin in March 1999,
thermal stratification was observed in both reservoirs
leading to well-defined epilimnion, metalimnion (mixing
zone) and hypolimnion (Fig. 3). This stratification was
apparently stable throughout the year for the Tucupido
reservoir with a thermocline located ca. 10 m and a

B. Bellanger et al. / Applied Geochemistry 19 (2004) 1295–1314 1301
temperature gradient of 4–5 �C. In contrast, thermal
stratification was only temporary for the Bocon�o reser-
voir. In November 2000, the thermocline was located 6 m
below that of September 1999 and was not observed in
March 1999. Due to lower temperatures (ca. 24 �C), theriver inflow sinks below the thermocline in the Bocon�oreservoir. Dissolved O2 concentrations have different
depth-patterns for the two reservoirs. Hypoxic to anoxic
conditions prevail in the Tucupido basin below 15 m
([O2]<14 lmol L�1), whereas the water column remains
oxic to hypoxic in the Bocon�o reservoir ([O2]>30 lmol
L�1), except in March, during the dry season, where
hypoxic to anoxic conditions are observed below 35 m.
Dissolved O2 concentrations range from 203 to 266 lmol
L�1 (6.5–8.5 mg L�1, respectively) in the epilimnion and
indicate conditions close to equilibrium with atmosphere
near the surface (O2 solubility is 240 lmol L�1 at 29 �C,equivalent to 7.7 mg L�1, Benson and Krause, 1984).
Redox potentials (Eh) are also contrasted between the
Fig. 4. Plots of stable isotope data in the water column: (a) d2H, (b) d18
d18O. Open circles refer to Bocon�o reservoir data (September 1999)
(September 1999 and November 2000, respectively). Grey squares corr
reservoir outlet. GMWL¼ global meteoric water line. Regression lines
procedure (Payne, 1991).
two reservoirs (Fig. 3). High and constant Eh values
(�300 mV), indicating oxic conditions (e.g.: Stumm and
Morgan, 1996), characterize Bocon�o reservoir waters,
whereas depth-decreasing trends are displayed in the
Tucupido reservoir below the thermocline for all CTD
casts. The latter reflects low water column ventilation
and subsequent evolution towards suboxic to anoxic
conditions (e.g.: Stumm andMorgan, 1996). Surface and
deep-water temperatures are rather constant (aver-
age� 1r: 29.5� 0.4 and 24.6� 0.2 �C, respectively) forboth reservoirs. In contrast, electrical conductivity ran-
ges from 140� 10 to 200 lS cm�1 with different depth
trends in each reservoir. In the Bocon�o reservoir, elec-
trical conductivity values slightly increase with water
depth, whereas in the Tucupido reservoir sharp increases
(ca. +40 lS cm�1) occur in the mixing zone, immediately
followed by varying trends. Average chlorophyll-a con-
centration ranges from 0.5 to 4.0 lg L�1 with prominent
peaks near the surface for the Bocon�o reservoir. Lower
O and plots of correlations: (c) d18O vs. temperature, (d) d2H vs.
; closed circles and triangles refer to Tucupido reservoir data
espond to the Bocon�o River and grey circles refer to the Bocon�oare calculated using a least squares fit with a reduced major axis

1302 B. Bellanger et al. / Applied Geochemistry 19 (2004) 1295–1314
concentrations are observed in surface waters of the
Tucupido reservoir, along with a second chlorophyll-a
peak in the metalimnion (Fig. 3). In the Bocon�o reser-
voir, backscatter values are high and continuously in-
creasing with water depth, except in March 1999, when a
prominent peak is observed between ca. 30 and 40 m
(Fig. 3). Backscatter values are low and nearly constant
in the water column of the Tucupido reservoir with small
peaks in the metalimnion. The pH values are high (8.0–
8.5) in the epilimnion, decrease sharply in the mixing
zone (by 1.0–1.5 pH unit), and remain nearly constant in
deep parts of the water column with values between 6.5
and 7.0 near the bottom. Bocon�o waters display an av-
erage shift of 0.5 pH units with respect to Tucupido
waters.
3.3. Stable isotopes composition of water
Water d18O, and d2H are displayed in Figs. 4(a)–(b).
The values decrease with water depth below the ther-
mocline for both reservoirs. Water is enriched in 18O and2H in the Tucupido reservoir with respect to the Bocon�o
H4SiO4 (mmol l-1)
0 0.1 0.2
Wat
erde
pth
(m)
0
-10
-20
-30
-40
-50
-60
0 20 40 60
Fed (µmol l-1)
0 20 40
Mnd (µmol l-1)
0 10 20
Cod (nmol l-1)
Wat
erde
pth
(m)
0 0.5 1
Mg2+, Ca2+ (mmol l-1)
0
-10
-20
-30
-40
-50
-60
Mg2+ Ca2+
0
K+, Na+ (mmol l-1)
0.1 0.2
K+ Na+
Fig. 5. Plots of dissolved element concentrations in the water column.
Bocon�o and Tucupido reservoirs, respectively, in September 1999. Tri
in November 2000. DOC concentrations are 0.1 mmol L�1 higher in
reservoir, in particular for surface waters. This depth-
related distribution is linked to the thermal stratification
and correlations between stable isotope values and water
temperature can be derived (Fig. 4(c)). Using a least
square fitting method with a reduced major axis proce-
dure (Payne, 1991), the overall d18O and d2H values
could be fitted by an ‘‘evaporation’’ line (Fig. 4(d)) with
a slope of 4.2� 0.3, consistent with the 4.0 value usually
reported for surface lake waters (e.g.: Gat, 1995). The
observed relationship can be improved if only Tucupido
reservoir data are taken into account. A local meteoric
water line could be derived from average monthly pre-
cipitation data reported for the Bocon�o watershed
(IAEA, 2001). This local meteoric line [d2H ¼ ð7:99�0:14Þd18Oþ ð10:6� 1:0Þ, r ¼ 0:99, n ¼ 59] is very closed
to the global meteoric water line (GMWL, Craig, 1961;
GNIP, 1996). The intercept of the GMWL with the
evaporation line (d18O � �7‰ and d2H � �45‰) pro-
vides a first order estimate of the isotopic composition
of the water before evaporation. This composition is
closely approached by that of the Bocon�o River
(d18O ¼ �6:7‰ and d2H ¼ �45:8‰, Fig. 4(d)). At the
0 1 2
DOC, DIC (mmol l-1)
DOC DIC
0 0.4 0.8
Bad (µmol l-1)
0
Cl- (mmol l-1)
0.02 0.04 0
SO42- (mmol l-1)
0.1 0.2 0
NH4+ (mmol l-1)
0.05 0.1
0 1 2
Ud (nmol l-1)
Open and closed circles refer to two bathymetric profiles in the
angles refer to one bathymetric profile in the Tucupido reservoir
the Tucupido reservoir.

Table 4
Data for the Bocon�o River at the inlet (inflow, September 1999)
and the outlet of the Pe~na Larga water dam (outflow: No-
vember 1997 for water data, and September 1999 for suspended
sediment data)
Inflow Outflow
Ca2þ (mmol L�1) 0.55 0.41
Mg2þ (mmol L�1) 0.14 0.10
Naþ (mmol L�1) 0.16 0.10
Kþ (mmol L�1) 0.04 0.02
SO2�4 (mmol L�1) 0.15 0.12
NO�3 (mmol L�1) 0.02 bda
Cl� (mmol L�1) 0.02 0.02
DOC (mmol L�1) 0.22 0.13
DIC (mmol L�1) 1.46 1.31
Fe (lmol L�1) 0.72 –
Mn (lmol L�1) 0.18 –
Ba (lmol L�1) 0.07 –
U (nmol L�1) 1.09 –
d18O vs. SMOW (‰) )6.7 )5.6d2H vs. SMOW (‰) )45.8 )41.8T (�C) 23.9 24.9
TSS <50 lm (g L�1) 1.46 0.09
POC<50 lm (mg C g�1) 10.3 13.0
PN <50 lm (mg N g�1) 1.1 1.4
POC: PN <50 lm 8.9 9.0
d13CPOC <50 lm vs. PDB (‰) )25.8 )24.8a Below detection limit.
B. Bellanger et al. / Applied Geochemistry 19 (2004) 1295–1314 1303
outlet of the dam, water provides d18O and d2H com-
positions ()5.6‰ and )41.8 ‰, respectively) that match
those in the water column of the Bocon�o reservoir at the
depth of water intake (ca. 30 m).
3.4. Dissolved element concentrations
Depth-variations of major element and selected trace
element concentrations are displayed in Fig. 5. Depth-
variations of electrical conductivity are correlated with
total dissolved load and mainly linked to the behaviour
of DIC, which represents 40–50 mol% of the total dis-
solved species (Fig. 5). The ionic balance is accurately
tightened if DIC concentrations are assigned to HCO�3
and the average uncertainty between major cations and
anions concentrations is below 2.5%. Several major el-
ement (Na, K, Mg, Ca, Si, Cl) concentrations are
equivalent and constant with water depth and time in
both reservoirs. In contrast, SO4, NH4 and dissolved
metal and trace elements (Fe, Mn, Co, Ba, U) display a
different behaviour in each reservoir. Despite equivalent
concentrations in surface waters for both reservoirs,
samples located immediately below the thermocline in
the Tucupido reservoir display a marked decrease in SO4
concentrations and concomitant increases in NHþ4 , dis-
solved Fe, Mn, Co and Ba concentrations (Fig. 5). These
trends are more pronounced in September 1999 than in
November 2000. In contrast with other trace elements,
U concentrations are lower in the Tucupido reservoir
than in the Bocon�o reservoir. Waters in both reservoirs
are markedly depleted in nitrates with concentration
ranging from 2 to 4 lmol L�1 or even below the detec-
tion limit (1 lmol L�1). Phosphate concentrations are
always below detection limit (data not shown). Finally,
DOC and DIC also differ from one reservoir to the other
below the thermocline, with nearly constant values in the
Bocon�o reservoir and higher, depth-increasing concen-
trations in the Tucupido reservoir that mirror electrical
conductivity changes (Fig. 3). The dissolved element
concentrations in the Bocon�o reservoir closely match
those of the Bocon�o River (Table 4), the main water
supply to the Pe~na Larga dam.
3.5. Composition of suspended matter
In the Bocon�o reservoir high and depth-increasing
suspended sediment concentrations (16–140 mg L�1) are
observed whereas, the Tucupido water column only
bears very low sediment concentrations (<10 mg L�1)
with no depth-related change (Fig. 6(a)). All particles
are smaller than 50 lm in the Bocon�o reservoir but 7–51
wt% of suspended matter debris are above 50 lm in the
Tucupido reservoir. Optical observations as well as total
organic matter analyses (POC ¼ 415� 98 mg C g�1,
POC/PN¼ 27� 10, and d13C ¼ �26� 1‰; n ¼ 9) sup-
port high occurrence of land derived detritus in the >50
lm size fraction of suspended matter in the Tucupido
reservoir (C/N > 20; Meyers, 1994). An additional
contrast between the two reservoirs is displayed by the
POC concentrations and their d13C values (Fig. 6). The
POC contents (in mg C g�1) of suspended sediments
decrease with water depth in both reservoirs but values
are much lower for the Bocon�o reservoir, indicating the
presence of organic C-poor material (Fig. 6(b)). How-
ever, POC concentrations (in mg C L�1) are higher in the
Bocon�o reservoir than in the Tucupido reservoir, due to
higher suspended sediment concentrations (Fig. 6(c)).
While both reservoirs display relatively similar d13Cvalues in their epilimnion, contrasting compositions are
observed below the thermocline (Fig. 6(d)). In the hy-
polimnion of the Bocon�o reservoir, d13C values decrease
moderately from )25.6‰ to )26.3‰ near lake bottom
whereas they decrease sharply to )29.9‰ in the Tu-
cupido reservoir. The POC:PN ratios decrease with
water depth in both reservoirs (Fig. 6(e)), indicating the
increase of N with respect to organic C in the water
column and/or the mixing of particles originating from
organic matter pools with a different composition. The
input of suspended organic matter linked to the Bocon�oriver discharge is reflected in the water column (ca. 20–
30 m) by concomitant changes in POC, POC:PN and
d13C values (Table 4 and Fig. 6). The lowest POC:
Chlorophyll-a ratio coincides with the highest POC: PN
value (ca. 2 m, Fig. 6(f)) but no evident direct link be-
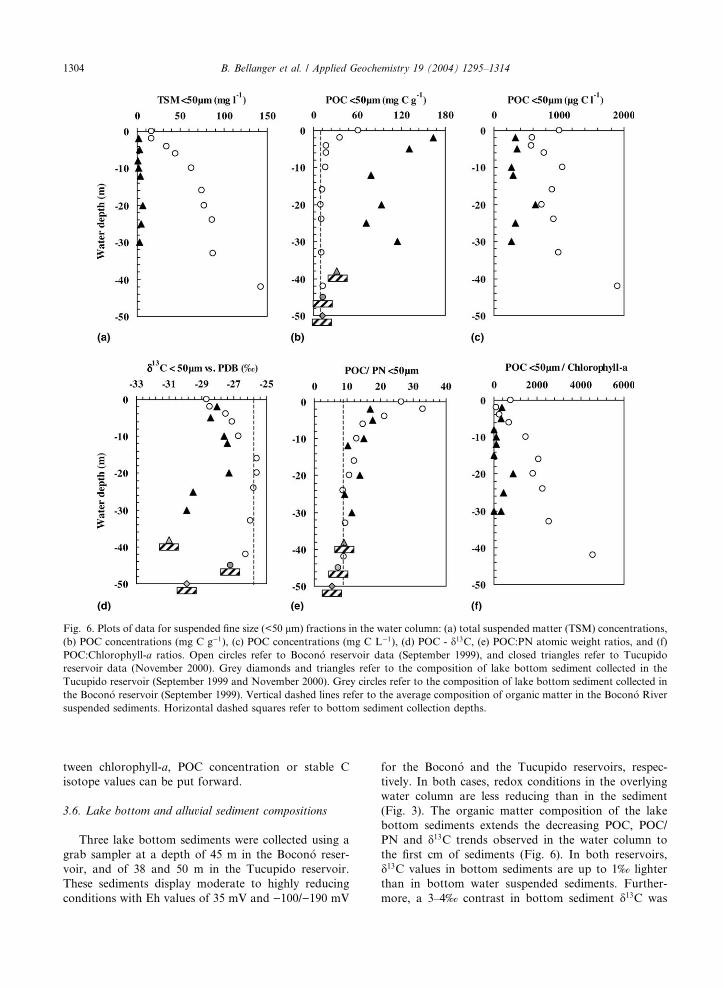
Fig. 6. Plots of data for suspended fine size (<50 lm) fractions in the water column: (a) total suspended matter (TSM) concentrations,
(b) POC concentrations (mg C g�1), (c) POC concentrations (mg C L�1), (d) POC - d13C, (e) POC:PN atomic weight ratios, and (f)
POC:Chlorophyll-a ratios. Open circles refer to Bocon�o reservoir data (September 1999), and closed triangles refer to Tucupido
reservoir data (November 2000). Grey diamonds and triangles refer to the composition of lake bottom sediment collected in the
Tucupido reservoir (September 1999 and November 2000). Grey circles refer to the composition of lake bottom sediment collected in
the Bocon�o reservoir (September 1999). Vertical dashed lines refer to the average composition of organic matter in the Bocon�o River
suspended sediments. Horizontal dashed squares refer to bottom sediment collection depths.
1304 B. Bellanger et al. / Applied Geochemistry 19 (2004) 1295–1314
tween chlorophyll-a, POC concentration or stable C
isotope values can be put forward.
3.6. Lake bottom and alluvial sediment compositions
Three lake bottom sediments were collected using a
grab sampler at a depth of 45 m in the Bocon�o reser-
voir, and of 38 and 50 m in the Tucupido reservoir.
These sediments display moderate to highly reducing
conditions with Eh values of 35 mV and )100/)190 mV
for the Bocon�o and the Tucupido reservoirs, respec-
tively. In both cases, redox conditions in the overlying
water column are less reducing than in the sediment
(Fig. 3). The organic matter composition of the lake
bottom sediments extends the decreasing POC, POC/
PN and d13C trends observed in the water column to
the first cm of sediments (Fig. 6). In both reservoirs,
d13C values in bottom sediments are up to 1‰ lighter
than in bottom water suspended sediments. Further-
more, a 3–4‰ contrast in bottom sediment d13C was

B. Bellanger et al. / Applied Geochemistry 19 (2004) 1295–1314 1305
observed between the two reservoirs (ca. )30.5‰ vs.
)27.0‰ for the Tucupido and the Bocon�o reservoirs,
respectively).
Additional information on sedimentary organic C
was obtained from 6 sedimentary cores sampled in the
alluvial fan of the Bocon�o River. These deposits repre-
sent the greatest part of the sedimentary supply to the
Bocon�o reservoir. Organic C concentrations range from
12 mg C g�1 in surface sediments to 3 mg C g�1 at a
depth of 3 m (Fig. 7). Except for a few C-rich surface
sediments, organic C concentrations are rather homog-
enous with depth, with an average POC concentration of
4� 1 mg C g�1. The measured pH–Eh values (T ¼ 26
�C, pH¼ 6.29, )100 mV<Eh<)190 mV) indicate
slightly more reducing conditions than in the top first cm
of lake bottom sediments (Fig. 9).
3.7. Sediment and organic carbon budgets
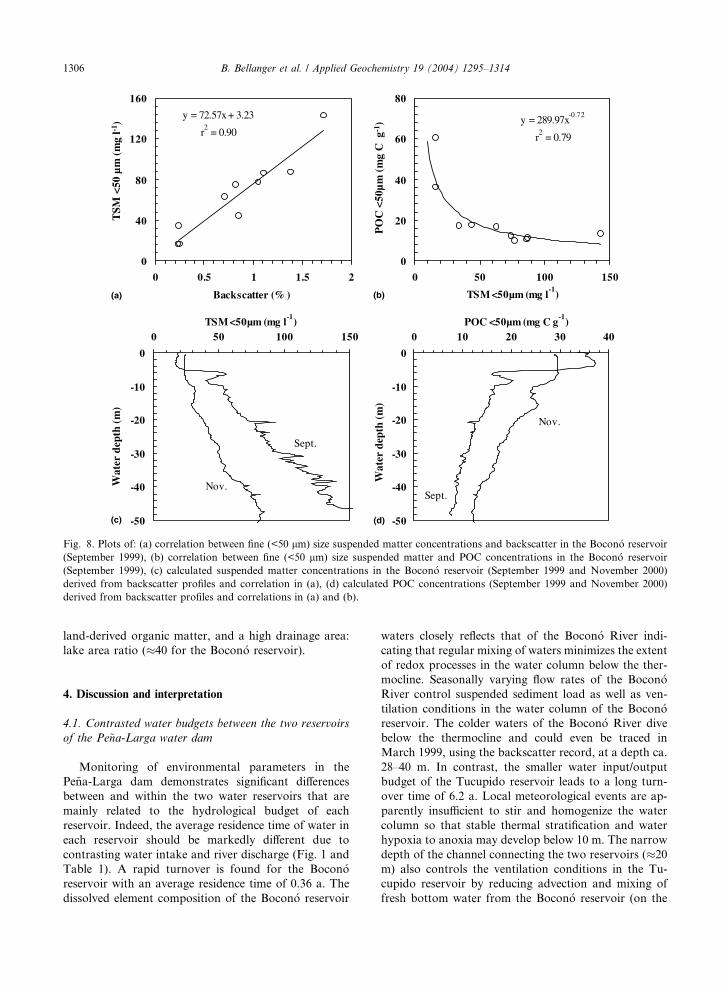
Suspended matter mass concentrations and light
backscatter values are correlated for the Bocon�o reser-
voir (September 1999; Fig. 8(a)). Because POC and
suspended sediment concentrations are also correlated
(hyperbolic trend, Fig. 8(b)), both the amount of sus-
pended matter and of POC can can derived from
backscatter values for each profile in the water column
(Figs. 8(c)–(d)). Using water depth–water volume
relationships (v ¼ 0:53z2 þ 63:99zþ 1907:81 and v ¼0:32z2 þ 36:66zþ 1041:19 for the Bocon�o and Tucupido
reservoirs, respectively, with v¼water volume in 106 m3
and z¼water depth in m, range: )0 m to )70 m,
0
50
100
150
200
250
300
350
0 5 10 15
OC (mg C g-1)
Sedi
men
t de
pth
(cm
)
Fig. 7. Plots of organic C concentration in 6 sediments cores
located in the alluvial fan of the Bocon�o River.
MARNR, 2001), average backscatter values and the
relationships previously established, for September 1999
an estimate can be derived of the instantaneous amount
of suspended sediment (80� 103 t) and POC (0.95� 103
t C) in the Bocon�o reservoir water column. Correlative
hyperbolic trends between POC and suspended sediment
are generally observed in rivers (e.g.: Meybeck, 1982)
and are thought to reflect either the dilution of organic
matter by minerals for high concentrations of suspended
sediment or a change in the nature of organic matter
(i.e., vegetation debris vs. soil organic matter). However,
if organic C-rich samples collected near the surface are
disregarded (Fig. 6), and a constant POC concentration
is assumed throughout the water column (average� 1r:13� 3 mg C g�1), the POC budget does not significantly
change (1.0� 0.2� 103 t C vs. 0.95� 103 t C). Suspended
sediment concentrations and backscatter values being
almost constant throughout the water column in the
Tucupido reservoir, an average 10� 103 t of sediment
and 0.5� 103 t of POC can be calculated, using a mean
suspended sediment concentration of 5 mg L�1 and a
mean POC concentration of 0.3 mg C L�1 in the water
column (Fig. 6). The suspended sediment concentration
in the Bocon�o reservoir was one order of magnitude
higher than in the Tucupido reservoir but the POC
concentration was only 3 times higher. Assuming that
backscatter/sediment and sediment/POC relationships
are also valid in November 2000, the suspended sedi-
ment content in the water column of the Bocon�o reser-
voir during this period was half of that of September
1999, but the POC content remained similar (Fig. 8(c)–
(d)). Equivalent estimations could not be performed for
March 1999 because backscatter values recorded the
presence, in the hypolimnion between ca. 28–40 m, of
incompletely mixed river/lake water masses with differ-
ent suspended loads and, most likely also, different types
of organic matter. The total POC content in the water
column of the dam amounted to 1.5� 103 t C in Sep-
tember 1999. The DOC: POC ratios also differed from
one reservoir to the other, reflecting the difference in
suspended sediment concentrations (DOC/POC� 3 in
the Bocon�o reservoir and DOC/POC� 10 in the
Tucupido reservoir).
The Bocon�o River discharges 32� 103 t C a�1 (cal-
culated with an average POC content of 5 mg C g�1). Of
this, 21� 5� 103 t C a�1 is stored in bottom sediments
(calculated with an average POC content of 4� 1 mg C
g�1) and ca. 2� 103 t C a�1 is exported from the water
dam (calculated with an average POC content of 10 mg
C g�1 measured at the depth of water intake). Because
POC mainly accumulates in the Bocon�o reservoir (38.4
km2), an organic C burial rate between 416 and 703 t C
km�2 a�1 was derived, which is an order of magnitude
higher than that usually reported for small lakes (<500
km2, rate: 20–80 t C km�2 a�1; e.g.: Einsele et al., 2001).
This high burial rate results both from high inputs of
-50
-40
-30
-20
-10
0
0 50 100 150TSM <50µm (mg l
-1)
(c)
Sept.
Nov.
-50
-40
-30
-20
-10
0
0 10 20 30 40POC <50µm (mg C g
-1)
(d)
Sept.
Nov.
y = 289.97x-0.72
r2
= 0.79
0
20
40
60
80
0 50 100 150
TSM <50µm (mg l-1
)(b)
y = 72.57x+ 3.23
r2
= 0.90
0
40
80
120
160
0 0.5 1 1.5 2
Backscatter (% )(a)
Wat
erde
pth
(m)
Wat
erde
pth
(m)
TSM
<50
µm
(mg
l-1)
PO
C<5
0µm
(mg
Cg-1
)
Fig. 8. Plots of: (a) correlation between fine (<50 lm) size suspended matter concentrations and backscatter in the Bocon�o reservoir
(September 1999), (b) correlation between fine (<50 lm) size suspended matter and POC concentrations in the Bocon�o reservoir
(September 1999), (c) calculated suspended matter concentrations in the Bocon�o reservoir (September 1999 and November 2000)
derived from backscatter profiles and correlation in (a), (d) calculated POC concentrations (September 1999 and November 2000)
derived from backscatter profiles and correlations in (a) and (b).
1306 B. Bellanger et al. / Applied Geochemistry 19 (2004) 1295–1314
land-derived organic matter, and a high drainage area:
lake area ratio (�40 for the Bocon�o reservoir).
4. Discussion and interpretation
4.1. Contrasted water budgets between the two reservoirs
of the Pe~na-Larga water dam
Monitoring of environmental parameters in the
Pe~na-Larga dam demonstrates significant differences
between and within the two water reservoirs that are
mainly related to the hydrological budget of each
reservoir. Indeed, the average residence time of water in
each reservoir should be markedly different due to
contrasting water intake and river discharge (Fig. 1 and
Table 1). A rapid turnover is found for the Bocon�oreservoir with an average residence time of 0.36 a. The
dissolved element composition of the Bocon�o reservoir
waters closely reflects that of the Bocon�o River indi-
cating that regular mixing of waters minimizes the extent
of redox processes in the water column below the ther-
mocline. Seasonally varying flow rates of the Bocon�oRiver control suspended sediment load as well as ven-
tilation conditions in the water column of the Bocon�oreservoir. The colder waters of the Bocon�o River dive
below the thermocline and could even be traced in
March 1999, using the backscatter record, at a depth ca.
28–40 m. In contrast, the smaller water input/output
budget of the Tucupido reservoir leads to a long turn-
over time of 6.2 a. Local meteorological events are ap-
parently insufficient to stir and homogenize the water
column so that stable thermal stratification and water
hypoxia to anoxia may develop below 10 m. The narrow
depth of the channel connecting the two reservoirs (�20
m) also controls the ventilation conditions in the Tu-
cupido reservoir by reducing advection and mixing of
fresh bottom water from the Bocon�o reservoir (on the

B. Bellanger et al. / Applied Geochemistry 19 (2004) 1295–1314 1307
model of the Black sea and the Bosphorus sill; e.g.:
Demaison and Moore, 1980). The isotopic composition
of water also reflects the impact of contrasted water
residence times. The extent of 18O/16O and 2H/1H iso-
topic fractionation due to evaporation was reduced
in the Bocon�o reservoir with respect to that of the
Tucupido reservoir (Fig. 4).
4.2. Linkages between environmental parameters and
geochemical data
The evolution of environmental parameters through
the water column indicates that photosynthetic pro-
cesses control the water chemistry above the thermocline
(high chlorophyll-a and dissolved O2 concentrations,
high pH) whereas, respiration processes lead to dis-
solved O2 depletion and low pH in the deeper water
strata. The impact of these processes can be clearly seen
in the calcite equilibrium diagram (Fig. 9(a)). Over sat-
uration with respect to calcite equilibrium is observed in
surface water, and under saturation in bottom water.
However, there is no evidence for precipitation of car-
bonates in the Pe~na Larga water dam, because no sea-
sonal or water depth related depletions in Ca2þ, Mg2þ
-0.5
0.0
0.5
1.0
0 2 4 6 8 10 12
pH
Eh
(V)
Fe2+
Fe(OH)2
Fe3+
FeOH2+
Fe(OH)3
(d)
-5
-7
O2 (g)
H2O
H2O
H2(g)
10.5
11.5
12.5
13.5
14.5
-4 -3 -2 -1
log (pCO2)
Atm
osph
ere
Euphotic Zone
Increasing depth
(a)
Log
(Ca2+
)+
2pH
+lo
g(H
2O)
-0.2
0.0
0.2
0.4
0.6
5 6 7 8
pH
Eh
(V)
NH4+
(b)
-1.0
-0.5
0.0
0.5
1.0
0 2 4
pH
Eh
(V)
H2S
SO42
HSO4-
H2O
H2(g)
(e)
Fig. 9. Equilibrium diagrams for: (a) calcite and water in the two r
species, (c) Mn species, (d) Fe species, (e) dissolved S species and (f) d
and therefore ignored. Boundaries in equilibrium diagrams are calc
concentrations¼ 10�5 and 10�7 mol L�1. Oxidation states involved ar
circles refer to Bocon�o and Tucupido reservoirs, respectively (Septemb
sediments in the Tucupido reservoir (November 2000).
or DIC concentrations have been observed (e.g.:
McConnaughey et al., 1994; McConnaughey and Whe-
lan, 1997).
In contrast to the Bocon�o reservoir in which organic
matter undergoes aerobic mineralization, microbially
mediated redox-driven processes induced by dissolved
O2 depletion control water chemical composition below
15 m in the Tucupido reservoir. Thus, the narrow
chlorophyll-a concentration and backscatter peaks ob-
served in the thermocline ca. 11 m (Fig. 3) indicate ac-
cumulation of suspended debris and reflects the location
of high microbial activity. It coincides with a major
‘‘dissolution zone’’ characterized by a sharp increase of
EC, and a decrease to near zero of dissolved O2 con-
centration. The location of high photosynthetic activity
at this depth is linked to high nutrient concentrations
induced by the degradation of suspended organic matter
and by the penetration of light. In O2-depleted waters,
the oxidation of organic matter is coupled with a suc-
cession of reduction reactions using other electron ac-
ceptors that theoretically follow decreasing free energy
yields (Stumm and Morgan, 1996). These processes have
been widely described in lakes and fjords (e.g.: Balistrieri
et al., 1992a, 1994; Yao and Millero, 1995; Hamilton-
9 10 11
NH3
NO3-
NO2-
-0.5
0.0
0.5
1.0
0 2 4 6 8 10 12
pH
Eh
(V)
Mn2+
MnO2
Mn2O3
Mn3O4
O2 (g)
H2O
H2O
H2(g)
Mn(OH)2
(c)
6 8 10 12
-
O2 (g)
H2O
HS-
-1.0
-0.5
0.0
0.5
1.0
4 6 8 10 12
pH
Eh
(V)
CH4
HCO3-
CO32-
H2CO3
O2(g)
H2O
H2(g)
H2O
(f)
eservoirs and Eh–pH diagrams (at 25 �C) for: (b) dissolved N
issolved C species. N2 is considered as a redox-inert component
ulated for total Mn concentrations¼ 10�6 mol L�1, total Fe
e S ()II) and S (+VI), C ()IV) and C (+IV). Open and closed
er 1999 and November 2000). Grey squares refer to lake bottom

1308 B. Bellanger et al. / Applied Geochemistry 19 (2004) 1295–1314
Taylor et al., 1996; Sternbeck, 1996; Stumm and Mor-
gan, 1996; Hongve, 1997; Wann et al., 1997; Zaw and
Chiswell, 1999). The main redox reactions can be pic-
tured by thermodynamic equilibrium diagrams using Eh
and pH values (Figs. 9(b)–(f)). It appears that conditions
for a complete dissolution of Fe and Mn oxides/hy-
droxides and reduction of NO3 to NH4 are predicted in
the Tucupido reservoir for samples located below the
thermocline. Sulphate reduction and, possibly also CH4
formation, are operating but most likely, do not reach
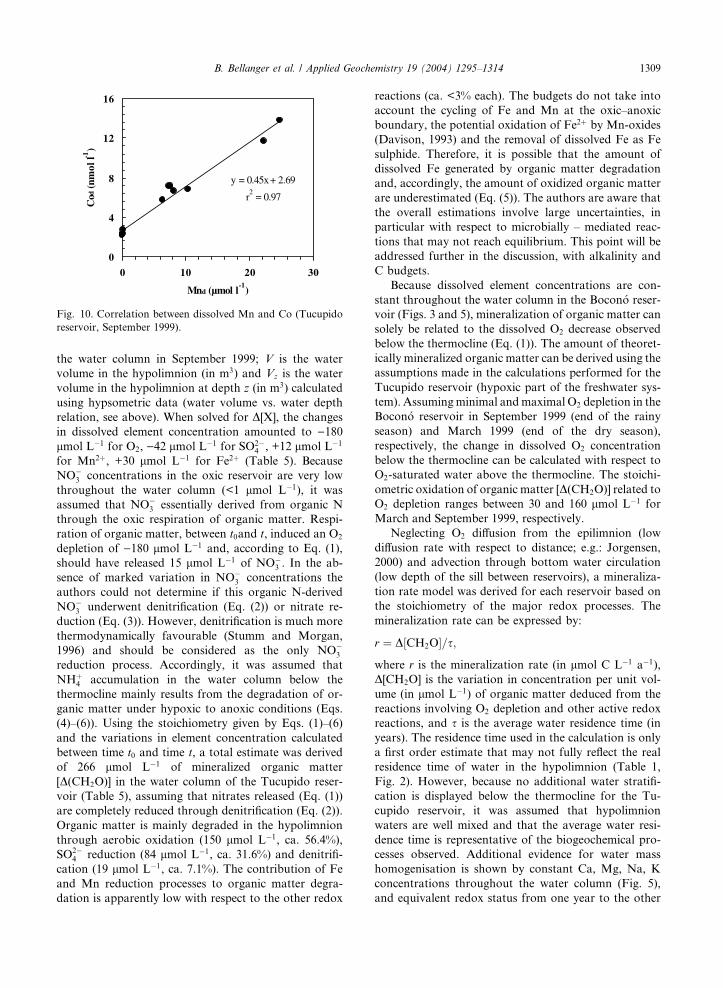
equilibrium. Additional information on active reduction
processes taking place in the water column is displayed
by the correlative distribution of dissolved Co and Ba
concentrations with dissolved Fe and Mn concentrations
below the thermocline in the Tucupido reservoir
(Fig. 10). This behaviour has been previously observed
in numerous lakes (e.g.: Balistrieri et al., 1992b, 1994;
Hamilton-Taylor and Davison, 1995; Viollier et al.,
1995; Achterberg et al., 1997; Taillefert and Gaillard,
2002) and attributed to microbially mediated reduction
of metallic hydrous oxides accompanied by the release of
adsorbed Co and Ba. The linear correlation between
dissolved Mn and Co concentrations (Fig. 10) bears a
slope of 4.5� 10�4, which falls in the range of the Co:
Mn ratios described for other lakes (1� 10�4 to 8� 10�4,
see references above). Cobalt and Ba are most likely
preferentially adsorbed onto Mn-oxides because the
correlations are more accurately defined with Mn
(r2 ¼ 0:97 and 0.75, respectively) than with Fe (r2 ¼ 0:68and 0.33, respectively). Additional evidence for reducing
conditions is pictured by the behaviour of U that is less
soluble in O2-depleted waters, suggesting out to possible
removal to sediments (Anderson et al., 1989).
4.3. Estimates of the mineralization rate of suspended
organic matter in the water column
On the basis of suspended organic matter with a C/N
ratio of 10, the sequence of oxidants, determined by
their energy yield can be expressed, for the Tucupido
reservoir, by the following equations (Froelich et al.,
1979; Stumm and Morgan, 1996):
Nitrification (coupled oxic respiration and nitrifica-
tion):
ðCH2OÞ10ðNH3Þ þ 12O2 () 10CO2 þHNO3 þ 11H2O
ð1Þ
D[O2]¼(12/10)�D[CH2O]¼)12�D[NO�3 ]¼)12�D[Alk]
Denitrification:
ðCH2OÞ10ðNH3Þ þ 8NO�3 () 4N2 þ 8HCO�
3
þ 2CO2 þ 6H2OþNH3 ð2Þ
D[NO�3 ]¼ (4/5)�D[CH2O]¼)8�D[NH3]¼�D[Alk]
Nitrate reduction:
ðCH2OÞ10ðNH3Þ þ 5NO�3 þ 5H2O () 5NHþ
4
þ 10HCO�3 þNH3 ð3Þ
D½NO�3 � ¼ ð1=2Þ � D[CH2O]¼�D[NHþ
4 ]¼)(1/2)D[Alk]
Mn (IV) reduction:
ðCH2OÞ10ðNH3Þ þ 30CO2 þ 10H2Oþ 20MnO2
() 20Mn2þ þ 40HCO�3 þNH3
ð4Þ
D½Mn2þ� ¼ �2� D½CH2O� ¼ 20� D½NH3�¼ ð1=2Þ � D½Alk�
Fe (III) reduction:
ðCH2OÞ10ðNH3Þ þ 70CO2 þ 40FeðOHÞ3() 40Fe2þ þ 80HCO�
3 þ 30H2OþNH3
ð5Þ
D[Fe2þ]¼)4�D[CH2O]¼ 40�D[NH3]¼ (1/2)�D[Alk]
Sulfate reduction:
ðCH2OÞ10ðNH3Þ þ 5SO2�4 () 5H2Sþ 10HCO�
3 þNH3
ð6Þ
D½SO2�4 � ¼ ð1=2Þ � D½CH2O� ¼ �5� D½NH3�
¼ �ð1=2Þ � D½Alk�
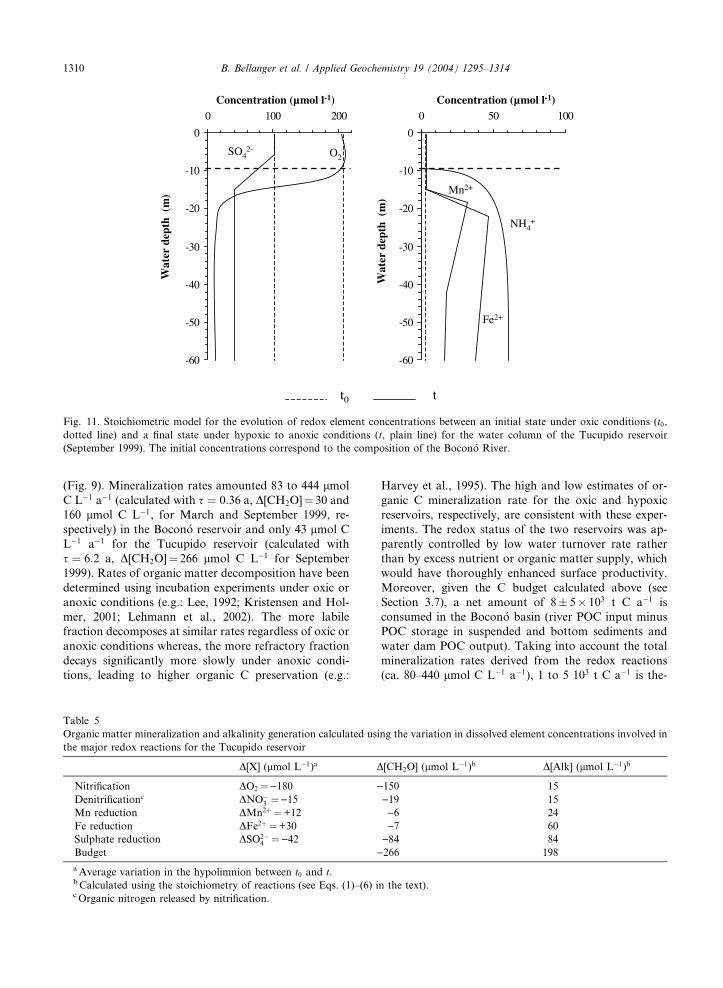
Assuming the hypolimnion (water depth below 10 m
in September 1999) as a closed system, we estimated the
theoretical amount of oxidized organic C (D[CH2O]),
using the stoichiometry of the operating redox processes
in each reservoir and integrating the average variations
in element concentrations (D[O2], D[NO�3 ], D[Mn2þ],
D[Fe2þ] and D[SO2�4 ]) in the hypolimnion between an
assumed initial status (t0 time, oxic conditions) where the
dissolved element composition is constant with water
depth and equivalent to that of the Bocon�o River
([O2]¼ 220 lmol L�1, [SO2�4 ] ¼ 100 lmol L�1, [NO�
3 ]
¼ [Mn2þ] ¼ [Fe2þ] ¼ 0 lmol L�1) and, a final status (t
time, hypoxic to anoxic conditions) where the dissolved
element composition is given by that of the concentra-
tion profiles achieved in September 1999 (Fig. 11). Mean
variations in concentration D[X] in the hypolimnion
between t0 and t can be calculated using the following
equation:
D½X� � V ¼ ð½X� � V Þt0 �X
½X�z�
� Vz�t;
where t0 and t are indices that refer to initial and final
redox status, respectively; [X] is the dissolved element
concentration (O2, SO2�4 , Mn2þ, Fe2þ in lmol L�1) in the
hypolimnion; [X]z is the element concentration at depth
z (in lmol L�1) extrapolated from their distribution in
y = 0.45x+ 2.69
r2
= 0.97
0
4
8
12
16
0 10 20 30
Mnd (µmol l-1
)
Cod
(nm
oll-1
)
Fig. 10. Correlation between dissolved Mn and Co (Tucupido
reservoir, September 1999).
B. Bellanger et al. / Applied Geochemistry 19 (2004) 1295–1314 1309
the water column in September 1999; V is the water
volume in the hypolimnion (in m3) and Vz is the water
volume in the hypolimnion at depth z (in m3) calculated
using hypsometric data (water volume vs. water depth
relation, see above). When solved for D[X], the changes
in dissolved element concentration amounted to )180lmol L�1 for O2, )42 lmol L�1 for SO2�
4 , +12 lmol L�1
for Mn2þ, +30 lmol L�1 for Fe2þ (Table 5). Because
NO�3 concentrations in the oxic reservoir are very low
throughout the water column (<1 lmol L�1), it was
assumed that NO�3 essentially derived from organic N
through the oxic respiration of organic matter. Respi-
ration of organic matter, between t0and t, induced an O2
depletion of )180 lmol L�1 and, according to Eq. (1),
should have released 15 lmol L�1 of NO�3 . In the ab-
sence of marked variation in NO�3 concentrations the
authors could not determine if this organic N-derived
NO�3 underwent denitrification (Eq. (2)) or nitrate re-
duction (Eq. (3)). However, denitrification is much more
thermodynamically favourable (Stumm and Morgan,
1996) and should be considered as the only NO�3
reduction process. Accordingly, it was assumed that
NHþ4 accumulation in the water column below the
thermocline mainly results from the degradation of or-
ganic matter under hypoxic to anoxic conditions (Eqs.
(4)–(6)). Using the stoichiometry given by Eqs. (1)–(6)
and the variations in element concentration calculated
between time t0 and time t, a total estimate was derived
of 266 lmol L�1 of mineralized organic matter
[D(CH2O)] in the water column of the Tucupido reser-
voir (Table 5), assuming that nitrates released (Eq. (1))
are completely reduced through denitrification (Eq. (2)).
Organic matter is mainly degraded in the hypolimnion
through aerobic oxidation (150 lmol L�1, ca. 56.4%),
SO2�4 reduction (84 lmol L�1, ca. 31.6%) and denitrifi-
cation (19 lmol L�1, ca. 7.1%). The contribution of Fe
and Mn reduction processes to organic matter degra-
dation is apparently low with respect to the other redox
reactions (ca. <3% each). The budgets do not take into
account the cycling of Fe and Mn at the oxic–anoxic
boundary, the potential oxidation of Fe2þ by Mn-oxides
(Davison, 1993) and the removal of dissolved Fe as Fe
sulphide. Therefore, it is possible that the amount of
dissolved Fe generated by organic matter degradation
and, accordingly, the amount of oxidized organic matter
are underestimated (Eq. (5)). The authors are aware that
the overall estimations involve large uncertainties, in
particular with respect to microbially – mediated reac-
tions that may not reach equilibrium. This point will be
addressed further in the discussion, with alkalinity and
C budgets.
Because dissolved element concentrations are con-
stant throughout the water column in the Bocon�o reser-
voir (Figs. 3 and 5), mineralization of organic matter can
solely be related to the dissolved O2 decrease observed
below the thermocline (Eq. (1)). The amount of theoret-
ically mineralized organic matter can be derived using the
assumptions made in the calculations performed for the
Tucupido reservoir (hypoxic part of the freshwater sys-
tem). Assumingminimal andmaximal O2 depletion in the
Bocon�o reservoir in September 1999 (end of the rainy
season) and March 1999 (end of the dry season),
respectively, the change in dissolved O2 concentration
below the thermocline can be calculated with respect to
O2-saturated water above the thermocline. The stoichi-
ometric oxidation of organic matter [D(CH2O)] related to
O2 depletion ranges between 30 and 160 lmol L�1 for
March and September 1999, respectively.
Neglecting O2 diffusion from the epilimnion (low
diffusion rate with respect to distance; e.g.: Jorgensen,
2000) and advection through bottom water circulation
(low depth of the sill between reservoirs), a mineraliza-
tion rate model was derived for each reservoir based on
the stoichiometry of the major redox processes. The
mineralization rate can be expressed by:
r ¼ D½CH2O�=s;
where r is the mineralization rate (in lmol C L�1 a�1),
D[CH2O] is the variation in concentration per unit vol-
ume (in lmol L�1) of organic matter deduced from the
reactions involving O2 depletion and other active redox
reactions, and s is the average water residence time (in
years). The residence time used in the calculation is only
a first order estimate that may not fully reflect the real
residence time of water in the hypolimnion (Table 1,
Fig. 2). However, because no additional water stratifi-
cation is displayed below the thermocline for the Tu-
cupido reservoir, it was assumed that hypolimnion
waters are well mixed and that the average water resi-
dence time is representative of the biogeochemical pro-
cesses observed. Additional evidence for water mass
homogenisation is shown by constant Ca, Mg, Na, K
concentrations throughout the water column (Fig. 5),
and equivalent redox status from one year to the other
-60
-50
-40
-30
-20
-10
0
0 100 200
-60
-50
-40
-30
-20
-10
0
0 50 100
Concentration (µmol l-1)
Wat
erde
pth
(m)
Concentration (µmol l-1)
Wat
erde
pth
(m)
SO42- O2
Mn2+
NH4+
Fe2+
t0 t
Fig. 11. Stoichiometric model for the evolution of redox element concentrations between an initial state under oxic conditions (t0,dotted line) and a final state under hypoxic to anoxic conditions (t, plain line) for the water column of the Tucupido reservoir
(September 1999). The initial concentrations correspond to the composition of the Bocon�o River.
1310 B. Bellanger et al. / Applied Geochemistry 19 (2004) 1295–1314
(Fig. 9). Mineralization rates amounted 83 to 444 lmol
C L�1 a�1 (calculated with s ¼ 0:36 a, D[CH2O]¼ 30 and
160 lmol C L�1, for March and September 1999, re-
spectively) in the Bocon�o reservoir and only 43 lmol C
L�1 a�1 for the Tucupido reservoir (calculated with
s ¼ 6:2 a, D[CH2O]¼ 266 lmol C L�1 for September
1999). Rates of organic matter decomposition have been
determined using incubation experiments under oxic or
anoxic conditions (e.g.: Lee, 1992; Kristensen and Hol-
mer, 2001; Lehmann et al., 2002). The more labile
fraction decomposes at similar rates regardless of oxic or
anoxic conditions whereas, the more refractory fraction
decays significantly more slowly under anoxic condi-
tions, leading to higher organic C preservation (e.g.:
Table 5
Organic matter mineralization and alkalinity generation calculated usi
the major redox reactions for the Tucupido reservoir
D[X] (lmol L�1)a D
Nitrification DO2 ¼)180 )Denitrificationc DNO�
3 ¼)15Mn reduction DMn2þ ¼+12
Fe reduction DFe2þ ¼+30
Sulphate reduction DSO2�4 ¼)42
Budget )aAverage variation in the hypolimnion between t0 and t.b Calculated using the stoichiometry of reactions (see Eqs. (1)–(6) icOrganic nitrogen released by nitrification.
Harvey et al., 1995). The high and low estimates of or-
ganic C mineralization rate for the oxic and hypoxic
reservoirs, respectively, are consistent with these exper-
iments. The redox status of the two reservoirs was ap-
parently controlled by low water turnover rate rather
than by excess nutrient or organic matter supply, which
would have thoroughly enhanced surface productivity.
Moreover, given the C budget calculated above (see
Section 3.7), a net amount of 8� 5� 103 t C a�1 is
consumed in the Bocon�o basin (river POC input minus
POC storage in suspended and bottom sediments and
water dam POC output). Taking into account the total
mineralization rates derived from the redox reactions
(ca. 80–440 lmol C L�1 a�1), 1 to 5 103 t C a�1 is the-
ng the variation in dissolved element concentrations involved in
[CH2O] (lmol L�1)b D[Alk] (lmol L�1)b
150 15
)19 15
)6 24
)7 60
)84 84
266 198
n the text).
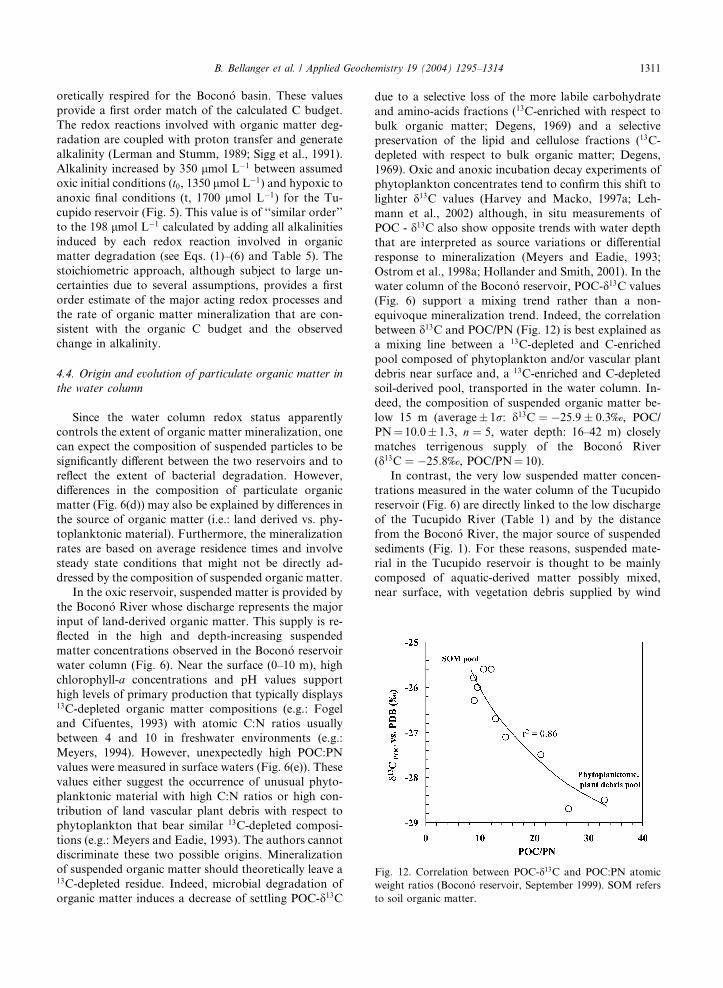
Fig. 12. Correlation between POC-d13C and POC:PN atomic
weight ratios (Bocon�o reservoir, September 1999). SOM refers
to soil organic matter.
B. Bellanger et al. / Applied Geochemistry 19 (2004) 1295–1314 1311
oretically respired for the Bocon�o basin. These values
provide a first order match of the calculated C budget.
The redox reactions involved with organic matter deg-
radation are coupled with proton transfer and generate
alkalinity (Lerman and Stumm, 1989; Sigg et al., 1991).
Alkalinity increased by 350 lmol L�1 between assumed
oxic initial conditions (t0, 1350 lmol L�1) and hypoxic to
anoxic final conditions (t, 1700 lmol L�1) for the Tu-
cupido reservoir (Fig. 5). This value is of ‘‘similar order’’
to the 198 lmol L�1 calculated by adding all alkalinities
induced by each redox reaction involved in organic
matter degradation (see Eqs. (1)–(6) and Table 5). The
stoichiometric approach, although subject to large un-
certainties due to several assumptions, provides a first
order estimate of the major acting redox processes and
the rate of organic matter mineralization that are con-
sistent with the organic C budget and the observed
change in alkalinity.
4.4. Origin and evolution of particulate organic matter in
the water column
Since the water column redox status apparently
controls the extent of organic matter mineralization, one
can expect the composition of suspended particles to be
significantly different between the two reservoirs and to
reflect the extent of bacterial degradation. However,
differences in the composition of particulate organic
matter (Fig. 6(d)) may also be explained by differences in
the source of organic matter (i.e.: land derived vs. phy-
toplanktonic material). Furthermore, the mineralization
rates are based on average residence times and involve
steady state conditions that might not be directly ad-
dressed by the composition of suspended organic matter.
In the oxic reservoir, suspended matter is provided by
the Bocon�o River whose discharge represents the major
input of land-derived organic matter. This supply is re-
flected in the high and depth-increasing suspended
matter concentrations observed in the Bocon�o reservoir
water column (Fig. 6). Near the surface (0–10 m), high
chlorophyll-a concentrations and pH values support
high levels of primary production that typically displays13C-depleted organic matter compositions (e.g.: Fogel
and Cifuentes, 1993) with atomic C:N ratios usually
between 4 and 10 in freshwater environments (e.g.:
Meyers, 1994). However, unexpectedly high POC:PN
values were measured in surface waters (Fig. 6(e)). These
values either suggest the occurrence of unusual phyto-
planktonic material with high C:N ratios or high con-
tribution of land vascular plant debris with respect to
phytoplankton that bear similar 13C-depleted composi-
tions (e.g.: Meyers and Eadie, 1993). The authors cannot
discriminate these two possible origins. Mineralization
of suspended organic matter should theoretically leave a13C-depleted residue. Indeed, microbial degradation of
organic matter induces a decrease of settling POC-d13C
due to a selective loss of the more labile carbohydrate
and amino-acids fractions (13C-enriched with respect to
bulk organic matter; Degens, 1969) and a selective
preservation of the lipid and cellulose fractions (13C-
depleted with respect to bulk organic matter; Degens,
1969). Oxic and anoxic incubation decay experiments of
phytoplankton concentrates tend to confirm this shift to
lighter d13C values (Harvey and Macko, 1997a; Leh-
mann et al., 2002) although, in situ measurements of
POC - d13C also show opposite trends with water depth
that are interpreted as source variations or differential
response to mineralization (Meyers and Eadie, 1993;
Ostrom et al., 1998a; Hollander and Smith, 2001). In the
water column of the Bocon�o reservoir, POC-d13C values
(Fig. 6) support a mixing trend rather than a non-
equivoque mineralization trend. Indeed, the correlation
between d13C and POC/PN (Fig. 12) is best explained as
a mixing line between a 13C-depleted and C-enriched
pool composed of phytoplankton and/or vascular plant
debris near surface and, a 13C-enriched and C-depleted
soil-derived pool, transported in the water column. In-
deed, the composition of suspended organic matter be-
low 15 m (average� 1r: d13C ¼ �25:9� 0:3‰, POC/
PN¼ 10.0� 1.3, n ¼ 5, water depth: 16–42 m) closely
matches terrigenous supply of the Bocon�o River
(d13C ¼ �25:8‰, POC/PN¼ 10).
In contrast, the very low suspended matter concen-
trations measured in the water column of the Tucupido
reservoir (Fig. 6) are directly linked to the low discharge
of the Tucupido River (Table 1) and by the distance
from the Bocon�o River, the major source of suspended
sediments (Fig. 1). For these reasons, suspended mate-
rial in the Tucupido reservoir is thought to be mainly
composed of aquatic-derived matter possibly mixed,
near surface, with vegetation debris supplied by wind
1312 B. Bellanger et al. / Applied Geochemistry 19 (2004) 1295–1314
(with high C:N ratios). The higher organic C contents
(in mg C g�1) measured in suspended sediments support
this assumption with respect to the soil-derived POC
recovered in the water column of the Bocon�o reservoir,
typically diluted by clay minerals and / or fine clastic
debris. Below the thermocline (ca. 12 m), the decreasing
d13C trend towards light values ()30‰) could reflect the
theoretical decreasing trend due to organic matter min-
eralization previously outlined. However, since reduced
mineralization rate apparently take place in the Tucup-
ido reservoir, suspended organic matter should be better
preserved than for the Bocon�o reservoir. An alternative
interpretation to the observed trend could be a change in
the nature of suspended organic matter (e.g.: Hollander
and Smith, 2001). Under hypoxic to anoxic conditions,
settling material with 13C-depleted values in the deeper
part of the water column might reflect the contribution
of chemoautotrophic and/or methanotrophic biomass.
Indeed, chemoautotrophic bacteria usually display low
d13C values (ca. )45‰, Freeman et al., 1990). Methan-
otrophic bacteria provide even more 13C-depleted com-
positions (ca. )90‰; Whiticar et al., 1986; Summons
et al., 1994). These assumptions are supported by
oxic–anoxic incubation decay experiments of marine
phytoplankton (Harvey and Macko, 1997b) or by a
comparative study of sediments from locations with
oxic–anoxic bottom waters (Gong and Hollander, 1997)
that both describe enhanced incorporation of microbial
biomass to total POC under anoxic conditions.
The redox conditions displayed near lake bottom
apparently extend to the first cm of sediments as shown
by low d13C values (d13C ¼ �27:2‰ and �29:9‰ <d13C < �31:0‰ for Bocon�o and Tucupido reservoirs,
respectively) and POC:PN ratios similar to those ob-
tained for suspended matter (Fig. 6). The ca. 1‰ dia-
genetic offset, with respect to suspended matter of the
overlying water column (e.g.: Lehmann et al., 2002), is
also shown by sediment d13C values. However, this trend
should still be validated by sediment core studies.
5. Conclusions
The combination of water cycle budgets, high reso-
lution monitoring of water environmental parameters,
chemical and isotopic measurements on water and sus-
pended organic matter in a tropical freshwater reservoir
(Pe~na Larga dam) located at the outlet of the Bocon�owatershed (Andes, NW Venezuela) allows several as-
sessments on the redox conditions prevailing in the
water column, their relationship with water and organic
matter supplies and the extent of suspended organic
matter mineralization. Composed of two sub-reservoirs
with contrasted water inputs, the Pe~na Larga dam pro-
vides the opportunity to better constrain C budgets and
source – composition of suspended organic matter
within two parts of a unique freshwater system with
different redox and ventilation conditions.
The redox status of the water column in the Pe~naLarga reservoir is mainly linked to mixing and renewal
of water (i.e.: the water residence time). In the part of the
reservoir directly connected to the main river discharge,
a seasonal water turnover induces regular water supply
and mixing during the year and subsequent dissolved O2
reload below the thermocline. Despite important river-
ine suspended matter inputs (sediment yield: 6� 106 t
a�1, POC input: 32� 103 t C a�1), organic matter deg-
radation is mainly driven by mineralization under oxic
conditions (estimated rate: ca. 80–440 lmol C L�1 a�1)
with limited dissolution of suspended mineral phases.
Surface planktonic production can be discriminated
from soil-derived organic matter supply using d13C val-
ues (13C-depleted vs. 13C-enriched values, respectively).
The oxic reservoir of Pe~na Larga dam mainly acts as a
sink for sediments and organic matter and thus, reduces
suspended matter export downriver.
Limited water mixing and ‘‘long-term’’ water resi-
dence time (average: 6.2 a) lead to apparently persistent
thermal stratification in the isolated parts of the Pe~naLarga dam. Reduced surface - bottom water mixing
induces hypoxic to anoxic conditions in the water col-
umn and in lake bottom sediments. Limited organic
matter mineralization occurs in waters strongly depleted
in dissolved O2 (estimated mineralization rate: ca. 40
lmol C L�1 a�1). Below the thermocline, bacterially
mediated reduction releases important amounts of dis-
solved metals and trace elements (i.e.: Fe, Mn, Co, Ba),
induces NH4 accumulation and limited SO4 reduction.
Below 20 m, residual organic matter displays high or-
ganic C concentrations (in mg C g�1) and 13C-depleted
compositions that both either reflect high contribution
of microbial biomass (chemoautotrophic and/or met-
hanotrophic bacteria) or selective loss of 13C-enriched
compounds. The hypoxic to anoxic conditions observed
in the isolated part of this tropical reservoir throughout
the year are comparable to the anoxic conditions pre-
vailing in the deep part of the water column in temperate
freshwater reservoirs undergoing eutrophication (e.g.:
Lake Lugano, Lake Michigan). However, enhanced
primary productivity due to excess supply of nutrients
and organic matter by runoff or soil erosion on the
watershed is apparently not the main process driving the
evolution of water column and sediment to hypoxic to
anoxic conditions, that are more likely linked to limited
O2 supply due to restricted water circulation and
renewal.
Acknowledgements
This work is dedicated to the memory of late Pro-
fessor Bernard K€ubler (Universit�e de Neuchatel) who
B. Bellanger et al. / Applied Geochemistry 19 (2004) 1295–1314 1313
initiated our collaboration. It was supported by the
French INSU (Program 97 PROSE 53) and by the
MARNR (Ministerio del Ambiente y de los Recursos
Naturales Renovables, Caracas, Venezuela). The au-
thors are grateful to M. Corni�eles-Vall�es, A. Moreau,
and Colonel R. Mena Nava (Instituto Geografico de
Venezuela Sim�on Bolivar) for their hospitality and
support. Bathymetric and hypsometric data for the Pe~naLarga water dam were kindly provided by A. Montilva,
M.J. Guerrero, H. Brice~no and M. Alvarado (DES-
URCA-CADAFE and MARNR, Venezuela). We are
also grateful to M. Grably (BIOMCO – Paris),
P. Richard (BIOMCO – Paris), J. Samuel (CGS –
Strasbourg), R. Rouault (CGS – Strasbourg), and D.
Million (CGS – Strasbourg) for their analytical assis-
tance. Dr. P.-P. Zuddas (IPGP – Paris) and Dr T. Bariac
(BIOMCO – Paris) helped us with their comments and
suggestions to improve a former draft of this manu-
script. Two anonymous reviewers are gratefully ac-
knowledged for their extensive reviews.
References
Achterberg, E.P., Van Den Berg, C.M.G., Boussemart, M.,
Davison, W., 1997. Speciation and cycling of trace metals in
Esthwaite water: a productive English lake with seasonal
deep-water anoxia. Geochim. Cosmochim. Acta 61, 5233–
5253.
Anderson, R.F., Fleisher, M.Q., LeHuray, A.P., 1989. Con-
centration, oxidation state and particulate flux of uranium
in the black sea. Geochim. Cosmochim. Acta 53, 2215–2224.
Balistrieri, L.S., Murray, J.W., Paul, B., 1992a. The cycling of
iron and manganese in the water column of Lake Samma-
mish, Washington. Limnol. Oceanog. 37, 510–528.
Balistrieri, L.S., Murray, J.W., Paul, B., 1992b. The biochem-
ical cycling of trace metals in the water column of Lake
Sammamish, Washington: response to seasonally anoxic
conditions. Limnol. Oceanog. 37 (3), 529–548.
Balistrieri, L.S., Murray, J.W., Paul, B., 1994. The geochemical
cycling of trace elements in a biogenic meromictic lake.
Geochim. Cosmochim. Acta 58, 3993–4008.
Benson, B.B., Krause, D., 1984. The concentration and isotopic
fractionation of oxygen dissolved in freshwater and seawa-
ter in equilibrium with the atmosphere. Limnol. Oceanog.
29, 620–632.
Bigeleisen, J., Perlman, M.L., Prosser, H.C., 1952. Conversion
of hydrogenic materials to hydrogen for isotopic analysis.
Anal. Chem. 24, 1356–1357.
Brock, T.D., 1985. A eutrophic lake: Lake Mendota, Wiscon-
sin. In: Ecological Studies, vol. 55. Springer, Berlin.
Chapra, S.C., Dobson, H.F.H., 1981. Quantification of the lake
trophic typologies of Naumann (surface quality) and the
Thienemann (oxygen) with special reference to Great Lakes.
J. Great Lakes Res. 7, 182–193.
Corniel�es, M., 1998. Etude et mod�elisation des transferts deau,
d�el�ements dissous et particulaires dans un bassin versant
torrentiel. Cas du Rio Bocon�o dans les Andes v�en�ezu�eli-
ennes. Unpubl. Doct. Thesis, Univ. Avignon (France).
Craig, H., 1961. Isotopic variations in meteoric waters. Science
133, 1702–1703.
Davison, W., 1993. Iron and manganese in lakes. Earth. Sci.
Rev. 34, 119–163.
Davison, W., Woof, C., 1984. A study of the cycling of
manganese and other elements in a seasonally anoxic lake,
Rostherne Mere, UK. Wat. Res. 18, 139–146.
Degens, E.T., 1969. Biogeochemistry of stable carbon isotopes.
In: Eglinton, G., Murphy, M.T.J. (Eds.), Organic Geochem-
istry: Methods and results. Springer, Berlin, pp. 304–356.
Demaison, G.J., Moore, G.T., 1980. Anoxic environments and
oil source bed genesis. Am. Assoc. Petrol. Geol. Bull. 64,
1179–1209.
De Vitre, R.R., Buffle, J., Perret, D., Baudat, R., 1988. A study
of iron and manganese transformations at the O2/S ()II)transition layer in a eutrophic lake (Lake Bret, Switzerland):
a multimethod approach. Geochim. Cosmochim. Acta 52,
1601–1613.
Edmond, J.M., Palmer, M.R., Measures, C.I., Brown, E.T.,
Huh, Y., 1996. Fluvial geochemistry of the eastern slope of
the North-eastern Andes and its foredeep in the drainage of
the Orinoco in Colombia and Venezuela. Geochim. Cos-
mochim. Acta 60, 2949–2976.
Einsele, G., Yan, J., Hinderer, M., 2001. Atmospheric carbon
burial in modern lake basins and its significance for the
global carbon budget. Global Planet. Change 30, 167–195.
Epstein, S., Mayeda, T., 1953. Variation of 18O content of
waters from natural sources. Geochim. Cosmochim. Acta.
4, 224–231.
Fogel, M., Cifuentes, L., 1993. Isotope fractionation during
primary production. In: Engel, H., Macko, S. (Eds.),
Organic Geochemistry. Plenum Press, New York, pp. 73–
97.
Froelich, P.N., Klinghammer, G.P., Bender, M.L., Luedtke,
N.A., Heath, G.R., Cullen, D., Dauphin, P., Hammond, D.,
Maynard, V., 1979. Early oxidation of organic matter in
pelagic sediments of the eastern equatorial Pacific: suboxic
diagenesis. Geochim. Cosmochim. Acta 43, 1075–1088.
Freeman, K.H., Hayes, J.M., Trendal, J.M., Albrecht, P., 1990.
Evidence from carbon isotope measurements for diverse
origins of sedimentary hydrocarbons. Nature 343, 254–256.
Gat, J.R., 1995. Stable isotopes of fresh and saline lakes. In:
Lerman, A., Imboden, D., Gat, J.R. (Eds.), Physics and
Chemistry of Lakes. Springer, Berlin, pp. 139–165.
GNIP (Global Network for Isotopes in Precipitation), 1996.
Internal Report IAEA. PAGES, WMO, IAHS.
Gong, C., Hollander, D.J., 1997. Differential contribution of
bacteria to sedimentary organic matter in oxic and anoxic
environments, Santa Monica Basin, California. Org. Geo-
chem. 26, 545–563.
Gonzales de Juana, C., Ithurralde, A., Picart-Cadillat, X., 1980.
Geologia de Venezuela y de sus cuencas petroleras. FON-
INVES, Caracas.
Hamilton-Taylor, J., Davison, W., 1995. Redox-driven cycling
of trace elements in lake. In: Lerman, A., Imboden, D., Gat,
J.R. (Eds.), Physics and Chemistry of Lakes. Springer,
Berlin, pp. 217–236.
Hamilton-Taylor, J., Davison, W., Morfett, K., 1996. The
biogeochemical cycling of Zn, Cu, Fe, Mn, and dissolved
organic C in a seasonally anoxic lake. Limnol. Oceanog. 41,
408–418.
1314 B. Bellanger et al. / Applied Geochemistry 19 (2004) 1295–1314
Harvey, H.R., Tuttle, J.H., Bell, J.T., 1995. Kinetics of
phytoplankton decay during simulated sedimentation:
changes in biochemical composition and microbial activity
under oxic and anoxic conditions. Geochim. Cosmochim.
Acta 59, 3367–3377.
Harvey, H.R., Macko, S.A., 1997a. Kinetics of phytoplankton
decay during simulated sedimentation: changes in lipids
under oxic and anoxic conditions. Org. Geochem. 27, 129–
140.
Harvey, H.R., Macko, S.A., 1997b. Catalysts or contributors.
Tracking bacterial mediation of early diagenesis in the
marine water column. Org. Geochem. 26, 531–544.
Hollander, D.J., Smith, M.A., 2001. Microbially mediated
carbon cycling as a control on the d13C of sedimentary
carbon in eutrophic Lake Mendota (USA): new models for
interpreting isotopic excursions in the sedimentary record.
Geochim. Cosmochim. Acta 65, 4321–4337.
Hongve, D., 1997. Cycling of iron, manganese, and phosphate
in a meromictic lake. Limnol. Oceanog. 42, 635–647.
Huon, S., Grousset, F.E., Burdloff, D., Bardoux, G., Mariotti,
A., 2002. Sources of fine-sized organic matter in North
Atlantic Heinrich layers: d13C and d15N tracers. Geochim.
Cosmochim. Acta 66, 223–239.
IAEA, 2001. Global Network in Precipitation, the GNIP
database. Available <http://isohis.iaea.org>.
Jorgensen, B.B., 2000. Bacteria and Marine Biogeochemistry.
In: Schulz, H.D., Zabel, M. (Eds.), Marine Geochemistry.
Springer, Berlin, pp. 173–208.
Kristensen, E., Holmer, M., 2001. Decomposition of plant
materials in marine sediment exposed to different electron
acceptors (O2, NO�3 , SO2�
4 ), with emphasis on substrate
origin, degradation kinetics, and the role of bioturbation.
Geochim. Cosmochim. Acta 65, 419–433.
Lal, R., 1990. Soil Erosion in the Tropics: Principles and
Management. McGraw-Hill, New York.
Lal, R., 1995. Global soil erosion by water and carbon
dynamics. In: Lal, R., Kimble, J., Levine, E., Stewart,
B.A. (Eds.), Soils and Global Change. Advances in Soil
Science. Lewis Pub., Boca Raton, pp. 131–142.
Lee, C., 1992. Controls on organic carbon preservation: the use
of stratified bodies to compare intrinsic rates of decompo-
sition in oxic and anoxic systems. Geochim. Cosmochim.
Acta 56, 3323–3335.
Lehmann, M.F., Bernasconi, S.M., Barbieri, A., McKenzie,
J.A., 2002. Preservation of organic matter and alteration of
its carbon and nitrogen isotope composition during simu-
lated and in situ early diagenesis. Geochim. Cosmochim.
Acta 66, 3573–3584.
Lerman, A., Stumm, W., 1989. CO2 storage and alkalinity
trends in lakes. Wat. Res. 23, 139–146.
Lewis, W.M., 1984. Eutrophication and land use, lake Dillon,
Colorado. In: Ecological Studies, vol. 46. Springer, Berlin.
Likens, G.E., 1972. Eutrophication and aquatic ecosystems. In:
Likens, G.E. (Ed.), Nutrients and Eutrophication. Am. Soc.
Limnol. Oceanog. Spec. Symp., vol. 1, pp. 3–13.
McConnaughey, T.A., Labaugh, J.W., Rosenberry, D.O.,
Striegl, R.G., Reddy, M.M., Schuster, P.F., Carter, V.,
1994. Carbon budget for a groundwater-fed lake: Calcifica-
tion supports summer photosynthesis. Limnol. Oceanog. 39,
1319–1332.
McConnaughey, T.A., Whelan, J.F., 1997. Calcification gener-
ates protons for nutrient and bicarbonate uptake. Earth Sci.
Rev. 42, 95–117.
Meybeck, M., 1982. Carbon, nitrogen, phosphorous transport
by world rivers. Am. J. Sci. 282, 401–450.
Meyers, P.A., 1994. Preservation of elemental and isotopic
source identification of sedimentary organic matter. Chem.
Geol. 114, 289–302.
Meyers, P.A., Eadie, B.J., 1993. Sources, degradation and
recycling of organic matter associated with sinking particles
in Lake Michigan. Org. Geochem. 20, 47–56.
Ostrom, N.E., Long, D.T., Bell, E.M., Beals, T., 1998a. The
origin of particulate and sedimentary organic matter and
nitrate in Lake Superior. Chem. Geol. 152, 13–28.
Payne, B.R., 1991. On the statistical treatment of environmen-
tal isotope data in hydrology. In: Isotope Techniques in
Water Resources Development. Proceeding Series, IAEA,
Vienna.
Pouyllau, M., 1989. G�eomorphologie du Venezuela: carte au 1/
4000000 et bibliographie s�elective. Venezuela, environne-
ments et changements. Unpublished report Univ., Toulouse
(France).
Sigg, L., Johnson, A., Kuhn, A., 1991. Redox conditions and
alkalinity generation in a seasonally anoxic lake (Lake
Greifen). Mar. Chem. 36, 9–26.
Sternbeck, J., 1996. Manganese cycling in a eutrophic lake –
Rates and pathways. Aquat. Geochem. 1, 399–426.
Stumm, W., Morgan, J.J., 1996. Oxidation and reduction;
equilibria and microbial mediation. In: Stumm, W., Mor-
gan, J.J. (Eds.), Aquatic Chemistry, third ed. Wiley-Inter-
science, New York, pp. 425–515.
Summons, R.E., Jahnke, L.L., Roksandic, Z., 1994. Carbon
isotope fractionation in lipids from methanotrophic bacte-
ria: relevance for interpretations of the geochemical record
of biomarkers. Geochim. Cosmochim. Acta 58, 2853–2863.
Taillefert, M., Gaillard, J.F., 2002. Reactive transport modeling
of trace elements in the water column of a stratified lake:
iron cycling and metal scavenging. J. Hydrol. 256, 16–34.
Viollier, E., J�ez�equel, D., Michard, G., P�epe, M., Sarazin, G.,
Alb�eric, P., 1995. Geochemical study of a crater lake (Pavin
Lake, France): trace-element behaviour in the monimolim-
nion. Chem. Geol. 125, 61–72.
Wann, J.K., Chen, C.T.A., Wang, B.J., 1997. A seasonally
anoxic mountain lake with an active Fe cycle in tropical
Taiwan. Aquat. Geochem. 3, 21–42.
Whiticar, M.J., Faber, E., Schoell, M., 1986. Biogenic methane
formation in marine and freshwater environments: CO2
reduction vs. acetate fermentation – Isotopic evidence.
Geochim. Cosmochim. Acta 50, 693–709.
Yao, W., Millero, F.J., 1995. The chemistry of the anoxic
waters in the Framvaren fjord, Norway. Aquat. Geochem.
1, 53–88.
Zaw, M., Chiswell, B., 1999. Iron and manganese dynamics in
lake water. Wat. Res. 33, 1900–1910.