Lateral and Vertical Alteration-Mineralization Zoning in ...

Assessment of bone tissue mineralization by conventional x-raymicrocomputed tomography: Comparison with synchrotron radiationmicrocomputed tomography and ash measurements
G. J. Kazakia,a� A. J. Burghardt, S. Cheung, and S. MajumdarMusculoskeletal and Quantitative Imaging Research Group, Department of Radiology, Universityof California, San Francisco, California 94158
�Received 8 November 2007; revised 21 March 2008; accepted for publication 19 April 2008;published 19 June 2008�
Assessment of bone tissue mineral density �TMD� may provide information critical to the under-standing of mineralization processes and bone biomechanics. High-resolution three-dimensionalassessment of TMD has recently been demonstrated using synchrotron radiation microcomputedtomography �SR�CT�; however, this imaging modality is relatively inaccessible due to the scarcityof SR facilities. Conventional desktop �CT systems are widely available and have been usedextensively to assess bone microarchitecture. However, the polychromatic source and cone-shapedbeam geometry complicate assessment of TMD by conventional �CT. The goal of this study wasto evaluate �CT-based measurement of degree and distribution of tissue mineralization in a quan-titative, spatially resolved manner. Specifically, �CT measures of bone mineral content �BMC� andTMD were compared to those obtained by SR�CT and gravimetric methods. Cylinders of trabe-cular bone were machined from human femoral heads �n=5�, vertebrae �n=5�, and proximal tibiae�n=4�. Cylinders were imaged in saline on a polychromatic �CT system at an isotropic voxel sizeof 8 �m. Volumes were reconstructed using beam hardening correction algorithms based onhydroxyapatite �HA�-resin wedge phantoms of 200 and 1200 mg HA /cm3. SR�CT imaging wasperformed at an isotropic voxel size of 7.50 �m at the National Synchrotron Light Source. Attenu-ation values were converted to HA concentration using a linear regression derived by imaging acalibration phantom. Architecture and mineralization parameters were calculated from the imagedata. Specimens were processed using gravimetric methods to determine ash mass and density.�CT-based BMC values were not affected by altering the beam hardening correction. Volume-averaged TMD values calculated by the two corrections were significantly different �p=0.008� inhigh volume fraction specimens only, with the 1200 mg HA /cm3 correction resulting in a 4.7%higher TMD value. �CT and SR�CT provided significantly different measurements of both BMCand TMD �p�0.05�. In high volume fraction specimens, �CT with 1200 mg HA /cm3 correctionresulted in BMC and TMD values 16.7% and 15.0% lower, respectively, than SR�CT values. Inlow volume fraction specimens, �CT with 1200 mg HA /cm3 correction resulted in BMC andTMD values 12.8% and 12.9% lower, respectively, than SR�CT values. �CT and SR�CT valueswere well-correlated when volume fraction groups were considered individually �BMC R2=0.97−1.00; TMD R2=0.78−0.99�. Ash mass and density were higher than the SR�CT equivalents by8.6% in high volume fraction specimens and 10.9% in low volume fraction specimens �p�0.05�.BMC values calculated by tomography were highly correlated with ash mass �ash versus �CTR2=0.96−1.00; ash versus SR�CT R2=0.99−1.00�. TMD values calculated by tomography weremoderately correlated with ash density �ash versus �CT R2=0.64−0.72; ash versus SR�CT R2
=0.64�. Spatially resolved comparisons highlighted substantial geometric nonuniformity in the �CTdata, which were reduced �but not eliminated� using the 1200 mg HA /cm3 beam hardening cor-rection, and did not exist in the SR�CT data. This study represents the first quantitative comparisonof �CT mineralization evaluation against SR�CT and gravimetry. Our results indicate that �CTmineralization measures are underestimated but well-correlated with SR�CT and gravimetric data,particularly when volume fraction groups are considered individually. © 2008 American Associa-tion of Physicists in Medicine. �DOI: 10.1118/1.2924210�
Key words: computed tomography, synchrotron radiation, bone tissue, mineralization, beam hard-ening
I. INTRODUCTION
Bone strength is influenced by many complex factors. Bonemineral density �BMD� assessed by dual x-ray absorptiom-
3170 Med. Phys. 35 „7…, July 2008 0094-2405/2008/35„7…/3
etry is considered a surrogate measure for determining frac-ture risk, but does not entirely predict fracture or adequatelyassess therapeutic interventions. Recently, the importance of
trabecular microarchitecture in determining bone strength3170170/10/$23.00 © 2008 Am. Assoc. Phys. Med.

3171 Kazakia et al.: Assessment of bone tissue mineralization by microcomputed tomography 3171
has been brought to the attention of the clinicalcommunity.1,2 Improved predictions of biomechanical prop-erties have been found as a result of including measures oftrabecular bone structure.3–5 By including compositionalmeasures—e.g., degree and distribution of mineralization—even more powerful predictions of fracture risk may bepossible.
Degree of mineralization of bone or tissue mineral density�TMD� is known to influence tissue-level mechanicalproperties.6 Increased mineralization is associated withgreater amounts of tissue damage,7 and hypermineralizedsites present localized sites for crack initiation.8 The distri-bution of mineralization within bone tissue may also have aneffect on tissue properties.9,10 Thus, high-resolution three-dimensional �3D� quantification of tissue mineralization mayprovide information critical to the understanding of bonebiomechanics and to the assessment of bone strength. Addi-tionally, tissue engineering efforts as well as studies of min-eralization mechanics would profit from the ability to imagemineralization in a nondestructive, spatially resolved man-ner.
Common techniques for mineral evaluation includeashing,11 microradiography,12 backscattered electronmicroscopy,13 nanoindentation,14 and Fourier-transform in-frared spectroscopy.15 However, each of these techniques isdestructive and none provide 3D information.
Three-dimensional spatially resolved assessment of TMDhas recently been demonstrated using synchrotron radiationmicrocomputed tomography �SR�CT�.16,17 The monoener-getic, high flux, parallel beam used in SR�CT provides highspatial resolution, high signal-to-noise ratio, and accurate at-tenuation measurement, thus rendering SR�CT an appropri-ate gold standard for 3D TMD evaluation. However, SR�CTstudies are inaccessible to many researchers due to the scar-city of SR facilities.
Conventional desktop �CT systems are widely availableand have been used extensively to assess bone microarchi-tecture. Conventional �CT has been shown to provide accu-rate measures of architecture in trabecular bone as comparedto SR�CT.18 However, the polychromatic source and cone-shaped beam geometry complicate the assessment of TMD.Beam hardening effects resulting from the preferential at-tenuation of low energies from the polychromatic source leadto geometric nonuniformities in signal and a nonlinear rela-tionship between attenuation and material density. Beamhardening correction algorithms have been introduced toovercome this limitation and have provided measurable im-provements in attenuation linearity.19 While qualitative com-parisons of conventional and synchrotron radiation mineral-ization images have been made,20,21 quantitative spatiallyresolved comparisons have not been performed.
The goal of this study was to evaluate �CT-based mea-surement of degree and distribution of bone mineralization ina quantitative, spatially resolved manner. Conventional �CTmineralization measurements were compared to those per-formed by SR�CT, the gold standard for 3D spatially re-
solved mineralization analysis, and by gravimetric methodsMedical Physics, Vol. 35, No. 7, July 2008
�ashing�, the standard for volume-averaged bone tissue mea-surements. Specifically, our objectives were to: �1� Compare�CT measurements of bone mineral content �BMC� andvolume-averaged TMD to those derived by SR�CT and bygravimetric measurements and �2� compare �CT assessmentof mineral distribution to that measured by SR�CT. To makespatially resolved comparisons, mineralization was evaluatedas a function of distance from a trabecular surface. Architec-tural parameters determined by the two imaging techniqueswere also compared for completeness.
II. MATERIALS AND METHODS
II.A. Specimen preparation
UCSF Committee for Human Research approval wasgranted for this work. Femoral head specimens were surgi-cally excised during hip arthroplasty procedures at UCSF.Vertebrae and tibiae were harvested from human cadavers�National Disease Research Interchange, Philadelphia, PA�.Each specimen was taken from a unique donor. Cylinders oftrabecular bone �8 mm diameter, 4 mm length� were ma-chined from the femoral head �FEM, n=5�, vertebral body�VERT, n=5�, and proximal tibia �TIB, n=4�. The specimenswere completely cleaned of marrow using a water jet withsonicator agitation and detergent washes as necessary �1%,Tergazyme, Alconox, Inc.�. No further chemical defattingwas necessary to remove marrow. Specimens were stored at−20 °C when not being processed.
II.B. Conventional polychromatic �CT imaging
In preparation for imaging, each specimen was placed inan acrylic holder, submerged in saline, and vacuum degassedto remove any air bubbles trapped in the pore spaces. Thecylinders were imaged while still submerged in saline on aconventional polychromatic �CT system ��CT 40 ScancoMedical AG., Bruttisellen, Switzerland�. This device consistsof an x-ray source producing a narrow-angle cone beam, a0.5 mm thick aluminum filter plate to eliminate the lowestenergies from the beam, a cesium iodide scintillator, and a 12bit charge coupled device �CCD� detector �2048�64 pixels�. A previous generation of this scanner has beendescribed in detail.22 Imaging was performed at a voxel sizeof 8 �m �isotropic� with a source potential of 70 kV andtube current of 114 �A. Each scan consisted of 2000 pro-jections over 360 deg, with the sample rotated in equiangularsteps about its longitudinal axis. For each projection, sam-pling occurred over an integration time of 250 ms and twoimages were averaged to reduce the effects of noise. Darkcurrent and raw beam measurements were made once at thebeginning of each scan. Scanning time was 11−12 h perspecimen. Three-dimensional data sets were reconstructedusing a cone beam approximation.23 Attenuation values wereconverted to hydroxyapatite �HA� concentration using a lin-ear regression derived by imaging a calibration phantomcontaining rods of HA-resin mixtures �0, 100, 200, 400, and
3
800 mg HA /cm �.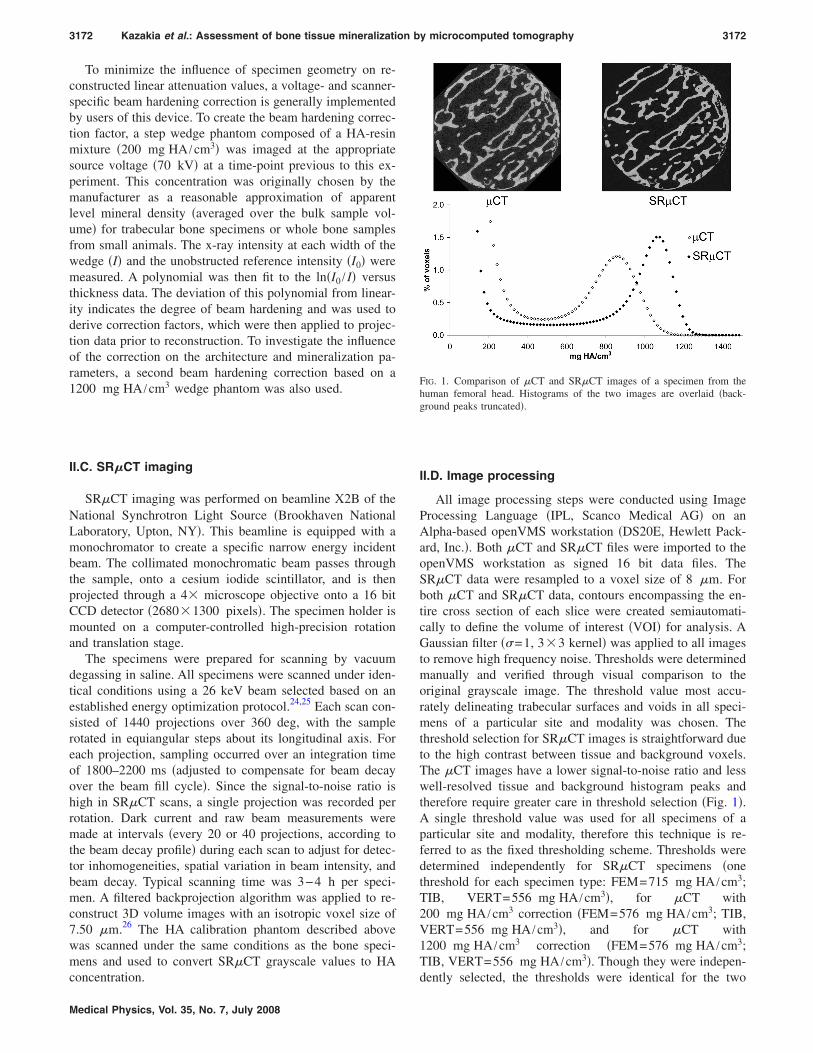
3172 Kazakia et al.: Assessment of bone tissue mineralization by microcomputed tomography 3172
To minimize the influence of specimen geometry on re-constructed linear attenuation values, a voltage- and scanner-specific beam hardening correction is generally implementedby users of this device. To create the beam hardening correc-tion factor, a step wedge phantom composed of a HA-resinmixture �200 mg HA /cm3� was imaged at the appropriatesource voltage �70 kV� at a time-point previous to this ex-periment. This concentration was originally chosen by themanufacturer as a reasonable approximation of apparentlevel mineral density �averaged over the bulk sample vol-ume� for trabecular bone specimens or whole bone samplesfrom small animals. The x-ray intensity at each width of thewedge �I� and the unobstructed reference intensity �I0� weremeasured. A polynomial was then fit to the ln�I0 / I� versusthickness data. The deviation of this polynomial from linear-ity indicates the degree of beam hardening and was used toderive correction factors, which were then applied to projec-tion data prior to reconstruction. To investigate the influenceof the correction on the architecture and mineralization pa-rameters, a second beam hardening correction based on a1200 mg HA /cm3 wedge phantom was also used.
II.C. SR�CT imaging
SR�CT imaging was performed on beamline X2B of theNational Synchrotron Light Source �Brookhaven NationalLaboratory, Upton, NY�. This beamline is equipped with amonochromator to create a specific narrow energy incidentbeam. The collimated monochromatic beam passes throughthe sample, onto a cesium iodide scintillator, and is thenprojected through a 4� microscope objective onto a 16 bitCCD detector �2680�1300 pixels�. The specimen holder ismounted on a computer-controlled high-precision rotationand translation stage.
The specimens were prepared for scanning by vacuumdegassing in saline. All specimens were scanned under iden-tical conditions using a 26 keV beam selected based on anestablished energy optimization protocol.24,25 Each scan con-sisted of 1440 projections over 360 deg, with the samplerotated in equiangular steps about its longitudinal axis. Foreach projection, sampling occurred over an integration timeof 1800–2200 ms �adjusted to compensate for beam decayover the beam fill cycle�. Since the signal-to-noise ratio ishigh in SR�CT scans, a single projection was recorded perrotation. Dark current and raw beam measurements weremade at intervals �every 20 or 40 projections, according tothe beam decay profile� during each scan to adjust for detec-tor inhomogeneities, spatial variation in beam intensity, andbeam decay. Typical scanning time was 3−4 h per speci-men. A filtered backprojection algorithm was applied to re-construct 3D volume images with an isotropic voxel size of7.50 �m.26 The HA calibration phantom described abovewas scanned under the same conditions as the bone speci-mens and used to convert SR�CT grayscale values to HA
concentration.Medical Physics, Vol. 35, No. 7, July 2008
II.D. Image processing
All image processing steps were conducted using ImageProcessing Language �IPL, Scanco Medical AG� on anAlpha-based openVMS workstation �DS20E, Hewlett Pack-ard, Inc.�. Both �CT and SR�CT files were imported to theopenVMS workstation as signed 16 bit data files. TheSR�CT data were resampled to a voxel size of 8 �m. Forboth �CT and SR�CT data, contours encompassing the en-tire cross section of each slice were created semiautomati-cally to define the volume of interest �VOI� for analysis. AGaussian filter ��=1, 3�3 kernel� was applied to all imagesto remove high frequency noise. Thresholds were determinedmanually and verified through visual comparison to theoriginal grayscale image. The threshold value most accu-rately delineating trabecular surfaces and voids in all speci-mens of a particular site and modality was chosen. Thethreshold selection for SR�CT images is straightforward dueto the high contrast between tissue and background voxels.The �CT images have a lower signal-to-noise ratio and lesswell-resolved tissue and background histogram peaks andtherefore require greater care in threshold selection �Fig. 1�.A single threshold value was used for all specimens of aparticular site and modality, therefore this technique is re-ferred to as the fixed thresholding scheme. Thresholds weredetermined independently for SR�CT specimens �onethreshold for each specimen type: FEM=715 mg HA /cm3;TIB, VERT=556 mg HA /cm3�, for �CT with200 mg HA /cm3 correction �FEM=576 mg HA /cm3; TIB,VERT=556 mg HA /cm3�, and for �CT with1200 mg HA /cm3 correction �FEM=576 mg HA /cm3;TIB, VERT=556 mg HA /cm3�. Though they were indepen-
FIG. 1. Comparison of �CT and SR�CT images of a specimen from thehuman femoral head. Histograms of the two images are overlaid �back-ground peaks truncated�.
dently selected, the thresholds were identical for the two

3173 Kazakia et al.: Assessment of bone tissue mineralization by microcomputed tomography 3173
�CT data sets. Similarly, thresholds for proximal tibia andvertebral specimens were identical within each group.
To investigate the influence of thresholding technique onthe accuracy of �CT parameters, two additional thresholdingschemes were applied to the �CT data with200 mg HA /cm3 correction. An adaptive thresholdingscheme was applied, which automatically determined thegrayscale value equivalent to the minimum change in bonevolume fraction, or bone volume/total volume ratio �BV/TV�. Additionally, a volume fraction matching approach wasused, taking advantage of the ease of segmentation affordedby the high contrast SR�CT images. The volume fractionmatching approach automatically determined an individualthreshold for each �CT image by matching the resulting vol-ume fraction to that of the associated SR�CT image.
II.E. Parameter evaluation
Structural parameters were calculated from the binarizedreconstructions using code written in IPL. BV/TV was mea-sured by direct voxel counting.27 Trabecular thickness�Tb.Th�, trabecular separation �Tb.Sp�, and trabecular num-ber �Tb.N� were calculated using a skeletonization routineand the model-independent 3D distance transformmethod.28–30
Mineralization parameters were calculated from the grey-level data using IPL and MATLAB �The Mathworks, Inc.,Natick, MA� code. Based on the results of the thresholdingtechnique investigation, the manually determined fixedthresholds were used for all of the following calculations.BMC and volume-averaged TMD for each specimen werecalculated based on relationships derived from the rule ofmixtures, which specifies that the mean density of a volumeof interest is equal to the sum of the density of each compo-nent within the volume scaled by its volume fraction. For thecase of trabecular bone with a uniform background this can
FIG. 2. Data representing mineralization and depth for each voxel within afrom the nearest surface �voxels�. Distance data are calculated in three dim
be written as
Medical Physics, Vol. 35, No. 7, July 2008
TMD = �BMDVOI − BMDback * �1 − BV/TV��/�BV/TV� . �1�
In this equation BMDVOI and BMDback are derived directlyfrom the image data; BMDVOI is the mean mineralizationvalue of all voxels in the VOI and BMDback is the meanmineralization of the background voxels. Prior to determin-ing BMDback five voxels were eroded from the interface be-tween bone and background to remove background voxelsinfluenced by partial volume artifacts. By using this methodto calculate TMD—rather than calculating the mean intensityof all bone voxels within a segmented image—we avoid thedirect dependence of TMD on the number of voxels peeledfrom the bone surface.
BMC can be calculated by multiplying TMD by the totalvolume of bone in the imaged sample
BMC = TMD*BV. �2�
To visualize the data in a spatially resolved manner, a dis-tance value was assigned to each bone voxel in each data set�Fig. 2�. This distance value represents the number of voxelsseparating the voxel in question from the nearest surfacevoxel. The average voxel mineralization was then calculatedfor each distance value within a given image. This allows thevisualization of mineral distribution through the depth of thetrabeculae. The same was done for the voxels in the interiorof the cylinder �75% of the overall diameter� and for those inthe outer periphery of the cylinder. To quantify the effects ofbeam hardening, geometric nonuniformity �cupping artifact�was assessed by comparing voxel intensities in the interior ofthe cylinder to those in the periphery. If a cupping artifactexists, we expect the mean mineralization value for the inte-rior of the cylinder to be lower than that of the periphery fora given distance value. To calculate geometric nonunifor-mity, the difference between inner and peripheral voxel val-ues was calculated at each distance value. Since surface vox-
n of a SR�CT image. Left: Mineralization �mg HA /cm3�. Right: Distancens.
portioensio
els �lowest distance values� may be affected by partial

3174 Kazakia et al.: Assessment of bone tissue mineralization by microcomputed tomography 3174
volume effects and voxels furthest from the surface �highestdistance values� are not numerous enough to comprise a rep-resentative sample, they were excluded from this analysis.
II.F. Gravimetric analysis
Following �CT and SR�CT imaging, each specimen wasprocessed using established gravimetric protocols.11 Speci-mens were dehydrated in a furnace at 100 °C for 12 h, thenashed at 600 °C for 48 h. Ash mass was determined byweighing each specimen in its crucible once cooled back toroom temperature, then subtracting the crucible weight deter-mined prior to ashing. Measurements after an additional 24 hat 600 °C confirmed the complete removal of organic con-stituents. Ash density was calculated by dividing ash mass bytissue volume as measured by SR�CT imaging. This ap-proach was deemed more accurate than relying on a water-displacement method for tissue volume measurement due tothe ease of segmentation of SR�CT data. It also avoidedpotential physical damage to the specimens, which wouldhave affected the ash mass measurement.
II.G. Statistics
Statistical computations were performed using JMP �SASInstitute, Inc., Cary NC�. Residual analysis was performed toidentify outliers. Results calculated from the �CT imagesusing the two beam hardening corrections were comparedusing Wilcoxon sign-rank tests. The Friedman test was usedto compare parameters obtained from �CT images using thetwo beam hardening corrections to those obtained viaSR�CT imaging. Additional Friedman testing was used tocompare �CT and SR�CT results to gravimetric measures.Comparisons between specimen groups �high versus lowvolume fraction groups� were performed using Wilcoxonsign-rank tests.
III. RESULTS
Specimens were divided into two volume fraction groupsfor comparisons among �CT, SR�CT, and gravimetric re-sults: High volume fraction �HVF� including femur speci-mens �BV /TV=33�4� and low volume fraction �LVF� in-cluding tibia specimens �BV /TV=9�3� and vertebralspecimens �BV /TV=9�3�. One vertebral sample was iden-
TABLE I. Regression statistics comparing architecture parameters calculatevolume fraction-matched� were implemented on �CT data with 200 mg1200 mg /cm3 BH correction �fixed threshold� is shown for comparison. Al
�CT 200 BH vs SR�CT
Fixed Adaptive
Slope Int R2 Slope Int R
BV/TV 1.04 0.00 1.00 1.07 0.00 1.Tb.Th 0.98 0.01 1.00 1.08 −0.01 1.Tb.Sp 1.00 0.00 1.00 1.01 −0.01 1.Tb.N 1.07 −0.07 0.99 1.07 −0.07 1.
tified as an outlier based on residual analysis of the mineral-
Medical Physics, Vol. 35, No. 7, July 2008
ization data. On investigating the image data, we found thatthis sample contained small slivers of trabeculae created dur-ing the machining process. These slivers may have contrib-uted to errors in mineralization data due to partial volume orsegmentation artifacts. This sample was excluded fromanalysis.
III.A. Architecture
Regressions between �CT and SR�CT architecture pa-rameters resulted in strong correlations for all thresholdschemes and beam hardening corrections applied to the �CTimages �Table I�. Based on the comparison of regression sta-tistics and in keeping with the literature18,31 the fixed thresh-old scheme was chosen to be the basis of further analysis.
Differences in architecture values between the two �CTbeam hardening corrections were small �Table II�. In theHVF group, only Tb.Th was influenced by the beam harden-ing correction �1.5% diff; p=0.008�. In the LVF group, allarchitecture parameters were influenced by changing thebeam hardening correction �0.9% min diff, 5.1% max diff;p=0.008�.
Small but significant differences between �CT andSR�CT data were found for all architecture parameters withthe exception of Tb.Sp �Table II�. Tb.Th values calculated by�CT were overestimated only with the 200 mg HA /cm3
beam hardening correction �HVF 1.7%, LVF 2.5%�. Tb.Nvalues calculated by �CT were overestimated only in theHVF group �4.4% with both beam hardening corrections�.BV/TV values calculated by �CT differed from SR�CT val-ues only in the LVF group �1.1% overestimation with the200 mg HA /cm3 correction, 4.1% underestimation with the1200 mg HA /cm3 correction�.
III.B. Mineralization
�CT-based BMC values were not affected by changingthe beam hardening correction �Table II�. TMD values in theHVF group were significantly different as calculated by thetwo beam hardening corrections �p�0.0001�, with the1200 mg HA /cm3 beam hardening correction resulting in a4.7% higher TMD value. In the LVF group there was nosignificant difference in TMD values calculated using the
�CT and SR�CT imaging. Three thresholding strategies �fixed, adaptive,beam hardening �BH� correction. Regression data for �CT data with
elations significant at p�0.0001.
�CT 1200 BH vs SR�CT
VF-matched Fixed
Slope Int R2 Slope Int R2
1.00 0.00 1.00 1.00 0.00 1.000.98 0.01 1.00 0.99 0.00 1.001.01 0.00 1.00 1.02 −0.01 1.001.08 −0.08 0.99 1.08 −0.08 0.99
d by/cm3
l corr
2
00000000
two beam hardening corrections.

her b
3175 Kazakia et al.: Assessment of bone tissue mineralization by microcomputed tomography 3175
Significant differences between �CT and SR�CT miner-alization values were found in both volume fraction groups�Table II�. In the HVF group, the 1200 mg HA /cm3 correc-tion resulted in BMC and TMD values 16.7% and 15.0%lower, respectively, than SR�CT values. In the LVF group,the 1200 mg HA /cm3 correction resulted in BMC and TMDvalues 12.8% and 12.9% lower, respectively, than SR�CTvalues.
The relatively larger underestimation of mineralizationmeasures in HVF bone led to a further discrepancy between�CT and SR�CT data; in the �CT data set TMD of the HVFgroup was significantly lower than that of the LVF group�p=0.004�, while in the SR�CT analysis the groups had sta-tistically indistinguishable TMD values.
Gravimetric ash mass and density were significantlyhigher than SR�CT �and consequently �CT� mineralizationvalues in both volume fraction groups �Table II�. In the HVFgroup, both ash mass and ash density were higher than theSR�CT equivalents by 8.6%. In the LVF group, ash massand ash density were higher than the SR�CT equivalents by10.9%.
Individual specimen values as well as regressions wereplotted to explore relationships among �CT, SR�CT, andgravimetry mineralization results �Fig. 3�. BMC values cal-culated by tomography were highly correlated with ash mass�ash versus �CT R2=0.96−1.00; ash versus SR�CT R2
=0.99−1.00�. High correlations were found between �CTand SR�CT BMC values �R2=0.97−1.00�. Though no sig-nificant differences were found between �CT BMC valuescalculated using the two beam hardening corrections, the1200 mg HA /cm3 correction consistently yielded resultscloser to the SR�CT values.
TMD values calculated by tomography were moderately2
TABLE II. Mean�SD of architectural and mineralization parameters measureSpecimens were divided into two groups for analysis: High volume fraction
�CT
200BH 1200BH 200BH vs 1200
High volume fraction: FEM �n=5�BV/TV �%� 33�5 32�4 NSTb.Th ��m� 191�36 189�36 0.008Tb.Sp ��m� 520�61 523�62 NSTb.N �1 /mm� 1.9�0.3 1.9�0.3 NSBMC �mg� 68�8 71�9 NSTMD �mg HA /cm3� 942�24 987�24 0.008
Low volume fraction: TIB �n=4� and VERT �n=4�BV/TV �%� 9�3 9�3 0.008Tb.Th ��m� 126�16 123�16 0.008Tb.Sp ��m� 958�174 969�177 0.008Tb.N �1 /mm� 1.0�0.2 1.0�0.2 0.008BMC �mg� 19�7 19�7 NSTMD �mg HA /cm3� 1027�27 1023�23 NS
ap values based on Wilcoxon signed-rank tests. NS indicates no significantb�CT measurements statistically different from SR�CT, and tomography mtests�. NS indicates no significant differences were found between �CT �eit
correlated with ash density �ash versus �CT R =0.64−0.72;
Medical Physics, Vol. 35, No. 7, July 2008
ash versus SR�CT R2=0.64�. Of the two �CT beam hard-ening algorithms the 200 mg HA /cm3 correction had agreater slope when regressed against ash density, resultingfrom beam hardening in the HVF samples. With the1200 mg HA /cm3 correction the measured tissue density ofthe HVF samples increased resulting in a slope almost equalto that of the SR�CT regression �Fig. 3�. �CT and SR�CTTMD values were well correlated with each other when vol-ume fraction groups were considered individually �HVF R2
=0.90−0.99; LVF R2=0.78�. With the 200 mg HA /cm3 cor-rection, �CT-derived TMD of the HVF group was lowerthan that of the LVF group, with similar slope. The1200 mg HA /cm3 correction moved the HVF group towardthe LVF regression, softening the dependence on volumefraction.
To ensure that thresholding technique did not influenceour results, BMC and TMD were recalculated for the �CTdata using the adaptive and volume fraction matching thresh-olding schemes �results not shown�. These alternativeschemes resulted in slight shifts of absolute TMD and BMCvalues, however, the tomography versus ash and �CT versusSR�CT regressions were similar to the results of the fixedthreshold scheme shown in Fig. 3.
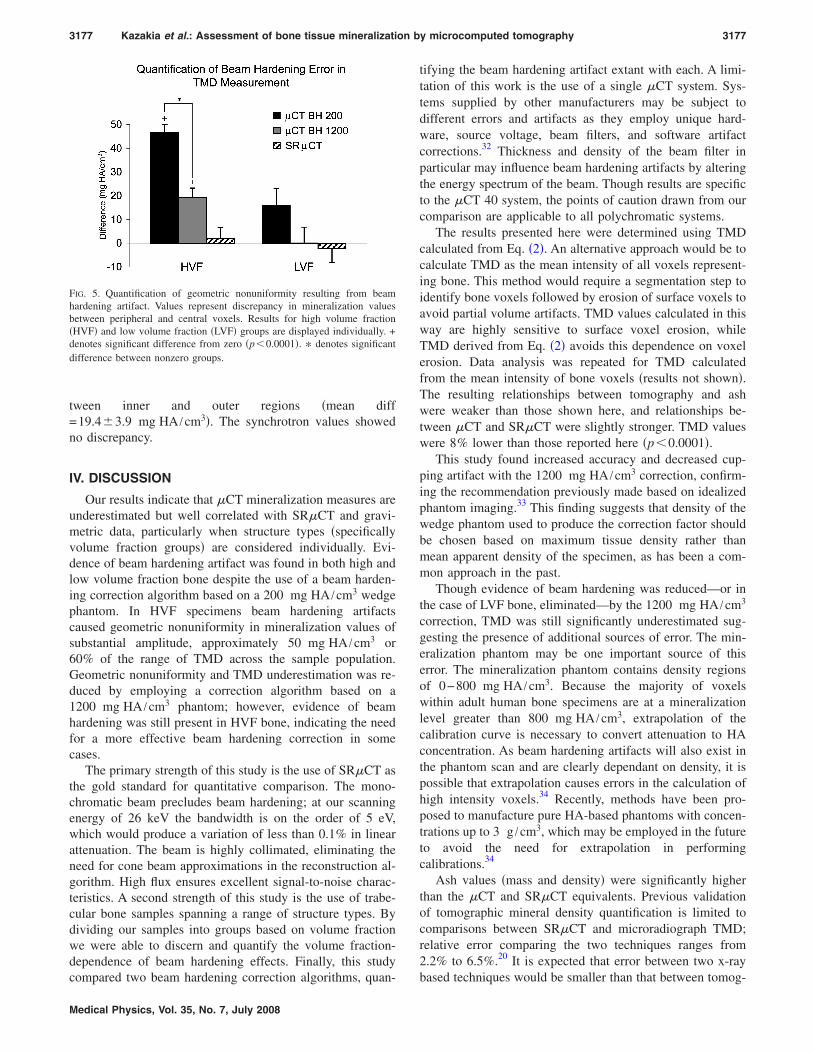
Spatially resolved comparisons highlighted substantialgeometric nonuniformity in the �CT data that did not existin the SR�CT data �Figs. 4 and 5�. Geometric nonuniformitywas quantified as the discrepancy between mineralizationvalues of the voxels in the inner and peripheral regions of thespecimen cylinder. For every specimen, the �CT datawith 200 mg HA /cm3 correction produced the greatest dis-crepancy in mineralization values. The discrepancy wasmost extreme in the HVF samples �mean diff between innerand peripheral mineralization=46.7�3.3 mg HA /cm3�. The
3
�CT with 200 and 1200 mg /cm3 BH corrections, SR�CT, and gravimetry.low volume fraction.
SR�CT Gravimetry�CT vs SR�CT b CT vs gravimetryb
33�4 NS - -188�38 200BH - -520�64 NS - -1.8�0.3 200BH, 1200BH - -84�10 200BH, 1200BH 91�11 200BH, 1200BH, SR
1147�24 200BH, 1200BH 1251�51 200BH, 1200BH, SR
9�3 200BH, 1200BH - -123�16 200BH - -952�172 NS - -1.0�0.2 NS - -22�8 200BH, 1200BH 25�8 200BH, 1200BH, SR
1161�30 200BH, 1200BH 1295�36 200BH, 1200BH, SR
ence.ements statistically different from gravimetry are listed �p�0.05 Friedmaneam hardening correction� and SR�CT.
d byand
BHa
differeasur
1200 mg HA /cm correction lessened the discrepancy be-

3176 Kazakia et al.: Assessment of bone tissue mineralization by microcomputed tomography 3176
FIG. 3. Left column: BMC and TMD values as measured by gravimetry �+�, SR�CT ���, �CT with 200 mg HA /cm3 BH correction �closed symbols, solidlines�, and �CT with 1200 mg HA /cm3 BH correction �open symbols, dotted lines�. Middle column: Regressions of BMC vs ash mass and TMD vs ash
density. Right column: Regressions of �CT BMC vs SR�CT BMC and �CT TMD vs SR�CT TMD. All regressions significant at p�0.0001.FIG. 4. Visualization of mineral density as a function of distance from trabecular surface. Mean mineralization was calculated at each distance value for allvoxels �circles�, for those in the interior of the specimen only �dashes�, and for those in the outer periphery only �pluses�. The discrepancy between the innerand peripheral regions was used to quantify geometric nonuniformity �cupping artifact�. The greatest discrepancy occurred in high volume fraction boneimaged on the �CT with the 200 mg HA /cm3 correction �top left�. The 1200 mg HA /cm3 correction reduced this discrepancy �top middle�, and the SR�CT
data revealed no discrepancy �top right�. The effect was less evident in low volume fraction bone �bottom row�.Medical Physics, Vol. 35, No. 7, July 2008
3177 Kazakia et al.: Assessment of bone tissue mineralization by microcomputed tomography 3177
tween inner and outer regions �mean diff=19.4�3.9 mg HA /cm3�. The synchrotron values showedno discrepancy.
IV. DISCUSSION
Our results indicate that �CT mineralization measures areunderestimated but well correlated with SR�CT and gravi-metric data, particularly when structure types �specificallyvolume fraction groups� are considered individually. Evi-dence of beam hardening artifact was found in both high andlow volume fraction bone despite the use of a beam harden-ing correction algorithm based on a 200 mg HA /cm3 wedgephantom. In HVF specimens beam hardening artifactscaused geometric nonuniformity in mineralization values ofsubstantial amplitude, approximately 50 mg HA /cm3 or60% of the range of TMD across the sample population.Geometric nonuniformity and TMD underestimation was re-duced by employing a correction algorithm based on a1200 mg HA /cm3 phantom; however, evidence of beamhardening was still present in HVF bone, indicating the needfor a more effective beam hardening correction in somecases.
The primary strength of this study is the use of SR�CT asthe gold standard for quantitative comparison. The mono-chromatic beam precludes beam hardening; at our scanningenergy of 26 keV the bandwidth is on the order of 5 eV,which would produce a variation of less than 0.1% in linearattenuation. The beam is highly collimated, eliminating theneed for cone beam approximations in the reconstruction al-gorithm. High flux ensures excellent signal-to-noise charac-teristics. A second strength of this study is the use of trabe-cular bone samples spanning a range of structure types. Bydividing our samples into groups based on volume fractionwe were able to discern and quantify the volume fraction-dependence of beam hardening effects. Finally, this study
FIG. 5. Quantification of geometric nonuniformity resulting from beamhardening artifact. Values represent discrepancy in mineralization valuesbetween peripheral and central voxels. Results for high volume fraction�HVF� and low volume fraction �LVF� groups are displayed individually. +denotes significant difference from zero �p�0.0001�. * denotes significantdifference between nonzero groups.
compared two beam hardening correction algorithms, quan-
Medical Physics, Vol. 35, No. 7, July 2008
tifying the beam hardening artifact extant with each. A limi-tation of this work is the use of a single �CT system. Sys-tems supplied by other manufacturers may be subject todifferent errors and artifacts as they employ unique hard-ware, source voltage, beam filters, and software artifactcorrections.32 Thickness and density of the beam filter inparticular may influence beam hardening artifacts by alteringthe energy spectrum of the beam. Though results are specificto the �CT 40 system, the points of caution drawn from ourcomparison are applicable to all polychromatic systems.
The results presented here were determined using TMDcalculated from Eq. �2�. An alternative approach would be tocalculate TMD as the mean intensity of all voxels represent-ing bone. This method would require a segmentation step toidentify bone voxels followed by erosion of surface voxels toavoid partial volume artifacts. TMD values calculated in thisway are highly sensitive to surface voxel erosion, whileTMD derived from Eq. �2� avoids this dependence on voxelerosion. Data analysis was repeated for TMD calculatedfrom the mean intensity of bone voxels �results not shown�.The resulting relationships between tomography and ashwere weaker than those shown here, and relationships be-tween �CT and SR�CT were slightly stronger. TMD valueswere 8% lower than those reported here �p�0.0001�.
This study found increased accuracy and decreased cup-ping artifact with the 1200 mg HA /cm3 correction, confirm-ing the recommendation previously made based on idealizedphantom imaging.33 This finding suggests that density of thewedge phantom used to produce the correction factor shouldbe chosen based on maximum tissue density rather thanmean apparent density of the specimen, as has been a com-mon approach in the past.
Though evidence of beam hardening was reduced—or inthe case of LVF bone, eliminated—by the 1200 mg HA /cm3
correction, TMD was still significantly underestimated sug-gesting the presence of additional sources of error. The min-eralization phantom may be one important source of thiserror. The mineralization phantom contains density regionsof 0−800 mg HA /cm3. Because the majority of voxelswithin adult human bone specimens are at a mineralizationlevel greater than 800 mg HA /cm3, extrapolation of thecalibration curve is necessary to convert attenuation to HAconcentration. As beam hardening artifacts will also exist inthe phantom scan and are clearly dependant on density, it ispossible that extrapolation causes errors in the calculation ofhigh intensity voxels.34 Recently, methods have been pro-posed to manufacture pure HA-based phantoms with concen-trations up to 3 g /cm3, which may be employed in the futureto avoid the need for extrapolation in performingcalibrations.34
Ash values �mass and density� were significantly higherthan the �CT and SR�CT equivalents. Previous validationof tomographic mineral density quantification is limited tocomparisons between SR�CT and microradiograph TMD;relative error comparing the two techniques ranges from2.2% to 6.5%.20 It is expected that error between two x-ray
based techniques would be smaller than that between tomog-
3178 Kazakia et al.: Assessment of bone tissue mineralization by microcomputed tomography 3178
raphic and gravimetric techniques. Some portion of the dis-crepancy between tomography and gravimetry seen in thisstudy may be related to our method of calculating ash den-sity, which uses tissue volume calculated by SR�CT as op-posed to that directly measured from the sample usingArchimedes principle. It is possible that the tissue volumecalculated by SR�CT is underestimated—organic materialor osteoid surfaces may be excluded by the segmentationprocess. It is also possible that ash mass includescomponents—those of the nonstoichometric HA found inbone, for example—which are not adequately accounted forby the HA phantom calibration.35 Though steps were taken toprevent sample rehydration prior to measurement of ashmass, such rehydration may be another source of discrepancybetween ash and tomographic values. TMD values calculatedby �CT �with the 1200 mg HA /cm3 correction� andSR�CT and are related to ash density with similar slopesthat are far less than one �Fig. 3�. It is possible that theeffects described above are volume fraction-dependant in amanner that would cause this relationship. Compton or otherscatter phenomena may also influence attenuation measure-ments in a volume fraction-dependant manner, contributingto this relationship.
This study represents the first quantitative comparison of�CT mineralization evaluation against SR�CT and gravim-etry. Our findings are significant in the context of mineral-ization assessment of human biopsies, animal models, andtissue engineered bone using polychromatic �CT systems.These studies often include specimens of varying architec-ture and volume fraction, and therefore may be subject toerrors due to artifacts that may mask effects of experimentaltreatments. The interaction between volume fraction andbeam hardening artifact must be considered when investigat-ing specimens from different subjects or anatomical sites, orwhen comparing different regions within one scan. Addi-tional work is necessary to investigate more appropriate min-eralization calibrations, to devise more robust beam harden-ing correction algorithms, and to isolate possible volumefraction-dependant errors.
ACKNOWLEDGMENTS
The authors would like to acknowledge the generous con-tributions of Steve Jorgensen, John Dunsmuir, Tony Keav-eny, Andres Laib, and Sven Prevrhal to this work. This re-search was supported by NIH F32 AR053446.
a�Present address: 1700 4th Street, Suite 203, San Francisco, CA 94158.Telephone: 415-514-9663; Fax: 415-514-9656. Electronic mail:[email protected]
1M. Kleerekoper, A. R. Villanueva, J. Stanciu, D. S. Rao, and A. M.Parfitt, “The role of three-dimensional trabecular microstructure in thepathogenesis of vertebral compression fractures,” Calcif. Tissue Int. 37,594–597 �1985�.
2M. J. Ciarelli, S. A. Goldstein, J. L. Kuhn, D. D. Cody, and M. B. Brown,“Evaluation of orthogonal mechanical properties and density of humantrabecular bone from the major metaphyseal regions with materials test-ing and computed tomography,” J. Orthop. Res. 9, 674–682 �1991�.
3B. L. Riggs and L. J. Melton III, “Bone turnover matters: The raloxifenetreatment paradox of dramatic decreases in vertebral fractures without
commensurate increases in bone density,” J. Bone Miner. Res. 17, 11–14Medical Physics, Vol. 35, No. 7, July 2008
�2002�.4C. L. Gordon, T. F. Lang, P. Augat, and H. K. Genant, “Image-basedassessment of spinal trabecular bone structure from high-resolution CTimages,” Osteoporos. Int. 8, 317–325 �1998�.
5C. H. Chesnut III and C. J. Rosen, “Reconsidering the effects of antire-sorptive therapies in reducing osteoporotic fracture,” J. Bone Miner. Res.16, 2163–2172 �2001�.
6J. Y. Rho, P. Zioupos, J. D. Currey, and G. M. Pharr, “Variations in theindividual thick lamellar properties within osteons by nanoindentation,”Bone 25, 295–300 �1999�.
7A. C. Courtney, W. C. Hayes, and L. J. Gibson, “Age-related differencesin post-yield damage in human cortical bone. Experiment and model,” J.Biomech. 29, 1463–1471 �1996�.
8T. M. Boyce and R. D. Bloebaum, “Cortical aging differences and frac-ture implications for the human femoral neck,” Bone 14, 769–778 �1993�.
9M. J. Jaasma, H. H. Bayraktar, G. L. Niebur, and T. M. Keaveny, “Bio-mechanical effects of intraspecimen variations in tissue modulus for tra-becular bone,” J. Biomech. 35, 237–246 �2002�.
10P. J. Meunier and G. Boivin, “Bone mineral density reflects bone mass butalso the degree of mineralization of bone: Therapeutic implications,”Bone 21, 373–377 �1997�.
11J. Galante, W. Rostoker, and R. D. Ray, “Physical properties of trabecularbone,” Calcif. Tissue Res. 5, 236–246 �1970�.
12G. Boivin and P. J. Meunier, “The degree of mineralization of bone tissuemeasured by computerized quantitative contact microradiography,” Cal-cif. Tissue Int. 70, 503–511 �2002�.
13R. D. Bloebaum, J. G. Skedros, E. G. Vajda, K. N. Bachus, and B. R.Constantz, “Determining mineral content variations in bone using back-scattered electron imaging,” Bone 20, 485–490 �1997�.
14P. K. Zysset, X. E. Guo, C. E. Hoffler, K. E. Moore, and S. A. Goldstein,“Elastic modulus and hardness of cortical and trabecular bone lamellaemeasured by nanoindentation in the human femur,” J. Biomech. 32,1005–1012 �1999�.
15L. F. Bonewald, S. E. Harris, J. Rosser, M. R. Dallas, S. L. Dallas, N. P.Camacho, B. Boyan, and A. Boskey, “von Kossa staining alone is notsufficient to confirm that mineralization in vitro represents bone forma-tion,” Calcif. Tissue Int. 72, 537–547 �2003�.
16B. Borah, E. L. Ritman, T. E. Dufresne, S. M. Jorgensen, S. Liu, J. Sacha,R. J. Phipps, and R. T. Turner, “The effect of risedronate on bone miner-alization as measured by micro-computed tomography with synchrotronradiation: Correlation to histomorphometric indices of turnover,” Bone37, 1–9 �2005�.
17F. Peyrin, M. Salome, S. Nuzzo, P. Cloetens, A. M. Laval-Jeantet, and J.Baruchel, “Perspectives in three-dimensional analysis of bone samplesusing synchrotron radiation microtomography,” Cell. Mol. Biol. �Paris�46, 1089–1102 �2000�.
18C. Chappard, A. Basillais, L. Benhamou, A. Bonassie, B. Brunet-Imbault,N. Bonnet, and F. Peyrin, “Comparison of synchrotron radiation and con-ventional x-ray microcomputed tomography for assessing trabecular bonemicroarchitecture of human femoral heads,” Med. Phys. 33, 3568–3577�2006�.
19L. Mulder, J. H. Koolstra, and T. M. Van Eijden, “Accuracy of microCTin the quantitative determination of the degree and distribution of miner-alization in developing bone,” Acta Radiol. 45, 769–777 �2004�.
20S. Nuzzo, F. Peyrin, P. Cloetens, J. Baruchel, and G. Boivin, “Quantifi-cation of the degree of mineralization of bone in three dimensions usingsynchrotron radiation microtomography,” Med. Phys. 29, 2672–2681�2002�.
21M. Ito, S. Ejiri, H. Jinnai, J. Kono, S. Ikeda, A. Nishida, K. Uesugi, N.Yagi, M. Tanaka, and K. Hayashi, “Bone structure and mineralizationdemonstrated using synchrotron radiation computed tomography�SR-�CT� in animal models: Preliminary findings,” J. Bone Miner.Metab. 21, 287–293 �2003�.
22P. Ruegsegger, B. Koller, and R. Müller, “A microtomographic system forthe nondestructive evaluation of bone architecture,” Calcif. Tissue Int. 58,24–29 �1996�.
23L. A. Feldkamp, S. A. Goldstein, A. M. Parfitt, G. Jesion, and M.Kleerekoper, “The direct examination of three-dimensional bone architec-ture in vitro by computed tomography,” J. Bone Miner. Res. 4, 3–11�1989�.
24L. Grodzins, “Optimum energies for x-ray transmission tomography ofsmall samples: Applications of synchrotron radiation to computerized to-
mography I,” Nucl. Instrum. Methods Phys. Res. 206, 541–545 �1983�.
3179 Kazakia et al.: Assessment of bone tissue mineralization by microcomputed tomography 3179
25S. M. Jorgensen, O. Demirkaya, and E. L. Ritman, “Three-dimensionalimaging of vasculature and parenchyma in intact rodent organs with x-raymicro-CT,” Am. J. Physiol. 275, H1103–H1114 �1998�.
26E. L. Ritman, S. M. Jorgensen, P. E. Lund, P. J. Thomas, J. H. Dunsmuir,J. C. Romero, R. T. Turner, and M. E. Bolander, “Synchrotron-basedmicro-CT of in situ biological basic functional units and their integra-tion,” SPIE Dev. X-Ray Tomography 3149, 13–24 �1997�.
27M. Ding, A. Odgaard, and I. Hvid, “Accuracy of cancellous bone volumefraction measured by micro-CT scanning,” J. Biomech. 32, 323–326�1999�.
28T. Hildebrand and P. Rüegsegger, “A new method for the model-independent assessment of thickness in three-dimensional images,” J. Mi-crosc. 185, 67–75 �1997�.
29A. Laib, T. Hildebrand, H. J. Hauselmann, and P. Ruegsegger, “Ridgenumber density: A new parameter for in vivo bone structure analysis,”Bone 21, 541–546 �1997�.
30R. Muller, T. Hildebrand, and P. Ruegsegger, “Non-invasive bone biopsy:A new method to analyse and display the three-dimensional structure of
trabecular bone,” Phys. Med. Biol. 39, 145–164 �1994�.Medical Physics, Vol. 35, No. 7, July 2008
31R. Müller, H. Van Campenhout, B. Van Damme, G. Van Der Perre, J.Dequeker, T. Hildebrand, and P. Ruegsegger, “Morphometric analysis ofhuman bone biopsies: A quantitative structural comparison of histologicalsections and micro-computed tomography,” Bone 23, 59–66 �1998�.
32A. J. Olejniczak, P. Tafforeau, T. M. Smith, H. Temming, and J. J. Hublin,“Technical note: Compatibility of microtomographic imaging systems fordental measurements,” Am. J. Phys. Anthropol. 134, 130–134 �2007�.
33R. Fajardo, E. Cory, N. Patel, A. Nazarian, B. Snyder, and M. L. Boux-sein, Specimen Size and Porosity Can Introduce Error Into mCT-BasedTissue Mineral Density Measurements �Orthopaedic Research Society,San Diego, CA, 2007�.
34S. Schweizer, B. Hattendorf, P. Schneider, B. Aeschlimann, L. Gauckler,R. Muller, and D. Gunther, “Preparation and characterization of calibra-tion standards for bone density determination by micro-computed tomog-raphy,” Analyst �Cambridge, U.K.� 132, 1040–1045 �2007�.
35A. A. Postnov, A. V. Vinogradov, D. Van Dyck, S. V. Saveliev, and N. M.De Clerck, “Quantitative analysis of bone mineral content by x-ray mi-
crotomography,” Physiol. Meas. 24, 165–178 �2003�.Copyright © 2022 FDOKUMEN