Assessing the Efficacy of Nano- and Micro-Sized Magnetic Particles as Contrast Agents for MRI Cell...
12
Assessing the Efficacy of Nano- and Micro-Sized Magnetic Particles as Contrast Agents for MRI Cell Tracking Arthur Taylor 1 *, Anne Herrmann 2 , Diana Moss 1 , Violaine Se ´e 2 , Karen Davies 3 , Steve R. Williams 3 , Patricia Murray 1 1 Institute of Translational Medicine, University of Liverpool, Liverpool, United Kingdom, 2 Institute of Integrative Biology, University of Liverpool, Liverpool, United Kingdom, 3 Centre for Imaging Sciences, University of Manchester, Manchester, United Kingdom Abstract Iron-oxide based contrast agents play an important role in magnetic resonance imaging (MRI) of labelled cells in vivo. Currently, a wide range of such contrast agents is available with sizes varying from several nanometers up to a few micrometers and consisting of single or multiple magnetic cores. Here, we evaluate the effectiveness of these different particles for labelling and imaging stem cells, using a mouse mesenchymal stem cell line to investigate intracellular uptake, retention and processing of nano- and microsized contrast agents. The effect of intracellular confinement on transverse relaxivity was measured by MRI at 7 T and in compliance with the principles of the ‘3Rs’, the suitability of the contrast agents for MR-based cell tracking in vivo was tested using a chick embryo model. We show that for all particles tested, relaxivity was markedly reduced following cellular internalisation, indicating that contrast agent relaxivity in colloidal suspension does not accurately predict performance in MR-based cell tracking studies. Using a bimodal imaging approach comprising fluorescence and MRI, we demonstrate that labelled MSC remain viable following in vivo transplantation and can be tracked effectively using MRI. Importantly, our data suggest that larger particles might confer advantages for longer-term imaging. Citation: Taylor A, Herrmann A, Moss D, Se ´e V, Davies K, et al. (2014) Assessing the Efficacy of Nano- and Micro-Sized Magnetic Particles as Contrast Agents for MRI Cell Tracking. PLOS ONE 9(6): e100259. doi:10.1371/journal.pone.0100259 Editor: Masaya Yamamoto, Institute for Frontier Medical Sciences, Kyoto University, Japan Received January 28, 2014; Accepted May 24, 2014; Published June 24, 2014 Copyright: ß 2014 Taylor et al. This is an open-access article distributed under the terms of the Creative Commons Attribution License, which permits unrestricted use, distribution, and reproduction in any medium, provided the original author and source are credited. Funding: This work was supported in part by the United Kingdom EPSRC (http://www.epsrc.ac.uk/, Grant EP/H046143) and by the European Union (http://ec. europa.eu/research/mariecurieactions/, grant PERG08-GA-2010-276909). AH is funded by Alder Hey Children’s NHS Foundation Trust (http://www.alderhey.nhs. uk/). The funders had no role in study design, data collection and analysis, decision to publish, or preparation of the manuscript. Competing Interests: The authors have declared that no competing interests exist. * Email: [email protected] Introduction Monitoring the migration and fate of cells in vivo plays an important role in the development of cellular therapies. In such therapies, where cells are administered to an animal or patient in order to treat a disease, there is a need to image the therapeutic cells non-invasively in order to assess their delivery, migration over time and viability. Currently, a wide range of techniques based on optical, photoacoustic, nuclear and magnetic resonance imaging (MRI) are available for the pre-clinical tracking of cells[1,2]. In all of these methods, the therapeutic cells need to be labelled prior to imaging in order to allow them to be distinguished from the host cells. This is normally achieved with the introduction of contrast agents (such as quantum dots, gold nanoparticles and radioactive tracers)[1,2] or reporter genes (such as fluorescent proteins, luciferase and HSV1-tk)[2,3] into the cells. In the clinic, the method of choice for cellular imaging in vivo has been MRI as it is safe and does not suffer from limitations associated with other techniques, such as low penetration depth (e.g. fluorescence and bioluminescence imaging) or poor spatial resolution (e.g. nuclear imaging). Additionally, until recently, the commercial availability of MR contrast agents clinically approved by regulatory agencies provided a means to label cells for administration in hu- mans[4,5,6,7]. Although such contrast agents were not marketed for this purpose, as they were designed to be liver-specific contrast agents[8], they were successfully used off label for cell tracking. For this application, the cells of interest are labelled in vitro prior to their administration with uptake being achieved either via spontaneous endocytosis when the contrast agent is added to the culture medium or with use of transfection aids[1]. Such MRI contrast agents are based on superparamagnetic iron oxide nanoparticles (SPION). When cells labelled with SPION are introduced into an animal, the magnetic nanoparticles within the cells locally disturb the magnetic field homogeneity[8] during MR imaging, thus allowing them to be distinguished from the tissue background in T 2 and T 2 *-weighed images. Since the first reports that introduced the concept of MR cell imaging using SPION in the early 1990s[9], numerous research groups have used this method in pre-clinical and clinical studies. The ready availability of commercial SPION, as well as the well-established procedures for synthesising such nanoparticles[10] has facilitated the widespread application of this technique for cell tracking. However, most studies on cell tracking tend to focus on the use of a particular type of SPION, or on methods to enhance cell labelling, and only a few actually compare the performance of different types of SPION in vitro and in vivo. In this work, three commercially available iron oxide-based contrast agents with distinct physical properties (size, number of magnetic cores, PLOS ONE | www.plosone.org 1 June 2014 | Volume 9 | Issue 6 | e100259
Transcript of Assessing the Efficacy of Nano- and Micro-Sized Magnetic Particles as Contrast Agents for MRI Cell...

Assessing the Efficacy of Nano- and Micro-SizedMagnetic Particles as Contrast Agents for MRI CellTrackingArthur Taylor1*, Anne Herrmann2, Diana Moss1, Violaine See2, Karen Davies3, Steve R. Williams3,
Patricia Murray1
1 Institute of Translational Medicine, University of Liverpool, Liverpool, United Kingdom, 2 Institute of Integrative Biology, University of Liverpool, Liverpool, United
Kingdom, 3 Centre for Imaging Sciences, University of Manchester, Manchester, United Kingdom
Abstract
Iron-oxide based contrast agents play an important role in magnetic resonance imaging (MRI) of labelled cells in vivo.Currently, a wide range of such contrast agents is available with sizes varying from several nanometers up to a fewmicrometers and consisting of single or multiple magnetic cores. Here, we evaluate the effectiveness of these differentparticles for labelling and imaging stem cells, using a mouse mesenchymal stem cell line to investigate intracellular uptake,retention and processing of nano- and microsized contrast agents. The effect of intracellular confinement on transverserelaxivity was measured by MRI at 7 T and in compliance with the principles of the ‘3Rs’, the suitability of the contrast agentsfor MR-based cell tracking in vivo was tested using a chick embryo model. We show that for all particles tested, relaxivity wasmarkedly reduced following cellular internalisation, indicating that contrast agent relaxivity in colloidal suspension does notaccurately predict performance in MR-based cell tracking studies. Using a bimodal imaging approach comprisingfluorescence and MRI, we demonstrate that labelled MSC remain viable following in vivo transplantation and can be trackedeffectively using MRI. Importantly, our data suggest that larger particles might confer advantages for longer-term imaging.
Citation: Taylor A, Herrmann A, Moss D, See V, Davies K, et al. (2014) Assessing the Efficacy of Nano- and Micro-Sized Magnetic Particles as Contrast Agents forMRI Cell Tracking. PLOS ONE 9(6): e100259. doi:10.1371/journal.pone.0100259
Editor: Masaya Yamamoto, Institute for Frontier Medical Sciences, Kyoto University, Japan
Received January 28, 2014; Accepted May 24, 2014; Published June 24, 2014
Copyright: � 2014 Taylor et al. This is an open-access article distributed under the terms of the Creative Commons Attribution License, which permitsunrestricted use, distribution, and reproduction in any medium, provided the original author and source are credited.
Funding: This work was supported in part by the United Kingdom EPSRC (http://www.epsrc.ac.uk/, Grant EP/H046143) and by the European Union (http://ec.europa.eu/research/mariecurieactions/, grant PERG08-GA-2010-276909). AH is funded by Alder Hey Children’s NHS Foundation Trust (http://www.alderhey.nhs.uk/). The funders had no role in study design, data collection and analysis, decision to publish, or preparation of the manuscript.
Competing Interests: The authors have declared that no competing interests exist.
* Email: [email protected]
Introduction
Monitoring the migration and fate of cells in vivo plays an
important role in the development of cellular therapies. In such
therapies, where cells are administered to an animal or patient in
order to treat a disease, there is a need to image the therapeutic
cells non-invasively in order to assess their delivery, migration over
time and viability. Currently, a wide range of techniques based on
optical, photoacoustic, nuclear and magnetic resonance imaging
(MRI) are available for the pre-clinical tracking of cells[1,2]. In all
of these methods, the therapeutic cells need to be labelled prior to
imaging in order to allow them to be distinguished from the host
cells. This is normally achieved with the introduction of contrast
agents (such as quantum dots, gold nanoparticles and radioactive
tracers)[1,2] or reporter genes (such as fluorescent proteins,
luciferase and HSV1-tk)[2,3] into the cells. In the clinic, the
method of choice for cellular imaging in vivo has been MRI as it is
safe and does not suffer from limitations associated with other
techniques, such as low penetration depth (e.g. fluorescence and
bioluminescence imaging) or poor spatial resolution (e.g. nuclear
imaging). Additionally, until recently, the commercial availability
of MR contrast agents clinically approved by regulatory agencies
provided a means to label cells for administration in hu-
mans[4,5,6,7]. Although such contrast agents were not marketed
for this purpose, as they were designed to be liver-specific contrast
agents[8], they were successfully used off label for cell tracking. For
this application, the cells of interest are labelled in vitro prior to
their administration with uptake being achieved either via
spontaneous endocytosis when the contrast agent is added to the
culture medium or with use of transfection aids[1].
Such MRI contrast agents are based on superparamagnetic iron
oxide nanoparticles (SPION). When cells labelled with SPION are
introduced into an animal, the magnetic nanoparticles within the
cells locally disturb the magnetic field homogeneity[8] during MR
imaging, thus allowing them to be distinguished from the tissue
background in T2 and T2*-weighed images. Since the first reports
that introduced the concept of MR cell imaging using SPION in
the early 1990s[9], numerous research groups have used this
method in pre-clinical and clinical studies.
The ready availability of commercial SPION, as well as the
well-established procedures for synthesising such nanoparticles[10]
has facilitated the widespread application of this technique for cell
tracking. However, most studies on cell tracking tend to focus on
the use of a particular type of SPION, or on methods to enhance
cell labelling, and only a few actually compare the performance of
different types of SPION in vitro and in vivo. In this work, three
commercially available iron oxide-based contrast agents with
distinct physical properties (size, number of magnetic cores,
PLOS ONE | www.plosone.org 1 June 2014 | Volume 9 | Issue 6 | e100259

surface chemistry and, consequently, T2 relaxation rates) are
evaluated as a means to label and image mesenchymal stem cells
(MSC) using MRI. Our goals were to establish their uptake levels
in MSC, the intracellular fate immediately after labelling and
during cell proliferation, as well as their imaging properties in vitro
and in vivo. Moreover, an important aim of our work was to
establish an test system in vivo that complied with the principles of
the ‘3Rs’ (i.e. Replacement, Refinement, Reduction in research
using animals), for according to 3Rs philosophy, it would be
deemed inappropriate to use protected animals such as laboratory
rodents for evaluating the effectiveness of tracking agents if
alternative models were available. For this reason, we have used
the chick embryo as a test bed for evaluating the different contrast
agents, for during the initial stages of development, the chick
embryo is not considered to be sentient, and furthermore, unlike
the situation with mammalian embryos, the mother does not need
to be sacrificed in order to gain access to the embryo. Although all
products evaluated in this work were found to be suitable for cell
labelling and imaging in vivo, marked differences were seen in
labelling efficiency, the extent of dilution upon cell division, the
extent of dissolution in a lysosomal microenvironment model and
also, on T2 relaxation as measured in solution or within cells.
These effects are discussed in regard to the application of iron
oxide-based particles as contrast agents for cell tracking using T2-
weighed images.
Methods
Contrast Agents and Cell LabellingMolday ION Evergreen (Biopal Inc, Worcester, MA, USA),
Feratrack (Miltenyi Biotec, Surrey, England) and Dragon Green
Encapsulated Magnetic Polymers (Bangs Beads, Stratech Scientif-
ic, Suffolk, England) were used for cell labelling. Zeta potential was
measured in 10 mM NaCl using a Zetasizer Nano Z (Malvern,
England) and averaged over 50 runs. A schematic representation
of the contrast agents, including a description of their properties is
shown in Figure 1.
The multipotent MSC line D1 ORL UVA (ATCC CRL-12424)
was used as a model and grown in Dulbecco’s Modified Eagle’s
Medium (DMEM) containing 10% fetal calf serum (FCS) at 37uCunder a humidified atmosphere with 5% CO2. For labelling with
the magnetic particles, 56104 cells were seeded in 24-well plates
and allowed to attach and grow for 24 h. After this period the cells
reached approximately 50% confluency. The culture medium was
then replaced with 350 ml of fresh medium containing the contrast
agents and the cells were allowed to grow for a further 24 h. In all
cases the contrast agents were added directly to the complete
culture medium with the exception for Feratrack, where labelling
was also performed in accordance with manufacturer’s instruc-
tions, which involves the use of a lipid-based loading reagent in
conjunction with serum free medium; with this reagent, cells were
labelled for 5 h followed by a recovery period of 19 h. After the
labelling period, the cells were carefully washed with phosphate-
buffered saline (PBS) to remove excess contrast agent and used for
downstream studies.
Quantification of Intracellular Iron & Labelling EfficiencyIntracellular iron quantification was carried out using a slightly
modified version of a previously reported colourimetric meth-
od[11]. Briefly, 56104 cells were suspended in 100 ml acetone and
digested for at least 2 h after which an equal volume of 1.2 M
hydrochloric acid was added to the sample that was then heated at
75uC for 2 h. After this treatment, the samples were allowed to
cool down and 60 ml of ferrozine reagent (6.5 mM Ferrozine,
13.1 mM neocuproine, 2 M L-ascorbic acid and 5 M ammonium
acetate, all from Sigma, Dorset, England) was added to the
sample. The absorbance was measured at 570 nm and compared
to a standard curve prepared with an iron standard (TraceCERT,
Sigma). Flow cytometry was used to assess the labelling efficiency
(percentage of labelled cells) and also as a qualitative means to
evaluate intracellular concentration of contrast agents. Cells were
Figure 1. Properties of contrast agents. Schematic representation, transmission electron microscopy images and description of the contrastagents used in this study. Zeta potential (f) was assessed in 10 mM NaCl at a concentration of 100 mg[Fe]/ml.doi:10.1371/journal.pone.0100259.g001
Efficacy of Nano- and Micro-Sized Contrast Agents for Cell Tracking
PLOS ONE | www.plosone.org 2 June 2014 | Volume 9 | Issue 6 | e100259
fixed with 4% formaldehyde and the green fluorescence intensity
of at least 16104 cells was measured with a FACScalibur flow
cytometer (BD Biosciences, Oxford, England). As Feratrack is not
conjugated to a fluorophore, an anti-dextran FITC-conjugated
antibody (Stem Cell Technologies, Grenoble, France) was used to
detect the intracellular presence of this contrast agent. For that
purpose, cells were permeabilised with 0.1% saponin (Sigma),
blocked with 10% bovine serum albumin and allowed to react
with the antibody for 2 h in the dark using concentrations
suggested by the manufacturer.
Cellular ImagingFluorescence microscopy was used to identify the cellular
localisation of the contrast agents. Cells were grown and labelled
in culture slides (BD Biosciences) and the same immunostaining
procedures as described for flow cytometry were applied. For
imaging the lysosomes, a rabbit antibody against the Lysosomal-
Associated Membrane Protein 2 (LAMP2, Abcam, Cambridge,
England) was used in conjunction with secondary goat anti-rabbit
antibody conjugated to Alexa-Fluor-488 (Life Technologies,
Paisley, Scotland). Particles and lysosomes were imaged using
confocal microscopy (Leica TCS SP II) using a pinhole size of 1
airy unit. Nuclei were stained using 49,6-diamidino-2-phenylindole
(DAPI, Life Technologies) and imaged using wide-field fluores-
cence.
For transmission electron microscopy (TEM) cells were grown
and labelled in 3.5 cm dishes, followed by fixation with 4%
formaldehyde/2.5% glutaraldehyde, post fixation with 1% osmi-
um tetroxide, dehydration and embedding in epoxy resin. Thin
sections (70 nm) were then collected over copper grids containing
a formvar support film. For analysis of the contrast agents, those
were simply dispersed of over the grids containing the support film
and allowed to dry. Samples were analysed with a FEI Technai G2
Spirit BioTwin microscope operated at 100 kV.
Intracellular Retention and Stability of Contrast AgentsTo quantify the intracellular retention of contrast agents and the
effect on cellular proliferation, labelled cells were trypsinised after
labelling and counted using an automated cell counter (TC20,
Biorad). A fraction of the cells (56104) was plated in 24-well plates
in triplicate and allowed to grow for up to 3 days. At 24 h
intervals, the cells from one of the wells were trypsinised, counted
using the trypan blue exclusion assay and then used for
intracellular iron quantification.
To evaluate the long-term stability of the particles, a lysosomal
model of cellular digestion as originally proposed by Skotland et
al.[12] was used. The pH of PBS containing 22 mM sodium
citrate tribasic (Sigma) was left at 7.2 or adjusted to 5.5 or 4.5
using hydrochloric acid. A sample containing 1 mg of particles (Fe
basis) was added to these buffers and allowed to digest for a period
of up to 28 days at 37uC. The amount of dissolved iron was
quantified using the ferrozine assay as described above using a
slightly modified ferrozine reagent consisting of 6.5 mM Ferro-
zine, 100 mM L-ascorbic acid and 1.1 M ammonium acetate.
DifferentiationThe multipotent MSC D1 cell line was differentiated into
adipocytes and osteocytes. For that purpose, the medium was
exchanged immediately after labelling and replaced with fresh
medium containing adipogenic or osteogenic supplementation.
Adipogenic supplementation consisted of 100 nM Dexametha-
sone, 10 mM b-glycerophosphate disodium salt hydrate and
77 mM 2-Phospho-L-ascorbic acid trisodium salt (all from Sigma),
whereas the osteogenic supplementation consisted of 100 nM
Dexamethasone, 155 mM 2-phospho-L-ascorbic acid trisodium
salt, 50 mM indomethacin and 175 nM bovine pancreas insulin
(all from Sigma). The cells were then allowed to grow for a further
9 d with periodic medium changes. Effective differentiation was
evaluated by fixation and histochemical staining with 0.5% Oil
Red O (Sigma) in isopropanol or 2% Alizarin Red S (Sigma).
Optical and Magnetic Resonance ImagingAll magnetic resonance data were acquired with a Bruker 7 T
Avance III instrument using a 38 mm transmit/receive quadra-
ture volume coil. To obtain the longitudinal relaxivity of the
contrast agents, T1/T2 maps were generated using a modified
Rapid Acquisition with Refocused Echoes (RARE) sequence with
variable repetition times (TR) of 5000, 3000, 1500, 800, 400 and
200 ms, and echo times (TE) of 11, 22, 55, 77 and 99 ms.
Paravision 5.0 (Bruker Biopsin) was used to determine the mono-
exponential decay in signal intensity as a function of echo time and
the respective relaxation time constant T2, which was then used to
compute the relaxation rate R2 (taken as the reciprocal of the
relaxation time). The relaxation rate of agarose without any
contrast agent was used to normalise the data and obtain DR2.
The same procedure was used to determine the relaxivity in cells,
whereby the iron content per cell was calculated and used to
determine the number of cells necessary to achieve the concen-
trations used for measurements. In all cases, particles and cells
were suspended in 1% low-melting temperature agarose (Sigma) to
prevent samples being subjected to temperatures above 40uC and
then loaded into 200 ml polypropylene tubes which were held in
place for axial imaging using a sample holder.
For imaging in vivo by fluorescence, cells were first transduced
with viral particles encoding the dTomato gene. Viral particles
were produced in HEK 293TN cells using three plasmids
encoding the viral envelope (pMD2.G), packaging proteins
(psPAX2) and the transfer vector (pHIV.dTomato), all obtained
as gifts from Didier Trono and Bryan Welm (Addgene plasmids
#12259, #12260 and #21374). The number of viral particles
obtained was titred using HEK 293TN cells and the MSC were
then transduced with a multiplicity of infection of 5 viral particles
per cell yielding .90% of cells positive for dTomato 72 h post-
transduction. No noticeable changes in the amount of contrast
agent taken up were observed in relation to non-transduced cells.
Those cells were then labelled with the magnetic particles as
described. Fertilised white leghorn chicken eggs were incubated in
a humidified incubator at 37uC. At embryonic day 3, eggs were
windowed and 56104 labelled cells were implanted in the
midbrain of the chick embryo in ovo. The chicks were allowed to
grow up to embryonic day 5, at which point they were harvested
from their eggs and imaged using a fluorescence stereoscope (Leica
M165FC) before being fixed in 4% formaldehyde and embedded
in 1% low-melting temperature agarose for MRI. Axial T2-
weighed slices were acquired with a high resolution TurboRARE
T2-weighed sequence with the following parameters: field of view
30630 mm, matrix 2566256, slice thickness 0.5 mm, effective TE
33 ms, RARE factor 8, TR 2741.9 ms, averages 10, flip angle
135o, scan time 14 min 37 s).
Results
Uptake of contrast agentsThe contrast agents evaluated consisted of SPION in the form
of particles with a single core and a cationic carboxydextran shell
(Molday ION), multicore particles and a dextran shell (Feratrack)
or multicore microspheres embedded in a carboxyl-modified
polystyrene matrix (Bangs Beads). The manufacturers’ data
Efficacy of Nano- and Micro-Sized Contrast Agents for Cell Tracking
PLOS ONE | www.plosone.org 3 June 2014 | Volume 9 | Issue 6 | e100259

indicates a hydrodynamic diameter of 35 nm for the single core
particles, 60–140 nm for the multicore particles and an average
size of 860 nm for the microspheres, the latter comprising a broad
size distribution, in agreement with the TEM images obtained
(Figure 1). Molday ION was found to be cationic with a surface
charge of +21 mV (manufacturers’ data suggests +31 mV),
Feratrack neutral at 22 mV and Bangs Beads anionic at 2
26 mV.
Uptake of the contrast agents was measured over a concentra-
tion range of 1.5–100 mg[Fe]/ml. Spontaneous uptake was
obtained by simply adding the contrast agents to the media and
was found to be concentration dependent for Molday ION and
Bangs Beads, whereas virtually no uptake was seen for Feratrack
(Figure 2A). The intracellular iron content after labelling cells with
Molday ION was found to reach a plateau at about 25 mg[Fe]/ml,
suggesting saturation of the cells. Uptake of Bangs Beads was
linear up to a concentration of 25 mg[Fe]/ml. Given the size and
density of these particles, they displayed a strong tendency to
undergo sedimentation during the 24 h labelling period. This
hindered an accurate evaluation of intracellular iron content at
concentrations above this level, as extracellular aggregates were
difficult to wash away, even with extensive PBS washes.
Quantitative values are therefore not shown for these conditions.
When labelling according to the manufacturer’s instructions,
which involves the use of a lipid-based loading reagent and an
effective concentration of 50 mg[Fe]/ml, a significant intracellular
uptake of Feratrack (Figure 2A) was observed, suggesting a stealth
shell that requires the use of a transfection agent for effective
labelling. To confirm the quantitative trends observed with the
ferrozine assay, flow cytometry was carried out with the same cells.
Molday ION and Bangs Beads are conjugated with a green
fluorophore allowing the estimation of uptake by evaluation of the
mean green fluorescence of individual cells. For Feratrack, an anti-
dextran antibody conjugated to FITC was used in order to label
the SPION. The trend in the mean fluorescence intensity as a
function of contrast agent concentration was exactly the same as
observed quantitatively by intracellular iron measurement
(Figure 2B) suggesting saturation at ,25 mg[Fe]/ml for Molday
ION, the need of transfection aids for Feratrack and linear uptake
for Bangs Beads. As flow cytometry allows the exclusion of
extracellular aggregates by gating the data using forward and side
scatter data plots, fluorescence intensity data are provided for
concentrations above 25 mg[Fe]/ml suggesting that even higher
amounts of Bangs Beads can be taken up by this cell line, although
it was not possible to evaluate that quantitatively. For the purpose
of comparing the efficacy and effects of the different contrast
agents at similar intracellular concentrations, further studies were
conducted with cells labelled with a defined set of standard
labelling conditions summarised in Table 1. No significant
statistical differences in intracellular concentrations between these
conditions were found (p.0.05, 2-tailed, unpaired, student’s t-
test).
Intracellular localisation and stabilityAll contrast agents displayed a perinuclear distribution
(Figure 3). Molday ION and Feratrack showed a strong co-
localisation with the lysosomal marker, LAMP-2, whereas for
Bangs Beads, LAMP-2 staining was found mainly around the
beads, without co-localisation. Transmission electron microscopy
images corroborated these findings, with the contrast agents being
found clustered in well-defined vesicles around the nucleus
(Figure 3, right panels).
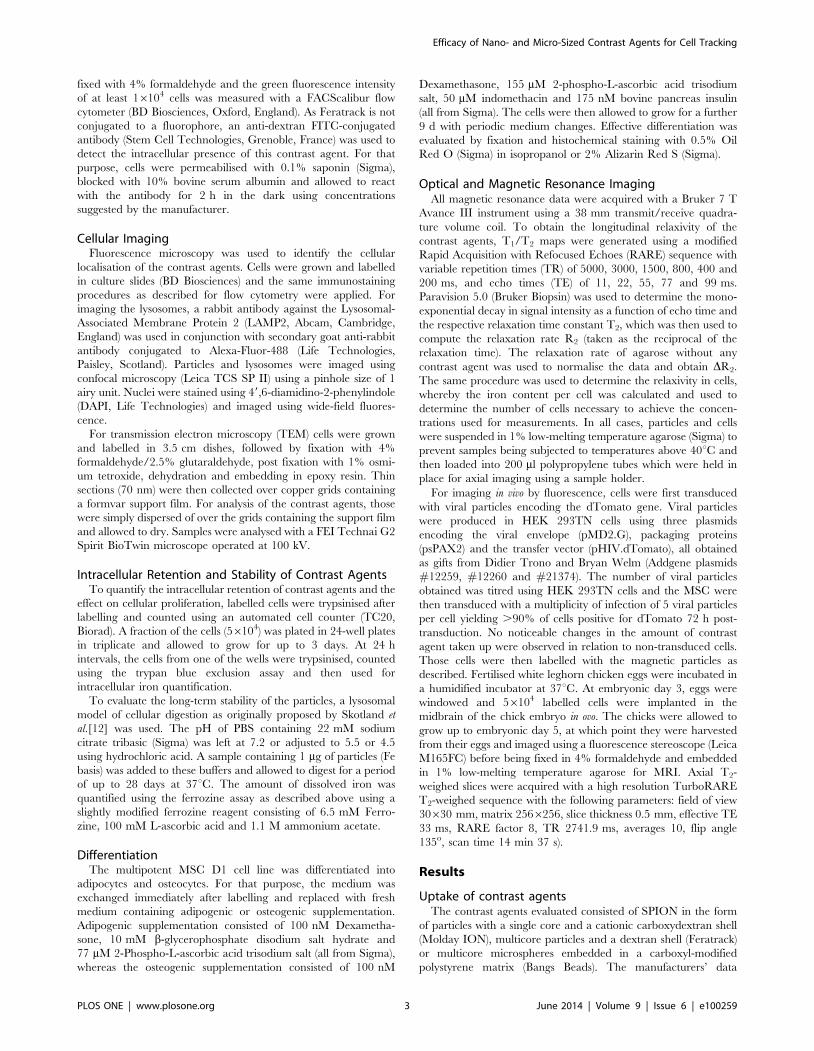
The relative dissolution of the contrast agents in citrate
containing buffers at neutral (7.2) and endo-lysosomal (5.5–4.5)
pH is shown in Figure 4. A pH dependent dissolution of the
particles is observed in all conditions and at pH 7.2, only a small
(,30%) dissolution that took place at a very slow rate is observed.
Proportionally higher rates of dissolution were observed at pH 5.5
and 4.5, and Molday ION and Feratrack were found to fully
dissolve within a period of 4 days when exposed to the lowest pH.
Bangs Beads, on the other hand, exhibited a higher stability under
all conditions displaying a maximum dissolution of 60% at pH 4.5.
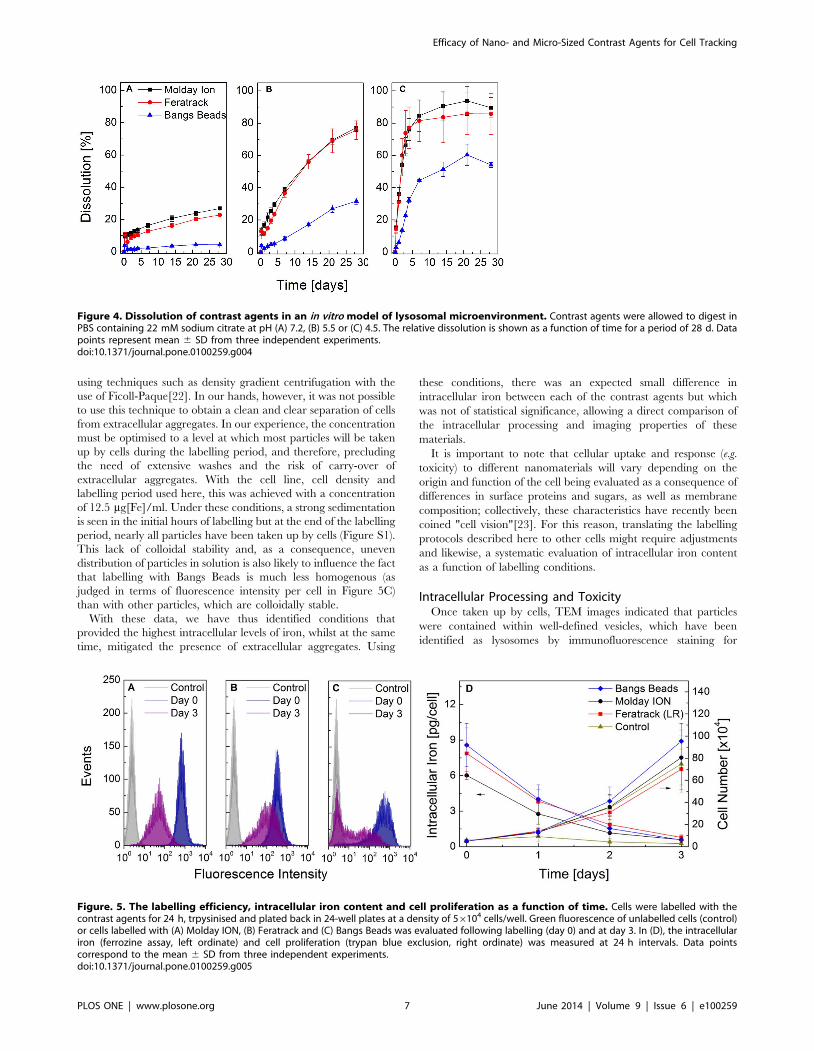
Labelling efficiency, intracellular retention and effect onMSC phenotype
Fluorescence measurements using flow cytometry reveal that
when cells have been freshly labelled (day 0), the labelling
efficiency is over 99% for Molday ION and Feratrack, whereas
this figure is slightly lower for Bangs Beads, but still over 95%
(Figure 5A–C). A more uniform labelling of cells with Molday
ION and Feratrack, characterised by a histogram displaying
narrower peaks, is observed when compared to Bangs Beads. After
3 days, a dilution of the number of particles per cell is observed, as
identified by a marked decay in fluorescence intensity and a
broadening of the histogram. For Bangs Beads, the uniformity of
the labelling is broader from day 0 and after a growth period of 3
days, a bimodal distribution is observed suggesting a population of
unlabelled cells whose green fluorescence intensity is equivalent to
that of control (unlabelled) cells and another population containing
intracellular particles (Figure 5C).
Intracellular retention of the contrast agents as measured by the
ferrozine assay at 24 h intervals up to 3 days after labelling reveals
that indeed all particles are diluted between daughter cells,
resulting in an effectively lower intracellular concentration of iron
as a function of growth time. The amount of iron per cell halved at
approximately every 24 h, consistent with the cell’s approximate
doubling time (Figure 5D) and reached values close to that of
control (unlabelled) cells after a period of 3 days.
Trypan-blue exclusion assay conducted at 24 h intervals
resulted in viability values .90% at every time point for all
conditions. The negligible impact of the contrast agents on
viability is reflected in the growth rate (Figure 5D) where labelled
cells proliferated at rates similar to control cells, irrespective of the
contrast agent used. In all cases, cells were capable of differen-
tiating into osteocytes and adipocytes as efficiently as unlabelled
cells as evidenced by a strong, positive staining for calcium deposits
and intracellular lipid droplets, respectively (Figure 6). Because of
their size and opacity, Bangs Beads were occasionally observed
within adipocytes (Figure 6, arrows). Importantly, we found that if
MSC are labelled with the contrast agents prior to inducing their
differentiation, a strong signal could be detected with MRI for at
least 9 days (the study end-point), which is likely due to the fact
that these differentiated cells proliferate much more slowly than
the undifferentiated MSC (Figure S3).
Transverse Relaxivity in vitro and in vivoWhen measured in solution, the contrast agents displayed an
expected concentration-dependent relaxation rate (Figure 7A) with
Feratrack presenting the highest relaxivity at 247 mM21s21,
nearly 2.5-fold higher than that measured for Molday ION and
Bangs Beads at 106 and 92 mM21s21 respectively (Table 2).
When the same measurements were carried out with labelled cells,
however, a significant drop in relaxation rates was observed and all
contrast agents displayed similar relaxivities at 26, 24 and
25 mM21s21 for Molday ION, Feratrack and Bangs Beads
respectively.
Fluorescence imaging of chick embryos 48 h after implantation
of 56104 labelled dTomato+ MSC into the midbrain revealed the
Efficacy of Nano- and Micro-Sized Contrast Agents for Cell Tracking
PLOS ONE | www.plosone.org 4 June 2014 | Volume 9 | Issue 6 | e100259

presence of dTomato+ cells in several areas of the brain (Figure 8,
left panel), confirming the cell’s survival and integration in the host
tissue. Although the cells were implanted at a single site, they
spread to the fore-, mid- and hindbrain during the 48 h period
between administration and analysis (from embryonic day 3 to 5).
The fluorescence intensity, as well as the number of areas with
positive cells, varied arbitrarily between samples, including chick
embryos that were implanted with unlabelled dTomato+ cells
(results not shown). These parameters (fluorescence intensity and
number of positive areas) cannot thus be attributed to the presence
and type of contrast agents within cells but are rather a reflection
of biological variability.
MR imaging using a T2-weighed RARE sequence revealed the
presence of areas of signal loss in several regions of the brain,
which were found to correlate with the anatomical location of
dTomato+ cells (Figure 8, right panel), confirming the suitability of
all contrast agents, as well as of the labelling procedures, as a
means for imaging in vivo using MRI. To test the likely effectiveness
of the contrast agents for longer-term imaging, we developed a
surrogate test system that involved culturing the labelled cells for 3
days prior to transplantation, in order to mimic an additional 3
days of growth in vivo. This approach was necessary because
following the 5th embryonic day, the increasing size of the chick
embryo brain makes it difficult to visualise with fluorescence
microscopy. We found that under these conditions, whilst no
difference was observed in the intensity of the fluorescence signal
between the 3 groups, the MR signal was noticeably stronger in
embryos transplanted with MSC labelled with Bangs Beads
(Figure S7).
Discussion and Conclusions
MR Contrast Agents & Cell LabellingIron oxide-based contrast agents are found in a variety of sizes
and surface functionalities. As a rule, they consist of core-shell
structures where the most common configurations are single core
particles with a size below 100 nm or, multi-core particles
consisting of an assembly of magnetic nanoparticles. Endorem,
one of the former clinically approved contrast agents that proved
popular for cell tracking, consisted of such multicore particles[13].
More recently, larger particles in the micrometer scale, consisting
of a polystyrene matrix with several magnetic nanoparticle cores
embedded within it, have also been used to label cells for MR
imaging[14]. Here, we sought to compare the efficiency of these
different particle configurations for cell tracking using mouse
MSC. The therapeutic effect of MSC has been evaluated for a
broad range of diseases demonstrating great clinical potential but
major questions still remain, including their fate after administra-
tion[15]. These cells are therefore a relevant model for cell
tracking. The nanoparticles chosen are representative of the
configurations described above; Molday ION consists of a single
core with a carboxydextran shell, whereas Feratrack is a multicore
ensemble with a dextran shell. Bangs Beads are among the most
popular micro-sized particles used for cell tracking and consist of a
polystyrene matrix with several magnetic cores embedded within
it.
It is well known that surface properties and the formation of a
so-called ‘‘protein corona’’ [16], the layer of surface associated
proteins that is formed in serum containing media, can play an
important role in cell-nanomaterial interactions. Surface charge,
in particular, seems to strongly influence cellular uptake, with
Figure 2. Intracellular iron content of murine mesenchymal stem cells as a function of labelling concentration. Cells (56104) wereseeded in 24-well plates and labelled for 24 h by adding the contrast agents to the culture medium. Intracellular iron concentration was measured (A)quantitatively using the ferrozine assay (mean 6 SD from three independent experiments) or (B) qualitatively using flow cytometry (representativedata from three independent experiments). LR denotes labelling with loading reagent provided by the contrast agent manufacturer.doi:10.1371/journal.pone.0100259.g002
Table 1. Standard set of conditions used for labelling cells.
Contrast Agent Labelling Concentration (mg[Fe]/ml) Intracellular Concentration (pg[Fe]/cell)
Molday ION 25 6.0961.23
Feratrack 50 (with LR) 7.4660.98
Bangs Beads 12 8.7761.16
LR: loading reagent, as provided by manufacturer.doi:10.1371/journal.pone.0100259.t001
Efficacy of Nano- and Micro-Sized Contrast Agents for Cell Tracking
PLOS ONE | www.plosone.org 5 June 2014 | Volume 9 | Issue 6 | e100259

positive charges often resulting in enhanced uptake by cells[17].
Of the particles examined here, Molday ION has a positive zeta
potential whereas the carboxyl-modified polystyrene matrix of
Bangs Beads leads to a negative surface charge. Feratrack, on the
other hand, has a dextran shell which is usually reported as
neutral[18] and thus in agreement with our results. Although these
charges can be at least partially offset as a result of protein
adsorption[17,19], spontaneous uptake was only seen for the
charged contrast agent Molday ION and Bangs Beads, which
sediments in culture. Feratrack displayed negligible spontaneous
uptake up to concentrations of up 100 mg[Fe]/ml and required the
use of a loading reagent, disclosed by the manufacturer as lipid-
based, to enhance cellular uptake. These characteristics of
Feratrack are very similar to Endorem, which also consisted of
multicore nanoparticles with a dextran shell[18] and likewise
resulted in limited uptake by most cells requiring the use of
transfection agents for efficient labelling[18,20,21].
Regarding the uptake of Bangs Beads, a common problem with
particles of these dimensions is that they are not colloidally stable.
Therefore, a strong sedimentation over the cells is observed that
can be assumed to influence uptake. Furthermore, it is generally
very difficult to wash away non-internalised particles once the
labelling period is finished. Some investigators have mentioned
success in separating labelled cells from extracellular aggregates
Figure 3. Confocal and electron microscopy images evidencing intracellular uptake and accumulation of contrast agents inlysosomes. Cells were labelled with (A) Molday ION, (B) Feratrack or (C) Bangs Beads. Blue fluorescence corresponds to the nuclei, green to thecontrast agents and red to LAMP2, scale bar represents 10 mm. Transmission electron microscopy was carried out without post-staining and electrondense (dark) areas correspond to the iron-oxide based contrast agents.doi:10.1371/journal.pone.0100259.g003
Efficacy of Nano- and Micro-Sized Contrast Agents for Cell Tracking
PLOS ONE | www.plosone.org 6 June 2014 | Volume 9 | Issue 6 | e100259
using techniques such as density gradient centrifugation with the
use of Ficoll-Paque[22]. In our hands, however, it was not possible
to use this technique to obtain a clean and clear separation of cells
from extracellular aggregates. In our experience, the concentration
must be optimised to a level at which most particles will be taken
up by cells during the labelling period, and therefore, precluding
the need of extensive washes and the risk of carry-over of
extracellular aggregates. With the cell line, cell density and
labelling period used here, this was achieved with a concentration
of 12.5 mg[Fe]/ml. Under these conditions, a strong sedimentation
is seen in the initial hours of labelling but at the end of the labelling
period, nearly all particles have been taken up by cells (Figure S1).
This lack of colloidal stability and, as a consequence, uneven
distribution of particles in solution is also likely to influence the fact
that labelling with Bangs Beads is much less homogenous (as
judged in terms of fluorescence intensity per cell in Figure 5C)
than with other particles, which are colloidally stable.
With these data, we have thus identified conditions that
provided the highest intracellular levels of iron, whilst at the same
time, mitigated the presence of extracellular aggregates. Using
these conditions, there was an expected small difference in
intracellular iron between each of the contrast agents but which
was not of statistical significance, allowing a direct comparison of
the intracellular processing and imaging properties of these
materials.
It is important to note that cellular uptake and response (e.g.
toxicity) to different nanomaterials will vary depending on the
origin and function of the cell being evaluated as a consequence of
differences in surface proteins and sugars, as well as membrane
composition; collectively, these characteristics have recently been
coined "cell vision"[23]. For this reason, translating the labelling
protocols described here to other cells might require adjustments
and likewise, a systematic evaluation of intracellular iron content
as a function of labelling conditions.
Intracellular Processing and ToxicityOnce taken up by cells, TEM images indicated that particles
were contained within well-defined vesicles, which have been
identified as lysosomes by immunofluorescence staining for
Figure 4. Dissolution of contrast agents in an in vitro model of lysosomal microenvironment. Contrast agents were allowed to digest inPBS containing 22 mM sodium citrate at pH (A) 7.2, (B) 5.5 or (C) 4.5. The relative dissolution is shown as a function of time for a period of 28 d. Datapoints represent mean 6 SD from three independent experiments.doi:10.1371/journal.pone.0100259.g004
Figure. 5. The labelling efficiency, intracellular iron content and cell proliferation as a function of time. Cells were labelled with thecontrast agents for 24 h, trpysinised and plated back in 24-well plates at a density of 56104 cells/well. Green fluorescence of unlabelled cells (control)or cells labelled with (A) Molday ION, (B) Feratrack and (C) Bangs Beads was evaluated following labelling (day 0) and at day 3. In (D), the intracellulariron (ferrozine assay, left ordinate) and cell proliferation (trypan blue exclusion, right ordinate) was measured at 24 h intervals. Data pointscorrespond to the mean 6 SD from three independent experiments.doi:10.1371/journal.pone.0100259.g005
Efficacy of Nano- and Micro-Sized Contrast Agents for Cell Tracking
PLOS ONE | www.plosone.org 7 June 2014 | Volume 9 | Issue 6 | e100259

LAMP2. Co-localisation of LAMP2 and contrast agent fluores-
cence was limited to the rim of the Bangs Beads, an observation
that can probably be attributed to the contrast agent’s large size
and the fact that LAMP2 is a lysosomal membrane protein.
Because of this preferential localisation within lysosomes, which
typically have a pH of 4.5–5.5, it is important to try to investigate
the stability of the labelling agents within this organelle, given that
SPION tend to degrade at low pH. Due to the difficulties with
assessing SPION stability using live cells, Skotland et al. proposed
in 1999[12] the use of acidic buffers with the presence of sodium
citrate as a model of the lysosomal microenvironment. We found
that the nanosized contrast agents underwent rapid dissolution at
pH 5.5 and 4.5, which was comparable to that seen for similar
products such as Clariscan[12] and Sinerem[24] but more rapid
than has been reported for Endorem and Resovist[25]. Surpris-
ingly, even the micro-sized contrast agents were found to partially
dissolve at low pH 4.5, an unexpected observation given the non-
biodegradable polystyrene matrix surrounding these particles. A
closer examination of the particles revealed, however, that besides
a strong polydispersity in size as seen in the TEM images in
Figure 1, the core-shell structure of these contrast agents is not
uniform. In fact, several single beads appear to have cores in direct
contact with the surrounding environment (Figure S2) and are
hence not completely encapsulated by the polystyrene shell. The
iron oxide cores that are not completely encapsulated are thus
likely to be in direct contact with the buffers, which likely explains
the nearly 60% dissolution that is seen for this contrast agent at
pH 4.5. With this observation accounted for, it is expected that the
other 40% of those particles would not be digested in vivo. This
non-biodegradability has an important impact in long-term cell
tracking. On the one hand, it potentially allows the longitudinal
tracking without the concern of progressively losing the contrast
agent with time. On the other hand, it might exacerbate the issue
of false positives; for instance, host cells that might engulf particles
released from labelled cells that die following implantation. It is
worth pointing out, however, that despite the fact that this assay
has been widely used to estimate the intracellular stability of iron
oxide-based contrast agents in the lysosomal microenvironment, it
does have limitations and cannot completely mimic the conditions
found in cells. For instance, we have been able to observe
significant contrast in cells at least up to 9 days after labelling
(Figure S3) suggesting that the dissolution does not occur as rapidly
as observed under the conditions obtained using this lysosomal
assay.
Apart from evaluating the intracellular processing within the
lysosomes, it is also important to evaluate the effect of contrast
agent dilution during cell division. One of the drawbacks when
imaging labelled cells is that upon cell division (and potential
migration within the host organism), the label is diluted, ultimately
reducing the signal-to-noise when imaging. At the early stages of
cell division, it is expected that the contrast agents are evenly
distributed between daughter cells and it is possible to image that
using live cell imaging (Figure S4). A comparison of fluorescence
intensity between day 0 (freshly labelled cells) and day 3, however,
Figure 6. Differentiation of cells into osteocytes and adipocytes. Unlabelled (control) and labelled cells were induced to differentiate for 9 dwith osteogenic or adipogenic media, after which cells were stained with Alizarin Red S to reveal calcium deposits or Oil Red O to reveal lipiddroplets. Arrow indicates an adipocyte where the intracellular presence of labelling agent is clearly noticeable around the nucleus (zoomed view isshown in inset).doi:10.1371/journal.pone.0100259.g006
Figure 7. Relaxation rate (DR2) of contrast agents (A) in solution or (B) internalised in cells. Data points represent mean 6 SD from threeindependent experiments and are displayed as a function of iron concentration. Lines represent the least square fit of the data points.doi:10.1371/journal.pone.0100259.g007
Efficacy of Nano- and Micro-Sized Contrast Agents for Cell Tracking
PLOS ONE | www.plosone.org 8 June 2014 | Volume 9 | Issue 6 | e100259

reveals a significant difference between nano- and microsized
particles. Whilst the former are evenly distributed between
daughter cells during this period, resulting in a uniform peak of
lower intensity at day 3 (Figure 5A,B), the latter displays an
asymmetric distribution between daughter cells (Figure 5C).
Because of the size of the particles, it is expected that when just
one particle is present within a cell, such a situation would take
place. This effect can be seen quite readily if the volume of the
contrast agent is taken into account. A cell containing 8 pg of
8 nm nanoparticles contains a total of 86106 particles within its
lysosomes, allowing their uniform distribution through several cell
divisions. If the same particles are 1 mm, the same intracellular
concentration of iron (8 pg) would correspond to only 4 particles
allowing two cell divisions before asymmetric distribution between
daughter cells. Live cell imaging of cells containing just one bead
demonstrate that asymmetric distribution does take place in vitro
(Figure S5). To confirm if the flow cytometry histogram obtained
at day 3 corresponded to a bimodal distribution of labelled and
unlabelled cells, we ran this sample through a magnetic-activated
cell sorting (MACS) column, which allows the separation of the
magnetically positive fraction. Flow cytometry analysis of this
fraction (Figure S6) confirmed there are indeed two cell
populations, one that did not contain any contrast agents (flow
through), and a second population that retained the label (elution).
For MR imaging, these observations are of relevance, for in the
case of the microsized contrast agents, at least one of the daughter
cells could potentially retain enough iron to display a T2-
shortening effect, which would be lost in the case of nanosized
particles, where a 50% reduction in signal intensity at every cell
division would quickly render them undetectable. Shapiro et
al.[26], have demonstrated this effect by inserting Bangs Beads
into single cell mouse embryos and allowing them to develop up to
embryonic day 7, and then using MRI to identify single cells
within the organism that still contained the particles. Our own
Table 2. Transverse Relaxivity (r2) of contrast agents in solution or within cells. Values were obtained from the linear regression ofthe relaxation rate and are displayed as mean6SE from three independent measurements.
Contrast Agent r2 in Solution (mM21s21) r r2 in Cells (mM21s21) r
Molday ION 10664 0.99 2664 0.97
Feratrack 247614 0.99 2464 0.97
Bangs Beads 9263 0.99 2567 0.92
The correlation coefficient r is provided for each condition.doi:10.1371/journal.pone.0100259.t002
Figure 8. Fluorescence and magnetic resonance imaging of cells implanted into the brain of a chick embryo. Cells (56104) expressingdTomato were labelled with (A) Molday ION, (B) Feratrack or (C) Bangs Beads and implanted into the midbrain of chick embryos at embryonic day 3.At embryonic day 5 the embryos were harvested from their eggs, imaged with a fluorescence stereomicroscope and fixed prior to MR imaging usinga T2-weighed RARE sequence. Scale bars represent 1 mm. Numbers in fluorescence images indicate the position of viable (dTomato expressing) cells.The corresponding numbers in the transverse MR sections show the T2 shortening effect of the labelling agent at the same anatomical positions.doi:10.1371/journal.pone.0100259.g008
Efficacy of Nano- and Micro-Sized Contrast Agents for Cell Tracking
PLOS ONE | www.plosone.org 9 June 2014 | Volume 9 | Issue 6 | e100259

studies involving injection of cells in the brain of chick embryos 3
days after they had been labelled suggest an attenuated signal for
the nanosized agents and a stronger signal for Bangs Beads (Figure
S7).
Cellular toxicity of nanomaterials is a research area of great
controversy[27]. It is generally accepted that there is a myriad of
factors that can affect toxicity including the physicochemical
properties of materials, intracellular content, exposure time, cell
line, etc., not to mention the wide range of assays which are
available for evaluating different aspects ranging from cell
proliferation to gene expression and DNA damage. Here, we
have based our investigations on the evaluation of the hallmarks of
stem cells: self-renewal and the capacity to give rise to specialised
cells, and whether contrast agent labelling affected those
properties. Proliferation of the MSC was unaffected by the
labelling protocols used here and they were able to differentiate
into osteocytes and adipocytes with the same propensity as
unlabelled cells. In fact, in the case of Bangs Beads, it was possible
to observe retention of several particles within single adipocytes,
probably a consequence of cell arrest once they start to
differentiate, preventing dilution of the label between daughter
cells, and clearly suggesting that they do not affect their potential
to differentiate into specialised cells. Beyond assays in vitro, studies
using a chick embryo model show that cells with all contrast agents
survive after implantation in vivo as evidenced by expression of
dTomato 48 h after implantation into the animal.
MR Imaging PropertiesWhen the efficiency of contrast agents is considered, the
standard property for assessing their efficacy is their relaxivity
value[28]. The capacity of a T2 contrast agent to shorten
relaxation times, thus leading to a hypointense signal in T2-
weighed sequences, varies linearly with its concentration and the
constant of proportionality corresponds to its relaxivity. Here,
Feratrack was shown to display the highest relaxivity which was
nearly 2.5-fold higher than Molday ION and Bangs Beads. It is
generally acknowledged that magnetisation, particle and/or
aggregate size and the volume fraction of contrast agents in the
particle/aggregate are important factors in the design of contrast
agents of high relaxivity[29]. Thus, although it is not possible to
explain these relaxivity differences without a complete magnetic
characterisation of the contrast agents, their morphology is likely
to play an important role in these observations. Because Feratrack
consists of multicore ensembles (aggregates) that can be considered
as a large magnetised sphere[30] (a more efficient dephaser of
proton relaxation), this would explain its high relaxation in respect
to Molday ION, which consists of single particles. Relaxivity
theories predict that particle size only increases relaxivity up to a
certain extent with a maximum at a size range of 100 to
350 nm[29] after which relaxivity drops. This is the case for Bangs
Beads, which consist of large particles of around 860 nm, and
where the distance between the particles at a given iron
concentration is so great that the diffusion of water in the
magnetic field inhomogeneities is limited, resulting in a lower
relaxivity.
A caveat of such measurements however, is that relaxivity is
assessed under model conditions of colloidal suspensions of
particles evenly distributed in aqueous solution. This is far
removed from the intracellular situation seen here, where the
contrast agents are clustered in the lysosomes. In fact, this
clustering effect results in a similar configuration for all particles,
where they all consist of aggregates enclosed within a cellular
organelle with a size often larger than 500 nm. This configuration
can limit diffusion on water just like the case for Bangs Beads in
solution, reducing the relaxivity of all contrast agents when
measured in cells. This effect can also be compounded by other
intracellular effects. The diffusion coefficient of water, for example,
is probably intrinsically lower in cells than in a pure solution and
organelle membranes and intracellular compartments may also
limit water diffusion and accessibility to the contrast agents[31].
This negative effect of intracellular confinement in transverse
relaxivity has been previously shown for other iron oxide
nanoparticles at low[32,33] and high magnetic fields[34], and
our results support such findings. An implication of these
observations for T2-weighed cell tracking is that achieving high
loads of intracellular contrast agents without affecting cell function
might be of greater relevance than the development of contrast
media with a high relaxivity.
To demonstrate the capacity of labelled cells to generate
contrast in vivo, we have used a chick embryo model. We have
opted to use this model in order to comply with the principles of
the 3Rs. Furthermore, the absence of an immune system during
the early embryonic stages allows xenogeneic cells to be
administered [35] (here, murine stem cells), and also, the small
size of the embryo during the first 5 days of development in ovo
allows the use of non-specialised optical imaging to track cells. It
was thus possible to evaluate the viability of cells using fluorescence
imaging and then confirm their localisation and retention of
contrast agents via MR imaging. We implanted the cells in the
brain as it has a relatively large volume and longer T2-relaxation
time when compared to other organs[36] and also because of its
quick development, which we anticipated would result in a spread
of cells and the possibility to evaluate the imaging properties of
large and small cell clusters. In all cases, we could identify several
regions in the brain which contained the administered cells.
Because of the limitation of optical imaging, in particular signal
attenuation due to tissue depth, it is not possible to directly
correlate the signal intensity with the number of cells. Fluorescence
imaging allowed us, however, to predict the anatomical localisa-
tion of the cells and confirm their viability in vivo. An excellent
correlation was found between the position of the cells as evaluated
optically and as imaged via MR, confirming the imaging
properties of each of the contrast agents, and most importantly,
their co-localisation with the administered cells even when those
migrate to other parts of the brain. A significant increase in
sensitivity was observed when using a Fast Low Angle Shot
(FLASH) T2* sequence for imaging the embryos; however, that
came at the expense of lower signal to noise for the rest of the
tissue (Figure S8). The strong signal quench observed in the T2*
sequence might also pose difficulties for detecting cell clusters in
close proximity, as the hypointense areas can overlap. As the
contrast in T2*-imaging is caused by the local magnetic field
perturbation produced by the contrast agent, it extends well
beyond the physical location of the particles. Thus it provides an
amplification mechanism to detect low levels of labelled cells but
does overestimate the volume occupied by labelled cells. The effect
on T2, on the other hand, is better localised to the particles’
physical location.
In summary, we evaluated the efficacy of nano- and microsized
iron oxide-based contrast agents as a means to label and track
cells. With proper adjustment in the labelling protocol, all contrast
agents were successfully internalised within the lysosomes of
murine MSC with intracellular levels in the range of 5–9 pg[Fe]/
cell. All particles were retained within the cells in vitro and in vivo
without presenting major cytotoxic effects. Although Feratrack
offers a higher T2 relaxivity in solution, this is not reflected when
internalised in cells where its imaging properties are equivalent to
the other contrast agents. Thus, all contrast agents evaluated here
Efficacy of Nano- and Micro-Sized Contrast Agents for Cell Tracking
PLOS ONE | www.plosone.org 10 June 2014 | Volume 9 | Issue 6 | e100259

are effective as a means to label and track cells with equivalent
imaging properties once they are internalised in cells. Bangs Beads
are less prone to dissolution and dilution between daughter cells in
the long-term and can confer an advantage when cells that are
proliferative and migratory are concerned.
Supporting Information
Figure S1 Representative images of MSC D1 duringlabelling. Images were acquired during (5 h) and after the
labelling period (24 h). There is noticeable sedimentation of
particles at 5 h for cells labelled with Bangs Beads, resulting in a
grainy image (detailed view in inset). After 24 h cells take up nearly
all particles that have sedimented. For Feratrack, the labelling
conditions (serum free medium, loading reagent) result in a small
impact in cell morphology after 5 h (shrinkage) and proliferation
after 24 h (reduced cell density). Data acquired with a Leica DM
IL inverted microscope coupled to a DFC420C camera. Scale bar
represents 100 mm. Prussian blue staining performed with an iron
stain kit (Sigma) and imaged using bright field microscopy. For
Bangs Beads no Prussian Blue staining is observed as the
polystyrene matrix prevents the reaction of the staining reagent
with the iron oxide cores.
(TIF)
Figure S2 Transmission electron microscopy micro-graphs of Bangs Beads. Particles which are not uniformly
coated with the polystyrene shell are indicated with arrows.
(TIF)
Figure S3 Magnetic resonance imaging of cell pelletsbefore and after differentiation. Images of cell pellets
obtained using a T2-weighed RARE sequence. Cells were fixed
and imaged directly after labelling or after a period of 9 days
during which the cells were differentiated into adipocytes or
osteocytes. Pellets obtained with cells differentiated into osteocytes
are less uniform given the presence of a mineralised extracellular
matrix.
(TIF)
Figure S4 Live cell imaging of labelled MSC D1. The
symmetric distribution of Molday ION (top) and Bangs Beads
(bottom) during mitosis is observed (overlay of phase contrast and
fluorescence images acquired with a Zeiss LSM 510 Meta
microscope). Feratrack is not included as it does not contain a
fluorescent tag.
(TIF)
Figure S5 Live cell imaging of MSC D1 10 d afterlabelling with Bangs Beads. Once the contrast agent has been
diluted between daughter cells, asymmetric distribution is
observed during mitosis (overlay of phase contrast and fluores-
cence images acquired with a Zeiss LSM 510 Meta microscope).
(TIF)
Figure S6 Magnetic retention of cells labelled withBangs Beads. Flow cytometry histogram (green fluorescence)
of MSC D1 3 d after labelling with Bangs Beads and sorted with a
Magnetic-Activated Cell Sorting (MACS) device. Flow thorough
population displays no fluorescence whereas cells retained in the
MACS column (elution) present a wide distribution of the contrast
agent.
(TIF)
Figure S7 Fluorescence and magnetic resonance imag-ing of cells implanted into the brain of a chick embryo.Cells expressing a red fluorescent protein were labelled with (A)
Molday ION, (B) Feratrack or (C) Bangs Beads and allowed to
grow for a further 3 days to allow for the dilution of the contrast
agents. After this period approximately 56104 cells were
implanted into the midbrain of chick embryos at embryonic day
3. At embryonic day 5 the embryos were harvested from their
eggs, imaged with a fluorescence stereomicroscope and fixed prior
to MR imaging using a T2-weighed RARE sequence. Scale bars
represent 1 mm. Numbers in fluorescence images indicate the
position of viable (dTomato expressing) cells. The corresponding
numbers in the transverse MR sections show the T2 shortening
effect of the labelling agent at the same anatomical positions. In
the case of the nanosized agents, although contrast is still obtained,
the intensity is noticeable weaker than that obtained with freshly
labelled cells.
(TIF)
Figure S8 Side-by-side comparison of samples scannedwith a TurboRARE T2-weighed or FLASH T2* sequence.The slices contain hypointense regions corresponding to cells
labelled with (A) Molday ION, (B) Feratrack and (C) Bangs Beads.
An increase in the hypointense area is seen with the FLASH
sequence. Conditions Turbo RARE T2-weighed: field of view
30630 mm, matrix 2566256, slice thickness 1.0 mm, effective TE
33 ms, RARE factor 8, TR 2741.9 ms, averages 10, flip angle 135,
scan time 14 min37 s, FLASH T2*: field of view 30630 mm,
matrix 2566256, slice thickness 1.0 mm, effective TE 15 ms, TR
450.8 ms, averages 4, pulse angle 30, scan time 7 min41 s.
Average increase in hypointense area was 5.3-fold for Feratrack
and Bangs Beads and 6.8-fold for Molday ION.
(TIF)
Acknowledgments
The authors would like to acknowledge Ian Prior (University of Liverpool)
for access to electron microscopy facilities and Michael Barrow (University
of Liverpool) for support with zeta potential measurements.
Author Contributions
Conceived and designed the experiments: AT AH DM VS KD SRW PM.
Performed the experiments: AT AH KD. Analyzed the data: AT AH DM
VS KD SRW PM. Contributed reagents/materials/analysis tools: AT AH
DM VS KD SRW PM. Wrote the paper: AT AH DM VS KD SRW PM.
References
1. Taylor A, Wilson KM, Murray P, Fernig DG, Levy R (2012) Long-term tracking
of cells using inorganic nanoparticles as contrast agents: are we there yet? Chem
Soc Rev 41: 2707–2717.
2. Kircher MF, Gambhir SS, Grimm J (2011) Noninvasive cell-tracking methods.
Nat Rev Clin Oncol 8: 677–688.
3. Brader P, Serganova I, Blasberg RG (2013) Noninvasive Molecular Imaging
Using Reporter Genes. J Nucl Med 54: 167–172.
4. de Vries IJM, Lesterhuis WJ, Barentsz JO, Verdijk P, van Krieken JH, et al.
(2005) Magnetic resonance tracking of dendritic cells in melanoma patients for
monitoring of cellular therapy. Nat Biotech 23: 1407–1413.
5. Richards JMJ, Shaw CA, Lang NN, Williams MC, Semple SIK, et al. (2012) In
Vivo Mononuclear Cell Tracking Using Superparamagnetic Particles of Iron
Oxide: Feasibility and Safety in Humans. Circ Cardiovascular Imaging 5: 509–
517.
6. Toso C, Vallee JP, Morel P, Ris F, Demuylder-Mischler S, et al. (2008) Clinical
Magnetic Resonance Imaging of Pancreatic Islet Grafts After Iron Nanoparticle
Labeling. Am J Transplant 8: 701–706.
7. Zhu J, Zhou L, XingWu F (2006) Tracking Neural Stem Cells in Patients with
Brain Trauma. New Engl J Med 355: 2376–2378.
8. Kalva SP, Blake MA, Sahani DV (2006) MR Contrast Agents. Applied
Radiology 35: 18–27.
9. Bulte JWM (2009) In Vivo MRI Cell Tracking: Clinical Studies.
Am J Roentgenol 193: 314–325.
Efficacy of Nano- and Micro-Sized Contrast Agents for Cell Tracking
PLOS ONE | www.plosone.org 11 June 2014 | Volume 9 | Issue 6 | e100259

10. Sun C, Lee JSH, Zhang M (2008) Magnetic nanoparticles in MR imaging and
drug delivery. Adv Drug Deliver Rev 60: 1252–1265.11. Fish WW (1988) Rapid colorimetric micromethod for the quantitation of
complexed iron in biological samples. In: James F. Riordan BLV, editor.
Method Enzymol: Academic Press. pp. 357–364.12. Skotland T, Sontum PC, Oulie I (2002) In vitro stability analyses as a model for
metabolism of ferromagnetic particles (Clariscan), a contrast agent for magneticresonance imaging. J Pharmaceut Biomed 28: 323–329.
13. Jung CW, Jacobs P (1995) Physical and chemical properties of super-
paramagnetic iron oxide MR contrast agents: Ferumoxides, ferumoxtran,ferumoxsil. Magn Reson Imaging 13: 661–674.
14. Shapiro E, Koretsky A (2008) Micron-Sized Iron Oxide Particles (MPIOs) forCellular Imaging: More Bang for the Buck. In: Bulte JM, Modo MJ, editors.
Nanoparticles in Biomedical Imaging: Springer New York. pp. 141–161.15. Ren G, Chen X, Dong F, Li W, Ren X, et al. (2012) Concise Review:
Mesenchymal Stem Cells and Translational Medicine: Emerging Issues. Stem
Cells Transl Med 1: 51–58.16. Monopoli MP, Aberg C, Salvati A, Dawson KA (2012) Biomolecular coronas
provide the biological identity of nanosized materials. Nat Nano 7: 779–786.17. Albanese A, Tang PS, Chan WCW (2012) The Effect of Nanoparticle Size,
Shape, and Surface Chemistry on Biological Systems. Annu Rev Biomed Eng
14: 1–16.18. Cengelli F, Maysinger D, Tschudi-Monnet F, Montet X, Corot C, et al. (2006)
Interaction of Functionalized Superparamagnetic Iron Oxide Nanoparticleswith Brain Structures. J Pharmacol Exp Ther 318: 108–116.
19. Rezwan K, Studart AR, Voros J, Gauckler LJ (2005) Change of f Potential ofBiocompatible Colloidal Oxide Particles upon Adsorption of Bovine Serum
Albumin and Lysozyme. J Phys Chem B 109: 14469–14474.
20. Frank JA, Miller BR, Arbab AS, Zywicke HA, Jordan EK, et al. (2003) ClinicallyApplicable Labeling of Mammalian and Stem Cells by Combining Super-
paramagnetic Iron Oxides and Transfection Agents. Radiology 228: 480–487.21. Matuszewski L, Persigehl T, Wall A, Schwindt W, Tombach B, et al. (2005) Cell
Tagging with Clinically Approved Iron Oxides: Feasibility and Effect of
Lipofection, Particle Size, and Surface Coating on Labeling Efficiency1.Radiology 235: 155–161.
22. Shapiro EM, Skrtic S, Koretsky AP (2005) Sizing it up: cellular MRI usingmicron-sized iron oxide particles. Magn Reson Med 53: 329–338.
23. Laurent S, Burtea C, Thirifays C, Hafeli UO, Mahmoudi M (2012) CrucialIgnored Parameters on Nanotoxicology: The Importance of Toxicity Assay
Modifications and ‘‘Cell Vision’’. PLoS ONE 7: e29997.
24. Michael L, Florence L, Valentin-Adrian M, Marie-Genevieve B, Francois G, et
al. (2010) Degradability of superparamagnetic nanoparticles in a model of
intracellular environment: follow-up of magnetic, structural and chemical
properties. Nanotechnology 21: 395103.
25. Soenen SJH, Himmelreich U, Nuytten N, Pisanic TR, Ferrari A, et al. (2010)
Intracellular Nanoparticle Coating Stability Determines Nanoparticle Diagnos-
tics Efficacy and Cell Functionality. Small 6: 2136–2145.
26. Shapiro EM, Skrtic S, Sharer K, Hill JM, Dunbar CE, et al. (2004) MRI
detection of single particles for cellular imaging. PNAS 101: 10901–10906.
27. Grainger DW (2009) Nanotoxicity assessment: all small talk? Adv Drug Deliver
Rev 61: 419–421.
28. Geraldes CFGC, Laurent S (2009) Classification and basic properties of contrast
agents for magnetic resonance imaging. Contrast Media Mol I 4: 1–23.
29. Carroll MRJ, Woodward RC, House MJ, Teoh WY, Amal R, et al. (2010)
Experimental validation of proton transverse relaxivity models for super-
paramagnetic nanoparticle MRI contrast agents. Nanotechnology. 21.
30. Laurent S, Forge D, Port M, Roch A, Robic C, et al. (2008) Magnetic Iron
Oxide Nanoparticles: Synthesis, Stabilization, Vectorization, Physicochemical
Characterizations, and Biological Applications. Chemical Reviews 108: 2064–
2110.
31. Levy M, Wilhelm C, Devaud M, Levitz P, Gazeau F (2012) How cellular
processing of superparamagnetic nanoparticles affects their magnetic behavior
and NMR relaxivity. Contrast Media & Molecular Imaging 7: 373–383.
32. Billotey C, Wilhelm C, Devaud M, Bacri JC, Bittoun J, et al. (2003) Cell
internalization of anionic maghemite nanoparticles: Quantitative effect on
magnetic resonance imaging. Magn Reson Med 49: 646–654.
33. Simon G, Bauer J, Saborovski O, Fu Y, Corot C, et al. (2006) T1 and T2
relaxivity of intracellular and extracellular USPIO at 1.5T and 3T clinical MR
scanning. Eur Radiol 16: 738–745.
34. Klug G, Kampf T, Bloemer S, Bremicker J, Ziener CH, et al. (2010)
Intracellular and extracellular T1 and T2 relaxivities of magneto-optical
nanoparticles at experimental high fields. Magn Reson Med 64: 1607–1615.
35. Rashidi H, Sottile V (2009) The chick embryo: hatching a model for
contemporary biomedical research. BioEssays 31: 459–465.
36. Boss A, Oppitz M, Wehrl HF, Rossi C, Feuerstein M, et al. (2008) Measurement
of T1, T2, and magnetization transfer properties during embryonic development
at 7 Tesla using the chicken model. J Magn Reson Im 28: 1510–1514.
Efficacy of Nano- and Micro-Sized Contrast Agents for Cell Tracking
PLOS ONE | www.plosone.org 12 June 2014 | Volume 9 | Issue 6 | e100259