Comparison Between Nano- and Micro-Sized Copper Particles as Fillers in NAO Friction Materials
9
Nanomaterials and Nanotechnology Comparison Between Nano- and Micro-Sized Copper Particles as Fillers in NAO Friction Materials Regular Paper Sanjeev Sharma 1 , Jayashree Bijwe 1,* and Mukesh Kumar 1,2 1 Industrial Tribology Machine Dynamics & Maintenance Engineering Centre (ITMMEC), Indian Institute of Technology Delhi, New Delhi India * Corresponding author E-mail: [email protected] Received 13 February 2013; Accepted 12 July 2013 © Sharma et al.; licensee InTech. This is an open access article distributed under the terms of the Creative Commons Attribution License (http://creativecommons.org/licenses/by/3.0), which permits unrestricted use, distribution, and reproduction in any medium, provided the original work is properly cited. Abstract In this study, the comparative role of nanoȬ and microȬsized Cu powder in exploring the influence on the triboȬperformance of friction materials in the form of brakeȬpads is discussed. Two friction composites were developed by keeping allthe ingredients constant and varying the size of the selected filler (copper powder). The developed microȬcomposite contained 10 % (wt) Cu (400 Ȭ 600 ΐm) while in the nanoȬcomposite only a part (2 %) of the microȬpowder was replaced by a nanoȬpowder (50 Ȭ 200 nm) since 10 % replacement was not possible because of the agglomeration problem. One more composite without any metallic filler was also developed for the sake of comparison. For triboȬevaluation, the brakeȬdynamometer testing was selected. The performance properties, such as friction, wear and sensitivity of friction towards load, speed and temperature were studied as per industrial practice. It was concluded that the inclusion of nanoȬCu powder (just 2 %) improved the performance properties significantly. MicroȬcomposite was a moderate performer while composite without Cu powder proved the poorest. The quality of a triboȬlayer transferred to the disc as studied in SEM was confirmed to be one of the reasons for the improved performance of the nanoȬcomposite. Keywords NanoȬComposites, NanoȬParticles of Cu, NonȬAsbestos Organic Friction Material, Brake Materials 1. Introduction NonȬasbestos organic (NAO) friction materials (FMs) are widely used in automobiles and locomotives as brake pads, brake shoes, brake linings, clutch facings and brake blocks. The performance requirements of FMs are very complex and conflicting [1]. These multiȬ ingredient composites containing the right combination of ingredients in the right proportion are manufactured with the right technology to achieve the desired amalgam of performance properties [1Ȭ3]. Amongst the ingredients are metallic fillers such as copper, brass, iron etc., which are very important in FMs and are added in various shapes, sizes, amounts and combinations basically to improve the thermoȬphysical properties. These metallic fillers, however, influence the overall friction and wear properties of FM [4Ȭ14]. In our previous studies, the influence of different metallic fillers with different contents and shapes was discussed and it was concluded that copper powder (micronȬsized) has special 1 ARTICLE www.intechopen.com Nanomater. nanotechnol., 2013, Vol. 3, Art. 12:2013
-
Upload
independent -
Category
Documents
-
view
1 -
download
0
Transcript of Comparison Between Nano- and Micro-Sized Copper Particles as Fillers in NAO Friction Materials

Nanomaterials and Nanotechnology
Comparison Between Nano- and Micro-Sized Copper Particles as Fillers in NAO Friction Materials Regular Paper
Sanjeev Sharma1, Jayashree Bijwe1,* and Mukesh Kumar1,2
1 Industrial Tribology Machine Dynamics & Maintenance Engineering Centre (ITMMEC), Indian Institute of Technology Delhi, New Delhi India * Corresponding author E-mail: [email protected]
Received 13 February 2013; Accepted 12 July 2013 © Sharma et al.; licensee InTech. This is an open access article distributed under the terms of the Creative Commons Attribution License (http://creativecommons.org/licenses/by/3.0), which permits unrestricted use, distribution, and reproduction in any medium, provided the original work is properly cited.
Abstract In this study, the comparative role of nano and
micro sized Cu powder in exploring the influence on the
tribo performance of friction materials in the form of
brake pads is discussed. Two friction composites were
developed by keeping allthe ingredients constant and
varying the size of the selected filler (copper powder).
The developed micro composite contained 10 % (wt) Cu
(400 600 m) while in the nano composite only a part (2
%) of the micro powder was replaced by a nano powder
(50 200 nm) since 10 % replacement was not possible
because of the agglomeration problem. One more
composite without any metallic filler was also developed
for the sake of comparison. For tribo evaluation, the
brake dynamometer testing was selected. The
performance properties, such as friction, wear and
sensitivity of friction towards load, speed and
temperature were studied as per industrial practice. It
was concluded that the inclusion of nano Cu powder (just
2 %) improved the performance properties significantly.
Micro composite was a moderate performer while
composite without Cu powder proved the poorest. The
quality of a tribo layer transferred to the disc as studied
in SEM was confirmed to be one of the reasons for the
improved performance of the nano composite.
Keywords Nano Composites, Nano Particles of Cu,
Non Asbestos Organic Friction Material, Brake Materials
1. Introduction
Non asbestos organic (NAO) friction materials (FMs) are
widely used in automobiles and locomotives as brake
pads, brake shoes, brake linings, clutch facings and brake
blocks. The performance requirements of FMs are very
complex and conflicting [1]. These multi ingredient
composites containing the right combination of
ingredients in the right proportion are manufactured with
the right technology to achieve the desired amalgam of
performance properties [1 3]. Amongst the ingredients
are metallic fillers such as copper, brass, iron etc., which
are very important in FMs and are added in various
shapes, sizes, amounts and combinations basically to
improve the thermo physical properties. These metallic
fillers, however, influence the overall friction and wear
properties of FM [4 14]. In our previous studies, the
influence of different metallic fillers with different
contents and shapes was discussed and it was concluded
that copper powder (micron sized) has special
Sanjeev Sharma, Jayashree Bijwe and Mukesh Kumar: Comparison Between Nano- and Micro-Sized Copper Particles as Fillers in NAO Friction Materials
1www.intechopen.com
ARTICLE
www.intechopen.com Nanomater. nanotechnol., 2013, Vol. 3, Art. 12:2013

advantages due to its highest thermal conductivity (TC)[8 10]. Cu has three roles, viz. improving thermalconductivity, providing primary contact sites andimproving sliding performance under severe brakingconditions [10,14]. Thus, keeping this in mind it was ofinterest to explore the potential of Cu powder (nanosized) in FMs.
Since the last decade, the area of nano composites (NCs)has been the most explored research area because of themulti fold potential of such fillers as performanceimprovers. Nano particles (NPs) have a very high surfacearea to volume ratio and hence provide a very largeinterfacial surface area, as a driving force for enhancedinteraction with other surfaces such as a matrix,counterface etc. [15]. A very low content (generally < 2 3wt %) provides an exceptional increase in mechanicalstrength asides from its thermal, electrical and biologicalproperties. Consequently, in recent years, the potential ofpolymeric NCs has been explored for tribologicalapplications [16 25]. However, studies were more focusedon anti friction applications [16 22] rather than FMs [2325]. Qiao et al. [23] reported on the positive effect(improvement in friction and wear performance) of NPsof styrene butadiene rubber for manufacturing clutchfacings, disc brake pads and brake linings as compared tothe micron sized particles. Jang et al. [24] reported thatthe physical and tribological properties (improved faderesistance and friction stability) were influencedconsiderably by the inclusion of carbon nano tubes(CNTs). In a recent work in the authors�’ laboratory [25]while reporting on the influence of micronized and nanosized abrasives (viz. alumina, silica and SiC; each at 2 %)in NAO FMs, a significantly superior friction and wearbehaviour of nano composites was found and wasclaimed to be due to the superior quality of the tribo layeron the counterface. Interestingly, hardly any papers areavailable which report on the effect of other NPs,especially of metallic NPs, in the FMs. Oesterle et al. [14]stated that the inclusion of Cu in FM is appreciated notonly for its high TC and its capability to provide primarycontact sites, but also as a soft metal providing smoothsliding and reducing the propensity for noise generationat higher temperatures. Furthermore, they hypothesizedthat the Cu particles in FMs play a dual role. Apart fromreinforcing the FM by providing primary contact sites,they also act as a solid lubricant by contributing to theformation of a tribo layer of granular material responsiblefor velocity accommodation between the disc and pad.However, there was no experimental evidence for theclaim that recrystallized NPs of Cu enter into frictionlayers as a soft ingredient once they are detached fromthe pad surface, although initially they were incorporatedin micron size. This hypothesis was confirmed bymodelling contact sites on the nanometre scale using themovable cellular automata method. This might be
understood best if it was assumed that the soft Cu NPsare incorporated in the tribo layer [26].
The above hypothesis and simulation studies were themotivating factors for this study of the influence of nanoCu in FMs by developing brake pads. In the presentstudy, three NAO friction composites were developed inorder to understand the effects of nano copper powder onthe performance properties. A composite without Cu wasconsidered as a reference composite, while the other twocomposites were developed with micron sized and acombination of nano and micron sized Cu powders.Tribological evaluation was performed on a full scaleinertia dynamometer for various performance propertiesand is discussed in the subsequent sections.
2. Experimental
2.1 Details of Cu powder
Micron sized copper powder was procured from a localvendor (M/s Kandoi Metal, Jaipur, India), while nanocopper powder was procured from Nanostructured &Amorphous Materials, Inc USA. (Purity: 99.8% ; APS:78 nm; SSA: 8.46 m2/g; Colour: black; Morphology:spherical; Density: 8.94 g/cm3). The details of the particlesize studied by FESEM are shown in Figure 1.
Figure 1. FESEM micrographs of selected copper powders;(a,b) coarse micron sized, (c,d) nano sized
2.2 Fabrication of the composites
Three composites were developed containing 12ingredients of identical types and the parent compositionof 11 ingredients (90 % by wt.) was kept constant. Theremaining two fillers viz. Cu powder and barite werechanged as per Table 1. The micro composite contained10 % Cu powder of micron size while the nano compositecontained a combination of micro sized (8 %) and nanosized Cu powder (2 %). A composite with 10 % nano Cu
(c) (d)
2 m1 m
10 m 20 m
(a (b)
Nanomater. nanotechnol., 2013, Vol. 3, Art. 12:20132 www.intechopen.com

powder was not possible because of the agglomerationproblem [22]1. For the sake of comparison, a thirdcomposite was also developed without Cu powder byreplacing this 10 % amount with an inert filler barite.
The desired quantity of nano powder (2 % of totalmixture) was dispersed thoroughly in petroleum ether(40 600C) using a probe sonicator for 10 minutes followedby phenolic powder which was added slowly. Themixture was further sonicated for 10 minutes. Theresulting paste was poured onto aluminium foil to dry inthe open air. This dried mixture, along with otheringredients, was placed in an industrial mixer forhomogeneous dispersion as per standard procedure [8] toensure macroscopic homogeneity using a chopper speedof 2800 rpm and a feeder speed of 1450 rpm. Thecomposites were developed as per the method reportedelsewhere [8 10]. The mixture was then placed into afour cavity mould supported by adhesive coated backplates. Each cavity was filled with approximately 80 g ofthe mixture and was then cured in a compressionmoulding machine under a pressure of 8 MPa for 7 8minutes at 150oC. Five intermittent �‘breathings�’ werecarried out during the curing process to expel thevolatiles. The pads were then post cured in an oven at150° C for four hours. The surfaces of the pads were thenpolished with a grinding wheel to attain the desiredthickness (14 16 mm) and surface finish.
Ingredients/ Designation Composition by weight %CM CN CRef
Parent composition* 90 90 90Barite (BaSO4) 0 0 10Cu powder micron sized(400 600 m)
10 8 0
Cu powder �–nano sized(50 200 nm)
0 2 0
Abbreviations used �– C for composite, subscripts M and N for micronsized and nano sized Cu particles; Ref for reference composite.* Binder (St. Phenolic) 10 wt.%; Fibres (Aramid, Rock wool, Ceramic,Acrylic, potassium titnate) �– 23 wt.%; Additives (Graphite, Alumina) �– 12wt.% and Fillers (NBR powder, Cashew dust, vermiculite, barite) �– 45 wt.%
Table 1. Design and designations of composites
1 It is well reported that agglomeration is considered as a generalproblem of NCs, especially for higher contents and if theoptimum content is in the range of 2 4%. In general, beyond 2 %loading, either the performance of the NCs levels off or showsdeterioration [22]. While preparing NCs, the first step is to deagglomerate the NCs in the right liquid medium using probesonication which consumes significant amounts of energy. Thisde agglomeration becomes extremely difficult if the loading ishigh, generally beyond 2 %. We selected 10 % Cu contents in allthe composites. The replacement of all the 10 % of microparticles with NPs was not practically possible because of thesefacts. Hence, we had to replace only 2 % which is the mostlogical solution based on the above discussion.
Properties CM CN CRef
Density (g/cc) 2.21 2.35 2.07Porosity (%)(JIS D 4418:1996) 4.28 4.18 4.48Acetone extraction (%) 2.10 1.85 2.15Rockwell Hardness (S scale) 82 87 90 95 87 92Thermal Conductivity (W m 1K 1) 2.11 2.22 1.67Thermal diffusivity x10 4(cm2s 1) 71 80 68Specific heat (J kg 1K 1) 1298 1207 1068
Table 2. Physical, thermo physical and mechanical properties ofthe composites
2.3 Characterization of the composites
The composites were characterized by their physical andchemical (density, porosity and acetone extraction),thermo physical (thermal conductivity, diffusivity,specific heat etc.) and mechanical (hardness) properties asper standard practice. The thermo physical propertieswere measured as per ASTM E1461 01 standard on anFL 3000 Flash line instrument supplied by AnterCorporation, USA. Square sized samples (10 mm x 10mm) with a thickness of 2 to 2.5 mm were used for thesemeasurements at room temperature and the results arecollected in Table 2. Worn surface studies were carriedout on a Zeiss scanning electron microscope (model EVO10M) after the gold coating.
2.3 Tribological evaluation
A full scale inertia brake dynamometer (Dyno) was usedto examine the friction and wear properties of developedcomposites. The schematic diagram and more details ofDyno are discussed elsewhere [9]. Lab view basedsoftware (version 4.0) was provided to calculate thedesired output parameters. In this work, JapaneseAutomobile Standard (JASO C 406) was used for testing[9] which is the norm for performance evaluation inAsian countries. For this study, the two major and mostimportant sections viz. effectiveness II and fade andrecovery I of a complete schedule were followed insteadof a complete schedule to avoid complexity and reducethe amount of time involved in the full testing.
Prior to performance evaluation testing, each pair of padswas subjected to 100 brakings to establish at least 80%conformal contact with the disc. The disc was thenreplaced with a new one. Each composite test wasrepeated twice on an unused tribo couple and theaverage value of these two tests was reported. Table 3 iscomprised of the experimental design (operatingparameters) of testing.
The second segment viz. Effectiveness II was done atthree different braking speeds viz., 50, 80 and 100 kmph.The tests were conducted under eight differentdecelerations (0.1g to 0.8g). The deceleration is varied byincreasing the pressure. With an increase in deceleration,
Sanjeev Sharma, Jayashree Bijwe and Mukesh Kumar: Comparison Between Nano- and Micro-Sized Copper Particles as Fillers in NAO Friction Materials
3www.intechopen.com

the severity of the braking increases and the stoppingdistance is reduced to a set value. At each deceleration (gvalue) one brake was applied. Eight brake applicationswere applied at each speed while a total of 24 brakeapplications were applied in this part of the effectivenessstudies. Prior to each brake application a temperature of80 0C was set.
In the last and third segment, called Fade and Recovery I,the first 10 brake applications consisted of a fade cycle andthe last 12 brake applications were for the recovery cycle.The fade cycle starts with an initial speed of 80 kmph, adeceleration of 0.45 and an initial temperature of 80 0C. Inthe fade cycle, the temperature of the disc was allowed torise uninterruptedly in order to observe the influence oftemperature (by keeping the air blower switched off) whilethe recovery cycle started with an initial speed of 50 kmphand a deceleration of 0.30. The air blower was switched onduring this test and the initial temperature of the disc priorto each brake was kept under 80 °C.
3. Results and Discussion
3.1 Physical, thermo physical and mechanical properties
As seen from Table 2, some properties, such as density, TC,diffusivity and hardness, increased due to the inclusion ofthe copper powder. These were highest for the CN,followed by CM and then Cref, while the porosity andacetone extraction values went in the inverse order. The TCof these composites was in the range of 1.67 2.22 Wm 1K 1,similar to the values reported in the literature for frictioncomposites [27]. The values of TC were in a inverse relationto the density, as expected. It is well accepted that densermaterials have better packing and hence a higher TC. NPshave a significantly larger surface/volume ratio ascompared to their micro counterpart, leading to a moreintense interaction/adhesion with the resin. This finallyfacilitates the formation of a thermally conducting pathwayin the composite which results in the increase in TC. Theacetone extraction values indicate the amount of uncuredresin, which should be as low as possible. CRef, which didnot contain any metal powder, showed the highest amountof uncured resin followed by CM and CN. The hardnessfollowed the exact opposite trend, confirming that curingleads to more hardness.
Description Speed(kmph)
Deceleration(g)
InitialTemp.(°C)
BrakeApps.
AirBlower
Bedding test 65 0.35 120°C 100 OnEffectiveness II 50,80,
1000.10.8
< 80°C 24 On
F&R IFade testRecovery test
8050
0.450.30
80°C< 80°C
1012
OffOn
Table 3. Experimental parameters for JASO C406 studies [9 11]
3.2 Tribological properties of composites
3.2.1 Effectiveness studies (Pressure speed sensitivity)
Effectiveness studies are concerned with the influence ofthe operating parameters (pressure and speed) mainly onthe coefficient of friction ( ) of FM. is the ratio of thefrictional force generated to the applied load with whichit is pressed against its counterpart. The changes in as afunction of sliding speed and applied pressure are a veryimportant issue during braking in automobiles [28, 29] aswell as in aircrafts [30]. Changes in should be minimalsince the driver expects the same level of friction underdiverse braking conditions.
Effect on friction behaviour
As seen in Figure 2, the of the composites was in therange of 0.30 to 0.45 which is in the acceptable range forbrake pads [1]. It is a well accepted fact that Amonton slaw does not hold true for polymers and composites andis not constant with variations in pressure and speed.
With increases in pressure and speed, decreased for allthe composites, which again also conform to trendsidentified in the literature [28, 29]. With the increase inpressure, it decreases (referred to as a pressure fade),though not always linearly [31, 32]. However, with speedthis relationship is more complex as generally does notshow fixed trends with increases in speed [28, 29]. In thepresent case, decreased with an increase in speed whichis mostly observed since an increase in speed leads to thegeneration of more frictional heat which, however, isresponsible for a reduction in . The variation in speedleads to a thermo mechanical overloading on theasperities. The shear film disruption results in the surfaceunderneath being exposed and the friction changingaccordingly [33 35].
Pressure sensitivity
The variation in with an increase in deceleration (g) ateach constant speed reflects the sensitivity towards thepressure of FMs and is shown in Figure 2. For an idealfriction composite the line should be parallel to the X axisor the slope of the curve and undulations in the curveshould be minimal. However, generally decreases withan increase in (g). The decline was lowest (desirable) forCN. At the lowest speed (50 kmph), CN showed a slightlyhigher (0.42 0.40) while for the other two compositeswas lower than the CN and they were almost similar toeach other. As the conditions became severe (80 kmph),CRef showed the poorest behaviour since it showedmaximum decline which is considered as an unwantedphenomenon, followed by CM, whereas the nanocomposite showed the best behaviour. It should be notedthat CN performed better than CM at each speed. Higheris not the performance criteria. Stable is the ideal
Nanomater. nanotechnol., 2013, Vol. 3, Art. 12:20134 www.intechopen.com

requirement. As observed in Figure 2b, CN showed theleast fluctuations and the lowest slope, though was notthe highest as seen in Figure2c. CN showed the leastfluctuations and the lowest slope, though was not thehighest. Under the most severe conditions (100 kmph),the performance of CRef deteriorated excessivelyconfirming that metallic contents are very much requiredfor the desired friction properties. The performance of CN
improved further confirming that the replacement of just2 % of the coarse Cu powder with nano powderimproved the friction behaviour significantly. The greaterthe severity in the braking conditions, the better theperformance offered by CN was. Thus, of among all thecomposites, CN proved the best from the pressuresensitivity point of view. One of the reasons for this couldbe the ability of nano powder to form a very fine uniformfriction film on both the rubbing surfaces. This frictionalfilm kept the at a constant level. CRef performed thepoorest which could be attributed to the appreciabledifference in TC of the composites (Table 2). High TC isresponsible for carrying away the frictional heatgenerated at the interface very efficiently and hence theextent of the thermal degradation of the organic materialis reduced. This leads to the integrity of the FM beingmaintained as well as the surface properties and hencealso varies effectively [9].
Figure 2. Variation in with an increase in deceleration at (a) 50kmph, (b) 80 kmph and (c) 100 kmph
One interesting fact as observed from Figure 2 is thecorrelation between the magnitude of , speed and thesize of the Cu powder. At the lowest speed was higherfor CN than CM while for the other two speeds it was theopposite. As per the literature [14] under severe operatingconditions Cu acts as a solid lubricant when it enters intoa tribo layer on the disc. The extraction of nano particlesfrom the composite is comparatively difficult since theiradhesion with the matrix is better compared to microparticles [15, 16]. Hence at lower speeds, CN showedhigher since its tribo layer was not very rich with Cuparticles. Hence its performance (slope of curve) was
slightly inferior to that of CM. However, for furtherincreases in speed, the tribo layer on the disc must bemore coherent and rich in Cu contents, which leads tomore stable , rather than higher . NPs, being ofextremely small size, are known to percolate in theasperities on the counterface and hence form a very good,thin and coherent film [36]. The evidence for this ispresented in the SEM section.
Speed sensitivity
Speed sensitivity is defined as a variation in speed spread(SS) with respect to deceleration (g) and Figure 3 showsthe performance of the composites from the speedsensitivity point of view. The % SS is the stability inwhen the speed changes from the first to the second level(i.e. from 80 to 50 kmph and this corresponds to mildconditions). While from the first to the third level (100 to50 kmph) corresponds to a severe condition. For an idealmaterial, SS should be high (in the range of 85 100 %)and the slope of the curve should be as minimal aspossible. As seen from Figure 3, Cref proved the poorest inboth these aspects. CM, however always showed higherSS than CN which is appreciable indicating that coarse Cupowder is more suitable for attaining a lower sensitivityto speed. CN, however, was rated excellent based on othercriteria. Under both conditions, it showed a very steadyvalue.
Figure 3. Variation in speed spread with increase in decelerationat (a) mild conditions (transition from 80 to 50 kmph) and (b)severe conditions (transition from 100 to 50 kmph)
3.2.2 Fade and recovery (F & R) behaviour
F & R behaviour highlight the effect of temperature onthe . A loss of effectiveness in braking as a result of anexcessive increase in temperature of the tribo surface isknown as fade. On the other hand, recovery is the abilityof an FMs to regain the pre fade normal brakeeffectiveness after the temperature comes down [28].Figure 4 shows the F & R behaviour of the composites.For an ideal composite, the rise in disc temperatureshould be minimal, should be stable and in the requiredrange depending on the vehicle selected (0.30 0.45) andthe fade curve ( vs. number of applications) should havea minimal slope. In the case of the recovery mode, thecurve should be flat with a low slope and should be inthe range of the pre fade value.
Sanjeev Sharma, Jayashree Bijwe and Mukesh Kumar: Comparison Between Nano- and Micro-Sized Copper Particles as Fillers in NAO Friction Materials
5www.intechopen.com

Figure 4. Fade and recovery behaviour of the composites; (a) disctemperature as a function of the number of brakings; (b) as afunction of the number of brakings
There are two separate testing cycles included in thetesting. Up to 10 cycles (fade cycle) the air blower is off &hence the temperature of the disc keeps on increasing to apeak value with a simultaneous decrease in due to thefading. For the 10th braking is the lowest since the disctemperature is at its highest. During the second cycle(recovery cycle), first the temperature of the disc isallowed to decrease with the help of a blower. The 11thbraking starts only when the temperature is around 80degrees C and the blower is continuously on to controlthe rise in temperature. Hence the faded recovers(increases) showing peaking for almost 3 brakings. Lateron it decreases slightly because of repetitive brakings.
Essence of the fade and recovery studies
The F & R characteristics of the composites are collectedin Table 4. These were calculated as per the standardpattern of the JASO C406 schedule. The followinginferences were drawn from Table 4.
Resistance to fade (% fade ratio): performance
order higher the better
This is one of the most important parameters whichmeasures the deterioration in when the operatingconditions are more demanding. This fade behaviour wasdue to the increase in the surface temperature as the test wasconducted at a constant pressure and speed. Generally, afade % ratio in the range of 75 to 100 is acceptable as perindustry norms. The % fade ratio and hence performancewas in the following order for the composites;
CN (90) > CM (83) > CRef (78)
As we know, fade is caused by the thermaldecomposition of ingredients due to the accumulation offrictional heat on the surface. A higher TC of CN perhapswas responsible for it having the best performance.
Segment Parameters CM CN CRef
Fadefade* 0.370 0.393 0.341
% fade ratio** 83 90 78Max. disc temperature (oC) 234 217 271
Recovery recovery�† 0.427 0.429 0.430% recovery ratio�†�† 84 89 85
* fade = lowest recorded during fade test (Higher the better)** % fade ratio = ( min / max) x 100, during fade test; (Higher the better)�† recovery = highest recorded during recovery test (Higher the better)�†�† % recovery ratio = ( min / max) x 100 during recovery test (Higherthe better)
Table 4.Fade and recovery responses of the composites as perthe JASO schedule
The recovery behaviour (% recovery ratio):
performance order higher the better
Composites which recover their friction level considerablyafter fade cycles are considered as good FMs. In general,the acceptable levels should be in the range of 75 100%.The recovery % of the selected composites was as follows,confirming that CN performed best.
CN (89) > CM (84) CRef (85)
Counter face friendliness performance:
One of the criteria for deciding counterface friendliness isthe rise in the disc temperature during fade cycles. Thelower the rise, the greater the friendliness. Theperformance of the composites was in the following order;
CN (217) > CC (234) >> CRef (271)
CN proved best in this aspect and was also followed bythe CM. However, CRef proved to be the poorest showingthe highest disc temperature. The TC of the compositesproved to be the influencing factor for controlling theperformance because it conducted away the frictionalheat generated at the interface very efficiently and finallyled to a lower temperature rise in the disc.
3.3 Studies on wear behaviour and worn surfaces
3.3.1 Wear behaviour of the composites
A weight loss method was used to measure the wear ofthe composites after completing the effectiveness, fadeand recovery studies. The wear volume was calculated byusing the density data of the composites. Figure 5 showsthe wear performance of the composites. Lower the wear,the better the performance. The inclusion of nano Cupowder improved the wear performance significantly.CM showed moderate performance, while that of CRef wasthe poorest. The wear mechanisms of FMs are extremelycomplex since several interactions and mechanismsoperate simultaneously during the material removal/gainprocess from both the surfaces. These dynamic processes
Nanomater. nanotechnol., 2013, Vol. 3, Art. 12:20136 www.intechopen.com
depend on the composition of the contacting surfaces,
including that of a third phase (tribo layer), which in turn
depends on the operating parameters, such as load, speed
and especially interface temperature. As per the
simulation results and the hypothesis in the literature
[14], superficial layers of the Cu MPs are strengthened by
severe plastic deformation leading to a nano crystalline
microstructure.
Figure 5. Wear volume of the composites
These nanocrystals at the surface recrystallize at elevated
temperatures and form soft inclusions in the friction
layer. Although these are harder than graphite at ambient
temperature, the presence of particles of soft Cu in a
friction layer provides a solid lubricating effect similar to
that of graphite inclusions. It leads to the stabilization of a
smooth sliding mode by forming a granular layer of
mechanically mixed materials from the friction layers and
the layer formation causes a reduction in both and the
amplitude of fluctuations. Thus, in our work an
improvement in tribo performance properties due to the
inclusion of Cu as per the above hypothesis was observed
and the studies on worn surfaces of the composites, as
discussed in the subsequent section, were performed to
support these trends.
3.3.2 Worn surface analysis by SEM
The SEM micrographs of the worn surfaces of the
composites are arranged as per their decreasing wear
resistance (WR) in Figures 6 to 8. The main features are
described in the captions.
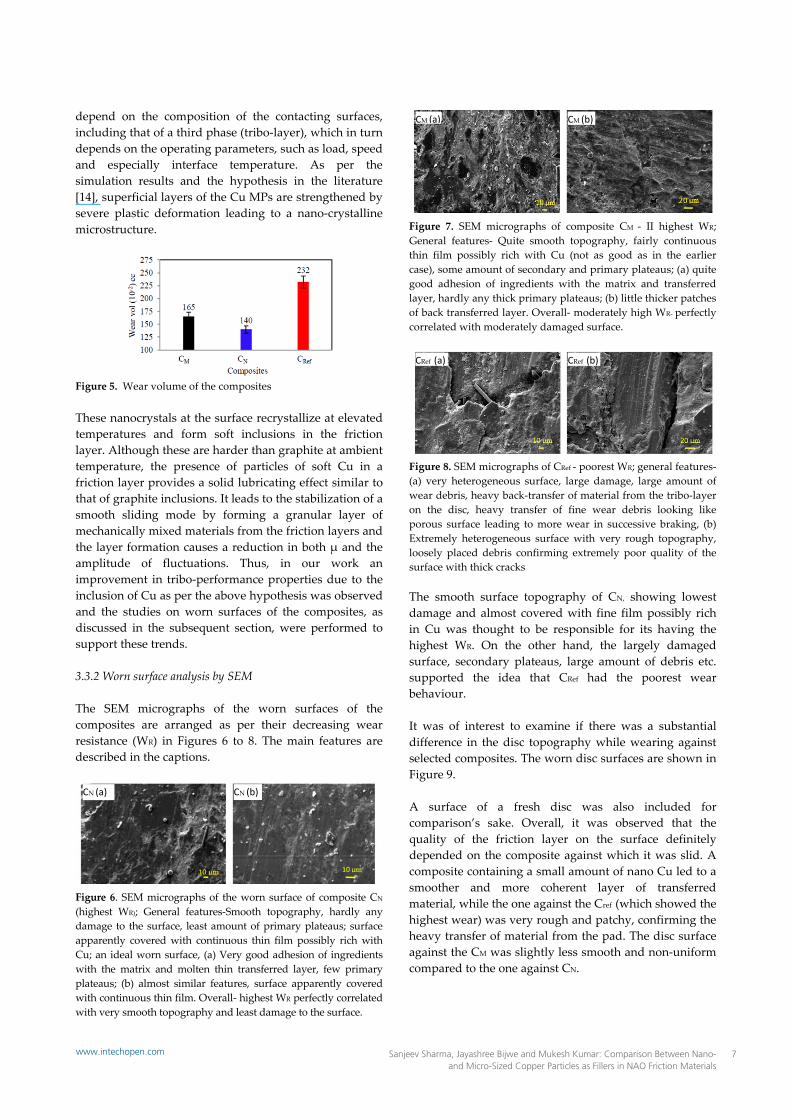
Figure 6. SEM micrographs of the worn surface of composite CN
(highest WR); General features Smooth topography, hardly any
damage to the surface, least amount of primary plateaus; surface
apparently covered with continuous thin film possibly rich with
Cu; an ideal worn surface, (a) Very good adhesion of ingredients
with the matrix and molten thin transferred layer, few primary
plateaus; (b) almost similar features, surface apparently covered
with continuous thin film. Overall highest WR perfectly correlated
with very smooth topography and least damage to the surface.
Figure 7. SEM micrographs of composite CM II highest WR;
General features Quite smooth topography, fairly continuous
thin film possibly rich with Cu (not as good as in the earlier
case), some amount of secondary and primary plateaus; (a) quite
good adhesion of ingredients with the matrix and transferred
layer, hardly any thick primary plateaus; (b) little thicker patches
of back transferred layer. Overall moderately high WR perfectly
correlated with moderately damaged surface.
Figure 8. SEM micrographs of CRef poorest WR; general features
(a) very heterogeneous surface, large damage, large amount of
wear debris, heavy back transfer of material from the tribo layer
on the disc, heavy transfer of fine wear debris looking like
porous surface leading to more wear in successive braking, (b)
Extremely heterogeneous surface with very rough topography,
loosely placed debris confirming extremely poor quality of the
surface with thick cracks
The smooth surface topography of CN, showing lowest
damage and almost covered with fine film possibly rich
in Cu was thought to be responsible for its having the
highest WR. On the other hand, the largely damaged
surface, secondary plateaus, large amount of debris etc.
supported the idea that CRef had the poorest wear
behaviour.
It was of interest to examine if there was a substantial
difference in the disc topography while wearing against
selected composites. The worn disc surfaces are shown in
Figure 9.
A surface of a fresh disc was also included for
comparison�’s sake. Overall, it was observed that the
quality of the friction layer on the surface definitely
depended on the composite against which it was slid. A
composite containing a small amount of nano Cu led to a
smoother and more coherent layer of transferred
material, while the one against the Cref (which showed the
highest wear) was very rough and patchy, confirming the
heavy transfer of material from the pad. The disc surface
against the CM was slightly less smooth and non uniform
compared to the one against CN.
CRef (a) CRef (b)
CM (a) CM (b)
CN (a) CN (b)
Sanjeev Sharma, Jayashree Bijwe and Mukesh Kumar: Comparison Between Nano- and Micro-Sized Copper Particles as Fillers in NAO Friction Materials
7www.intechopen.com

Figure 9. SEM micrographs of the disc surfaces arranged in orderof decreasing WR of the composites; (DFresh a and b) fresh discsurface, graphite flakes also appearing in a magnified view; (DN
a and b) disc worn against CN showing very fine and thinuniform friction layer due to organic material and combinationof micron sized (8%) and nano�–sized copper (2%); (DM a and b)disc worn against CM ; almost similar but slightly inferior type ofuniform friction film mainly due to the combination of organicmaterial and copper; (DRef a and b) disc worn against CRef
composite; A thick layer of molten organic material and debristransferred from the pad.
4. Conclusions
Based on the experimental studies conducted on the roleof nano sized Cu powder in NAO friction composites forevaluating the effectiveness, fade and recovery behaviouron brake inertia dynamometer, the following conclusionswere drawn;
All composites showed adequate (0.35 to 0.45)which decreased with pressure and speed.The inclusion of a small amount of nano Cu powder(2 %) in FM affected most of the performanceproperties in a beneficial way. Most of theproperties, such as density, hardness, thermalconductivity and thermal diffusivity etc. increaseddue to the nano Cu powder.During the evaluation of wear resistance and thesensitivity of friction for pressure, speed andtemperature, the inclusion of 10 % Cu powderproved very helpful for improving all theperformance properties. The replacement of 2 % of
the coarse powder with an equal amount of nanopowder proved significantly beneficial inimproving the performance properties further.The thermal conductivity of the composites playedan important role in the enhancement of theperformance properties of the composites (faderesistance, recovery performance and counterfacefriendliness)The worn surface topography of the pad and thedisc could be correlated with wear resistance and athin uniform and coherent film on the counterfacewas found to be responsible for enhancing theperformance due to the nano Cu powder.
Finally, it was concluded that the inclusion of nanoparticles (Cu in this case) in very small amounts (2 %) canbe beneficial for improving all performance parameterssignificantly. This has the potential for further explorationin its application to industrial friction materials.
5. References
[1] J. Bijwe, �“Composites as friction materials: recentdevelopments in non asbestos fibre reinforcedfriction materials A review�”, Polymer Composites,vol. 18, pp.378 396, 1997.
[2] I. Mutlu, M.H. Alma, M.A. Basturk, C. Oner,�“Preparation and characterization of brake liningsfrom modified tannin phenol formaldehyde resinand asbestos free fillers�”, Journal of Material Science,vol. 40, pp.3003 3005, 2005.
[3] Q.F. Guan, G.Y. Li, H.Y. Wang, �“Friction wearcharacteristics of carbon fiber reinforced frictionmaterial�”, Journal of Material Science, vol. 39, pp.641 643, 2004.
[4] H. Jang, K. Koa, S.J. Kim, R.H. Basch, J.W. Fash, �“Theeffect of metal fibers on the friction performance ofautomotive brake friction materials�”, Wear, vol. 256,pp. 406 414, 2004.
[5] S.C. Ho, J.H.C. Cu Lin, �“Effect of fiber addition onmechanical and tribological properties of acopper/phenolic based friction material�”, Wear, vol.258, pp. 861 869, 2005.
[6] M. Kumar, J. Bijwe, �“Composite friction materialsbased on metallic fillers: sensitivity of to operatingvariables�”, Tribology International, vol. 44, pp. 106113, 2011.
[7] M. Kumar, J. Bijwe, �“Studies on reduced scaletribometer to investigate the effect of metal additiveson friction coefficient temperature sensitivity inbrake materials�”, Wear, vol. 269, pp. 838 846, 2010.
[8] M. Kumar, J. Bijwe, �“Role of different metallic fillersin non asbestos organic (NAO) friction compositesfor controlling sensitivity of coefficient of friction toload and speed�”, Tribology International, vol. 43, pp.965 974, 2010.
DFresh (a) DFresh (b)
DN (a) DN (b)
DM (a) DM (b)
DRef (a) DRef (b)
Nanomater. nanotechnol., 2013, Vol. 3, Art. 12:20138 www.intechopen.com
[9] M. Kumar, J. Bijwe, �“NAO friction materials withvarious metal Powders: tribological evaluation onfull scale inertia dynamometer�”, Wear vol. 269, pp.826 837, 2010.
[10] M. Kumar, J. Bijwe, �“Non asbestos organic (NAO)friction composites: role of copper; its shape andamount�”, Wear, vol. 270, pp. 269 280, 2011.
[11] M. Kumar, J. Bijwe, �“Optimized selection of metallicfillers for best combination of performance propertiesof friction materials: a comprehensive study�”, Wear,vol. 303, pp. 569 583, 2013.
[12] X. Qu, L. Zhang, H. Ding, G. Liu, �“The effect of steelfiber orientation on frictional properties of asbestosfree friction materials�”, Polymer Composite, vol. 25,pp. 94 101, 2004.
[13] Y. Handa, T. Kato, �“Effects of Cu powder BaSO4 andcashew dust on the wear and friction characteristicsof automotive brake pads�”, Tribology Transactions,vol. 39, pp. 346 353, 2006.
[14] W. Österle, C. Prietzel, H. Kloß, A.I. Dmitriev, �“Onthe role of copper in brake friction materials�”,Tribology International, vol. 43, pp. 2317�–2326, 2010.
[15] S.Y. Fu, X.Q. Feng, B. Lauke, Y.W. Mai, �“Effect ofparticle size, particle/matrix interface adhesion andparticle loading on mechanical properties ofparticulate polymer composites�”, Composites Part B,vol. 39, pp. 933�–961, 2008.
[16] K. Friedrich, A.K. Schlarb, �“Tribology of polymericnanocomposites�”, Tribology and interfaceengineering series, 55, Editor: B. J. Briscoe, Elsevierpublication. 2008.
[17] K. Friedrich, Z. Zhang, A.K. Schlar, �“Effects ofvarious fillers on the studying wear of polymer�”,Composite Science Technology, vol. 65, pp. 23292343, 2005.
[18] L. Chang, Z. Zhang, T.C. Breid, K. Friedrich,�“Tribological Properties of Epoxy Nano CompositesI. Enhancement of the Wear Resistance by Nano TiO2
Particles�”, Wear, vol. 258, pp. 141 148, 2005.[19] L. Chang, Z. Zhang, K. Friedrich, �“Effect of
nanoparticles on the tribological behavior of shortcarbon fiber reinforced polyetherimide composites�”,Tribology International, vol. 38, pp. 966 973, 2005.
[20]B. Wetzel, F. Haupert, M. Q. Zhang, �“Epoxynanocomposites with high mechanical andtribological performance�”, Composite Science andTechnology, vol. 63, pp. 2055 2067, 2003.
[21] J. C. Lin, �“Compression and wear behavior ofcomposites filled with various nano particles�”,Composites Part B, vol. 38, pp. 79 85, 2007.
[22] K. Friedrich, S. Fakirov, Z. Zhang, �“PolymerComposites: From Nano to Macro Scale�”, Springer,2005.
[23] Y. Liu, Z. Fan, H. Ma, Y. Tan, J. Qiao, �“Application ofnano powdered rubber in friction materials�”, Wear,vol. 261, pp. 225 229, 2006.
[24] H.J. Hwang, S.L. Jung, K.H. Cho, Y.J. Kim, H. Jang,�“Tribological performance of brake friction materialscontaining carbon nanotubes�”, Wear, vol. 268, pp.519 �– 525, 2010.
[25] J. Bijwe, N. Aranganathan, S. Sharma, N. Dureja, R.Kumar, �“Nano abrasives in friction materialsInfluence on tribological properties�”, Wear, vol. 296,pp.693 701, 2012.
[26] J. Kukutschová, V. Roubí ek, K. Malachová, Z.Pavlí ková, R. Holu�ša, J. Kuba ková, V. Mi ka, D.MacCrimmon, P. Filip, �“Wear mechanism inautomotive brake materials, wear debris and itspotential environmental impact�”, Wear, vol. 267, pp.807�–817, 2009.
[27] A. Shojaei, M. Fahimian, B. Derakhshandeh,�“Thermally conductive rubber based compositefriction materials for railroad brakes �– Thermalconduction characteristics�”, Composite Science andTechnology, vol. 67, pp. 2665 2674, 2007.
[28] S.K. Rhee, �“Friction properties of a phenolic resinfilled with iron and graphite sensitivity to load,speed and temperature�”, Wear, vol. 28, pp. 277 281,1974.
[29] P. Gopal, L.R. Dharani, F.D. Blum, �“Load, speed andtemperature sensitivities of a carbon fiber reinforcedphenolic friction material�”, Wear, vol. 181 183, pp.913 921, 1995.
[30] S. Fan, L. Zhang, L. Cheng, G. Tian, S. Yang, �“Effectof braking pressure and braking speed on thetribological properties of C/SiC aircraft brakematerials�”, Composite Science and Technology,vol.70, pp. 959 965, 2010.
[31] B.N.J. Persson, �“Sliding friction: physical principlesand application�”, second ed., Springer Verlag,Berlin, pp. 45 �– 91, 2000.
[32] V. Brizmer, Y. Kligerman, I. Etsion, �“Elastic �– plasticspherical contact under combined normal andtangential loading in full stick�”, Tribology Letters,vol. 25, pp. 61 70, 2007.
[33] D. Severin, S. Dorsch, �“Friction mechanism inindustrial brakes�”, Wear, vol. 249, pp. 771 779, 2001.
[34] M.H. Cho, K.H. Cho, S.J. Kim, D.H. Kim, H. Jang,�“The role of transfer layers on friction characteristicsin the sliding interface between friction materialsagainst gray iron brake disks�”, Tribology Letters, vol.20, pp. 101 108, 2005.
[35] T. Vladimir, K. Gabriela, Y. Rongping, F. Yanli, L.Yafei, �“Effects of alumina in nonmetallic brakefriction materials on friction performance�”, Journal ofMaterial Science, vol. 44, pp. 266�–273, 2009.
[36] J. M. Martin, N. Ohmae, �“Nanolubricants�”, TribologySeries, John Wiley & Sons Ltd., 2008.
Sanjeev Sharma, Jayashree Bijwe and Mukesh Kumar: Comparison Between Nano- and Micro-Sized Copper Particles as Fillers in NAO Friction Materials
9www.intechopen.com